
Submitted:
25 August 2025
Posted:
27 August 2025
You are already at the latest version
Abstract
This study evaluated the seasonal greenhouse gas (GHG) emissions and carbon assimilation of Bambusa edulis under four soil amendment treatments—control (C), biochar (B), fertilizer (F), and biochar plus fertilizer (B+F)—in a coastal shelterbelt system in southwestern Taiwan. Over a 12-month monitoring period (August 2023–July 2024), static chamber techniques and portable photosynthesis systems were used to measure CO₂ and N₂O fluxes as well as net photosynthetic assimilation. Results showed that the fertilizer-only (F) treatment produced the highest CO₂ (up to 4.0 kg m⁻² season⁻¹) and N₂O emissions (peak at 160.73 ± 96.22 g CO₂e m⁻² in summer), but also achieved the highest seasonal carbon assimilation (up to 18.5 kg CO₂ clump⁻¹ season⁻¹). In contrast, the biochar-only (B) treatment exhibited lower GHG emissions—reducing N₂O by 43.3% in summer and 54.3% in autumn compared to F—while maintaining moderate carbon uptake. The B+F treatment showed intermediate performance, suggesting potential synergistic effects. Control plots had the lowest emissions and assimilation rates, with seasonal uptake dropping to 1.8 kg CO₂ clump⁻¹ in autumn due to drought stress. Soil CO₂ flux was significantly correlated with soil temperature (r = 0.63, p < 0.01) and moisture (r = 0.45, p < 0.05), while N₂O flux had a strong positive correlation with soil moisture (r = 0.71, p < 0.001). The findings underscore the trade-off between nutrient-driven productivity and GHG intensity and demonstrate that optimized organic and biochar applications can enhance photosynthetic carbon gain while mitigating emissions. This study provides empirical evidence for bamboo’s potential role in climate mitigation, carbon offset strategies, and ESG-aligned nature-based solutions. The data serve as a baseline for incorporating bamboo shelterbelts into Taiwan’s national GHG accounting and carbon neutrality roadmap.
Keywords:
Bamboo
; greenhouse gas emissions
; biochar
; N₂O emissions
; carbon assimilation
; bamboo shelterbelt
; nature-based solutions
1. Introduction
As the global climate crisis escalates, the need for a transition toward low-carbon development pathways becomes increasingly urgent. The Intergovernmental Panel on Climate Change [1] emphasizes that curbing greenhouse gas (GHG) concentrations in the atmosphere is fundamental to maintaining global warming within the 1.5°C threshold. In line with this objective, the Paris Agreement has established a global framework for achieving net-zero emissions by 2050, prompting nations to implement diverse mitigation strategies and regulatory instruments. Among these, carbon sequestration and nature-based solutions (NbS) are gaining prominence as complementary measures to technological decarbonization approaches [2]. Corporate climate accountability is also advancing through mechanisms such as the Science-Based Targets initiative [3], which guides enterprises in aligning their Scope 1, 2, and 3 GHG reductions with scientifically grounded targets. NbS interventions—including reforestation, peatland rehabilitation, and the restoration of blue carbon systems—are increasingly integrated into corporate and national climate strategies, particularly for hard-to-abate sectors. Simultaneously, the Taskforce on Nature-related Financial Disclosures [4] advocates for the systematic evaluation of ecological dependencies and risks, encouraging private investment in biodiversity and ecosystem resilience.
Among land-based ecosystems, bamboo has emerged as a promising candidate for rapid and scalable carbon sequestration. Characterized by its fast growth cycle and high biomass accumulation, managed bamboo plantations—especially in subtropical Asia—have been reported to sequester carbon at rates 2–4 times greater than conventional conifer forests [5,6]. Recent studies have emphasized the role of carbon-based soil amendments in enhancing soil quality and contributing to climate mitigation. For instance, Li et al. [7] demonstrated that the application of biochar and plant residues significantly increased soil organic carbon stocks while maintaining crop productivity in subtropical agricultural systems. In Taiwan, both native and naturalized bamboo species such as Bambusa edulis are widely integrated into agroforestry systems and windbreak plantations. However, the carbon dynamics and ecological service functions of these bamboo-dominated landscapes remain insufficiently characterized, underscoring the need for localized empirical research.
Bambusa edulis (Odashima) Keng is a widely cultivated species in western Taiwan, primarily grown for its edible shoots. Beyond its agricultural value, this species also serves ecological functions such as mitigating wind damage and stabilizing soils. Its vigorous rhizome system and rapid regrowth capability indicate significant potential for above- and belowground carbon accumulation. Field-based evaluations are increasingly recognized as essential to quantify the species’ carbon sequestration capacity, particularly under varying soil nutrient and moisture regimes [8,9]. To enhance both plant productivity and soil fertility, farmers often apply organic soil amendments like compost and biochar. Biochar—a stable, carbon-rich material produced through pyrolysis of organic matter in low-oxygen environments—is notable for its high porosity, chemical stability, and long-term carbon persistence [10]. Its incorporation into soil has been shown to improve physical properties such as aggregation and water retention [11], and may contribute to more stable soil organic carbon pools over time. Moreover, biochar has been reported to enhance nitrogen use efficiency, modulate soil enzymatic activity, and support beneficial microbial consortia that collectively influence nutrient cycling and greenhouse gas (GHG) dynamics [12,13]. However, these microbial interactions may also modify CO₂ and N₂O emissions, with effects dependent on soil type, amendment rate, and crop system [14].
Studies on the effectiveness of biochar in mitigating greenhouse gas (GHG) emissions have produced variable outcomes. Some research has shown that biochar can significantly reduce nitrous oxide (N₂O) emissions by enhancing soil aeration and influencing microbial denitrification processes [15,16]. However, other investigations have observed increases in carbon dioxide (CO₂) efflux, potentially driven by stimulated microbial activity or rhizosphere priming effects [17]. In addition, recent findings suggest that adjusting soil moisture levels [18] and modifying cultivation regimes [19] can also contribute to GHG emission reductions in managed agroecosystems. These outcomes appear to be highly context-dependent, influenced by variables such as soil composition, amendment type, and climatic conditions. Meta-analyses by Woolf et al. [20] and Biederman & Harpole [21] have confirmed the general efficacy of biochar in enhancing soil carbon stability and nitrogen use efficiency, especially in marginal or nutrient-deficient soils. In tropical and subtropical settings, biochar amendments have further been associated with improved plant resilience against soil acidification and periodic drought stress, making them particularly suitable for bamboo cultivation under environmental extremes. Notably, Novak et al. [22] and Gao et al. [23] reported synergistic benefits when biochar is applied alongside organic fertilizers, including enhanced microbial diversity and more efficient nutrient cycling, potentially shifting net GHG outcomes in favor of carbon retention. In addition, a study by Amirahmadi et al. [24] reported that sole biochar application reduced N₂O and CH₄ emissions by 16.3% and 10.1%, respectively, while combined applications with fertilizers sometimes led to increased N₂O fluxes. These results emphasize the importance of application strategy and soil conditions when using biochar as a climate mitigation tool. Despite these promising findings, empirical evidence from subtropical coastal regions—especially those with saline soils and water stress—is still sparse. Taiwan’s bamboo shelterbelt systems offer a valuable testbed for assessing the combined impacts of organic and biocarbon amendments on ecosystem carbon balance and emission dynamics. With respect to the frequency of greenhouse gas (GHG) measurements, the development of Tier 3 emission factors is generally based on monitoring conducted at intervals of one to two weeks in order to capture short-term fluctuations. Nevertheless, extensive studies on paddy field GHG dynamics have demonstrated that conducting measurements every 7–10 days during critical growth stages of rice (e.g., tillering, heading, and irrigation periods) is sufficient to effectively capture the peaks and temporal trends of CH₄ and N₂O emissions [16,18,19].
This study aimed to assess the impacts of different soil amendment regimes on the greenhouse gas fluxes and carbon assimilation capacity of Bambusa edulis windbreak systems located in Dongshi Township, Chiayi County, southwestern Taiwan. A one-year field trial was conducted across four management treatments: control (C), biochar (B), fertilizer (F), and biochar plus fertilizer (B+F) application. We hypothesize that biochar, when applied alone or in combination with organic fertilizer, can reduce GHG emissions while enhancing photosynthetic carbon uptake compared to fertilizer-only treatments. By monitoring soil CO₂ and N₂O fluxes using static chamber techniques, alongside leaf-level photosynthetic performance and estimated carbon assimilation rates, this study provides insight into the seasonal carbon dynamics of coastal bamboo ecosystems.
2. Materials and Methods
2.1. Study Site and Experimental Design
The field experiment was carried out in a coastal windbreak forest located in Wenzi Village, Dongshi Township, Chiayi County, Taiwan (23°26'26.0"N, 120°10'44.1"E, Figure S1). Meteorological data for the study site were obtained from the Chiayi Weather Station of the Central Weather Administration, located at 23°29′45.3″N, 120°25′58.5″E. The monitoring period spanned from August 2023 to July 2024, corresponding precisely with the duration of the field experiment. During this period, the total annual precipitation was 2,491 mm. The highest recorded temperature was 36.8 °C in April (spring), while the lowest was 7.5 °C in January (winter). The mean annual temperature was 24.41 °C (Figure S1). The plant material used in the study consisted of a salt-tolerant cultivar of Bambusa edulis, specifically selected and propagated for its adaptability to saline environments [25]. Saline soils are typically characterized by high concentrations of soluble salts—particularly Na⁺, Cl⁻, and SO₄2⁻—which can adversely affect plant water uptake, enzyme activity, and microbial processes. The soil at the experimental site was classified as mildly saline-alkaline sandy soil, with a salt content ranging from 0.1% to 0.25% and a pH of approximately 8.5. The total area is approximately 0.4 hectares, with a planting density of 4m X 4m. The trial spanned from August 2023 to July 2024, during which data were collected at monthly intervals.
The experiment included four soil amendment treatments: control (C), biochar (B), fertilizer using vermicompost (F), and a combination of biochar and fertilizer (B+F). Each treatment included three monitored bamboo clumps. During each seasonal measurement, the following parameters were recorded: (1) leaf-level photosynthesis, assessed by selecting two leaves per clump; (2) soil CO₂ flux, measured at three locations around each clump; and (3) soil N₂O flux, also measured at three locations around each clump. For each treatment, three bamboo clumps were selected for monitoring. Amendments were applied on four occasions: August 31, 2023; November 22, 2023; February 22, 2024; and May 15, 2024. Fertilization was performed using 5 kg of vermicompost per clump per application. Biochar treatments used 5 kg of commercially available rice husk biochar per clump. For the combined treatment (B+F), each clump received 5 kg of vermicompost and 5 kg of biochar per application.
2.2. Soil Greenhouse Gas Flux Measurement
Monthly measurements of greenhouse gas (GHG) emissions, specifically carbon dioxide (CO₂) and nitrous oxide (N₂O), were conducted using a closed chamber method. Gas fluxes were quantified by connecting transparent chamber lids to gas analyzers—namely, a CO₂ analyzer (LI-830) and an N₂O analyzer (LI-7820) were produced by LI-COR Biosciences, USA—with data recorded via the default data loggers supplied with each device.
The chamber system, developed by our research team, consists of a semi-cylindrical transparent acrylic upper cover and a circular stainless steel base ring (20 cm in height, 30 cm in diameter). For larger plants, an oversized acrylic chamber lid was used to accommodate plant height. During each measurement, the steel ring was inserted 5 cm into the soil. The acrylic cover was then secured tightly to the base using strong clamps to ensure airtight conditions. A pump and flexible tubing were used to direct the enclosed air from the chamber to the analyzers.
When plant height exceeded the standard chamber capacity, a larger chamber (24 × 24 × 50 cm or greater) was used to capture GHG emissions.
Gas fluxes were calculated using the ideal gas law, based on the linear increase in gas concentration over time. The flux (F) was calculated using the following equation [18,19,26]:
Flux= (S×V×t_c×M)/((RT×1000×A))
Where:
- F: Gas flux (mg m⁻2 h⁻¹)
- S: Slope of gas concentration increase over time (ppm s⁻¹)(CH₄:20s;N₂O:20s;CO₂:30s)
- V: Volume of the chamber (L)
- tc:Time conversion constant, N₂O:20s:180 = (1 h × (60 min/hour) × ((60 s/min)/20s);CO₂:120 = (1 h × (60 min/hour) × ((60 s/min)/30s);
- M: Molecular weight of the gas (g mol⁻¹)
- R: Ideal gas constant (0.082 L atm mol⁻¹ K⁻¹)
- T: Absolute temperature (K)
- 1000: Unit conversion factor (1 mg = 1000 µg)
- A: Area of the chamber base (m2)
2.3. Photosynthetic Carbon Assimilation Measurement
Carbon assimilation in Bambusa edulis (Odashima) was estimated based on leaf photosynthetic responses, measured using a portable photosynthesis system (GFS 3000, Heinz Walz GmbH, Germany). Photosynthetic light response curves were generated, and key parameters were calculated following the methods described by Chen et al. [27]. These parameters included the maximum assimilation rate (Aₘₐₓ), quantum efficiency (α), light compensation point (LCP), light saturation point (LSP), curve shape parameter (θ), and dark respiration rate (Rd).
The values of α, LCP, and Rd were derived from the linear portion of the light response curve under low irradiance conditions (≤ 50 μmol m⁻2 s⁻¹), using linear regression. Carbon assimilation rates were estimated using the model proposed by Chen et al. [27], with the following equation for net photosynthetic rate (A, μmol m⁻2 s⁻¹):
In Equation 2, the parameters Aₘₐₓ, α, and θ were obtained from light response curves measured in different seasons. Iₗ (μmol m⁻2 s⁻¹) represents the incident light intensity and was estimated using Beer’s Law, based on canopy-level measurements following the method described by Chen et al. [26].
Once the leaf-level net photosynthetic rate (A) was calculated, the daily carbon assimilation per plant (Ac) was estimated using Equation 3, incorporating daily photoperiod (h) and total leaf area (L). Monthly CO₂ assimilation was obtained by multiplying Ac by the number of days in each month. The annual CO₂ assimilation per plant was calculated as the sum of monthly values [28].
Leaf area index (LAI) was measured monthly using a plant canopy analyzer (LAI-2200, LI-COR Biosciences, USA). For each sampling event, LAI readings were taken at four orientations around each of the three sample bamboo clumps. A 90° view cap was used during measurements to minimize distortion from the central culm. The FV2200 software was used to calculate LAI, which was then combined with the measured canopy radius to estimate the ground projection area and total leaf area per plant [27].
Nighttime respiration was estimated using the dark respiration rate (Rd) obtained from the light response curve. To correct for temperature effects, respiration temperature response curves were concurrently measured. Monthly dark respiration rates were adjusted based on mean monthly temperatures. Nighttime respiration was then calculated using the following equation:
In Equation 4, Rₜ represents the temperature-adjusted dark respiration rate, and n denotes the duration of nighttime (in hours). The product of Rₜ and n yields the daily nighttime respiration per plant (R_c). Multiplying R_c by the number of days in each month provides the monthly respiration total. Finally, net carbon flux (i.e., net primary productivity, NPP) was calculated by subtracting total respiration from total assimilation for each plant [27].
2.4. Statistical Analysis
Statistical analyses were conducted using PASW Statistics 18 and SigmaPlot 10.0 software. A one-way analysis of variance (ANOVA) followed by Tukey’s Honestly Significant Difference (HSD) test was applied to evaluate significant differences among treatment means. In addition, Pearson correlation analysis was used to examine the relationships between greenhouse gas fluxes (CO₂ and N₂O) and environmental variables, including air temperature and precipitation. All data were tested for normality and homogeneity of variance prior to analysis to ensure the validity of parametric assumptions..
3. Results
3.1. Seasonal Variation in CO₂ Emissions
Seasonal averages of soil CO₂ fluxes in Bambusa edulis plots are presented in Figure 1. Across the four seasons, soil CO₂ emissions exhibited both temporal variation and treatment-specific differences. The mean seasonal CO₂ efflux ranged between 2 and 4 kg m⁻2, following the order: control (C) < fertilizer only (F) < biochar combined with fertilizer (B+F) < biochar alone (B). These results indicate that biochar application generally led to increased CO₂ emissions, with statistically significant differences observed (p < 0.05). However, no significant differences were detected among all treatments when analyzed pairwise.
The B+F treatment produced intermediate levels of CO₂ flux—averaging 3.31 ± 1.66 µmol m⁻2 s⁻¹ in summer and 2.15 ± 0.23 µmol m⁻2 s⁻¹ in winter—suggesting potential interactive effects between organic and inorganic inputs. Notably, CO₂ emissions declined across all treatments during the winter season, likely due to reduced atmosphere temperatures inhibiting microbial respiration and root activity.
3.2. N₂O Emissions and Fertilizer Response
Soil N₂O fluxes displayed pronounced differences among treatments. Plots receiving fertilizer (F) or biochar plus fertilizer (B+F) consistently exhibited higher N₂O emissions compared to the control (C) and biochar-only (B) treatments. Notably, peak N₂O fluxes occurred following fertilization events and during warmer seasons, particularly summer and autumn. The highest emission levels in F-treated plots reached 160.73 ± 96.22 g CO₂e m⁻2 during summer and 73.83 ± 48.56 g CO₂e m⁻2 in autumn.
These findings indicate that vermicompost application significantly stimulates N₂O emissions, likely via enhanced nitrification and denitrification processes. In contrast, the incorporation of biochar was associated with substantial emission reductions—43.3% lower in summer and 54.3% lower in autumn relative to fertilizer-only plots—highlighting its mitigation potential. Statistical analysis using one-way ANOVA revealed significant treatment effects (p < 0.05). Post hoc comparisons further clarified the ranking of annual N₂O emissions as follows: C ≈ B > B+F > F. These results underscore the dominant role of nitrogen inputs in driving N₂O fluxes and suggest that biochar may help suppress emissions when co-applied with fertilizers.
Pearson correlation analysis revealed that CO₂ fluxes were positively associated with atmosphere temperature (r = 0.63, p < 0.01) and moisture (r = 0.45, p < 0.05). N₂O fluxes showed even stronger correlation with rainfall (r = 0.71, p < 0.001), indicating its central role in regulating gaseous nitrogen losses. No significant correlations were found between gas fluxes and atmosphere temperatur , suggesting below that rainfall, which affects ground conditions, were the dominant drivers.
3.3. Carbon Assimilation Performance
Measurements of photosynthetic performance revealed both seasonal variation and treatment-dependent differences in net carbon assimilation. As shown in Figure 3, the seasonal carbon sequestration capacity of Bambusa edulis ranged from approximately 1.8 to 18.5 kg CO₂ per clump per season. Among the four treatments, the fertilizer-only (F) group exhibited the highest carbon assimilation, with a peak value of 18.6 kg CO₂ clump⁻¹ observed in spring. The biochar plus fertilizer (B+F) treatment followed, with a seasonal average of 9.9 kg CO₂ clump⁻¹, while the biochar-only (B) treatment yielded a slightly lower average of 8.5 kg CO₂ clump⁻¹. The control (C) group consistently showed the lowest carbon uptake, averaging 6.5 kg CO₂ clump⁻¹ across all seasons.
In autumn, the carbon assimilation of the control group was significantly lower (p < 0.05), likely due to reduced precipitation that intensified drought stress. In the absence of nutrient supplementation, plants in the control plots experienced more pronounced physiological decline under water-limited conditions.
All treatments exhibited their lowest carbon assimilation rates in winter, corresponding to the dormant phase of bamboo growth. With the onset of spring rainfall, new leaf emergence stimulated an increase in photosynthetic activity and carbon uptake. The observed seasonal trends highlight the role of fertilization in enhancing canopy productivity and total carbon input across growth cycles.
When comparing GHG emissions with assimilation rates, the F and B+F treatments showed higher gross CO₂ release but also substantially elevated carbon uptake. The biochar treatment (B) offered a balanced profile with moderate emissions and enhanced photosynthesis. Control plots maintained the lowest emissions and uptake. This result highlights the benefits of biochar application in reducing greenhouse gas emissions under fertilized cultivation, carrying important implications for carbon budgeting and mitigation strategies in bamboo agroecosystems.
Figure 1.
Seasonal variation of soil CO₂ fluxes (µmol m⁻2 s⁻¹) under different treatments (C = control, B = biochar, F = fertilizer, B+F = biochar + fertilizer). Error bars represent standard deviation. Different letters indicate significant differences (p < 0.05) in Tukey HSD analysis among the four field treatments (n=12).
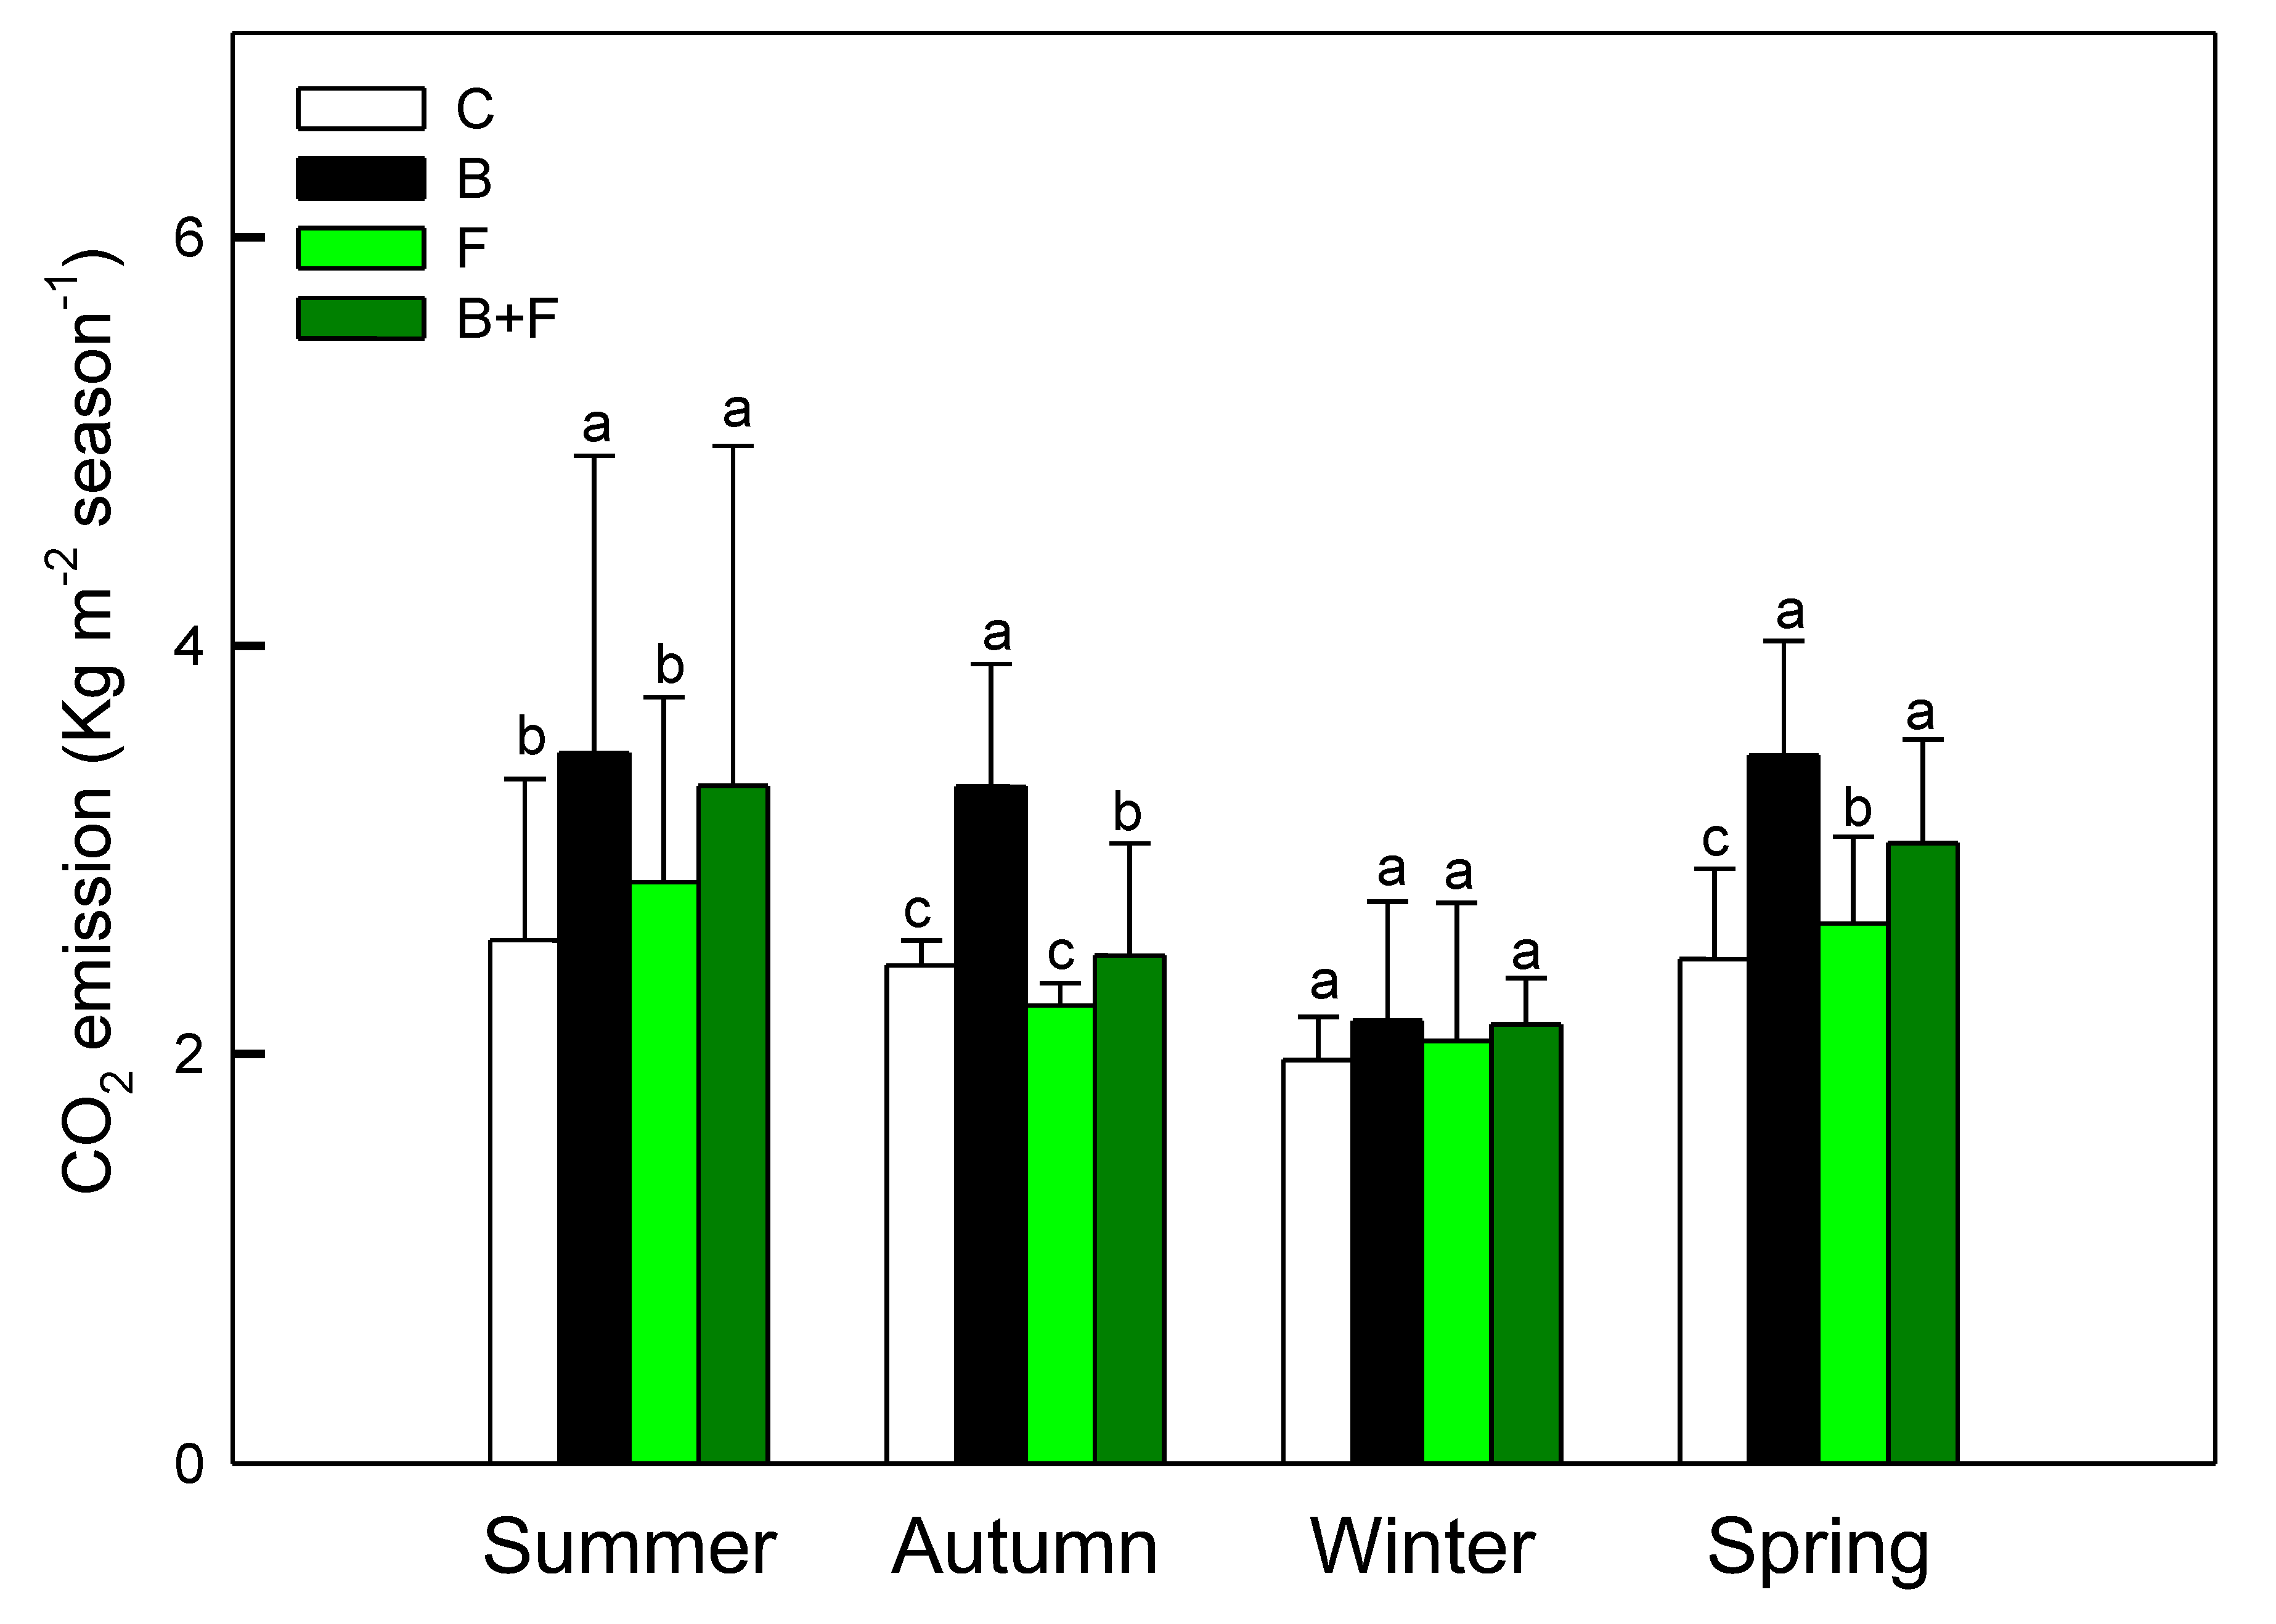
Figure 2.
Seasonal N₂O fluxes (µg N m⁻2 s⁻¹) under different treatments (C = control, B = biochar, F = fertilizer, B+F = biochar + fertilizer). Error bars represent standard deviation. Different letters indicate significant differences (p < 0.05) in Tukey HSD analysis among the four field treatments (n=12).
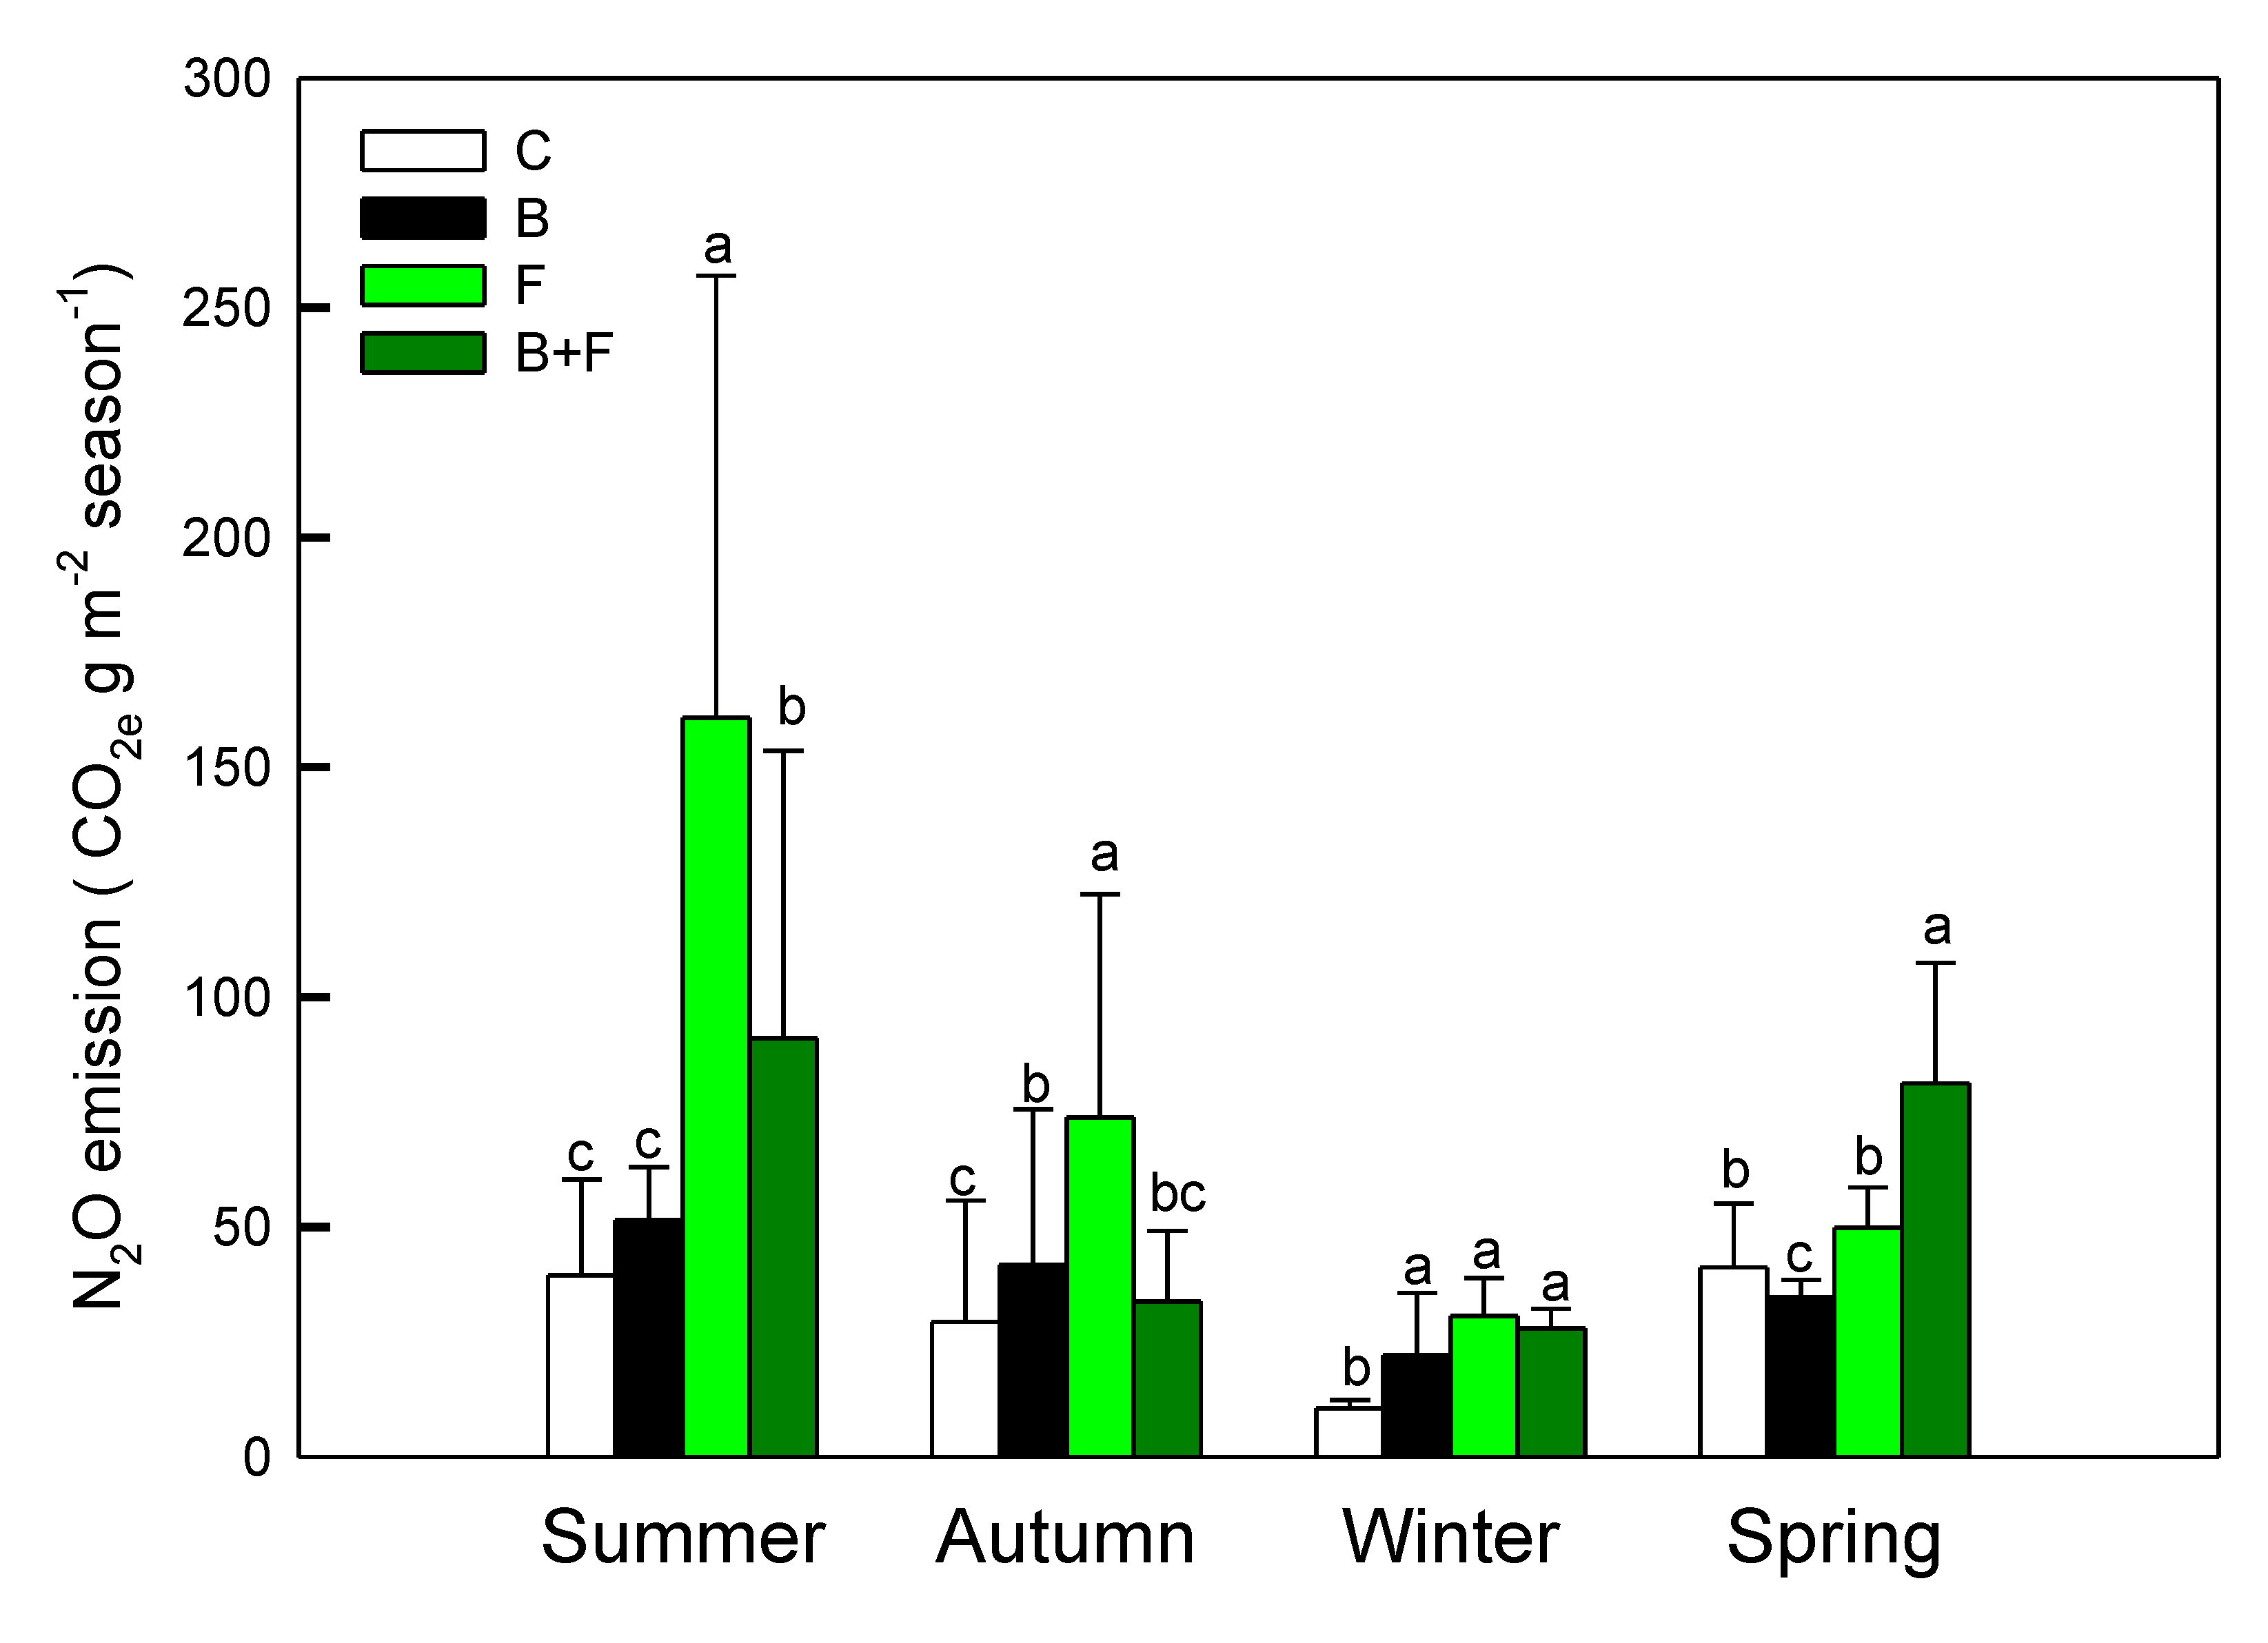
Figure 3.
Seasonal net carbon assimilation rates (kg clump-1) estimated from photosynthetic activity and LAI. Different letters indicate significant differences (p < 0.05) in Tukey HSD analysis among the four field treatments (n=12).
Figure 3.
Seasonal net carbon assimilation rates (kg clump-1) estimated from photosynthetic activity and LAI. Different letters indicate significant differences (p < 0.05) in Tukey HSD analysis among the four field treatments (n=12).
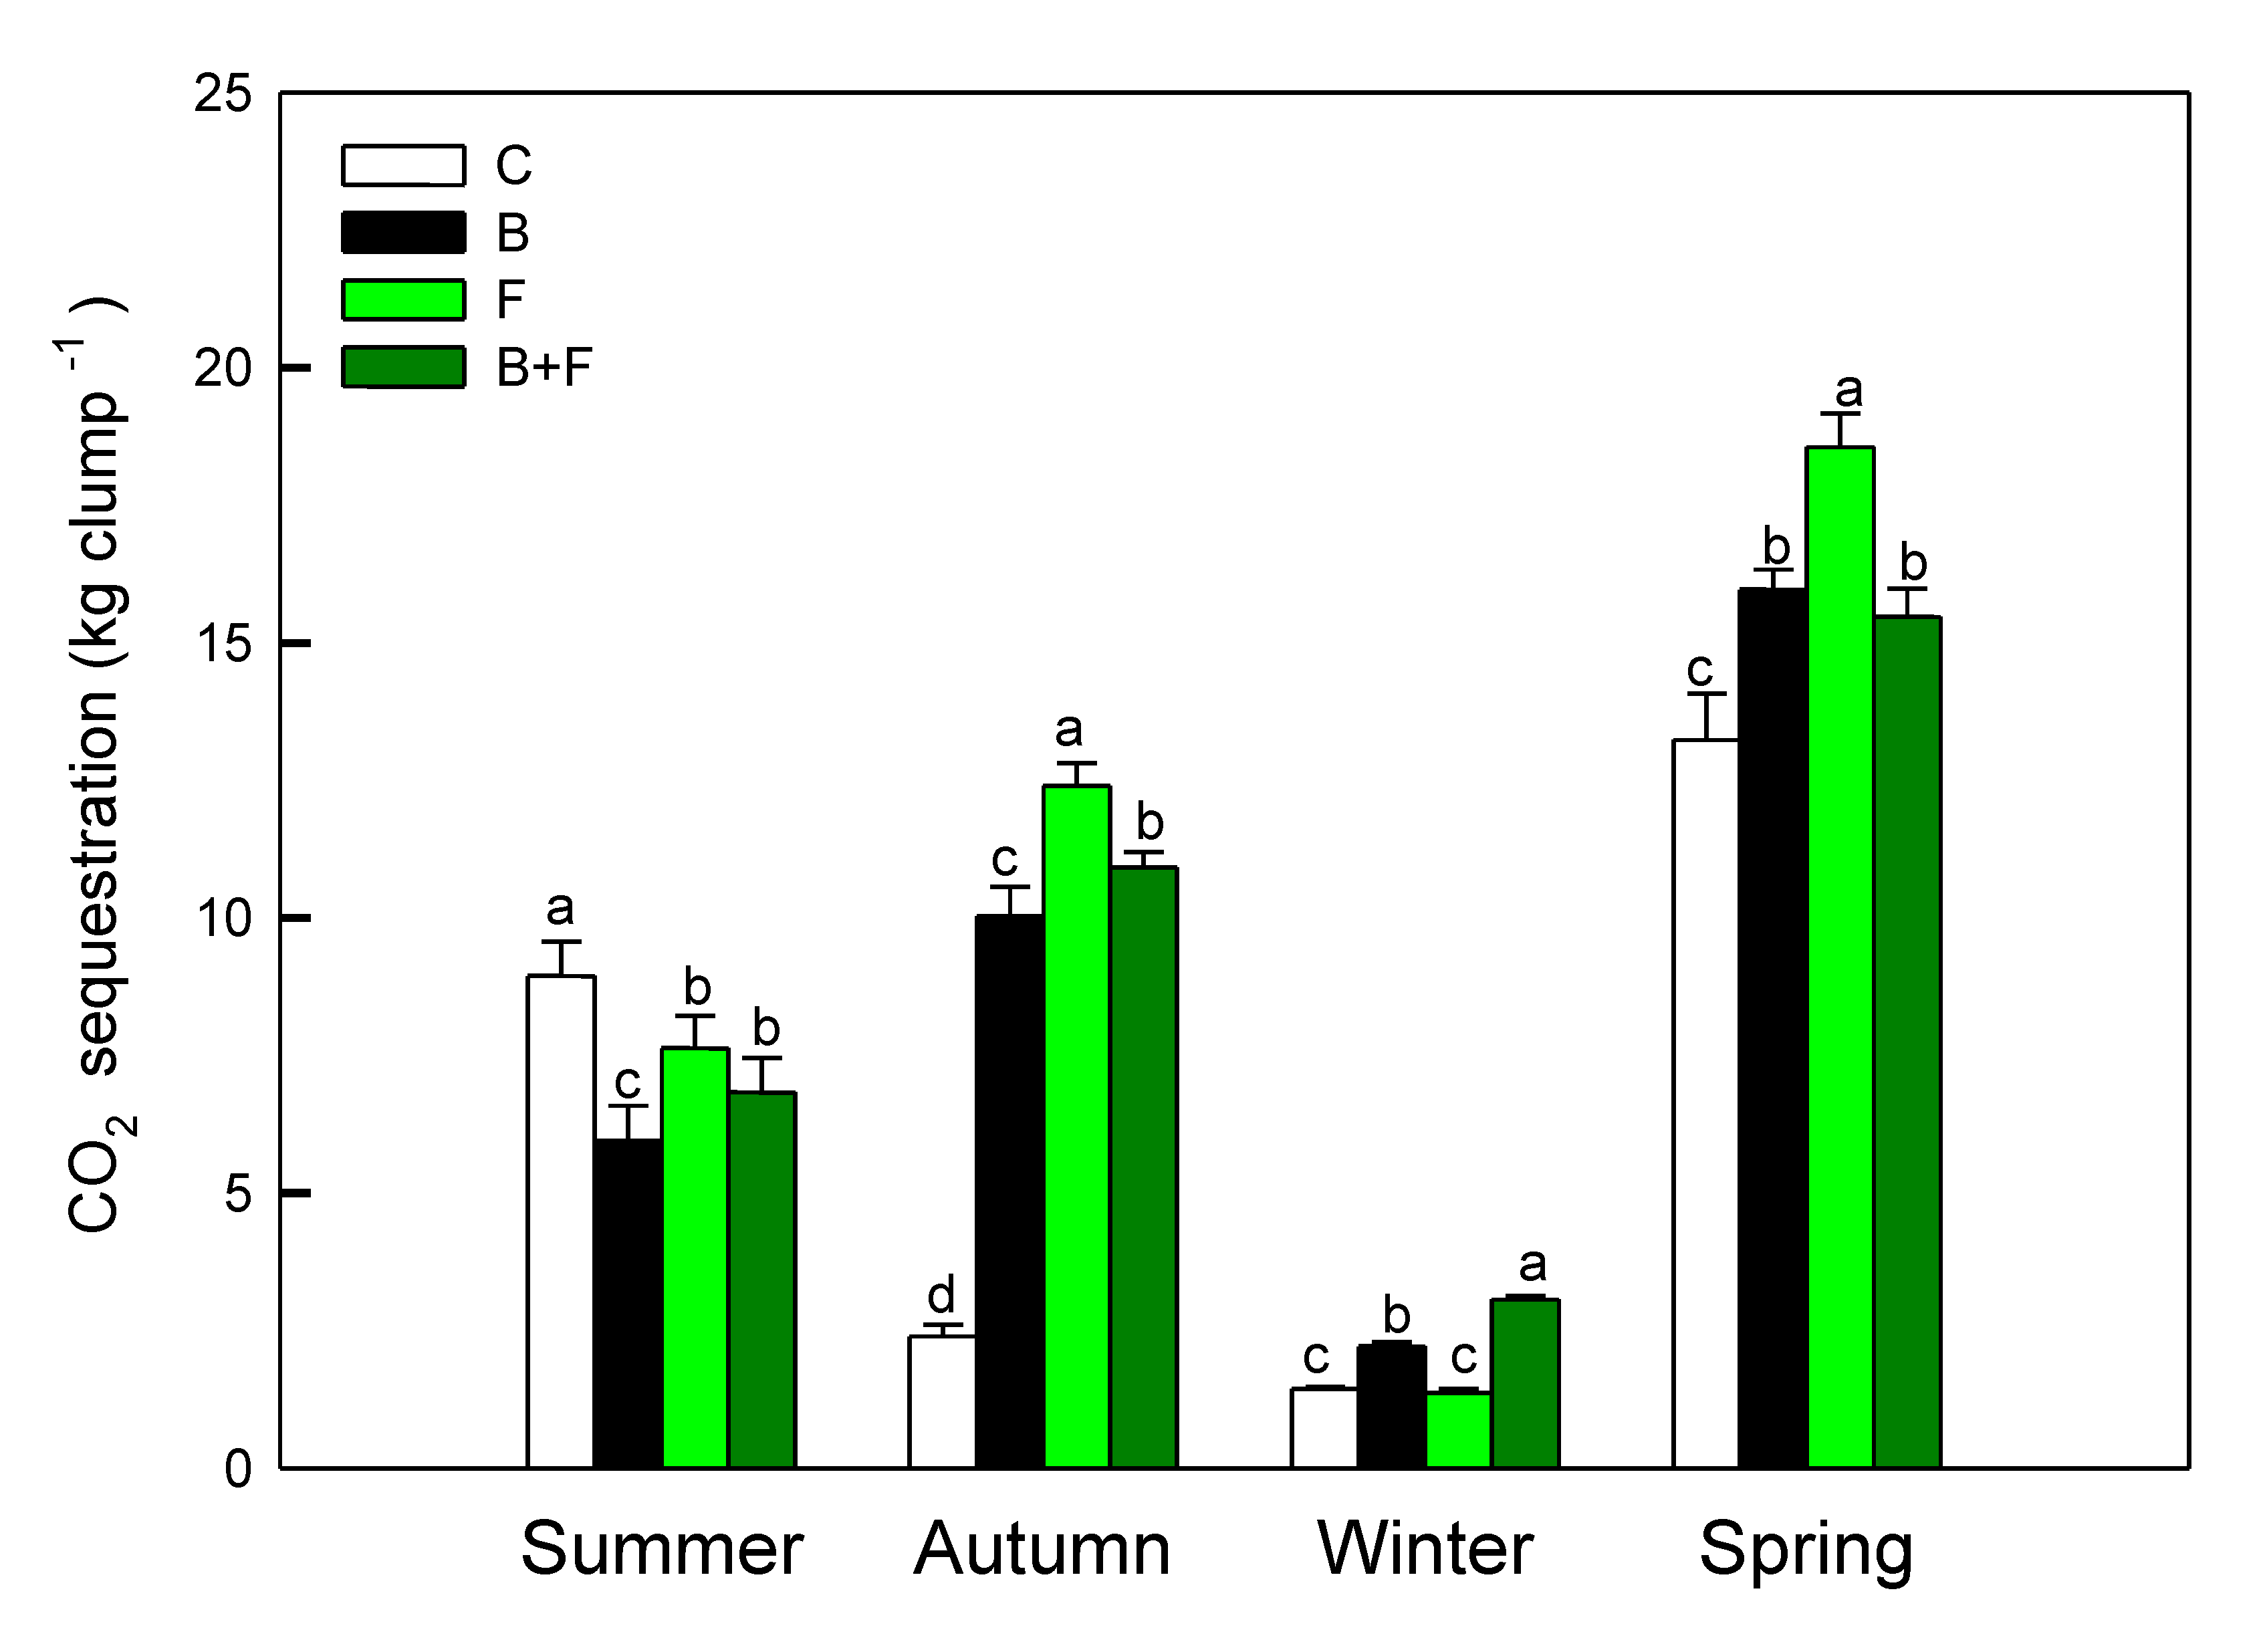

Table 1.
Pearson correlation coefficients between soil greenhouse gas emissions and environmental factors.
Table 1.
Pearson correlation coefficients between soil greenhouse gas emissions and environmental factors.
| temperature | rainfall | CO2 | N2O | |
| temperature | 1 | .768** | .867** | .763** |
| rainfall | - | 1 | .854** | .857** |
| CO2 | - | - | 1 | .714* |
| N2O | - | - | - | 1 |
Note: ** indicates p-value < 0.01; * indicates p-value < 0.05. (n=48).
4. Discussion
4.1. CO₂ Emissions
Seasonal and treatment-driven fluctuations in CO₂ and N₂O fluxes from Bambusa edulis plantations observed in this study are consistent with previous research highlighting the influence of environmental and management factors on greenhouse gas (GHG) dynamics in forested and agroforestry systems [29,30]. Our findings indicate that while vermicompost application led to substantial increases in both CO₂ and N₂O emissions, it also resulted in improved net carbon assimilation. This outcome exemplifies a common trade-off encountered in tropical and subtropical agroecosystems, where productivity gains are often accompanied by elevated emission intensities [31].
The elevated CO₂ efflux recorded in the F and B+F treatments can likely be explained by a synergistic rise in autotrophic respiration—due to increased root biomass—and heterotrophic respiration, which may have been stimulated by microbial proliferation in response to nutrient availability [32]. Enhanced nitrogen levels are known to promote root development and rhizosphere metabolic activity, thereby contributing to higher respiration rates [33,34]. Moreover, peak CO₂ emissions during the summer season likely reflect optimal microbial and root functioning under warm and moist conditions [35].
Although biochar is typically regarded as a carbon-stabilizing amendment, its effects on CO₂ flux remain context-dependent. In some cases, increased emissions have been attributed to priming effects associated with labile carbon fractions in biochar [17,36]. In contrast, other studies report decreased emissions due to microbial immobilization and stabilization of organic carbon [37]. In our study, the B+F treatment produced moderate CO₂ fluxes relative to the fertilizer-only plots, suggesting that the co-application of biochar and composted inputs may temper microbial decomposition rates and modulate carbon release.
4.2. N₂O Emissions and Nitrogen Transformation Pathways
Our results demonstrate clear differences in greenhouse gas (GHG) emissions depending on the type of fertilizer used. Plots treated with synthetic fertilizer exhibited the highest N₂O emissions, particularly during the summer and autumn seasons. This observation is consistent with Shcherbak et al. [38], who reported a nonlinear escalation of N₂O fluxes with increased nitrogen fertilizer (vermicompost) rates, largely due to intensified nitrification–denitrification pathways [39]. The rapid nitrogen availability in vermicompost creates microbial “hotspots,” triggering pulses of GHG emissions [40]. These findings are also in line with the global trend reported by Amirahmadi et al. [24], whose meta-analysis revealed that combined biochar and chemical fertilizer (BCF) treatments led to a 62.9% increase in N₂O emissions. In contrast, their analysis showed that sole biochar application (B) was more effective in reducing gaseous nitrogen losses under field conditions—a pattern that closely aligns with our own observations.
In contrast, B+F treatment resulted in lower emissions, attributed to its gradual nutrient release and higher carbon-to-nitrogen ratio, which promotes microbial nitrogen immobilization and limits denitrification. Charles et al. [41] noted that while organic fertilizers display greater variability in emissions, they typically reduce average N₂O output due to improved microbial stability. Furthermore, combining biochar with organic fertilizers has been shown to enhance nitrogen retention, alter microbial community structure, and suppress denitrification processes [42,43]. These effects likely contribute to the observed emission reductions in our biochar-amended plots.
Environmental factors also modulate GHG fluxes. rainfall was significantly correlated with N₂O emissions in our study, reaffirming the findings of Fang et al. [44], who emphasized the role of water-filled pore space in driving microbial N transformations. The porous structure of biochar further influences microsite oxygen diffusion and redox dynamics, suppressing N₂O generation under fluctuating moisture conditions [45]. Regarding the frequency of greenhouse gas (GHG) measurements, the development of Tier 3 emission factors typically requires monitoring at weekly or biweekly intervals to capture short-term fluctuations. However, numerous studies on GHG emissions from paddy fields have demonstrated that conducting measurements every 7–10 days during critical growth stages of rice (e.g., tillering, heading, and irrigation periods) is sufficient to effectively capture the peaks and temporal trends of CH₄ and N₂O emissions. For example, experiments conducted in China, Korea, and Japan have successfully employed 7–10 day intervals to obtain reliable estimates of seasonal cumulative emissions, which have been widely published in international journals [16,18,19,46,47,48,49]. Accordingly, the measurement intervals adopted in this study were designed based on these references and are statistically robust in reflecting both seasonal variations and treatment effects. These results provide empirical evidence that integrated use of biochar and compost represents a viable strategy to reduce GHG intensity while sustaining photosynthetic performance.
In addition, the coastal site’s saline conditions likely influenced both plant physiological responses and microbial GHG dynamics. High soil salinity may have suppressed microbial activity and altered nitrogen transformation pathways, particularly in control plots where no organic amendments were applied. The enhanced performance under biochar treatments may partly reflect improved osmotic buffering and soil structure, which warrants further investigation through direct salinity measurements in future studies.
4.3. Carbon Assimilation and Photosynthetic Response
The enhancement of bamboo's photosynthetic performance under fertilization treatments aligns with well-documented physiological mechanisms whereby increased nitrogen availability promotes chlorophyll synthesis, Rubisco enzyme activity, and stomatal regulation [50,51]. Elevated net assimilation rates (Aₙ) observed in fertilizer (F) and biochar-plus-fertilizer (B+F) plots mirror responses seen in other high-biomass, fast-growing tree species such as Eucalyptus and Populus [52].
Estimates of carbon assimilation based on leaf area index (LAI) reached values as high as 1.8 to 18.5 kg CO₂ per clump per season, which are consistent with, or even surpass, those reported for intensively managed bamboo plantations in subtropical China [5,6]. These results further substantiate the notion that bamboo ecosystems, under appropriate nutrient regimes, are capable of achieving levels of primary productivity comparable to conventional forest systems.
4.4. Management Implications for Bamboo Agroecosystems
The observed trade-off between enhanced carbon uptake and increased greenhouse gas (GHG) emissions in the fertilizer (F) and biochar-plus-fertilizer (B+F) treatments underscores the complexity of managing bamboo-based agroforestry systems for both productivity and climate outcomes. While the use of synthetic fertilizers can drive short-term gains in biomass accumulation, the associated rise in N₂O emissions poses challenges for long-term carbon neutrality if not carefully managed [53].
Conversely, compost-only treatments offered a more favorable balance, achieving improved photosynthetic performance while maintaining relatively low GHG emissions. This aligns with findings by Agegnehu et al. [54], who reported that organic amendments can enhance soil health and plant growth without promoting excessive nitrogen losses. Li et al. [7] also reported that long-term application of biochar and plant residues in subtropical maize systems significantly increased soil organic carbon and sustained crop yields. The addition of biochar, as demonstrated in this study, further contributed to N₂O mitigation, highlighting its value as a carbon-stabilizing amendment with long-term sequestration potential [55]
With the growing emphasis on soil-derived greenhouse gas emissions within climate policy frameworks and voluntary carbon credit systems, localized empirical evidence is becoming increasingly essential for informing monitoring, reporting, and verification (MRV) protocols. In alignment with Taiwan’s 2050 carbon neutrality objectives, the strategic integration of bamboo shelterbelt systems—particularly under well-regulated nutrient regimes—presents a promising solution to reconcile carbon sequestration efforts with emission mitigation targets [56]. Furthermore, evaluating the performance of bamboo species alongside other reforestation or afforestation alternatives may assist in optimizing land-use decisions within broader nature-based solution (NbS) frameworks [2,57]. Considering bamboo’s ecological advantages—including rapid biomass recovery, effective erosion control, and contributions to rural livelihoods—properly managed bamboo landscapes hold strong potential to serve as multifunctional assets in climate-resilient rural development strategies.
5. Conclusions
This study provides site-specific empirical data on greenhouse gas (GHG) emissions and carbon assimilation of Bambusa edulis under different soil amendment regimes in a coastal windbreak system in southwestern Taiwan. The results indicate that vermicompost (F) treatment significantly enhanced aboveground carbon uptake but also increased both CO₂ and N₂O emissions, especially during warm seasons. In contrast, the biochar-only (B) treatment showed a more balanced performance, with moderate carbon assimilation and lower GHG emissions. The combined treatment (B+F) exhibited intermediate responses, suggesting potential for synergistic but complex interactions between organic inputs. These findings highlight the importance of context-specific nutrient management in optimizing the trade-off between productivity and emission intensity. This result underscores the advantages of biochar in reducing greenhouse gas emissions under fertilized cultivation conditions, with important implications for carbon budgeting and mitigation strategies in bamboo agroecosystems. By employing standardized gas flux and photosynthesis measurement methods, this study examined seasonal trends and provides a sustainable monitoring model for managing bamboo plantations with reduced greenhouse gas emissions.
Supplementary Materials
The following supporting information can be downloaded at the website of this paper posted on Preprints.org.
Author Contributions
Conceptualization, Y.-P.H., C.-W.W., and W.-H.H.; methodology, Y.-P.H., C.-P.S., and C.-I.C.; field investigation, J.-Y.S., W.-C.C., and S.-C.L.; data analysis, Y.-P.H. and Y.-H.L.; resources and project administration, C.-W.W. and L.-H.L.; writing—original draft preparation, Y.-P.H. and C.-P.S.; writing—review and editing, C.-W.W. and W.-H.H.; supervision, W.-H.H. and C.-W.W. All authors have read and agreed to the published version of the manuscript.
Funding
This research received no external funding.
Data Availability Statement
The datasets used and/or analysed during the current study are available from the corresponding author on reasonable request.
Conflicts of Interest
The authors declare no conflicts of interest.
References
- IPCC. Climate Change 2023: Synthesis Report. Intergov. Panel Clim. Change 2023. Available online: https://www.ipcc.ch/report/sixth-assessment-synthesis-report (accessed on 2025.6.25).
- Seddon, N.; Chausson, A.; Berry, P.; Girardin, C.A.J.; Smith, A.; Turner, B. Understanding the value and limits of nature-based solutions to climate change and other global challenges. Philos. Trans. R. Soc. B 2020, 375, 20190120. [Google Scholar] [CrossRef]
- Science Based Targets initiative (SBTi). Foundations for Science-Based Net-Zero Target Setting in the Corporate Sector; SBTi: London, UK, 2021; Available online: https://sciencebasedtargets.org/resources/files/foundations-of-net-zero.pdf (accessed on 25 June 2025).
- TNFD. The LEAP Approach: A Technical Guidance for Nature-Related Risk and Opportunity Assessment; Taskforce on Nature-related Financial Disclosures: Geneva, 2022; Available online: https://tnfd.global (accessed on 25 June 2025).
- Zhou, G.; Jiang, P.; Wang, Y.; Luo, Y. Carbon balance of a managed Chinese fir plantation ecosystem in sub-tropical China. For. Ecol. Manag. 2005, 212, 131–145. [Google Scholar]
- Song, X.; Zhou, G.; Jiang, H.; Yu, S.; Fu, J.; Li, W.; Wang, W.; Ma, Z.; Peng, C. Carbon sequestration by Chinese bamboo forests and their ecological benefits: Assessment of potential, problems, and future challenges. J. For. Res. 2011, 22, 575–580. [Google Scholar] [CrossRef]
- Li, Y.; Liu, Y.; Zhang, H.; Zhang, J.; Wang, J.; Xie, Z. Long-term carbon input through plant residues and biochar improves soil carbon stock and maize productivity in a subtropical agroecosystem. Field Crops Research 2025, 299, 110040. [Google Scholar]
- Huang, C.-H.; Wang, S.-C.; Lin, H.-J. Toward national accounting of bamboo-based carbon sinks: Lessons from Taiwan. Sustain. Sci. 2023, 18, 45–59. [Google Scholar]
- Yang, R.; Lin, Y.; Chen, Y.; Chen, C.; Hsu, L. Bio-based nutrient strategies for emission reduction in bamboo plantations. Agron. Sustain. Dev. 2023, 43, 33. [Google Scholar]
- Antal, M.J.; Grønli, M. The art, science, and technology of charcoal production. Ind. Eng. Chem. Res. 2003, 42, 1619–1640. [Google Scholar] [CrossRef]
- Jeffery, S.; Bezemer, T.M.; Cornelissen, G.; Kuyper, T.W.; Lehmann, J.; Mommer, L.; et al. The way forward in biochar research: Targeting trade-offs between the potential wins. Glob. Change Biol. Bioenergy 2015, 7, 1–13. [Google Scholar] [CrossRef]
- Li, H.; Wei, Y.; Chen, Z.; Liu, C.; Yu, M.; Zhang, Q.; et al. Biochar Application Improves Soil Nutrient Availability and Crop Yield by Regulating Enzyme Activity and Microbial Community in Maize Field. J. Plant Growth Regul. 2023, 42, 2992–3007. [Google Scholar]
- Gupta, A.; Singh, P.; Bhatia, A.; Kumar, R. Biochar and Nitrogen Fertilizer Application Improves Nitrogen Use Efficiency and Maize Yield in Semi-Arid Regions. Sustainability 2022, 14, 14523. [Google Scholar]
- Lehmann, J.; Joseph, S. Biochar for environmental management: An introduction. In Lehmann, J.; Joseph, S. (Eds.), Ed.; Biochar for Environmental Management; Earthscan: London, UK, 2009; pp. 1–12. [Google Scholar]
- Song, X.Z.; Pan, G.; Wang, H.; Zhang, C. Effects of biochar application on fluxes of three biogenic greenhouse gases: A meta-analysis. Ecosyst. Health Sustain. 2016, 2, 1–13. [Google Scholar] [CrossRef]
- Li, Y.; Hu, S.; Chen, J.; Müller, K.; Li, Y.; Fu, W.; et al. Effects of biochar application in forest ecosystems on soil properties and greenhouse gas emissions: A review. J. Soils Sediments 2018, 18, 546–563. [Google Scholar] [CrossRef]
- Ma, R.; Wu, X.; Liu, Z.; Yi, Q.; Xu, M.; Zheng, J.; Pan, G. Biochar improves soil organic carbon stability by shaping the microbial community structures at different soil depths four years after incorporation in a farmland soil. Curr. Res. Environ. Sustain. 2023, 5, 100214. [Google Scholar] [CrossRef]
- Yang, X.-C.; Huang, M.-Y.; Chen, C.-I.; Lin, C.-H.; Huang, W.-H.; Lee, L.-H.; Wang, C.-W. Assessing the benefits of alternating wet and dry (AWD) irrigation of rice fields on greenhouse gas emissions in central Taiwan. Taiwania 2025, 70. [Google Scholar] [CrossRef]
- Wang, C.-W.; Lin, K.-H.; Feng, Y.-Z.; Lin, Y.-W.; Yang, Z.-W.; Chen, C.-I.; Huang, M.-Y. Effects of crop rotation and tillage on CO₂ and CH₄ fluxes in paddy fields. Taiwania 2025, 70. [Google Scholar] [CrossRef]
- Woolf, D.; Amonette, J.E.; Street-Perrott, F.A.; Lehmann, J.; Joseph, S. Sustainable biochar to mitigate global climate change. Nat. Commun. 2010, 1, 56. [Google Scholar] [CrossRef]
- Biederman, L.A.; Harpole, W.S. Biochar and its effects on plant productivity and nutrient cycling: A meta-analysis. GCB Bioenergy 2013, 5, 202–214. [Google Scholar] [CrossRef]
- Novak, J.M.; Lima, I.M.; Xing, B.; Gaskin, J.W.; Steiner, C.; Das, K.C.; Schomberg, H.H. Characterization of designer biochar produced at different temperatures and their effects on a loamy sand. Ann. Environ. Sci. 2014, 8, 1–14. [Google Scholar]
- Gao, J.; Li, Q.; Zhang, J.; Cui, K.; Wu, Z.; Shi, M.; Song, X. Biochar amendment alters the nutrient-use strategy of Moso bamboo under N additions. Front. Plant Sci. 2021, 12, 667964. [Google Scholar] [CrossRef]
- Amirahmadi, E.; Ghorbani, M.; Adani, F. Biochar contribution in greenhouse gas mitigation and crop yield considering pyrolysis conditions, utilization strategies and plant type – A meta-analysis. Field Crops Res. 2025, 333, 110040. [Google Scholar] [CrossRef]
- Liu, C.C.; Huang, L.C.; Chang, C.T.; Sung, H.Y. Purification and characterization of soluble invertases from suspension-cultured bamboo (Bambusa edulis) cells. Food Chem. 2006, 96, 621–631. [Google Scholar] [CrossRef]
- Pao, S.H.; Wu, H.; Hsieh, H.L.; Chen, C.P.; Lin, H.J. Effects of modulating probiotics on greenhouse gas emissions and yield in rice paddies. Plant Soil Environ. 2024, 71, 21–35. [Google Scholar] [CrossRef]
- Chen, C.-I.; Wang, Y.-N.; Lin, H.-H.; Wang, C.-W.; Yu, J.-C.; Chen, Y.-C. Seasonal Photosynthesis and Carbon Assimilation Dynamics in a Zelkova serrata (Thunb.) Makino Plantation. Forests 2021, 12. [Google Scholar] [CrossRef]
- Chen, J.; Li, Z.; Zhao, B.; Zhang, Y.; Zhu, D.; Sun, C. Nitrogen transformation and microbial community analysis in soil under long-term straw returning and chemical fertilizer application. Sci. Total Environ. 2019, 647, 419–428. [Google Scholar]
- Singh, B.P.; Hatton, B.J.; Singh, B.; Cowie, A.L.; Kathuria, A. Influence of biochars on nitrous oxide emission and nitrogen leaching from two contrasting soils. J. Environ. Qual. 2010, 39, 1224–1235. [Google Scholar] [CrossRef]
- Oertel, C.; Matschullat, J.; Zurba, K.; Zimmermann, F.; Erasmi, S. Greenhouse gas emissions from soils—A review. Carbon Balance Manag. 2016, 11, 1–17. [Google Scholar] [CrossRef]
- Jiang, Y.; Wang, W.; Xie, X.; Wang, L.; Zhang, J.; Li, X. Fertilizer management effects on carbon dioxide emissions from vegetable production in China: A meta-analysis. Sci. Total Environ. 2019, 688, 1325–1336. [Google Scholar]
- Raich, J.W.; Tufekciogul, A. Vegetation and soil respiration: Correlations and controls. Biogeochemistry 2000, 48, 71–90. [Google Scholar] [CrossRef]
- Subke, J.A.; Inglima, I.; Cotrufo, M.F. Trends and methodological impacts in soil CO₂ efflux partitioning: A meta-analytical review. New Phytol. 2006, 171, 175–195. [Google Scholar]
- Wang, Y.; Hu, C.; Dong, W.; Li, X. Effect of fertilization on soil respiration and its temperature sensitivity in a winter wheat field. Plant Soil 2011, 343, 139–155. [Google Scholar]
- Davidson, E.A.; Janssens, I.A.; Luo, Y. On the variability of respiration in terrestrial ecosystems: Moving beyond Q₁₀. Ecology 2006, 87, 2348–2357. [Google Scholar] [CrossRef]
- Zimmerman, A.R.; Gao, B.; Ahn, M.Y. Positive and negative carbon mineralization priming effects among a variety of biochar-amended soils. Environ. Sci. Technol. 2011, 45, 5137–5143. [Google Scholar] [CrossRef]
- Ventura, M.; Panzacchi, P.; Biasiol, S.; Tonon, G. Biochar reduces short-term nitrate leaching from A horizon in a silty clay loam soil. Sci. Total Environ. 2019, 655, 512–522. [Google Scholar]
- Shcherbak, I.; Millar, N.; Robertson, G.P. Global meta-analysis of the nonlinear response of soil nitrous oxide (N₂O) emissions to fertilizer nitrogen. Glob. Change Biol. 2014, 20, 1398–1406. [Google Scholar]
- Baggs, E.M. Soil microbial sources of nitrous oxide: Recent advances in knowledge, emerging challenges and future direction. Plant Soil 2011, 339, 1–17. [Google Scholar] [CrossRef]
- Akiyama, H.; Yan, X.; Yagi, K. Evaluation of effectiveness of enhanced-efficiency fertilizers as mitigation options for N₂O and NO emissions from agricultural soils: Meta-analysis. Glob. Change Biol. 2010, 16, 1837–1846. [Google Scholar] [CrossRef]
- Charles, A.; Rochette, P.; Whalen, J.K.; Angers, D.A.; Chantigny, M.H. Global nitrous oxide emission factors of mineral and organic fertilizers used in agriculture: A meta-analysis. Soil Biol. Biochem. 2017, 111, 208–220. [Google Scholar]
- Abalos, D.; Jeffery, S.; Sanz-Cobena, A.; Guardia, G.; Vallejo, A. Meta-analysis of the effect of urease and nitrification inhibitors on crop productivity and nitrogen use efficiency. Glob. Change Biol. 2014, 20, 3610–3621. [Google Scholar] [CrossRef]
- Liu, X.; Zhang, A.; Ji, C.; Joseph, S.; Bian, R.; Li, L.; Pan, G.; et al. Biochar’s effect on crop productivity and the dependence on experimental conditions—A meta-analysis of literature data. Sci. Total Environ. 2017, 592, 333–341. [Google Scholar] [CrossRef]
- Fang, Y.; Zhu, X.; Wang, W.; Yu, G. Responses of N₂O emissions to nitrogen fertilization and environmental factors in global paddy fields. Biogeosciences 2021, 18, 513–528. [Google Scholar]
- Taghizadeh-Toosi, A.; Clough, T.J.; Condron, L.M.; Sherlock, R.R. Biochar incorporation into pasture soil suppresses in situ nitrous oxide emissions from ruminant urine patches. Soil Biol. Biochem. 2011, 43, 216–225. [Google Scholar] [CrossRef]
- Ali, M. A.; Oh, J. H.; Kim, P. J. Evaluation of silicate iron slag amendment on reducing methane emission from flood water rice farming. Agriculture, Ecosystems & Environment 2008, 128, 21–26. [Google Scholar] [CrossRef]
- Ali, M. A.; Lee, C. H.; Lee, Y. B.; Kim, P. J. Silicate fertilization in no-tillage rice farming for mitigation of methane emission and increasing rice productivity. Agriculture, Ecosystems & Environment 2009, 132, 16–22. [Google Scholar] [CrossRef]
- Kreye, C.; Dittert, K.; Zheng, X.; Zhang, X.; Lin, S.; Tao, H.; Sattelmacher, B. Fluxes of methane and nitrous oxide in water-saving rice production in North China. Nutrient Cycling in Agroecosystems 2007, 77, 293–304. [Google Scholar] [CrossRef]
- Amirahmadi, E.; Ghorbani, M.; Adani, F. Biochar contribution in greenhouse gas mitigation and crop yield considering pyrolysis conditions, utilization strategies and plant type – A meta-analysis. Field Crops Research 2025, 333, 110040. [Google Scholar] [CrossRef]
- Evans, J.R. Photosynthesis and nitrogen relationships in leaves of C₃ plants. Oecologia 1989, 78, 9–19. [Google Scholar] [CrossRef]
- Makino, A.; Sakuma, H.; Sudo, E.; Mae, T. Differences between maize and rice in N-use efficiency for photosynthesis and protein allocation. Plant Cell Environ. 2003, 26, 947–957. [Google Scholar] [CrossRef]
- Crous, K.Y.; Quentin, A.G.; Lin, Y.-S.; Medlyn, B.E.; Williams, D.G.; Barton, C.V.M.; Ellsworth, D.S. Photosynthesis of Eucalyptus species along a subambient to elevated CO₂ gradient. Tree Physiol. 2011, 31, 256–267. [Google Scholar]
- Smith, P.; Martino, D.; Cai, Z.; Gwary, D.; Janzen, H.; Kumar, P.; Smith, J. Greenhouse gas mitigation in agriculture. Agric. Ecosyst. Environ. 2007, 118, 6–28. [Google Scholar] [CrossRef]
- Agegnehu, G.; Bass, A.M.; Nelson, P.N.; Bird, M.I. Benefits of biochar, compost and biochar–compost for soil quality, maize yield and greenhouse gas emissions in tropical agricultural soil. Agric. Ecosyst. Environ. 2016, 218, 121–134. [Google Scholar] [CrossRef]
- Lehmann, J.; Joseph, S. (Eds.) Biochar for Environmental Management: Science, Technology and Implementation, 2nd ed.; Routledge: London, UK, 2015. [Google Scholar] [CrossRef]
- Taiwan EPA. Taiwan's Net-Zero Emissions Pathway; Environmental Protection Administration, Executive Yuan, Taiwan: Taipei, 2022; Available online: https://enews.epa.gov.tw/Page/3B3C62C78849F32F/f4c3c91d-51f9-41a2-850f-cd1a3f94d50f (accessed on 25 June 2025).
- Griscom, B.W.; Adams, J.; Ellis, P.W.; Houghton, R.A.; Lomax, G.; Miteva, D.A.; Fargione, J. Natural climate solutions. Proc. Natl. Acad. Sci. USA 2017, 114, 11645–11650. [Google Scholar] [CrossRef] [PubMed]
Disclaimer/Publisher’s Note: The statements, opinions and data contained in all publications are solely those of the individual author(s) and contributor(s) and not of MDPI and/or the editor(s). MDPI and/or the editor(s) disclaim responsibility for any injury to people or property resulting from any ideas, methods, instructions or products referred to in the content. |
© 2025 by the authors. Licensee MDPI, Basel, Switzerland. This article is an open access article distributed under the terms and conditions of the Creative Commons Attribution (CC BY) license (http://creativecommons.org/licenses/by/4.0/).
Copyright: This open access article is published under a Creative Commons CC BY 4.0 license, which permit the free download, distribution, and reuse, provided that the author and preprint are cited in any reuse.


