
Submitted:
18 April 2025
Posted:
21 April 2025
You are already at the latest version
Abstract
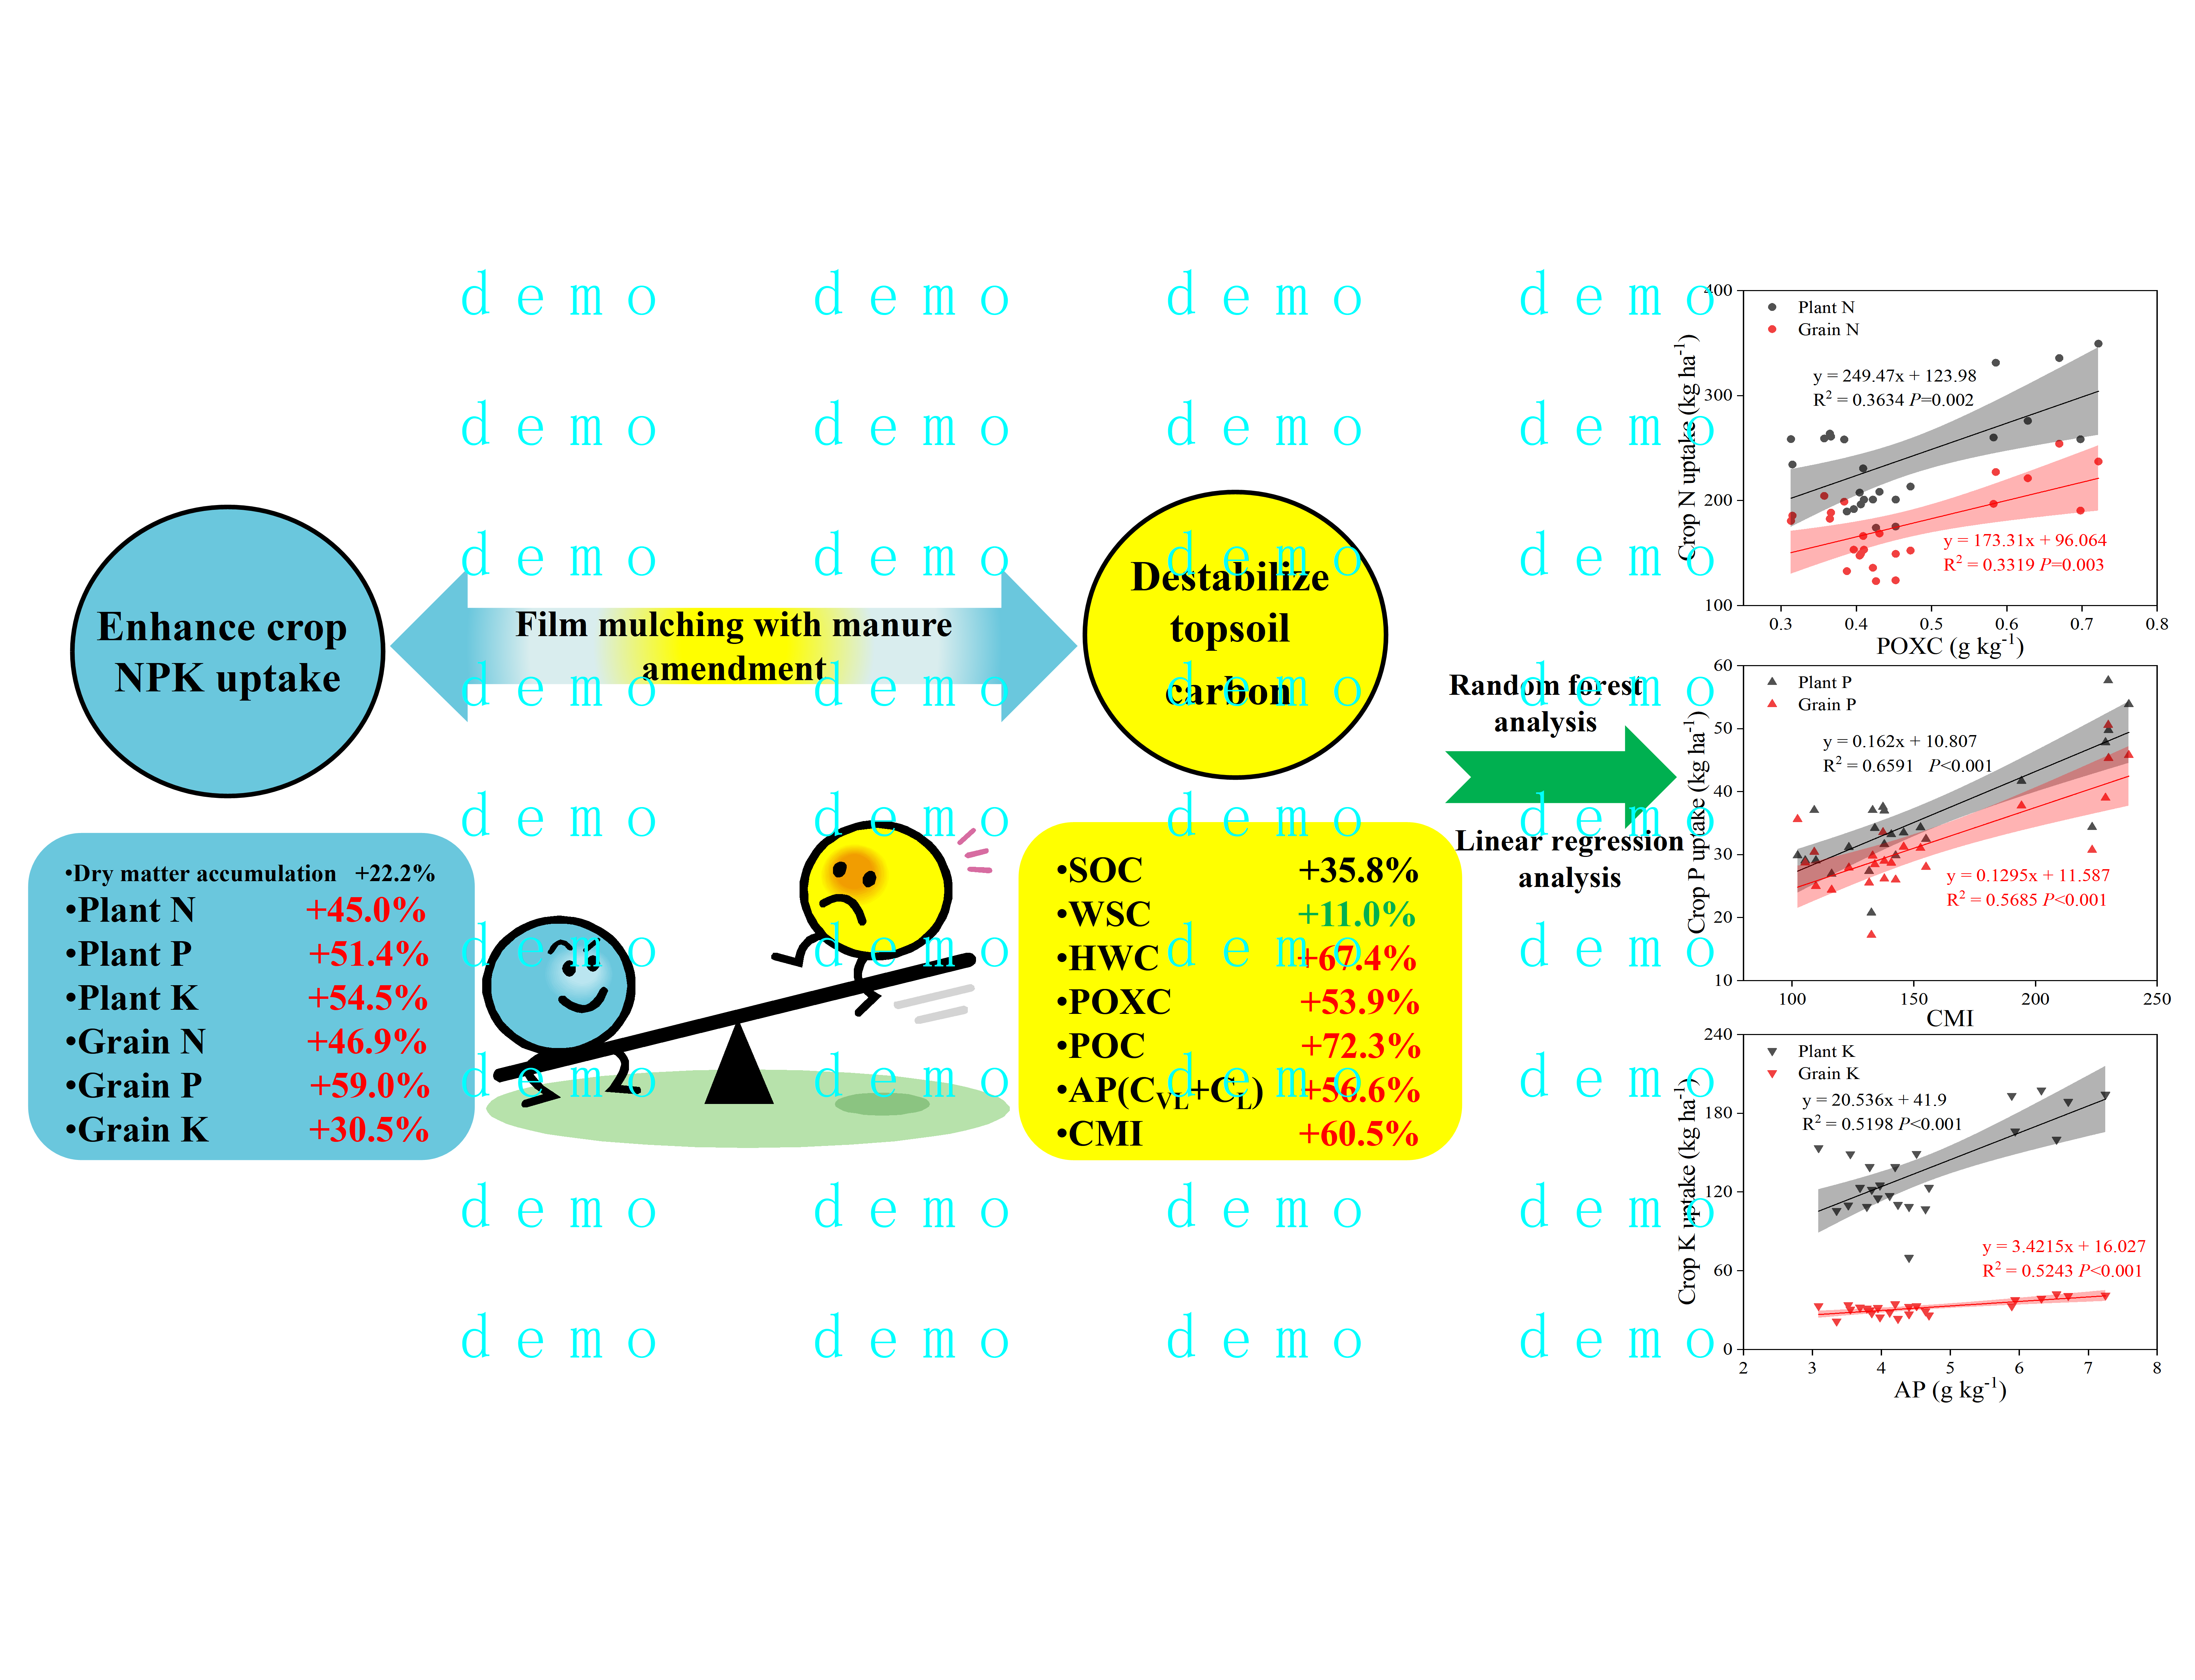
Film mulching and gravel mulching are effective methods for increasing crop yields in Northwest China but exacerbate soil organic carbon (SOC) mineralization, while manure amendment is a viable method for offsetting carbon (C) losses from mulching. SOC stability is a key factor in determining the nutrient supply capacity of soil, as it affects the C sources available to microorganisms. However, the synergistic effects of film mulching with manure amendment on SOC stability and crop nutrient uptake are still unclear. Thus, four treatments of no mulching (CK), gravel mulching (GM), film mulching (FM) and film mulching with manure amendment (FCM) were established on the Loess Plateau. The experiments investigated nitrogen (N), phosphorus (P), potassium (K) uptake in the plant and grain, SOC, labile organic C fractions (LOCFs), stability-based organic C fractions (SOCFs) and C management index (CMI) in 2019 and 2020. The results indicated that FM and FCM treatments significantly improved crop dry matter accumulation in both years compared with that of the control, and the FCM treatment significantly increased the two-year NPK average of plants to 44.9%, 50.7%, and 54.5%, and significantly increased the two-year NPK average of grain to 46.7%, 58.2%, and 30.4%. The FCM treatment significantly increased all LOCFs, namely water solution C (WSC), hot-water extractable C (HWC), permanganate oxidizable C (POXC) and particulate organic C (POC) in the topsoil (0-20 cm) in both years, and the fractions of active C pool (AP) in SOCFs, namely very labile C (CVL) and labile C (CL), were significantly increased, which suggested the FCM treatment significantly decreased the C stability of topsoil. The results of CMI confirmed this. The sensitivity index indicated that among all SOC fractions, POC (21.5-72.9%) and less labile C (CLL) (20.8-483.8%) were the most sensitive fractions of LOCFs and SOCFs compared with SOC (1.93-35.8%). The random forest analysis showed that most labile C fractions and CMI had significant contributions to crop N, P and K uptake, especially POXC to crop N uptake, CMI to crop P uptake, and AP to crop K uptake. And the quantitative relationships were determined by linear regression analysis. The study concluded the FCM treatment synergistically enhanced SOC lability, crop NPK uptake, and labile C fractions (especially POXC, AP) and CMI serve as robust indicators for guiding precision nutrient management in semi-arid croplands.
Keywords:
crop nutrient uptake
; film mulching with manure amendment
; labile organic carbon fractions
; stability-based organic carbon fractions
; soil organic carbon
1. Introduction
Maize is the most widely distributed and productive food crop globally, and it plays an important role in ensuring food security (Erenstein et al., 2022). Nitrogen (N), phosphorus (P) and potassium (K) are the three macronutrient elements necessary for maize growth (Hao et al., 2023). Optimising the supply and uptake of these elements is critical to improving crop yields. Therefore, it is imperative to enhance soil nutrient supply in order to boost the uptake of N, P and K by maize. As is well established, effective agricultural management practices, including crop rotation systems and balanced fertilisers, have a recognised role in improving soil nutrient availability (Sainju et al., 2017; Cai et al., 2019). Recent studies have demonstrated a close correlation between changes in soil organic carbon (SOC) and its fractions, as influenced by agricultural management practices, and crop nutrient uptake (Major et al., 2010; Wang et al., 2024b). SOC plays a crucial role in enhancing soil properties and supporting crop production (Tang et al., 2022), as many soil biogeochemical processes are mediated by SOC (Chen et al., 2019). Consequently, the uptake of nutrients by crops is influenced not only by agricultural practices (Li et al., 2021), but also by the content of different carbon (C) fractions (Wang et al., 2024b). Therefore, the effects of agricultural practices on soil nutrient supply and N, P and K uptake by crops may be mediated by their effects on soil C dynamics.
The Loess Plateau is a typical dry farming area in China, and limited water resources and increasing soil degradation are the main constraints to maize yield (Liu et al., 2009). Gravel mulching and plastic film mulching were the effective agricultural practices to alleviate water shortage and maintain crop yield in semi-arid region (Bu et al., 2013), but previous studies had reported that long-term mulching could lead to a decrease in SOC content in the topsoil (0-20 cm) (Li et al., 2004; Steinmetz et al., 2016; Zhang et al., 2022a; Ren et al., 2023). Manure amendment is an effective way to improve soil fertility and increase SOC content (Abdalla et al., 2022; Zhang et al., 2022b). Manure can not only provide a large amount of available carbon(C) and various nutrients, but also improve soil structure, decrease soil bulk density, improve soil porosity and water storage capacity (Jiang et al., 2018; Wang et al., 2017; Wang et al., 2022), thus being able to support higher planting densities (Zhang et al., 2022b). Studies have shown that long-term organic matter application improved SOC accumulation and N use efficiency (Chen et al., 2020; Tang et al., 2022). Therefore, it is probably that film mulching with manure amendment have an effect on soil nutrient uptake by crops by increasing SOC.
SOC varies greatly with different agricultural practices and is often positively correlated with aboveground nutrient uptake (Xie et al., 2022; Wang et al., 2024b). However, SOC is not sensitive enough to reflect changes in soil quality due to higher background levels and natural soil variability (Haynes, 2005). Labile organic C fractions (LOCFs), such as water solution C (WSC), hot-water extractable C (HWC), permanganate oxidizable C (POXC) and particulate organic C (POC) have been used as early indicators to reflect soil quality dynamic (Chaudhary et al., 2017; Bongiorno et al., 2019; Zhang et al., 2022a). LOCFs are SOC fractions that can be directly utilised by microorganisms and are often considered the primary energy source for microorganisms (Haynes, 2005). Previous studies have found that LOCFs directly affect the supply of soil nutrients to crops (Zhang et al., 2021; Wang et al., 2024b). However, it should be noted that SOC are complex, heterogeneous substances composed of multiple compounds, each with different stability levels (Deb et al., 2015). The degree of stabilisation of different SOC fractions varies due to differences in physico-chemical properties and turnover times (Chan et al., 2001). Based on these differences in stability of SOC fractions, they can be broadly categorised into active C pools and passive C pools (Chan et al., 2001). The active C pools behaved in a similar way to LOCFs, while passive C pools were altered very slowly by microbes. This suggests that the C sources available to microorganisms are also limited by the stability of SOC pools (Davidson and Janssens, 2006). Furthermore, it has been demonstrated that microorganisms can also mediate the conversion of passive C pools into active C pools (Liang et al., 2017; Zhang et al., 2024). Different agricultural practices impact various soil properties, which are essential for the sustainability of cropping systems (Jat et al., 2019; Zhang et al., 2024). Based on the above two classifications, LOCFs together with CVL, CL, and AP are refered to labile C fractions. The changes in soil quality induced by agricultural practices can be more accurately and sensitively indicated by the C pool management index (CMI) (Blair et al., 1995). It can be used as an indicator of soil C lability and availability, and is often used to assess the relative potential of different agricultural practices to affect SOC pools (Chaudhary et al., 2017). However, few studies have focused on the effects of the stability of SOC fractions on soil nutrient supply and crop nutrient uptake under different agricultural practices in semi-arid areas, particularly film mulching with manure amendment. Microorganisms play a crucial role in the soil-plant nutrient cycle (Liu et al., 2021), and their enzyme activity has been demonstrated to correlate with the SOC fractions (Li et al., 2016; Jat et al., 2019). It is obviously related to the fact that the C sources available to microorganisms are also limited by the stability of SOC fractions. Therefore, a hypothesis was proposed in the present study that film mulching with manure amendment stimulated maize NPK uptake by accelerating labile C fractions driven nutrient mineralization.
A field experiment was conducted from 2009 to understand how mulching practices and manure amendment interact with soil organic matter (SOC) fractions and crop nutrient uptake (NPK) in semi-arid regions. The experiment was designed to test our hypothesis and provide valuable insights into these interactions. The specific objectives of the study were to (1) determine the effect of mulching practices and manure amendment on above-ground dry matter accumulation, crop NPK uptake and SOC pool; (2) indentify the effect of mulching practices and manure amendment on the stability of various SOC fractions, and the contribution of SOC fractions to crop NPK uptake; (3) quantify the effect of labile C fractions on NPK uptake in spring maize, with a view to establish their potential application in crop nutrient uptake.
2. Materials and Methods
2.1. Experimental Site
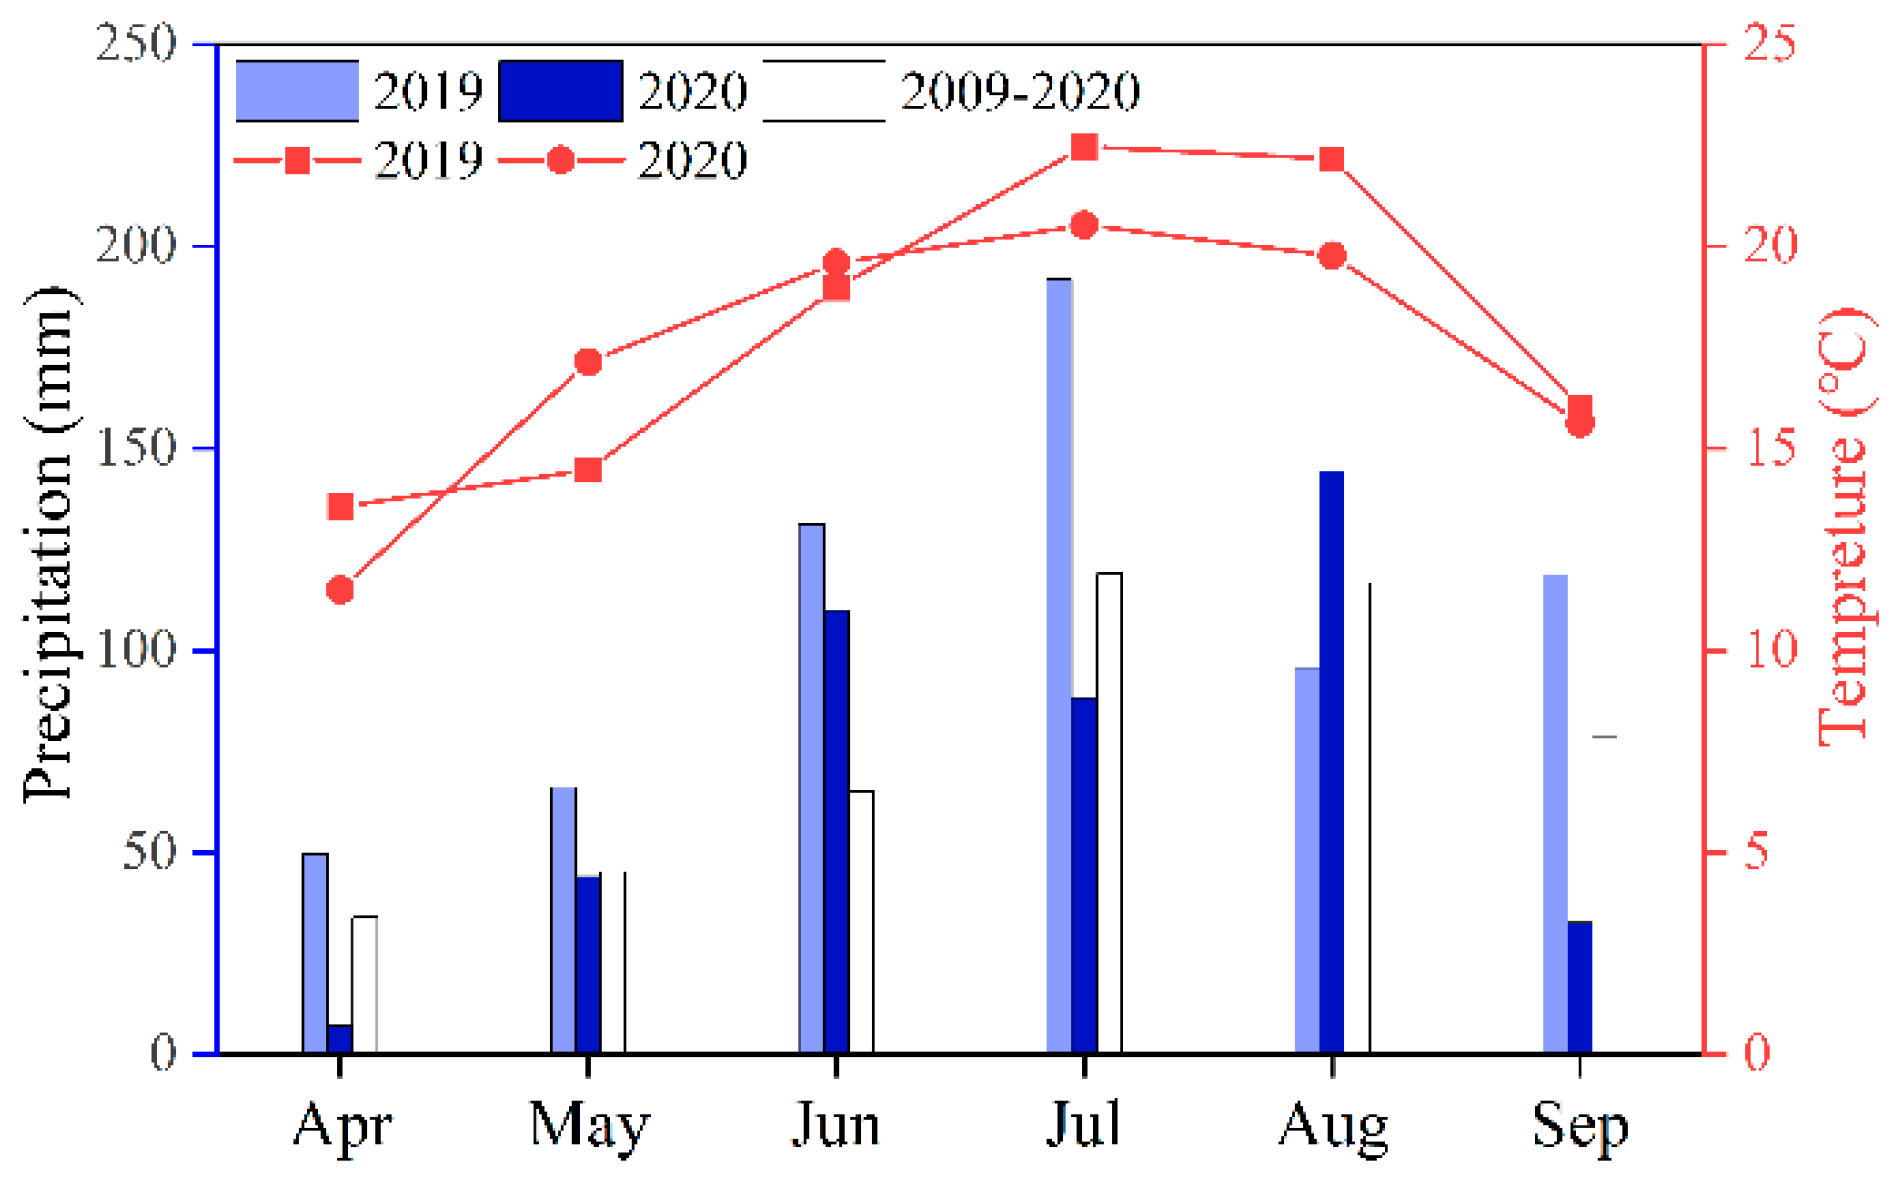
The field experiment was established at the Changwu Agro-ecological Experimental Station (35.28◦N, 107.88◦E; 1200 m a.s.l) on the Loess Plateau since 2009. The area has a semiarid monsoon climate with a mean annual air temperature of 9.2 ℃ and average annual precipitation of 582 mm (with about 73% received between May and September), while the average annual free evaporation is 1564.5 mm. The water table of groundwater is as deep as 60 m, making it unavailable for plants. The soil was classified as Cumuli-Ustic Isohumosols of the U.S. Department of Agriculture (USDA) classification system. The average monthly temperature and precipitation during the spring maize growth season in 2019 and 2020 and the average monthly precipitation from 2009 to 2020 shown in Fig 1. At the beginning of the experiment in 2009, the soil had the following initial properties in the 0-20 cm soil layer (Luo et al., 2015): bulk density (BD) 1.3 g cm-3, pH 8.4, SOC 8.2 g kg-1, total N 1.05 g kg-1, available P 20.7 mg kg-1, available K 133.1 mg kg-1, and mineral N 28.8 mg kg-1.
Figure 1.
The average monthly temperature and average monthly precipitation during maize growing season in 2019, 2020 and the 12-year average at the experiment site.
Figure 1.
The average monthly temperature and average monthly precipitation during maize growing season in 2019, 2020 and the 12-year average at the experiment site.
2.2. Experimental Design
The field experiment of this study was conducted in 2019 and 2020. The experiment was established four treatments with three replicates in a randomized completed block design, including no mulching + NPK fertilization (CK), gravel mulching + NPK fertilization (GM), film mulching + NPK fertilization (FM) and film mulching + NPK fertilization + cow manure (FCM). The size of each plot was 56 m2 (7 × 8 m), and all plots had alternating wide and narrow row spacing of 60 cm and 40 cm. The GM treatment was covered with gravel 2-4 cm in diameter and about 5 cm thick at the joint. The FM and FCM treatments were mulched with plastic film all the year round, and re-mulched before sowing in the second year. The N fertilizer (urea, 46% N) was applied at a rate of 225 kg ha−1 in three times: 40% before sowing, 30% at the 10-leaves stage, and 30% at the silking stage. All plots received 40 kg P ha−1 as calcium superphosphate (12% P2O5) and 80 kg K ha−1 as potassium sulfate (45% K2O) before sowing. The manure (cow dung) applied at a rate of 30 t ha−1 with an average content of 12.0 g N kg−1, 2.0 g P kg−1 and 1.5 g K kg−1 on a dry weight basis (Zhang et al., 2024). The manure added mineral N, available P, available K for 25, 4 and 3 kg ha−1, respectively (Zhu et al., 2018). The P and K fertilisers and manure were applied before sowing as basal fertilizers. The topdressing fertilizer was applied using a hole-sowing machine. The maize (Zea mays L.) of Pioneer 335 was sown in late April and harvested in late September each year, and all straws were completely removed after harvest. The water in the field was only precipitation.
2.3. Plant Sampling and Determination
Three maize plants were randomly selected in each plot at harvest and separated according to different plant organs (including leaves, stem, sheath, cob, and grain), then dried at 105℃ for 30 min, and then dried at 75℃ to a constant weight to obtain aboveground biomass. The dried plant samples were crushed and digested for determination of NPK concentrations, respectively. The N concentration was determined by the Kjeldahl method, the P concentration by the molybdenum-antimony colourimetric method, and the K concentration by the flame spectrophotometric method (Bao, 2000).
2.4. Soil Sampling and Analysis
2.4.1. Soil Sampling
Three soil samples were collected after the maize harvest with an auger in the 0-20, 20-40 and 40-60 cm soil layers, respectively. A composite sample was taken by mixing the three samples from the same soil layer in each plot. The fresh soil was immediately divided into two sub-samples after passing through a 2-mm sieve. One subsample was refrigerated (4 ℃), and the other subsample was air dried for further analysis.
2.4.2. LOCFs Determination
WSC and HWC were determined using the method described by Ghani et al. (2003). POXC was determined according to the method of Weil et al. (2003). The POC were determined according to the method of Zhang et al. (2024).
2.4.3. Stability-Based Organic Carbon Fractions (SOCFs) and CMI
SOC was determined using the wet oxidation method (Walkley and Black, 1934). The fractions at varying degrees of oxidation were estimated by the modified Walkley and Black method using 5, 10 and 20 mL of concentrated H2SO4 (which corresponded respectively to 6, 9 and 12 mol L-1 of H2SO4). The fractions were very labile C (CVL), labile C (CL), less labile C (CLL) and non-labile C (CNL). CVL and CL together constituted the active C pool (AP), and CLL and CNL together constituted the passive C pool (PP) (Chan et al., 2001).
According to the stability of different fractions, CVL, CL, and CLL were given weights of 3, 2, and 1, respectively. Then lability index (LI) was calculated using the following equation (Majumder et al., 2007).
The C pool index (CPI) and CMI were calculated using the following equations, taking the soil in the different soil layers of the control as the reference (Blair et al., 1995):
2.4.4. Sensitivity Index (SI)
The sensitivity index (SI, %) of SOC fractions was calculated according to the formula described by (Zhang et al., 2022a).
For multi-year results, the higher the mean value of SI, the more sensitive the SI; the smaller the variation coefficient (CV), the more stable the SI.
2.5. Statistical Analysis
The analysis of variance and Pearson’s correlation analysis were conducted using IBM SPSS Statistics 25.0 (IBM Corporation, Armonk, USA). The normality of the data distribution was determined by the Shapiro-Wilk method, and the homogeneity of variance was determined by the one-way analysis of variance (ANOVA). Multiple comparisons of mean values among treatments were performed using the least significant difference (LSD) at P < 0.05. Pearson correlation analysis between crop NPK uptake and SOC fractions and CMI was performed at 0.05 and 0.01 probability level. Random forest analysis was determined using the R package “randomForest”. The Origin 2021 (OriginLab, USA) was used to draw figures.
3. Results
3.1. Crop NPK Uptake
After ten years of long-term mulching and manure amendment, significant differences in crop dry matter accumulation and NPK uptake (Table 1). Compared with the control, both FM and FCM treatments significantly improved crop dry matter accumulation over two years, but GM treatment decreased dry matter accumulation. In comparison with the control, the two-year means of the plant NPK of the FCM treatment were found to be significantly higher at 44.9%, 50.7%, and 54.5%, respectively. Similarly, the grain NPK of the FCM treatment were found to be significantly higher at 46.7%, 58.2%, and 30.4%, respectively. The results demonstrated that FCM treatment led to a significant increase in aboveground biomass and NPK in the plant and grain in both years.
3.2. SOC
The effects of long-term mulching and manure amendment on SOC at different soil depths were shown in Figure 2. In the 0-20 cm soil layer, the SOC in the GM and FM treatments showed a decreasing trend compared to the control, while FCM significantly increased the SOC in both years.In the 20-40 cm soil layer, only the FCM treatment significantly increased SOC in 2020 compared to the control. In the 40-60 cm soil layer, there was no significant difference in SOC among the treatments. The linear regression analysis of NPK in both plant and grain with SOC content in both years demonstrated a highly significant positive correlation between SOC content and both plant NPK and grain NPK (Figure 3). The results demonstrated that the FCM treatment increased SOC in the 0-40 cm soil layers, particularly in the topsoil, reaching significant levels, and SOC content was significantly correlated with NPK in both plant and grain.
3.3. LOCFs
The results of long-term mulching and manure amendment affected the LOCFs at different soil depths in 2019 and 2020 were shown in Figure 4. Compared to the control, both GM and FM treatments decreased WSC in the topsoil in both years, but the FCM treatment significantly increased WSC in the topsoil in both years when compared with the FM treatment. The HWC increased significantly in the topsoil in the FCM treatment in both years, as compared to the control, while there was no significant change in the other soil layers. Compared to the control, POXC was decreased by the FM treatment and significantly increased by the FCM treatment in the topsoil in both years, while there was no significant difference in POXC between treatments in the other soil layers. The variation trends of POXC and POC were basically the same among treatments. Compared to the control, GM and FM treatments significantly decreased the POC in the topsoil in 2019, while the FCM treatment significantly increased the POC in both years. The variation trends of POC in the 20-40 and 40-60 cm soil layers were consistent with those of the topsoil. The results suggested that the FM treatment decreased the WSC and POXC, and the FCM treatment resulted in a significant increase in all of the LOCFs in the topsoil.
3.4. SOCFs and CMI
The long-term mulching and manure amendment affected SOCFs at different soil depths in 2019 and 2020 (Table 2). In the 0-20 cm soil layer, compared to the CK, the FCM treatment significantly increased CVL in both years, while the FM treatment decreased CVL, reaching significant levels especially in 2020. Compared to the CK, the FCM treatment increased CL and CLL in both years, but the FM treatment significantly decreased CLL in both years. In comparison with the CK, the FM and FCM treatments increased the CNL in both years, especially to significant levels in 2020. Compared to the CK, the CAP increased significantly in the topsoil in the FCM treatment in both years, whereas CPP showed no significant difference..Overall, compared to the control, the FM treatment decreased the AP, and the FCM treatment increased significantly the AP in the topsoil. It suggested the FM treatment impoved the SOC stability, and the FCM treatment decreased the SOC stability.
The above results on the SOC stability were well confirmed by the CMI (Table S1). In contrast to the CK, the GM and FM treatments decreased the LI and CPI, while the FCM treatment significantly increased the LI and CPI in the topsoil in both years. The FCM treatment significantly increased the LI only in 2020 and was not significant for the CPI in the subsoil. Compared to the control, the FM treatment decreased the CMI in the topsoil in both years and reached a significant level in 2020, while the FCM treatment significantly increased the CMI in both years. The variation trend of the CMI in the subsoil of all treatments was basically the same as that of the topsoil. The CMI in the 0-20 and 20-40 cm soil layers among the treatments showed a trend of FCM > CK > GM > FM. Overall, in the topsoil, the FM treatment decreased the CMI, while the FCM treatment significantly increased the CMI in both years.
3.5. SI
The two-year SI of all SOC fractions under long-term mulching and manure amendment in the topsoil were shown in Table 3. The average SI of HWC (30.0%), POXC (24.6%) and POC (40.6%) were higher than that of SOC (15.2%). The same was true for CVL (40.3%), CL (19.9%), CLL (181.7%) and AP (23.0%), which were higher than SOC. POC and CLL were highly sensitive to all treatments, and the SI occurred in the order: FCM > FM > GM, whereas the SI to the FCM treatment followed the order: CLL > CVL > POC > HWC > POXC >AP. Overall, the CLL and POC were most sensitive to the long-term mulching and manure amendment on the Loess Plateau.
3.6. Relationships Between Crop NPK and SOC Parameters
SOC, various organic C fractions (HWC, POXC, POC, CVL, AP, etc) and CMI showed significant correlations with crop NPK uptake under different treatments (Table 4). The correlation between WSC and crop NPK uptake was not significant, nor was the stable organic C fraction (CNL). Significant positive correlations were identified between SOC and its fractions (Table S2). SOC had the strongest correlation with POXC and POC, with a value of 0.929. Among SOC fractions, the strongest correlation was observed between POXC and AP (r = 0.916), followed by POXC and POC (r = 0.877).
The effects of SOC fractions and CMI on crop NPK uptake were analysed using the Random Forest method to quantitatively evaluate the relative contributions of each SOC fraction and CMI to crop NPK uptake (Figure 6).The largest contributor to both plant N and grain N was POXC (P<0.01), and the largest contributor to both plant P and grain P was CMI (P<0.01). The top three contributors to plant K were CMI (P<0.05), HWC (P<0.01), and AP (P<0.01), and the top three contributors to grain K were CVL (P<0.01), AP (P<0.01), and POXC (P<0.05). It was evident that AP (P<0.01) contributed significantly to both plant and grain K, reaching a highly significant level. It can be concluded that film mulching combined with manure amendment can improve crop NPK uptake by increasing the labile C fractions’ contents and CMI. Among them, POXC has the highest contribution to crop N, CMI has the highest contribution to crop P, and AP has a higher contribution and significance to crop K. Overall, most labile C fractions (POXC, HWC, POC, etc.) and CMI had significant effects on crop NPK uptake.
4. Discussion
4.1. The Effects of Long-Term Mulching and Manure Amendment on Crop NPK Uptake and SOC Content
Mulching and fertilization practices are closely related to maize nutrients uptake, translocation and partitioning (Liu et al., 2017; Li et al., 2021). The results of this study indicated that plant and grain N uptake were significantly higher in the FM treatment in both years, and NPK uptake in the plant and grain were significantly higher in the FCM treatment. The main reason is that film mulching can significantly improve the N utilization efficiency (Liu et al., 2017), while manure amendment to improve soil fertility can provide sufficient soil NPK for maize growth (Cai et al., 2019). The significant improvement of crop nutrient uptake by manure amendment can be attributed to several factors. Firstly, the amendment mitigates the competition between soil microbes and crop nutrient for N, thereby reducing nutrient loss through regulated soil stoichiometry (Yan et al., 2023); secondly, manure amendment has been shown to increase soil active organic N, and the increase of SOC can increase soil microbial biomass, which in turn increases soil microbial N sequestration capacity, thus reducing N loss (Tang et al., 2022); thirdly, manure amendment resulted in well-structured soil aggregates, contributing to increase availabilities of soil nutrients (Zhang et al., 2021). The results indicated that the FM treatment only had significant effects on crop N uptake, while the FCM treatment had significant effects on crop NPK uptake. This suggested that film mulching with manure amendment significantly improved the NPK uptake of the crops by improving soil fertility.
SOC content is a key indicator of soil fertility, with a direct impact on crop growth (Cai et al., 2019). The present study demonstrated that the initial SOC of the experiment was 8.20 g kg-1 in 2009, and 12 years of FCM treatment significantly increased SOC content by 11.61 g kg-1 in the topsoil. It was clearly due to the fact that manure itself can input large amounts of organic C and can also contribute to increased C input from the crop root (Zhang et al., 2020). Based on the regression analysis of crop NPK uptake and SOC content, it was found that the increase of SOC content was significantly correlated with crop NPK uptake, which was consistent with the results of previous research (Tang et al., 2022; Wang et al., 2024b). Manure amendment can significantly improve the physical and chemical properties of the soil and promote the transformation of soil nutrients by enhancing the C metabolism activity of soil microorganisms, which in turn improves the nutrient supply capacity of the soil and promotes nutrient uptake by crops (Tang et al., 2022; Zhang et al., 2022b). Therefore, SOC was closely related to crop NPK uptake, and manure amendment can significantly improve crop NPK uptake.
4.2. The Effects of Long-Term Mulching and Manure Amendment on SOC Fractions
4.2.1. The Effects of Long-Term Mulching and Manure Amendment on LOCFs
The dynamics of WSC and HWC exhibited distinct patterns across soil profiles (Figure 4). Both labile fractions demonstrated rapid turnover rates and collectively accounted for less than 5% of SOC (Bongiorno et al., 2019), consistent with their roles as microbial energy substrates. The observed divergence in vertical distribution patterns between WSC and HWC likely stems from their differential microbial associations: While WSC primarily serves as immediate microbial substrate (Li et al., 2022), HWC better reflects microbial biomass (Ghani et al., 2003). Notably, both GM and FM treatments reduced WSC in the topsoil while enhanced HWC compared to control. It could be attributed to improved hydrothermal conditions under mulching (Bu et al., 2013), which may stimulate microbial growth and the enzyme activity with accelerating WSC utilization (Li et al., 2004). POXC demonstrated particular sensitivity to management practices as evidenced by its strong correlations with both SOC (r = 0.930, P < 0.01) (Table S1). It was consistent with previous findings identifying POXC as the most oxidation-sensitive SOC fraction (Weil et al., 2003) and a robust indicator of labile C dynamics (Culman et al., 2012). The differential responses of POXC in the topsoil to mulch type, significant reduction under FM treatment versus non-significant reduction under GM treatment, may reflect the superior temperature and moisture elevating capacity of film mulch (Bu et al., 2013), potentially increasing oxidative losses of LOCFs. Contrary to expectations, POC showed significant depletion under mulching treatment, although mulching may have increased root input (Zhang et al., 2020). As POC originates from particulate plant/microbial residues (Bai et al., 2022), its decline suggests accelerated microbial mineralization outpaced fresh input accumulation. This observation supports the emerging concept of POC serving as a preferential microbial energy reservoir in disturbed systems (Witzgall et al., 2021). The apparent decoupling between POC dynamics and below-ground root inputs may be due to the fact that roots are inherently more resistant to microbial attack, combined with the long and cold winters of the region, and therefore more difficult to exploit to the extent that they are removed from the soil when ploughed the following year. The FCM treatment uniquely enhanced all SOC fractions relative to control, establishing its superiority over single management practice. This synergistic effect likely arises from dual mechanisms: (1) direct input of manure-derived labile organic compounds (Chaudhary et al., 2017) and (2) gradual transformation of low-stable SOC into various LOCFs (Zhang et al., 2024). Our findings suggested that strategic integration of manure amendment with film mulching can effectively counteract the labile C depletion associated with film mulching.
4.2.2. The Effects of Long-Term Mulching and Manure Amendment on SOCFs and CMI
The modified Walkley-Black method revealed differential responses of SOC stability pools to management practices (Table 2). The FM treatment decreased chemically vulnerable labile C (CVL) by 13.6% in the topsoil relative to the control, consistent with enhanced decomposition rates under improved hydrothermal conditions (Li et al., 2004). This accelerated CVL depletion is consistent with its role as microbial 'fast food' during early stages of decomposition (Cotrufo et al., 2015), which was particularly pronounced under the intensive organic matter mineralisation of FM. The cellulose-like fraction (CL) maintained relatively stable proportions (16.7-27.5% of SOC) across treatments (Table 3, Fig S2), supporting its characterization as intermediate-stability C (Zhang et al., 2024). In contrast, chemically resistant lignin-derived C (CLL) showed significant depletion (-5.6- -11.7%) under FM treatment, likely reflecting preferential degradation of aromatic compounds requiring high activation energy (Hammel, 1997). The observed CLL-CVL flux (ΔCLL = -0.77 g kg-1 vs ΔCVL = +0.44 g kg-1) in the topsoil suggested active microbial funnelling of recalcitrant compounds into labile pools under FM treatment (Davidson & Janssens, 2006), although this conversion efficiency requires isotopic further verification. The FCM treatment increased both CLL and CNL by 49.1% and 14.7% in the topsoil, attributed to lignin-polyphenol inputs from manure (Tian et al., 1992) and microbial necromass and extracellular metabolites (Liang et al., 2017). The superior SOC sequestration capacity of FCM compared to conventional mulching is explained by this dual enhancement mechanism. The turnover of SOC fractions was a key process for releasing nutrients that can affect crop growth (Zhang et al., 2024). The FCM treatment significantly increased the AP content but not the PP content in the topsoil, probably because the AP content was higher than the PP content in the manure itself, suggesting that the manure application reduced SOC stability to some extent. This result was inconsistent with the findings of Shao et al. (2024), possibly due to more active microbial activity in the rhizosphere soil. In our study, the FCM treatment significantly increased the overall ratio of CVL, CL and CLL, and decreased the stability of SOC, which also led to an increase in greenhouse gas emissions to a certain extent as reported by our team previously (Nan et al., 2020; Gao et al., 2023).
The CMI dynamics provided critical insights into system sustainability (Wang et al., 2024a). The CMI reduction under GM and FM treatments signaled accelerated C cycling in excess of input rates, potentially reflecting long-term fertility mining. Conversely, FCM significantly increased CMI by 60.8% in the topsoil, demonstrating the dual role of manure in replenishing labile pools while building stabilised C (Chaudhary et al., 2017). The divergence from Yang et al. (2024) may be due to differences in baseline SOC and regional precipitation gradients (450 mm vs 582 mm annual) modulating decomposition-input balances (Wang et al., 2016). Overall, there was a significant decrease in SOC stability in the FCM treatment compared to the FM treatment.
4.3. Relationships Between Crop NPK Uptake and SOC Parameters
As reported by Wang et al. (2024b), the study revealed a significant correlation between LOCFs (except WSC), CVL, AP, CMI and NPK uptake in plants and grain. It was confirmed that the SI of POC, CVL and AP to the FCM treatment was consistent with that of SOC. This result was consistent with previous studies that WSC and CL were not correlated with SOC (Jat et al., 2019; Ma et al., 2021). The reason for this was probably that WSC and CL were more easily decomposed by microorganisms and had a much lower proportion when accounting for SOC (Zhang et al., 2024). A meta-analysis also showed that the addition of organic matter continuously increased SOC composition and promoted microbial diversity, and dissolved organic C (DOC) (similar to WSC in this study) and microbial biomass C (MBC) (similar to HWC in this study) increased with the increase of organic matter addition, but the two were negatively correlated (Chen et al., 2024). It suggested that the increase in soil microbial abundance and enzyme activity may promote the increase in the labile C fractions with relatively faster turnover rates, introduced into the soil with the addition of manure.
Manure application directly increased C inputs and indirectly improved soil aggregate stability (Chen et al., 2020), which promoted nutrients uptake by crops (Tang et al., 2022; Yan et al., 2023). In this study, the results showed that SOC and its fractions were significantly higher in the FCM treatment than in the other treatments, which was similar to the variation of crop NPK uptake among treatments. The results had demonstrated that there were significant correlations between SOC parameters and NPK uptake in plant and grain (Table 4), which was similar to the results of Tang et al. (2022). Thus, we deduced that the N, P and K uptake in the plant and grain mainly contributed by the labile SOC fractions in the study. The random forest analysis showed that POXC contributed the most to crop nitrogen uptake, CMI contributed the most to crop P uptake, and AP contributed significantly to crop K uptake (Fig 5). To further investigate the relationships between POXC and crop N, CMI and crop P, AP and crop K, linear regression analysis was used to clarify the quantitative relationships (Figure 6). The R2 values of the linear regressions of the CMI on the plant P (R2 = 0.6591, P<0.001) and grain N (R2 = 0.5685, P<0.001) were the highest; followed by the AP on the plant P (R2 = 0.5198, P<0.001) and grain N (R2 = 0.5243, P<0.001); and then the POXC on the plant N (R2 = 0.3634, P=0.002) and grain N (R2 = 0.3319, P=0.003). Therefore, CMI was found to be the most effective predictor of crop P uptake, followed by AP for crop K uptake and then POXC for crop N uptake.
5. Conclusions
A 12 consecutive year spring maize field experiment revealed that both FM and FCM treatments significantly increased above-ground dry matter accumulation, while FCM treatment significantly increased NPK uptake in the plant and grain. Both GM and FM treatments decreased SOC and most labile C fractions in the topsoil, while FCM treatment significantly increased SOC and all labile C fractions, and resulted in a great improvement in CMI, which suggested the FCM treatment significantly decreased the SOC stability in the topsoil. The results of sensitivity index indicate that POC and CLL can be used as early indicators of the potential effects of mulching measures on SOC dynamics in the short term. SOC and most labile C fractions have positive effects on crop NPK uptake, among which CMI has the highest relative contribution to crop P uptake, AP has the highest relative contribution to crop K uptake, and POXC has the high relative contribution to crop N uptake. The results concluded that film mulching with manure amendment is a key technology for improving soil fertility and promoting NPK uptake in crops, and labile C fractions (such as POXC and AP) and CMI were effective predictors of crop nutrient uptake.
Author Contributions
Fangfang Zhang: Writing - original manuscript, Investigation. Kai Liu: Data curation. Qilong Song: Investigation. Linjuan Wang: Formal analysis. Renshan LI: Formal analysis. Kongyang Wu: Formal analysis. Jianming Han: Resources, Supervision, Writing - review & editing. Shiqing Li: Conceptualization, Resources, Supervision.
Acknowledgments
We appreciate the financial support of the National Key R&D Program of China (No.: 2021YFD1900700), the National Natural Science Foundation of China (No.: 42077102), Henan Province Science and Technology Breakthrough Project (No.: 232102110046, 242102320148), Key Research Projects of High Education Institutions in Henan Province (No.: 24A210019), and the core technology research category of the public welfare special of Luoyang (No.: 2302036A).
Declarations
The authors declare that they have no competing interests.
References
- Abdalla, K., Sun, Y., Zarebanadkouki, M., Gaiser, T., Seidel, S., Pausch, J., 2022. Long-term continuous farmyard manure application increases soil carbon when combined with mineral fertilizers due to lower priming effects. Geoderma, 428, 116216. [CrossRef]
- Bai, Y., Cotrufo, M.F., 2022. Grassland soil carbon sequestration; Current understanding, challenges, and solutions. Science(377), 603-608. [CrossRef]
- Bao, S.D., 2000. Soil Agrochemical Analysis (3rd Edition). Beijing: China Agriculture Press.
- Blair, G.J., Lefroy, R.D.B., Lise, L., 1995. Soil carbon fractions based on their degree of oxidation, and the development of a carbon management index for agricultural systems. Aust. J. Agric. Res. 46, 1459-1466. [CrossRef]
- Bongiorno, G., Bünemann, E. K., Oguejiofor, C. U., Meier, J., Gort, G., Comans, R., Mäder, P., Brussaard, L..,de Goede, R., 2019. Sensitivity of labile carbon fractions to tillage and organic matter management and their potential as comprehensive soil quality indicators across pedoclimatic conditions in Europe. Ecol. Indic. 99, 38-50. [CrossRef]
- Bu, L., Liu, J., Zhu, L., Luo, S., Chen, X., Li, S., Lee Hill, R., Zhao, Y., 2013. The effects of mulching on maize growth, yield and water use in a semi-arid region. Agric. Water Manag. 123, 71-78. [CrossRef]
- Cai, A., Xu, M., Wang, B., Zhang, W., Liang, G., Hou, E., Luo, Y., 2019. Manure acts as a better fertilizer for increasing crop yields than synthetic fertilizer does by improving soil fertility. Soil Tillage Res. 189, 168-175. [CrossRef]
- Chan, K.Y., Bowman, A., Oates, A., 2001. Oxidizible organic carbon fractions and soil quality changes in an Oxic Paleustalf under different pasture leys. Soil Sci. 166, 61–67. [CrossRef]
- Chaudhary, S., Dheri,, G.S., Brar, B.S., 2017. Long-term effects of NPK fertilizers and organic manures on carbon stability and management index under rice-wheat cropping system. Soil Tillage Res. 166, 59-66. [CrossRef]
- Chen, L., Liu, L., Qin, S., Yang, G., Fang, K., Zhu, B., Kuzyakov, Y., Chen, P., Xu, Y., Yang, Y., 2019. Regulation of priming effect by soil organic matter stability over a broad geographic scale. Nat. Commun. 10, 5112. [CrossRef]
- Chen, L., Zhou, S., Zhang, Q., Zou, M., Yin, Q., Qiu, Y.,Qin, W. (2024). Effect of organic material addition on active soil organic carbon and microbial diversity: A meta-analysis. Soil Tillage Res. 241. 106128. [CrossRef]
- Chen, S., Zhang, X., Shao, L., Sun, H., Niu, J., Liu, X., 2020. Effects of straw and manure management on soil and crop performance in North China Plain. Catena 187, 104359. [CrossRef]
- Culman, S.W., Snapp, S.S., Freeman, M.A., Schipanski, M.E., Beniston, J., Lal, R., Drinkwater, L. E., Franzluebbers, A.J., Glover, J.D., Grandy, A.S., Lee, J., Six, J., Maul, J.E., Mirksy, S.B., Spargo, J.T., Wander, M.M., 2012. Permanganate oxidizable carbon reflects a processed soil fraction that is sensitive to management. Soil Sci. Soc. Am. J. 76(2), 494-504. [CrossRef]
- Davidson, E.A., Janssens, I.A., 2006. Temperature sensitivity of soil carbon decomposition and feedbacks to climate change. Nature, 440(7081), 165-173. [CrossRef]
- Deb, S., Bhadoria, P.B.S., Mandal, B., Rakshit, A., Singh, H.B., 2015. Soil organic carbon: Towards better soil health, productivity and climate change mitigation. Clim. Change Environ. Sust. 3, 26. [CrossRef]
- Erenstein, O., Jaleta, M., Sonder, K., Mottaleb, K., Prasanna, B.M., 2022. Global maize production, consumption and trade: trends and R&D implications. Food Security, 14(5): 1295-1319. [CrossRef]
- Gao, N., Zhang, F., Bo, Q., Tang, A., Gao, J., Wei, X., Yue, S., Shen, Y., Li, S. 2023. Microbial and isotopomer analysis of N2O production pathways in a calcareous film-mulched farmland. Biol Fert Soils. 59(4), 407-422. [CrossRef]
- Ghani, A., Dexter, M., Perrott, K.W., 2003. Hot-water extractable carbon in soils: a sensitive measurement for determining impacts of fertilisation, grazing and cultivation. Soil Biol. Biochem. 35, 1231-1243. [CrossRef]
- Ghosh, A., Bhattacharyya, R., Meena, M.C., Dwivedi, B.S., Singh, G., Agnihotri, R., Sharma, A., 2018. Long-term fertilization effects on soil organic carbon sequestration in an Inceptisol. Soil Tillage Res. 177, 134-144. [CrossRef]
- Hao, D., Li, X., Kong, W., Chen, R., Liu, J., Guo, H..,Zhou, J., 2023. Phosphorylation regulation of nitrogen, phosphorus, and potassium uptake systems in plants. Crop J. 11(4), 1034-1047. [CrossRef]
- Haynes, R.J. 2005. Labile organic matter fractions as central components of the quality of agricultural soils: An overview, in: Sparks, D.L. (Ed.). Adv. Agron. 85, 221–268. [CrossRef]
- Jat, H.S., Datta, A., Choudhary, M., Sharma, P.C., Yadav, A.K., Choudhary, V., Gathala, M.K., Jat, M.L., McDonald, A., 2019. Climate Smart Agriculture practices improve soil organic carbon pools, biological properties and crop productivity in cereal-based systems of North-West India. Catena, 181. [CrossRef]
- Jiang, H., Han, X., Zou, W., Hao, X., Zhang, B., 2018. Seasonal and long-term changes in soil physical properties and organic carbon fractions as affected by manure application rates in the Mollisol region of Northeast China. Agric. Ecosyst. Environ. 268, 133-143. [CrossRef]
- Li, F., Song, Q., Hao, J., Jemba, P., Shi, Y., 2004. Dynamics of soil microbial biomass C and soil fertility in cropland mulched with plastic film in a semiarid agroecosystem. Soil Biol. Biochem. 36, 1893-1902. [CrossRef]
- Li, G.H., Cheng, Q., Li, L., Lu, D.L., Lu, W.P., 2021. N, P and K use efficiency and maize yield responses to fertilization modes and densities. J. Integr. Agr. 20(1), 78-86. [CrossRef]
- Li, S., Zhang, S., Pu, Y., Li, T., Xu, X., Jia, Y., Deng, O.,Gong, G. 2016. Dynamics of soil labile organic carbon fractions and C-cycle enzyme activities under straw mulch in Chengdu Plain. Soil Tillage Res. 155, 289-297. [CrossRef]
- Li Ye, Zengming Chen, Ji Chen, Michael J. Castellano, Chenglong Ye, Nan Zhang, Yuncai Miao, Huijie Zheng, Junjie Li, and Weixin Ding. 2022. Oxygen availability regulates the quality of soil dissolved organic matter by mediating microbial metabolism and iron oxidation. Global Change Biol. 28: 7410-27. [CrossRef]
- Liang, C., Schimel, J.P., Jastrow, J.D., 2017. The importance of anabolism in microbial control over soil carbon storage. Nat. Microbiol. 2, 17105. [CrossRef]
- Liu, C.A., Jin, S.L., Zhou, L.M., Jia, Y., Li, F.M., Xiong, Y.C., Li, X.G. 2009. Effects of plastic film mulch and tillage on maize productivity and soil parameters. Eur. J. Agron. 31, 241–249. [CrossRef]
- Liu, J., Li, S., Yue, S., Tian, J., Chen, H., Jiang, H., Siddique, K. H. M., Zhan, A., Fang, Q., Yu, Q., 2021. Soil microbial community and network changes after long-term use of plastic mulch and nitrogen fertilization on semiarid farmland. Geoderma, 396. [CrossRef]
- Liu, Z., Chen, Z., Ma, P., Meng, Y., Zhou, J., 2017. Effects of tillage, mulching and N management on yield, water productivity, N uptake and residual soil nitrate in a long-term wheat-summer maize cropping system. Field Crops Res. 213, 154-164. [CrossRef]
- Luo, S., Zhu, L., Liu, J., Bu, L., Yue, S., Shen, Y., Li, S., 2015. Sensitivity of soil organic carbon stocks and fractions to soil surface mulching in semiarid farmland. Eur. J. Soil Biol. 67, 35-42. [CrossRef]
- Ma, L., Lv, X., Cao, N., Wang, Z., Zhou, Z.,Meng, Y. 2021. Alterations of soil labile organic carbon fractions and biological properties under different residue-management methods with equivalent carbon input. Appl Soil Ecol. 161, 103821. [CrossRef]
- Major, J., Rondon, M., Molina, D., Riha, S.J., Lehmann, J. 2010. Maize yield and nutrition during 4 years after biochar application to a Colombian savanna oxisol. Plant Soil 333, 117–128.
- Majumder, B., Mandal, B., Bandyopadhyay, P.K., Chaudhury, J. 2007. Soil organic carbon pools and productivity relationships for a 34 year old rice-wheat-jute agroecosystem under different fertilizer treatments. Plant Soil 297, 53-67. [CrossRef]
- Nan, W., Li, S., Dong, Z., Yao, P. 2020. CH4 fluxes and diffusion within soil profiles subjected to different fertilizer regimes on China’s Loess Plateau. Agric. Ecosyst. Environ. 287, 106679. [CrossRef]
- Ren, A.T., Li, J.Y., Zhao, L., Zhou, R., Ye, J.S., Wang, Y.B., Zhang, X.C., Wesly, K., Ma, M.S., Xiong, Y.C. 2023. Reduced plastic film mulching under zero tillage boosts water use efficiency and soil health in semiarid rainfed maize field. Resour. Conserv. Recy. 190, 106851. [CrossRef]
- Sainju, U.M., Lenssen, A.W., Allen, B.L., Stevens, W.B., Jabro, J.D. 2017. Soil total carbon and nitrogen and crop yields after eight years of tillage, crop rotation, and cultural practice. Heliyon 3, e00481. [CrossRef]
- Shao, G., Xu, Y., Zhou, J., Tian, P., Ai, J., Yang, Y., Zamanian, K., Zeng, Z., Zang, H. 2024. Enhanced soil organic carbon stability in rhizosphere through manure application. Soil Tillage Res. 244: 106223. [CrossRef]
- Steinmetz, Z., Wollmann, C., Schaefer, M., Buchmann, C., David, J., Tröger, J., Muñoz, K., Frör, O., Schaumann, G.E. 2016. Plastic mulching in agriculture. trading short-term agronomic benefits for long-term soil degradation? Sci. Total Environ. 550, 690-705. [CrossRef]
- Tang, H., Cheng, K., Shi, L., Li, C., Wen, L., Li, W., Sun, M., Sun, G., Long, Z. 2022. Effects of long-term organic matter application on soil carbon accumulation and nitrogen use efficiency in a double-cropping rice field. Environ Res, 213, 113700. [CrossRef]
- Tian, G., Kang, B.T., Brussaard, T. 1992. Biological effects of plant residues with contrasting chemical compositions under humid tropical conditions decomposition and nutrients release. Soil Biol. Biochem. 24, 1051-1060. [CrossRef]
- Walkley, A., Black, I.A. 1934. An examination of the Degtjareff method for determining organic carbon in soils: effect of variations in digestion conditions and inorganic soil constituents. Soil Sci. 63, 251-263.
- Wang, D., Lin, J.Y., Sayre, J.M., Schmidt, R., Fonte, S.J., Rodrigues, J.L.M., Scow, K.M. 2022. Compost amendment maintains soil structure and carbon storage by increasing available carbon and microbial biomass in agricultural soil – A six-year field study. Geoderma, 427, 116117. [CrossRef]
- Wang, X., Chen, F., Liu, J., Wang, Z., Zhang, Z., Li, X.,Zhang, Q., Liu, W., Liu, H., Zeng, J., 2024a. Linking the soil carbon pool management index to ecoenzymatic stoichiometry and organic carbon functional groups in abandoned land under climate change. Catena 235, 107676. [CrossRef]
- Wang, M., Feng, X., Zhou, Z., Ma, H., Ge, T., Tang, C., Wang, D.,Chen, S. 2024b. Labile organic carbon fractions in the rhizosphere contribute to nitrogen and phosphorus uptake in rice under long-term crop rotations and nitrogen application. Appl Soil Ecol. 200, 105459. [CrossRef]
- Wang, X., Ren, Y., Zhang, S., Chen, Y., Wang, N., 2017. Applications of organic manure increased maize (Zea mays L.) yield and water productivity in a semi-arid region. Agric. Water Manag. 187, 88–98. [CrossRef]
- Wang, Y., Li, X., Fu, T., Wang, L., Turner, N., Siddique, K., Li, F., 2016. Multi-site assessment of the effects of plastic-film mulch on the soil organic carbon balance in semiarid areas of China. Agric. For. Meteorol. 228-229, 42-51. [CrossRef]
- Weil, R.R., Islam, K.R., Stine, M.A., Gruver, J.B., Samson-Liebig, S.E., 2003. Estimating active carbon for soil quality assessment: a simplified method for laboratory and field use. Am. J. Altern. Agric. 18, 3-17. [CrossRef]
- Witzgall, K., Vidal, A., Schubert, D.I., Hoschen, C., Schweizer, S.A., Buegger, F., Pouteau, V., Chenu, C., Mueller, C.W., 2021. Particulate organic matter as a functional soil component for persistent soil organic carbon. Nat. Commun. 12(1), 4115. [CrossRef]
- Xie, J., Evgenia, B., Zhang, Y., Wan, Y., Hu, Q.J., Zhang, C.M., Wang, J., Zhang, Y.Q., Shi, X.J., 2022. Substituting nitrogen and phosphorus fertilizer with optimal amount of crop straw improves rice grain yield, nutrient use efficiency and soil carbon sequestration. J. Integr. Agric. 21, 3345–3355.
- Yan B.J., Zhang Y.P., Wang, Y.Z., Rong, X.M., Peng, J.W., Fei, J.C., Gongwen, L., 2023. Biochar amendments combined with organic fertilizer improve maize productivity and mitigate nutrients loss by regulating the C–N–P stoichiometry of soil, microbiome, and enzymes. Chemosphere, 324, 138293. [CrossRef]
- Yang, J., Ren, L., Zhang, N., Liu, E., Sun, S., Ren, X., Jia, Z., Wei, T..,Zhang, P., 2024. Can soil organic carbon sequestration and the carbon management index be improved by changing the film mulching methods in the semiarid region? J. Integr. Gr. 23(5), 1541-1556. [CrossRef]
- Yang, Y., Liang, C., Wang, Y.Q., Cheng, H., An, S.S., Chang, S.X. 2020. Soil extracellular enzyme stoichiometry reflects the shift from P- to N-limitation of microorganisms with grassland restoration. Soil Biol. Biochem. 149, 107928. [CrossRef]
- Zhang, L., Meng, Y., Li, S.,Yue, S., 2020. High-yield characteristics and root support of rain-fed maize under film mulching. Agron. J. 112(3), 2115-2131. [CrossRef]
- Zhang, F., Li, S., Yue, S., Song, Q., 2022a. The effect of long-term soil surface mulching on SOC fractions and the carbon management index in a semiarid agroecosystem. Soil Tillage Res. 216, 105233. [CrossRef]
- Zhang, F., Wei, Y., Bo, Q., Tang, A., Song, Q., Li, S.,Yue, S., 2022b. Long-term film mulching with manure amendment increases crop yield and water productivity but decreases the soil carbon and nitrogen sequestration potential in semiarid farmland. Agric. Water Manag. 273, 107909. [CrossRef]
- Zhang, F., Song, Q., Ma, T., Gao, N., Han, X., Shen, Y., Yue, S., Li, S., 2024. Long-term maintenance of high yield and soil fertility with integrated soil-crop system management on the Loess Plateau. J Environ Manage. 351, 119687. [CrossRef]
- Zhang, Y., E, S., Wang, Y., Su, S., Bai, L., Wu, C., Zeng, X., 2021. Long-term manure application enhances the stability of aggregates and aggregate-associated carbon by regulating soil physicochemical characteristics. Catena, 203, 105342. [CrossRef]
- Zhang, Z.M., Yan, J., Han, X.Z., Zou, W.X., Chen, X., Lu, X.C., Feng, Y.T., 2021. Labile organic carbon fractions drive soil microbial communities after long-term fertilization. Glob Ecol Conserv. 32, e01867. [CrossRef]
- Zhu, L., Shen, Y., Li, S. 2018. Microbial residues were increased by film mulching with manure amendment in a semiarid agroecosystem. Arch Agron Soil Sci. 65(1), 101-112. [CrossRef]
Figure 2.
Soil organic carbon content in different soil layers under soil surface mulching and manure amendment in 2019 and 2020. CK, GM, FM and FCM represent no mulching, gravel mulching, film mulching and film mulching with amendment, respectively.
Figure 2.
Soil organic carbon content in different soil layers under soil surface mulching and manure amendment in 2019 and 2020. CK, GM, FM and FCM represent no mulching, gravel mulching, film mulching and film mulching with amendment, respectively.
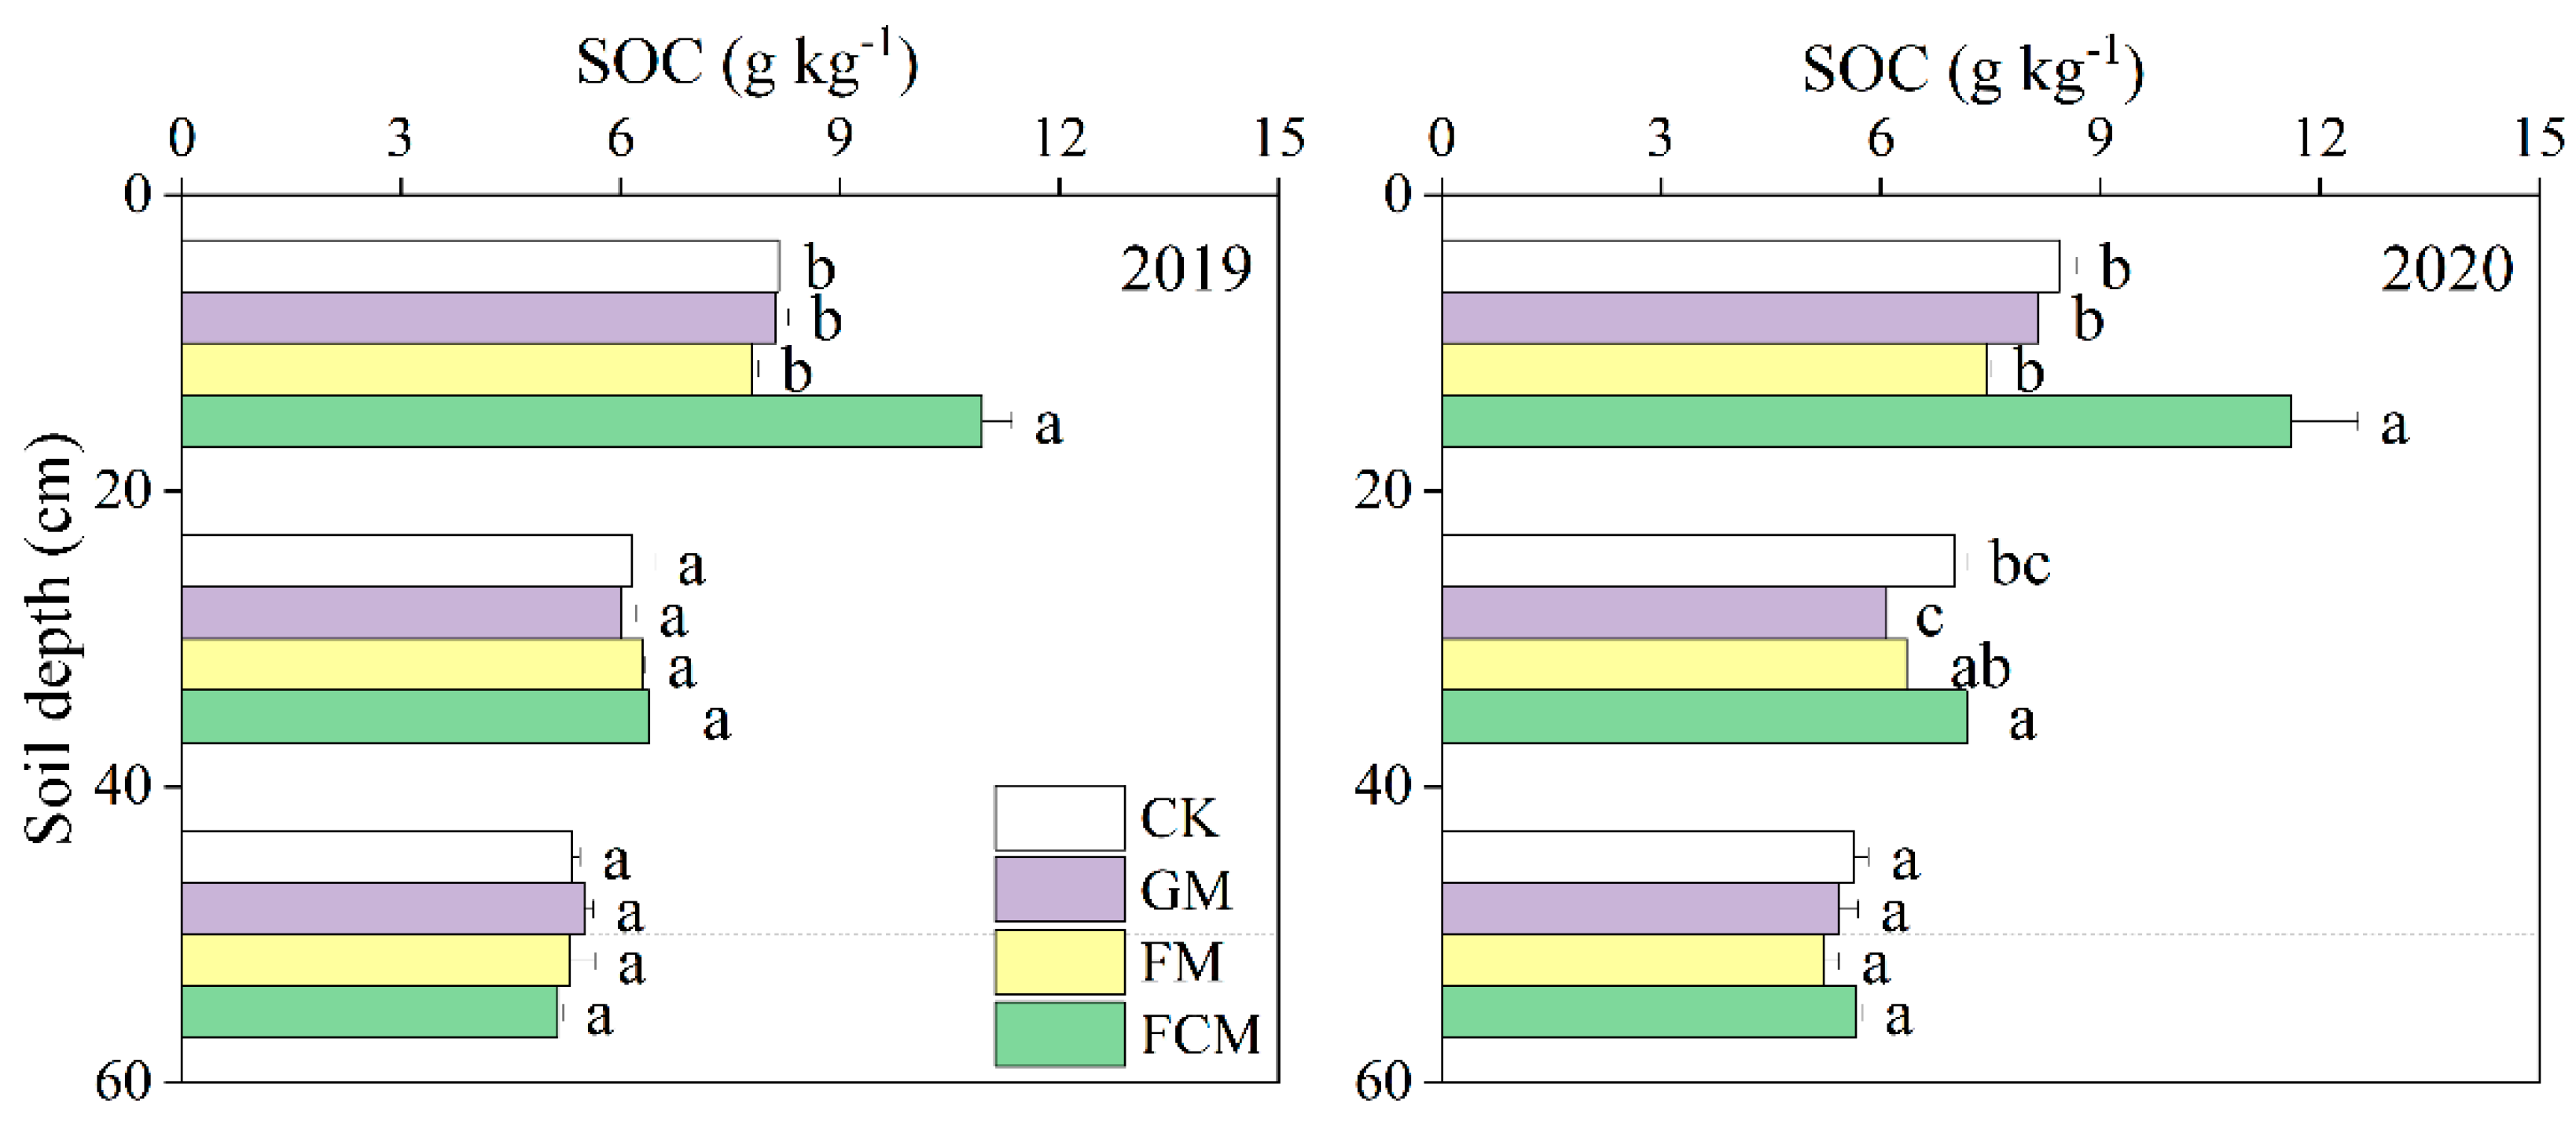
Figure 3.
Linear regression analysis between soil organic carbon content of the topsoil and nitrogen (N), phosphorus (P) and potassium (K) in the plant (A) and grain (B) (n=24).
Figure 3.
Linear regression analysis between soil organic carbon content of the topsoil and nitrogen (N), phosphorus (P) and potassium (K) in the plant (A) and grain (B) (n=24).
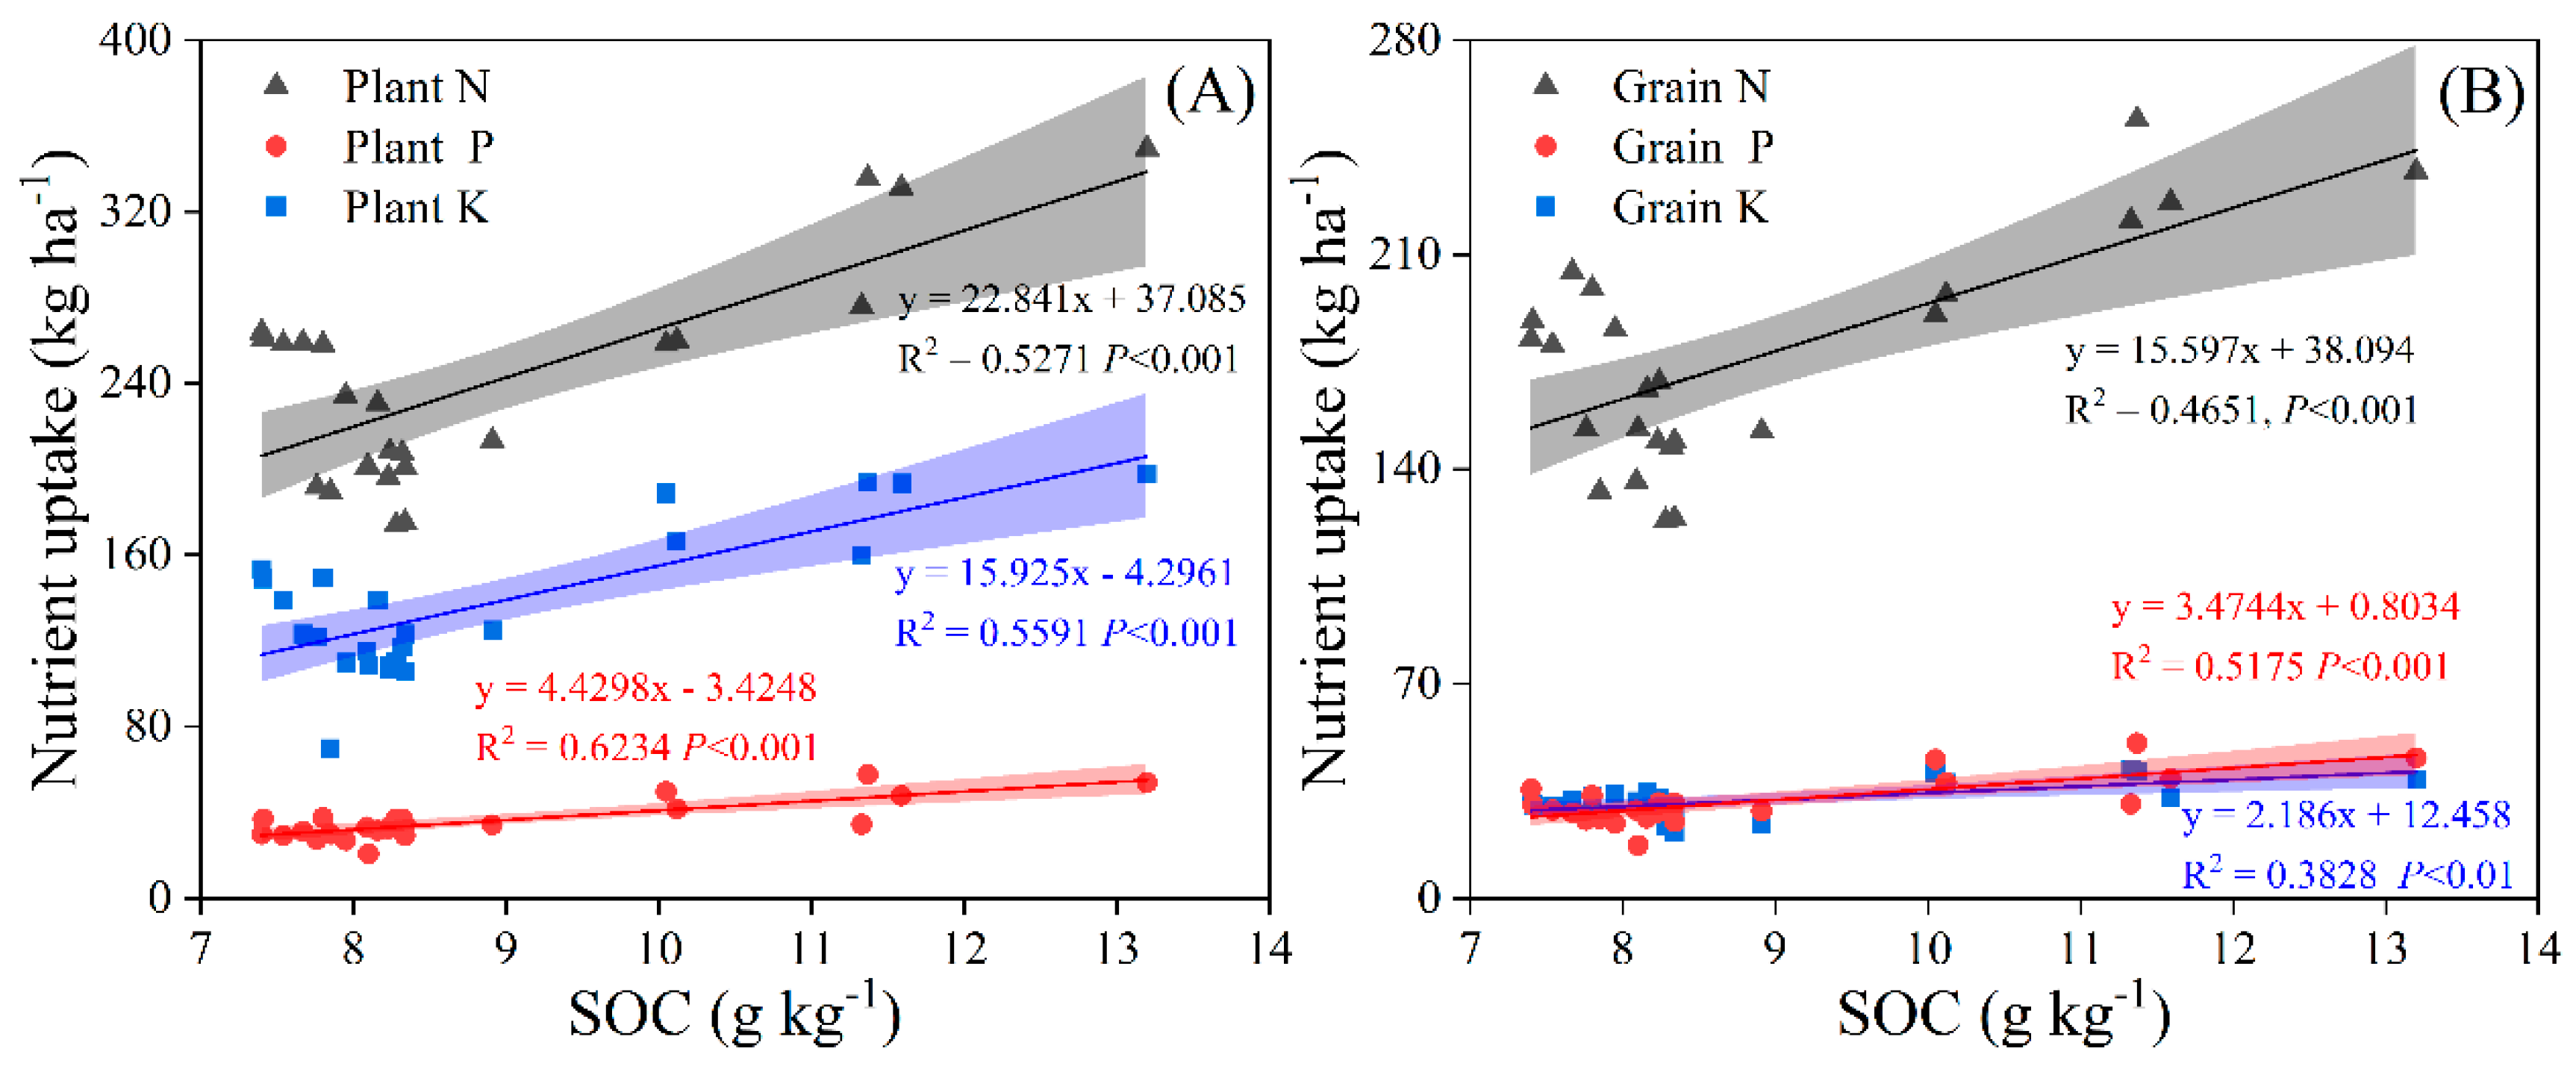
Figure 4.
The contents labile organic carbon fractions under long-term mulching and amendment in 2019 and 2020. Error bars are standard errors of means (n = 3). Different lowercase letters denote significant differences among treatments at P < 0.05. CK, GM, FM and FCM represent no mulching, gravel mulching, film mulching and film mulching with amendment, respectively. WSC: water solution carbon; HWC: hot-water extractable carbon; POXC: permanganate oxidizable carbon; POC: particulate organic carbon.
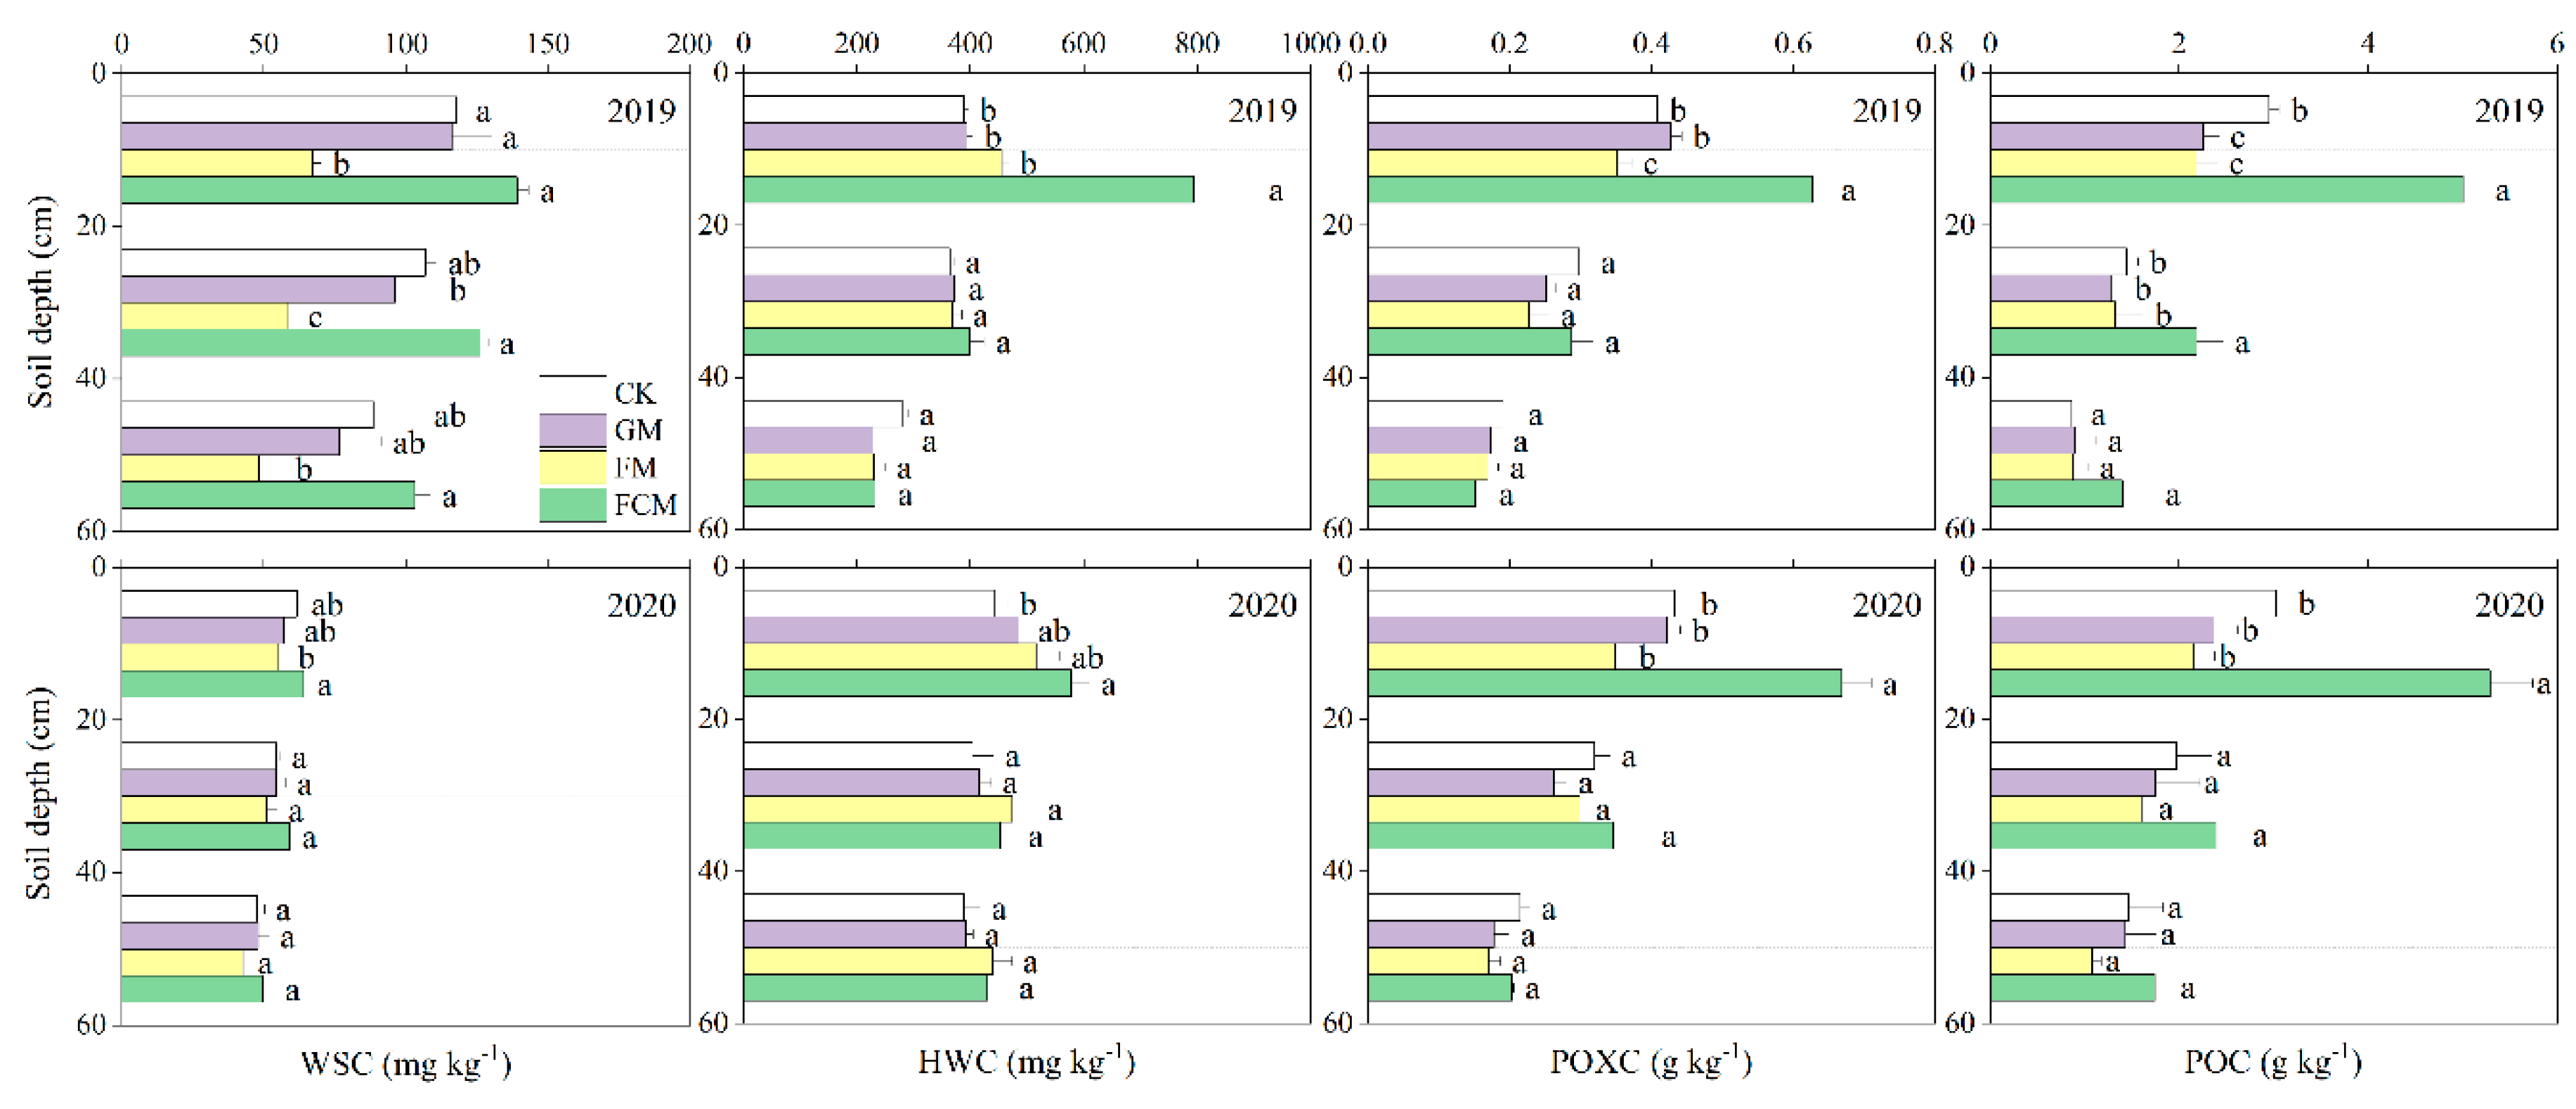
Figure 5.
Random forest analysis of soil organic carbon fractions and carbon pool management index in the topsoil on nitrogen (N), phosphorus (P) and potassium (K) in the plant and grain.
Figure 5.
Random forest analysis of soil organic carbon fractions and carbon pool management index in the topsoil on nitrogen (N), phosphorus (P) and potassium (K) in the plant and grain.
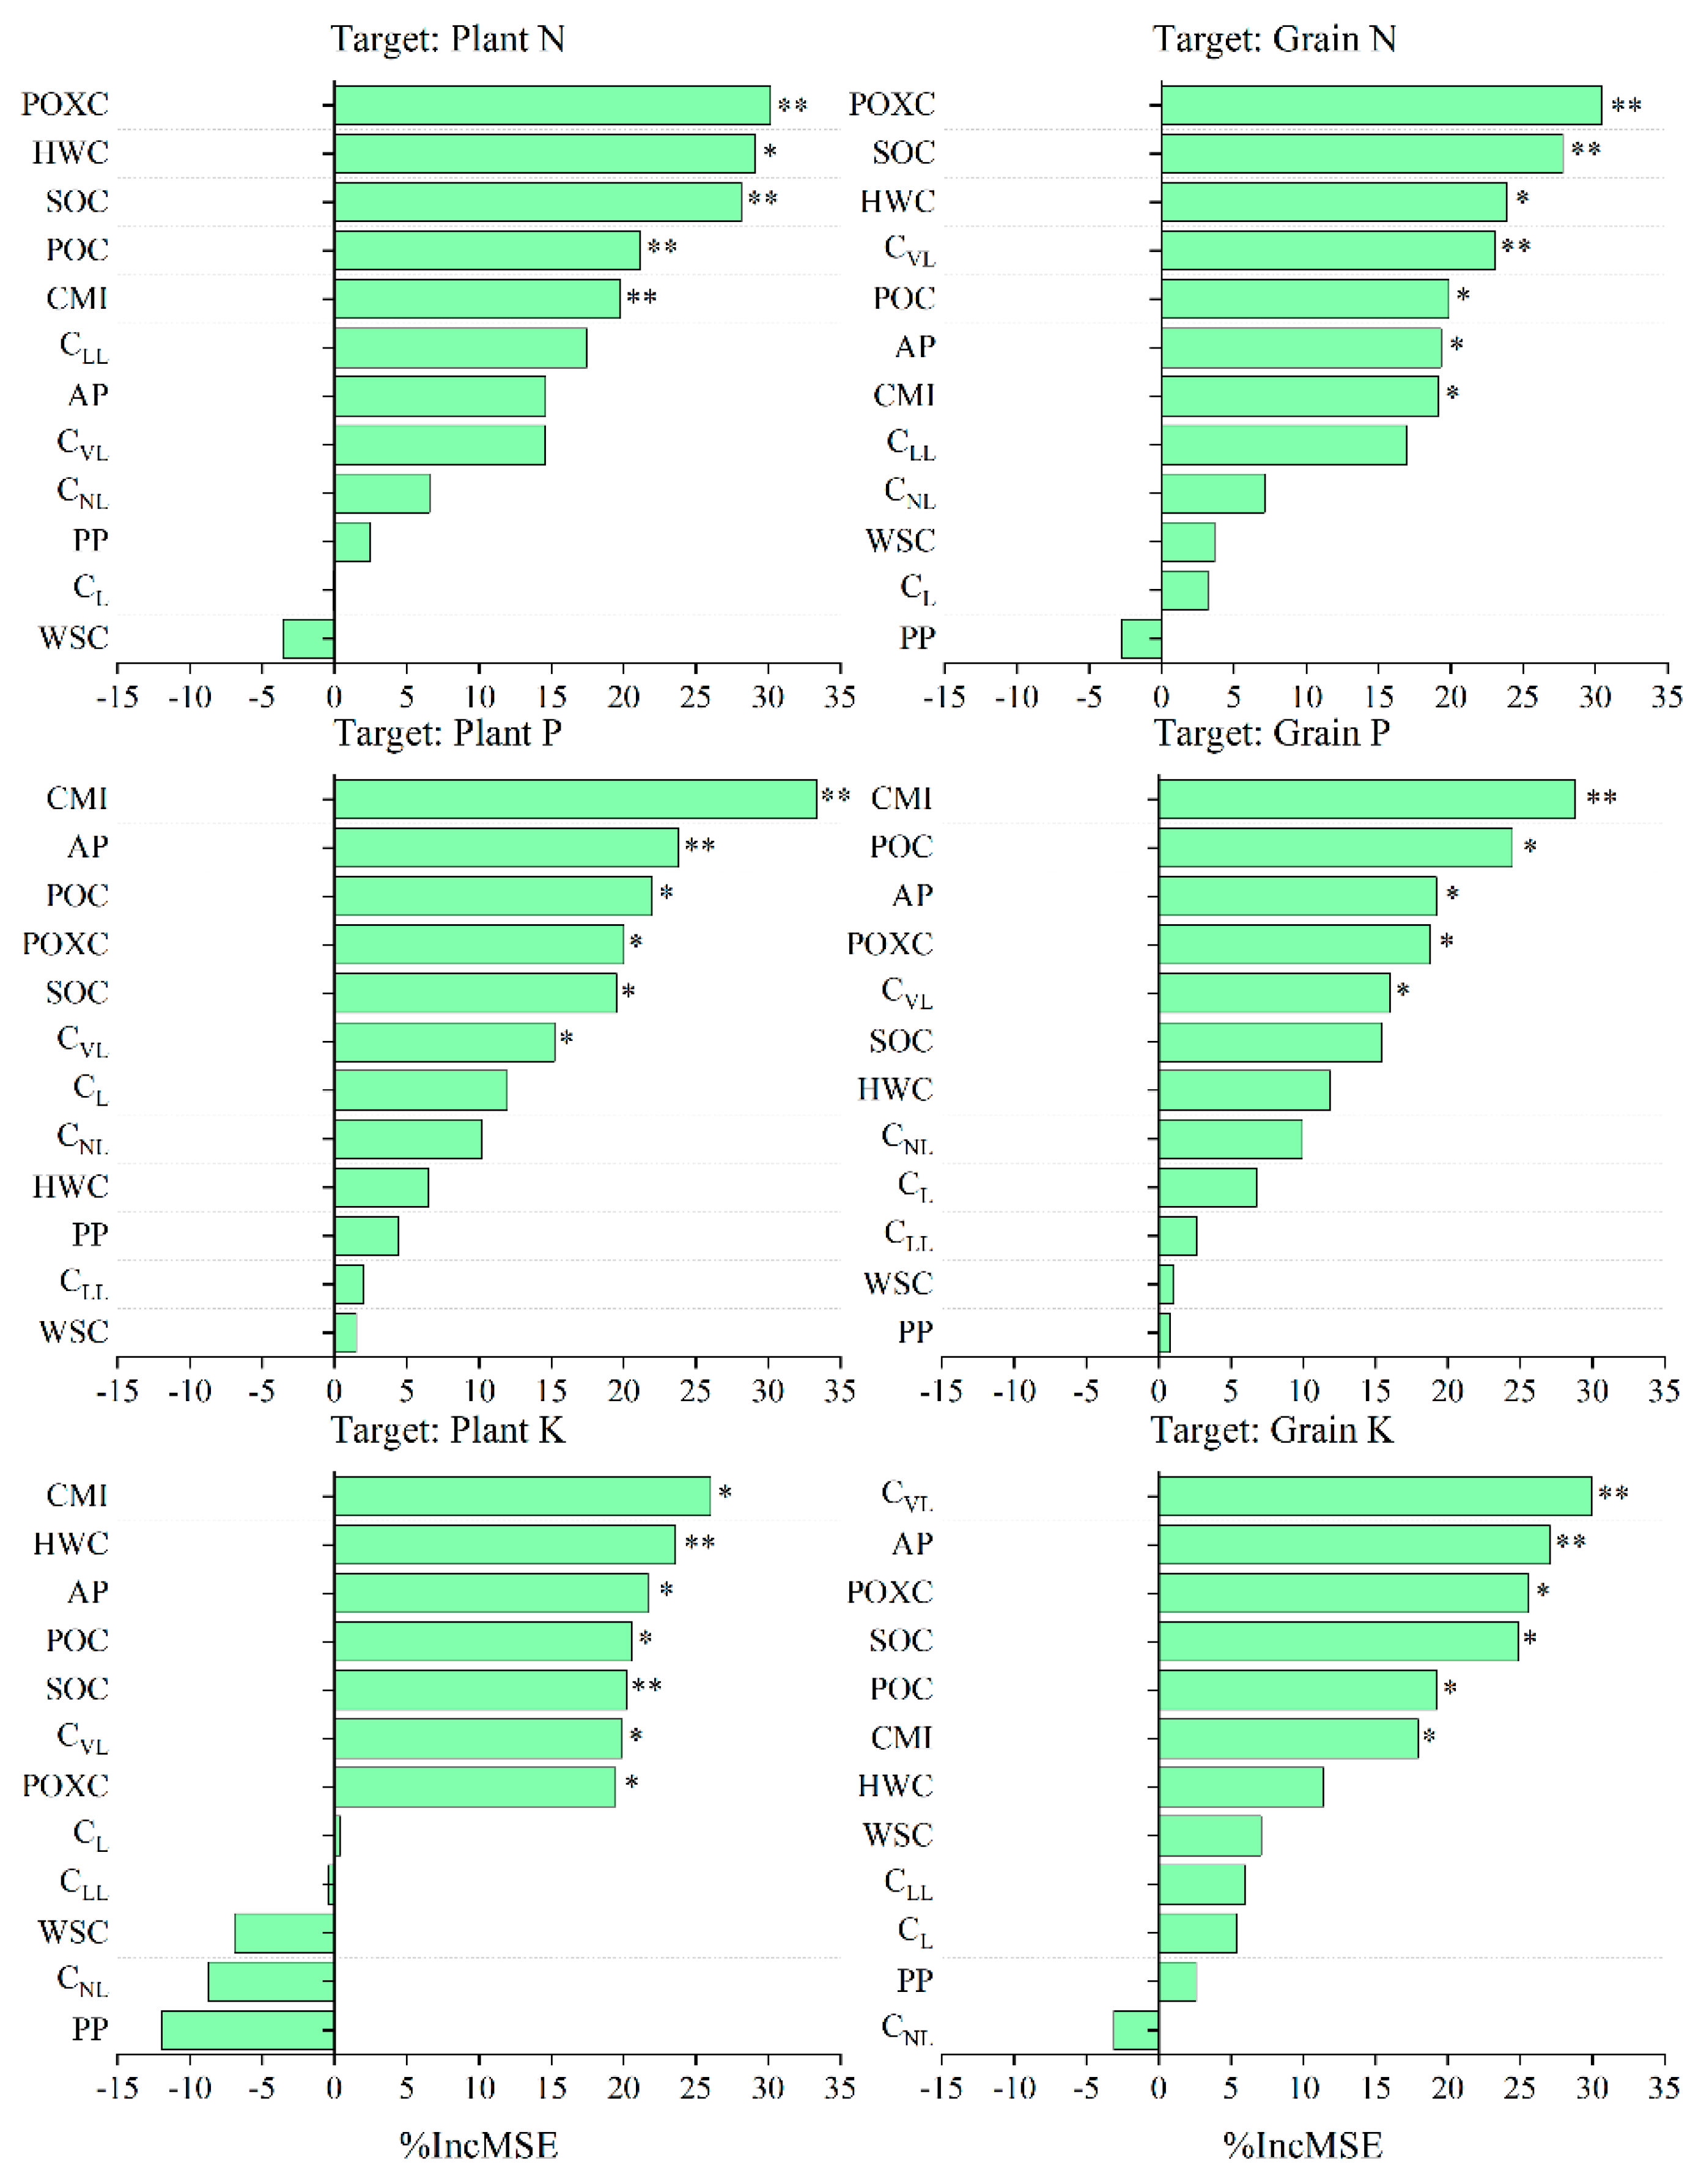
Figure 6.
Linear regression analysis between soil organic carbon content of the topsoil and nitrogen (N), phosphorus (P) and potassium (K) in the plant (A) and grain (B) (n=24).
Figure 6.
Linear regression analysis between soil organic carbon content of the topsoil and nitrogen (N), phosphorus (P) and potassium (K) in the plant (A) and grain (B) (n=24).
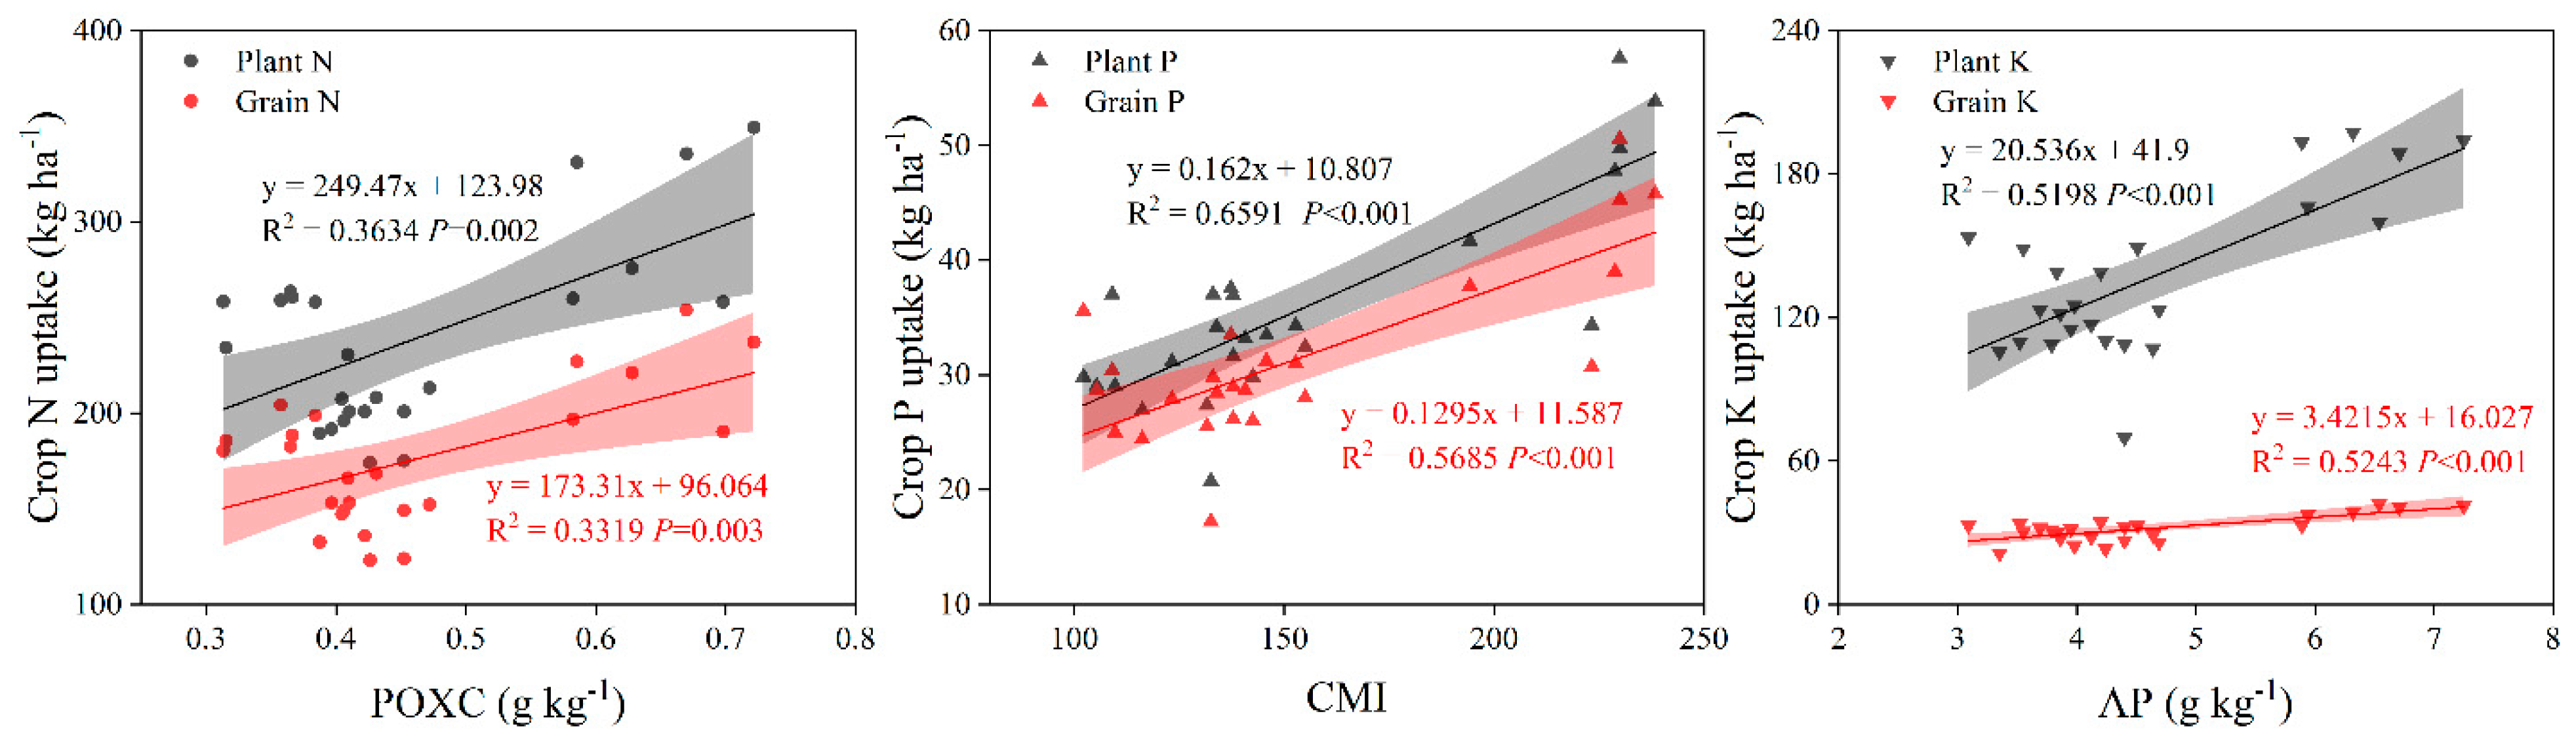

Table 1.
Dry matter accumulation, nitrogen (N), phosphorus (P) and potassium (K) in the plant and grain under long-term mulching and amendment in 2019 and 2020.
Table 1.
Dry matter accumulation, nitrogen (N), phosphorus (P) and potassium (K) in the plant and grain under long-term mulching and amendment in 2019 and 2020.
| Year | Treatment | Dry matter accumulation | Plant N | Plant P | Plant K | Grain N | Grain P | Grain K |
| - | - | Mg ha−1 | kg ha−1 | kg ha−1 | kg ha−1 | kg ha−1 | kg ha−1 | kg ha−1 |
| 2019 | CK | 25.2b | 209.2bc | 28.3b | 118.2b | 156.1b | 23.8b | 31.6b |
| GM | 21.9c | 200.3c | 31.7ab | 117.8b | 156.9b | 29.3ab | 28.7b | |
| FM | 26.1b | 250.5ab | 31.9ab | 127.3b | 196.3a | 28.6ab | 32.9b | |
| FCM | 29.6a | 290.5a | 44.6a | 173.4a | 224.0a | 39.7a | 40.3a | |
| 2020 | CK | 22.7b | 207.2c | 34.8b | 119.1c | 145.2c | 28.7b | 28.1c |
| GM | 20.0b | 179.6c | 32.0b | 95.2d | 126.6c | 26.9b | 23.9bc | |
| FM | 26.9a | 261.0b | 36.3b | 147.1b | 183.8b | 31.6b | 31.2b | |
| FCM | 28.8a | 313.0a | 50.5a | 193.2a | 218.2a | 43.4a | 37.5a |
Data are presented as the mean values (n = 3). Different lowercase letters denote significant differences among treatments at P < 0.05. CK, GM, FM and FCM represent no mulching, gravel mulching, film mulching and film mulching with amendment, respectively.
Table 2.
The contents of carbon fractions based on gradient oxidation under long-term mulching and manure amendment.
Table 2.
The contents of carbon fractions based on gradient oxidation under long-term mulching and manure amendment.
| 2019 | 2020 | |||||||||||
| Treat ment |
CVL | CL | CLL | CNL | AP | PP | CVL | CL | CLL | CNL | AP | PP |
| g kg-1 | g kg-1 | g kg-1 | g kg-1 | g kg-1 | g kg-1 | g kg-1 | g kg-1 | g kg-1 | g kg-1 | g kg-1 | g kg-1 | |
| 0-20 cm | ||||||||||||
| CK | 2.85b | 1.36b | 1.01a | 2.94a | 4.21b | 3.95a | 2.02b | 1.99a | 1.54ab | 2.88b | 4.01b | 4.42ab |
| GM | 2.88b | 1.44b | 0.92a | 2.87a | 4.32b | 3.80a | 1.77bc | 2.22a | 1.03b | 3.13ab | 4.00b | 4.16b |
| FM | 2.56b | 1.35b | 0.53b | 3.37a | 3.91b | 3.90a | 1.44c | 2.05a | 0.49b | 3.47a | 3.49b | 3.96b |
| FCM | 4.40a | 2.17a | 1.13a | 3.24a | 6.58a | 4.37a | 4.14a | 2.17a | 2.87a | 3.43a | 6.31a | 6.30a |
| 20-40 cm | ||||||||||||
| CK | 2.29a | 1.35a | 0.84a | 1.67a | 3.64a | 2.51a | 1.72b | 1.26b | 1.44a | 2.59a | 2.97b | 4.03a |
| GM | 1.86a | 0.92a | 0.89a | 2.33a | 2.78a | 3.22a | 1.06b | 2.52a | 0.58b | 1.92b | 3.58b | 2.50b |
| FM | 2.2a | 0.70a | 1.04a | 2.38a | 2.9a | 3.41a | 1.05b | 2.15ab | 0.61b | 2.54a | 3.20b | 3.15ab |
| FCM | 2.54a | 1.18a | 1.28a | 1.89a | 3.72a | 3.17a | 3.00a | 1.76ab | 1.51a | 1.91b | 4.76a | 3.42a |
| 40-60 cm | ||||||||||||
| CK | 1.78a | 1.18a | 1.16a | 1.20b | 2.96a | 2.36a | 0.80b | 0.53b | 1.89a | 2.41a | 1.34c | 4.29a |
| GM | 1.61a | 1.30a | 0.39b | 2.20a | 2.91a | 2.59a | 0.60b | 2.17a | 0.94c | 1.72ab | 2.77ab | 2.66b |
| FM | 1.49a | 1.38a | 0.39b | 2.05ab | 2.87a | 2.44a | 0.90b | 1.32ab | 1.20bc | 1.81ab | 2.22b | 3.01b |
| FCM | 1.80a | 1.10a | 0.88ab | 1.52ab | 2.90a | 2.40a | 1.92a | 1.43ab | 1.72ab | 1.08b | 3.35a | 2.80b |
Data are presented as the mean values (n = 3). Different lowercase letters denote significant differences among treatments at P < 0.05. CK, GM, FM and FCM represent no mulching, gravel mulching, film mulching and film mulching with amendment, respectively. CVL: very labile carbon; CL: labile carbon; CLL: less labile carbon; CNL: non-labile carbon; AP: active carbon pool; PP: passive carbon pool.
Table 3.
Sensitivity index of soil organic carbon and its fractions in the topsoil under long-term mulching and manure amendment in the topsoil in 2019 and 2020.
Table 3.
Sensitivity index of soil organic carbon and its fractions in the topsoil under long-term mulching and manure amendment in the topsoil in 2019 and 2020.
|
Treat ment |
Year | SOC | LOCFs | SOCFs | ||||||||
| - | - | WSC | HWC | POXC | POC | CVL | CL | CLL | CNL | AP | PP | |
| GM | 2019 | 0.59 | 1.50 | 1.39 | 4.45 | 22.8 | 1.35 | 8.13 | 6.22 | 0.53 | 2.79 | 3.40 |
| 2020 | 3.27 | 7.24 | 9.59 | 2.35 | 20.1 | 12.6 | 12.9 | 35.4 | 8.68 | 0.50 | 6.40 | |
| Mean | 1.93 | 4.37 | 5.49 | 3.40 | 21.5 | 6.98 | 10.5 | 20.8 | 4.61 | 1.64 | 4.90 | |
| CV | 97.9 | 93.0 | 105.6 | 43.6 | 8.90 | 114.11 | 31.8 | 99.2 | 125.1 | 98.32 | 43.34 | |
| FM | 2019 | 4.36 | 42.8 | 17.0 | 13.8 | 25.8 | 11.7 | 3.06 | 41.8 | 16.7 | 6.79 | 1.03 |
| 2020 | 11.6 | 10.4 | 16.2 | 18.9 | 28.9 | 15.5 | 5.76 | 39.5 | 11.9 | 13.09 | 9.61 | |
| Mean | 7.98 | 26.6 | 16.6 | 16.3 | 27.3 | 13.6 | 4.41 | 40.6 | 14.3 | 9.94 | 5.32 | |
| CV | 64.3 | 86.4 | 3.52 | 22.2 | 7.89 | 19.3 | 43.4 | 3.92 | 23.8 | 44.84 | 114.03 | |
| FCM | 2019 | 34.1 | 18.1 | 105.3 | 53.4 | 70.7 | 66.3 | 82.5 | 126.5 | 1.67 | 57.66 | 10.71 |
| 2020 | 37.4 | 4.11 | 30.6 | 54.7 | 75.1 | 134.1 | 7.28 | 841.1 | 1.14 | 56.99 | 41.64 | |
| Mean | 35.8 | 11.1 | 67.9 | 54.1 | 72.9 | 100.2 | 44.9 | 483.8 | 1.40 | 57.33 | 26.18 | |
| CV | 6.50 | 89.1 | 77.8 | 1.70 | 4.25 | 47.9 | 118.5 | 104.4 | 26.4 | 0.82 | 83.54 | |
GM, FM and FCM represent no mulching, gravel mulching, film mulching and film mulching with amendment, respectively. SOC: soil organic carbon; WSC: water solution carbon; HWC: hot-water extractable carbon; POXC: permanganate oxidizable carbon; POC: particulate organic carbon; CVL: very labile carbon; CL: labile carbon; CLL: less labile carbon; CNL: non-labile carbon; AP: active carbon pool; PP: passive carbon pool.
Table 4.
Correlation analysis of soil organic carbon fractions and carbon management index in the topsoil and nitrogen (N), phosphorus (P) and potassium (K) in the plant and grain (n=24).
Table 4.
Correlation analysis of soil organic carbon fractions and carbon management index in the topsoil and nitrogen (N), phosphorus (P) and potassium (K) in the plant and grain (n=24).
| Plant N | Plant P | Plant K | Grain N | Grain P | Grain K | |
| SOC | 0.726** | 0.790** | 0.746** | 0.682** | 0.719** | 0.618** |
| WSC | 0.051 | 0.019 | 0.139 | 0.212 | 0.036 | 0.363 |
| HWC | 0.608** | 0.439* | 0.571** | 0.635** | 0.490* | 0.622** |
| POXC | 0.603** | 0.820** | 0.748** | 0.576** | 0.778** | 0.627** |
| POC | 0.699** | 0.754** | 0.743** | 0.644** | 0.690** | 0.648** |
| CVL | 0.603** | 0.704** | 0.662** | 0.681** | 0.672** | 0.756** |
| CL | 0.251 | 0.510* | 0.329 | 0.122 | 0.480* | 0.106 |
| CLL | 0.481* | 0.570** | 0.497* | 0.328 | 0.468* | 0.191 |
| CNL | 0.398 | -0.037 | 0.271 | 0.389 | -0.005 | 0.218 |
| AP | 0.638** | 0.826** | 0.721** | 0.662** | 0.786** | 0.724** |
| PP | 0.579** | 0.482* | 0.542** | 0.442* | 0.406* | 0.253 |
| CMI | 0.655** | 0.812** | 0.728** | 0.651** | 0.754** | 0.702** |
SOC: soil organic carbon; WSC: water solution carbon; HWC: hot-water extractable carbon; POXC: permanganate oxidizable carbon; POC: particulate organic carbon; CVL: very labile carbon; CL: labile carbon; CLL: less labile carbon; CNL: non-labile carbon; AP: active carbon pool; PP: passive carbon pool. CMI: carbon management index.
Disclaimer/Publisher’s Note: The statements, opinions and data contained in all publications are solely those of the individual author(s) and contributor(s) and not of MDPI and/or the editor(s). MDPI and/or the editor(s) disclaim responsibility for any injury to people or property resulting from any ideas, methods, instructions or products referred to in the content. |
© 2025 by the authors. Licensee MDPI, Basel, Switzerland. This article is an open access article distributed under the terms and conditions of the Creative Commons Attribution (CC BY) license (http://creativecommons.org/licenses/by/4.0/).
Copyright: This open access article is published under a Creative Commons CC BY 4.0 license, which permit the free download, distribution, and reuse, provided that the author and preprint are cited in any reuse.


