
Submitted:
22 August 2025
Posted:
25 August 2025
You are already at the latest version
Abstract
This study investigates response patterns to political questions in the European Social Survey and identifies latent classes based on item nonresponse using Latent Class Analysis. Three distinct latent classes were identified: a politically engaged group with low missing data, a moderately engaged group with moderate missing data, and a politically disengaged group with high missing data. Sociodemographic variables, including age, gender, education level, income, employment status, marital status, and religiosity, were used as predictors to develop machine learning models, such as Logistic Regression, Lasso Regression, Decision Tree, Random Forest, XGBoost, and K-Nearest Neighbors, to predict latent class membership. Random Forest and XGBoost models showed superior accuracy, precision, recall, and F-1 score. Multiple imputations accounted for errors in predicted class membership, with consistent patterns observed across the imputed datasets. However, the study’s limitations, including reliance on self-reported data and a limited set of predictors, suggest avenues for future research to explore additional variables and alternative imputation methods.
Keywords:
item nonresponse
; latent class analysis (LCA)
; supervised machine learning
; XGBoost
; random forest
; logistic regression
; multiple imputation
; bayesian information criterion (BIC)
; survey methodology
; political attitudes
1. Introduction
The integrity and validity of survey research are critically dependent on the quality and completeness of data collected (Jamieson et al., 2023). Nonresponse, a significant challenge in survey research, compromises the reliability and validity of research findings (Taherdoost & Madanchian, 2024). Groves & Peytcheva (2008) conducted a meta-analysis of 59 studies and found that nonresponse bias can affect survey estimates, particularly for attitudinal variables. Their findings emphasize the importance of assessing nonresponse bias to ensure the reliability and validity of survey research. Nonresponse is more common in social research particularly in sensitive health and political surveys like the European Social Survey (ESS). Nonresponse can occur on a unit or item level and may introduce substantial bias, especially if the nonresponse is not random but correlated with the survey's substantive variables of interest (Groves et al., 2009). The European Social Survey, known for its rigorous methodology and cross-national reach, provides a rich dataset for studying political behavior, attitudes, and social change across Europe (Nickel & Weber, 2024). However, the sensitivity of political questions can influence item nonresponse, potentially leading to skewed results (Burden & Ono, 2021).
Traditional methods of handling nonresponse like imputation, while helpful, often fall short in addressing the complexity and scale of data typically involved in surveys. The need for innovative approaches that can effectively predict nonresponse to ensure the accuracy of survey data is critical in today’s social research (Ji et al., 2024). There is growing interest in employing advanced statistical techniques such as Latent Class Analysis (LCA) and Machine Learning (ML) to predict nonresponse effectively (Kern et al., 2019). LCA is particularly useful in large-scale surveys like the ESS, where missing data patterns often vary by question sensitivity (Montagni et al., 2019). By identifying latent nonresponse classes, survey methodologists can detect systematic missingness in politically sensitive or complex questions, differentiate between intentional and unintentional nonresponse, and develop subgroup-specific interventions to minimize missing data. Feskens et al. (2012) and Sulis & Porcu (2017) demonstrated how LCA can uncover patterns in missing data by identifying distinct groups of respondents with similar item nonresponse tendencies.
While LCA provides a probabilistic framework for modeling missingness, it does not directly predict which individuals will exhibit item nonresponse in future surveys (Brandenburger & Schwichow, 2023). To address this limitation, researchers have turned to machine learning models, which offer predictive capabilities beyond traditional statistical techniques (Buskirk et al., 2018). Studies such as one by Kern and colleagues (2023) illustrate the potential of machine learning techniques like Random Forests and Gradient Boosting Machines to predict nonresponse in survey data. Barkho and colleagues (2024) also employed machine learning to predict participant responses in a longitudinal health survey, demonstrating how these techniques can be adapted for different surveys, including those with political and social dimensions. Their work underscores the versatility of ML in addressing various challenges in survey research, from predicting follow-up participation to identifying factors influencing initial nonresponse.
Olbrich (2024) and Grönemann (2024) illustrate how ML models can analyze complex patterns of missing responses in face-to-face surveys, finding that demographic factors, socio-economic status, and question sensitivity strongly influence item nonresponse. Olbrich (2024) further highlights that ML models outperform traditional regression approaches in detecting non-linear relationships between respondent characteristics and item nonresponse. Among the most effective ML models for predicting item nonresponse are Random Forests and Gradient Boosting Machines, which can model complex interactions between predictors and detect response patterns (Uddin et al., 2019). LASSO regression, which performs feature selection to identify the most influential predictors of item nonresponse, has also been widely used (Yao et al., 2022).
The integration of LCA and ML provides a useful framework for studying item nonresponse. While LCA helps uncover latent patterns in missing data, ML models offer predictive power to anticipate future item nonresponse behaviors and develop data-driven interventions to minimize missingness. Given the complexity of item nonresponse in surveys like the ESS, these methods are particularly well-suited for analyzing large datasets where traditional statistical models fall short.
My study builds upon these foundations by employing supervised machine learning specifically, Logistic Regression, Decision Trees, Random Forest, XGBoost, LASSO Regression, and K-Nearest Neighbors (KNN) models to address item nonresponse in ESS. By leveraging the demographic and response data available, I aim to unveil underlying predictors of item nonresponse in future survey rounds.
1.1. Research Questions
The primary objective of this study is to provide answers to the following questions:
- What patterns of nonresponse to politically sensitive questions in the ESS can be identified through Latent Class Analysis?
- How accurately can various supervised machine learning models predict nonresponse to politically sensitive questions in the ESS?
- How do different supervised machine learning models compare in terms of their performance in predicting nonresponse?
2.0. Data and Methods
2.1. Data Source
This study utilized data from Rounds 10 and 11 of the ESS to analyze item nonresponse patterns. The ESS is a biennial, cross-national survey that collects data on individuals’ social attitudes, values, and behaviors across Europe. This study focuses on the Belgian subset of the ESS, covering all respondents from Belgium in both survey rounds. The target population of the ESS in Belgium includes all individuals aged 15 and older residing in private households, regardless of nationality or language. The German-speaking Community is excluded for practical reasons, as no German-language questionnaire is provided in Belgium. To ensure national representativeness, a strictly random probability-based sampling approach was used. The sampling frame is drawn from the Belgian National Register, which provides a complete and up-to-date listing of all residents. Individuals were selected through random procedures at each stage, ensuring that every person in the population had a known and nonzero probability of selection. After merging the two datasets (data from round 1 and round 11), the total sample size was 2935.
Data collection for Rounds 10 and 11 of the ESS in Belgium followed a standardized survey protocol designed to minimize bias and ensure comparability across countries and survey waves. The primary mode of data collection was face-to-face interviews conducted using Computer-Assisted Personal Interviewing (CAPI). This method allows for real-time data validation and interviewer-assisted clarification, which helps improve response accuracy. The field period for Round 10 occurred between 2020 and 2021, while data for Round 11 were collected between 2022 and 2023. Interviewers made up to four contact attempts to increase response rates, including home visits at different times of the day (European Social Survey, 2024). Variable descriptions and question wordings have been provided in Appendix A.
2.2. Methods
The primary dependent variable in this study is constructed through LCA of both round 10 and 11 datasets. I used the poLCA package in R. The selected questions classified as political in ESS that were used for the study are:
Trust in Various Institutions: Such as parliament (trstprl), the legal system (trstlgl), police (trstplc), politicians (trstplt), political parties (trstprt), the European Parliament (trstep), and the United Nations (trstun).
Satisfaction Measures: Including satisfaction with life overall (stflife), the economy (stfeco), the national government (stfgov), and how democracy works (stfdem).
Immigration Attitudes: Questions about allowing immigrants of the same or different race/ethnic group as the majority (imsmetn, imdfetn), immigrants from poorer countries outside Europe (impcntr), and whether immigration is good or bad for the economy (imbgeco) or cultural life (imueclt).
Answers such as "Refusal" (coded as 77), "Don't know" (coded as 88), and "No answer" (coded as 99) were recoded as 'no response'. In contrast, all other numerical values representing substantive responses were recoded as 'response'. The LCA relies on the expectation-maximization procedure to produce the maximum likelihood or probabilities of class membership and item-response probabilities (Naldi & Cazzaniga, 2020). The analysis procedure involved fitting multiple LCA models with varying numbers of latent classes (1-5) to determine the most appropriate model structure to represent the data. The optimal number of latent classes was determined through model fit statistics such as the Bayesian Information Criterion (BIC).
Following the identification of the optimal latent classes, each respondent was assigned to a latent class. The assignment process uses modal posterior probabilities, which is a procedure that assigns each respondent to the class for which they have the highest probability. Supervised machine learning models including Logistic Regression, Decision Trees, Random Forest, XGBoost, LASSO Regression, and K-Nearest Neighbors (KNN) were deployed to predict the latent class membership using several R packages including caret, nnet, randomForest, xgboost, glmnet, and class among others. These models are chosen for their robustness and ability to handle the complexity and non-linearity of survey data (Uddin et al., 2019). The tuning parameters explored are summarized in Table 1. I utilized sociodemographic variables as predictors to develop the various supervised machine learning models previously mentioned. These variables include age, gender, education level, income, employment, marital status, and religiosity. Prior research suggests these variables may influence a respondent's likelihood to participate fully in a survey (Huff & Tingley, 2015). Each model was trained using data from Round 10 of the ESS and validated with data from Round 11 to ensure robustness.
To handle the uncertainty in class membership, five imputed datasets were generated by sampling class membership from these posterior probabilities for each respondent. In each imputed dataset, a different latent class was assigned based on the sampled probabilities, reflecting the variability in the predicted class for each individual. By aggregating (averaging) the results across all imputations, the variability in predicted classes was considered, resulting in more reliable performance estimates. The models' performances were assessed using several metrics including accuracy, precision, recall, and F1-score to determine the best-performing models.
The formula for each metric is written below.
………………………………… eqn 1
…………………………………..eqn 2
…………………………………..eqn 3
……………………..…………..eqn 4
TP= True Positive, TN= True Negative, FP= False Positive, True Negative, False Negative
3.0. Results
This section presents the results of the study. It is divided into two main parts: the identification of latent classes and the performance of machine learning models in classifying respondents into these classes.
3.1. Latent Class Model
The model with three latent classes was ultimately selected due to its superior BIC performance (lowest BIC), suggesting it provided the best fit without overfitting the data. The BIC and AIC became smaller as the number of classes increased up to the three-class model. The estimated population shares for High Response, Moderate Response, and Low Response classes are 90.11, 3.17, and 6.72 respectively. Figure 1 provides the Goodness of fit statistics for the five models. The description of each latent class based on the average conditional item-response probabilities has been presented in Table 2.
The LCA revealed three distinct latent classes based on response patterns to political questions. The first class, representing approximately 90% of the respondents (estimated population share), showed low levels of missing data and high response rates to political questions. This class can be interpreted as reflecting politically engaged respondents who are knowledgeable and active in political matters. They provide reliable data and likely represent the more informed and engaged segment of the population. The second class, comprising about 3% of the respondents, exhibited moderate levels of missing data and moderate responses to the political questions. These respondents likely engage with politics, but their responses suggest they may not hold strong views. The third class, which represents about 7% of the sample, displayed the highest levels of missing data. This class likely consists of individuals who are politically disengaged or indifferent to political matters. These respondents may skip certain political questions due to a lack of interest or insufficient knowledge.
Table 2 shows the average conditional item-response probabilities by latent class for political themes, providing insight into the distribution of responses within each class for different political measures. The High Response class (Class 1) exhibits high probabilities of responding positively to political questions across all themes, with probabilities consistently above 0.8. For example, the probability of a substantive response for "Trust in Institutions" in this class is 0.81, which aligns with the interpretation that politically engaged respondents are highly likely to provide answers across political themes (Ouattara & Steenvoorden, 2024). Similarly, the probability of a substantive response for "Satisfaction Measures" and "Immigration Attitudes" is also high, suggesting that this group is well-informed and engaged in discussions about these political issues. The Moderate Response class (Class 2) shows moderate response rates to the questions, with response probabilities around 0.5 to 0.6 for most themes. For instance, the probability for "Trust in Institutions" is 0.55, which suggests that this class is somewhat engaged with political topics but not as actively involved as the first class. These respondents likely provide more ambiguous or uncertain responses to political issues, reflecting a lack of depth in their political engagement. In contrast, the Low Response class (Class 3) displays the lowest response probabilities for political themes. For example, the probability for "Trust in Institutions" is just 0.12, which indicates political disengagement. Respondents in this class are the least likely to respond to political questions, reflecting their indifference or lack of interest in political issues. Similarly, response probabilities for "Satisfaction Measures" and "Immigration Attitudes" are low, with probabilities of 0.15 and 0.13, respectively, further confirming that this group is politically disengaged and may skip political questions due to their lack of interest or insufficient knowledge.
3.2. Supervised Machine Learning Models
Among the models tested, XGBoost achieved the highest accuracy, followed by Random Forest demonstrating the effectiveness of ensemble learning models in predicting item nonresponse. Logistic Regression and LASSO Regression also performed well, with accuracy above 90. The Decision Tree model had a slightly lower performance, and KNN performed the worst. A summary of the performance of each model has been presented in Table 3. Since latent class assignments are probabilistic, uncertainty in classification was addressed using multiple imputations with five iterations. Final predictions were aggregated across imputations to obtain stable estimates as shown in Table 3.
I used the Random Forest model to assess feature importance, identifying age as the most influential predictor. Educational level and income also played significant roles, indicating that level of education and income levels influence the likelihood of a respondent skipping survey items. The results are presented in Table 4.
4.0. Discussion
In this study, I aimed to address item nonresponse in political questions from the ESS. By using LCA and supervised machine learning techniques, I sought to understand missing data patterns and predict latent class membership using sociodemographic variables. This section discusses the results, interprets the findings, and highlights the implications for future research and survey methodology.
The findings of this LCA reveal the significant variations in political engagement across different latent classes, as captured by the population share and the item conditional probabilities. The High Response class, which accounts for the majority of respondents, is associated with higher engagement levels in political themes. This group’s consistent positive response probabilities across political questions indicate a population segment that is politically informed and active. The high level of engagement in this group reflects the importance of focusing on such respondents for public opinion research, as they contribute reliable data that can inform political analysis and decision-making. Survey designs can be optimized by targeting this group’s preferences and ensuring their continued participation through effective outreach strategies.
In contrast, the Moderate Response class represents individuals who engage with political topics to a lesser extent. These respondents tend to provide more ambiguous or uncertain responses, reflecting a middle-ground stance on political issues. The implications here are twofold: first, the data from this group may introduce some level of noise due to the lack of strong opinions which can undermine the precision of survey findings. Second, these respondents may represent a significant portion of the electorate whose political opinions are not fully formed or whose engagement is passive, thus highlighting the importance of understanding the reasons behind such moderate political engagement. Strategies to engage this group more deeply, such as targeted interventions or clearer survey questions, may improve the quality of the data and reduce the uncertainties in political opinion research.
The Low Response class, associated with a high level of missing, represents politically disengaged individuals. These respondents are less likely to answer political questions, reflecting indifference or a lack of political knowledge. This pattern of disengagement can introduce significant biases in survey data, as the views of these individuals are underrepresented in the final analysis. The underrepresentation of this group is problematic because it risks distorting the accuracy of political surveys, especially when interpreting trends in voter behavior or public opinion (Groves et al., 2009). As these respondents are often excluded from political decision-making and are more likely to abstain from surveys, their absence can lead to the marginalization of important viewpoints. Survey researchers must recognize this gap and develop methods to account for the missing data, such as by incorporating weighting schemes or imputation techniques, to ensure that these voices are better represented.
These results are consistent with existing literature on political disengagement, which suggests that individuals who are less politically engaged tend to skip questions on political topics more frequently (Zhang, 2022). These findings highlight the importance of understanding different response patterns in survey data to improve the quality of political survey research. Identifying these latent classes and their characteristics helps survey researchers identify segments of the population that are more likely to exhibit item nonresponse and further investigate the underlying factors contributing to missing data.
Among the supervised machine learning models, XGBoost demonstrated superior performance, achieving an accuracy of 0.98, precision of 0.99, recall of 0.98, and an F1 score of 0.99. This indicates that XGBoost excels in capturing complex relationships in the data, making it an ideal choice for analyzing survey data in political research, where interactions between multiple variables are often intricate and non-linear (Chen & Guestrin, 2016). The strong performance of Random Forest further underscores the effectiveness of ensemble methods in handling the complexities of survey data (Breiman, 2001). However, the results also suggest important considerations for future research and applications. Despite the strong performance, the Logistic and Lasso Regression models were outperformed by more advanced methods like XGBoost and Random Forest. This highlights that while these simpler models offer interpretability and ease of use, they may not always capture the inherent complexity in political survey data, particularly when non-linear relationships exist between sociodemographic factors and political opinions (James et al., 2021). Therefore, for researchers seeking higher predictive accuracy and the ability to model complex data structures, advanced machine learning techniques like XGBoost and Random Forest should be prioritized.
Moreover, the aggregation of results across multiple imputations demonstrated that imputing class membership multiple times enhances the robustness of the models, accounting for uncertainty in predicted class memberships and ensuring more reliable results. These findings have broader implications for political surveys, indicating that advanced machine learning models combined with robust techniques for handling missing data can lead to more reliable, and insightful analyses of public opinion and political engagement.
The importance scores for the predictors of latent class membership, derived from the Random Forest model in Table 5, provide insights into the factors that influence political engagement and response patterns in surveys. Age was found to be the most important predictor. This aligns with existing research that shows younger individuals tend to exhibit lower levels of political engagement, while older adults are often more involved in political activities (Early et al., 2022). Income was the second most important predictor. This result is also consistent with the literature indicating that individuals with higher incomes are more likely to engage in political activities, as they may have greater access to resources and information that facilitate informed political participation (Brown-Iannuzzi et al., 2017). Education level was also found to be an important predictor of class membership. Education has long been recognized as a key determinant of political participation, with more educated individuals more likely to engage in political processes (Kim, 2023). Educated individuals tend to have higher political knowledge and more informed opinions, which could explain why they are less likely to skip political questions or provide vague responses. Furthermore, education often correlates with increased awareness of civic responsibilities, which contributes to more consistent and accurate responses in surveys.
5.0. Conclusions
This study aimed to explore response patterns to political questions and identify latent classes based on item nonresponse using LCA. The analysis revealed three latent classes: a politically engaged group with low missing data, a moderately engaged group with moderate missing data, and a politically disengaged group with high missing data. These findings provide valuable insight into the varying levels of political engagement across different segments of the population and highlight the importance of understanding nonresponse patterns in survey data. The use of supervised machine learning models, such as Random Forest and XGBoost, effectively predicted latent class membership, with these models outperforming others in terms of accuracy, precision, recall, and F1 score. The application of multiple imputations further strengthened the robustness of the results, showing consistent patterns across the imputed datasets.
However, some limitations of the study should be acknowledged. First, the reliance on self-reported political responses may introduce bias due to social desirability or misinterpretation by respondents. Second, I focused on a limited set of questions and sociodemographic variables that might not capture all factors influencing political behavior and item nonresponse, thus potentially omitting key explanatory variables. The findings are also based on European Social Survey, Belgium data, which may limit the generalizability to other regions or political contexts.
Future research could aim to expand the set of predictors and consider alternative imputation methods to improve the accuracy of latent class predictions. Future studies could also examine the impact of other cultural and societal factors on political participation across different geographic regions, increasing the generalizability of the findings.
Appendix A
Appendix A: Variable Descriptions and Question Wordings
| Variable Name | Full Description | Question Wording | Response Options |
| stfdem | How satisfied are you with the way democracy works in your country? | And on the whole, how satisfied are you with the way democracy works in [country]? | 0–10 scale: 0 = Extremely dissatisfied, 10 = Extremely satisfied; 77=Refusal, 88=Don't know, 99=No answer |
| stfeco | How satisfied are you with the present state of the economy in your country? | On the whole how satisfied are you with the present state of the economy in [country]? | 0–10 scale: 0 = Extremely dissatisfied, 10 = Extremely satisfied; 77=Refusal, 88=Don't know, 99=No answer |
| stfedu | What is your opinion about the current state of education in your country? | Now, using this card, please say what you think overall about the state of education in [country] nowadays? | 0–10 scale: 0 = Extremely bad, 10 = Extremely good; 77=Refusal, 88=Don't know, 99=No answer |
| stfgov | How satisfied are you with the way the national government is doing its job? | Now thinking about the [country] government, how satisfied are you with the way it is doing its job? | 0–10 scale: 0 = Extremely dissatisfied, 10 = Extremely satisfied; 77=Refusal, 88=Don't know, 99=No answer |
| stflife | Overall life satisfaction, from extremely dissatisfied to extremely satisfied. | All things considered, how satisfied are you with your life as a whole nowadays? | 0–10 scale: 0 = Extremely dissatisfied, 10 = Extremely satisfied; 77=Refusal, 88=Don't know, 99=No answer |
| trstprl | Trust in the country's parliament. | How much do you personally trust the parliament? | 0–10 scale: 0 = No trust at all, 10 = Complete trust; 77=Refusal, 88=Don't know, 99=No answer |
| trstlgl | Trust in the legal system. | How much do you personally trust the legal system? | 0–10 scale: 0 = No trust at all, 10 = Complete trust; 77=Refusal, 88=Don't know, 99=No answer |
| trstplc | Trust in the police. | How much do you personally trust the police? | 0–10 scale: 0 = No trust at all, 10 = Complete trust; 77=Refusal, 88=Don't know, 99=No answer |
| trstplt | Trust in politicians. | How much do you personally trust politicians? | 0–10 scale: 0 = No trust at all, 10 = Complete trust; 77=Refusal, 88=Don't know, 99=No answer |
| trstprt | Trust in political parties. | How much do you personally trust political parties? | 0–10 scale: 0 = No trust at all, 10 = Complete trust; 77=Refusal, 88=Don't know, 99=No answer |
| trstep | Trust in the European Parliament. | How much do you personally trust the European Parliament? | 0–10 scale: 0 = No trust at all, 10 = Complete trust; 77=Refusal, 88=Don't know, 99=No answer |
| trstun | Trust in the United Nations. | How much do you personally trust the United Nations? | 0–10 scale: 0 = No trust at all, 10 = Complete trust; 77=Refusal, 88=Don't know, 99=No answer |
| imsmetn | Support for allowing immigrants of the same race or ethnicity as the majority. | To what extent do you think [country] should allow people of the same race or ethnic group as most [country] people to come and live here? | 1 = Allow many, 2 = Allow some, 3 = Allow a few, 4 = Allow none; 7=Refusal, 8=Don't know, 9=No answer |
| imdfetn | Support for allowing immigrants of a different race or ethnicity from the majority. | How about people of a different race or ethnic group from most [country] people? | 1 = Allow many, 2 = Allow some, 3 = Allow a few, 4 = Allow none; 7=Refusal, 8=Don't know, 9=No answer |
| impcntr | Support for allowing immigrants from poorer countries outside Europe. | How about people from the poorer countries outside Europe? | 1 = Allow many, 2 = Allow some, 3 = Allow a few, 4 = Allow none; 7=Refusal, 8=Don't know, 9=No answer |
| imbgeco | Perceived economic impact of immigration on the country. | Would you say it is generally bad or good for [country]’s economy that people come to live here from other countries? | 0–10 scale: 0 = Bad for the economy, 10 = Good for the economy; 77=Refusal, 88=Don't know, 99=No answer |
| imueclt | Perceived cultural impact of immigration on the country. | Would you say that [country]’s cultural life is generally undermined or enriched by people coming to live here from other countries? | 0–10 scale: 0 = Cultural life undermined, 10 = Enriched; 77=Refusal, 88=Don't know, 99=No answer |
| edulvlb | Highest level of education attained by the respondent. | What is the highest level of education you have successfully completed? | Categorical ISCED codes (0–800, 5555=Other, 7777=Refusal, 8888=Don't know, 9999=No answer) |
| gndr | Gender of the respondent. | CODE SEX, respondent | 1 = Male, 2 = Female; 9=No answer |
| agea | Age of the respondent (in years). | Age of respondent, calculated | Numeric (in years); 999 = Not available |
| emplrel | Employment relationship of the respondent in their main job. | In your main job are/were you... | 1 = Employee, 2 = Self-employed, 3 = Family business; 6=NA, 7=Refusal, 8=Don't know, 9=No answer |
| rlgdnbe | Religious affiliation of the respondent (Belgium). | Which one? (Belgium) | 1 = Roman Catholic, 2 = Protestant, ..., 8 = Other non-Christian religion; 7777=Refusal, 9999=No answer |
References
- Barkho, W., Carnes, N. C., Kolaja, C. A., Tu, X. M., Boparai, S. K., Castañeda, S. F., Sheppard, B. D., Walstrom, J. L., Belding, J. N., & Rull, R. P. (2024). Utilizing machine learning to predict participant response to follow-up health surveys in the Millennium Cohort Study. Scientific Reports, 14, 25764. [CrossRef]
- Brandenburger, M., & Schwichow, M. (2023). Utilizing Latent Class Analysis (LCA) to Analyze Response Patterns in Categorical Data. In X. Liu & W. J. Boone (Eds.), Advances in Applications of Rasch Measurement in Science Education (pp. 123–156). Springer International Publishing. [CrossRef]
- Breiman, L. (2001). Random Forests. Machine Learning, 45(1), 5–32. [CrossRef]
- Brown-Iannuzzi, J. L., Lundberg, K. B., & McKee, S. (2017). The politics of socioeconomic status: How socioeconomic status may influence political attitudes and engagement. Current Opinion in Psychology, 18, 11–14. [CrossRef]
- Burden, B. C., & Ono, Y. (2021). Ignorance is Bliss? Age, Misinformation, and Support for Women’s Representation. Public Opinion Quarterly, 84(4), 838–859. [CrossRef]
- Buskirk, T. D., Kirchner, A., Eck, A., & Signorino, C. S. (2018). An Introduction to Machine Learning Methods for Survey Researchers. Survey Practice, 11(1). [CrossRef]
- Chen, T., & Guestrin, C. (2016). XGBoost: A Scalable Tree Boosting System. Proceedings of the 22nd ACM SIGKDD International Conference on Knowledge Discovery and Data Mining, 785–794. [CrossRef]
- Early, A. S., Smith, E. L., & Neupert, S. D. (2022). Age, education, and political involvement differences in daily election-related stress. Current Psychology (New Brunswick, N.j.), 1–10. [CrossRef]
- European Social Survey. (2024). The European Social Survey in Belgium. https://europeansocialsurvey.org/about/country-information/belgium/french.
- Groves, R. M., Jr, F. J. F., Couper, M. P., Lepkowski, J. M., Singer, E., & Tourangeau, R. (2009). Survey Methodology. John Wiley & Sons.
- Huff, C., & Tingley, D. (2015). “Who are these people?” Evaluating the demographic characteristics and political preferences of MTurk survey respondents. Research & Politics. [CrossRef]
- James, G., Witten, D., Hastie, T., & Tibshirani, R. (2021). An Introduction to Statistical Learning: With Applications in R. Springer US. [CrossRef]
- Jamieson, K. H., Lupia, A., Amaya, A., Brady, H. E., Bautista, R., Clinton, J. D., Dever, J. A., Dutwin, D., Goroff, D. L., Hillygus, D. S., Kennedy, C., Langer, G., Lapinski, J. S., Link, M., Philpot, T., Prewitt, K., Rivers, D., Vavreck, L., Wilson, D. C., & McNutt, M. K. (2023). Protecting the integrity of survey research. PNAS Nexus, 2(3), pgad049. [CrossRef]
- Ji, J., Kim, J., & Kim, Y. (2024). Predicting Missing Values in Survey Data Using Prompt Engineering for Addressing Item Non-Response. Future Internet, 16(10), Article 10. [CrossRef]
- Kern, C., Klausch, T., & Kreuter, F. (2019). Tree-based Machine Learning Methods for Survey Research. Survey Research Methods, 13(1), 73–93.
- Kern, C., Weiß, B., & Kolb, J.-P. (2023). Predicting Nonresponse in Future Waves of a Probability-Based Mixed-Mode Panel with Machine Learning*. Journal of Survey Statistics and Methodology, 11(1), 100–123. [CrossRef]
- Kim, Y. (2023). Absolutely Relative: How Education Shapes Voter Turnout in the United States. Social Indicators Research, 1–23. [CrossRef]
- Loh, W.-Y. (2011). Classification and regression trees. WIREs Data Mining and Knowledge Discovery, 1(1), 14–23. [CrossRef]
- Montagni, I., Cariou, T., Tzourio, C., & González-Caballero, J.-L. (2019). “I don’t know”, “I’m not sure”, “I don’t want to answer”: A latent class analysis explaining the informative value of nonresponse options in an online survey on youth health. International Journal of Social Research Methodology, 22(6), 651–667. [CrossRef]
- Naldi, L., & Cazzaniga, S. (2020). Research Techniques Made Simple: Latent Class Analysis. Journal of Investigative Dermatology, 140(9), 1676-1680.e1. [CrossRef]
- Nickel, A., & Weber, W. (2024). Measurement Invariance and Quality of Attitudes Towards Immigration in the European Social Survey. Methods, Data, Analyses, 18(2), Article 2. [CrossRef]
- Ouattara, E., & Steenvoorden, E. (2024). The Elusive Effect of Political Trust on Participation: Participatory Resource or (Dis)incentive? Political Studies, 72(4), 1269–1287. [CrossRef]
- Taherdoost, H., & Madanchian, M. (2024). (PDF) The Impact of Survey Response Rates on Research Validity and Reliability. In ResearchGate. https://www.researchgate.net/publication/384313577_The_Impact_of_Survey_Response_Rates_on_Research_Validity_and_Reliability.
- Uddin, S., Khan, A., Hossain, M. E., & Moni, M. A. (2019). Comparing different supervised machine learning algorithms for disease prediction. BMC Medical Informatics and Decision Making, 19, 281. [CrossRef]
- Yao, Y., Zhang, S., & Xue, T. (2022). Integrating LASSO Feature Selection and Soft Voting Classifier to Identify Origins of Replication Sites. Current Genomics, 23(2), 83–93. [CrossRef]
- Zhang, W. (2022). Political Disengagement Among Youth: A Comparison Between 2011 and 2020. Frontiers in Psychology, 13, 809432. [CrossRef]
Figure 1.
Latent Class Model Fit Statistics.
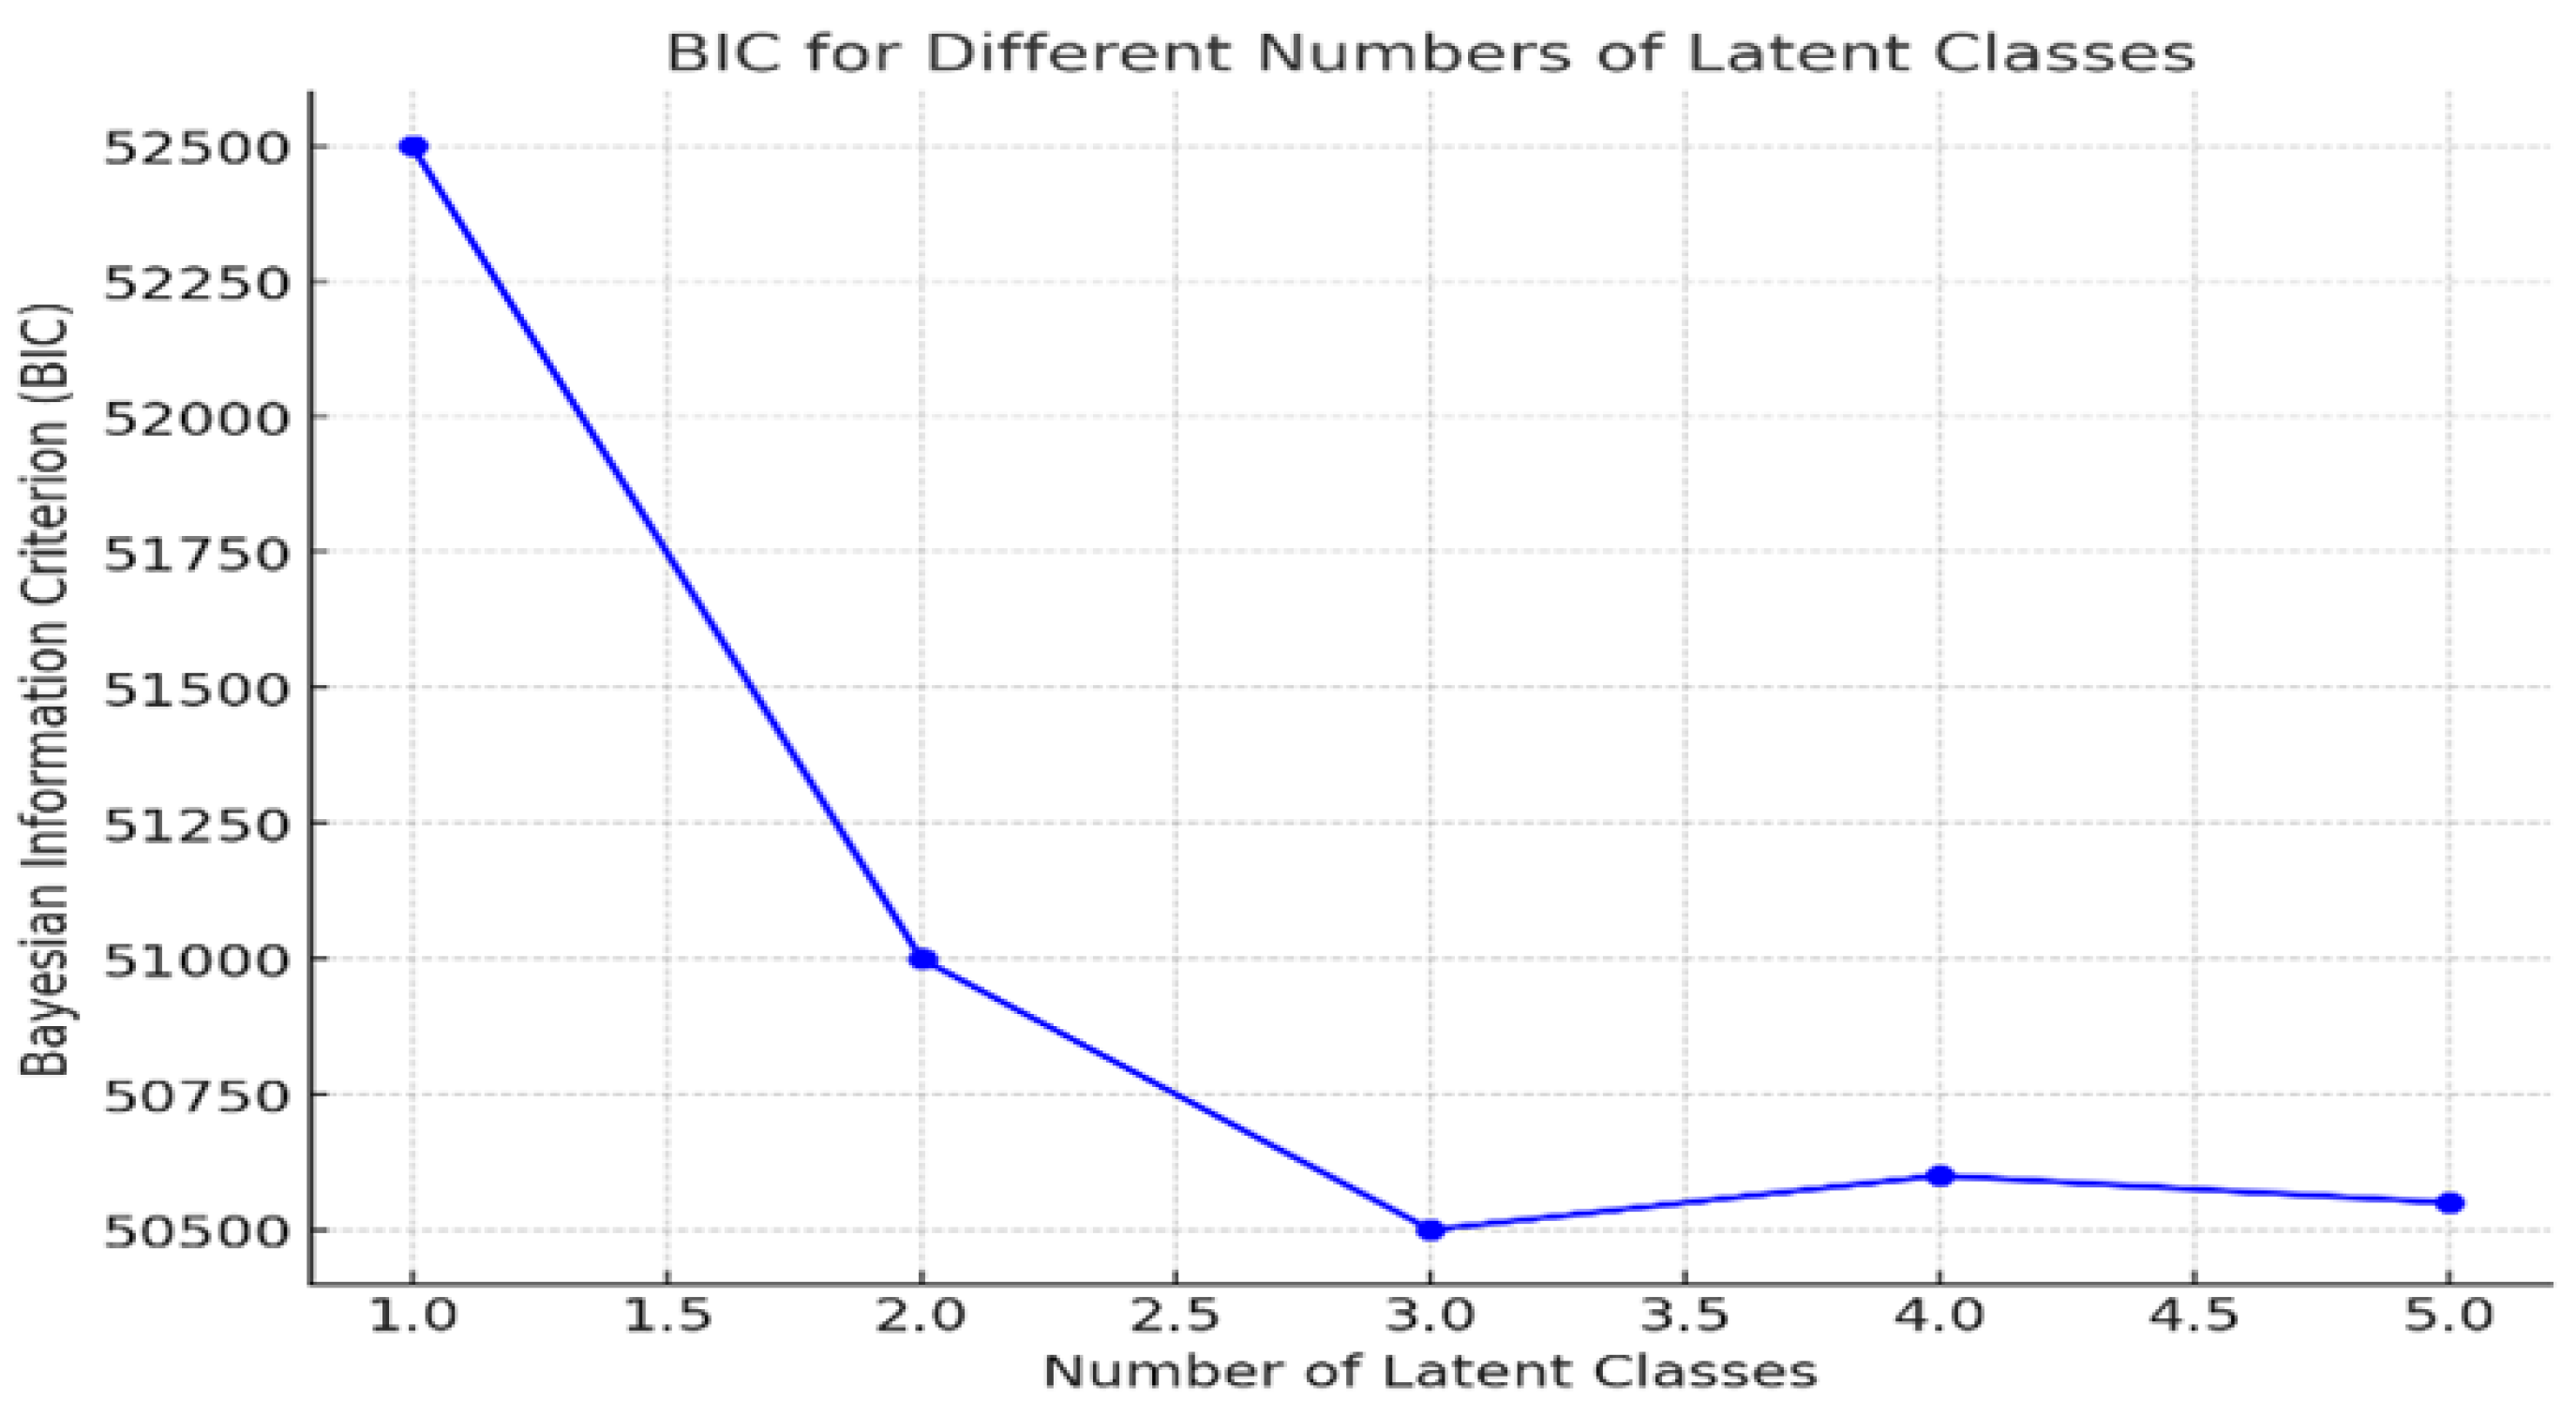

Table 1.
Tuning Parameters for Various Models.
| Model | Parameters |
| Logistic Regression | family = binomial |
| Lasso Regression | alpha = 1, lambda = 10^seq(-3, 3, 0.5) |
| Decision Tree | cp = 0.001 |
| Random Forest | mtry = (2, 4, 6) |
| KNN | k = (3, 5, 7, 9, 11) |
| XGBoost | grounds = (100, 200, 500), eta = (0.1, 0.01), max_depth = (3, 5, 7), gamma = 0, min_child_weight = 1 |
Table 2.
Average Conditional Item-Response Probabilities by Latent Class for Political Themes.
| Latent Class | Trust in Institutions | Satisfaction Measures | Immigration Attitudes |
| Low Missing / High Response | 0.81 | 0.89 | 0.87 |
| Moderate Missing / Moderate Response | 0.55 | 0.53 | 0.58 |
| High Missing / Low Response | 0.12 | 0.15 | 0.13 |
Table 3.
Performance Measures Across Multiple Imputed Datasets (5 Imputations).
| Model | Average Accuracy | Average Precision | Average Recall | Average F1 Score |
| Logistic Regression | 0.91 | 0.91 | 0.90 | 0.91 |
| Lasso Regression | 0.90 | 0.90 | 0.90 | 0.90 |
| Decision Tree | 0.87 | 0.87 | 0.87 | 0.86 |
| XGBoost | 0.98 | 0.99 | 0.98 | 0.99 |
| Random Forest | 0.95 | 0.96 | 0.95 | 0.94 |
| KNN | 0.76 | 0.78 | 0.77 | 0.77 |
Table 4.
Important Predictors for Latent Class Membership (Random Forest).
| Predictor | Importance Score |
| Age | 0.28 |
| Gender | 0.13 |
| Education Level | 0.20 |
| Income | 0.25 |
| Employment Status | 0.10 |
| Marital Status | 0.05 |
| Religiosity | 0.04 |
Disclaimer/Publisher’s Note: The statements, opinions and data contained in all publications are solely those of the individual author(s) and contributor(s) and not of MDPI and/or the editor(s). MDPI and/or the editor(s) disclaim responsibility for any injury to people or property resulting from any ideas, methods, instructions or products referred to in the content. |
© 2025 by the authors. Licensee MDPI, Basel, Switzerland. This article is an open access article distributed under the terms and conditions of the Creative Commons Attribution (CC BY) license (http://creativecommons.org/licenses/by/4.0/).
Copyright: This open access article is published under a Creative Commons CC BY 4.0 license, which permit the free download, distribution, and reuse, provided that the author and preprint are cited in any reuse.


