Submitted:
13 April 2025
Posted:
14 April 2025
You are already at the latest version
Abstract
Short-term research matters today because: 1) pre-pandemic data may obscure new paradigms; 2) new studies should build on rather than duplicate long-term work; and 3) timely policy is crucial. However, short-term studies involve limited data. We examine inflation’s impact on income groups to explore methodological combinations and sequencing for short-term research. First, we assess the effectiveness of quantitative (multiple and quantile regression) and qualitative (thematic analysis of reports) approaches. We evaluate how sequencing methods influences insights, avoiding researcher bias towards preferred sequences by prompting a large language model (LLM) multiple times to interpret the combined results in each sequence: quant→qual and qual→quant. We then compare outputs. Next, we conduct small-scale, open- and closed-ended surveys and repeat the LLM sequencing experiment, this time with closed→open-ended and open→closed-ended instructions. Quantitative models link income to debt and unemployment; qualitative findings show varied views on inflation control and consumer behavior across groups. Surveys show inflation shapes coping and policy trust—especially for middle-income earners, whose unique struggles are lost when grouped with low-income peers by analyses. The quant→qual and closed→open-ended sequences provided more insightful outputs with causal connections and contextualization. Theoretically, this paper provides methodological guidelines; practically, it provides policy insights.
Keywords:
mixed methods
; short-term research
; inflation
; income inequality
; method sequencing
; quantile regression
1. Introduction
Recent studies emphasize the critical importance of short-term research in capturing the economic consequences of sudden disruptions such as COVID-19. For instance, Knicker et al. (2024) emphasize the role of short-term volatility modeling in capturing economic consequences of sudden disruptions. Similarly, the Harding et al.’s (2023) paper stresses the need for adaptive, timely analysis to support responsive policymaking during periods of economic flux. Other research, such as Aspachs et al. (2021) and Furceri et al. (2021), highlight that the socioeconomic impacts of the pandemic unfolded rapidly and unevenly, warranting immediate, fine-grained study rather than long-range, aggregated assessments.
However, limited data points present methodological challenges in short-term research, necessitating mixed methods. As such, we aim to provide a methodological blueprint for other researchers to follow.
We do so by focusing on an important topic: inflation’s impact on income distribution. We believe this is a suitable candidate for short-term research given that a volume of research has already been conducted in the past on this topic, and recent geopolitical changes post pandemic such as the introduction of Trump tariffs has necessitated a more localized focus on the recent past. We analyze the US because of the ease of data availability and its influence on global economics.
Inflation has long been a central concern in economic research, with substantial evidence linking it to rising inequality. A meta-analysis by Sintos (2023) consolidates findings from 124 studies, revealing a consistent positive correlation between inflation and income disparity. Complementing this, the Federal Reserve Bank of Dallas finds that high inflation disproportionately burdens low-income households, deepening financial stress and exacerbating existing inequities (Jayashankar and Murphy 2023). Yet, the precise mechanisms through which inflation affects various income strata remain contested, particularly in the wake of structural shocks like the COVID-19 pandemic.
To address the challenges established by previous research in the context of methodological guidance for short-term research, we combine the use of macroeconomic regression models (quantitative) and thematic analysis (qualitative) using secondary data to check whether each provides insights. We then use an LLM to check whether it interprets the combined results differently when presented with different sequences in prompts (quantitative>qualitative and qualitative>quantitative) and instructed to interpret them in the given order. We have provided the details of the prompts and chat transcripts for complete transparency and reproducibility. Next, we conduct a closed-ended and an open-ended survey to gather individual inputs and conduct a similar LLM experiment to the first one, instructing the model to interpret the overall survey results in a particular order (closed-ended>open-ended and open-ended>closed-ended).
Specifically, our research questions (RQ) are as follows:
RQ 1: Is quantitative research helpful despite limited data points for short-term studies?
RQ 2: Does qualitative research add value?
RQ 3: Do microeconomic, small-sample surveys help us humanize research?
RQ 4: Which sequencing (quantitative>qualitative or qualitative>quantitative; closed-ended>open-ended or open-ended>closed-ended) is preferable and more insightful?
2. Materials and Methods
2.1. RQ 1: Is Quantitative Research Helpful Despite Limited Data Points for Short-Term Studies?
For the quantitative analysis, we used publicly available data for February 2024-2025. The data sources are listed below:
- Income: U.S. Bureau of Labor Statistics (BLS) (Hourly wage*8*22)
- Unemployment Rate: Federal Reserve Economic Data (FRED) (U.S. Bureau of Labor Statistics)
- Wage Growth: U.S. Bureau of Labor Statistics (BLS)*
- Consumer Spending [personal consumption expenditures (PCE)]: U.S. Bureau of Economic Analysis (BEA)
- Debt-to-Income Ratio (DTI): Federal Reserve Economic Data (FRED) (Board of Governors of the Federal Reserve System (US))
- Inflation Rate: Trading Economics1
- Trump-Era Tariffs: Atlantic Council Trump Tariff Tracker
- Income Grouping: Calculated based on percentile distribution of income data**
* Calculated using the formula ((Current hourly average wage-previous hourly average wage)/Previous hourly average wage)*100
** For the purposes of this study, income groups are broadly categorized based on percentiles: lower-income (bottom 25th percentile), middle-income (25th to 75th), and higher-income (above 75th).
The data gathered from the sources is available online at https://docs.google.com/document/d/1sw6pnKU4lKEojb9Y68Y_45SpaE_vp5l5/edit?usp=sharing&ouid=112905476201508626530&rtpof=true&sd=true.
First, we ran a baseline multiple linear regression to gain insights into how inflation, wage growth, debt-to-income ratio (DTI), consumer spending, unemployment, and Trump-era tariffs impact income levels across different income strata in the US. We introduced an interaction term between inflation rate and income to focus on the differential effects of inflation on income. We then ran a quantile regression at the 25th percentile to gain insights into how inflation and other macroeconomic factors impact lower-income groups. We ran a separate regression to examine the relationship between Trump’s tariffs and the inflation rate. We conducted tests for heteroskedasticity and multicollinearity for all models, which indicated their robustness.
2.2. RQ 2: Does Qualitative Research Add Value?
For the qualitative analysis, we conducted thematic analysis utilizing Atlas.ti 2025 to systematically examine key policy documents on inflation-related policies, consumer behavior, and social impacts. This methodological approach was chosen not only for its ability to organize information but for its capacity to reveal cross-cutting patterns, establish cause-and-effect relationships, and provide a multi-perspective interpretation of inflation’s impact (Friese et al. 2018).
The selection of sources ensures a balanced and interdisciplinary perspective by integrating national, global, and developmental viewpoints. The OECD Economic Surveys: United States (2024) provides a detailed policy-oriented assessment of U.S. economic conditions, particularly in relation to inflation control, monetary policies, and inequality. The World Economic Outlook (2025) by the IMF offers a cross-country comparative analysis of inflation trends, consumer confidence, and macroeconomic stability. The Poverty, Prosperity, and Planet Report (2024) by the World Bank introduces a social and environmental lens, emphasizing poverty, inequality, and sustainable economic development.
Our thematic analysis aimed to ensure that conclusions are not based on isolated studies but rather on validated economic patterns observed across sources. By systematically mapping inflation’s effects on wages, savings, consumption, and government responses, this approach avoids oversimplification and enhances the depth, accuracy, and applicability of the findings.
2.3. RQ 3: Do Microeconomic, Small-Sample Surveys Help Us Humanize Research?
We conducted two surveys targeting U.S.-based respondents. One was designed to be more quantitative, collecting structured data on income, perceived financial strain, changes in expenses, and opinions on policy. The other survey was qualitative in nature, inviting open-ended responses to explore personal narratives and lived experiences related to inflation.
The quantitative survey received 65 responses and included questions such as: How much have your expenses increased due to inflation? On a scale of 1–5, how financially strained do you feel compared to last year? Do you believe government policies have effectively managed inflation? The qualitative survey received 52 responses and featured more reflective prompts, including: What is one personal financial decision you had to rethink because of inflation? Describe how inflation affects your life using a metaphor. What do you think is the biggest unexpected impact of inflation? All responses were collected anonymously to protect participants’ privacy and encourage candid feedback. The full dataset is available online at https://drive.google.com/drive/folders/15DHnBpF_GcBeW4MGIExPQb_gG2I3w7t8?usp=sharing.
This design reflects an increasingly accepted approach in mixed-methods research—especially in volatile economic and post-crisis contexts—where small, agile samples are used to capture emerging dynamics with policy relevance (Vindrola-Padros et al. 2020).
2.4. RQ 4: Which Sequencing (Quantitative>Qualitative or Qualitative>Quantitative; Closed-Ended>Open-Ended or Open-Ended>Closed-Ended) is Preferable and More Insightful?
We tested whether the order in which the regression and thematic analyses are analyzed—quantitative first or qualitative first—affects the conclusions drawn. We used GPT to simulate two analysis sequences:
- Set 1: Quantitative → Qualitative
- Set 2: Qualitative → Quantitative
To prevent framing bias, we didn’t label the datasets as “quantitative” or “qualitative”/ “closed-ended” or “open-ended”—GPT received them unlabeled and was asked to integrate and interpret them. This helped us observe whether the analytical direction or interpretive emphasis shifts depending on which dataset is presented first. While researchers (including ourselves) may often unconsciously prefer one form of data over another (for example, we might be trained to treat qualitative narratives as illustrations of already-validated quantitative models—or vice versa), using GPT helped us step outside these habits and examine both pathways on equal footing.
The complete Set 1 with GPT conversation links is available online at https://docs.google.com/document/d/1vXyYHJ-n1qgHe_cmoVZwjE0DOuUPIKZE/edit?usp=sharing&ouid=100923077272312359114&rtpof=true&sd=true. The complete Set 2 with GPT conversation links is available online at https://docs.google.com/document/d/1QldpM1cmjVL4cAfzIKJO3u86LGD8vc18/edit?usp=sharing&ouid=100923077272312359114&rtpof=true&sd=true.
A simplified example of Set 1 (Quant→Qual): In the same prompt, we first gave GPT the regression result summary. Then we gave it a thematic synthesis from the analyzed reports. We asked it to provide an overall interpretation after analyzing the information in the given order. We did this five times.
In contrast, in Set 2 (Qual→Quant): In the same prompt, we first provided GPT with the thematic reports. Then we shared the quantitative regression. We asked it to provide an overall interpretation after analyzing the information in the given order. We did this five times.
We then tested whether the order in which survey results are analyzed—closed- or open-ended first—affects the conclusions drawn. We used GPT to simulate two analysis sequences:
- Set 1: Closed-ended → Open-ended
- Set 2: Open-ended → Closed-ended
The complete Set 1 with GPT conversation links is available online at https://docs.google.com/document/d/1ZZT6uCk4MlJWhc69Sjbf3a9RxhxdQQuE/edit?usp=sharing&ouid=100923077272312359114&rtpof=true&sd=true. The complete Set 2 with GPT conversation links is available online at https://docs.google.com/document/d/1dGKnyz0MeNMIPE4lP9ddmkpZY8TaELU8/edit?usp=sharing&ouid=100923077272312359114&rtpof=true&sd=true.
A simplified example of Set 1 (Closed→Open-ended): In the same prompt, we first gave GPT the closed-ended survey summary. Then we gave it the open-ended survey summary. We asked it to provide an overall interpretation after analyzing the information in the given order. We did this five times.
In contrast, in Set 2 (Open→Closed-ended): In the same prompt, we first provided GPT with open-ended survey results. Then we shared the closed-ended survey results. We asked it to provide an overall interpretation after analyzing the information in the given order. We did this five times.
We then analyzed all outputs to understand whether the order of analysis impacts the depth, clarity, or direction of insights.
It is important to clarify that while the structure of this paper follows a Quant→Qual and Closed→Open-ended sequence, the prompts were presented without our sequenced interpretations to prevent bias. This can be confirmed by perusing the conversations that can be accessed via links shared above.
3. Results
3.1. RQ 1: Is Quantitative Research Helpful Despite Limited Data Points for Short-Term Studies?
Dependent Variables:
- 1.
- Income
Primary dependent variable in the baseline, interaction, quantile, and robustness models.
- 2.
- Inflation
Dependent variable in the tariff impact regression model.
Independent Variables:
- Inflation Rate
- Wage Growth
- Debt-to-Income Ratio
- Consumer Spending
- Unemployment Rate
- Trump Tariffs
- Income Group (used in interaction term)
- Inflation Rate × Income Group (interaction term to assess differential effects of inflation across income levels)
As shown in Table 1, the baseline model indicated the following:
- Inflation Rate (β = 79.74, p = 0.0165): A statistically significant positive coefficient suggests that higher inflation is correlated with an increase in income. This could indicate nominal wage adjustments in response to inflation, though real income effects should be further examined.
- Wage Growth (β = -92.49, p = 0.1085): The negative but statistically insignificant coefficient suggests that wage growth does not strongly predict income changes. This could imply that wage increases have not kept pace with inflation or that real wage stagnation limits its effect.2
- Debt-to-Income Ratio (β = 257.42, p = 0.0000): A highly significant positive relationship indicates that individuals or households with higher debt-to-income ratios tend to report higher income levels. This seems to reflect debt access rather than debt necessity.
- Consumer Spending (β = -81.82, p = 0.0040): The significant negative coefficient indicates that increased consumer spending is associated with lower income. While high-income groups tend to spend more in absolute terms, this finding may reflect financial pressure among lower- and middle-income groups—where spending, especially on essentials, rises despite stagnant earnings. Future research could explore spending-to-income ratios to capture this relationship with greater nuance.3
- Unemployment Rate (β = 388.76, p = 0.0016): A strong positive relationship suggests that higher unemployment is linked to increased income levels. While counterintuitive at first glance—and seemingly at odds with traditional expectations such as the Phillips Curve—this result may reflect sample-specific dynamics or compositional effects. For instance, during certain economic adjustments, job losses may be concentrated in lower-wage sectors, skewing the income distribution of those who remain employed upward. This does not imply that unemployment causes higher income overall, but that in the observed data, the employed sample includes a relatively higher proportion of middle- to high-income earners. Additionally, in a post-COVID context shaped by gig work, remote employment, and selective sectoral recovery, standard relationships between labor indicators and income may appear disrupted or reconfigured. Future research could disaggregate employment effects further, distinguishing between temporary layoffs, underemployment, or sector-specific shocks.4
- Trump Tariffs (β = -1.37, p = 0.1867): The negative but statistically insignificant coefficient suggests that tariff-driven price changes have not had a direct significant impact on income levels, though their broader inflationary effects may play a role.
- An R-squared of 0.9847 indicates that the model explains 98.47% of the variation in income, suggesting strong explanatory power.
- The F-statistic (p = 0.000035) confirms that the overall regression is statistically significant.
- The results of the heteroscedasticity test indicate no evidence of heteroscedasticity in the model. The null hypothesis (H₀) assumes constant variance, and the test yielded a chi-square value of 0.00 with a corresponding p-value of 0.9712, which is well above the conventional significance level of 0.05. This suggests that the assumption of homoscedasticity holds true. Additionally, the multicollinearity test revealed that none of the coefficients had a centered variance inflation factor (VIF) value greater than 10 (Table 2), indicating that multicollinearity is not a concern in the model.
The interaction term between inflation rate and income group (Table 3) is insignificant (β = 2.90, p = 0.851), indicating that inflation does not affect income groups differently. This suggests that inflation-driven wage adjustments or cost-of-living changes are relatively uniform across income levels. This result is crucial for the research objective of assessing how inflation impacts different income strata in the U.S. It implies that inflationary pressures do not disproportionately benefit or harm specific income groups. Further robustness checks, including quantile regression, may be needed to explore non-linear effects across different income percentiles.
As shown in Table 4, the interaction model shows no signs of multicollinearity, as indicated by the absence of any concerning variance inflation factor (VIF) values. Additionally, the heteroscedasticity test supports the assumption of constant variance. The null hypothesis (H₀) assumes constant variance, and the test yielded a chi-square value of 0.05 with a p-value of 0.8247. Since the p-value is well above the 0.05 threshold, there is no evidence of heteroscedasticity in the model.
As shown in Table 5, the quantile regression at the 25th percentile provides insights into how inflation and other macroeconomic factors impact lower-income groups. The debt-to-income ratio (β = 251.66, p = 0.001) is the only significant predictor, suggesting that for lower-income individuals, an increasing debt burden is strongly associated with higher reported income, possibly due to reliance on credit. Inflation (β = 76.56, p = 0.780) and wage growth (β = -153.81, p = 0.674) remain insignificant, indicating that lower-income earners do not experience substantial wage adjustments in response to inflation. The consumer spending effect is negative (β = -111.62, p = 0.155), implying that lower-income groups may reduce spending when inflationary pressures rise, affecting overall economic activity. These findings align with the research objective of understanding how inflation and financial constraints disproportionately affect different income groups, highlighting that lower-income individuals are more vulnerable to debt burdens rather than benefiting from wage adjustments.
Table 6 reveals that the robust model explains 98.48% of the variation in income (R² = 0.9848). Debt-to-income ratio (DTI) and unemployment rate significantly impact income, with DTI (β = 257.42, p = 0.000) having the strongest effect. Unemployment (β = 388.77, p = 0.020) also has a significant positive effect. Consumer spending negatively affects income (β = -81.83, p = 0.024). Inflation rate, wage growth, and Trump’s tariffs are not statistically significant (p > 0.1). The constant term is not significant (p = 0.091). Despite strong overall fit, high standard errors suggest potential multicollinearity or small sample bias.
As seen in Table 7, the final regression examines the relationship between Trump’s tariffs and the inflation rate. The model explains 23.74% of the variation in inflation (R² = 0.2374), though the effect is not highly significant (p = 0.091). The coefficient for tariffs (β = 0.0276) suggests that a one-unit increase in tariffs is associated with a 0.0276 increase in inflation. However, with a wide confidence interval (-0.0052 to 0.0605), the effect is uncertain. This aligns with economic theories suggesting tariffs can raise prices but may not be the sole inflation driver. Further analysis, including interaction models, can refine these insights on inflation’s impact across income strata.5
Additionally, the trend graph (Figure 1)6 shows a steady increase in income from February 2024 to February 2025. The growth appears linear, suggesting consistent upward movement without major fluctuations. This indicates stable income growth over time, possibly driven by economic factors such as wage increases, employment trends, or inflation adjustments.
3.2. RQ 2: Does Qualitative Research Add Value?
For the qualitative analysis, the following table (Table 8) synthesizes key economic themes and insights from three major reports, highlighting their contributions to understanding inflation control, consumer behavior, and social inequality. Each source provides a distinct perspective, enhancing the analysis of global and national economic dynamics.
The OECD Economic Surveys: United States 2024 contributes a detailed, policy-focused analysis of U.S. economic conditions, particularly in inflation control, monetary adjustments, and fiscal consolidation, while also examining how income inequality influences economic stability and growth. In contrast, the Poverty, Prosperity, and Planet Report 2024 expands the discussion beyond macroeconomic metrics by integrating social and environmental dimensions, linking economic policies to global poverty reduction, inequality, and sustainable development. Meanwhile, the World Economic Outlook 2025 provides a comprehensive, cross-country perspective, analyzing divergent inflation trends, shifts in consumer behavior, and the varying monetary policy responses of different nations—offering critical insights into global economic interdependencies. Together, these sources create a multi-layered understanding of contemporary economic issues, from national policy impacts to worldwide socioeconomic and environmental challenge (Table 9).
All three sources examine the interplay between economic policies and consumer behavior, while also assessing the broader societal effects, such as inequality and economic growth. However, they differ in scope and emphasis: the OECD report offers a U.S.-centric analysis, detailing national monetary and fiscal policies alongside their social consequences; the World Economic Outlook takes a global macroeconomic perspective, comparing inflation trends and policy responses across countries without deep social analysis; and the World Bank report bridges economic trends with global development challenges, explicitly linking policy impacts to poverty, inequality, and sustainability. Thus, while all three explore policy-economic dynamics, their focus ranges from national specifics (OECD) to worldwide comparisons (IMF) to socio-economic development (World Bank).
A key trend across recent economic research is the expanding role of fiscal policies in steering economic recovery and controlling inflation, with governments worldwide adopting more proactive measures. Another prominent pattern is the rising influence of consumer behavior as a major economic driver, particularly due to lasting shifts caused by global disruptions such as the pandemic—making consumer confidence and spending central to growth projections. Additionally, there is a heightened policy focus on inequality, as economists and institutions increasingly recognize its systemic effects on economic stability, pushing for inclusive growth strategies in fiscal and monetary decision-making. These trends highlight a broader shift toward integrating macroeconomic management with social equity and behavioral insights, reflecting a more holistic approach to global economic challenges. The following concept clouds (Figure 1, Figure 2 and Figure 3; prepared using Atlas.ti 2025 Concept clouds) capture the key thematic trends.
3.3. RQ 3: Do Microeconomic, Small-Sample Surveys Help Us Humanize Research?
The closed-ended survey results showed that middle-income groups ($1,500–$5,000) experienced sharper increases in living costs, with 40% reporting 10–20% expense hikes, while lower-income groups mostly faced moderate rises of 5–10%. Financial strain scores increased with income, peaking at an average of 2.6 among middle earners—suggesting that inflation may be eroding their discretionary income more significantly. Wage stagnation also hit the middle-income group hardest, with 80% stating their salaries hadn’t kept pace with inflation, compared to 58% in lower-income brackets. Interestingly, lower-income respondents expressed more trust in government efforts (64–72%), possibly due to receiving direct aid, while only 40% of middle-income earners shared that trust.
The open-ended survey results revealed distinct coping strategies and perceptions across income groups. Lower-income respondents reported cutting non-essentials like dining out or travel, postponing life events, and experiencing survival-level anxiety. In contrast, middle-income individuals focused on preserving lifestyle quality by switching to store brands, delaying large purchases, and taking on side gigs. Policy preferences also diverged: lower-income groups favored direct government aid such as wage hikes and rent control, while middle-income respondents leaned toward structural reforms like tax relief and price regulation. Tipping points included housing, where rent consumed over 40% of income for lower earners, while some middle-income households managed through refinancing. Budgeting stress over food and transport was widespread, but food insecurity hit the lower-income group hardest. Savings and debt data revealed a stark contrast—many lower-income individuals had no financial cushion, while middle-income buffers were rapidly shrinking. Psychologically, both groups reported constant anxiety: for lower-income respondents, it stemmed from day-to-day survival; for middle-income earners, it was tied to the erosion of stability and the inability to plan for the future. Overall, inflation was not just a financial stressor but a major barrier to long-term progress and upward mobility.
3.4. RQ 4: Which Sequencing (Quantitative>Qualitative or Qualitative>Quantitative; Closed-Ended>Open-Ended or Open-Ended>Closed-Ended) Is Preferable and More Insightful?
Several GPT-generated phrases show that it performed better in the quantitative>qualitative sequencing:
- “By synthesizing the empirical findings of Analysis 1 and the thematic insights from Analysis 2, we can develop a more comprehensive understanding of inflation’s multifaceted effects…”
-
“This financial strain exacerbates economic inequality and limits upward mobility.”(A conclusion grounded in both quantitative DTI patterns and qualitative themes like savings depletion and constrained consumption.)
-
“Consumer spending’s significant negative impact on income… signals financial stress and decreased economic participation, further reinforcing inequality.”(Showing alignment between regression trends and macro-level social impacts.)
-
“A key anomaly in Analysis 1 is that higher unemployment rates are positively correlated with income… Analysis 2 provides context…”(An example of one dataset contextualizing another.)
- Political Implications
Qual → Quant:
“Analysis 1 discusses inflation’s role in rising inequality, social unrest, and housing disparities—themes not explicitly addressed in Analysis 2 but indirectly supported by its findings... including heightened protests and policy shifts.”
Quant → Qual:
“Additionally, Analysis 2’s findings on political unrest complement Analysis 1’s insights on financial strain, reinforcing the argument that inflation is not merely an economic issue but a broader societal challenge…”
Why Quant → Qual is Stronger:
The Qual → Quant statement—“themes not explicitly addressed in Analysis 2 but indirectly supported by its findings...”—is speculative and relies on inference rather than demonstration. It overlooks the implicit engagement of these themes in Analysis 2 by prematurely stating they are “not explicitly addressed.” In doing so, it misses the opportunity to uncover and articulate how the data may, in fact, reflect or reinforce those very issues—rendering the connection superficial rather than insightful. In contrast, the Quant → Qual statement—“Analysis 2’s findings on political unrest complement Analysis 1’s insights on financial strain...”—offers a direct, reinforcing link. It doesn't just suggest relevance; it substantiates the claim that “inflation is not merely an economic issue but a broader societal challenge.” By drawing a clear line from measurable unrest to structural inequality, it turns parallel analyses into a cohesive, evidence-driven argument.
- 6.
- Wage Stagnation
Qual → Quant:
“Analysis 1 suggests that wage stagnation exacerbates economic disparity. However, Analysis 2 finds that while wage growth is negatively correlated with inflation, it is statistically insignificant…”
Quant → Qual:
“Analysis 1 establishes that inflation is positively correlated with income, suggesting nominal wage adjustments. However, Analysis 2 clarifies that these gains do not translate into real income growth…”
Why Quant → Qual is Stronger:
This interpretation connects data trends to real-world implications. It explains why nominal wage increases fail to improve living standards, especially for lower- and middle-income groups, by revealing inflation as the underlying mechanism. The analysis builds a coherent explanatory thread—from observed correlations to structural challenges—demonstrating a higher level of analytical synthesis.
- 7.
- Debt-to-Income and Credit Dependency
Qual → Quant:
“Specifically, the debt-to-income (DTI) ratio from Analysis 2 reinforces Analysis 1’s claim that lower-income groups rely more on credit as real wages stagnate.”
Quant → Qual:
“Analysis 1 highlights a strong positive relationship between DTI and income… However, quantile regression results indicate that lower-income earners rely on credit rather than wage growth… reinforcing findings from Analysis 2…”
Why Quant → Qual is Stronger:
The second interpretation connects findings across datasets and goes beyond surface-level correlation. It discusses the structural implications of wage stagnation, emphasizing credit reliance as a response to eroding purchasing power. Moreover, it situates these insights within a broader policy and equity context, showing deeper engagement with the data and its societal relevance.
Several GPT-generated responses also show that it performed better in the closed>open-ended sequencing:
- 1.
- Closed>Open-ended:
"Middle-income earners, however, feel the "gradual squeeze," adjusting consumption habits (switching brands, delaying big-ticket purchases) while still trying to maintain their quality of life."
Open>Closed-ended:
"Middle-income earners ($1,500–$5,000/month) feel a gradual squeeze, as inflation erodes savings, delays major purchases, and forces lifestyle adjustments."
Why Closed>Open-ended is Stronger:
Closed>Open-ended clarifies why the squeeze is “gradual”: this group is still actively trying to adapt—modifying habits while aiming to preserve their standard of living. In contrast, Open>Closed-ended presents the squeeze as more passive, implying the effects have already taken hold, with limited room for response—making the term “gradual” less convincing in that context.
Additionally, Closed>Open-ended brings in a broader implication through its reference to purchasing power, signaling a longer-term structural concern: “The long-term risk: a structural economic shift where inflation not only erodes purchasing power but also reshapes class stability.” This framing connects present-day strain to systemic shifts, something Open>Closed-ended doesn’t touch upon.
- 2.
- Closed>Open-ended:
“They experience the highest expense increases (10–20%), stagnant wages (80% say salaries don’t match inflation), and the most financial stress. Their primary response to inflation is adjusting spending habits rather than eliminating expenses entirely.”
Open>Closed-ended:
“Their discretionary spending is squeezed, savings are shrinking, and wages are not keeping up with inflation (80% report stagnant salaries).”
Why Closed>Open-ended is Stronger:
Only the Closed>Open-ended set explicitly connects wage stagnation with purchasing behavior within the same sentence. This integration strengthens the causal link between earnings and coping mechanisms. It thus offers a clearer picture of how stagnant wages directly influence financial decisions, whereas the Open>Closed-ended set presents the effects (shrinking savings, squeezed spending) more generally and less relationally.
- 3.
- Closed>Open-ended:
“Lower-income respondents favor direct interventions such as wage increases and rent controls, viewing inflation as a crisis requiring immediate relief. Middle-income respondents lean toward market-based solutions like tax cuts and corporate regulation, perceiving inflation as a systemic issue that needs structural fixes.”
Open>Closed-ended:
“Lower-income respondents favor direct interventions such as wage growth, rent control, and food price regulations (Set A), while middle-income respondents prefer market-based solutions like tax cuts and price oversight (Set A & B).”
Why Closed>Open-ended is Stronger:
Closed>Open-ended is richer because it adds motivations and perceptions behind the policy preferences—lower-income respondents see inflation as a crisis needing immediate relief, while middle-income respondents view it as a systemic issue needing structural fixes. This framing provides not just what the groups prefer, but why, adding interpretive depth beyond the listing of policy options in Open>Closed-ended.
- 4.
- Closed>Open-ended:
“Set A shows they already experience the worst wage stagnation, and Set B suggests they are delaying wealth-building efforts.”
Only this set connects wages to wealth. As such, it doesn't just present stagnant wages as a static fact—it connects income challenges to longer-term consequences, specifically the inhibition of wealth-building efforts. This linkage adds analytical depth by showing how short-term income strain can lead to long-term financial precarity. In contrast, the Open>Closed-ended set may present these as isolated datapoints, but Closed>Open-ended weaves them into a more cohesive narrative about economic trajectory and intergenerational impact.
- 5.
- Closed>Open-ended:
“Financial coping strategies reveal structural gaps: Lower-income individuals rely on extreme cutbacks, including delaying healthcare and increasing reliance on credit, whereas middle-income earners adjust by switching brands, postponing major purchases, or seeking additional income sources like gig work.”
“The long-term risk: a structural economic shift where inflation not only erodes purchasing power but also reshapes class stability. Without targeted interventions, today’s middle-income earners could become tomorrow’s struggling class, reinforcing economic divides and altering consumer behavior in ways that reshape entire market segments.”
Open>Closed-ended:
“Structural vs. Immediate Relief Needs: Lower-income households require urgent financial relief to survive inflation, while middle-income earners seek systemic reforms to prevent further erosion of their financial stability.”
“Policy Solutions Reflect Survival vs. Stability: Lower-income groups favor immediate government intervention (wage growth, rent controls, price caps on essentials), while middle-income earners prefer structural solutions (tax relief, anti-price-gouging laws, boosting local production).”
Why Closed>Open-ended is Stronger:
While both sets mention the preferred structural reforms of both groups, only Closed>Open-ended connects these preferences to projecting how these challenges may evolve over time. It traces coping mechanisms back to systemic gaps, then forward to potential class destabilization and market transformation—that is, it links individual behavior to macroeconomic shifts. Open>Closed-ended, while outlining policy preferences, stops at identifying current needs and proposed fixes; Closed>Open-ended adds a layer of analytical foresight about long-term socioeconomic consequences.
- 6.
- Closed>Open-ended:
“Financial Stress Is More Psychological for Middle-Income Earners: Set A shows that middle-income respondents report the highest financial strain, with a median stress level of 3.0. Set B expands on this by detailing how they feel "one financial shock away from hardship" and struggle to save. This suggests inflation is eroding their long-term financial confidence rather than pushing them into immediate poverty.”
While Open>Closed-ended treats financial and psychological stress distinctly, this connection is established only in Closed>Open-ended’s output, which highlights a feedback loop: inflation triggers financial instability, which in turn erodes psychological security and future outlook. This linkage adds depth to the interpretation, framing inflation not just as a material challenge but as a threat to perceived stability and class identity.
- 7.
- Consistency and polarization issues: While some observations in the Open>Closed-ended set indicate that the middle-income group is more strained, others emphasize the sheer severity of low-income struggles. Closed>Open-ended is more balanced and consistent in this sense.
4. Discussion
4.1. RQ 1: Is Quantitative Research Helpful Despite Limited Data Points for Short-Term Studies?
In our quantitative analysis, examined the impact of inflation on different income strata in the U.S., focusing on key factors such as wage growth, debt-to-income (DTI) ratios, consumer spending, unemployment, and Trump-era tariffs. The regression results indicate that DTI and unemployment significantly impact income, suggesting that higher debt burdens and labor market conditions are critical determinants. Consumer spending negatively affects income, likely reflecting shifts in disposable income due to rising costs. However, inflation and wage growth do not show significant direct effects, indicating that inflationary pressures may not uniformly influence all income levels. The analysis of Trump’s tariffs shows a weak but positive relationship with inflation, implying that tariffs may contribute to inflationary pressures, though the effect is statistically uncertain. Given the study’s objectives—testing the effects of nominal wage growth, debt-to-income ratios, and tariff-linked price changes—our regression findings suggest that debt burdens and labor market dynamics explain more variation in income-group vulnerability than inflation alone. We used income grouping to identify broad disparities, but future studies should explore within-group variation using quantile regression. Additionally, some policy implications suggest focusing on employment stability and debt management to mitigate inflation’s uneven effects on different income strata. Robustness checks and interaction models can further refine these conclusions: Our findings point to the need for targeted debt relief policies for low- and middle-income households, alongside measures that promote stable and secure employment to buffer the effects of labor market volatility. Policymakers should consider recalibrating macroeconomic indicators to reflect micro-level financial distress, as aggregate data often masks the lived reality of debt strain and spending constraints. There is also a case for revisiting tariff structures that may indirectly contribute to inflation, particularly in essential goods consumed disproportionately by vulnerable groups. Finally, inflation-adjusted support mechanisms—such as indexed subsidies or transfers—could help align fiscal responses with the differentiated impacts of price changes across income tiers. These implications can be explored further in future work to inform more inclusive and adaptive policy design.
4.2. RQ 2: Does Qualitative Research Add Value?
Inflation exerts unequal pressure across income groups, with lower- and middle-income households bearing the brunt due to rising costs of essentials, stagnant wages, and heavier debt burdens, while higher-income groups remain more insulated thanks to asset diversification and financial flexibility (OECD 2024; World Bank 2024; WEO 2025). Our regression findings mirror this pattern, showing that inflation’s effects are mediated by factors like debt-to-income ratios and structural constraints rather than inflation alone. Monetary responses during 2023–2024 varied: aggressive rate hikes curbed inflation but suppressed investment, while cautious strategies prolonged inflation but protected growth—both approaches ultimately deepening income disparities (WEO 2025). Thematic evidence also reveals how inflation erodes real wages, reshapes consumption and savings behavior, and contributes to social unrest and political pressure, particularly among vulnerable groups (OECD 2024; World Bank 2024). These dynamics underscore the inadequacy of inflation as a uniform variable in modeling and support our use of interaction terms and quantile regressions to capture stratified effects. More broadly, they highlight the need for integrated fiscal responses—beyond monetary tools—to address inflation’s unequal impacts and promote equitable recovery.
4.3. RQ 3: Do Microeconomic, Small-Sample Surveys Help Us Humanize Research?
The closed-ended survey responses reveal that middle-income earners—those earning between $1,500 and $5,000 per month—are hit hardest by inflation. They face the sharpest increase in living costs, stagnant wages, and growing financial insecurity, while also expressing the lowest levels of trust in government interventions. Lower-income respondents (earning less than $1,500), though certainly affected, seem to experience less subjective financial strain. This may be due to focused spending on essentials and the relative effectiveness of targeted public safety nets. In this light, government support appears to reach lower-income groups more effectively, whereas middle-income households are increasingly falling through the cracks.
The open-ended survey responses reframe inflation not merely as a macroeconomic concern but as a pivotal force transforming everyday life, class identity, and social mobility. For lower-income individuals, inflation is an urgent survival crisis—affecting access to food, housing, and healthcare. For middle-income earners, it erodes progress and undermines their ability to save, invest, or maintain quality of life. These differing pressures lead to divergent policy preferences: while lower-income groups demand immediate relief (e.g., rent control, food price regulation), middle-income groups call for broader structural reforms (e.g., tax breaks, support for local production). If left unaddressed, inflation could shift from a temporary financial pressure to a permanent source of inequality.
4.4. RQ 4: Which Sequencing (Quantitative>Qualitative or Qualitative>Quantitative; Closed-Ended>Open-Ended or Open-Ended>Closed-Ended) is Preferable and More Insightful?
Regarding the sequencing analysis, overall, the Quant → Qual sequencing yielded richer insights, stronger causal reasoning, and more layered interpretation. This seems intuitive, especially when we corroborate this analysis with our own examination of how qualitative findings help explain quantitative results in the quant>qual sequencing (Table 10).
Likewise, the Closed → Open-ended sequencing provided deeper insights, more robust causal reasoning, and a more nuanced interpretation. This approach appears logical, particularly when we compare it with our own analysis of how open-ended survey responses clarify the closed-ended survey results in the closed>open-ended sequencing (Table 11).
5. Conclusions
This study explored the short-term socioeconomic effects of inflation across U.S. income groups using a mixed-methods approach—regression analysis, thematic review, and microeconomic survey data. Our findings directly address four research questions, offering a more integrated and human-centered view of post-pandemic inflation.
5.1. RQ1: Is Quantitative Research Helpful in Short-Term Studies with Limited Data?
Yes—when focused on key variables like wage growth, debt-to-income (DTI) ratios, and unemployment, quantitative models provide valuable insights even with limited data. While inflation itself showed weak direct effects, DTI and labor market conditions emerged as strong predictors of income vulnerability. This underscores the limits of inflation as a standalone metric and highlights the usefulness of interaction models in shaping policy directions such as debt relief and employment support.
5.2. RQ2: Does Qualitative Research Add Value?
Absolutely. Thematic insights from global reports explained the uneven impacts of inflation, revealing how policy choices, wage stagnation, and inequality shape outcomes across income groups. Qualitative analysis added depth to our regression findings—for example, clarifying why consumer spending drops sharply among lower-income households and why DTI matters more for credit-reliant groups.
5.3. RQ3: Do Small-Scale Surveys Help Humanize Research?
Yes—survey data exposed inflation’s emotional and psychological toll, particularly among middle-income earners facing declining financial security and rising disillusionment. While lower-income respondents remain in survival mode, it is the perceived erosion of stability among the middle class that drives much of the alarm. These human-scale insights emphasize the need for layered, group-specific policy responses.
5.4. RQ4: Which Sequencing (Quantitative>Qualitative or Qualitative>Quantitative; Closed-Ended>Open-Ended or Open-Ended>Closed-Ended) is Preferable and More Insightful?
Quant→Qual and closed>open-ended sequencing proved more effective. Beginning with quantitative/closed-ended results helped identify key patterns, which qualitative/open-ended survey data then contextualized. This order clarified unexpected results, such as weak wage effects, and strengthened causal reasoning. It also sharpened policy insights—supporting calls for indexed transfers, debt-focused relief, and employment-centered recovery plans.
5.5. Limitations, Future Scope, and Implications
This study is limited by its short-term scope, reliance on secondary qualitative sources, and a small, non-representative survey sample. However, its integrated design demonstrates that even in volatile contexts with limited data, mixed-methods research can yield meaningful insights. Future studies could build on this by expanding survey reach, incorporating panel data, or analyzing subgroup dynamics across time. Theoretically, our approach encourages a shift from inflation as a purely macroeconomic concern to one embedded in lived experience, structural vulnerability, and behavioral response. For researchers, this study offers a framework for conducting rigorous short-term analysis by linking targeted variables with qualitative interpretation and human-scale narratives. For policymakers, it underscores how short-term research—despite data constraints—can inform timely, tailored interventions. Especially in crisis contexts, such research can help detect early warning signs, capture emerging distress patterns, and guide rapid response measures such as targeted transfers, credit relief, and employment stabilization.
Funding
This research received no external funding.
Informed Consent Statement
Informed consent was obtained from all subjects involved in the study.
Data Availability Statement
All data used in the research are available in the manuscript or can be accessed via links provided in the manuscript.
Conflicts of Interest
The authors declare no conflicts of interest.
Data Sources
(February 2024-Februrary 2025)
- Income: Bureau of Labor Statistics (BLS)
- Unemployment Rate: Federal Reserve Economic Data (FRED) (U.S. Bureau of Labor Statistics)
- Wage Growth: Bureau of Labor Statistics (BLS)
- Consumer Spending: Bureau of Economic Analysis (BEA)
- Debt-to-Income Ratio (DTI): Federal Reserve Economic Data (FRED) (Board of Governors of the Federal Reserve System (US))
- Inflation Rate: Trading Economics
- Trump-Era Tariffs: Atlantic Council Trump Tariff Tracker
- World Economic Outlook (2025) https://www.oecd.org/en/publications/oecd-economic-surveys-united-states-2024_cdfff156-en.html
- International Monetary Fund (2025) https://www.imf.org/en/Videos/view?vid=6367238532112
- World Bank Group (2024) https://www.worldbank.org/en/publication/poverty-prosperity-and-planet
| 1 | While this study references primary sources like BEA and BLS in other sections, Trading Economics was used here to enable efficient cross-indicator alignment across uniform monthly timeframes, especially for regression modeling. Its curated datasets offer immediate usability, minimizing preprocessing efforts and allowing for smoother integration of macro-level variables within a short-term, mixed-methods framework. Given the study’s focus on temporal sensitivity and rapid economic shifts, this streamlined access supported timely analysis while maintaining data fidelity. All figures used were archived and are available to ensure transparency and facilitate future comparative research. |
| 2 | Wage growth is a key component of household income and is often used as a proxy for labor market strength. Analyzing its relationship with income changes helps determine whether reported income increases are due to actual improvements in compensation or other factors like borrowing or inflation-driven adjustments. In this model, the weak and negative coefficient for wage growth may suggest that nominal wage increases have not translated into meaningful income gains—possibly due to inflation eroding real wages or wage growth being concentrated in sectors not well-represented in the sample. Including wage growth in the model is therefore essential to understand whether income gains are substantive or illusory, especially in volatile, post-crisis conditions. |
| 3 | Consumer spending in this study is measured using monthly percentage changes in Personal Consumption Expenditures (PCE), sourced from the U.S. Bureau of Economic Analysis (BEA). This macro-level indicator reflects the overall direction and momentum of household consumption in the economy. As such, the regression captures the association between income changes and the aggregate fluctuation in consumer demand, rather than individual or group-specific dollar amounts. While higher-income groups may indeed spend more in absolute terms, this model interprets broader spending trends as proxies for economic strain or resilience across the income distribution. The data used in this analysis are available to facilitate future comparison or replication. |
| 4 | While traditionally the Phillips Curve posits an inverse relationship between inflation and unemployment, recent labor market trends—particularly post-pandemic—have shown greater heterogeneity. High-income earners in knowledge-based sectors may maintain or increase earnings despite rising unemployment in lower-income service sectors. This compositional effect may help explain the observed positive correlation in the model. Moreover, the regression does not claim a causal relationship but identifies patterns in aggregate data that warrant deeper stratified analysis. |
| 5 | This analysis focuses on consumer inflation, where the extent of price increases depends on the degree to which companies pass on tariff-related costs to consumers. Further analysis, including interaction models, can refine these insights on inflation’s impact across income strata—specifically in the context of consumer inflation, where the extent of price increases depends on how much of the tariff-related cost is passed through by companies to end consumers. |
| 6 | The inclusion of a time-based income trend graph provides essential context for interpreting the regression results and understanding the dynamics of income movement across the study period. While the regression models assess the strength and direction of relationships between variables, the trend graph offers a visual overview of the dataset’s temporal stability. This helps establish whether the income data exhibits anomalous shifts, cyclical patterns, or structural breaks, any of which could influence the robustness of the model. Additionally, the visual cue of linearity strengthens confidence in the assumption of temporal consistency, which supports the model’s validity for short-term policy inferences. Including this figure also enables future researchers to compare or extend the dataset using the same time frame. |
References
- Aspachs, O., Durante, R., Graziano, A., Mestres, J., Reynal-Querol, M., and Montalvo, J. G. 2021. “Tracking the Impact of COVID-19 on Economic Inequality at High Frequency.” Proceedings of the National Academy of Sciences 118(31): e2105784118. [CrossRef]
- Friese, S., Soratto, J., and de Pires, D. E. P. 2018. “Carrying Out a Computer-Aided Thematic Content Analysis with ATLAS.ti.” ResearchGate. Retrieved from https://www.researchgate.net/publication/324720405_Carrying_out_a_computer-aided_thematic_content_analysis_with_ATLASti.
- Furceri, D., Loungani, P., Ostry, J. D., and Pizzuto, P. 2021. Will COVID-19 Have Long-Lasting Effects on Inequality? Evidence from Past Pandemics (IMF Working Paper No. 2021/105). International Monetary Fund. [CrossRef]
- Harding, M., Lindé, J., and Trabandt, M. 2023. Understanding Post-COVID Inflation Dynamics (IMF Working Paper No. 2023/017). International Monetary Fund. [CrossRef]
- Jayashankar, S., and Murphy, A. 2023. “High Inflation Disproportionately Hurts Low-Income Households.” Federal Reserve Bank of Dallas. Retrieved from https://www.dallasfed.org/research/economics/2023/0110.
- Knicker, F., Naumann-Woleske, J., Bouchaud, J.-P., and Zamponi, F. 2024. “Post-COVID Inflation & the Monetary Policy Dilemma: An Agent-Based Scenario Analysis.” arXiv. https://arxiv.org/abs/2306.01284.
- Sintos, D. 2023. “The Impact of COVID-19 on Labor Markets and Inequality.” ResearchGate. Retrieved from https://www.researchgate.net/publication/373762681_Does_inflation_worsen_income_inequality_A_meta-analysis.
- Vindrola-Padros, C., Chisnall, G., Cooper, S., Dowrick, A., Djellouli, N., Mulcahy Symmons, S., Martin, S., Singleton, G., Vanderslott, S., Vera, N., and Johnson, G. A. 2020. “Carrying Out Rapid Qualitative Research During a Pandemic: Emerging Lessons from COVID-19.” Qualitative Health Research 30(14): 2192–2204. [CrossRef]
Figure 1.
Concept Cloud (OECD Economic Surveys US 2024).
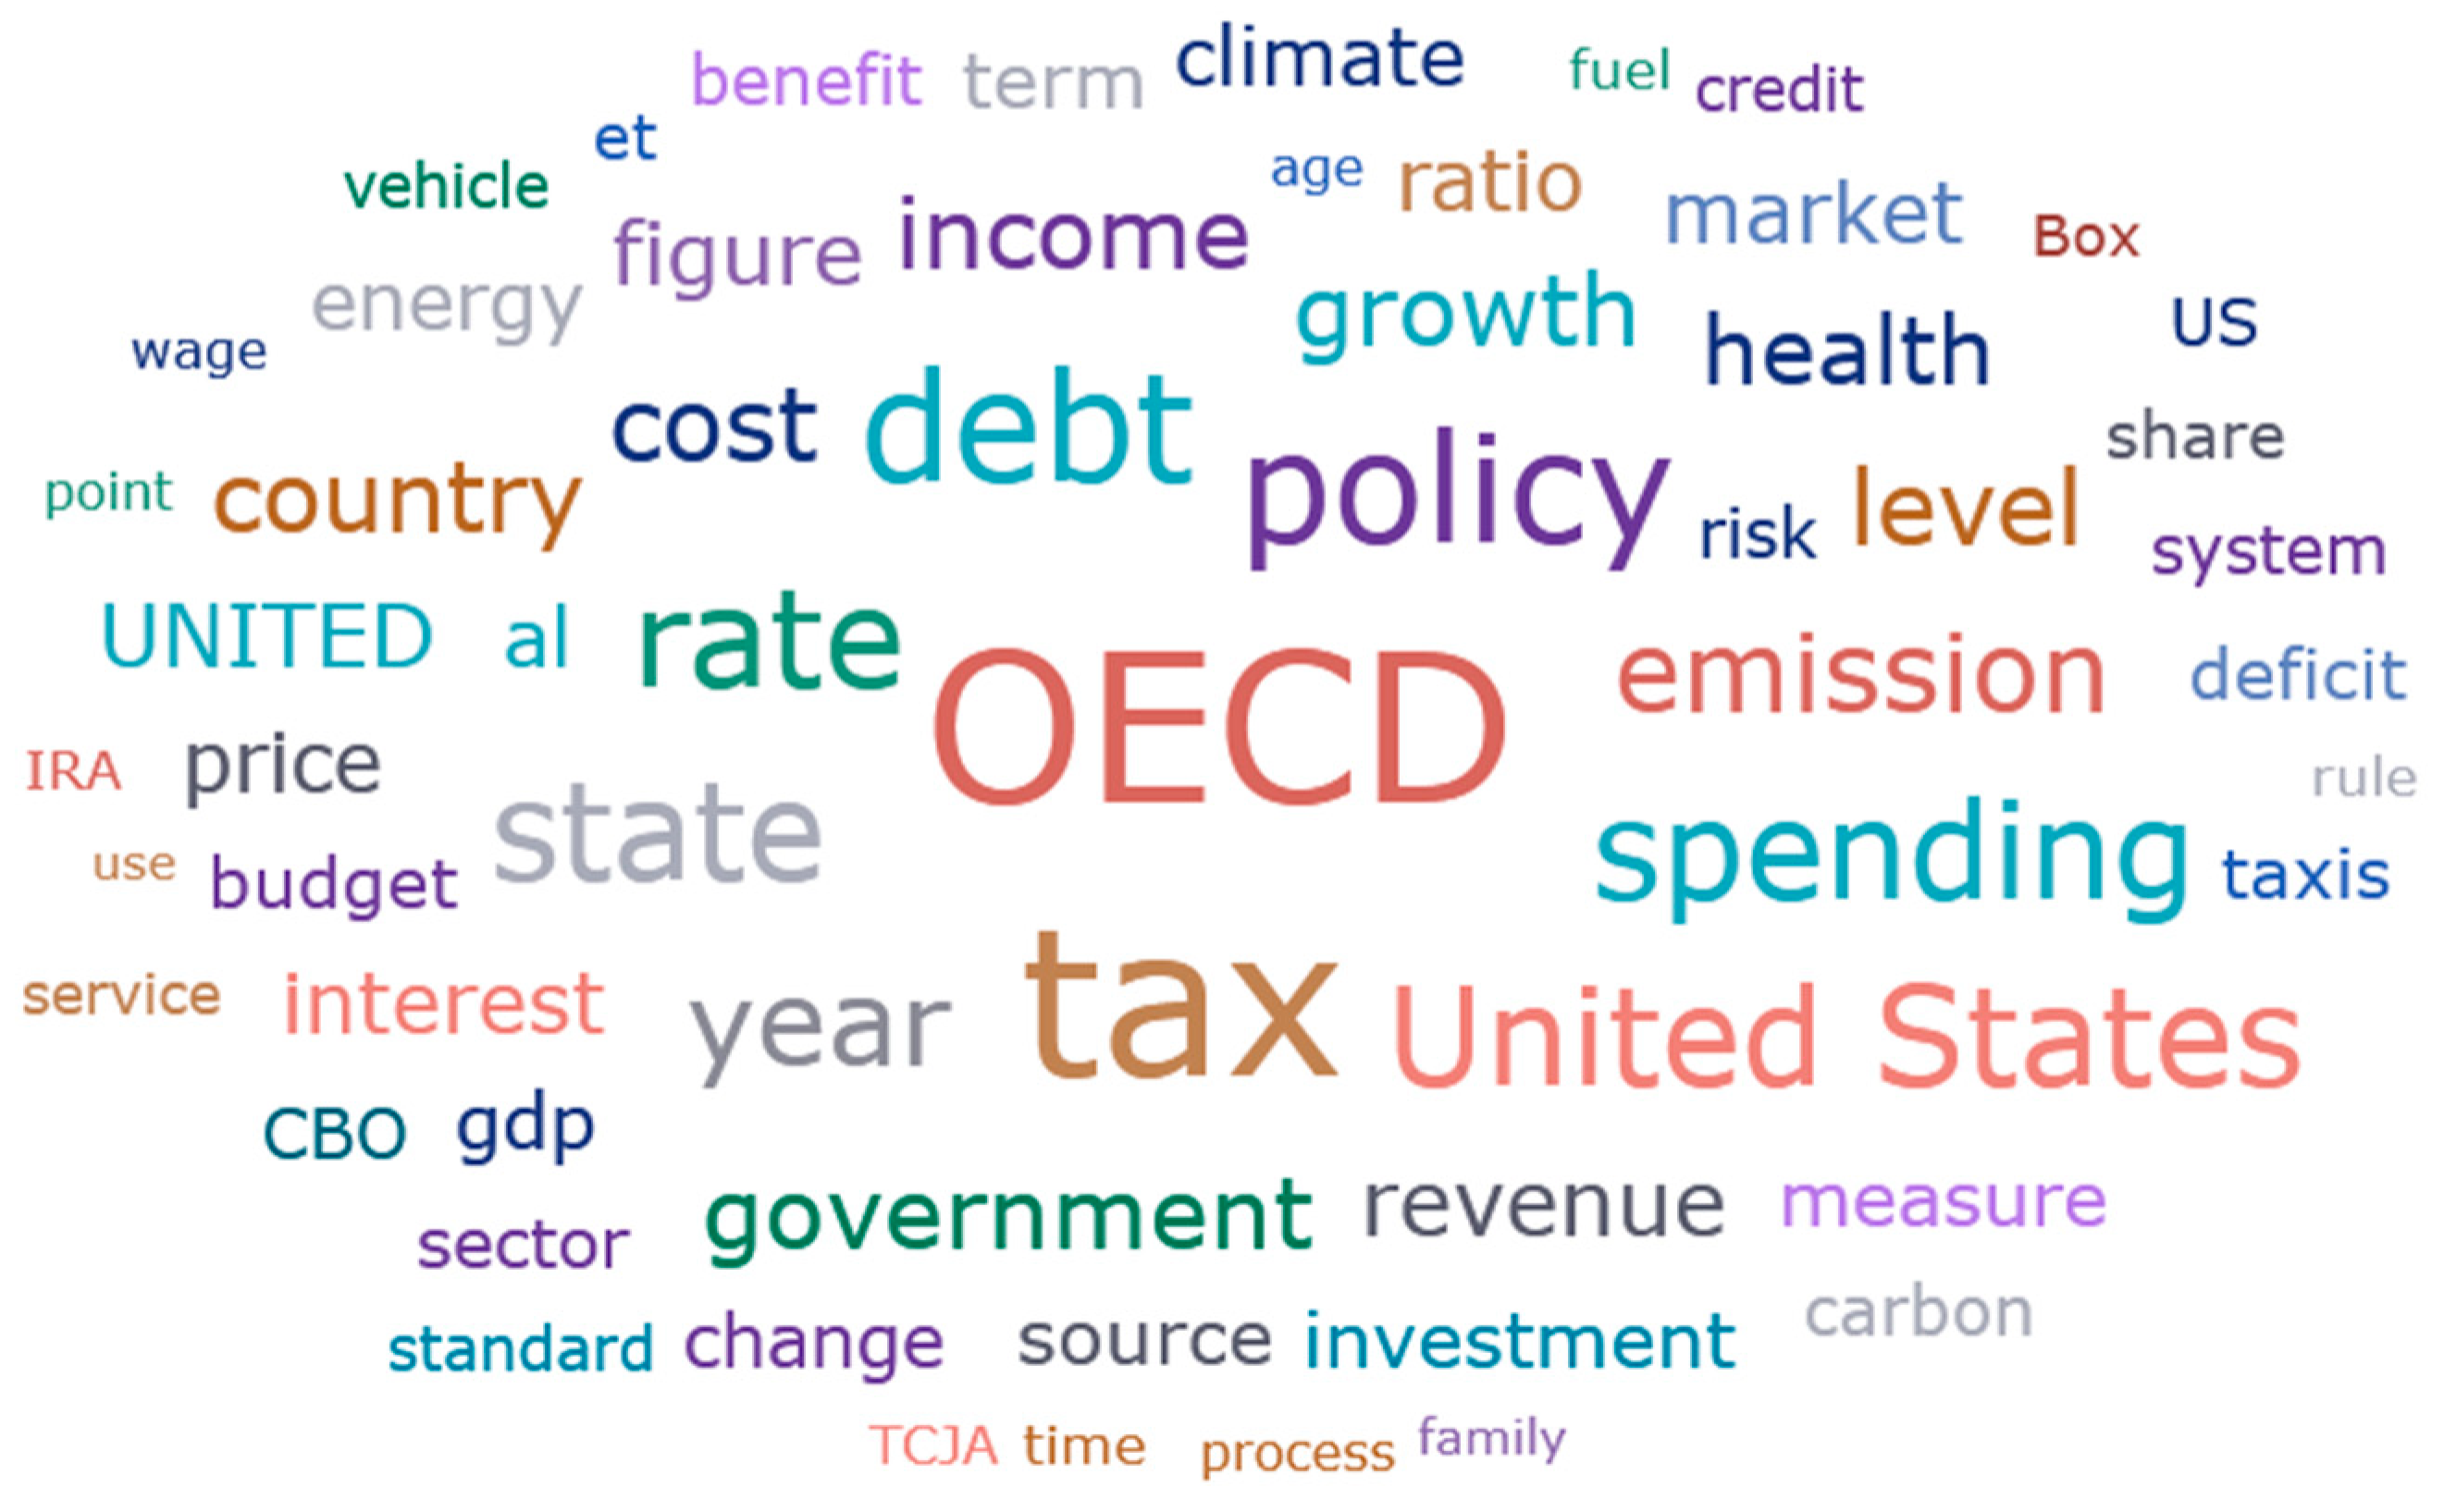
Figure 2.
Concept Cloud (World Economic Policy 2025).
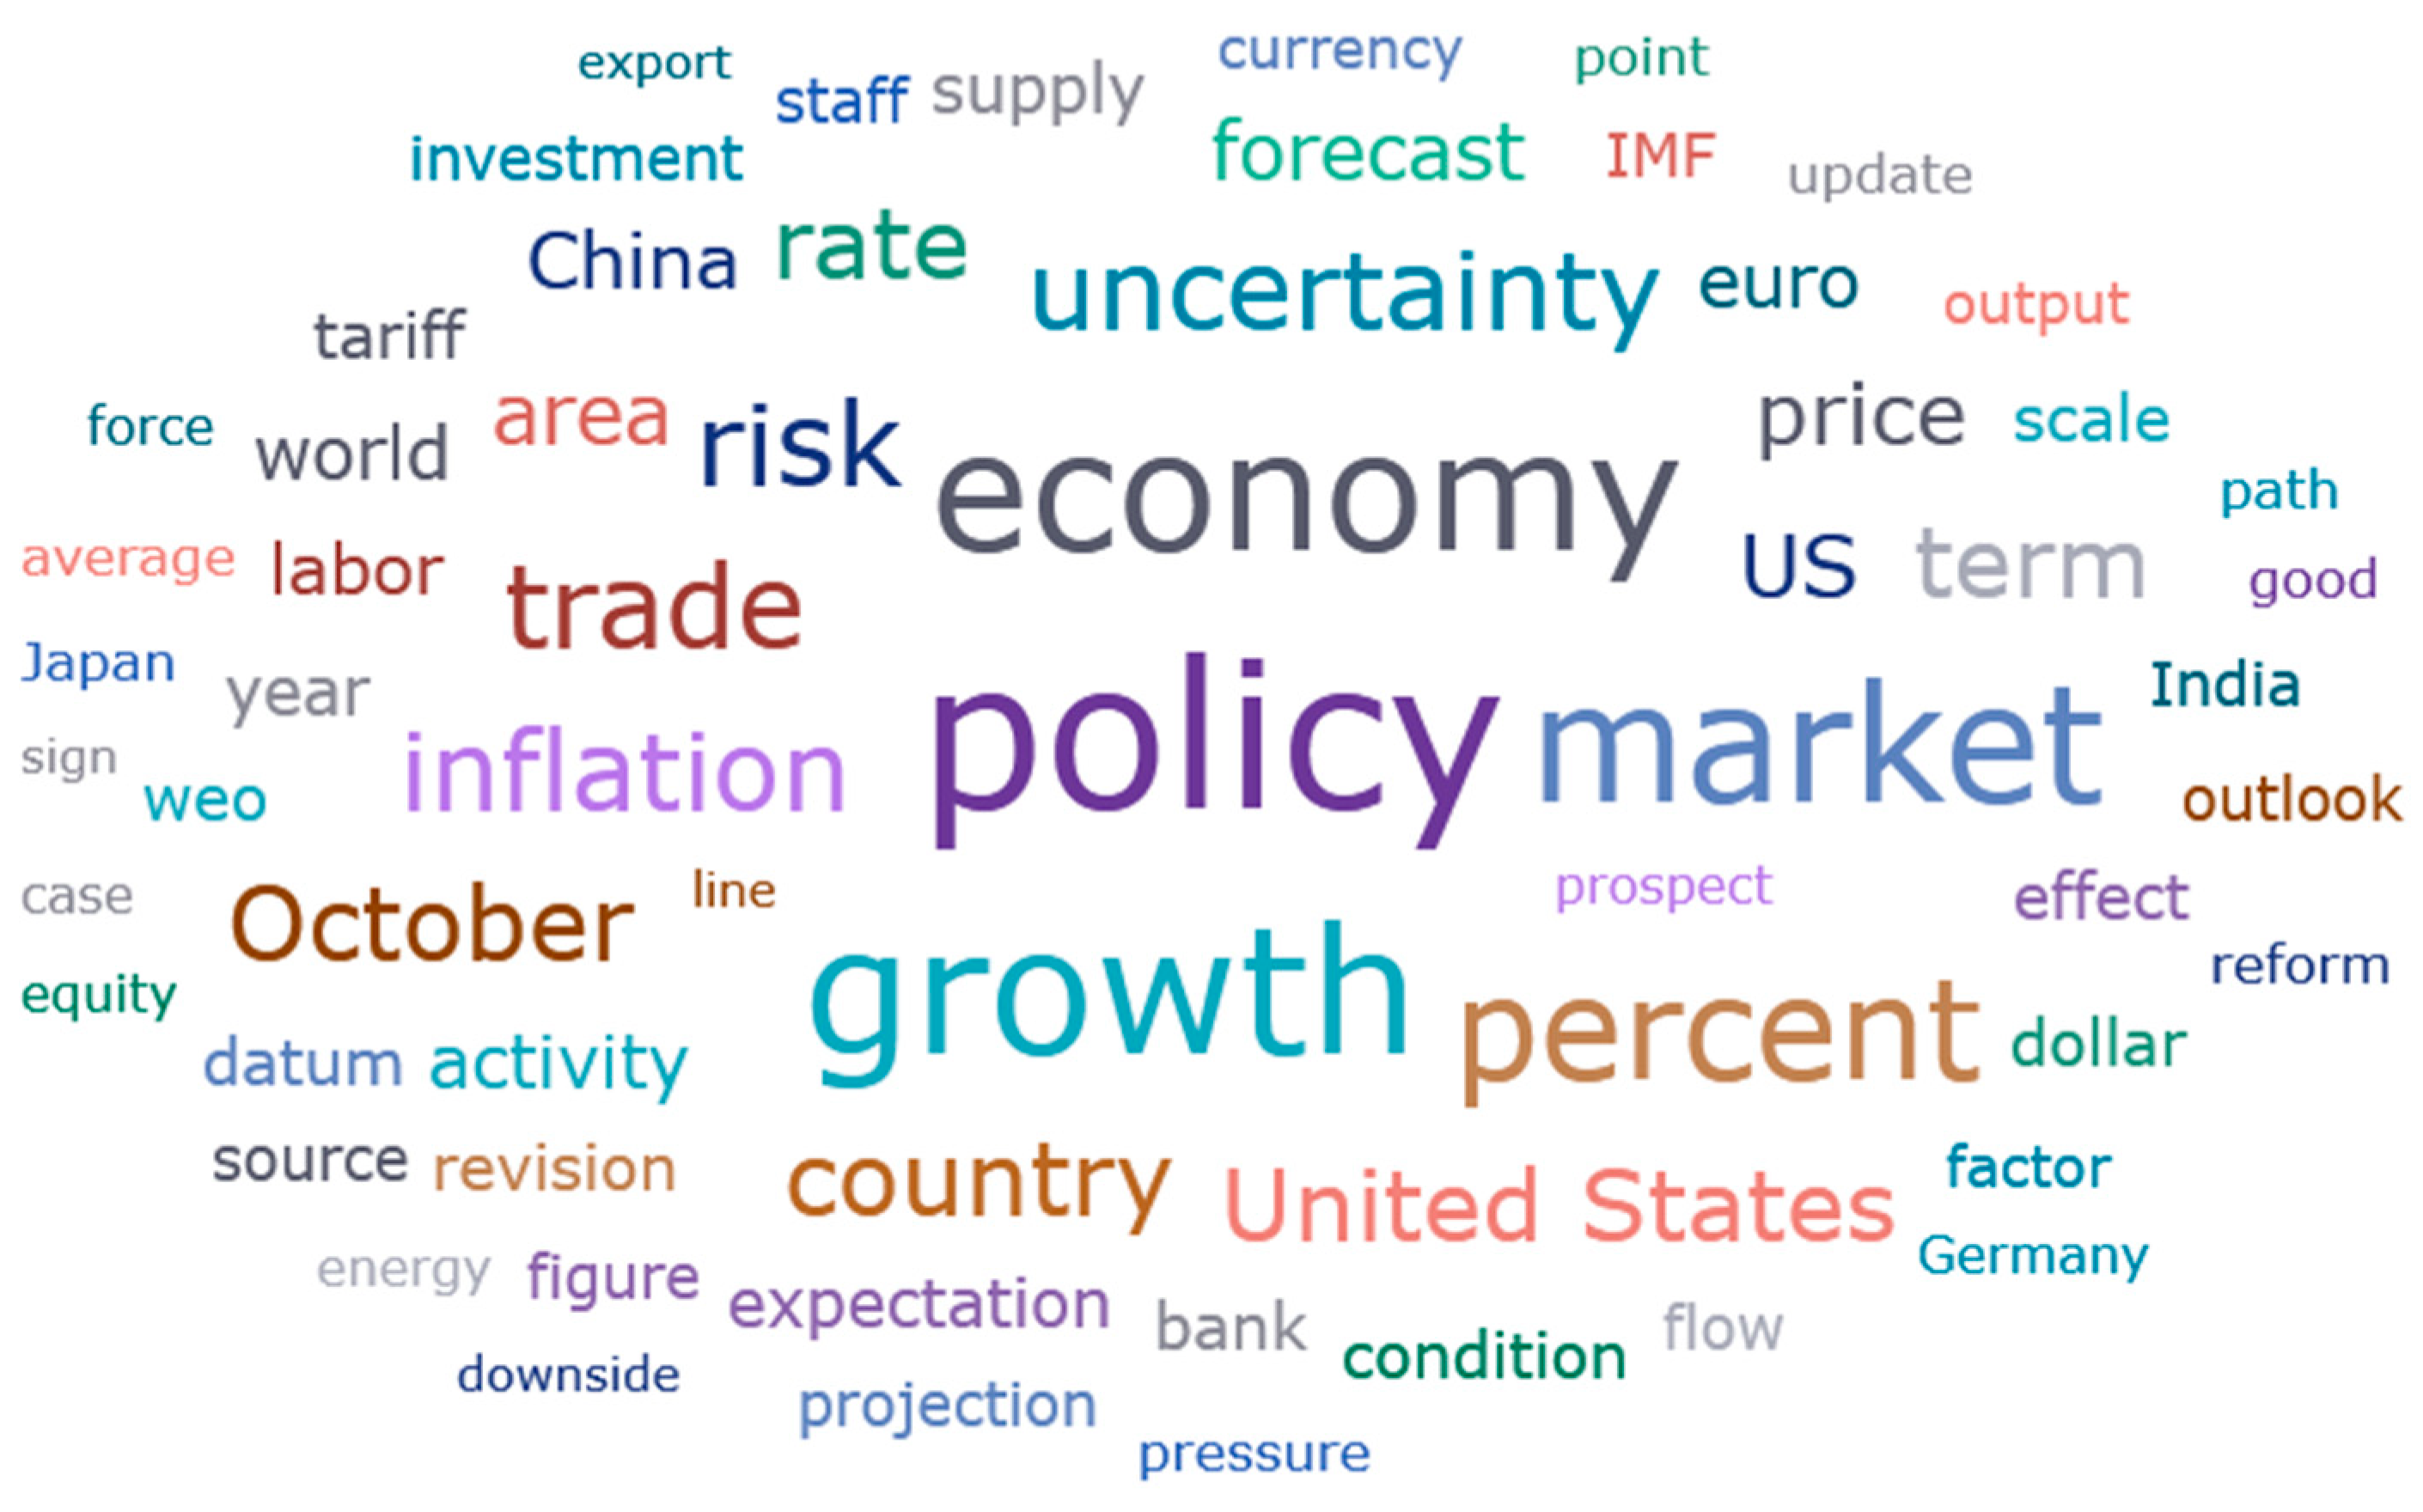
Figure 3.
Concept Cloud (Poverty, prosperity and Planet Report 2025).
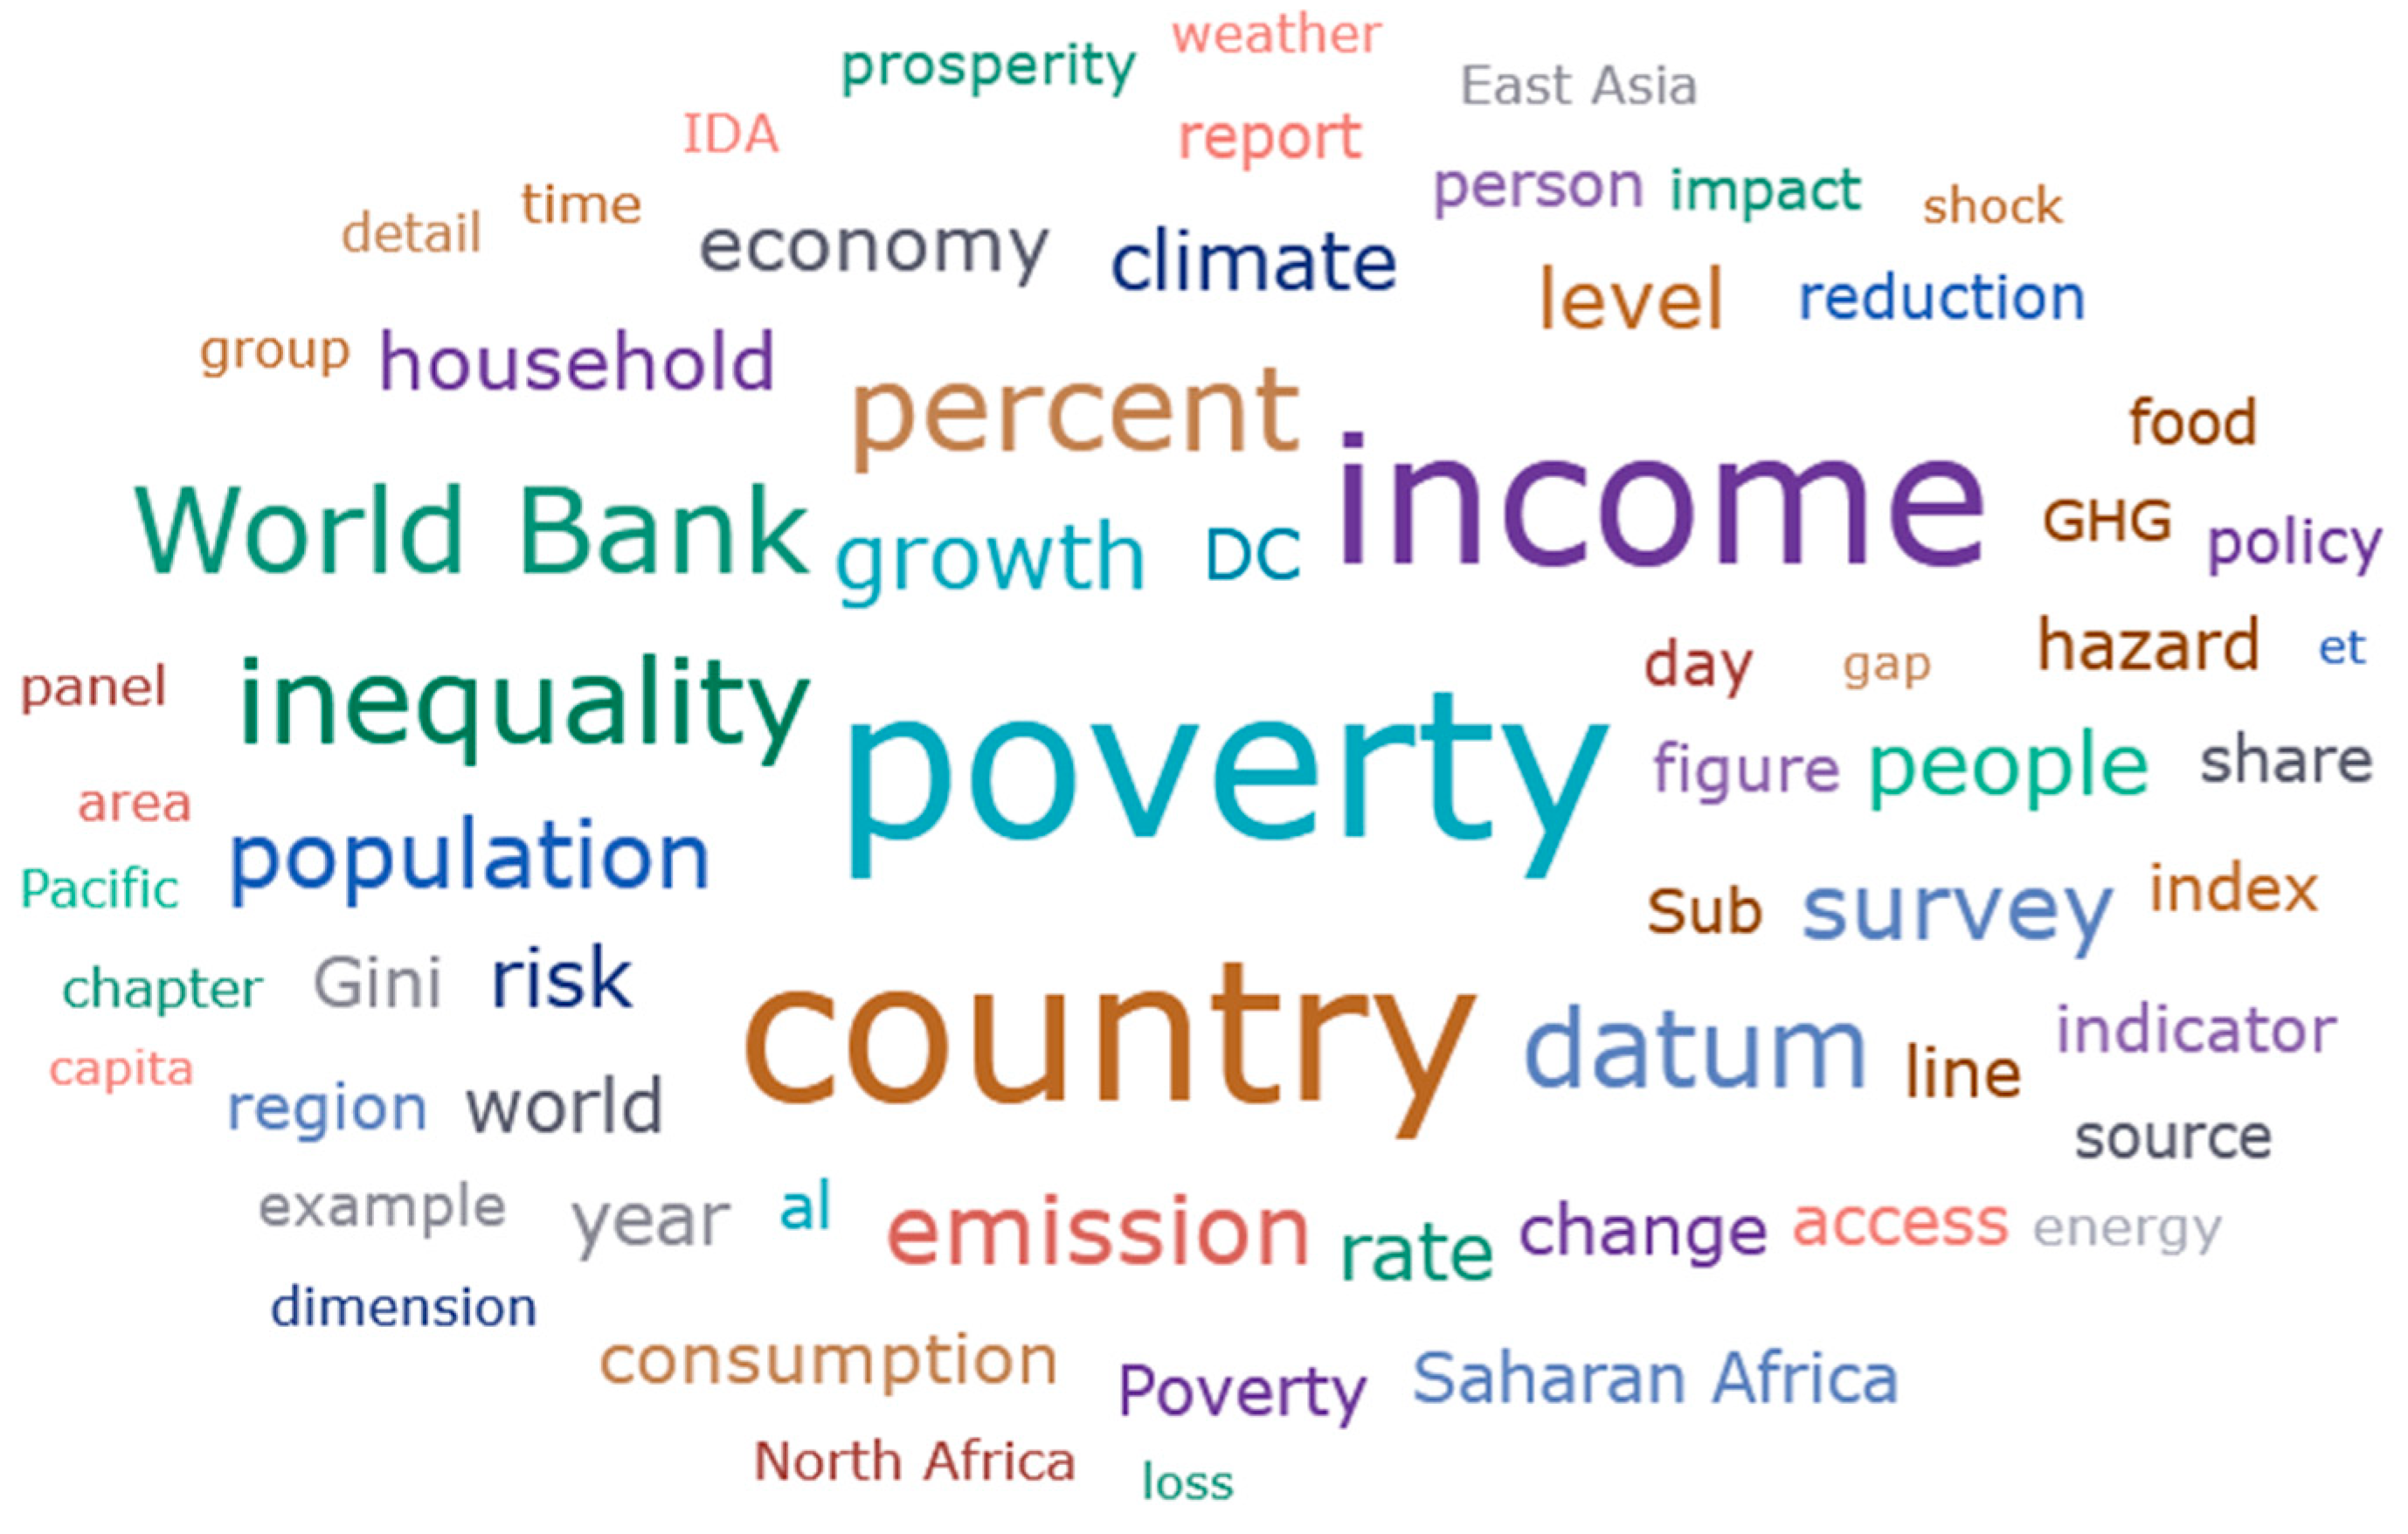

Table 1.
Baseline Multiple Linear Regression Results.
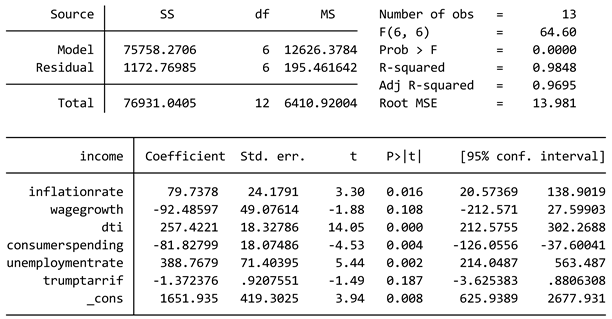 |
Table 2.
Multicollinearity Test Results for Baseline Multiple Linear Regression.
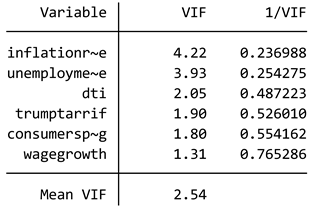 |
Table 3.
Interaction Model Results.
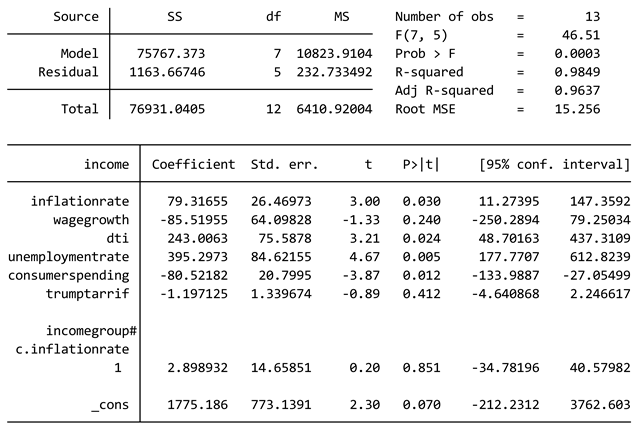 |
Table 4.
Multicollinearity Test Results for Interaction Model.
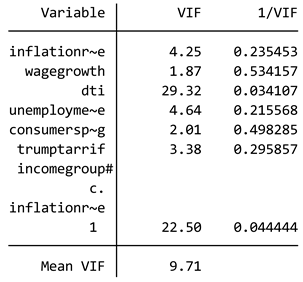 |
Table 5.
Quantile Regression Results.
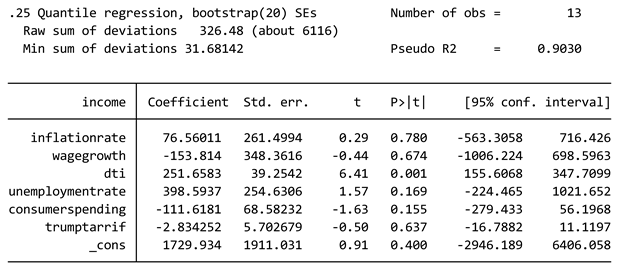 |
Table 6.
Robustness Checks (HC3 Standard Errors).
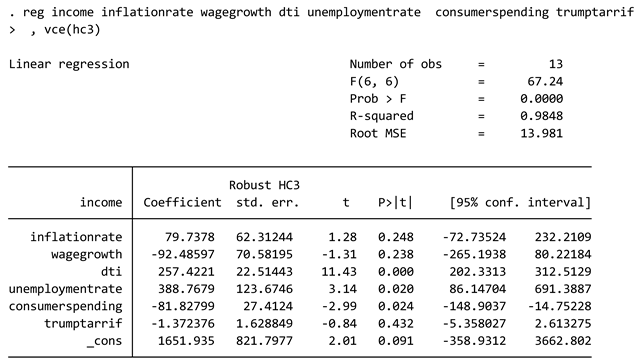 |
Table 7.
Tariff Impact Regression Results.
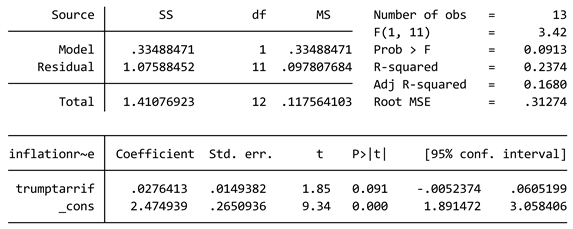 |
Table 8.
Key themes, insights, and sources.
| Theme | Insight | Source |
|---|---|---|
| Inflation Control and Monetary Policies | Emphasizes the need for monetary policy adjustment and fiscal consolidation to manage inflationary pressures. | OECD Economic Surveys: United States 2024 |
| Discusses global inflation trends and the divergent responses of central banks, highlighting the cautious approach in places where inflation is more persistent. | World Economic Outlook 2025 | |
| Consumer Behavior and Economic Growth | Focuses on global poverty and its impact on consumer behavior, with specific emphasis on shared prosperity and economic inclusion. | Poverty, Prosperity, and Planet Report 2024 |
| Notes changes in consumer confidence and its effects on economic performance, particularly in China and the United States. | World Economic Outlook 2025 | |
| Social Impacts and Inequality | Highlights the stalled progress in global poverty reduction and inequality, discussing the need for comprehensive strategies to tackle structural sources of inequality. | Poverty, Prosperity, and Planet Report 2024 |
| Addresses income inequality and its implications for fiscal policies and social stability. | OECD Economic Surveys: United States 2024 |
Table 9.
Comparative analysis.
| Source | Inflation Control | Consumer Behavior | Social Impacts |
|---|---|---|---|
| OECD Economic Surveys: United States 2024 | Yes | Yes | Yes |
| Poverty, Prosperity, and Planet Report 2024 | No | Yes | Yes |
| World Economic Outlook 2025 | Yes | Yes | No |
Table 10.
Contextualizing quantitative analysis using qualitative insights.
| Thematic Item | Explains/Contextualizes These Aspects of the Quantitative Analysis |
|---|---|
| Item 1: Overview of the Analysis This analysis examines inflation-related policies, consumer behavior, and social impacts using thematic analysis via Atlas.ti 2025. It synthesizes key economic insights from three major reports:
|
- Positions the U.S.-focused regression within a broader global policy context (OECD, IMF, World Bank). - Explains the relevance of inequality, environmental, and social dimensions that are not directly modeled but affect outcomes like spending and income. |
| Item 2: Key Themes and Insights Theme 1: Inflation Control & Monetary Policies
Theme 2: Consumer Behavior & Economic Growth
Theme 3: Social Impacts & Inequality
|
- Theme 1 (Inflation Control & Monetary Policies): Contextualizes the limited real wage growth (insignificant wage-inflation link) as a global policy outcome. - Theme 2 (Consumer Behavior): Supports finding that consumer spending negatively affects income, especially in lower brackets. - Theme 3 (Social Impacts): Aligns with findings that only DTI significantly affects low-income earners, showing deeper structural vulnerability. |
| Item 3: Findings on Inflation’s Impact by Income Groups High-Income Groups:
Middle-Income Groups:
Low-Income Groups:
|
How it connects:
- Directly supports stratified regression findings: • High-income: Positive inflation-income correlation due to asset appreciation. • Middle-income: Income squeezed, mirroring weak wage growth and reduced spending. • Low-income: High DTI reliance and consumer cutbacks match regression results. |
| Item 4: Policy & Economic Trends Inflation Worsens Inequality:
|
- Explains why inflation correlates with income (nominal gains for asset holders, not wage earners). - Adds depth to the DTI-income link in lower-income groups (credit reliance). - Clarifies lack of tariff-income correlation (tariffs’ indirect inflationary role). - Supports observed consumer spending drop as a systemic effect of inequality and wage stagnation. |
Item 5: Conclusion
|
- Reinforces empirical study’s call for integrated fiscal/monetary responses. - Aligns with recommendation to focus on employment and debt management. - Validates need for quantile regression and non-linear models to capture unequal effects. |
Table 11.
Contextualizing closed-ended survey results using open-ended insights.
| Open-Ended Survey Finding | What It Shows | How It Explains the Closed-Ended Results (indicating a higher burden on middle-income groups) |
|---|---|---|
| 1. Key Findings: Inflation’s Effects on Different Income Groups | Spending Adjustments: Lower-income groups eliminate discretionary spending, while middle-income groups shift strategies but keep spending. | Middle-income groups appear more vocal about inflation because they still have spending flexibility—they are adjusting rather than eliminating. Lower-income groups, already cutting back for survival, aren’t experiencing a drastic new change—they were struggling before. |
| 2. Unexpected Impacts of Inflation | Life Disruptions: Lower-income groups struggle with basic needs, while middle-income groups struggle with savings and security. | The middle class feels the crisis differently—they are losing financial progress, not just struggling to survive. This fuels their anxiety and makes them perceive inflation as a bigger disruption than lower-income groups. |
| 3. Suggested Policy Solutions | Policy Priorities: Lower-income respondents want immediate relief (wage growth, rent control), while middle-income respondents want structural reforms (lower taxes, anti-price gouging laws). | Middle-income respondents have more faith in systemic change because they still have assets and financial options. Lower-income respondents need instant intervention since they lack financial buffers. |
| 4. Deep Interpretation: Inflation’s Disproportionate Burden | Survival vs. Stability: Lower-income groups are in crisis mode, while middle-income groups feel a gradual erosion of security. | The middle class is alarmed because they had stability before but are now slipping—this sudden loss of control makes them more vocal than lower-income groups, who were already struggling. |
| 5. The Psychology of Inflation: Stress and Uncertainty | Behavioral & Psychological Shifts: Lower-income respondents experience financial anxiety due to survival stress, while middle-income respondents feel growing insecurity due to inflation eating into their financial future. | Middle-income stress feels more “unexpected”—they weren’t prepared to struggle like this. Lower-income respondents are already conditioned to financial hardship, so their response doesn’t change as dramatically. |
| 6. The Inflation Tipping Point: Where Do Groups Break? | Critical Breaking Points: The lower-income group is already at maximum strain, while middle-income respondents have some resilience but are at risk of falling downward. | Middle-income respondents feel more threatened because they still have something to lose. Lower-income respondents have already hit rock bottom, so inflation doesn’t change their baseline as drastically. |
| 7. Final Interpretation: Inflation as a Social Turning Point | Long-Term Consequences: Inflation is not just economic—it is redefining class structure and mobility. | Without intervention, today’s middle class will become tomorrow’s struggling class. The anxiety middle-income respondents feel is justified because they sense they are on the brink of falling down the economic ladder. |
Disclaimer/Publisher’s Note: The statements, opinions and data contained in all publications are solely those of the individual author(s) and contributor(s) and not of MDPI and/or the editor(s). MDPI and/or the editor(s) disclaim responsibility for any injury to people or property resulting from any ideas, methods, instructions or products referred to in the content. |
© 2025 by the author. Licensee MDPI, Basel, Switzerland. This article is an open access article distributed under the terms and conditions of the Creative Commons Attribution (CC BY) license (http://creativecommons.org/licenses/by/4.0/).
Copyright: This open access article is published under a Creative Commons CC BY 4.0 license, which permit the free download, distribution, and reuse, provided that the author and preprint are cited in any reuse.


