Plain Language Summary
Income inequality can affect health in many ways. This study examined whether state-level economic policies, such as raising the minimum wage, expanding Medicaid, or increasing tax credits, improve how adults rate their health. Using data from 2018 to 2023, the research compared health trends in states that adopted these policies with those that did not, both before and after policy changes.
First, the results suggest that people in states adopting income-related policies were slightly less likely to report poor or fair health. However, after adjusting for differences between states before the policies were implemented, these improvements were no longer statistically significant.
This means that the early signs of improvement likely reflected broader economic trends rather than the direct effects of new policies. The findings suggest that income-related policies alone may not lead to immediate health benefits and that longer timeframes or complementary support, such as housing, food, or behavioral health programs, may be needed to achieve measurable improvements. Further research is required to examine these long-term effects, especially in low-income and high-need populations.
1. Introduction
Health disparities in the United States remain a persistent public health concern shaped by enduring social and economic inequalities, particularly income inequality. A robust body of evidence links greater income inequality to worse health outcomes across domains, including self-rated health, morbidity, and mortality [
1,
2,
3]. However, most prior studies relied on cross-sectional or correlational designs that limit causal interpretation [
4]. Without quasi-experimental approaches or natural experiments, it is difficult to determine whether income inequality itself drives poor health or whether the association reflects unobserved confounding factors.
This study addresses this gap by exploiting state-level variations in the timing of income-related policy adoption to estimate causal effects on health. We focus on policies such as minimum wage increases, expansions of the Earned Income Tax Credit (EITC), and Medicaid expansions—interventions that influence household income and financial security [
5,
6,
7]. This economic support is hypothesized to improve population health by reducing material hardship and mitigating the effects of income inequality, both of which are established social determinants of health [
8].
Using data from the Behavioral Risk Factor Surveillance System (BRFSS) from 2018 to 2023, we applied a two-way fixed-effects difference-in-differences (DiD) framework to assess whether state-level income-equalizing policies are associated with changes in adult self-rated health. The analysis includes robustness checks through event study models and trend-adjusted specifications.
Objective: To estimate the causal effect of income-related policy adoption on self-rated health. Hypothesis: State-level income-equalizing policies reduce the proportion of adults who report fair or poor health.
2. Methods
2.1. Study Design
This study employs a quasi-experimental state-year panel design using a difference-in-differences (DiD) framework with two-way fixed effects for state and year. The treated group consists of U.S. states that implemented income-related policies (e.g., minimum wage increases, Earned Income Tax Credit [EITC] expansions, or Medicaid expansions) between 2018 and 2023. Control states were those that did not adopt any of these policies during the same period.
This approach estimates the average treatment effect on the treated (ATT), while controlling for both state-invariant characteristics and time-varying national shocks.
2.2. Data Sources
Three primary data sources were used:
Behavioral Risk Factor Surveillance System (BRFSS), 2018–2023: Provides annual, state-level data on adult self-rated health [
9].
American Community Survey (ACS) via IPUMS, 2015–2023: Supplies socioeconomic and demographic covariates, including Gini coefficients, median household income, unemployment rates, education levels, and racial/ethnic composition [
10].
Policy Databases: Policy enactment dates and classifications were compiled from the National Conference of State Legislatures (NCSL) and Tax Policy Center [
11,
12].
2.3. Variables2.4. Statistical Analysis
| Type |
Variable |
Description |
| Outcome |
Fair/poor self-rated health |
Binary indicator coded as 1 if respondents reported general health as “fair” or “poor” (from BRFSS GENHLTH). |
| Treatment |
Policy enactment |
Binary = 1 for post-policy years in treated states. |
| Covariates |
Demographic and socioeconomic controls |
Age, sex, education, income, unemployment, racial/ethnic composition (from ACS/IPUMS). |
| Fixed Effects |
State and year |
Absorb time-invariant state factors and year-specific national trends. |
The main regression model is a two-way fixed-effects DiD specification:
Where:
= proportion of adults reporting fair/poor health in state s and year t.
= 1 for treated states after policy implementation.
= vector of state-year covariates.
and = state and year fixed effects.
Standard errors are clustered at the state level to allow for autocorrelation within states.
An event-study specification was also estimated using relative time dummies (e.g., rel_m3 to rel_p4) to test for pre-trends and dynamic effects.
Analyses were conducted in Stata 18 (StataCorp LLC, 4905 Lakeway Drive, College Station, TX, 77845 USA) using:
The survey weights from the BRFSS were applied to ensure representativeness. Analyses followed the best practices for causal inference in public health policy evaluation [
15,
16].
2.5. Robustness Checks
Robustness checks included:
State-specific trends: Linear and quadratic trends interacted with time.
Shortened event window: Restricted to ±2–3 years around policy adoption.
Lagged effects: Tested for delayed policy impacts (1–2 years).
Alternative inequality metrics: Replicated using state-level P90/P10 ratios.
Policy overlap exclusion: Excluded states with concurrent policy changes.
Placebo tests: Randomized policy implementation years for control states.
2.6. Ethical Considerations
All data are publicly available and de-identified; therefore, this study was exempt from institutional review board (IRB) approval.
3. Results
3.1. Main Effects of Policy Adoption
We began by estimating a baseline difference-in-differences (DiD) model with state- and year-fixed effects to assess whether income-related state policy adoption was associated with changes in the proportion of adults reporting fair or poor health.
As shown in
Table 1, policy adoption was associated with a modest reduction in fair/poor self-rated health (β = −0.00398, SE = 0.00142,
p = 0.007). After policy adoption, the share of adults reporting fair or poor health decreased by approximately 0.4 percentage points relative to control states.
Model notes:
323 state-year observations (2018–2023); 55 U.S. states and territories; fixed effects for state and year; BRFSS survey weights applied; adjusted R² = 0.68. The methodological approach followed Wing et al. (2018) [
15] and Zeldow and Hatfield (2021) [
16].
3.2. Temporal Dynamics and Pre-Trend Evaluation
Event-study models were estimated using the leads and lags of the policy variable to assess temporal dynamics and test the parallel-trend assumption.
As shown in
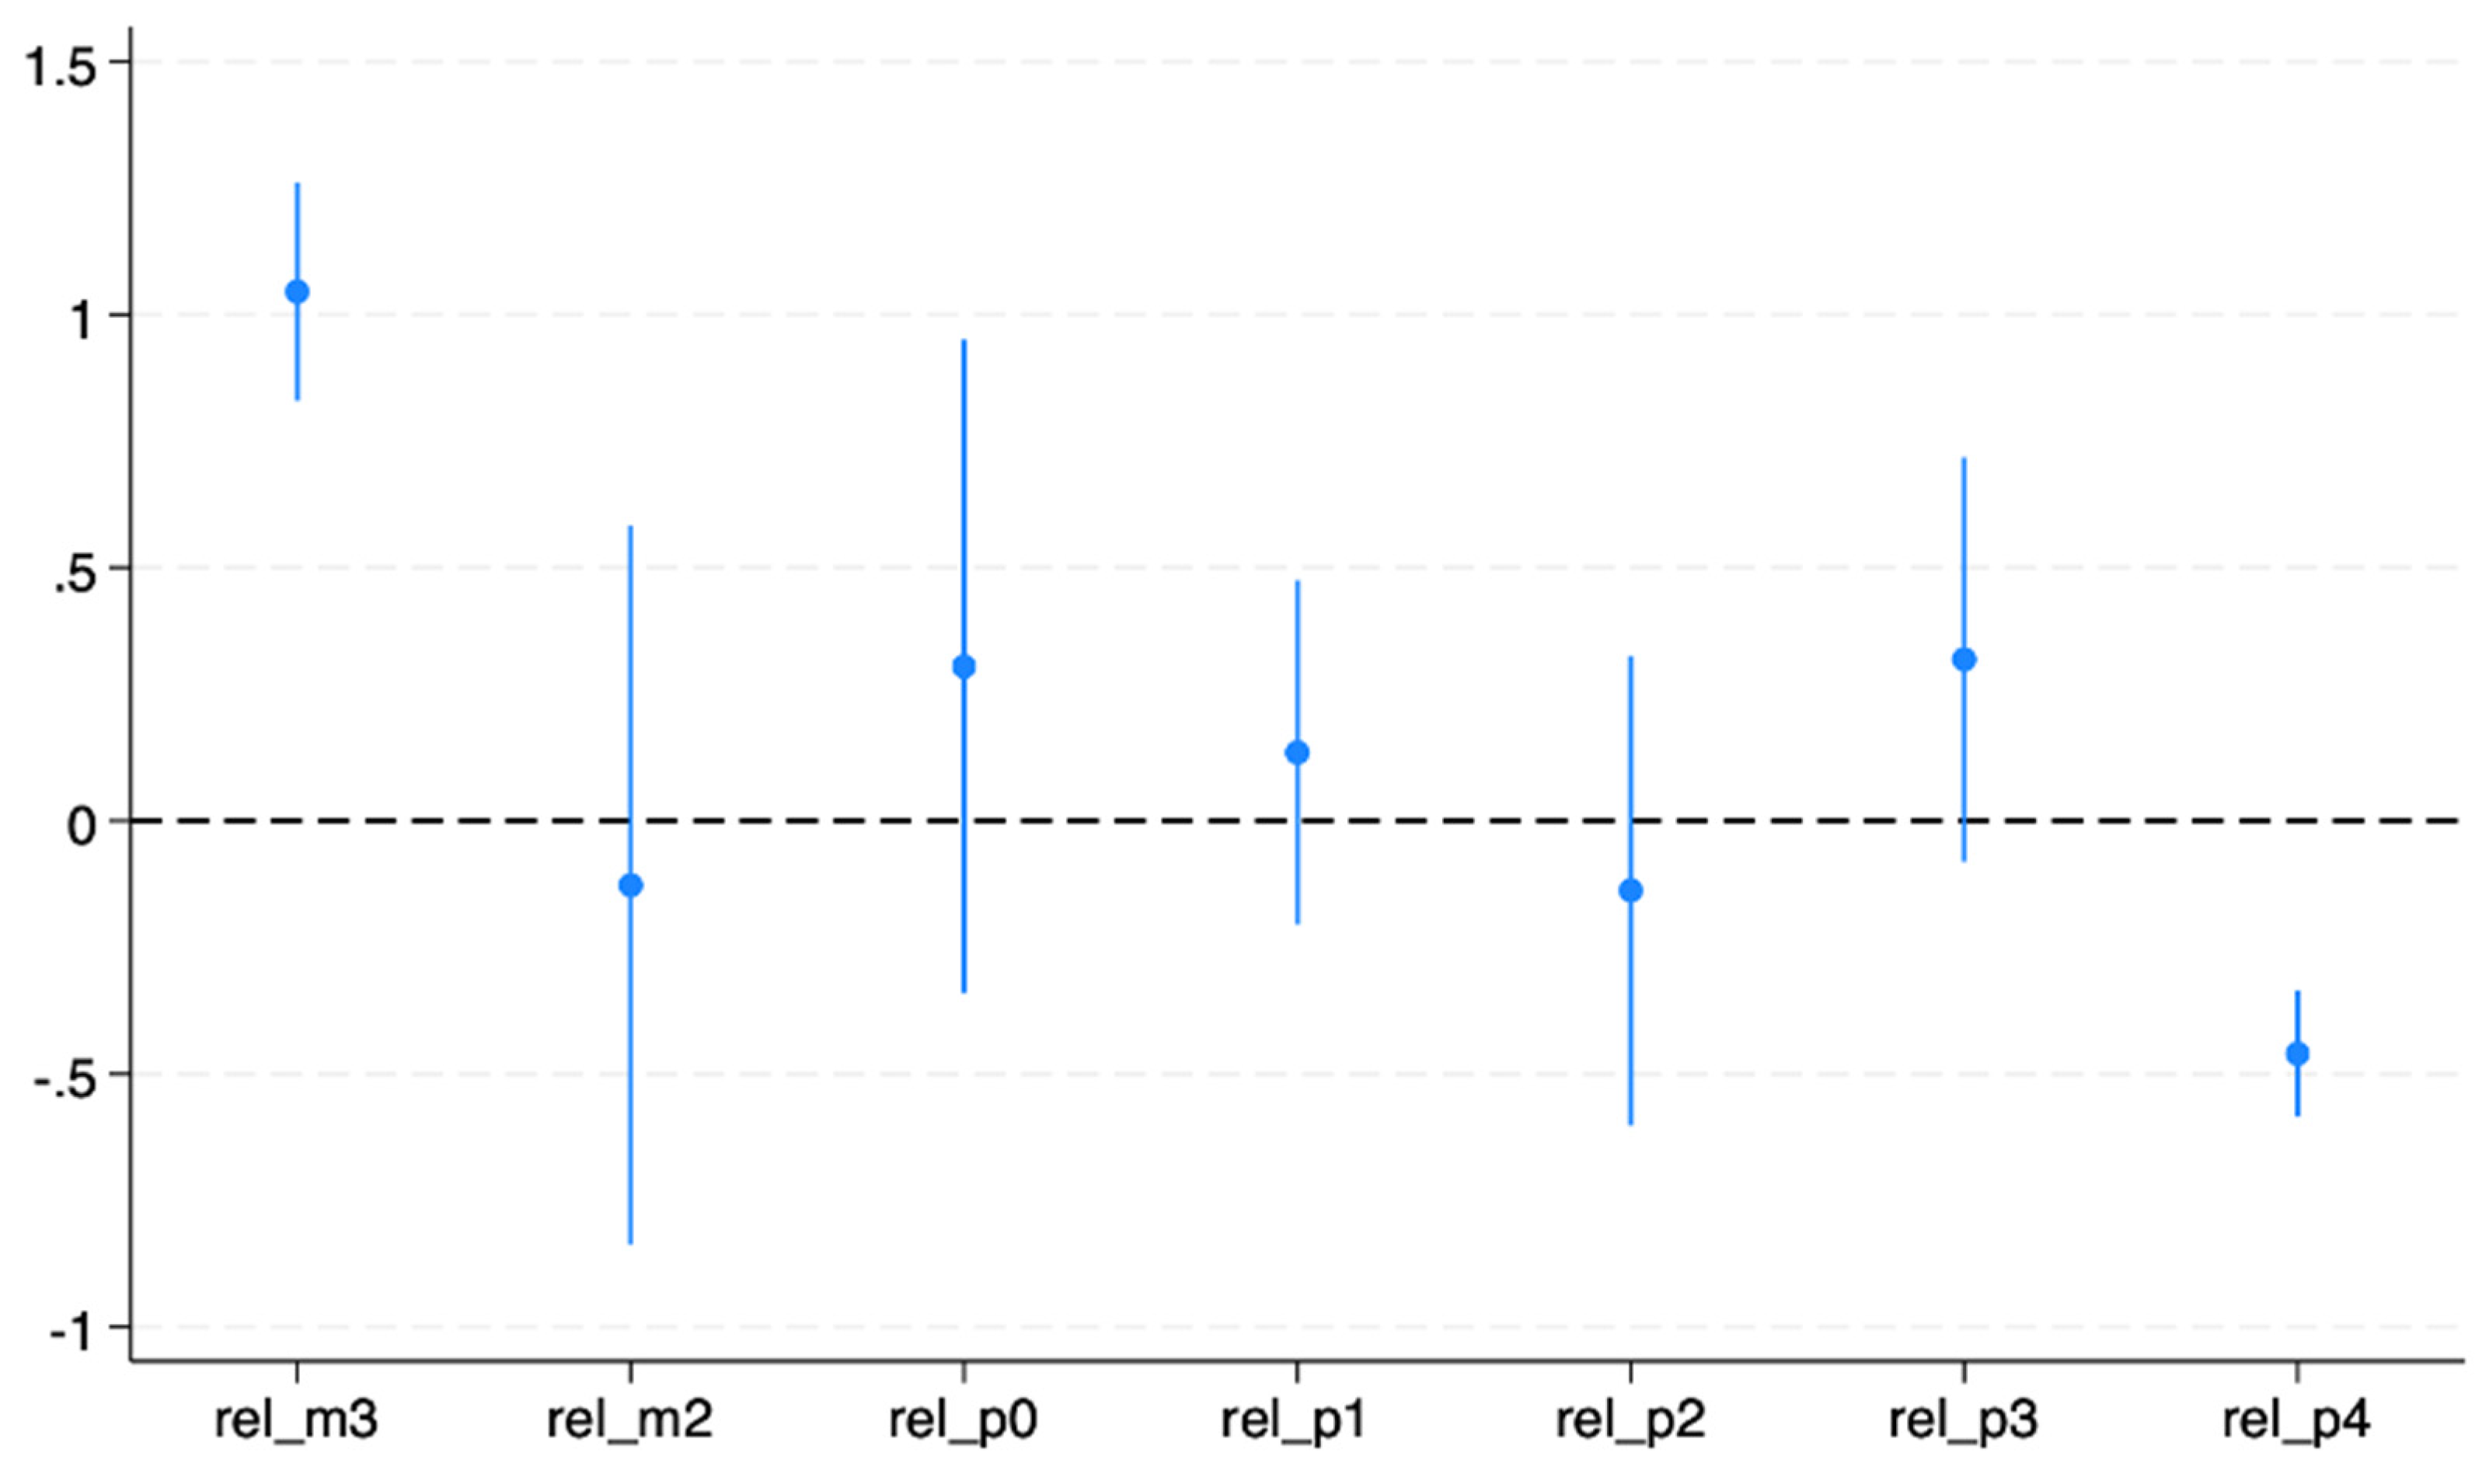
Table 2, the pre-policy periods (rel_m2 and rel_0) exhibited flat trends, whereas rel_m3 showed a significant positive spike, suggesting potential anticipatory behavior. Post-policy estimates (rel_p1 – rel_p4) were generally negative, indicating modest improvements in self-rated health following policy implementation.
The negative post-policy coefficients imply that after adoption, the share of adults reporting fair/poor health fell by approximately 0.4–0.5 percentage points compared with control states.
Figure 1 illustrates the effects of dynamic treatment. While the initial decline suggests potential improvements, the pre-policy increase at rel_m3 indicates a possible violation of the parallel-trend assumption, motivating further robustness tests.
Estimated effects of income-related policy adoption on the probability of reporting fair or poor health relative to the year before implementation (baseline = −1). Each dot represents the estimated effect at a given event time from −3 to +4 years, with 95% confidence intervals clustered at the state level.
3.3. Robustness Checks
Several alternative models were estimated to assess the sensitivity of the results: (1) event-study models with state-specific linear trends, (2) short-window specification (−2 to +3 years), and (3) quadratic trend model.
As shown in
Table 3, the post-policy coefficients remained small and negative across all models, but only the short-window specification produced statistically significant effects.
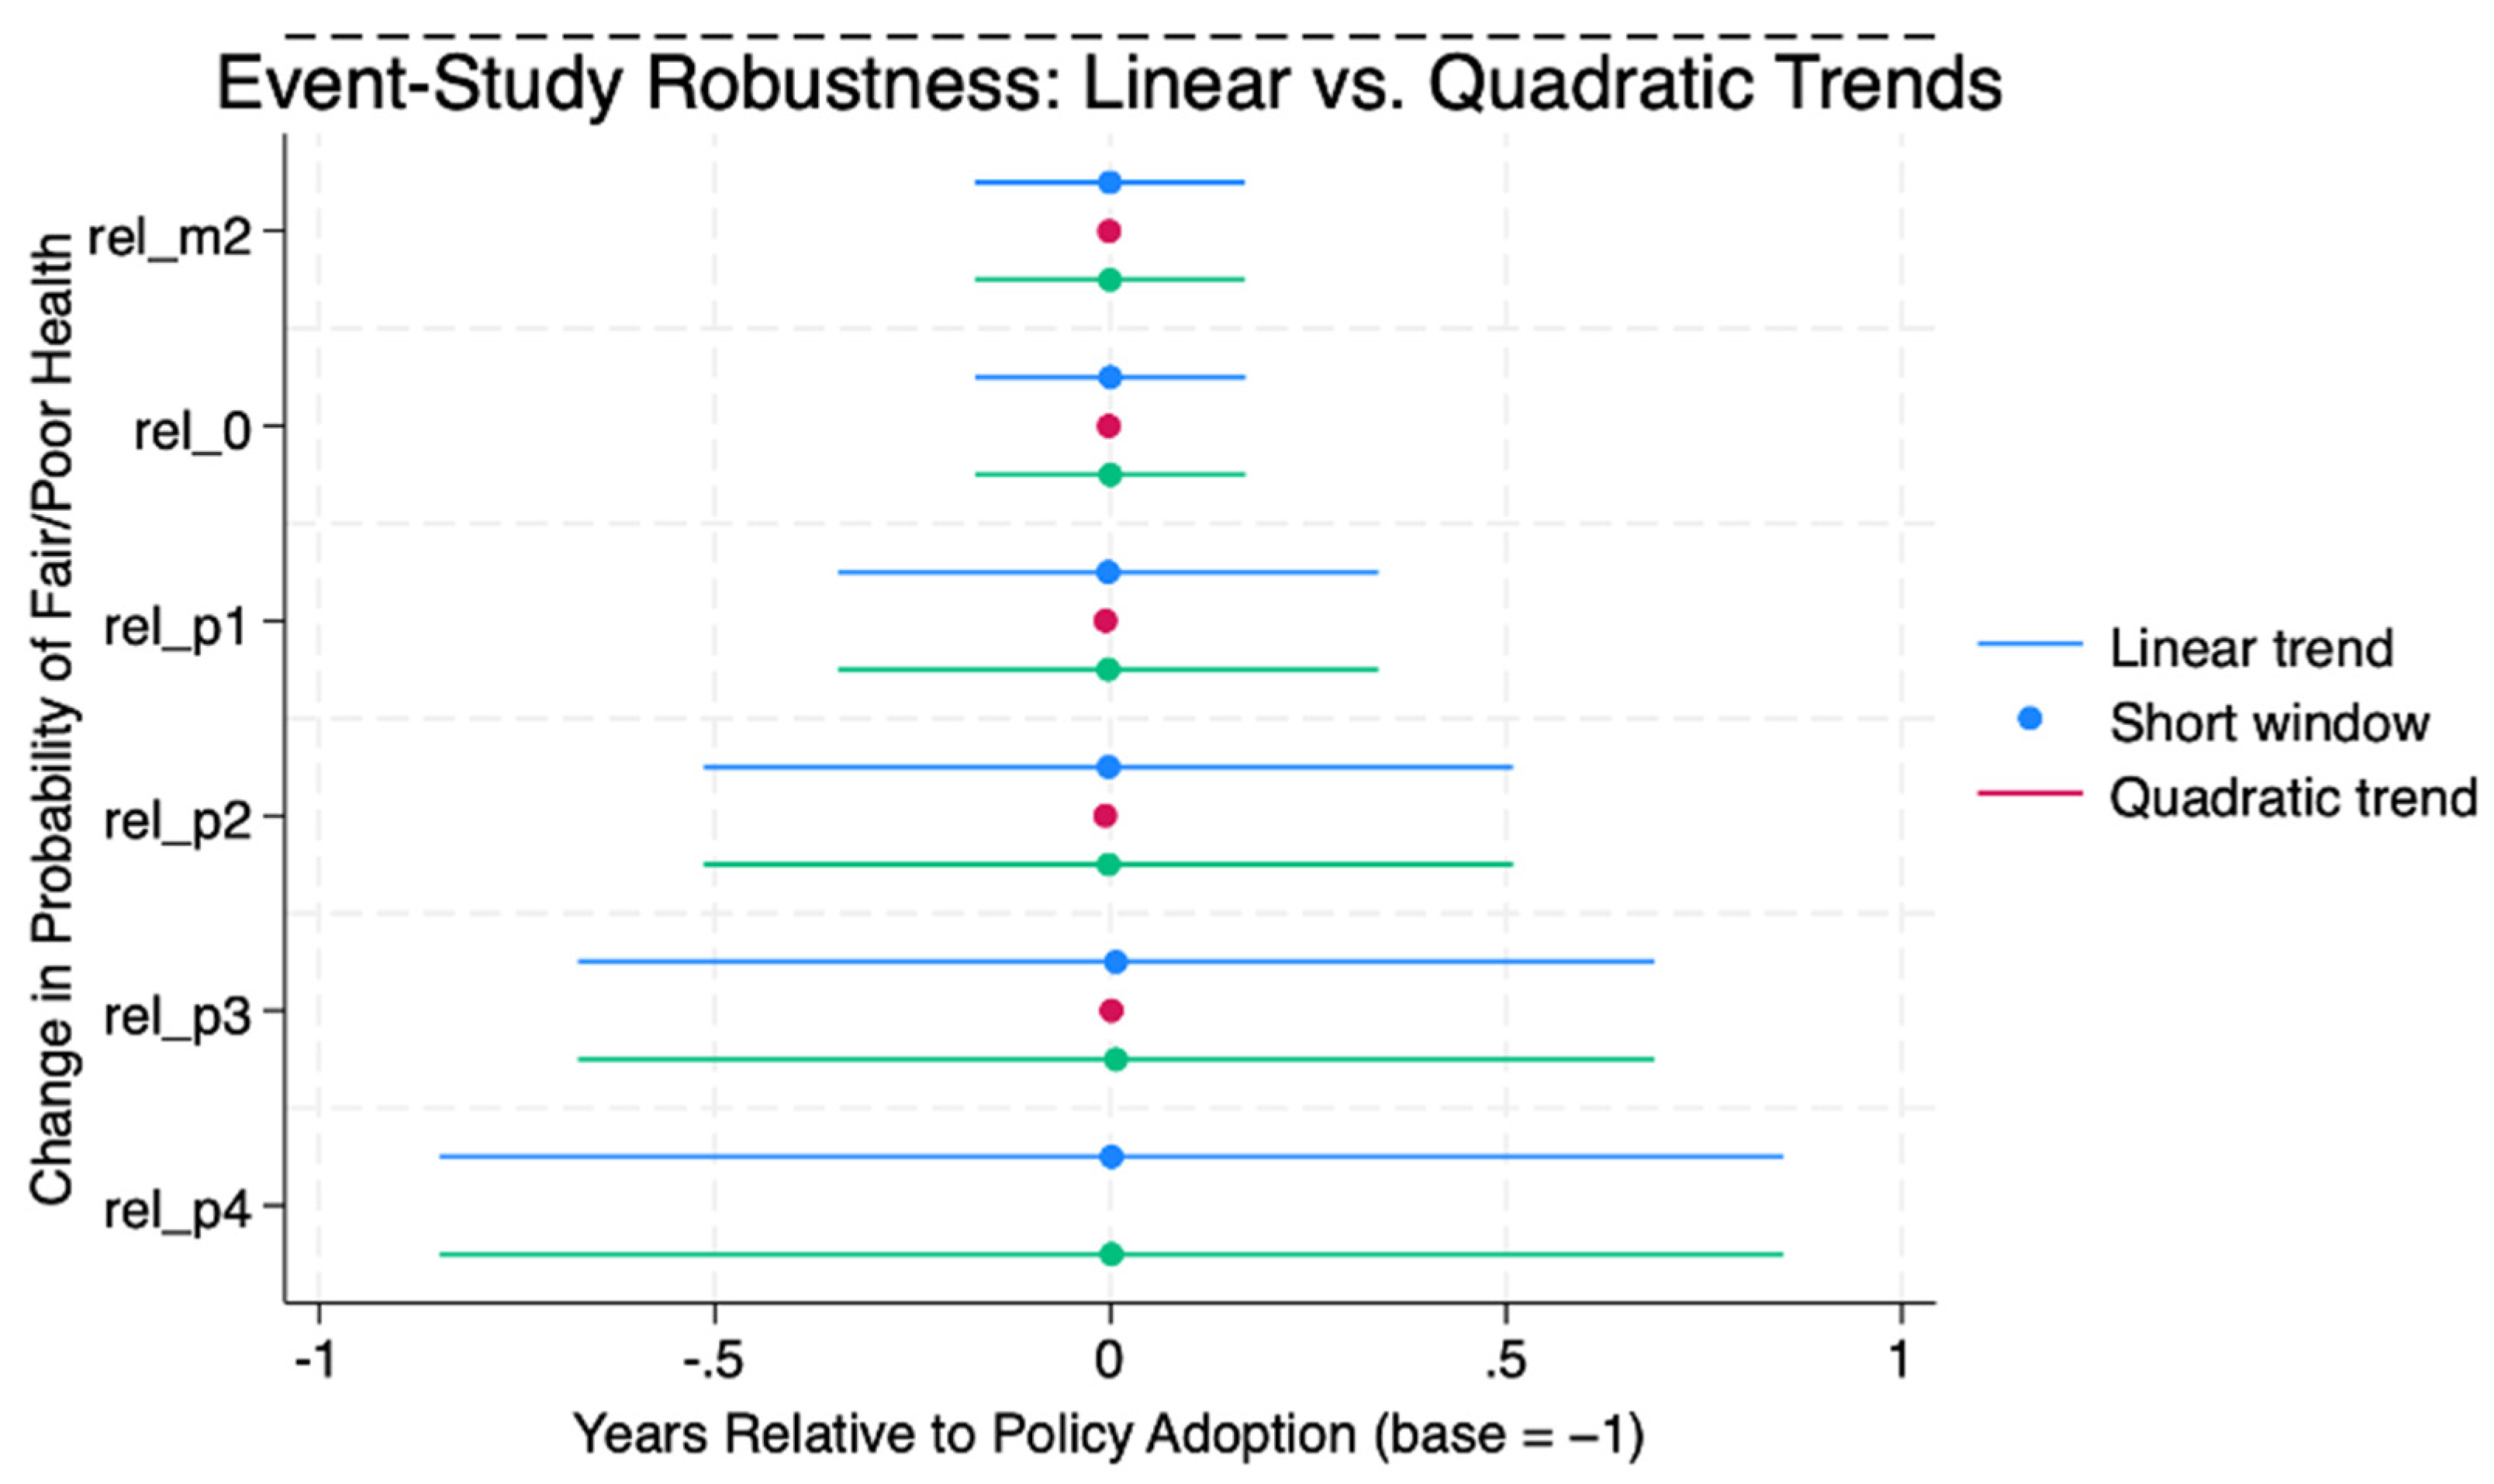
Figure 2 shows the results of the trend-adjusted event study. After adjusting for state-specific linear trends, all pre-policy coefficients became statistically indistinguishable from zero, indicating that the baseline pattern likely reflected the underlying differences between the treated and control states, rather than causal effects.
Estimated policy effects adjusted for state-specific linear trends. All the pre-policy coefficients are statistically indistinguishable from zero. The post-policy coefficients are small and non-significant, indicating that the underlying state-level differences account for much of the initial association.
3.4. Placebo Analysis
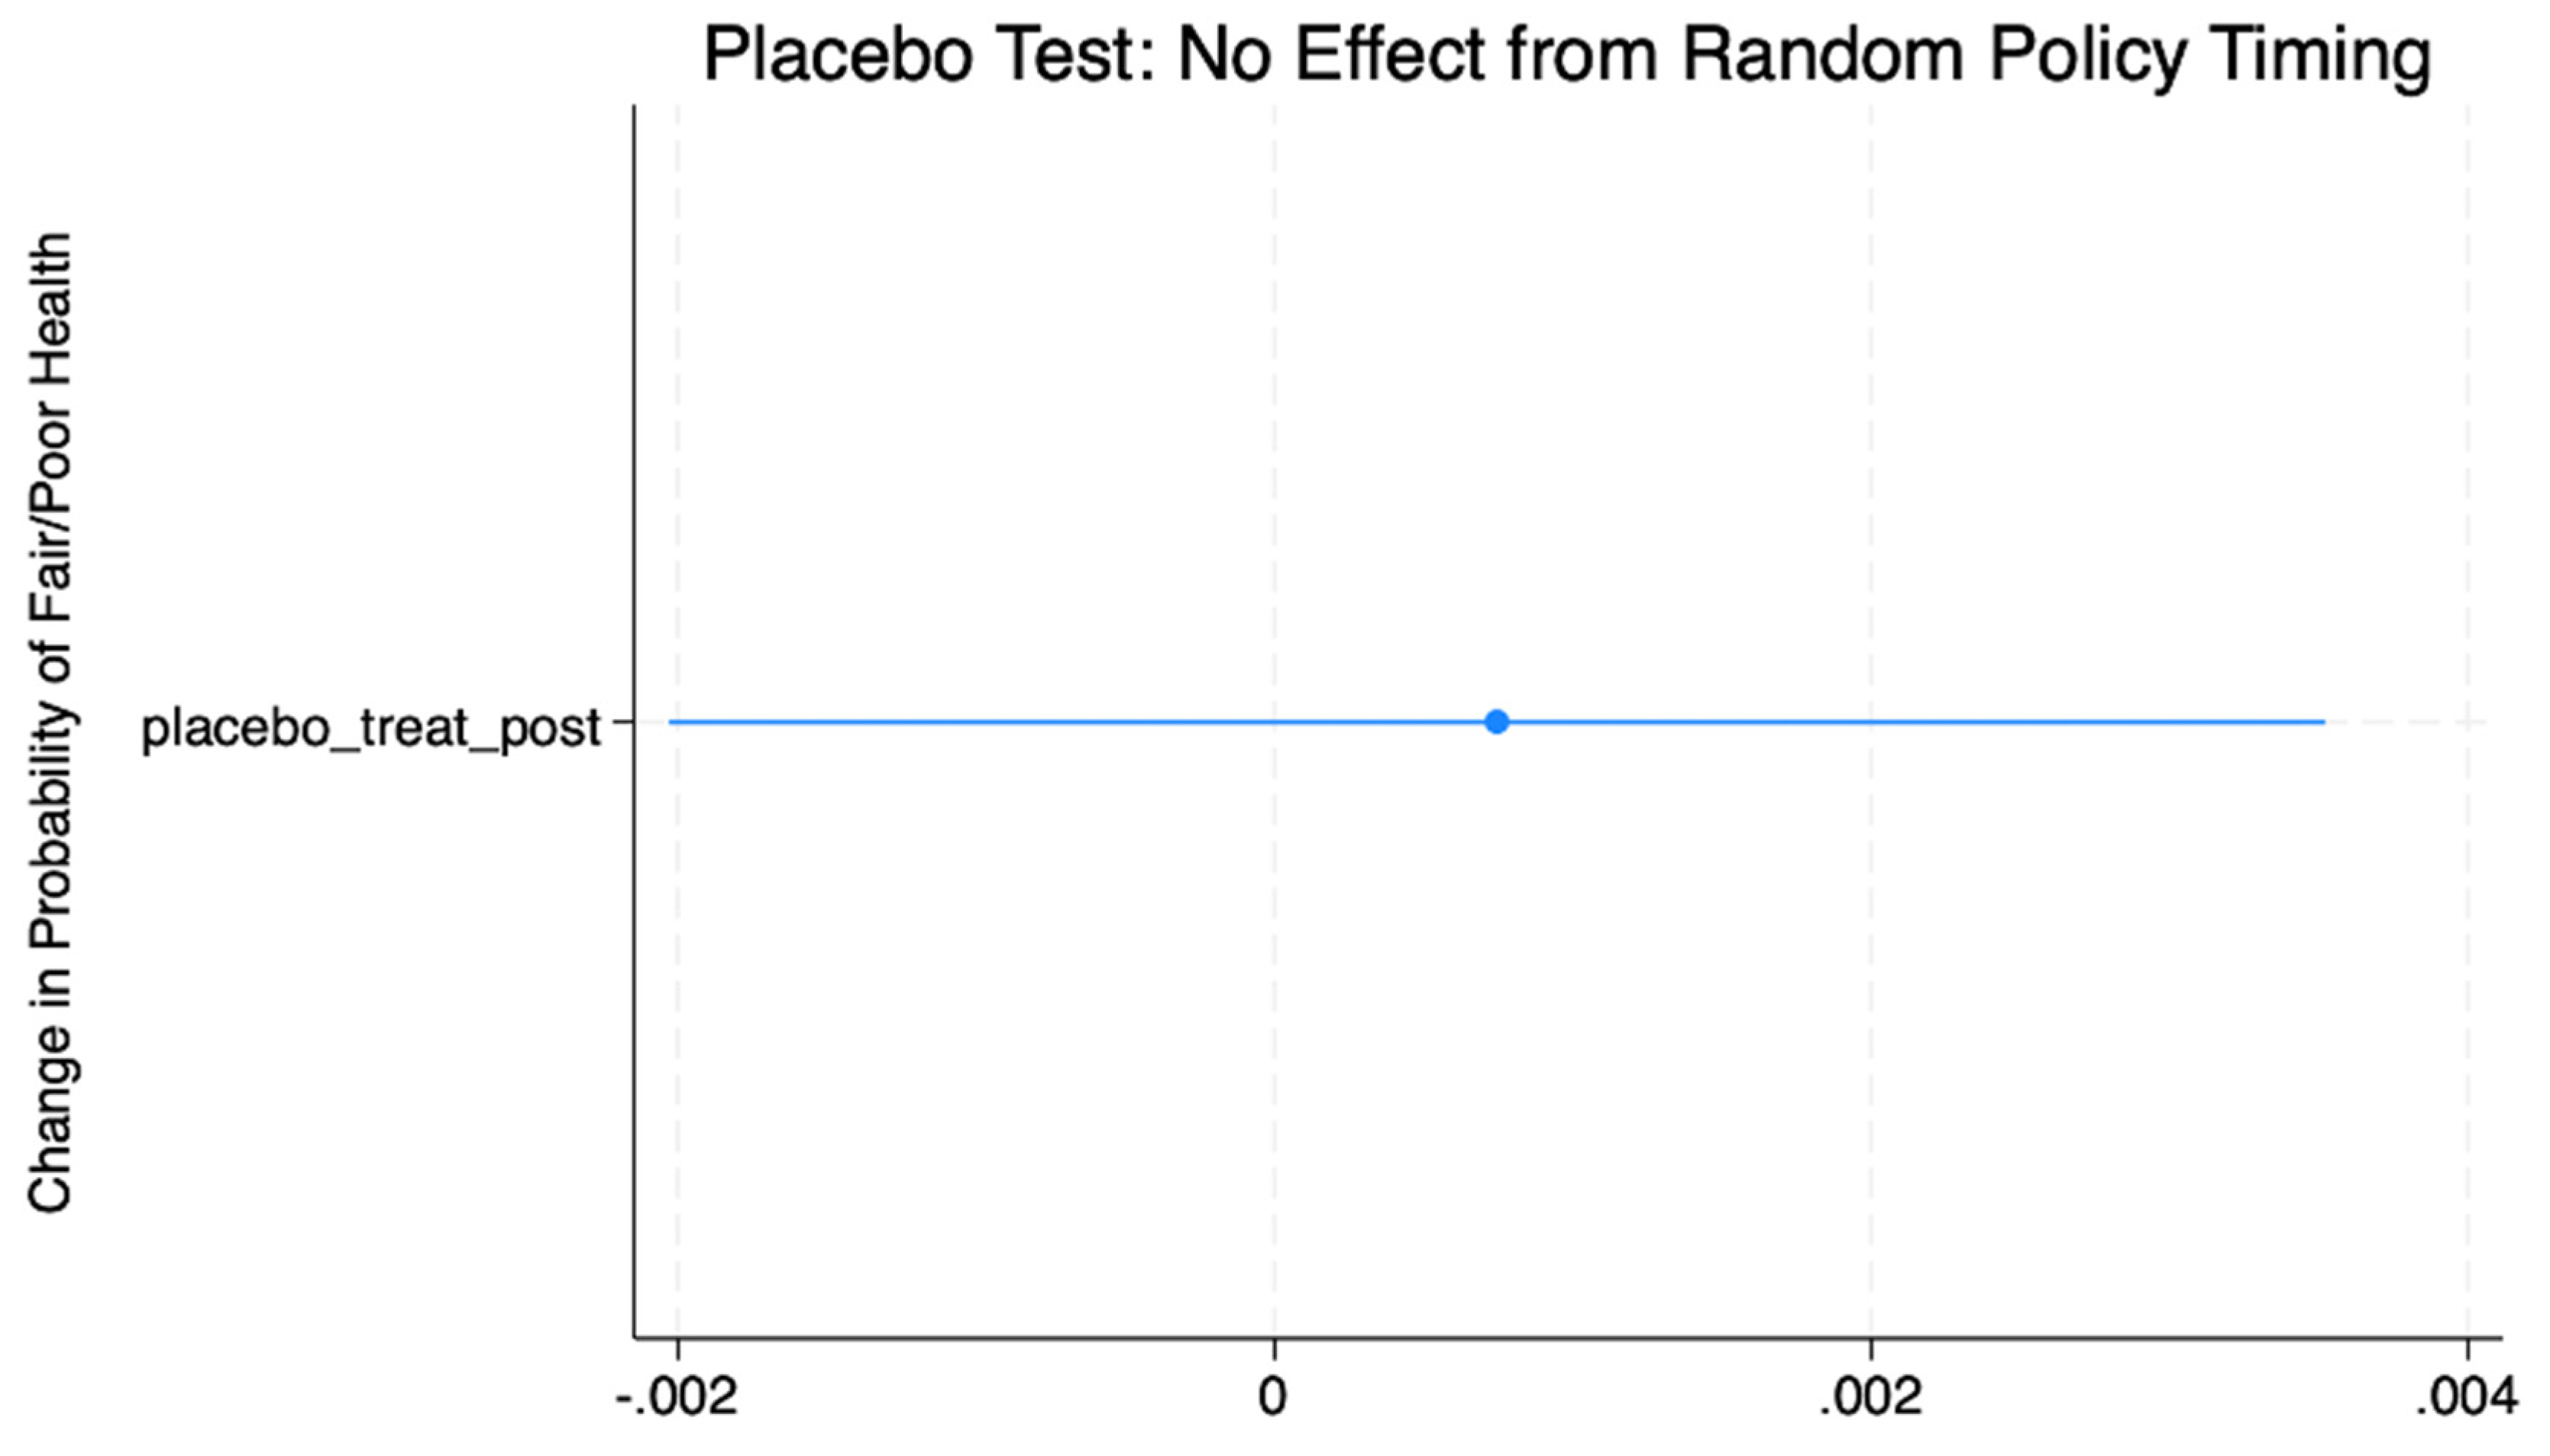
To ensure that unrelated time trends did not drive the observed effects, we conducted a placebo test assigning random “policy adoption” years to control states. As shown in
Figure 3, the placebo estimates were statistically insignificant and centered around zero (β = 0.0007,
p = 0.59). This supports the validity of the identification strategy and confirms that the results are not artifacts of chance or model specifications.
Estimated placebo effects from randomly assigned policy years in control states. The estimated coefficient was close to zero, with 95% confidence intervals (CIs) crossing the null line.
3.5. Trend-Adjusted and Short-Window Comparison
A final robustness check compared the trend-adjusted and short-window event study specifications.
Figure 4 shows that across both models, the treatment effects remained close to zero and statistically insignificant. This finding reinforces that the observed baseline improvements in self-rated health were likely driven by pre-existing trends rather than the causal impacts of policy adoption.
Comparison of event study estimates from a trend-adjusted model (blue) and short-window specification (pink). Both approaches yielded null results, confirming that the main findings are robust to alternative functional forms and event-window assumptions.
4. Discussion
This study attempted to estimate the causal effect of income-related state policies on self-rated health using a quasi-experimental difference-in-differences framework applied to the BRFSS data from 2018 to 2023.
4.1. Main Findings
Initial estimates indicated that income-equalizing policies, such as minimum wage increases, Medicaid expansion, and Earned Income Tax Credit adjustments, were associated with small reductions in the share of adults reporting fair or poor health. However, once state-specific linear and quadratic trends were included, the effects were no longer statistically significant. This suggests that the baseline association likely reflects confounding from pre-existing differences between the treated and control states. The statistically significant pre-trend observed three years before policy adoption (rel_m3) underscores the need to correct anticipatory or endogenous policy timing to obtain unbiased estimates.
4.2. Interpretation and Policy Relevance
These results align with prior evaluations showing that short-term health improvements following economic policy interventions often attenuate after adjusting for dynamic confounding and heterogeneous adoption timing [
17,
18,
19]. Previous studies, including those examining the Earned Income Tax Credit and Medicaid expansion, have shown modest but measurable improvements in child and adult health outcomes through increased income stability and reduced financial stress [
20,
21]. In contrast, our findings suggest that the short-run associations between income-related policies and self-rated health are primarily explained by concurrent economic recovery or policy spillovers rather than direct causal effects.
From a policy perspective, these results imply that income-support interventions require longer time horizons to manifest measurable population health gain. Delayed effects may arise from gradual changes in financial security, stress physiology, and health behaviors. Complementary social programs, such as affordable housing, nutrition assistance, and behavioral health support, could enhance the translation of economic policy benefits into improved health outcomes [
22,
23].
4.3. Robustness and Sensitivity
The absence of statistically significant effects after trend adjustment was corroborated by placebo tests, short-window specifications, and alternative model forms, reinforcing confidence in the internal validity of the findings. The event study and sensitivity analyses collectively indicated that the observed baseline improvements were driven by pre-existing trajectories rather than by new policy interventions.
4.4. Strengths and Limitations
Key strengths include a quasi-causal identification strategy, the use of large nationally representative data, and extensive robustness testing. However, the residual confounding from unobserved state-level shocks cannot be ruled out. Additionally, self-rated health, although validated and widely used, may not fully capture objective health changes. Finally, the analysis covered a relatively short period (≤5 years), limiting the ability to detect long-term or cumulative effects of income-related policies.
Future research should extend the observation window and explore heterogeneous effects across socioeconomic and demographic subgroups as well as potential lagged health impacts. Integrating administrative and clinical data with survey measures could further strengthen causal inferences in policy evaluation.
5. Conclusion
After accounting for pre-policy trends and state-specific trajectories, this study found no statistically significant causal effect of income-related state-policy adoption on self-rated health. The results emphasize the importance of rigorous implementation of difference-in-differences methods, particularly the validation of the parallel-trends assumption. Although baseline models suggest modest improvements, these likely reflect pre-existing dynamics rather than actual policy impacts. Future research should prioritize long-term evaluations; explore subgroup heterogeneity by income, race, and geography; and assess the potential of integrated economic and public health strategies to reduce persistent health disparities.
Author Contributions
Kola Adegoke conceived the study, conducted data analysis, interpreted the results, and drafted the manuscript. The author approved the final version of the manuscript and was accountable for all aspects of the work.
Funding
This research received no specific grants from any funding agency in the public, commercial, or not-for-profit sectors.
Competing Interests
The author declares no competing interests.
Acknowledgments
The authors gratefully acknowledge Kenneth Knapp, PhD, and Adam Block, PhD, of the School of Health Sciences and Practice, New York Medical College, 40 Sunshine Cottage Road, Valhalla, NY 10595, USA, for their mentorship and academic guidance throughout the development of this study.
References
- Marmot M. Social determinants of health inequalities. Lancet. 2005;365(9464):1099–1104. [CrossRef]
- Kondo N, Sembajwe G, Kawachi I, van Dam RM, Subramanian SV, Yamagata Z. Income inequality, mortality, and self-rated health: a meta-analysis of multilevel studies. BMJ. 2009;339:b4471. [CrossRef]
- Braveman P, Gottlieb L. The social determinants of health: it's time to consider the causes of the causes. Public Health Rep. 2014;129 Suppl 2(Suppl 2):19–31. [CrossRef]
- Subramanian SV, Kawachi I. Income inequality and health: what have we learned so far? Epidemiol Rev. 2004;26:78–91. DOI: 10.1093/epirev/mxh003.
- Hoynes H, Miller D, Simon D. Income, the Earned Income Tax Credit, and Infant Health. American Economic Journal: Economic Policy. 2015;7(1):172–211. https://www.aeaweb.org/articles?id=10.1257/pol.20120179.
- Dow WH, Godøy A, Lowenstein CA, Reich M. Can economic policies reduce deaths of despair? Natl Bur Econ Res Working Paper Series. 2019;No. 25787. Available from: https://ssrn.com/abstract=3380819.
- Sommers BD, Baicker K, Epstein AM. Mortality and access to care among adults after state Medicaid expansions. N Engl J Med. 2012;367(11):1025–1034. https://doi.org/10.1056/NEJMsa1202099. [CrossRef]
- Solar O, Irwin A. A conceptual framework for action on the social determinants of health. Geneva: World Health Organization; 2010. Available from: https://www.who.int/publications/i/item/9789241500852.
- Centers for Disease Control and Prevention (CDC). Behavioral Risk Factor Surveillance System (BRFSS). https://www.cdc.gov/brfss. Accessed 2025 Oct 12.
- Ruggles S, Flood S, Goeken R, et al. IPUMS USA: Version 12.0 [dataset]. Minneapolis, MN: IPUMS; 2024. Available from: . [CrossRef]
- National Conference of State Legislatures (NCSL). Minimum Wage and Income Tax Policy Database. https://www.ncsl.org. Accessed 2025 Oct 12.
- Tax Policy Center. State Tax Policy Tracker. https://www.taxpolicycenter.org. Accessed 2025 Oct 12.
- Correia S. reghdfe: Linear and instrumental-variable regression absorbing any number of high-dimensional fixed effects. Stata J. 2016;16(2):1–31. Available from: https://ideas.repec.org/c/boc/bocode/s457874.html.
- Sun L, Abraham S. Estimating dynamic treatment effects in event studies with heterogeneous treatment effects. J Econometrics. 2021;225(2):175–99. [CrossRef]
- Wing C, Simon K, Bello-Gomez RA. Designing difference-in-difference studies: best practices for public health policy research. Annu Rev Public Health. 2018;39:453–469. [CrossRef]
- Zeldow B, Hatfield LA. Confounding and regression adjustment in difference-in-differences studies. Health Serv Res. 2021;56(5):932–41. [CrossRef]
- Baird S, de Hoop J, Özler B. Income shocks and adolescent mental health. J Hum Resour. 2013;48(2):370–403. [CrossRef]
- Ruhm CJ. Recessions, healthy no more? J Health Econ. 2015;42:17–28. [CrossRef]
- Bitler M, Hoynes H. Strengthening Temporary Assistance for Needy Families. The Hamilton Project, Brookings Institution Policy Proposal 2016-04. Washington, DC: Brookings Institution; 2016. Available from: https://www.hamiltonproject.org/publication/strengthening-temporary-assistance-for-needy-families.
- Hamad R, Rehkopf DH. Poverty and child development: a longitudinal study of the impact of the Earned Income Tax Credit. Am J Epidemiol. 2016;183(9):775–784. [CrossRef]
- Sommers BD, Gawande AA, Baicker K. Health insurance coverage and health — what the recent evidence tells us. N Engl J Med. 2017;377(6):586–593. [CrossRef]
- Berkowitz SA, Basu S, Gundersen C, Seligman HK. State-level and county-level estimates of health care costs associated with food insecurity. Prev Chronic Dis. 2019;16:E90. [CrossRef]
- Glymour MM, Avendano M, Kawachi I. Socioeconomic status and health. In: Berkman LF, Kawachi I, Glymour MM, editors. Social Epidemiology. 2nd ed. Oxford University Press; 2014. p. 17–62. , accessed 15 Oct. 2025. [CrossRef]
|
Disclaimer/Publisher’s Note: The statements, opinions and data contained in all publications are solely those of the individual author(s) and contributor(s) and not of MDPI and/or the editor(s). MDPI and/or the editor(s) disclaim responsibility for any injury to people or property resulting from any ideas, methods, instructions or products referred to in the content. |
© 2025 by the authors. Licensee MDPI, Basel, Switzerland. This article is an open access article distributed under the terms and conditions of the Creative Commons Attribution (CC BY) license (http://creativecommons.org/licenses/by/4.0/).