
Submitted:
22 August 2025
Posted:
25 August 2025
You are already at the latest version
Abstract
Background: Protein prenylation is crucial for the function of hundreds of proteins. Aberrant protein prenylation can be caused by aberrant expression of prenyltransferases (PTases), which has been reported for multiple cancer entities. The reasons for aberrant PTase expression in cancer have not yet been investigated. Methods: We analyzed CpG methylation within promoter-associated CpG islands of PTase genes FNTA, FNTB, PGGT1B and RABGGTA via bisulfite conversion and pyrosequencing to assess its role in PTase expression and gain deeper insight into the regulation of protein prenylation in cancer. We used DNA from three benign controls (whole blood samples, peripheral blood mononuclear cells, HEK293) and 19 human cancer cell lines from various origins to assess DNA methylation within PTase gene promoter-associated CpG islands. For a subset of these cell lines, we measured mRNA expression via qPCR and correlated it with DNA methylation. Results: Methylation across all PTase genes ranged from 1.9 % ± 0.9 to 11.4 % ± 4.0 (mean methylation ± standard deviation) in benign cells, and 2.3 % ± 1.0 to 16.0 % ± 5.4 in cancer cells. DNA methylation and mRNA expression of PGGT1B correlated inversely (PCC = −0.75; p = 0.005). Conclusions: We saw no general differences between benign and malignant cells, but observed significant differences between non-malignant controls and multiple individual cancer cell lines regarding methylation of PTase genes, most prominently of FNTA and PGGT1B in Caki-1 and Kelly cells, raising the possibility that DNA methylation is involved in the dysregulation of PTase expression in cancer.
Keywords:
protein prenylation
; prenyltransferases
; DNA methylation
; mRNA expression
; cancer
; pyrosequencing
; qPCR
; regulation
1. Introduction
Protein prenyltransferases (PTases) are a group of conserved heterodimeric enzymes comprising farnesyltransferase (FTase) and geranylgeranyltransferase type I & II (GGTase I & GGTase II). They use the mevalonate pathway intermediates farnesyldiphosphate (FPP) or geranylgeranyldiphosphate (GGPP) for the posttranslational modification of hundreds of proteins (among them many encoded by proto-oncogenes, e.g. Ras), which is crucial for the proper function and localization of those proteins. A third geranylgeranyltransferase (GGTase III) has been identified, but only a few of its targets are currently known [1,2]. Aberrant expression of FTase, GGTase I and GGTase II has frequently been observed in cancer, including ovarian carcinoma [3,4], skin carcinoma [4,5], glioma [6] and liver cancer [7]. However, the causes of the divergent PTase expression in cancer remain mostly unknown.
DNA methylation of CpG dinucleotides represents one major epigenetic mechanism regulating gene expression that is frequently altered in cancer, especially within CpG islands covering regulatory regions [8]. For another enzyme involved in protein prenylation, GGPP synthase (GGPPS), a connection between differentially methylated promoters, altered gene expression, altered protein prenylation and disease progression has been demonstrated [9]. GGPPS is responsible for the synthesis of GGPP from FPP, and DNA methylation of the GGPPS promoter following juvenile mumps infection results in an imbalance of both prenyl substrates, aberrant protein prenylation and consequently adult infertility [9]. Furthermore, in plant physiology, GGPPS expression is altered due to DNA methylation during root growth stages of red sage (Salvia miltiorrhiza), indicating a regulatory mechanism conserved far beyond the mammalian context [10].
Considering that differences in DNA methylation are often contributing to aberrant gene expression in cancer, and that DNA methylation is involved in the regulation of GGPPS expression under both pathological and physiological conditions, we hypothesized that human PTase promoters might also contain CpG islands that exhibit distinct methylation patterns in cancer cells, thus altering PTase expression in cancer. We therefore looked for CpG islands in the gene promoters of FTase (FNTA, FNTB), GGTase I (FNTA, PGGT1B) and GGTase II (RABGGTA, RABGGTB). Subsequently, we assessed DNA methylation within the identified CpG islands via bisulfite pyrosequencing in 19 cancer cell lines (including ovarian, brain and liver cancer) and compared it to the methylation in whole blood samples, peripheral blood mononuclear cells (PBMCs) and HEK293 cells. Finally, we assessed mRNA expression of these genes in a subset of these cell lines via qPCR and absolute quantification, and checked for correlations between DNA methylation and mRNA expression.
2. Materials and Methods
Identification of CpG Islands and Primer Design
We examined the human PTase genes FNTA, FNTB, PGGT1B, RABGGTA and RABGGTB regarding the presence of CpG islands (as defined by Takai and Jones [11]) using the Genome Data Viewer from the National Center for Biotechnology Information (assembly GRCh38.p14; https://www.ncbi.nlm.nih.gov/genome/gdv/?org=homo-sapiens). We then designed multiple pairs of oligonucleotides for the amplification of regions within the identified CpG islands via polymerase chain reaction (PCR) after bisulfite conversion using the PyroMark Assay Design software (version 2.0.1.15; Qiagen, Hilden, Germany). We selected one oligonucleotide pair per gene based on PCR product specificity (as evaluated by agarose gel electrophoresis), as well as signal strength and reproducibility during pyrosequencing.
Cell Culture
HEK293, HeLa, PC3 and HepG2 cells were cultured in Dulbecco's Modified Eagle Medium (DMEM; PAN-Biotech, Aidenbach, Germany), with HepG2 cells being supplemented with 1 % non-essential amino acids and 2 mmol/l glutamine. A-498, DU-145 and J82 cells were cultured in Eagle's Minimum Essential Medium (EMEM; PAN-Biotech). A2780, Kelly, Jurkat, JAR, NIH:OVCAR-3, LNCaP, SK-N-AS, IMR-5 and SH-SY5Y cells were cultured in Roswell Park Memorial Institute (RPMI) 1640 medium (PAN-Biotech). U2OS, Caki-1, T24, and SK-OV-3 cells were cultured in McCoy’s 5A Medium (PAN-Biotech), with T24 and SK-OV-3 cells being supplemented with 2 mmol/l glutamine. Each medium was additionally supplemented with 10 % fetal bovine serum (FBS), 100 U/ml penicillin and 100 µg/ml streptomycin, and cells were kept in a humidified incubator at 37 °C and 5 % CO2.
DNA Extraction, Processing of Controls and Bisulfite Treatment
For DNA extraction, cells were grown to ~ 90 % confluence, detached with trypsin/EDTA (PAN-Biotech) and pelletized via centrifugation at 300 x g for 5 minutes. DNA was then extracted from cell pellets (or from a whole blood sample) using the DNeasy Blood & Tissue Kit (Qiagen), and concentration and purity was determined via the ratio of absorbance at 260 nm and 280 nm as measured on an Infinite M Plex plate reader in combination with a NanoQuant plate (Tecan Infinite200 Pro, Tecan Group AG, Männedorf, Switzerland). The whole blood and PBMC samples were acquired commercially from Research Donors Ldt (London, UK) as anonymized samples including the healthy donors' consent for using the samples in biomedical research. We used maximally and minimally methylated, bisulfite converted DNA from the EpiTect PCR Control DNA Set (Qiagen) as positive controls (PC) and negative controls (NC), respectively. All non-control DNA samples were bisulfite-treated according to the manufacturer’s instructions using the EpiTect Bisulfite Kit (Qiagen).
Bisulfite Sequencing PCR and Pyrosequencing
Following bisulfite conversion, the regions of interest (ROI) within the promoters of FNTA, FNTB, PGGT1B and RABGGTA were amplified via bisulfite sequencing PCR (BSP) using Taq DNA Polymerase (Master Mix RED, AMPLIQON, Odense, Denmark). DNA samples or controls served as templates, and the following oligonucleotides were used as primers: FNTA_forward: 5’-GTTTTTTTATGTTTTGTATAGGTAA-3’; FNTA_reverse: 5’-biotin-ACAATCAAAAATACAACAATTTCC-3’; FNTB_forward: 5’-TATTGGGTAGAGGAGTTGTTG-3'; FNTB_reverse: 5’-biotin- ATACCCCAAAATACACAATAATTCTTTTAA-3'; PGGT1B_forward: 5’-biotin-TTATTGAGGATGAGAGGTTAGTAGG-3'; PGGT1B_reverse: 5’-AAACCCACTTAAAACCAATCAATAC-3'; RABGGTA_forward: 5’-biotin-TTTGGGGAGTAGAGTGGTT-3'; RABGGTA_reverse: 5’-CCCTACTAACTCCCCCCACAACTATATCC-3'. The primer stock solutions had a concentration of 10 µmol/l. The total volume of each PCR was 30 µl, containing 15 µl Taq Mix, 0.5 µl DNA template, 1 µl forward and reverse primer each (RABGGTA: 0.8 µl each), 1 µl DMSO (except for FNTB) and 11.5 – 12.5 µl H2O. Each PCR was started with an initial denaturation at 95 °C for 3 min, followed by 45 cycles of 30 s at 95 °C, 30 s at a ROI-specific annealing temperature (FNTA: 49.1 °C; FNTB: 58.0 °C; PGGT1B: 54.1 °C; RABGGTA: 57.2 °C), 20 s elongation at 72 °C, and concluded with 5 min at 72 °C. For each run, at least one no-template control (NTC) was included, lacking a DNA template. After BSP, the PCR reaction products were cleaned up using the ROTI Prep PCR Purification Kit (Carl Roth, Karlsruhe, Germany). Subsequently, part of the PCR products was visualized on a 2.5 % agarose gel using the Ultra Low Range (ULR) DNA Ladder (Thermo Fisher Scientific, Waltham, Massachusetts, USA) for size comparison. The remaining PCR products were immobilized on streptavidin-coated sepharose beads, treated with 0.2 mol/l NaOH for strand separation and annealed to the respective sequencing primer (FNTA_seq: 5’-GAGGTTTAGAGGTTTTAAGA-3’; FNTB_seq: 5’- AGGAGTTGTTGTAAGAG-3'; PGGT1B_seq: 5’-TACCAACCTAACTAACTATA-3'; RABGGTA_seq: 5’-AAACTTTACACCTTCCACAAAAAA-3') for 2 min at 80 °C before sequencing on a PyroMark Q24 device (Qiagen). The sequencing of all four ROIs was performed in at least three replicates for each cell line. All oligonucleotides were purchased from Eurofins Genomics, Ebersberg, Germany.
RNA Extraction and cDNA Synthesis
Total RNA isolation was performed with the QuickRNA-Kit (Zymo Research Europe, Freiburg, Germany) according to the manufacturer's instructions and quantified photometrically at 260 and 280 nm using a plate reader. An OD260nm/280 nm of 1.9-2.1 was considered protein-free RNA. Synthesis of cDNA was performed using the PrimeScript RT Master Mix (Takara Bio, Kusatsu, Japan) according to the manufacturer's instructions. For cDNA synthesis, 1 μg RNA was added to 4 μL of 5X PrimeScript RT Master Mix, bringing the total volume to 20 μL with RNAse-free ddH2O. The thermocycler was set for a 15 min reverse transcription at 37°C, a 5-s inactivation at 85°C, and a 4°C hold.
Plasmid Preparation and Linearization
The following plasmids were used in this study: pRSFDUET-1-Hs-FNTalpha-Hs-FNTbeta1 (6,240 bp), pRSFDUET-1-Hs-FNTalpha-GGT1B (6,087 bp), pOTB7-RABGGTA (3,748 bp), pDNR-LIB-RABGGTB (5,687 bp), and pCMV-SPORT6-PTAR1 (5,863 bp). Of these, the first two were constructed by cloning the coding sequences of FNTA and either FNTB or PGGT1B into a pRSF-DUET vector (kindly provided by Gerrit Praefcke), the other plasmids were obtained prefabricated from a commercial supplier (Horizon Discovery Biosciences Limited, Cambridge, UK). All plasmids were amplified in Escherichia coli DH5α and isolated using a standard plasmid miniprep protocol. Following isolation, plasmid DNA was linearized using the restriction enzyme NcoI according to the manufacturer’s instructions. Linearized DNA was purified using a commercial DNA clean-up kit (QIAquick PCR Purification Kit, Qiagen) to remove residual enzyme and buffer components. Purified DNA was then quantified using a spectrophotometer and diluted to a working concentration of 1 ng/μL (for pOTB7-RABGGTA: 10 ng/μL) in nuclease-free water.
Reverse Transcriptase Quantitative PCR
Quantitative polymerase chain reaction (qPCR) amplification was performed using a CFX96 Touch Real-Time PCR Detection System (Bio-Rad) and 96-well PCR plates. Each 20 µL reaction contained 10 µL of 2X iTaq Universal SYBR Green Supermix (Bio-Rad), 1 µL of cDNA, 0.3 µL each of forward and reverse primers (10 pmol) and 8.4 µL of nuclease-free water (Fresenius Kabi, Bad Homburg, Germany). Plates were sealed and run on a C1000 Touch Thermal Cycler with the CFX96 Real-Time System. The amplification protocol consisted of an initial denaturation at 95°C for 3 minutes, followed by 40 cycles of 95°C for 10 seconds, annealing at the respective Ta for 30 seconds, and extension at 70°C for 10 seconds. A melt curve analysis was conducted from 65°C to 95°C (0.5°C increments, 5 seconds each) to verify amplicon specificity. All primers were designed to span exon–exon junctions and produce amplicons of 70–200 bp in length. Oligonucleotides were synthesized by Eurofins MWG Operon LLC.
Linearized plasmid DNA standards were used to generate a 6-fold serial dilution series to enable absolute quantification of transcript levels. These dilutions were used to construct a standard curve for each gene of interest (GOI). After spectrophotometric determination of plasmid DNA concentration X, the copy number Y of standard DNA molecules was calculated using the following formula:
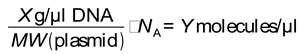
with MW being the molecular weight of the plasmid (as calculated with the NEBioCalculator, version 1.17.2, based on plasmid size or sequence; https://nebiocalculator.neb.com/#!/dsdnaamt), and NA being the Avogadro constant of approximately 6.022 x 10²³ mol-1. The standard curves for each gene were then constructed by plotting each dilutions CT value against the logarithm of its DNA amount, yielding a regression line with R2>0.95 for each gene (Supplementary File S1). The absolute transcript copy numbers of each sample were then determined by entering the samples' CT values into the equation of the regression line.
Amplification was performed for three biological replicates, each in technical duplicates across all experimental conditions.
Statistical Analysis
All statistical analyses were performed in Python (version 3.13) using the packages NumPy (version 2.3.0) and SciPy (version 1.16.0). Differences in DNA methylation between two groups (benign vs. malign) were assessed by unpaired t-test, differences among all investigated cells were assessed using ANOVA followed by Dunnett’s test to compare methylation in each cancer cell line to whole blood, PBMCs and HEK293 cells, yielding the mean difference between the compared samples and the 95% confidence interval (CI). The reported p values represent the multiplicity adjusted p values from Dunnett’s test. To evaluate the correlation between DNA methylation and gene expression, we determined the Pearson correlation coefficient (PCC). Nominal significance was assumed for p < 0.05.
3. Results
CpG islands were found to cover the transcription start sites (TSS) of FNTA, FNTB, PGGT1B and RABGGTA (but not of RABGGTB) containing 117 CpGs, 66 CpGs, 53 CpGs and 62 CpGs, respectively (Figure 1A). Amplification of a 200 to 300 bp long ROI within each of these CpG islands yielded one specific band for each ROI (Figure 1B). Each ROI covered 8 to 11 CpGs that were analyzed (Figure 1A).
The mean methylation of the sample cells ranged from 1.9 % to 16.0 % over all analyzed PTase genes and cell lines, and standard deviation was between 0.8 and 7.1 (Table 1). Mean methylation in the minimally methylated negative controls ranged from 2.2 % to 6.0 %, and in maximally methylated positive controls mean methylation ranged from 72.7 % in PGGT1B to 91.1 % in FNTA, showing that none of the four PTase genes could be regarded as maximally methylated in any of the analyzed sample cells.
Summarized comparisons of benign (whole blood, PBMCs, HEK293) and malign samples (all cancer cell lines) revealed no significant differences in DNA methylation between both groups (Figure 1C). Nonetheless, to detect potential differences between individual cancer cell lines and non-malignant cells, we additionally compared the methylation in each cancer cell line to each benign control in an ANOVA (Figure 1D and Table 1).
For FNTB, there was no cell line for which a significant difference could be detected to each of the three benign controls at once. For FNTA, RABGGTA and PGGT1B, there were several cell lines showing significant differences in DNA methylation (in percentage points, pp) compared to both whole blood samples, PBMCs and HEK293 cells (Table 1, bold highlighting). Methylation of FNTA was significantly higher in Caki-1, DU 145, SK-N-AS and Kelly cells than methylation in each control , with the strongest differences being observed for Kelly cells (whole blood: p<0.0001; 4.7 pp (95%-CI: 2.8;6.6); PBMCs: p<0.0001; 5.2 pp (95%-CI: 3.3;7.1); HEK293: p<0.0001; 7.1 pp (95%-CI: 5.3;9.0), Table 1). In contrast, most cell lines with a significant difference to every benign control regarding methylation of RABGGTA and PGGT1B showed higher methylation than one or two benign controls, but lower methylation than the other control(s), due to the relatively wide interval spanned by the controls. Additionally, there were several cancer cell lines for each gene in which methylation differed from only one or two non-malignant controls In total, the significant differences in methylation between benign and malign cells ranged from 1.9 to 12.1 pp mean difference (Table 1).
Figure 2.
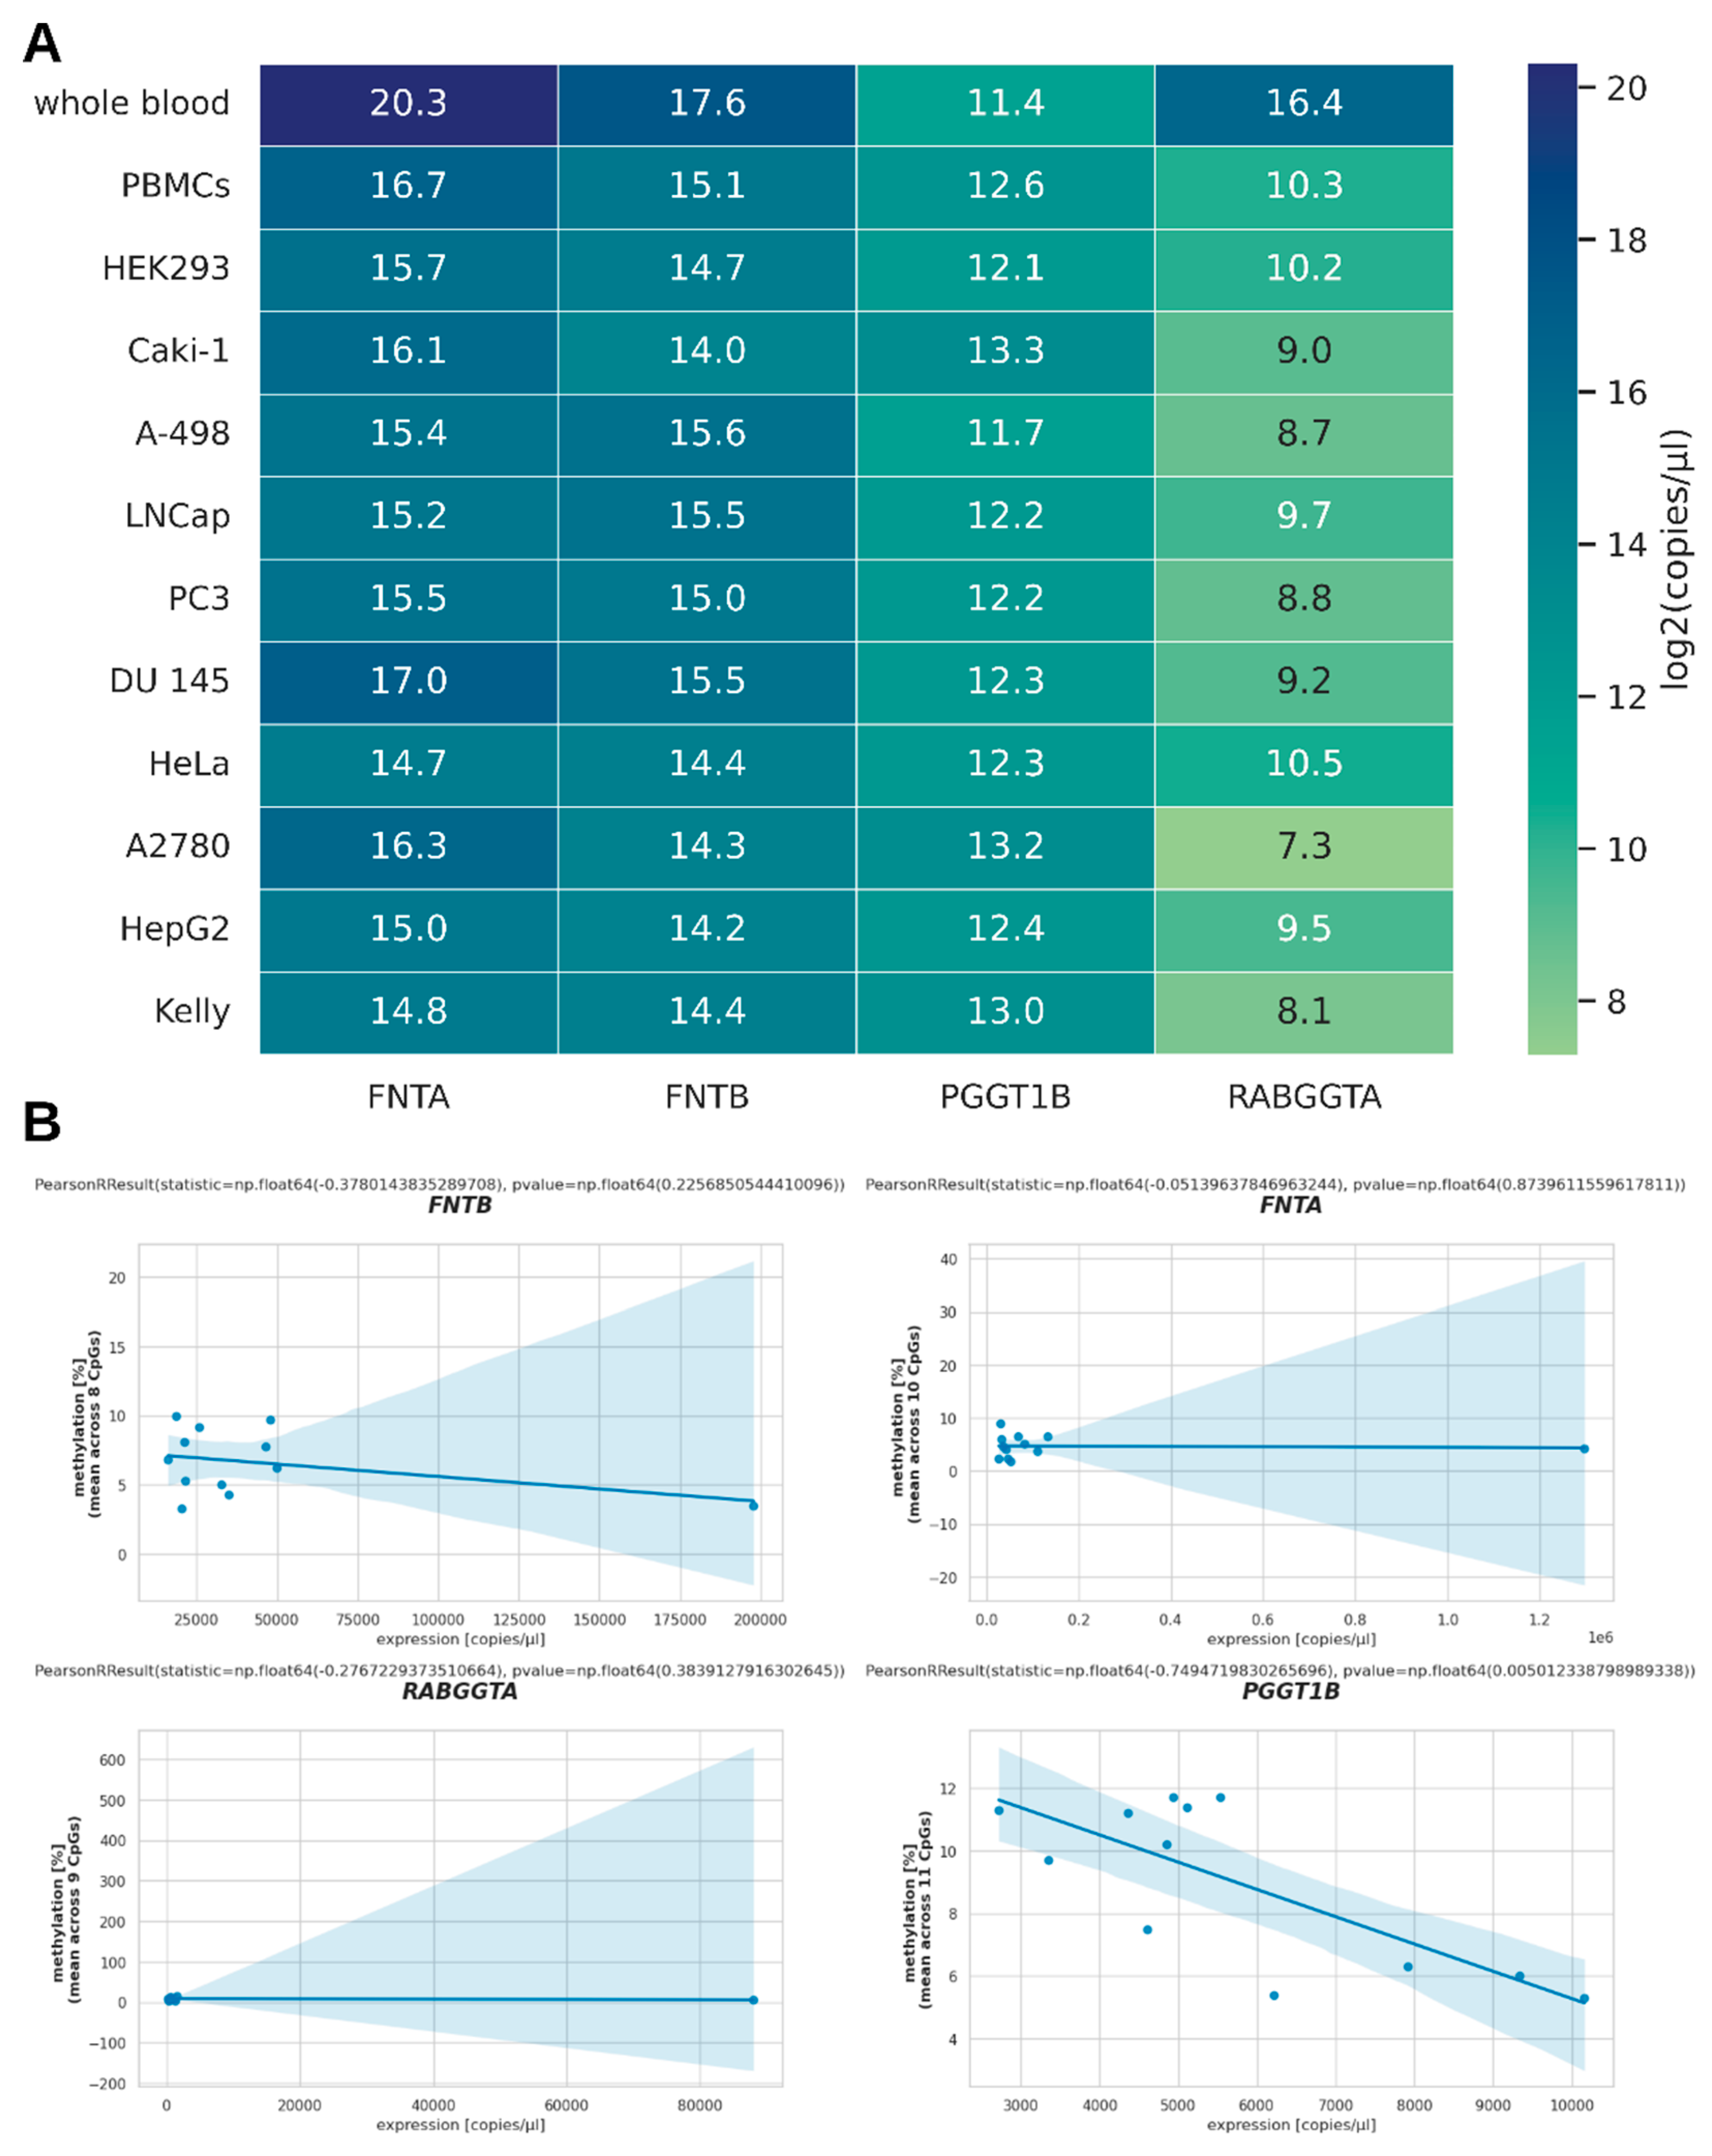
mRNA expression of PTase genes. (A) Heatmap showing the transcript numbers of PTase genes for selected cell lines as quantified by qPCR. For better representation of these values in a heatmap, the binary logarithm of the transcript number per µl was taken before mapping. (B) Scatterplots for each gene plotting DNA methylation against the number of transcripts per µl in order to visualize potential correlation between DNA methylation and gene expression.
Figure 2.
mRNA expression of PTase genes. (A) Heatmap showing the transcript numbers of PTase genes for selected cell lines as quantified by qPCR. For better representation of these values in a heatmap, the binary logarithm of the transcript number per µl was taken before mapping. (B) Scatterplots for each gene plotting DNA methylation against the number of transcripts per µl in order to visualize potential correlation between DNA methylation and gene expression.
4. Discussion
None of the cell lines analyzed in this study was predominantly methylated at the CpG islands overlapping with the promoters of FNTB, FNTA, RABGGTA and PGGT1B, but instead exhibited methylation values clearly more akin to the negative controls than to the positive controls. When comparing DNA methylation of the group of benign samples (whole blood, PBMCs, HEK293) in these regions to the group of cancer cell lines, no significant difference could be detected. However, comparisons between individual cancer cell lines and each of the three non-malignant reference cells revealed slight, yet statistically significant differences regarding methylation of each PTase gene for many cancer cell lines. For FNTA, RABGGTA and PGGT1B there even were several cancer cell lines that exhibited DNA methylation that was significantly different from each of the three benign controls. In all these cases, methylation of FNTA was uniformly higher in cancer cells than in the benign controls, the differences being most pronounced in renal clear cell carcinoma cell line Caki-1 and neuroblastoma cell line Kelly. In contrast, methylation of RABGGTA and PGGT1B in cells with significant differences to all three controls was between that of the most and the least methylated control. This illustrates the difficulties of comparing the methylation in cancer cell lines to controls of non-matched origin as different controls sometimes differed significantly from each other, thus hampering identification of the best representative of a physiological methylation state. Consequently, our main focus was the comparisons between HEK293 and the kidney cancer cell lines Caki-1 and A-498, despite significant differences between many other individual cancer cell lines and controls.
Regarding PTase expression, we showed that only in the case of PGGT1B did DNA methylation correlate with mRNA expression. This observation can be explained by other regulatory factors, particularly distinct levels of relevant transcription factors, which can mask the effect of DNA methylation on mRNA expression as long as the gene’s expression is not completely silenced. Of note, DNA methylation of PGGT1B was higher in HEK293 cells than in Caki-1 cells, while its mRNA expression was lower. This is in line with public expression data for HEK293 and Caki-1 (https://www.proteinatlas.org/ENSG00000164219-PGGT1B/cell+line) and may indicate an epigenetic regulatory mechanism relevant for PGGT1B expression in renal cell carcinoma. This may be of particular interest as PGGT1B expression is a validated prognostic factor in certain kidney tumors (https://www.proteinatlas.org/ENSG00000164219-PGGT1B/cancer/renal+cancer). Caki-1Additionally, our observations that PGGT1B is significantly less methylated in the brain tumor cell line Kelly than in whole blood samples or HEK293 cells, and shows higher expression than in controls is in line with studies that showed a two-fold elevated abundance of GGTase I in brain tumors when compared to non-tumorous brain tissue [6]. Caki-1
For the interpretation of these results, a couple of limitations of this pilot study have to be considered. These limitations arise from the screening approach of the study setting and the method employed, and necessitate the validation of the results by complementary methods in subsequent studies.
First, the influence of cell culturing and cell line establishment on DNA methylation is not entirely clear. There have long been reports that DNA methylation in cell lines can differ from DNA methylation in the original tissue [13]. Such alterations may arise from the use of cell culture media or changes in microenvironment [14]. However, other studies comparing DNA methylation in primary tumors and corresponding cancer cell lines have indicated that, in the majority of cases, aberrant DNA methylation in cancer cell lines is also present in the primary tumors [15,16]. Thus, studying cancer-specific DNA methylation in cell lines appears generally viable, although the results from such studies should be validated in primary tumor tissue to exclude any artifacts potentially arising from cell culture. In the present study, the whole blood and PBMC samples (unlike all other cell samples) represented a heterogeneous mix of different cell populations present in the blood stream that was not clearly defined. On the one hand, this limits reproducibility of the measured methylation values; on the other hand, this may actually increase their validity as a non-malignant control as these samples represent a broader spectrum of healthy cells and are not limited to one specific cell type. However, in a more focused cell panel, matched non-malignant controls from the same tissue as each investigated cancer cell line would certainly increase the power of future studies.
Second, the method used in this study, pyrosequencing, allowed the analysis of a relatively small portion of each CpG island. Even though the methylation status of few or even single CpGs within a CpG island is mostly representative for the methylation status of the whole CpG island [17], there can be relevant exceptions from this principle [18].
Lastly, a recent study reported differential methylation of a CpG located in intron 2 of PTase gene RABGGTB (cg08702915) in individuals with autism spectrum disorder [19]. For the sake of comparability, we focused on the analysis of CpGs within promoter-associated CpG islands, and therefore excluded RABGGTB from this study. It should be noted, however, that aberrant DNA methylation that affects gene expression is not necessarily confined to CpG islands or gene promoters, even though this kind of methylation represents one of the most noted and most studied types of DNA methylation [20]. Therefore, using long-read sequencing techniques to investigate larger PTase gene portions, and including all PTase genes may yield more informative results and would have the additional advantage of avoiding the need for DNA preparation and, thus, the risk of PCR bias.
Despite these limitations, the current study indicates the existence of differential DNA methylation in specific cancer cell lines affecting PTase expression, and delivers important clues for the selection of PTase genes and cell lines for the investigation via more elaborate yet more costly and time-consuming techniques.
5. Conclusions
The targeted analysis of DNA methylation in 19 cancer cell lines revealed no general differences between benign cells and cancer cell lines in DNA methylation regarding the promoter associated CpG islands of PTase genes FNTA, FNTB, PGGT1B and RABGGTA. However, we observed significant differences between several individual cancer cell lines and certain control cells, most notably regarding methylation of FNTA, RABGGTA and PGGT1B in HEK293 cells and in the kidney cancer cell line Caki-1. The mean differences in methylation between individual cancer cell lines and benign controls ranged from + 12.1 to – 7.6 pp.
Among the benign and malign cells analyzed in this study, we observed a general inverse correlation of DNA methylation of PGGT1B and PGGT1B mRNA expression (PCC = −0.75; p = 0.005). Specifically, PGGT1B methylation in Caki-1 cells was lower than in HEK293, while its mRNA expression was higher. This observation confirms public data regarding mRNA expression in these cell lines, and adds information about the possible causes for the differential expression. As PGGT1B expression is considered a validated prognostic factor in renal clear cell carcinoma, this discovery might become relevant for the management of renal clear cell cancer in the future.
Summarized, these results indicate the possibility of epigenetic regulation of PTase expression via DNA methylation in certain cancer cell lines and warrant further studies in primary tissues, especially regarding renal clear cell carcinoma.
Supplementary Materials
The following supporting information can be downloaded at the website of this paper posted on Preprints.org. File S1: qPCR raw data and standard curves; Figure S1: mRNA expression of PTase genes excluding whole blood samples as outliers; Figure S2. Uncropped gel image of Figure 1B
Author Contributions
Conceptualization: D.J. and H.S.B.; methodology: D.J. and D.D.; validation: D.J.; formal analysis: D.J.; investigation: D.J. and D.D.; resources: H.S.B.; data curation: D.J.; writing – original draft preparation: D.J.; writing – review and editing: D.J., A.H. and H.S.B.; visualization: D.J.; supervision: H.S.B. All authors have read and agreed to the published version of the manuscript.
Funding
This research received no external funding.
Informed Consent Statement
Informed consent was obtained from all subjects involved in the study.
Data Availability Statement
The datasets of the current study are available from the corresponding author upon reasonable request.
Conflicts of Interest
The authors declare no conflict of interest.
References
- Kuchay S, Wang H, Marzio A, Jain K, Homer H, Fehrenbacher N, Philips MR, Zheng N, Pagano M: GGTase3 is a newly identified geranylgeranyltransferase targeting a ubiquitin ligase. Nat Struct Mol Biol 2019, 26(7):628-636. [CrossRef]
- Shirakawa R, Goto-Ito S, Goto K, Wakayama S, Kubo H, Sakata N, Trinh DA, Yamagata A, Sato Y, Masumoto H et al: A SNARE geranylgeranyltransferase essential for the organization of the Golgi apparatus. Embo j 2020, 39(8):e104120. [CrossRef]
- Tanimoto H, Mehta KD, Parmley TH, Shigemasa K, Parham GP, Clarke J, O'Brien TJ: Expression of the farnesyltransferase beta-subunit gene in human ovarian carcinoma: correlation to K-ras mutation. Gynecol Oncol 1997, 66(2):308-312. [CrossRef]
- Lackner MR, Kindt RM, Carroll PM, Brown K, Cancilla MR, Chen C, de Silva H, Franke Y, Guan B, Heuer T et al: Chemical genetics identifies Rab geranylgeranyl transferase as an apoptotic target of farnesyl transferase inhibitors. Cancer Cell 2005, 7(4):325-336. [CrossRef]
- Khan SG, Dummer R, Siddiqui J, Bickers DR, Agarwal R, Mukhtar H: Farnesyltransferase activity and mRNA expression in human skin basal cell carcinomas. Biochem Biophys Res Commun 1996, 220(3):795-801.
- Zhou X, Qian J, Hua L, Shi Q, Liu Z, Xu Y, Sang B, Mo J, Yu R: Geranylgeranyltransferase I promotes human glioma cell growth through Rac1 membrane association and activation. J Mol Neurosci 2013, 49(1):130-139. [CrossRef]
- Sui GD, Zhang GY, Niu ZJ, Hu SY: Expression of farnesyltransferase in primary liver cancer. Chin Med J (Engl) 2012, 125(14):2427-2431.
- Kulis M, Esteller M: 2 - DNA Methylation and Cancer. In: Advances in Genetics. Volume 70, edn. Edited by Herceg Z, Ushijima T: Academic Press; 2010: 27-56.
- Wang XX, Ying P, Diao F, Wang Q, Ye D, Jiang C, Shen N, Xu N, Chen WB, Lai SS et al: Altered protein prenylation in Sertoli cells is associated with adult infertility resulting from childhood mumps infection. J Exp Med 2013, 210(8):1559-1574.
- He X, Chen Y, Xia Y, Hong X, You H, Zhang R, Liang Z, Cui Q, Zhang S, Zhou M et al: DNA methylation regulates biosynthesis of tanshinones and phenolic acids during growth of Salvia miltiorrhiza. Plant Physiol 2023. [CrossRef]
- Takai D, Jones PA: Comprehensive analysis of CpG islands in human chromosomes 21 and 22. Proc Natl Acad Sci U S A 2002, 99(6):3740-3745. [CrossRef]
- Kim Y, Kim T-H, Ergün T: The instability of the Pearson correlation coefficient in the presence of coincidental outliers. Finance Research Letters 2015, 13:243-257.
- Antequera F, Boyes J, Bird A: High levels of de novo methylation and altered chromatin structure at CpG islands in cell lines. Cell 1990, 62(3):503-514. [CrossRef]
- Heredia-Mendez AJ, Sánchez-Sánchez G, López-Camarillo C: Reprogramming of the Genome-Wide DNA Methylation Landscape in Three-Dimensional Cancer Cell Cultures. Cancers (Basel) 2023, 15(7):1991. [CrossRef]
- Ueki T, Walter KM, Skinner H, Jaffee E, Hruban RH, Goggins M: Aberrant CpG island methylation in cancer cell lines arises in the primary cancers from which they were derived. Oncogene 2002, 21(13):2114-2117. [CrossRef]
- Şükrüoğlu Erdoğan Ö, Kılıç Erciyas S, Bilir A, Buğra Tunçer Ş, Akdeniz Ödemiş D, Kurul S, Karanlık H, Cabıoğlu N, Yazıcı H: Methylation Changes of Primary Tumors, Monolayer, and Spheroid Tissue Culture Environments in Malignant Melanoma and Breast Carcinoma. Biomed Res Int 2019, 2019:1407167. [CrossRef]
- Barrera V, Peinado MA: Evaluation of single CpG sites as proxies of CpG island methylation states at the genome scale. Nucleic Acids Res 2012, 40(22):11490-11498. [CrossRef]
- van Vlodrop IJ, Niessen HE, Derks S, Baldewijns MM, van Criekinge W, Herman JG, van Engeland M: Analysis of promoter CpG island hypermethylation in cancer: location, location, location! Clin Cancer Res 2011, 17(13):4225-4231. [CrossRef]
- Iwata K, Nakabayashi K, Ishiwata K, Nakamura K, Kameno Y, Hata K, Matsuzaki H: Genome-wide DNA methylation profiles in the raphe nuclei of patients with autism spectrum disorder. Psychiatry Clin Neurosci 2025, 79(7):415-424. [CrossRef]
- Liu YX, Li QZ, Cao YN: The effect of key DNA methylation in different regions on gene expression in hepatocellular carcinoma. Mol Omics 2022, 18(1):57-70. [CrossRef]
Figure 1.
DNA methylation of PTase genes. (A) Relative positions of CpGs surrounding the transcription start sites (TSS) of prenyltransferase (PTase) genes. Individual CpGs are displayed as vertical lines with CpGs sequenced in this study being highlighted in blue. Regions defined as CpG islands are indicated by a red frame, the total number of CpGs and the number of sequenced CpGs within each CpG island are shown below. (B) Representative DNA bands of analyzed PCR products yielded after bisulfite conversion of genomic DNA samples and subsequent bisulfite specific PCRs (BSPs) of regions containing the sequenced CpGs highlighted in Figure 1A. ULR: Ultra low range; NTC: no template control (C) Boxplot representation of mean methylation across all sequenced CpGs within PTase genes FNTB, FNTA, RABGGTA and PGGT1B in benign cells (whole blood, PBMCs, HEK293) vs. cancer cell lines. (D) Mean methylation of individual benign and malignant cell samples summarized in Figure 1C. Negative (NC) and positive controls (PC) were demethylated and methylated, respectively, prior to BSP. p values of significant difference between a sample and different reference cells are indicated by different symbols for whole blood (*), PMBCs (#) and HEK293 (‡); */#/‡: p < 0.05; **/##/‡‡: p < 0.01; ***/###/‡‡‡: p < 0.001; ****/####/‡‡‡‡: p < 0.0001; ns (not significant): p ≥ 0.05.
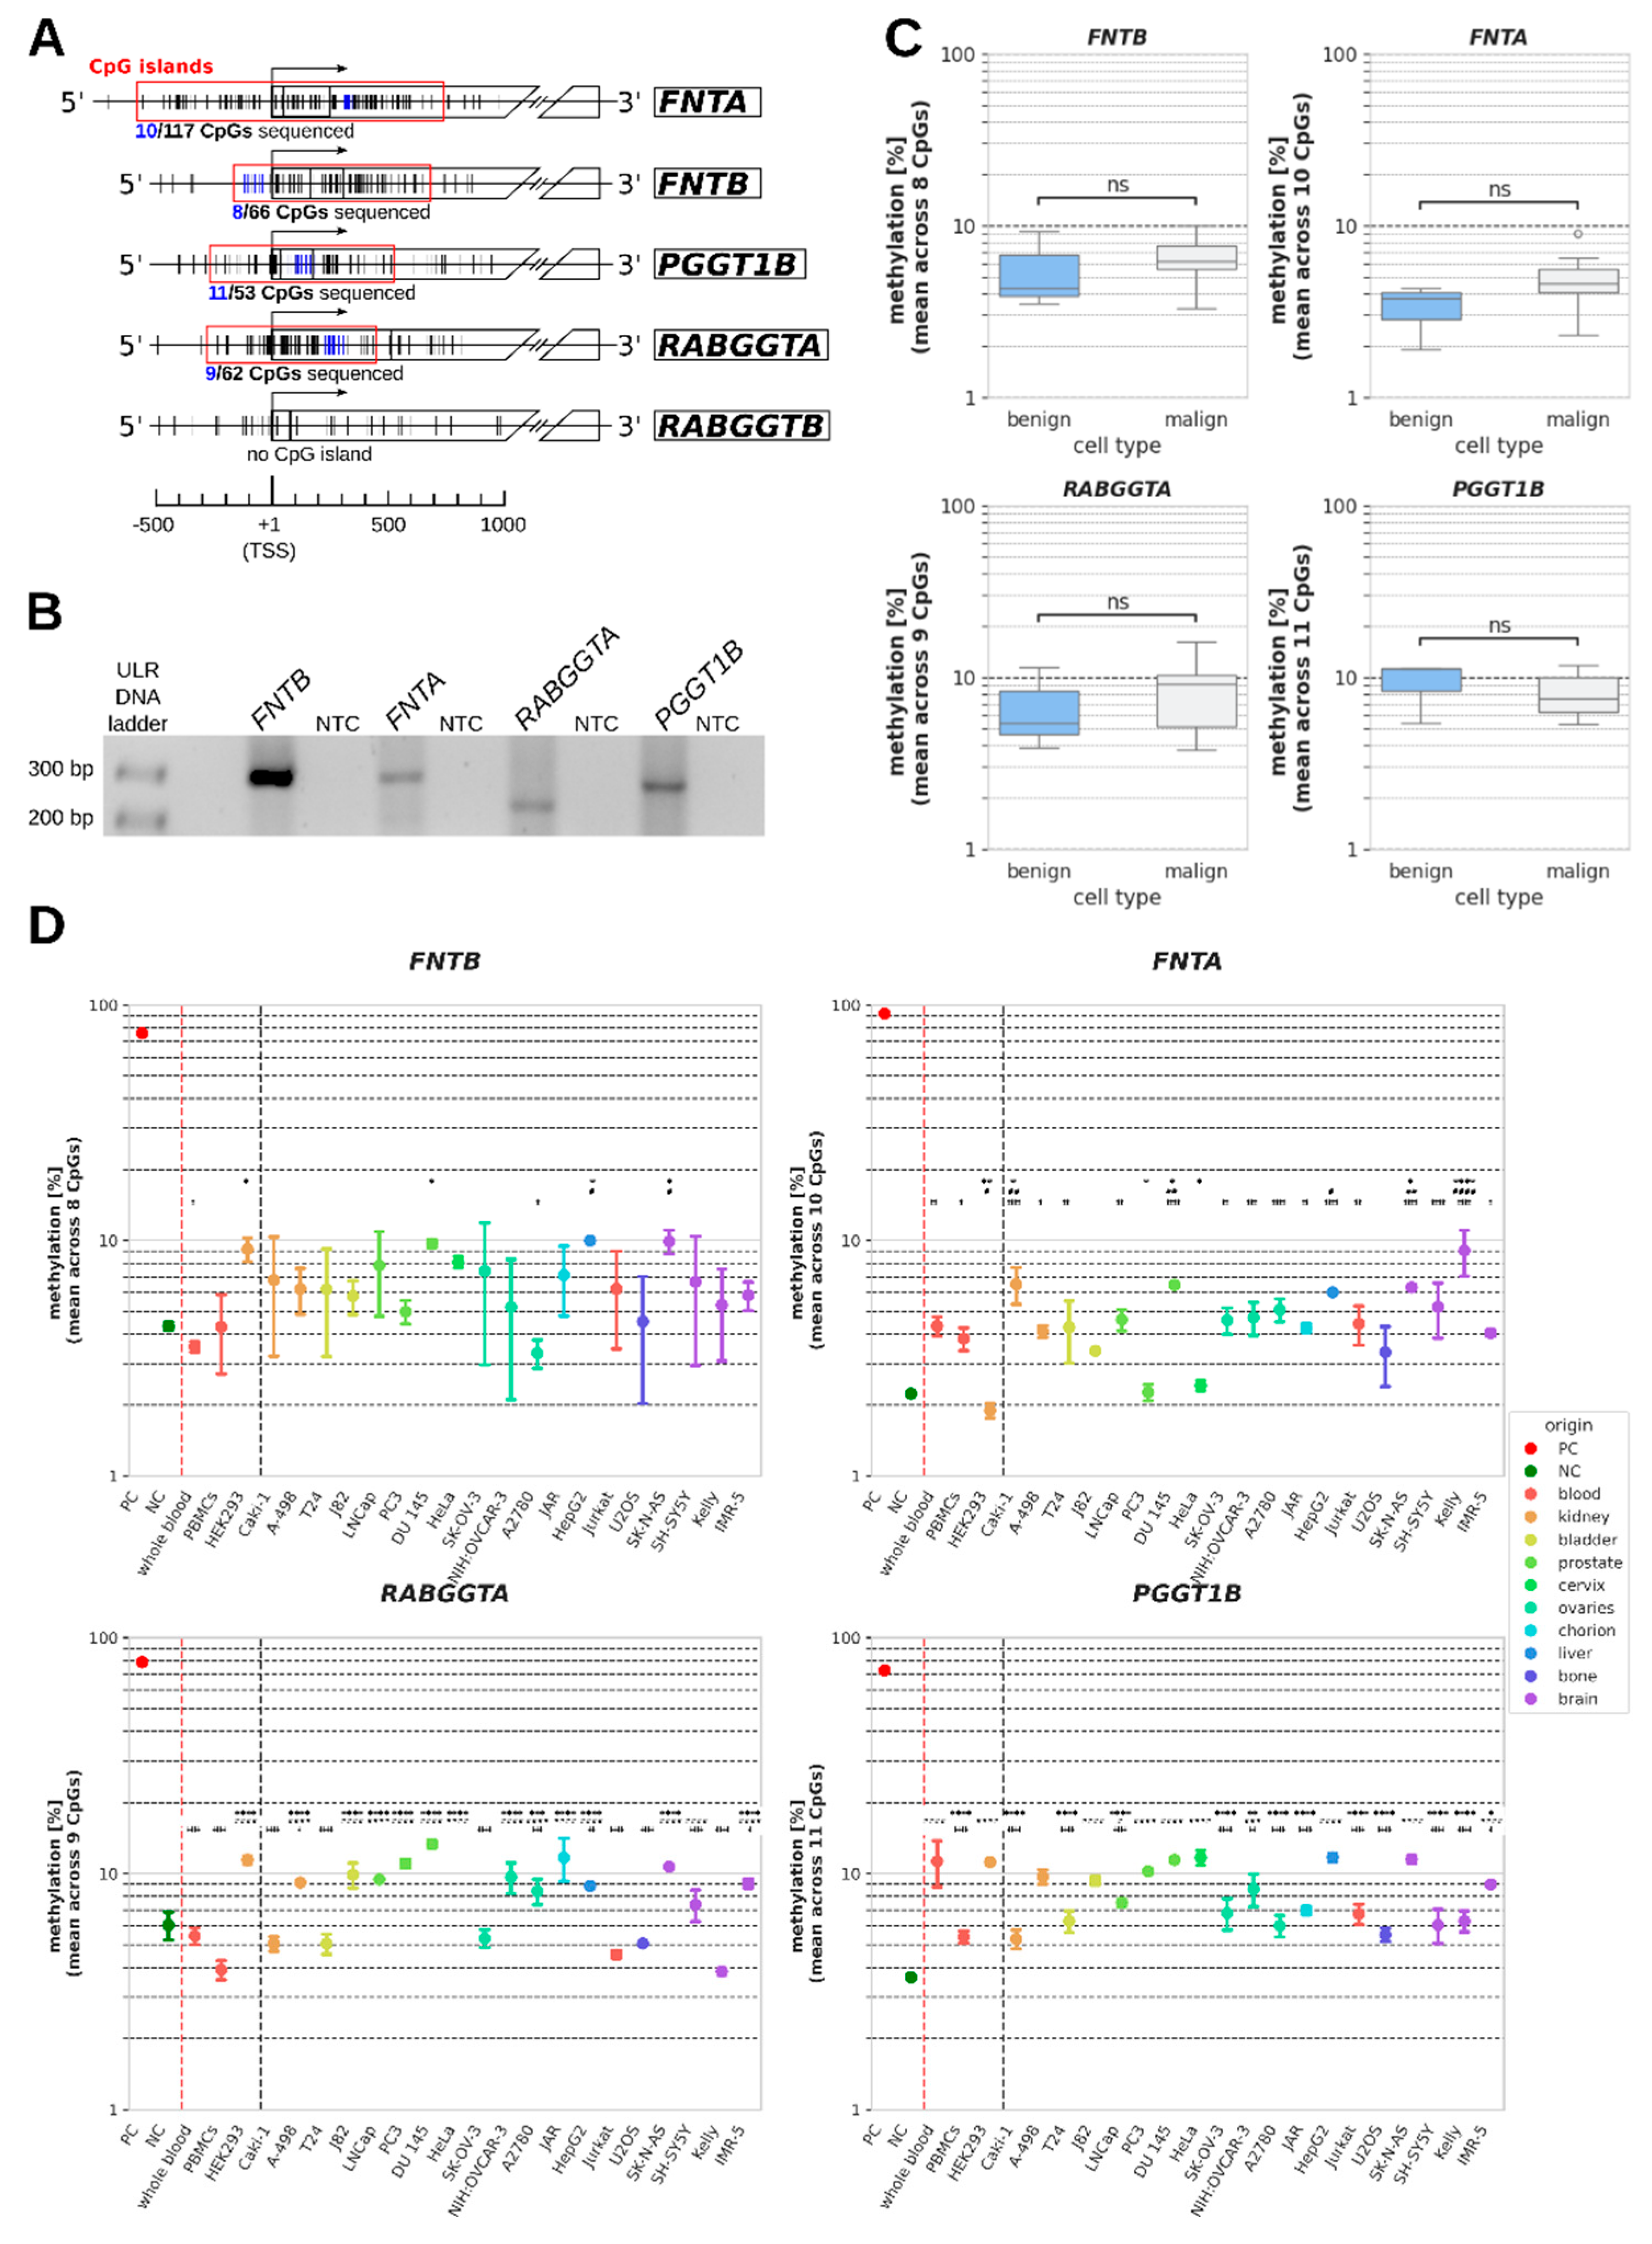

Table 1.
DNA methylation of PTase genes and comparisons between benign and malign cells. For every gene, data are presented in percent as the mean methylation across all analyzed CpGs within the promoter-associated CpG island ± standard deviation. DNA methylation of all samples was compared using ANOVA, followed by Dunnett’s post-hoc test comparing each cancer cell line to each benign sample (whole blood, PBMCs, HEK293) as reference cells. For each significant difference, we show categorized p valuesa, mean differences in methylation and 95 % confidence interval (in parentheses). Differences reported as significant regarding all three reference cells are highlighted in bold. All numbers are given as percentage points.
| difference to reference cells |
FNTA (mean of 10 CpGs) |
difference to reference cells |
FNTB (mean of 8 CpGs) |
Gene | Origin | ||||
| Chr8: 43,056,611 -43,056,636 |
Chr14: 64,986,670 -64,986,749 |
CpG locationb | |||||||
| 2.2 ± 1.1 | 4.3 ± 1.6 | neg. control | |||||||
| 91.9 ± 7.7 | 75.8 ± 15.0 | pos. control | |||||||
| HEK293 | PBMCs | whole blood | HEK293 | PBMCs | whole blood | ||||
| ‡‡ 2.4 (0.6 to 4.3) |
- | 4.3 ± 1.2 | ‡ -5.7 (-11.2 to -0.1) |
- | 3.5 ± 0.9 | whole blood | blood | ||
| ‡ 1.9 (0.1 to 3.8) |
- | 3.8 ± 0.8 | - | 4.3 ± 0.8 | PBMCs | blood | |||
| - | # -1.9 (-3.8 to -0.1) |
** -2.4 (-4.3 to -0.6) |
1.9 ± 0.9 | - | * 5.7 (0.1 to 11.2) |
9.2 ± 3.7 | HEK293 | kidney | |
|
‡‡‡‡ 4.6 (2.7 to 6.5) |
## 2.7 (0.8 to 4.6) |
* 2.2 (0.3 to 4.1) |
6.5 ± 2.7 | 6.8 ± 2.1 | Caki-1 | kidney | |||
| ‡ 2.2 (0.3 to 4.1) |
4.1 ± 2.4 | 6.2 ± 2.3 | A-498 | kidney | |||||
| ‡‡ 2.4 (0.5 to 4.3) |
4.3 ± 1.7 | 6.2 ± 1.9 | T24 | bladder | |||||
| 3.4 ± 1.8 | 5.8 ± 2.2 | J82 | bladder | ||||||
| ‡‡ 2.7 (0.8 to 4.6) |
4.6 ± 1.7 | 7.8 ± 3.1 | LNCaP | prostate | |||||
| * -2.0 (-3.9 to -0.2) |
2.3 ± 1.0 | 5.0 ± 2.0 | PC3 | prostate | |||||
|
‡‡‡‡ 4.6 (2.7 to 6.5) |
## 2.7 (0.8 to 4.5) |
* 2.2 (0.3 to 4.0) |
6.5 ± 3.9 | * 6.2 (0.6 to 11.7) |
9.7 ± 5.1 | DU 145 | prostate | ||
| * -1.9 (-3.8 to -0.0) |
2.4 ± 1.0 | 8.1 ± 3.8 | HeLa | cervix | |||||
| ‡‡ 2.7 (0.8 to 4.6) |
4.6 ± 2.2 | 7.4 ± 2.0 | SK-OV-3 | ovaries | |||||
| ‡‡‡ 2.8 (0.9 to 4.7) |
4.7 ± 1.7 | 5.2 ± 1.3 | NIH:OVCAR-3 | ovaries | |||||
| ‡‡‡‡ 3.2 (1.3 to 5.1) |
5.1 ± 2.1 |
‡ -5.9 (-11.4 to -0.3) |
3.3 ± 0.9 | A2780 | ovaries | ||||
| ‡‡ 2.3 (0.5 to 4.2) |
4.2 ± 1.7 | 7.1 ± 2.9 | JAR | chorion | |||||
| ‡‡‡‡ 4.1 (2.2 to 6.0) |
# 2.2 (0.3 to 4.1) |
6.0 ± 3.6 | # 5.7 (0.2 to 11.2) |
* 6.5 (0.9 to 12.0) |
10.0 ± 4.9 | HepG2 | liver | ||
| ‡‡ 2.5 (0.7 to 4.4) |
4.4 ± 1.9 | 6.2 ± 1.0 | Jurkat | blood | |||||
| 3.4 ± 1.4 | 4.5 ± 1.2 | U2OS | bone | ||||||
|
‡‡‡‡ 4.4 (2.5 to 6.3) |
## 2.5 (0.6 to 4.4) |
* 2.0 (0.1 to 3.9) |
6.3 ± 4.0 | # 5.6 (0.1 to 11.2) |
* 6.4 (0.8 to 11.9) |
9.9 ± 5.2 | SK-N-AS | brain | |
| ‡‡‡‡ 3.3 (1.4 to 5.2) |
5.2 ± 2.4 | 6.7 ± 2.1 | SH-SY5Y | brain | |||||
|
‡‡‡‡ 7.1 (5.3 to 9.0) |
#### 5.2 (3.3 to 7.1) |
**** 4.7 (2.8 to 6.6) |
9.0 ± 4.2 | 5.3 ± 1.6 | Kelly | brain | |||
| ‡ 2.1 (0.3 to 4.0) |
4.0 ± 2.5 | 5.8 ± 2.3 | IMR-5 | brain | |||||
| difference to reference cells |
PGGT1B (mean of 11 CpGs) |
difference to reference cells |
RABGGTA (mean of 9 CpGs) |
Gene | Origin | ||||
| Chr5: 115,262,704 -115,262,816 |
Chr14: 24,271,320 -24,271,399 |
CpG locationb | |||||||
| 3.6 ± 1.1 | 6.0 ± 2.4 | neg. control | |||||||
| 72.7 ± 14.1 | 78.8 ± 11.2 | pos. control | |||||||
| HEK293 | PBMCs | whole blood | HEK293 | PBMCs | whole blood | ||||
| #### 5.9 (3.9 to 7.9) |
- | 11.3 ± 6.9 | ‡‡‡‡ -6.0 (-8.0 to -4.0) |
- | 5.4 ± 2.1 | whole blood | blood | ||
| ‡‡‡‡ -5.8 (-7.8 to -3.8) |
- | **** -5.9 (-7.9 to -3.9) |
5.4 ± 1.1 | ‡‡‡‡ -7.5 (-9.5 to -5.5) |
- | 3.9 ± 1.6 | PBMCs | blood | |
| - | #### 5.8 (3.8 to 7.8) |
11.2 ± 2.2 | - | #### 7.5 (5.5 to 9.5) |
**** 6.0 (4.0 to 8.0) |
11.4 ± 4.1 | HEK293 | kidney | |
| ‡‡‡‡ -5.9 (-7.9 to -3.9) |
**** -6.0 (-8.0 to -4.0) |
5.3 ± 1.2 | ‡‡‡‡ -6.4 (-8.4 to -4.4) |
5.0 ± 1.9 | Caki-1 | kidney | |||
| #### 4.3 (2.3 to 6.3) |
9.7 ± 2.2 |
‡ -2.2 (-4.3 to -0.3) |
#### 5.3 (3.3 to 7.3) |
**** 3.8 (1.7 to 5.7) |
9.2 ± 3.4 | A-498 | kidney | ||
| ‡‡‡‡ -4.9 (-6.9 to -2.9) |
**** -5.0 (-7.0 to -3.0) |
6.3 ± 1.4 | ‡‡‡‡ -6.4 (-8.4 to -4.4) |
5.0 ± 2.1 | T24 | bladder | |||
| #### 3.9 (1.9 to 6.0) |
9.3 ± 2.0 | #### 6.0 (4.0 to 8.0) |
**** 4.5 (2.4 to 6.4) |
9.9 ± 3.3 | J82 | bladder | |||
|
‡‡‡‡ -3.7 (-5.7 to -1.7) |
# 2.1 (0.1 to 4.1) |
**** -3.8 (-5.8 to -1.7) |
7.5 ± 1.9 | #### 5.6 (3.5 to 7.5) |
**** 4.1 (2.0 to 6.0) |
9.5 ± 3.6 | LNCaP | prostate | |
| #### 4.8 (2.8 to 6.8) |
10.2 ± 7.1 | #### 7.1 (5.1 to 9.1) |
**** 5.6 (3.6 to 7.6) |
11.0 ± 7.1 | PC3 | prostate | |||
| #### 6.0 (4.0 to 8.1) |
11.4 ± 2.5 | #### 9.4 (7.4 to 11.4) |
**** 7.9 (5.9 to 9.9) |
13.3 ± 4.8 | DU 145 | prostate | |||
| #### 6.3 (4.3 to 8.3) |
11.7 ± 2.6 |
‡‡‡‡ 4.6 (2.6 to 6.6) |
#### 12.1 (10.1 to 14.1) |
**** 10.6 (8.6 to 12.6) |
16.0 ± 5.4 | HeLa | cervix | ||
| ‡‡‡‡ -4.4 (-6.4 to -2.4) |
**** -4.5 (-6.5 to -2.5) |
6.8 ± 2.9 | ‡‡‡‡ -6.1 (-8.1 to -4.1) |
5.3 ± 2.0 | SK-OV-3 | ovaries | |||
|
‡‡ -2.6 (-4.6 to -0.6) |
### 3.2 (1.2 to 5.2) |
** -2.7 (-4.7 to -0.7) |
8.6 ± 2.1 |
#### 5.8 (3.8 to 7.7) |
**** 4.3 (2.2 to 6.2) |
9.7 ± 3.5 | NIH:OVCAR-3 | ovaries | |
| ‡‡‡‡ -5.2 (-7.2 to -3.2) |
**** -5.3 (-7.3 to -3.3) |
6.0 ± 1.6 |
‡‡‡ -3.0 (-5.0 to -1.0) |
#### 4.5 (2.5 to 6.5) |
*** 3.0 (1.0 to 5.0) |
8.4 ± 3.4 | A2780 | ovaries | |
| ‡‡‡‡ -4.2 (-6.2 to -2.2) |
**** -4.3 (-6.3 to -2.3) |
7.0 ± 1.7 | #### 7.8 (5.8 to 9.8) |
**** 6.3 (4.2 to 8.2) |
11.7 ± 4.5 | JAR | chorion | ||
| #### 6.3 (4.3 to 8.3) |
11.7 ± 2.5 |
‡‡ -2.5 (-4.6 to -0.6) |
#### 5.0 (2.9 to 6.9) |
**** 3.5 (1.4 to 5.4) |
8.9 ± 3.7 | HepG2 | liver | ||
| ‡‡‡‡ -4.5 (-6.5 to -2.4) |
**** -4.6 (-6.5 to -2.5) |
6.7 ± 1.5 | ‡‡‡‡ -6.9 (-8.9 to -4.9) |
4.5 ± 1.9 | Jurkat | blood | |||
| ‡‡‡‡ -5.7 (-7.7 to -3.7) |
**** -5.8 (-7.8 to -3.8) |
5.5 ± 1.3 | ‡‡‡‡ -6.3 (-8.4 to -4.4) |
5.1 ± 1.8 | U2OS | bone | |||
| #### 6.1 (4.1 to 8.1) |
11.5 ± 2.5 | #### 6.8 (4.8 to 8.8) |
**** 5.3 (3.2 to 7.2) |
10.7 ± 4.4 | SK-N-AS | brain | |||
| ‡‡‡‡ -5.1 (-7.1 to -3.1) |
**** -5.2 (-7.2 to -3.2) |
6.1 ± 1.3 | ‡‡‡‡ -4.0 (-6.0 to -2.0) |
#### 3.5 (1.5 to 5.5) |
7.4 ± 2.9 | SH-SY5Y | brain | ||
| ‡‡‡‡ -4.9 (-6.9 to -2.9) |
**** -5.0 (-7.0 to -3.0) |
6.3 ± 1.2 | ‡‡‡‡ -7.6 (-9.6 to -5.6) |
3.8 ± 1.5 | Kelly | brain | |||
|
‡ -2.2 (-4.2 to -0.2) |
#### 3.6 (1.6 to 5.6) |
* -2.3 (-4.3 to -0.3) |
9.0 ± 1.8 |
‡ -2.3 (-4.4 to -0.4) |
#### 5.2 (3.2 to 7.2) |
**** 3.7 (1.6 to 5.6) |
9.1 ± 3.3 | IMR-5 | brain |
a multiplicity adjusted p values according to the Dunnett’s post-hoc test following ANOVA; p values of significant differences between a sample and different reference cells are indicated by different symbols for whole blood (*), PMBCs (#) and HEK293 (‡); */#/‡: p < 0.05; **/##/‡‡: p < 0.01; ***/###/‡‡‡: p < 0.001; ****/####/‡‡‡‡: p < 0.0001; b: Genome assembly GRCh38.p14.
Disclaimer/Publisher’s Note: The statements, opinions and data contained in all publications are solely those of the individual author(s) and contributor(s) and not of MDPI and/or the editor(s). MDPI and/or the editor(s) disclaim responsibility for any injury to people or property resulting from any ideas, methods, instructions or products referred to in the content. |
© 2025 by the authors. Licensee MDPI, Basel, Switzerland. This article is an open access article distributed under the terms and conditions of the Creative Commons Attribution (CC BY) license (http://creativecommons.org/licenses/by/4.0/).
Copyright: This open access article is published under a Creative Commons CC BY 4.0 license, which permit the free download, distribution, and reuse, provided that the author and preprint are cited in any reuse.


