
Submitted:
03 April 2024
Posted:
04 April 2024
You are already at the latest version
Abstract
The genetic causes of the differentiated, highly treatable and mostly non-fatal papillary thyroid cancer (PTC) are not yet fully known. The widely accepted PTC etiology blames altered sequence or/and expression level of certain biomarker genes. However, our previous studies found that the PTC biomarkers played significantly lower roles than the personalized PTC Gene Master Regulators. Our publicly accessible gene expression data from the cancer nodule and the surrounding normal tissue of surgically removed PTC tumor were re-analyzed to determine the transcriptomic effects on the genomic fabrics responsible for the DNA replication, repair and transcription. Tumor results were compared to the gene expression profiles of the papillary (BCPAP) and the anaplastic (8505C) human thyroid cancer cell lines. The analyses were carried out from the Genomic Fabric Paradigm (GFP) perspective that provides the most theoretically possible comprehensive characterization of the transcriptome and its alterations in disease. The study indicated that, in addition to regulating numerous genes, changes in the homeostatic control of transcript abundances and remodeling of the gene networks had major contributions to the PTC occurrence, resilience and proliferation. Therefore, the molecular mechanisms responsible for gene expression control and inter-coordination should also be considered when designing personalized anti-cancer gene therapies.
Keywords:
8505C cells
; BCPAP cells
; ERCC#
; evading apoptosis
; PCNA
; POLD4
; POLR2L
; TAF7
; UBXN1
Graphical Abstract
1. Introduction
The American Cancer Society estimates that in 2024 U.S.A. will register new 44,020 (31,520 women and 12,500 men) cases of thyroid cancer (TC), out of which, and 2,170 (1,180 females + 990 males) might die because of it [1]. The most lethal form is the non-differentiated (anaplastic) TC with 5 months’ median survival rate [2]. The least lethal is the differentiated papillary thyroid carcinoma (PTC) that covers over 8 out of 10 thyroid malignancies, growths slowly and has a favorable (> 95%) 5-year survival prognosis [3,4]. However, not treated in time, PTC can invade adjacent structures and metastasize in neck lymph nodes [5,6].
It is considered that the T1799A point mutation of the BRAF gene is responsible for 45% of the PTC cases [7] albeit mutations of several other genes (e.g.: RET, NTRK1, TP53) were also reported e.g.: [8,9,10,11] as present in numerous PTC cases. In total, the 39.0 Release of the National Cancer Institute GDC Data Portal (Dec. 04, 2023) lists 5,869 mutations affecting 19,313 genes in the registered 1,121 cases of thyroid cancer [12]. In addition to specific DNA mutations, regulation of the expression levels of selected gene sets were also pointed out as PTC transcriptomic signatures (e.g. [13,14,15]).
In order to quantify the power of the expression a particular gene to regulate the cancer phenotype, we have introduced the Gene Commanding Height (GCH) score [16]. Nonetheless, our PTC transcriptomic study [17] revealed that 1/3 of 544 known cancer biomarkers had higher GCH in the malignant region of the tumor, 1/3 in the benign region, while the rest did not discriminate between the two regions. This result raised the general question of the biomarkers’ utility for cancer diagnostic [18] and therapy [19], especially because, together with the blamed biomarker(s), sequence and/or expression of numerous other protein coding (e.g. [20]) and non-coding (e.g. [21]) genes are altered in cancer [22]. Moreover, all our cancer genomics studies revealed that biomarkers have low GCH scores and, as minor players in the cell life, their manipulation might be of little consequences for the survival and proliferation of the malignancy.
Here, we report the PTC-induced changes in the KEGG-constructed functional pathways [23] responsible for the genetic information processing in a surgically removed PTC tumor. The study complements the not so rich literature related to the genomic alterations in the DNA replication [24], repair [25,26,27,28] and transcription [29,30], chromatin remodeling [31], translation, and protein processing [32] and trafficking [33].
Gene expressions in the cancer nodule and surrounding normal thyroid tissue were compared with the transcriptomic profiles of the papillary (BCPAP, [34]) and anaplastic (8505C, [35]) human thyroid cancer cell cultures. As already adopted by us [36] and several other laboratories (e.g. [37,38,39]), the surrounding normal tissue in the tumor is the best reference to understand the genomic changes in the cancer nodule(s).
The analyses were carried out from the Genomic Fabric Paradigm (GFP) perspective that provides the most theoretically possible characterization of the transcriptome [40] and is able to identify the most legitimate targets for personalized anti-cancer gene therapy [41]. In addition to the traditional average expression level (AVE), GFP characterizes each gene by the Relative Expression Variation (REV) across biological replicas and Expression Coordination (COR) with each other gene in the same condition.
By comparing AVEs in the cancer nodule and the surrounding normal thyroid tissue one determines what gene was significantly up-/down-regulated according to certain cut-off criteria for the absolute fold-change and p-value of the t-test of means equality. AVE analysis is used also to identify the turned on/off genes.
REV analysis identifies the genes whose expression levels are the most/least controlled by the homeostatic mechanisms. Indirectly, REV points out the cell priorities in keeping within narrow intervals the fluctuations of the expression levels of critical genes to preserve the cell phenotype caused by nonhomogeneous and variable local environmental factors.
Moreover, COR analysis based on the Principle of Transcriptomic Stoichiometry [42]
stating that genes whose encoded products interact are coordinately expressed to
maximize the pathway efficiency. Thus, COR analysis singles out the most probable, statistically (p < 0.95) significant gene networking in functional pathways.
2. Materials and Methods
2.1. Gene Expression Data
Transcriptomic raw data obtained through our previous microarray experiments on thyroid cancer samples were downloaded from the publicly available Gene Expression Omnibus (GEO) of the National Center for Biotechnology Information (NCBI). As described in [17], 4 small pieces of malignant (here after denoted as T1, T2, T3, T4) and 4 of non-malignant (denoted as N1, N2, N3, N4) regions were collected from a surgically removed 32.0 mm pathological stage pT3NOMx [43] PTC tumor of a 33y old Asian woman. Tumor gene expression data [44] were compared with those from 4 papillary BCPAP (denoted as: Φ1, Φ2, Φ3, Φ4) and 4 anaplastic 8505C (denoted as: Θ1, Θ2, Θ3, Θ4) thyroid cancer cell cultures [45]. All thyroid cancer samples were profiled by us using Agilent Agilent-026652 Whole Human Genome Microarray 4x44K v2 [46]. The wet protocol and the raw data are fully described in the above cited, publicly accessible, GEO deposits.
2.2. Transcriptomic Analyses
The microarray data were filtered (eliminated all spots with foreground fluorescence less than twice the background in one microarray), normalized (to the median of valid spots) and analyzed using our standard GFP algorithms (presented in [47]). Besides the primary characteristics of adequately profiled individual genes in each condition: AVE, REV and COR (Appendix A), we considered also the derived characteristics: Relative Expression Control (REC) and Coordination Degree (COORD) (Appendix B).
The AVE, REV, COR, REC and COORD alterations in the malignant region of the tumor were quantified according to the algorithms from Appendix C and averaged for the genes included in the selected KEGG-constructed functional pathways. The arbitrarily introduced absolute fold-change cut-off (e.g. 1.5x) to consider a gene as significantly regulated might be too strict for very stably expressed genes or two laxed for the very unstably expressed ones across biological replicas. Therefore, we computed the absolute fold-change cut-off for each quantified gene considering the combined contributions of the biological variability in the compared conditions and the technical noise of the probing microarray spots [48].
Nevertheless, the transcriptomic distance (i.e. the Euclidian distance in the 3D orthogonal space of transcriptomic changes (WIR, ΔREC, ΔCOORD) with respect to the normal tissue (defined in C6) is the most comprehensive measure of the cancer-induce transcriptomic alteration of the thyroid.
2.3. Functional Pathways
We analyzed the following KEGG-constructed functional pathways responsible for the Genetic Information Processing in homo sapiens (hsa):
2.3.1. Transcription
(POL) hsa03020 RNA polymerase [49]
(BTF) hsa03022 Basal transcription factors [50]
(SPL) hsa03040 Spliceosome [51]
2.3.2. Translation
(RIB) hsa03010 Ribosome [52]
(AMI) hsa00970 Aminoacyl-tRNA biosynthesis [53]
(NCT) hsa03013 Nucleocytoplasmic transport [54]
(SUR) hsa03015 mRNA surveillance pathway [55]
(RBE) hsa03008 Ribosome biogenesis in eukaryotes [56]
2.3.3. Folding, Sorting and Degradation
(PEX) hsa03060 Protein export [57]
(PPE) hsa04141 Protein processing in endoplasmic reticulum [58]
(SIV) hsa04130 SNARE interactions in vesicular transport [59]
(UMP) hsa04120 Ubiquitin mediated proteolysis [60]
(SRS) hsa04122 Sulfur relay system [61]
(PRO) hsa03050 Proteasome [62]
(RND) hsa03018 RNA degradation [63]
2.3.4. Replication and Repair
(DER) hsa03030 DNA replication [64]
(BER) hsa03410 Base excision repair [65]
(NER) hsa03420 Nucleotide excision repair [66]
(MIR) hsa03430 Mismatch repair [67]
(HOR) hsa03440 Homologous recombination [68]
(NHJ) hsa03450 Non-homologous end-joining [69]
(FAP) 03460 Fanconi anemia pathway [70]
2.3.5. Chromosome
(ACM) hsa03082 ATP-dependent chromatin remodeling [71]
(PRC) hsa03083 Polycomb repressive complex [72].
In addition, we have analyzed in the surgically removed PTC tumor the regulation of the genes modules responsible for the cancer cells’ survival and proliferation included in KEGG-constructed hsa05200Pathways in cancer (PAC, [73]).
3. Results
3.1. Independence of the Three Transcriptomic Characteristics of Individual Genes
Figure 1 illustrates the independence of the primary characteristics AVE, REV and COR of the 30 quantified DER genes in the normal thyroid tissue (N), papillary thyroid cancer tissue (T), papillary thyroid cancer cell line BCPAP (Φ) and anaplastic thyroid cancer cell line 8505C (Θ). Correlations with PCNA (proliferating cell nuclear antigen) were selected for the PCNA role in ensuring the rate and accuracy of DNA replication, damage repair, chromatin formation, and segregation of the sister chromatids [74]. The characteristics were determined with the definition algorithms described in Appendix A.
Using the three characteristics (whose independence is visually evident) increases by almost four orders of magnitude the amount of workable transcriptomic information that can be derived from any microarray (or RNA-sequencing) experiment. Thus, by quantifying 14,904 unigenes in this experiment, we got for each type of sample (N, T, Φ, Θ) 14,904 AVEs + 14,904 REVs + 111,057,156 CORs = 111,086,964 (i.e. 7,453.5x more values to be analyzed than the 14,904 AVEs).
It is interesting to note that, with respect to the normal thyroid tissue N, the cancer increased the average expression of these genes by 46% in T, 142% in Φ, and 146% in Θ. RNASEH2A (ribonuclease H2, subunit A), known for its role in protecting the genomic integrity and progression of prostate cancer [75], had the most remarkable increase in the cultured BCPAP (39x) and 8505C (49x) cancer cells.
On the other hand, the large, 91% REV of RNASEH2B (ribonuclease H2, subunit B) in the anaplastic cells shows the high expression addaptability of this gene to ensure the proper DNA replication regardless of the tumor heterogeneous cell subpopulations.
Correlation analysis revealed that within the DER pathway, PCNA has 5 statistically significant synergistically expressed partners in N, but 11 in T, 21 in Φ, and 16 in Θ. These results indicate substantial increase of synchronious expressions DNA replication genes in thyroid cancer. The numbers of antagonistically expressed partners are: 0 in N, 2 in T, 3 in Φ, and 0 in Θ.
3.2. Cancer-Induced Regulation of Gene Expression Profile
3.2.1. Measures of Regulation of Expression Level
Figure 2 presents three ways to quantify the cancer-related regulation of the expression level of 51 randomly selected out of 74 quantified genes encoding polymerases based on the algorithms described in Appendix C.
The traditional measure of the percentages of significantly up- and down-regulated genes (according to a more or less arbitrarily introduced criterion) considers only the regulated genes and as uniform +1 or -1 contributors to the transcriptomic alteration. Instead, the other two measures from Figure 2 apply to all genes while discriminating also their contributions to the overall transcriptomic regulation. Thus, POLR1C (polymerase (RNA) I polypeptide C, 30kDa) had the largest up-regulation in both cell cultures lines even its expression level was not significantly changed in the malignant part of the surgically removed tumor (xT = -1.09; xΦ = 198.71; xΘ = 221.73). POLR1C was reported as one of the ten most up-regulated proteins when infiltrative gastric cancer regions were compared to the adjacent normal tissue [76]. TAF1A (TATA-box binding protein associated factor, RNA polymerase I subunit A) was also a highly up-regulated gene in both cell lines although it was significantly down-regulated in the tumor (xT = -2.12; xΦ = 105.70; xΘ = 128.88).
From the WIR perspective (Figure 2(c)), the largest negative contribution to the transcriptomic alteration of the polymerases were given in the two cell lines by PTRF (polymerase I and transcript release factor), although it appeared as not being significantly regulated in the tumor. The difference between high fold-change but low WIR for POLR1C and low absolute fold-change but high absolute WIR for PTRF in both cell lines comes from their difference in the average expression levels in the normal tissue: AVE(POLR1C) = 0.17, AVE(PTRF) = 16.80. (AVE is measured in the expression level of the median gene for that condition. POLR2L (RNA polymerase II, I and III subunit L) is another polymerase gene with very large negative contributions to the BCPAP and 8505C transcriptomes owing to the large expression level (AVE = 18.11) in the normal tissue.
3.2.2. Regulation of the KEGG-Constructed Functional Pathways Responsible for the Genetic Information Processing in the Malignat Region of the Thyroid Tumor
The regulated genes were identified using the cut-off criteria defined in Appendix C (C1) and the software “#PATHWAY#” described in Ref. [41].
Table 1 lists all the significantly up-regulated and down-regulated genes from the KEGG-constructed functional pathways responsible for Transcription and Translation in the cancer nodule of the surgically removed thyroid tumor.
Table 2 lists all the significantly up-regulated (bold) and down-regulated genes from the KEGG-constructed functional pathways responsible for Folding, Sorting and Degradation, Replication and Repair, and Chromosome in the cancer nodule of the surgically removed thyroid tumor.
3.2.3. Regulation of the Protein Processing in Endoplasmic Reticulum pathway
Figure 3 presents the localization of the regulated genes from the hsa04141 KEGG-constructed PPE pathway Protein Processing in Endoplasmic Reticulum [58] in the surgically removed PTC tumor. Within this gene subset, CRYAB (crystallin, alpha B), whose silencing might occur at the end of a stepwise dedifferentiation process in the thyroid gland [77], had the largest negative contribution in both PTC types of samples (xT = -7.16, WIRT = -105; xΦ = -36.62, WIRΦ = -610).
3.2.4. Regulation of the Cancer Cells’ Survival and Proliferation Genes
Figure 4 modified frm [73]: Localization of the regulated genes responsible for the cancer cells survival and proliferation within the KEGG-constructed functional pathways in cancer for the surgically removed PTC tumor. Regulated genes: BAX, BCL2, BIRC5 (baculoviral IAP repeat containing 5), CCND1 (cyclin D1), CDK6 (cyclin-dependent kinase 6), CDKN2A (cyclin-dependent kinase inhibitor 1A), CEBPA (CCAAT/enhancer binding protein (C/EBP), alpha), CKS2 (CDC28 protein kinase regulatory subunit 2), CSF1R (colony stimulating factor 1 receptor), DDB2 (damage-specific DNA binding protein 2), ESR1 (estrogen receptor 1), ETS1 (v-crk avian sarcoma virus CT10 oncogene homolog-like), FOS (FBJ murine osteosarcoma viral oncogene homolog), GTSK1/M1/M3/M5/o1/O2P1/T2 (glutathione S-transferase kappa 1/mu 1/mu 3/mu 5/omega 1/omega 2/pi 1/theta 2), HDAC1 (histone deacetylase 1), HEYL (hes-related family bHLH transcription factor with YRPW motif-like), HMOX1 (heme oxygenase (decycling) 1), JUN (jun proto-oncogene), MMP2 (matrix metallopeptidase 2 (gelatinase A, 72kDa gelatinase, 72kDa type IV collagenase)), MSH6 (mutS homolog 3), PAX8 (paired box 8), PDGF (platelet-derived growth factor beta polypeptide), PGF (placental growth factor), PIM1 (pim-1 oncogene), PPARG (peroxisome proliferator-activated receptor gamma), RUNX1T1 (runt-related transcription factor 1; translocated to, 1 (cyclin D-related)), RPS6KA5 (ribosomal protein S6 kinase, 90kDa, polypeptide 5), SLC2A1 (solute carrier family 2 (facilitated glucose transporter), member 1), SMAD3 (SMAD family member 3), SP1 (Sp1 transcription facto), STAT1/2/6 (signal transducer and activator of transcription 1), TCF7 (transcription factor 7 (T-cell specific, HMG-box)), TCF7L1 (transcription factor 7-like 1 (T-cell specific, HMG-box)), TGFB1 (transforming growth factor, beta 1), WNT11/3/3A/4/5A (wingless-type MMTV integration site family, member 11/3/3A/4/5A), ZBTB16 (zinc finger and BTB domain containing 17).
Genes in Figure 4 were identified by KEGG Pathways in Cancer [73] as responsible for blocking the differentiation, evading apoptosis, ensuring immortality and insensitivity to anti-growth signals, resistance to chemotherapy, as well proliferation and sustained angiogenesis. There is some degree of similarity between results in Figure 4 and those comparing gene expression profiles in the primary cancer nodule and the surrounding normal tissue from a surgically removed prostate tumor [78, Figure S1(a)]. For instance, GSTO2 and PGF were down-regulated while CSF1R, DDB2, HMOX1 and PGFB were up-regulated in both cancers. However, GSTP1 and PPARG were down-regulated in PTC but up-regulated in the profiled prostate tumor.
3.3. Additional Measures of Transcriptomic Alterations
Figure 5 illustrates our original novel measures of the cancer-induced transcriptomic alterations in expression control (ΔREC) and coordination degree (ΔCOORD), as well as the most comprehensive measure, the Transcriptomic Distance (TD). The measures, determined using the algorithms from Appendix C, were applied to the quantified 51 RNA polymerase II genes and their binding partners in the normal thyroid tissue (N), papillary thyroid cancer tissue (T), papillary thyroid cancer cell line BCPAP (Φ) and anaplastic thyroid cancer cell line 8505C (Θ).
Within this gene subset, the expression control (Figure 5(a)) had the largest increase for TAF7 (TATA-box binding protein associated factor 7) in T (ΔREC = 126), TAF6 (TATA-box binding protein associated factor 6) in Φ (ΔREC = 218) and POLR2B (RNA polymerase II subunit B) in Θ (ΔREC = 485). By contrast, the expression controls of POLR2L in T (ΔREC = -144) and Θ (ΔREC = -198), and GTF2E1 (general transcription factor IIE subunit 1) in Φ (ΔREC = -166) were substantially diminished. Interestingly, while the expression control of TAF6 increased in Φ, it stayed practically the same in T (ΔREC = 5), but decreased in Θ (ΔREC = -46), indicating significant changes in cancer cells’ priorities for controlling the expression fluctuations of this gene. The increased expression control of TAF7 is justified by its essential role for transcription, proliferation and differentiation [79].
The coordination degree (Figure 5(b)) was also largely affected by cancer. The largest increase was exhibited by ERCC3 (excision repair 3 TFIIH core complex helicase subunit) in T (ΔCOORD = 34) and Θ (ΔCOORD = 64), and TAF1L (TATA-box binding protein associated factor 1 like) in Φ (ΔCOORD = 60). Expression coordination of ERCC3, a.k.a. xeroderma-pigmentosum B (XPB) [80], increased also in Φ (ΔCOORD = 32). In contrast, GTF2I (general transcription factor IIi) in T (ΔCOORD = - 44), GTF2H4 (general transcription factor IIH subunit 4) in Φ (ΔCOORD = - 46) and TAF6 (TATA-box binding protein associated factor 6) in Θ (ΔCOORD = - 44) exhibited the largest decrease.
By the most comprehensive measure (Transcriptomic Distance, TD, (Figure 5(c)) POLR2L had the largest contribution to the overall cancer-induced transcriptomic alteration within this gene subset in T (TD(T) = 145, TD(Φ) = 497, TD(Θ) = 495) and GTF2I in both cell lines (TD(T) = 45, TD(Φ) = 964 TD(Θ) = 872). The least affected genes were: POLR2H (RNA polymerase II subunit H) in T (TD(T) = 3, TD(Φ) = 106, TD(Θ) = 157), TBP (TATA-box binding protein) in Φ (TD(T) = 15, TD(Φ) = 26, TD(Θ) = 18) and POLR2D (general transcription factor IIH subunit 1) in Θ (TD(T) = 15, TD(Φ) = 106, TD(Θ) = 157). The average TD of this gene subset was 40 for the T samples, 99 for the BCPAP cells and 94 for the 8505C cells. It is important to note the substantially different contribution levels to the overall transcriptomic change of this gene subset in the three types of samples.
3.4. Cancer-Induced Remodeling of DNA Replication (DER) Pathway
3.5. Remodeling of the Coupling of Polymerase II Genes with Basal Transcription Factors
Figure 7 presents the statistically (p < 0.95) significant synergism, antagonsim and independence of the expressions of the polymerase II genes with their binding partners.
4. Discussion
In this report, we used the GFP [40] algorithms to reveal novel characteristics of the transcriptome that are ignored by the traditional analysis limited to the genes’ expression levels (e.g. [81,82]). Adding the independent Relative Expression Variation (REV) and Expression Correlation (COR) to the Average Expression Level (AVE) of individual genes increased by almost 75 hundred times the information obtained from our gene expression experiments on thyroid cancer samples [44,45]. The independence of the three characteristics, illustrated here for 30 DNA replication genes in all four types of samples, was confirmed for several other gene sets profiled on surgically removed tumors from kidney [47,48], prostate [36,78] and thyroid [22]. AVEs, REVs and CORs of all genes characterize the transcriptome as well as the numbers (AVE) of electronic devices of each type, their wiring (COR) and applied voltage fluctuations (REV) characterize a supercomputer.
REV (Appendix A3) and COR (Appendix A4) were used to define the derived characteristics of individual genes termed Relative Expression Control (REC, Appendix B1) and Coordination Degree (COORD, Appendix B2). The derived characteristics were used to define the novel measures of transcriptomic alteration termed Regulation of Expression Control (ΔREC; Appendix C4) and Regulation of the Coordination Degree (ΔCOORD; Appendix C5).
It is important to specify that the arbitrarily introduced (1.5x or 2.0x) absolute fold-change cut-off to consider a gene as significantly regulated was replaced by the flexible CUT (Appendix C1). CUT is computed for each transcript by evaluating the biological variability of the expression level across biological replicas and the technical noise of the probing spots in the compared conditions. Also important is that the expression levels of adequately quantified genes were normalized to the median expression of all genes in that condition which improves the accuracy of the conditions’ comparison.
Instead of the traditional percentages of up- and down-regulated genes that is limited to the significantly regulated, implicitly considering every affected gene as a uniform +1/-1 contributor to the expression profile alteration, we use the Weighted Individual (gene) Regulation (WIR; Appendix C2). WIR takes into account the total change of the expression level and the statistical confidence of the regulation. Altogether WIR, ΔREC and ΔCOORD were incorporated into the Transcriptomic Distance (TD; Appendix C6), the most theoretically possible comprehensive measure of the cancer-related transcriptomic change.
In the presented analyses, the transcriptomic regulations in the cancer nodule (T) and standard thyroid cancer cell lines BPAP (Φ) and 8505C (Θ) were referred to the gene expression profile of the surrounding normal tissue (N) in the surgically removed PTC tumor. While such comparison is natural for the cancer nodule, it might be disputable for the cell lines because of the differences in the cellular environment. In separate studies we proved the profound remodeling of the transcriptomes of each of two cell types (mouse cortical astrocytes and immortalized precursor oligodendrocytes) when co-cultured in insert systems [83,84]. These results suggest that a homo-cellular culture does not exactly repeat the genomic properties of the main cell type in the tissue.
The functional pathways analyzed in Table 1 and Table 2 are not mutually exclusive. For instance, POLD4 (polymerase (DNA-directed), delta 4, accessory subunit) is included in: hsa03030 DNA replication, hsa03410 Base excision repair, hsa03420 Nucleotide excision repair, hsa03430 Mismatch repair, and hsa03440 Homologous recombination. Interestingly, while we found POLD4 as significantly up-regulated (x = 1.90) in the malignant part of the tumor compared to the normal region, it was massively down regulated in both BPAP (x = -26.96) and X505C (x = -39.64) cells. A recent meta-analysis of TCGA (The Cancer Genome Atlas) data [85] has shown that POLD4 was significantly overexpressed in 17 types of cancer compared to adjacent normal tissue. Our results indicate again the limitations of the standardized cancer cell lines to replicate the characteristics of the real tumors owing to potential in vitro evolution and genomic instability caused by repeated passages of the cultured cells [86].
Figure 3 shows how the expressions of genes involved in the protein processing in endoplasmic reticulum were regulated in the cancerous part of the thyroid tumor. Interestingly, the ubiquitination gene UBXN1 (UBX domain protein 1), an important negative regulator of the unfolded protein response [87], was significantly up-regulated in the profiled tumor (xT = 1.75) but massively down-regulated in both cell lines (x(Φ) = -41.96, x(Θ) = -106.57). While depletion of UBXN1 might be profitable for cancer cell survival and proliferation through protecting against endoplasmic reticulum (ER) stress [88,89] its up-regulation might facilitate migration and invasion of the cancer cells within the thyroid tissue as reported in prostate cancer [90]. Therefore, we speculate that, although in apparent contradiction, both UBXN1 up-regulation in the tissue (Figure 3) and UBXN1 down-regulation in the homo-cellular BPAP and 8505C cultures are justified by the molecular mechanisms controlled by the encoded protein. PTRF and UBE2O (ubiquitin-conjugating enzyme E2O) are other examples of genes that were not affected in the tumor but significantly regulated in both BPAP (xPTRF = -31.50, xUBE2O = 28.86) and 8505C (xPTRF = -58.42, xUBE2O = 11.70) cell lines. UBE2O was reported to ubiquitinate PTRF and inhibit the “secretion of exosome-related PTRF/CAVIN1” [91].
Figure 4 justifies the increased proliferation of the cancer cells through up-regulated CCND1 (x(T) = 3.48; x(Φ) = 4.78; x(Θ) = 8.85), one of the 20 hub genes used as biomarker for the thyroid cancer [92]. Survival of the cancer cells is optimized through the up-regulation of several key genes ensuring evading apoptosis such are BIRC5 (x(T) = 6.04) and DDB2 (x(T) = 2.37). BIRC5 (x(Φ) = 10.70; x(Θ) = 7.35) is known for promoting multidrug resistance to chemotherapy [93] and the oncogenic roles of DDB2 were reported in a recent review [94]. However, with respect to the normal thyroid tissue, DDB2 was significantly downregulated in both cell lines (x(Φ) = -3.01; x(Θ) = -22.00). How to explain these opposite results? Within a hetero-cellular tissue (composed of normal and cancer thyrocytes and potential presence of immune cells), over-expression of genes such is DDB2 accelerates cancer cells proliferation and invasion of the thyroid. Nevertheless, expression of genes that are no longer necessary is diminished in homo-cellular cultures [95].
The study proved that regulation of the gene expression profile is only a part of the global cancer-induced transcriptomic alteration as illustrated in Figure 5 for 51 RNA polymerase II genes and their binding partners. We believe that changes in the control of genes’ expression fluctuations and their inter-coordination should be also considered and eventually incorporated into the more general measure like the Transcriptomic Distance.
On average, REC increased in T by 2%, in Φ by 28% and in Θ by 20%. An increased control limits the fluctuations of the expression level within a narrow interval, while a decreased control allows the genes to easily adapt their expression levels to various environmental conditions. We believe that the Relative Expression Control is an indirect measure of cell’s priorities to ensure the right expression levels of critical genes for its survival and proliferation. As such, the regulation of REC gives important information of how cancerization has changed the cells’ priorities. We found huge increase of the expression control of POLR2B in both the anaplastic (ΔREC = 485) and the papillary (ΔREC = 206) thyroid cancer cell lines but not in the tumor (ΔREC = 5). The differences might be explained by the potential effects of the encoded protein on the tumor growth as recently reported in glioblastoma [96]. On the other hand, the much stricter control of TAF6 in BPAP cells while looser in the 8505C cells and practically not affected in the surgically removed specimen may indicate different anti-tumor molecular mechanisms [97]. It is interesting to note that POLR2B was up-regulated in both cell lines but not in the tumor (x(T) = 1.15; x(Φ) = 74.40; x(Θ) = 80.06), while TAF6 was down-regulated in both cell lines but not in the tumor (x(T) = -1.02; x(Φ) = -1.91; x(Θ) = -3.24).
For the gene set in Figure 5b, on average, the coordination degree decreased in T (ΔCOORD) = -7.76) but increased in the two cell lines (ΔCOORD) = 8.96 in Φ and ΔCOORD) = 16.80 in Θ). Increased coordination means more synchronization of the genes’ expressions with direct consequences on the pathway efficiency. By contrast, decreased coordination makes the pathway more flexible through letting genes to fluctuate their expression levels more independently. It seems natural to assume that the transcription pathways need more flexibility to adapt to the tissue heterogeneity while in a homo-cellular dish the pathway efficiency comes first.
The high hands out of POLR2L to the transcriptomic alteration in all three types of thyroid cancer samples as measured by the Transcriptomic Distance (Figure 5c) indicate that it might be a good target for anti-thyroid cancer gene therapy as it was suggested for prostate cancer [98]. Interestingly, the main contribution to the Transcriptomic Distance separating the state of a gene in a cancer sample with respect to the normal thyroid may come from any of the three types of individual gene characteristics. Thus, in the case of POLR2L, TD(T) = 145 comes mainly from the regulation of the expression control (ΔREC(T) = -142), while in the cell cultures the large TDs (TD(Φ) = 497; TD(Θ) = 495) from WIR (WIR(Φ) = -487; WIR(Θ) = -452), because of the substantial down-regulations (x(Φ)= -27.91; x(Θ)= -25.97). The differences between the tumor and the cell cultures indicate that, although POLR2L is a major player in developing of several forms of thyroid cancers, the involved molecular mechanisms are distinct. Therefore, the therapy targeting this gene should be tailored on the cancer specificity.
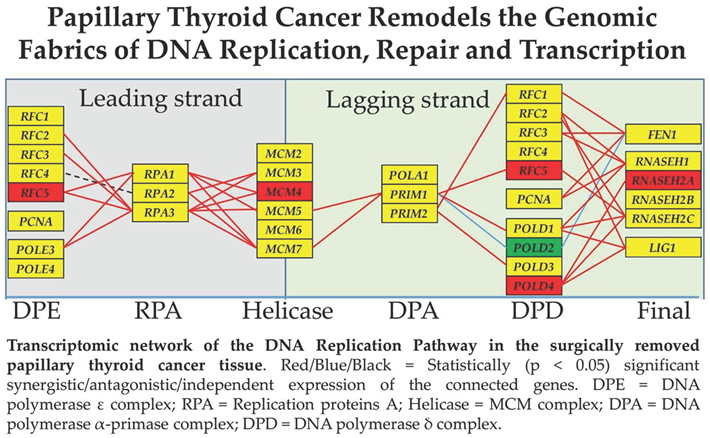
Figure 6 and Figure 7 show how cancer remodels the gene network responsible for the DNA Replication and that coupling the genes of the Polymerase II complex to the basal transcription factors in the investigated three types of thyroid malignancy. Expression levels of synergistically expressed genes fluctuate in phase (simultaneously going up and down) across the biological replicas, while those of the antagonistically expressed fluctuate in anti-phase (when one goes up the other goes down). Thus, COR analysis measures indirectly the expression synchronization of the coordinated genes. On the other hand, expression independence tells that most likely there is no direct interaction of the encoded products by the two genes. Missing continuous red/blue or dashed black line between two genes does not mean that they do not interact but that their expression correlation is not statistically significant in that condition. In addition to the substantial yet different remodeling of the transcriptomic network, it is also important to note the very different gene expression profile in the three types of thyroid cancer samples.
There are four main takehome findings in Figure 6:
i) Cancer remodels the DNA replication pathway as can be seen by comparing the gene network in the normal tissue (Figure 6(a)) and the malignant part (Figure 6(b)) of the same thyroid. Changes of the DER genes interaction might provide a complementary explanation of cancer development beyond the driving mutations [99].
ii) Expression correlation is independent of the regulation status of the linked genes. For instance, in “DPD –> Final” there is a significant synergism between the not regulated FEN1 and REC1 in the PTC nodule of the tumor ((COR = 0.978; Figure 6(b) but also between the up-regulated FEN1 and the down-regulated REC1 in the BCPAP cells (COR = 0.951; Figure 6(c)). The FEN1 - REC1 synergism was very near the 0.950 statistical significant cut-off in the normal tissue (COR = 0.944) but less close in the 8505C cells (COR = 0.749). FEN1 was reported to promote cancer cell proliferation, migration and invasion [100] in biliary tumors.
iii) The remodeling depends on the form of the thyroid cancer (see differences between the papillary (Figure 6(c)) and anaplastic (Figure 6(d)) cell lines. For instance, the sygnificant antagonism of the significantly down-regulated genes RPA2 and POLE4 in the BCPAP cells is switched into a significant synergism in 8505C cells (present also in the normal tissue). Although miR-519 was identified as a common upstream regulator of both RPA2 and POLE4 [101], our result might be the first confirmation of their direct interaction.
iv) Each affected person has a distinct DER gene network as illustrated by the differences between the network in Figure 6(b) (PTC collected from the thyroid of a 33y old woman) and that in Figure 6(c) (PTC collected from a 76y old woman [102]). For instance, the independently expressed RPA2 and REC4 in T are syngersically expressed in Φ (and also in Θ). This difference indicates distinct molecular mechanisms of the DNA replication in the papillary cancer nodules of the two PTC donors that requires personalized approach of anti-cancer therapy (e.g. [22,36,48]).
i) Cancer remodels the significant expression coordination of polymerases with their targeted partners (compare the correlations in the normal tissue (Figure 7(a)) and the malignant part (Figure 7(b)) of the same thyroid.
ii) Expression correlation is independent of the regulation status of the linked genes. For instance, POLR2H, a prognosis gene for the lung squamus cell carcinoma [101] and ECC3 are synergistically expressed in both T and Φ samples although POLR2H was up-regulated in T but down-regulated in Φ.
iii) The remodeling depends on the form of the thyroid cancer (see differences between the papillary (Figure 7(c)) and anaplastic (Figure 7(d)) cell lines.
iv) Each affected person has distinct gene networks as illustrated by the differences between the correlations in the the two PTC type samples T and Φ. For instance, POLR2H and CDK7 are synergistically expressed in T but antagonistically expressed in Φ.
5. Conclusions
By providing the most theoretically possible comprehensive measure of the transcriptome alteration in cancer, the GFP approach is the alternative of choice to the biomarker paradigm [103]. However, GFP findings should be completed by better equipped laboratories through pathophysiological experiments to identify the molecular mechanisms responsible for controlling the transcripts’ abundances and formation of gene networks.
Author Contributions
Conceptualization, D.A.I.; methodology, S.I.; software, D.A.I.; validation, D.A.I. and S.I.; formal analysis, D.A.I.; investigation, S.I.; resources, D.A.I.; data curation, D.A.I.; writing—original draft preparation, D.A.I.; writing—review and editing, S.I.; visualization, D.A.I.; supervision, D.A.I.; project administration, D.A.I. Both authors have read and agreed to the published version of the manuscript.
Funding
This research received no external funding.
Data Availability Statement
Gene expression data used in this study were downloaded from the publicly accessible websites: https://www.ncbi.nlm.nih.gov/geo/query/acc.cgi?acc=GSE97001 and https://www.ncbi.nlm.nih.gov/geo/query/acc.cgi?acc=GSE97002.
Conflicts of Interest
The author declarse no conflicts of interest.
Appendix A. Primary Transcriptomic Characteristics of Individual Genes
1. Normalized expression level of gene “i” in the biological replica “k” of condition “c”:
ai(c;k) is the sum of net florescences of all microarray spots probing gene “i” in the biological replica “k” of condition “c”.
2. Average expression level (AVE) of gene “i” in the biological replica “k” of condition “c”:
3. Relative expression variation of gene “i” in the biological replica “k” of condition “c”:
and χ2 is the chi-square score with β probability for r degrees of freedom
4. Pair-wise correlation (COR) of the expression levels of genes “i” and “j” in condition “c”:
Appendix B. Secondary Transcriptomic Characteristics of Individual Genes
1. Relative Expression Control (REC) in condition “c”:
where is the median of the REVs of all quantified unigenes in the respective condition. Positive REC values indicate genes with stronger expression control while negative values point to genes with lesser
2. Coordination degree (COORD) of gene “i” in the biological replica “k” of condition “c”:
where: SYN/ANT/IND are the percentages of statistically (p < 0.05) significant synergistically, antagonistically and independently expressed genes with gene “i” in the biological replica “k” of condition “c”.
Appendix C. Criteria and Measures of Transcriptomic Alterations of Individual Genes and Functional Pathways
1. Statistically significant regulation of the expression level:
2. Weighted Individual (Gene) Regulation:
3. Weighted Pathway Regulation:
4. Regulation of the Expression Control:
In this study, const = 100.
5. Regulation of the Coordination Degree:
6. Transcriptomic Distance:
References
- American Cancer Society: Key Statistics for Thyroid Cancer. Available online: https://www.cancer.org/cancer/types/thyroid-cancer/about/key-statistics.html (accessed on 31 January 2024).
- Pavlidis, E.T.; Galanis, I.N.; Pavlidis, T.E. Update on current diagnosis and management of anaplastic thyroid carcinoma. World J Clin Oncol. 2023, 14, 570–583. [Google Scholar] [CrossRef]
- Limaiem, F.; Rehman, A.; Anastasopoulou, C.; Mazzoni, T. Papillary Thyroid Carcinoma. [Updated 2023 Jan 1]. In: StatPearls [Internet]. Treasure Island (FL): StatPearls Publishing; 2024. Available from: https://www.ncbi.nlm.nih.gov/books/NBK536943/. (accessed on 31 January 2024).
- Wang, Z.; Ji, X.; Zhang, H.; Sun, W. Clinical and molecular features of progressive papillary thyroid microcarcinoma. Int J Surg. 2024. [Google Scholar] [CrossRef]
- Zhao, H.; Huang, T.; Li, H. Risk factors for skip metastasis and lateral lymph node metastasis of papillary thyroid cancer. Surgery. 2019, 166, 55–60. [Google Scholar] [CrossRef]
- Bai, X.; Xu, Y.; Liu, Y. MicroRNA-3653-3p inhibited papillary thyroid carcinoma progression by regulating CRIPTO-1. Cell Mol Biol (Noisy-le-grand). 2023, 69, 272–276. [Google Scholar] [CrossRef]
- Dhuli, K.; Medori, M.C.; Donato, K.; Donato, K.; Maltese, P.E.; Tanzi, B.; Tezzele, S.; Mareso, C.; Miertus, J.; Generali, D. M. Omics sciences and precision medicine in thyroid cancer. Clin Ter. 2023, 174 (Suppl. S2), 11–20. [Google Scholar] [CrossRef]
- Margraf, R.L.; Crockett, D.K.; Krautscheid, P.M.; Seamons, R.; Calderon, F.R.; Wittwer, C.T.; Mao, R. Multiple endocrine neoplasia type 2 RET protooncogene database: Repository of MEN2-associated RET sequence variation and reference for genotype/phenotype correlations. Hum Mutat. 2009, 30, 548–556. [Google Scholar] [CrossRef]
- Igbokwe, A.; Lopez-Terrada, D.H. Molecular testing of solid tumors. Arch Pathol Lab Med. 2011, 135, 67–82. [Google Scholar] [CrossRef]
- Giusti, F.; Falchetti, A.; Franceschelli, F. ; Marini F, Tanini A, Brandi ML Thyroid cancer: Current molecular perspectives. J Oncol. 2010, 2010, 351679. [Google Scholar] [CrossRef]
- Máximo, V.; Melo, M.; Zhu, Y.; Gazzo, A.; Sobrinho Simões, M.; Da Cruz Paula, A.; Soares, P. Genomic profiling of primary and metastatic thyroid cancers. Endocr Relat Cancer. 2024, 31, e230144. [Google Scholar] [CrossRef]
- NIH National Cancer Institute GDC Data Portal. Available online: https://portal.gdc.cancer.gov/ (accessed on 1 February 2024).
- Li, Z.; Jia, L.I.; Zhou, H.R.; Zhang, L.U.; Zhang, M.; Lv, J.; Deng, Z.Y.; Liu, C. Development and Validation of Potential Molecular Subtypes and Signatures of Thyroid Carcinoma Based on Aging-related Gene Analysis. Cancer Genomics Proteomics. 2024, 21, 102–117. [Google Scholar] [CrossRef]
- Xiao, H.; Hu, L.; Tan, Q.; Jia, J.; Xie, P.; Li, J.; Wang, M. Transcriptional profiles reveal histologic origin and prognosis across 33 The Cancer Genome Atlas tumor types. Transl Cancer Res. 2023, 12, 2764–2780. [Google Scholar] [CrossRef]
- Lim, J.; Lee, H.S.; Park, J.; Kim, K.S.; Kim, S.K.; Cho, Y.W.; Song, Y.S. Different Molecular Phenotypes of Progression in BRAF- and RAS-Like Papillary Thyroid Carcinoma. Endocrinol Metab (Seoul). 2023, 38, 445–454. [Google Scholar] [CrossRef]
- Iacobas, D.A. Powerful quantifiers for cancer transcriptomics. World J Clin Oncol. 2020, 11, 679–704. [Google Scholar] [CrossRef]
- Iacobas, D.A.; Tuli, N.Y.; Iacobas, S.; Rasamny, J.K.; Moscatello, A.; Geliebter, J.; Tiwari, R.K. Gene master regulators of papillary and anaplastic thyroid cancers. Oncotarget. 2017, 9, 2410–2424. [Google Scholar] [CrossRef]
- Penna, G.C.; Vaisman, F.; Vaisman, M.; Sobrinho-Simões, M.; Soares, P. Molecular Markers Involved in Tumorigenesis of Thyroid Carcinoma: Focus on Aggressive Histotypes. Cytogenet Genome Res. 2016, 150, 194–207. [Google Scholar] [CrossRef]
- Jin, Z.; Han, Y.; Zhang, J.; Liu, Z.; Li, R.; Liu, Z. Prognosis and therapy in thyroid cancer by gene signatures related to natural killer cells. J Gene Med. 2024, 26, e3657. [Google Scholar] [CrossRef]
- Liu, Y.; Yin, Z.; Wang, Y.; Chen, H. Exploration and validation of key genes associated with early lymph node metastasis in thyroid carcinoma using weighted gene co-expression network analysis and machine learning. Front Endocrinol (Lausanne). 2023, 14, 1247709. [Google Scholar] [CrossRef]
- Ruiz-Pozo, V.A.; Cadena-Ullauri, S.; Guevara-Ramírez, P.; Paz-Cruz, E.; Tamayo-Trujillo, R.; Zambrano, A.K. Differential microRNA expression for diagnosis and prognosis of papillary thyroid cancer. Front Med (Lausanne). 2023, 10, 1139362. [Google Scholar] [CrossRef]
- Iacobas, D.A. Biomarkers, Master Regulators and Genomic Fabric Remodeling in a Case of Papillary Thyroid Carcinoma. Genes 2020, 11, 1030. [Google Scholar] [CrossRef]
- Kyoto Encyclopedia of genes and Genomes: KEGG Pathway database. 2. Genetic Information Processing. Available online: https://www.genome.jp/kegg/pathway.html#genetic (accessed on 31 January 2024).
- Ouyang, J.; Feng, Y.; Zhang, Y.; Liu, Y.; Li, S.; Wang, J.; Tan, L.; Zou, L. Integration of metabolomics and transcriptomics reveals metformin suppresses thyroid cancer progression via inhibiting glycolysis and restraining DNA replication. Biomed Pharmacother. 2023, 168, 115659. [Google Scholar] [CrossRef]
- Santos, L.S.; Branco, S.C.; Silva, S.N.; Azevedo, A.P.; Gil, O.M.; Manita, I.; Ferreira, T.C.; Limbert, E.; Rueff, J.; Gaspar, J.F. Polymorphisms in base excision repair genes and thyroid cancer risk. Oncol Rep. 2012, 28, 1859–1868. [Google Scholar] [CrossRef] [PubMed]
- Santos, L.S.; Gomes, B.C.; Gouveia, R.; Silva, S.N.; Azevedo, A.P.; Camacho, V.; Manita, I.; Gil, O.M.; Ferreira, T.C.; Limbert, E. The role of CCNH Val270Ala (rs2230641) and other nucleotide excision repair polymorphisms in individual susceptibility to well-differentiated thyroid cancer. Oncol Rep. 2013, 30, 2458–2466. [Google Scholar] [CrossRef] [PubMed]
- Santos, L.S.; Gomes, B.C.; Bastos, H.N.; Gil, O.M.; Azevedo, A.P.; Ferreira, T.C.; Limbert, E.; Silva, S.N.; Rueff, J. Thyroid Cancer: The Quest for Genetic Susceptibility Involving DNA Repair Genes. Genes 2019, 10, 586. [Google Scholar] [CrossRef] [PubMed]
- Gao, Y.; Pan, Y.; Luo, Y.; Cheng, R.; Zhai, Q. Intrathyroid thymic carcinoma: A clinicopathological analysis of 22 cases. Ann Diagn Pathol. 2023, 67, 152221. [Google Scholar] [CrossRef] [PubMed]
- Li, Z.; Ying, Y.; Zeng, X.; Liu, J.; Xie, Y.; Deng, Z.; Hu, Z.; Yang, J. DNMT1/DNMT3a-mediated promoter hypermethylation and transcription activation of ICAM5 augments thyroid carcinoma progression. Funct Integr Genomics. 2024, 24, 12. [Google Scholar] [CrossRef]
- Zhou, T.; Ma, N.; Zhang, Y.L.; Chen, X.H.; Luo, X.; Zhang, M.; Gao, Q.J.; Zhao, D.W. Transcription factor FOXP4 inversely governs tumor suppressor genes and contributes to thyroid cancer progression. Heliyon. 2024, 10, e23875. [Google Scholar] [CrossRef]
- Bagıs, M.; Can, N.; Sut, N.; Tastekin, E.; Erdogan, E.G.; Bulbul, B.Y.; Sezer, Y.A.; Kula, O.; Demirtas, E.M.; Usta, I. A Comprehensive Approach to the Thyroid Bethesda Category III (AUS) in the Transition Zone Between 2nd Edition and 3rd Edition of The Bethesda System for Reporting Thyroid Cytopathology: Subcategorization, Nuclear Scoring, and More. Endocr Pathol. 2024. [Google Scholar] [CrossRef] [PubMed]
- Li, Y.; Zhang, R.; Hei, H. Advances in post-translational modifications of proteins and cancer immunotherapy. Front Immunol. 2023, 14, 1229397. [Google Scholar] [CrossRef] [PubMed]
- Zerfaoui, M.; Dokunmu, T.M.; Toraih, E.A.; Rezk, B.M.; Abd Elmageed, Z.Y.; Kandil, E. New Insights into the Link between Melanoma and Thyroid Cancer: Role of Nucleocytoplasmic Trafficking. Cells 2021, 10, 367. [Google Scholar] [CrossRef]
- Gong, Z.; Xue, L.; Vlantis, A.C.; van Hasselt, C.A.; Chan, J.Y.K.; Fang, J.; Wang, R.; Yang, Y.; Li, D.; Zeng, X. Brusatol attenuated proliferation and invasion induced by KRAS in differentiated thyroid cancer through inhibiting Nrf2. J Endocrinol Invest. 2023. [Google Scholar] [CrossRef]
- Wang, Q.; Hao, F.; Ning, L.; Sun, C. Targeting PEAK1 sensitizes anaplastic thyroid carcinoma cells harboring BRAFV600E to Vemurafenib by Bim upregulation. Histol Histopathol. 2024, 18705. [Google Scholar] [CrossRef]
- Iacobas, S.; Iacobas, D.A. Personalized 3-Gene Panel for Prostate Cancer Target Therapy. Curr. Issues Mol. Biol. 2022, 44, 360–382. [Google Scholar] [CrossRef] [PubMed]
- Fujimoto, H.; Saito, Y.; Ohuchida, K.; Kawakami, E.; Fujiki, S.; Watanabe, T.; Ono, R.; Kaneko, A.; Takagi, S.; Najima, Y. Deregulated Mucosal Immune Surveillance through Gut-Associated Regulatory T Cells and PD-1+ T Cells in Human Colorectal Cancer. J Immunol. 2018, 200, 3291–3303. [Google Scholar] [CrossRef]
- Clark, D.J.; Dhanasekaran, S.M.; Petralia, F.; Pan, J.; Song, X.; Hu, Y.; da Veiga Leprevost, F.; Reva, B.; Lih, T.M.; Chang, H.Y.; et al. Clinical Proteomic Tumor Analysis Consortium. Integrated Proteogenomic Characterization of Clear Cell Renal Cell Carcinoma. Cell. 2019, 179, 964–983. [Google Scholar] [CrossRef]
- Yang, C.; Gong, J.; Xu, W.; Liu, Z.; Cui, D. Next-generation sequencing identified somatic alterations that may underlie the etiology of Chinese papillary thyroid carcinoma. Eur J Cancer Prev. 2023, 32, 264–274. [Google Scholar] [CrossRef] [PubMed]
- Iacobas, D.A.; Xi, L. Theory and Applications of the (Cardio) Genomic Fabric Approach to Post-Ischemic and Hypoxia-Induced Heart Failure. J. Pers. Med. 2022, 12, 1246. [Google Scholar] [CrossRef]
- Iacobas, S.; Ede, N.; Iacobas, D.A. The Gene Master Regulators (GMR) Approach Provides Legitimate Targets for Personalized, Time-Sensitive Cancer Gene Therapy. Genes 2019, 10, 560. [Google Scholar] [CrossRef] [PubMed]
- Iacobas, D.A.; Iacobas, S.; Lee, P.R.; Cohen, J.E.; Fields, R.D. Coordinated Activity of Transcriptional Networks Responding to the Pattern of Action Potential Firing in Neurons. Genes 2019, 10, 754. [Google Scholar] [CrossRef] [PubMed]
- Medscape: Thyroid Cancer Staging. Available online: http://emedicine.medscape.com/article/2006643-overview (accessed on 4 February 2024).
- Hierarchal gene master regulators of one case of papillary thyroid cancer. Available online: https://www.ncbi.nlm.nih.gov/geo/query/acc.cgi?acc=GSE97001 (accessed on 4 February 2024).
- Hierarchal gene master regulators of papillary (BCPAP) and anaplastic (8505C) thyroid cancer cell lines. Available online: https://www.ncbi.nlm.nih.gov/geo/query/acc.cgi?acc=GSE97002 (accessed on 4 February 2024).
- Agilent-026652 Whole Human Genome Microarray 4x44K v2. Platform GPL10332. Available online: https://www.ncbi.nlm.nih.gov/geo/query/acc.cgi?acc=GPL10332 (accessed on 4 February 2024).
- Iacobas, D.A.; Obiomon, E.A.; Iacobas, S. Genomic Fabrics of the Excretory System’s Functional Pathways Remodeled in Clear Cell Renal Cell Carcinoma. Curr. Issues Mol. Biol. 2023, 45, 9471–9499. [Google Scholar] [CrossRef]
- Iacobas, D.A.; Mgbemena, V.E.; Iacobas, S.; Menezes, K.M.; Wang, H.; Saganti, P.B. Genomic Fabric Remodeling in Metastatic Clear Cell Renal Cell Carcinoma (ccRCC): A New Paradigm and Proposal for a Personalized Gene Therapy Approach. Cancers 2020, 12, 3678. [Google Scholar] [CrossRef]
- RNA polymerase. Available online: https://www.genome.jp/kegg-bin/show_pathway?hsa03020 (accessed on 7 January 2024).
- Basal transcription factors. Available online: https://www.genome.jp/kegg-bin/show_pathway?hsa03022 (accessed on 7 January 2024).
- Spliceosome. Available online: https://www.genome.jp/kegg-bin/show_pathway?hsa03040 (accessed on 7 January 2024).
- Ribosome. Available online: https://www.genome.jp/kegg-bin/show_pathway?hsa03010 (accessed on 7 January 2024).
- Aminoacyl-tRNA biosynthesis. Available online: https://www.genome.jp/kegg-bin/show_pathway?hsa00970 (accessed on 7 January 2024).
- Nucleocytoplasmic transport. Available online: https://www.genome.jp/kegg-bin/show_pathway?hsa03013 (accessed on 7 January 2024).
- mRNA surveillance pathway. Available online: https://www.genome.jp/kegg-bin/show_pathway?hsa03015 (accessed on 7 January 2024).
- Ribosome biogenesis in eukaryotes. Available online: https://www.genome.jp/kegg-bin/show_pathway?hsa03008 (accessed on 7 January 2024).
- Protein export. Available online: https://www.genome.jp/kegg-bin/show_pathway?hsa03060 (accessed on 7 January 2024).
- Protein processing in endoplasmic reticulum. Available online: https://www.genome.jp/kegg-bin/show_pathway?hsa04141 (accessed on 7 January 2024).
- SNARE interactions in vesicular transport. Available online: https://www.genome.jp/kegg-bin/show_pathway?hsa04130 (accessed on 7 January 2024).
- Ubiquitin mediated proteolysis. Available online: https://www.genome.jp/kegg-bin/show_pathway?hsa04120 (accessed on 7 January 2024).
- Sulfur relay system. Available online: https://www.genome.jp/kegg-bin/show_pathway?hsa04122 (accessed on 7 January 2024).
- Proteasome. Available online: https://www.genome.jp/kegg-bin/show_pathway?hsa03050 (accessed on 7 January 2024).
- RNA degradation. Available online: https://www.genome.jp/kegg-bin/show_pathway?hsa03018 (accessed on 7 January 2024).
- DNA replication. Available online: https://www.genome.jp/kegg-bin/show_pathway?hsa03030 (accessed on 7 January 2024).
- Base excision repair. Available online: https://www.genome.jp/kegg-bin/show_pathway?hsa03410 (accessed on 7 January 2024).
- Nucleotide excision repair. Available online: https://www.genome.jp/kegg-bin/show_pathway?hsa03420 (accessed on 7 January 2024).
- Mismatch repair. Available online: https://www.genome.jp/kegg-bin/show_pathway?hsa03430 (accessed on 7 January 2024).
- Homologous recombination. Available online: https://www.genome.jp/kegg-bin/show_pathway?hsa03440 (accessed on 7 January 2024).
- Non-homologous end-joining. Available online: https://www.genome.jp/kegg-bin/show_pathway?hsa03450 (accessed on 7 January 2024).
- Fanconi anemia pathway. Available online: https://www.genome.jp/kegg-bin/show_pathway?hsa03460 (accessed on 7 January 2024).
- ATP-dependent chromatin remodeling. Available online: https://www.genome.jp/kegg-bin/show_pathway?hsa03082 (accessed on 7 January 2024).
- Polycomb repressive complex. Available online: https://www.genome.jp/kegg-bin/show_pathway?hsa03083 (accessed on 7 January 2024).
- Pathway in cancer. Available online: https://www.genome.jp/kegg-bin/show_pathway?hsa05200 (accessed on 14 January 2024).
- Arbel, M.; Choudhary, K.; Tfilin, O.; Kupiec, M. PCNA Loaders and Unloaders—One Ring That Rules Them All. Genes 2021, 12, 1812. [Google Scholar] [CrossRef] [PubMed]
- Kimura, N.; Takayama, K.I.; Yamada, Y.; Kume, H.; Fujimura, T.; Inoue, S. Ribonuclease H2 Subunit A Preserves Genomic Integrity and Promotes Prostate Cancer Progression. Cancer Res Commun. 2022, 2, 870–883. [Google Scholar] [CrossRef] [PubMed]
- Saiselet, M.; Floor, S.; Tarabichi, M.; Dom, G.; Hébrant, A.; van Staveren, W.C.; Maenhaut, C. Thyroid cancer cell lines: An overview. Front Endocrinol (Lausanne). 2012, 3, 133. [Google Scholar] [CrossRef] [PubMed]
- Mineva, I.; Gartner, W.; Hauser, P.; Kainz, A.; Löffler, M.; Wolf, G.; Oberbauer, R.; Weissel, M.; Wagner, L. Differential expression of alphaB-crystallin and Hsp27-1 in anaplastic thyroid carcinomas because of tumor-specific alphaB-crystallin gene (CRYAB) silencing. Cell Stress Chaperones. 2005, 10, 171–184. [Google Scholar] [CrossRef] [PubMed]
- Iacobas, S.; Iacobas, D.A. A Personalized Genomics Approach of the Prostate Cancer. Cells 2021, 10, 1644. [Google Scholar] [CrossRef] [PubMed]
- Cheng, D.; Semmens, K.; McManus, E.; Chen, Q.; Meerzaman, D.; Wang, X.; Hafner, M.; Lewis, B.A.; Takahashi, H.; Devaiah, B.N. at al. The nuclear transcription factor, TAF7, is a cytoplasmic regulator of protein synthesis. Sci Adv 2021, 7, eabi5751. [Google Scholar] [CrossRef] [PubMed]
- Feng, K.; Li, X.; Bai, Y.; Zhang, D.; Tian, L. Mechanisms of cancer cell death induction by triptolide: A comprehensive overview. Heliyon 2024, 10, e24335. [Google Scholar] [CrossRef] [PubMed]
- Li, Z.; Jia, L.I.; Zhou, H.R.; Zhang, L.U.; Zhang, M.; Lv, J.; Deng, Z.Y.; Liu, C. Development and Validation of Potential Molecular Subtypes and Signatures of Thyroid Carcinoma Based on Aging-related Gene Analysis. Cancer Genomics Proteomics. 2024, 21, 102–117. [Google Scholar] [CrossRef]
- Amjad, E.; Asnaashari, S.; Jahanban-Esfahlan, A.; Sokouti, B. The role of MAPK, notch and Wnt signaling pathways in papillary thyroid cancer: Evidence from a systematic review and meta-analyzing microarray datasets employing bioinformatics knowledge and literature. Biochem Biophys Rep. 2023, 37, 101606. [Google Scholar] [CrossRef]
- Iacobas, S.; Iacobas, D.A. Astrocyte proximity modulates the myelination gene fabric of oligodendrocytes. Neuron Glia Biol. 2010, 6, 157–169. [Google Scholar] [CrossRef]
- Iacobas, D.A.; Iacobas, S.; Stout, R.F.; Spray, D.C. Cellular Environment Remodels the Genomic Fabrics of Functional Pathways in Astrocytes. Genes 2020, 11, 520. [Google Scholar] [CrossRef] [PubMed]
- Jiang, C.; Fan, F.; Xu, W.; Jiang, X. POLD4 Promotes Glioma Cell Proliferation and Suppressive Immune Microenvironment: A Pan-Cancer Analysis Integrated with Experimental Validation. Int. J. Mol. Sci. 2023, 24, 13919. [Google Scholar] [CrossRef] [PubMed]
- Saiselet, M.; Floor, S.; Tarabichi, M.; Dom, G.; Hébrant, A.; van Staveren, W.C.; Maenhaut, C. Thyroid cancer cell lines: An overview. Front Endocrinol (Lausanne). 2012, 3, 133. [Google Scholar] [CrossRef] [PubMed]
- Ahlstedt, B.A.; Ganji, R.; Mukkavalli, S.; Paulo, J.A.; Gygi, S.P.; Raman, M. UBXN1 maintains ER proteostasis and represses UPR activation by modulating translation. EMBO Rep. 2024, 25, 672–703. [Google Scholar] [CrossRef] [PubMed]
- Wu-Baer, F.; Ludwig, T.; Baer, R. The UBXN1 protein associates with autoubiquitinated forms of the BRCA1 tumor suppressor and inhibits its enzymatic function. Mol Cell Biol. 2010, 30, 2787–2798. [Google Scholar] [CrossRef] [PubMed]
- Naidoo, N. ER and aging-Protein folding and the ER stress response. Ageing Res Rev. 2009, 8, 150–159. [Google Scholar] [CrossRef] [PubMed]
- Oh, J.J.; Ho, J.-N.; Byun, S.-S. ARRDC4 and UBXN1: Novel Target Genes Correlated with Prostate Cancer Gleason Score. Cancers 2021, 13, 5209. [Google Scholar] [CrossRef] [PubMed]
- Cen, X.; Chen, Q.; Wang, B.; Xu, H.; Wang, X.; Ling, Y.; Zhang, X.; Qin, D. UBE2O ubiquitinates PTRF/CAVIN1 and inhibits the secretion of exosome-related PTRF/CAVIN1. Cell Commun Signal. 2022, 20, 191. [Google Scholar] [CrossRef]
- Xie, K. A biomarker and molecular mechanism investigation for thyroid cancer. Central European Journal of Immunology. 2023, 48, 203–218. [Google Scholar] [CrossRef]
- Lin, I.L.; Lin, Y.T.; Chang, Y.C.; Kondapuram, S.K.; Lin, K.H.; Chen, P.C.; Kuo, C.Y.; Coumar, M.S.; Cheung, C.H.A. The SMAC mimetic GDC-0152 is a direct ABCB1-ATPase activity modulator and BIRC5 expression suppressor in cancer cells. Toxicol Appl Pharmacol. 2024, 5, 116888. [Google Scholar] [CrossRef]
- Gilson, P.; Drouot, G.; Witz, A.; Merlin, J.L.; Becuwe, P.; Harlé, A. Emerging Roles of DDB2 in Cancer. Int J Mol Sci. 2019, 20, 5168. [Google Scholar] [CrossRef] [PubMed]
- Saiselet, M.; Floor, S.; Tarabichi, M.; Dom, G.; Hébrant, A.; van Staveren, W.C.; Maenhaut, C. Thyroid cancer cell lines: An overview. Front Endocrinol (Lausanne). 2012, 3, 133. [Google Scholar] [CrossRef] [PubMed]
- Li, X.L.; Xie, Y.; Chen, Y.L.; Zhang, Z.M.; Tao, Y.F.; Li, G.; Wu, D.; Wang, H.R.; Zhuo, R.; Pan, J.J. The RNA polymerase II subunit B (RPB2) functions as a growth regulator in human glioblastoma. Biochem Biophys Res Commun. 2023, 674, 170–182. [Google Scholar] [CrossRef]
- Wang, J.; Wang, F.; Li, Q.; Wang, Q.; Li, J.; Wang, Y.; Sun, J.; Lu, D.; Zhou, H.; Li, S.; et al. Proteomics and molecular network analyses reveal that the interaction between the TAT-DCF1 peptide and TAF6 induces an antitumor effect in glioma cells. Mol Omics. 2020, 16, 73–82. [Google Scholar] [CrossRef] [PubMed]
- Zhang, D.; Xu, X.; Wei, Y.; Chen, X.; Li, G.; Lu, Z.; Zhang, X.; Ren, X.; Wang, S.; Qin, C. Prognostic Role of DNA Damage Response Genes Mutations and their Association With the Sensitivity of Olaparib in Prostate Cancer Patients. Cancer Control. 2022, 29, 10732748221129451. [Google Scholar] [CrossRef] [PubMed]
- Uchinomiya, K.; Tomita, M. A mathematical model for cancer risk and accumulation of mutations caused by replication errors and external factors. PLoS ONE. 2023, 18, e0286499. [Google Scholar] [CrossRef] [PubMed]
- Yuwei, X.; Bingzi, D.; Zhaowei, S.; Yujie, F.; Wei, Z.; Kun, L.; Kui, L.; Jingyu, C.; Chengzhan, Z. FEN1 promotes cancer progression of cholangiocarcinoma by regulating the Wnt/β-catenin signaling pathway. Dig Liver Dis 2023. [Google Scholar] [CrossRef] [PubMed]
- Abdelmohsen, K.; Srikantan, S.; Tominaga, K.; Kang, M.J.; Yaniv, Y.; Martindale, J.L.; Yang, X.; Park, S.S.; Becker, K.G.; Subramanian, M. Growth inhibition by miR-519 via multiple p21-inducing pathways. Mol Cell Biol. 2012, 32, 2530–2548. [Google Scholar] [CrossRef]
- Cellosaurus B-CPAP (CVCL_0153). Available online: https://www.cellosaurus.org/CVCL_0153 (accessed on 11 February 2024).
- Iacobas, D.A. Advanced Molecular Solutions for Cancer Therapy—The Good, the Bad, and the Ugly of the Biomarker Paradigm. Curr. Issues Mol. Biol. 2024, 46, 1694–1699. [Google Scholar] [CrossRef]
Figure 1.
Independence of the three transcriptomic characteristics of the 30 quantified DNA-replication genes in the normal thyroid tissue (N), papillary thyroid cancer tissue (T), papilary thyroid cancer cell line BCPAP (Φ) and anaplastic thyroid cancer cell line 8505C (Θ). (a) Average expression level (AVE). (b) Relative Expression Varaition (REV). (c) Expression correlation (COR) with PCNA (proliferating cell nuclear antigen). (d) Statistically (p < 0.05) significant correlations (|COR| > 0.95) of the DER genes with PCNA.
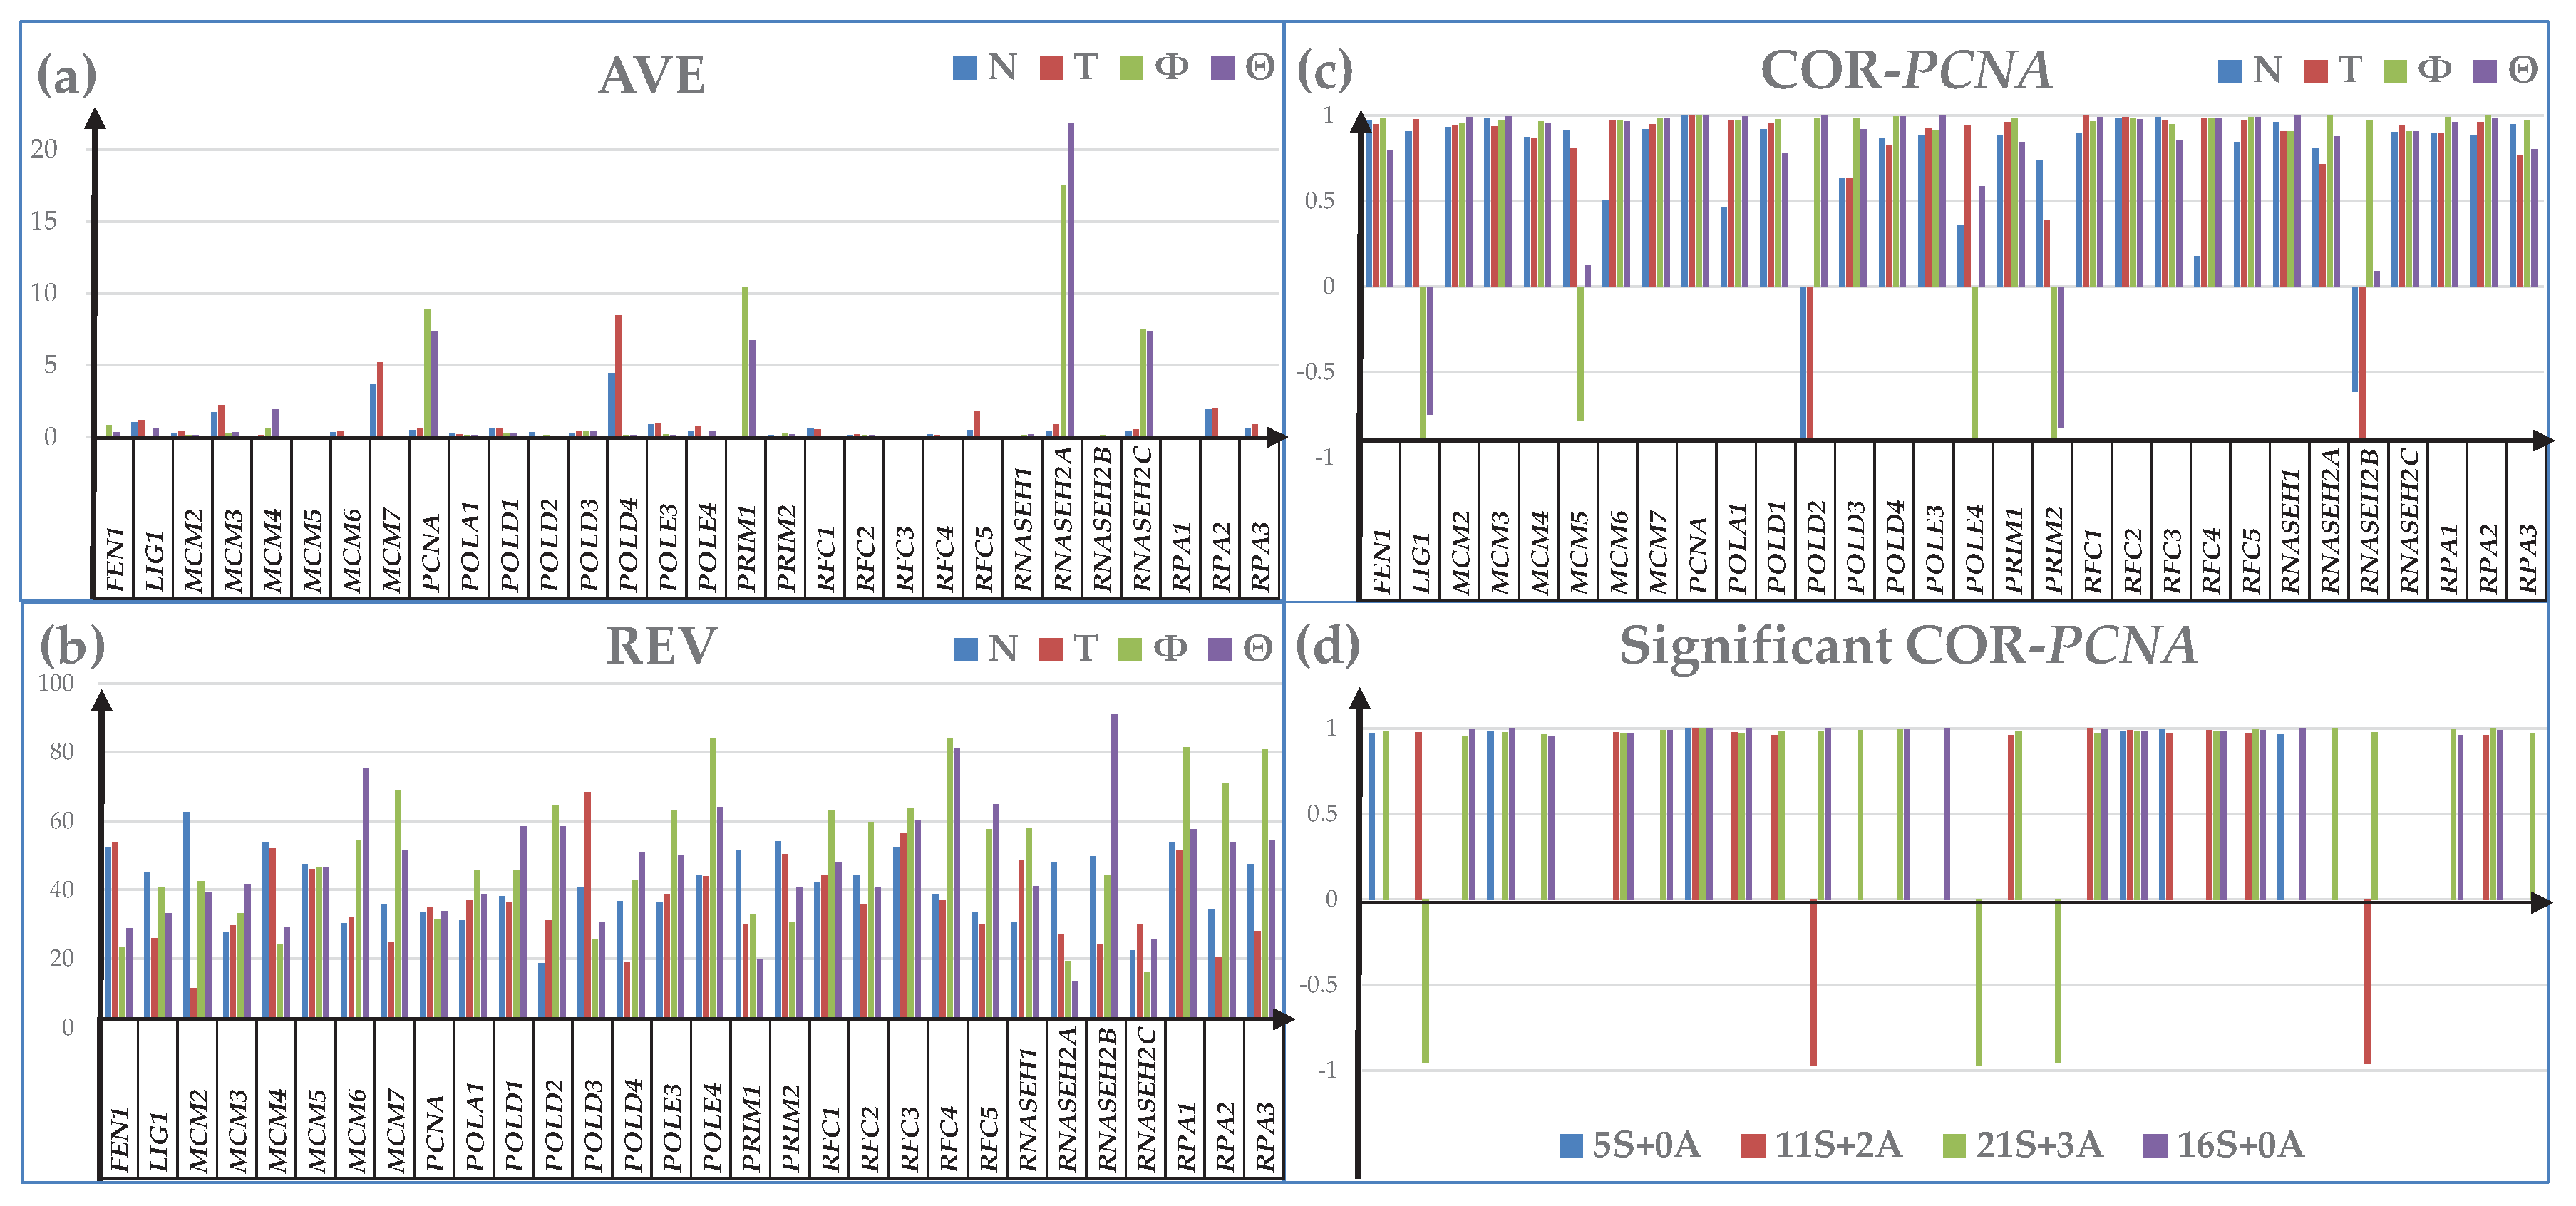
Figure 2.
Three ways to measure the expression regulation of 51 randomly selected out of 74 quantified genes encoding polymerases in cancer: (a) Uniform (+1/-1) contribution; (b) Expression Ratio; (c) Weighted Individual (gene) Regulation.
Figure 2.
Three ways to measure the expression regulation of 51 randomly selected out of 74 quantified genes encoding polymerases in cancer: (a) Uniform (+1/-1) contribution; (b) Expression Ratio; (c) Weighted Individual (gene) Regulation.
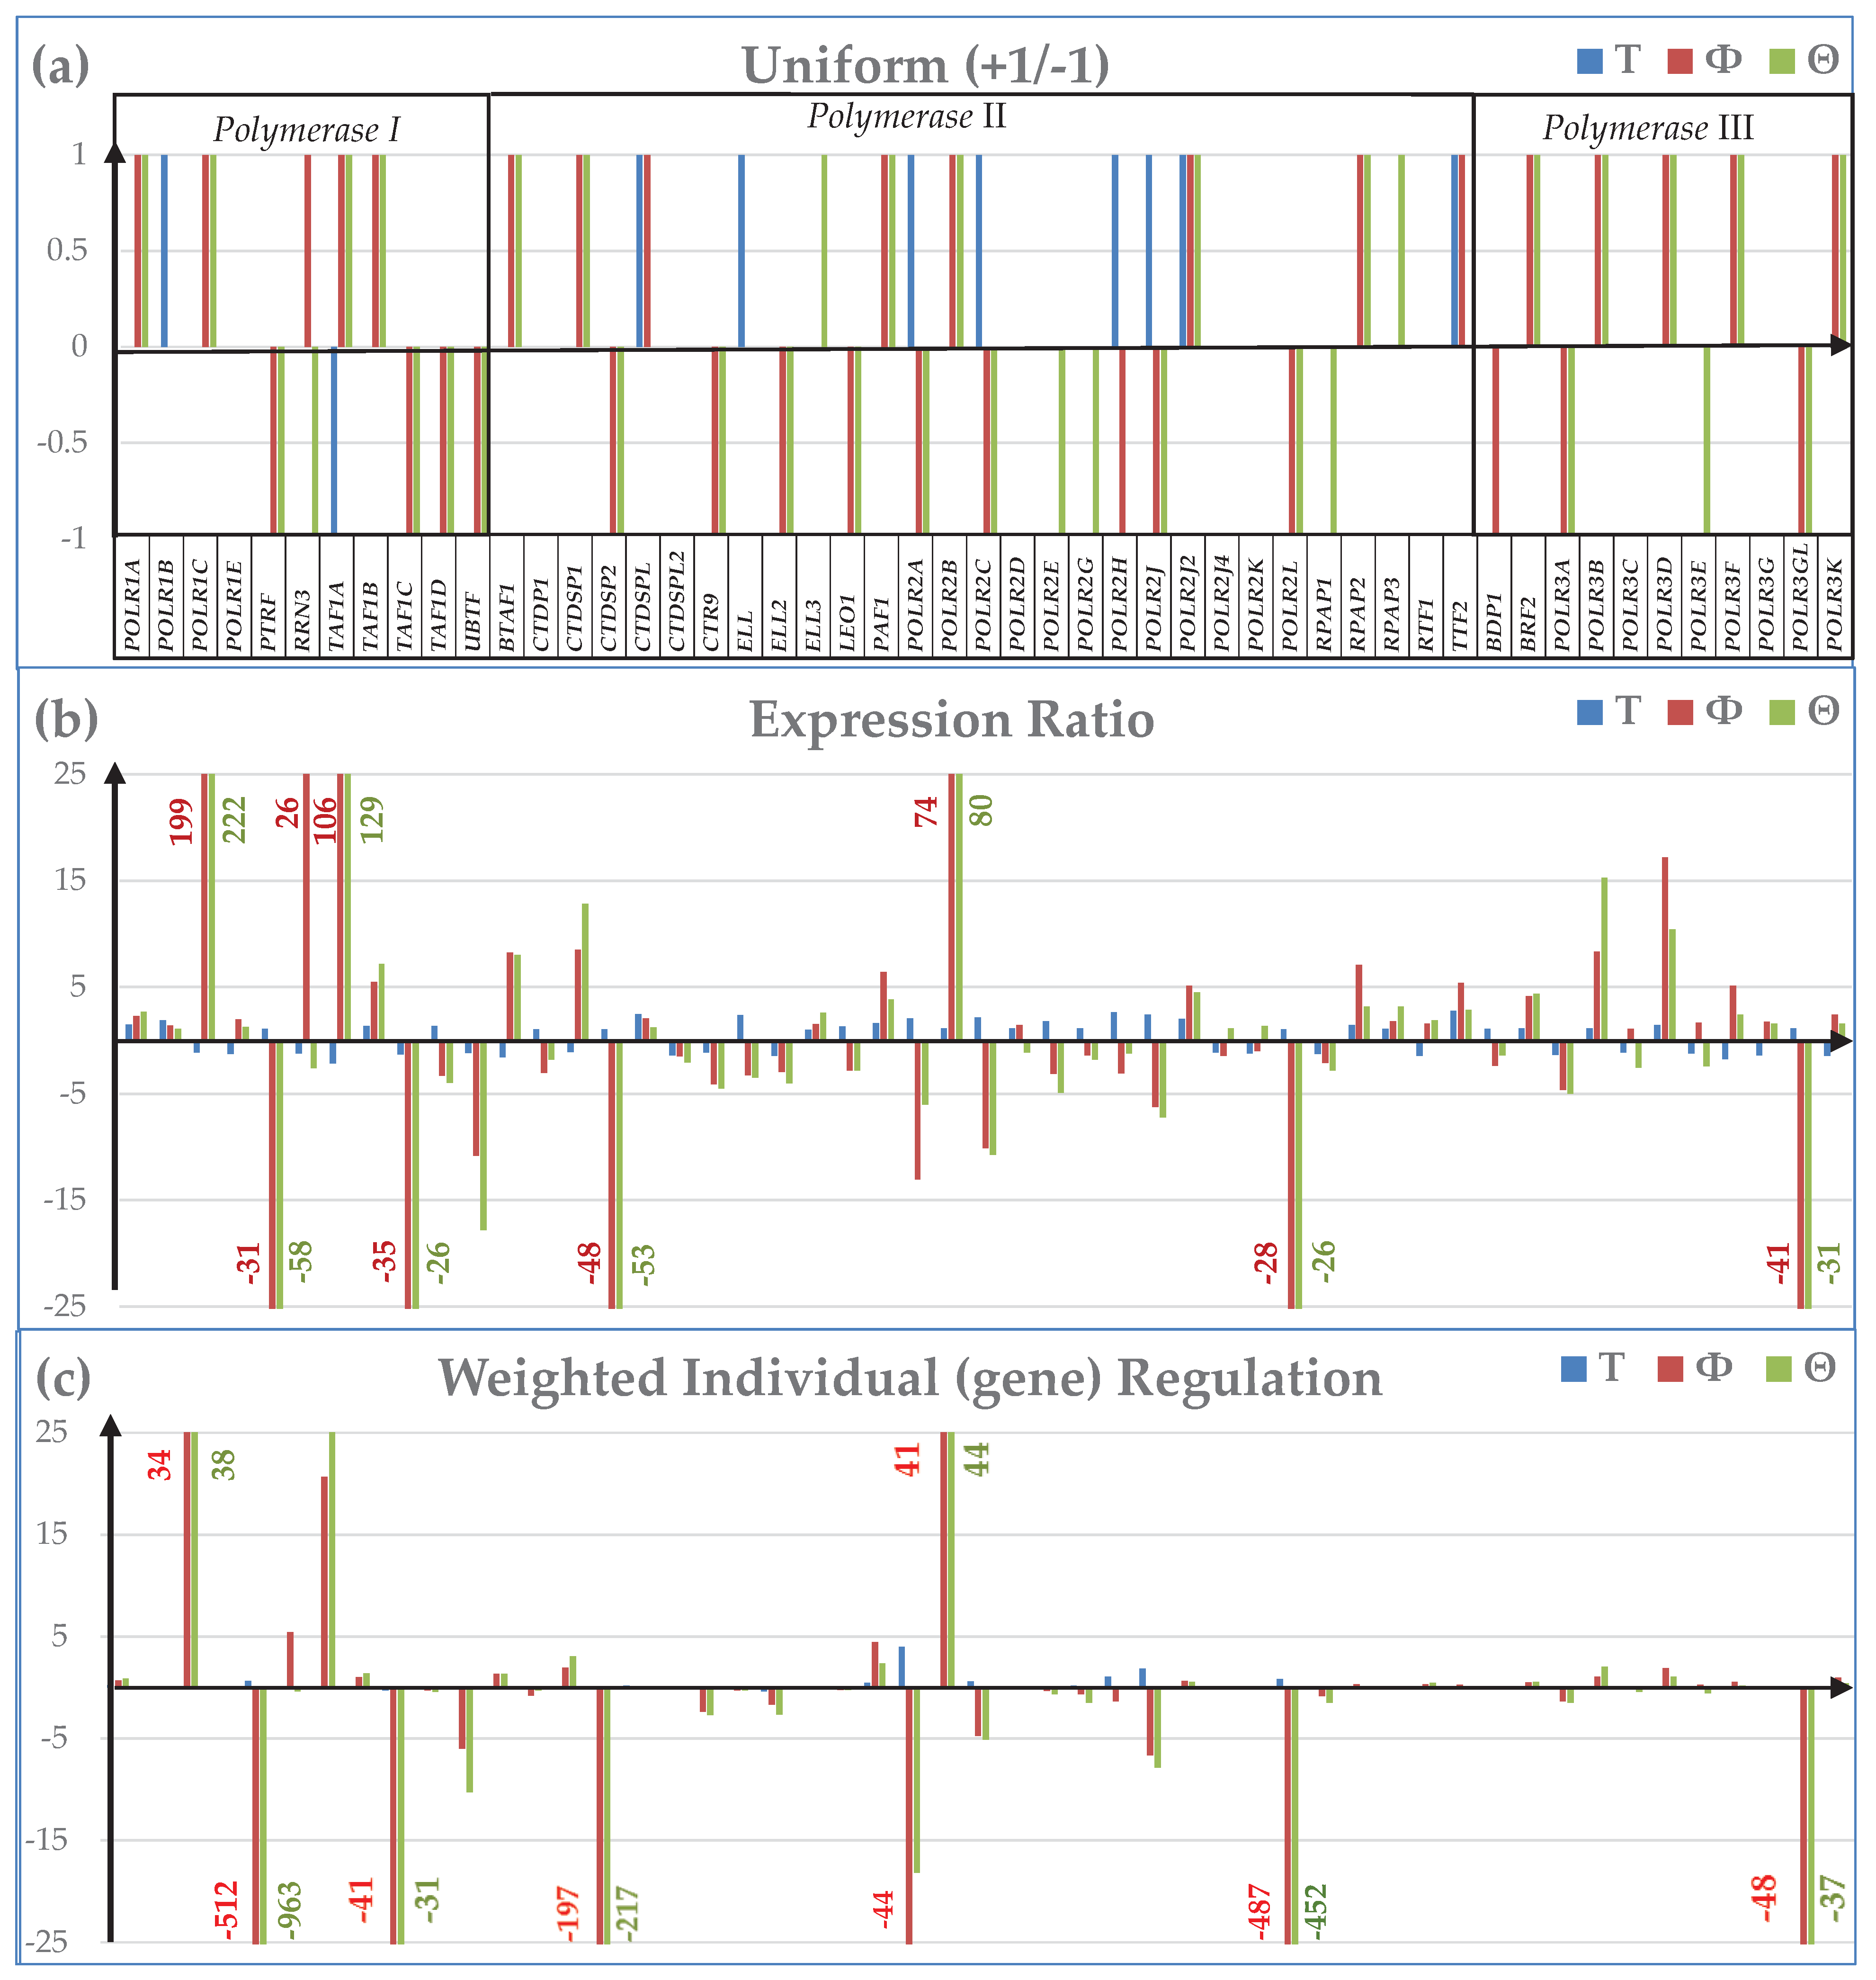
Figure 3.
modified from [58]: Regulation of the genes from the KEGG-constructed pathway Protein Processing in Endoplasmic Reticulum [58] in the surgically removed PTC tumor. BiP = Immunoglobulin Binding protein, SRP = signal recognition particle. Up-regulated genes: BAX (BCL2-associated X protein), BCAP31 (B-cell receptor-associated protein 31), DERL1 (derlin 1), DNAJA1 (DnaJ heat shock protein family (Hsp40) member A1), EDEM1 (ER degradation enhancing alpha-mannosidase like protein 1), FBXO2 (F-box protein 2), HSP90AA1 (heat shock protein 90 alpha family class A member 1), HSPH1 (heat shock protein family H (Hsp110) member 1), MAP2K7 (mitogen-activated protein kinase kinase 7), P4HB (prolyl 4-hydroxylase subunit beta), RAD23B (RAD23 homolog B, nucleotide excision repair protein), SSR3 (signal sequence receptor subunit 3), TUSC3 (tumor suppressor candidate 3), UBE2D1/2 (ubiquitin conjugating enzyme E2 D1/D2), UBXN1 (UBX domain protein 1), YOD1 (YOD1 deubiquitinase). Down-regulated genes: BAG2 (BCL2-associated athanogene 2), BCL2 (B-cell CLL/lymphoma 2), CALR (calreticulin), CRYAB, HERPUD1 (homocysteine inducible ER protein with ubiquitin like domain 1), HSPA1A (heat shock protein family A (Hsp70) member 1A), HYOU1 (hypoxia up-regulated 1), MAN1A1/C1 (mannosidase alpha class 1A/1C member 1), WFS1 (wolframin ER transmembrane glycoprotein), XBP1 (X-box binding protein 1).
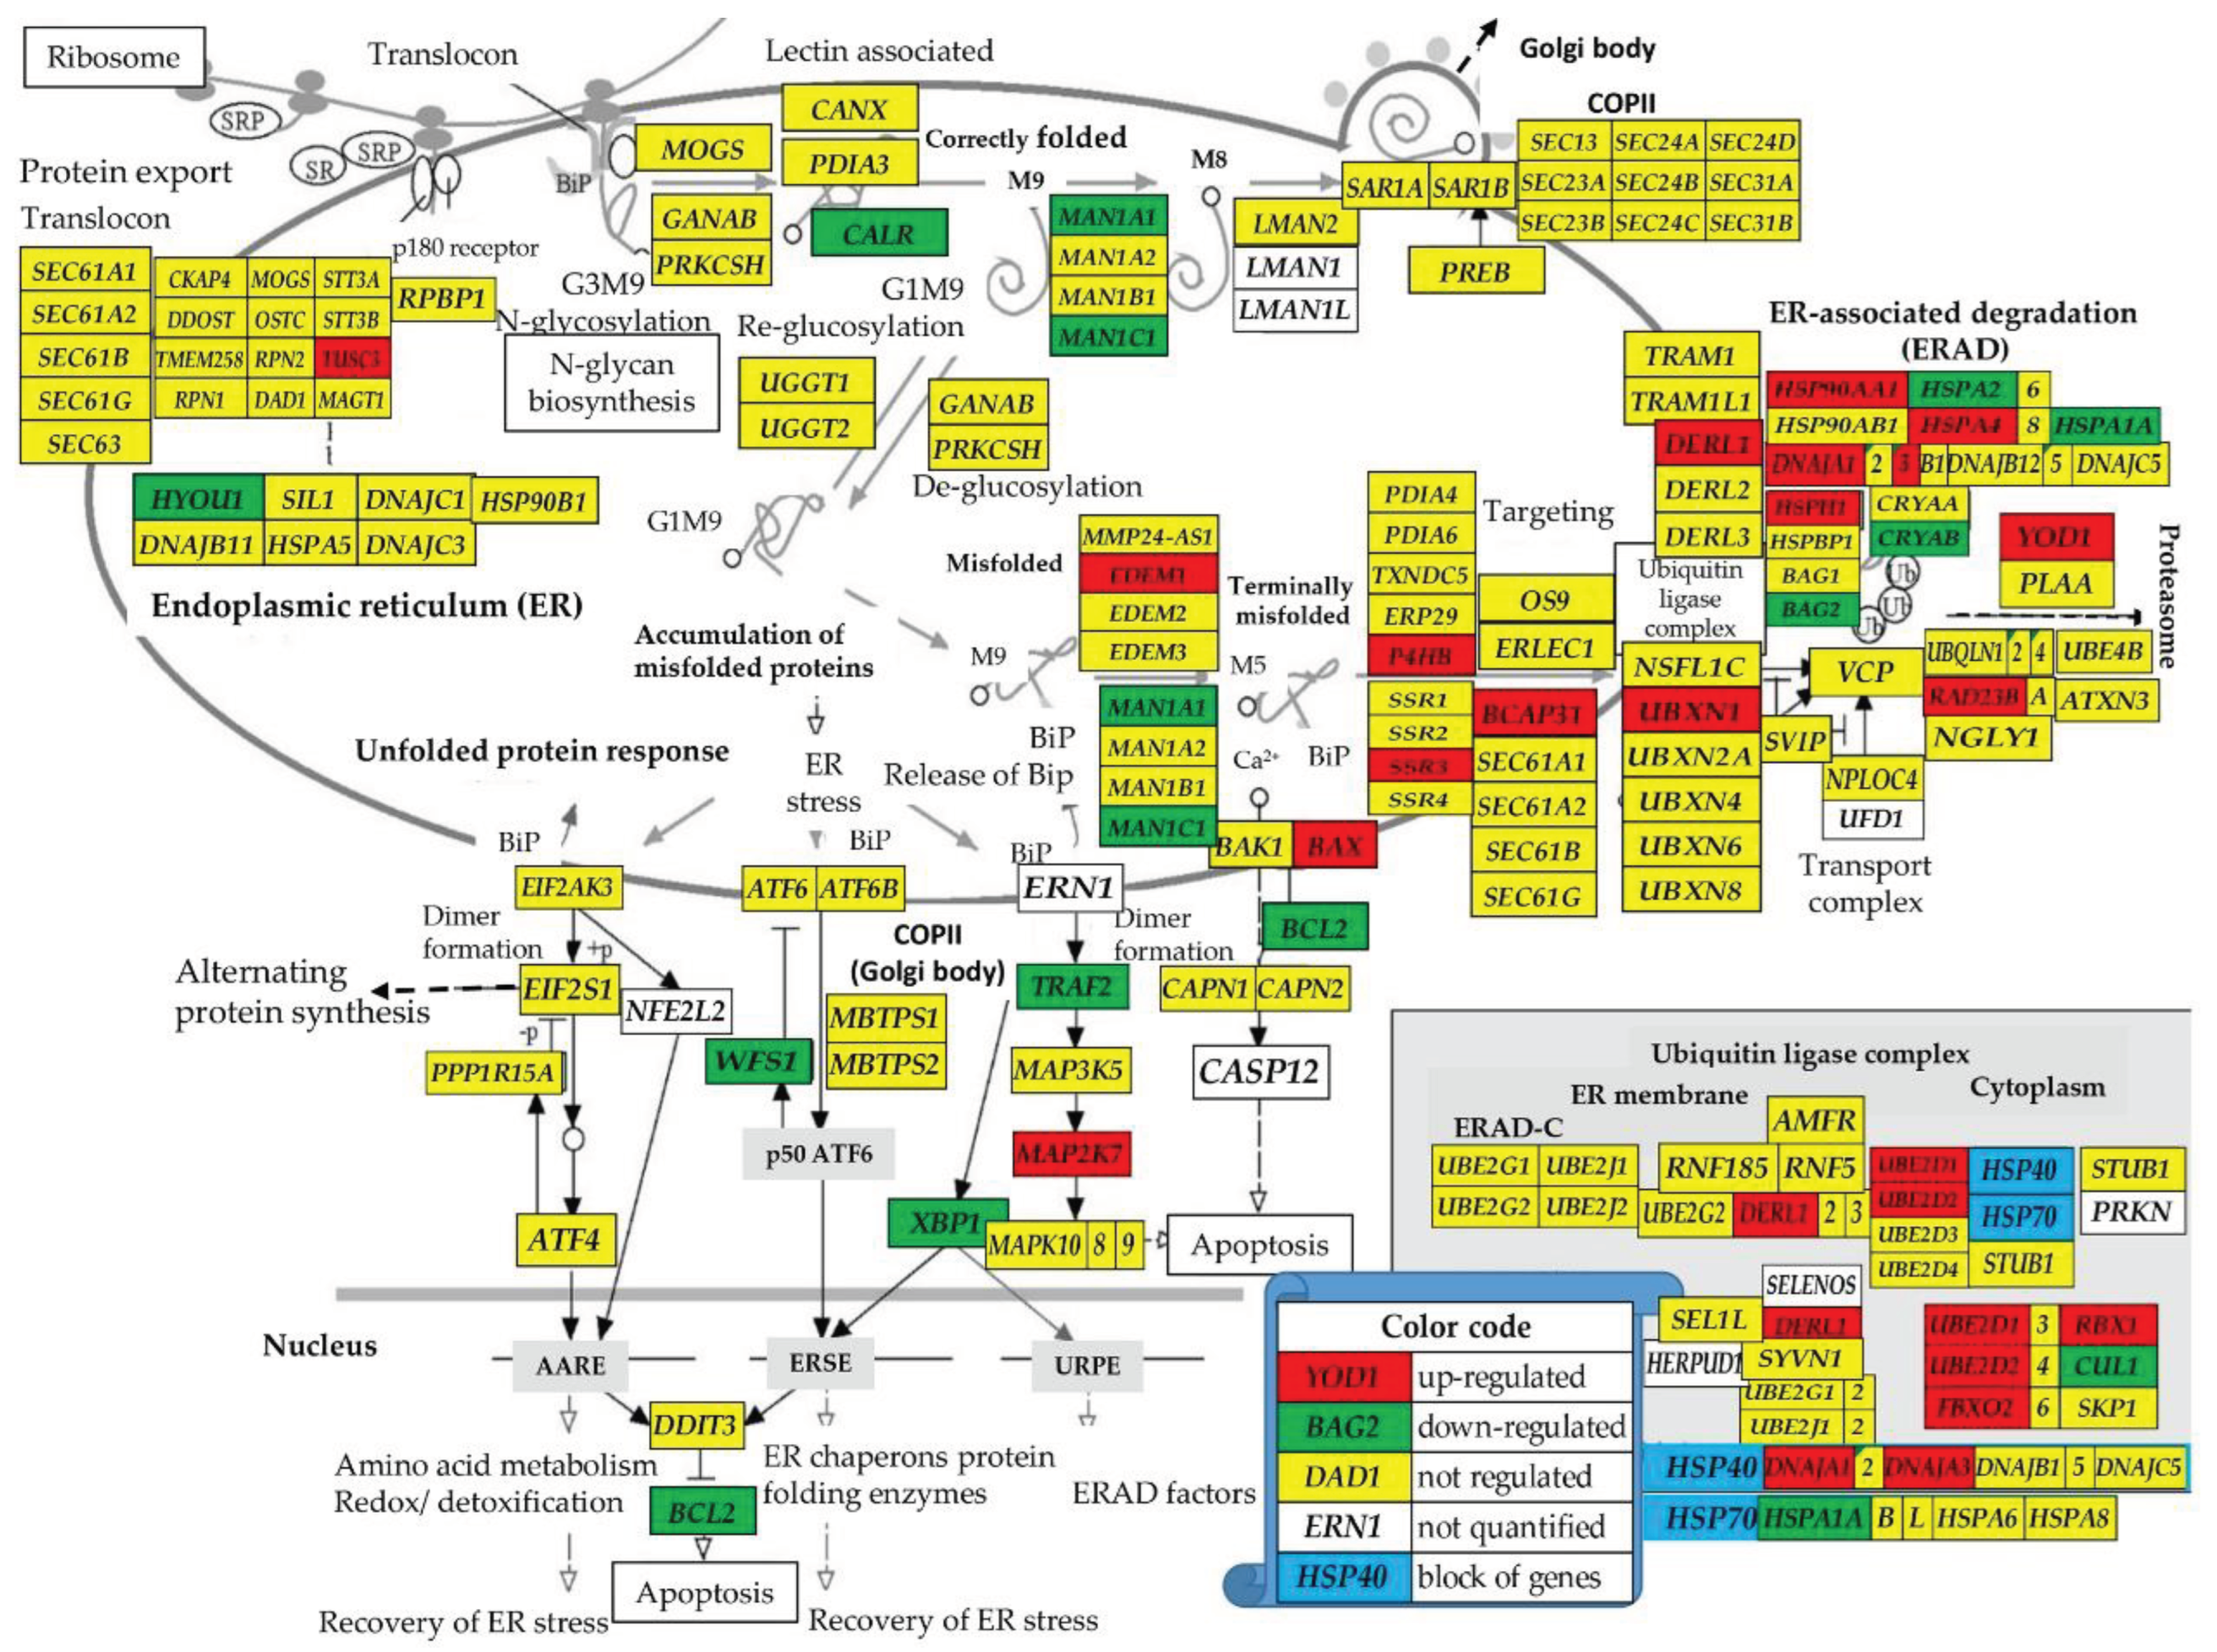
Figure 4.
presents the localization of the regulated genes responsible for the cancer cells survival and proliferation within the KEGG-constructed cancer functional pathways.
Figure 4.
presents the localization of the regulated genes responsible for the cancer cells survival and proliferation within the KEGG-constructed cancer functional pathways.
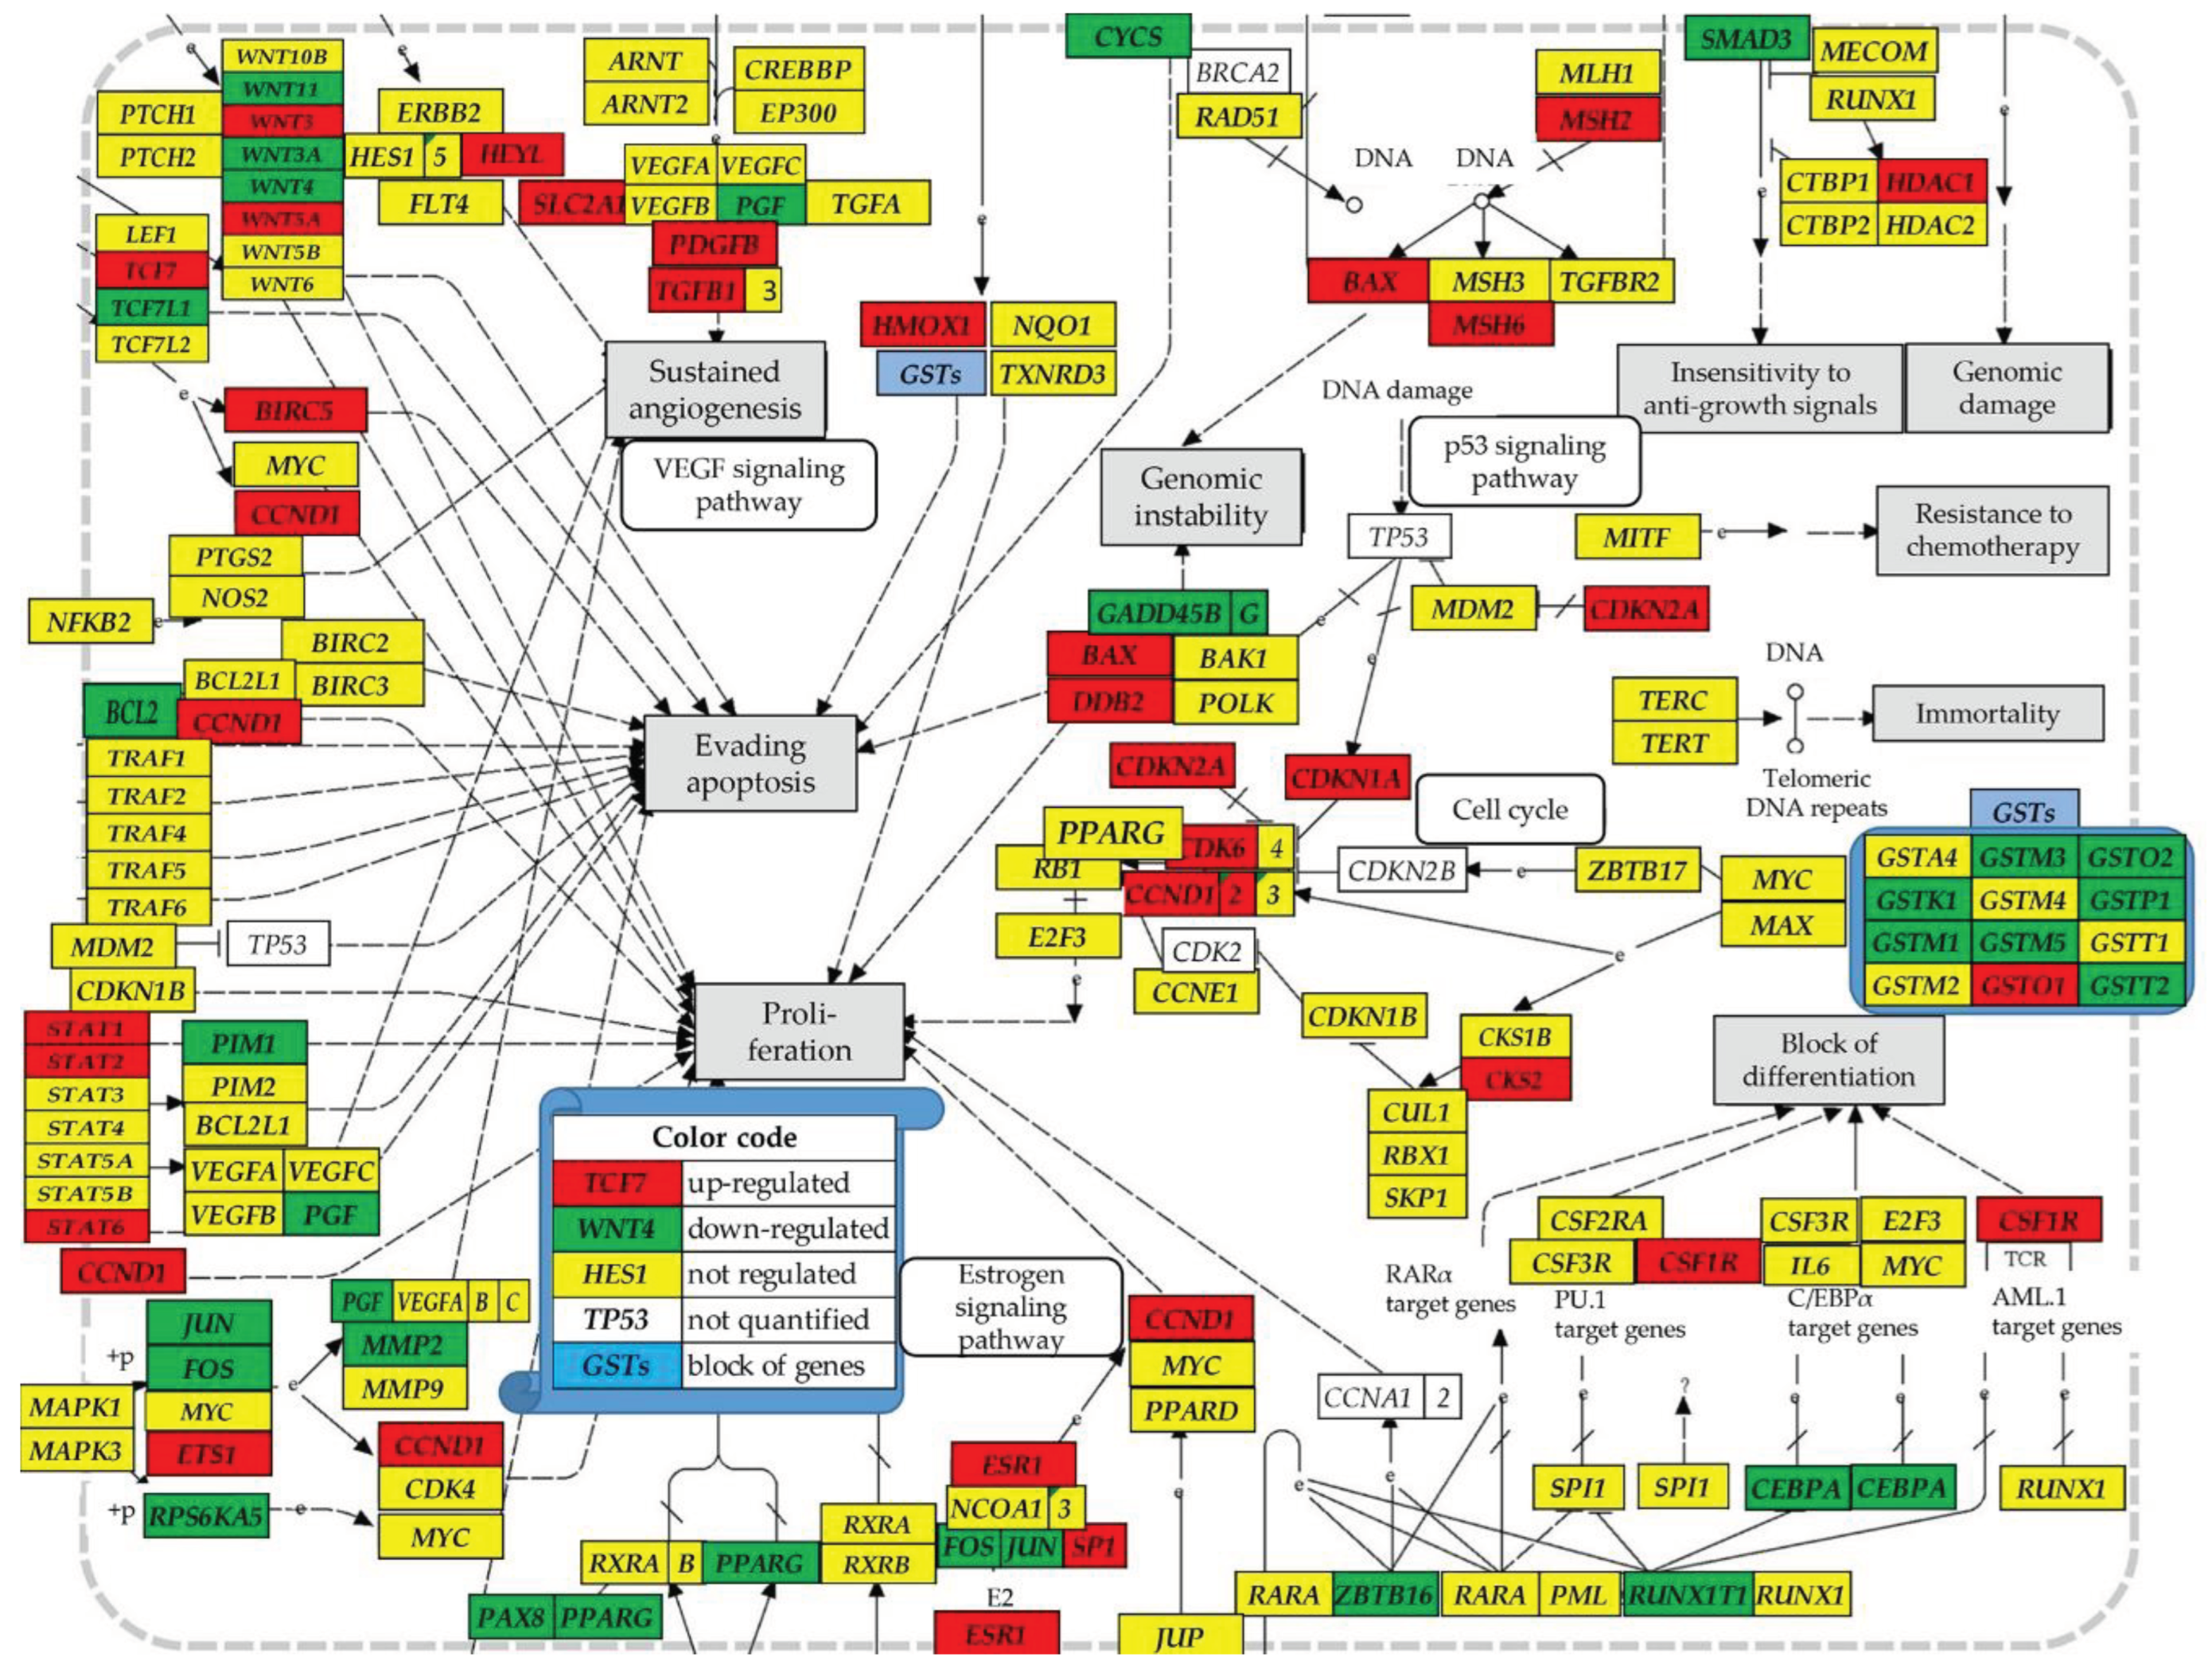
Figure 5.
Novel measures of transcriptomic alteration of 51 RNA polymerase II genes and their binding partners with respect to the normal thyroid tissue in the surgically removed PTC tumor (T), PTC cell line BCPAP (Φ) and APC cell line 8505C (Θ). (a) Regulation of the Relative Expression Control; (b) Regulation of the Coordination Degree; (c) Transcriptomic Distance.
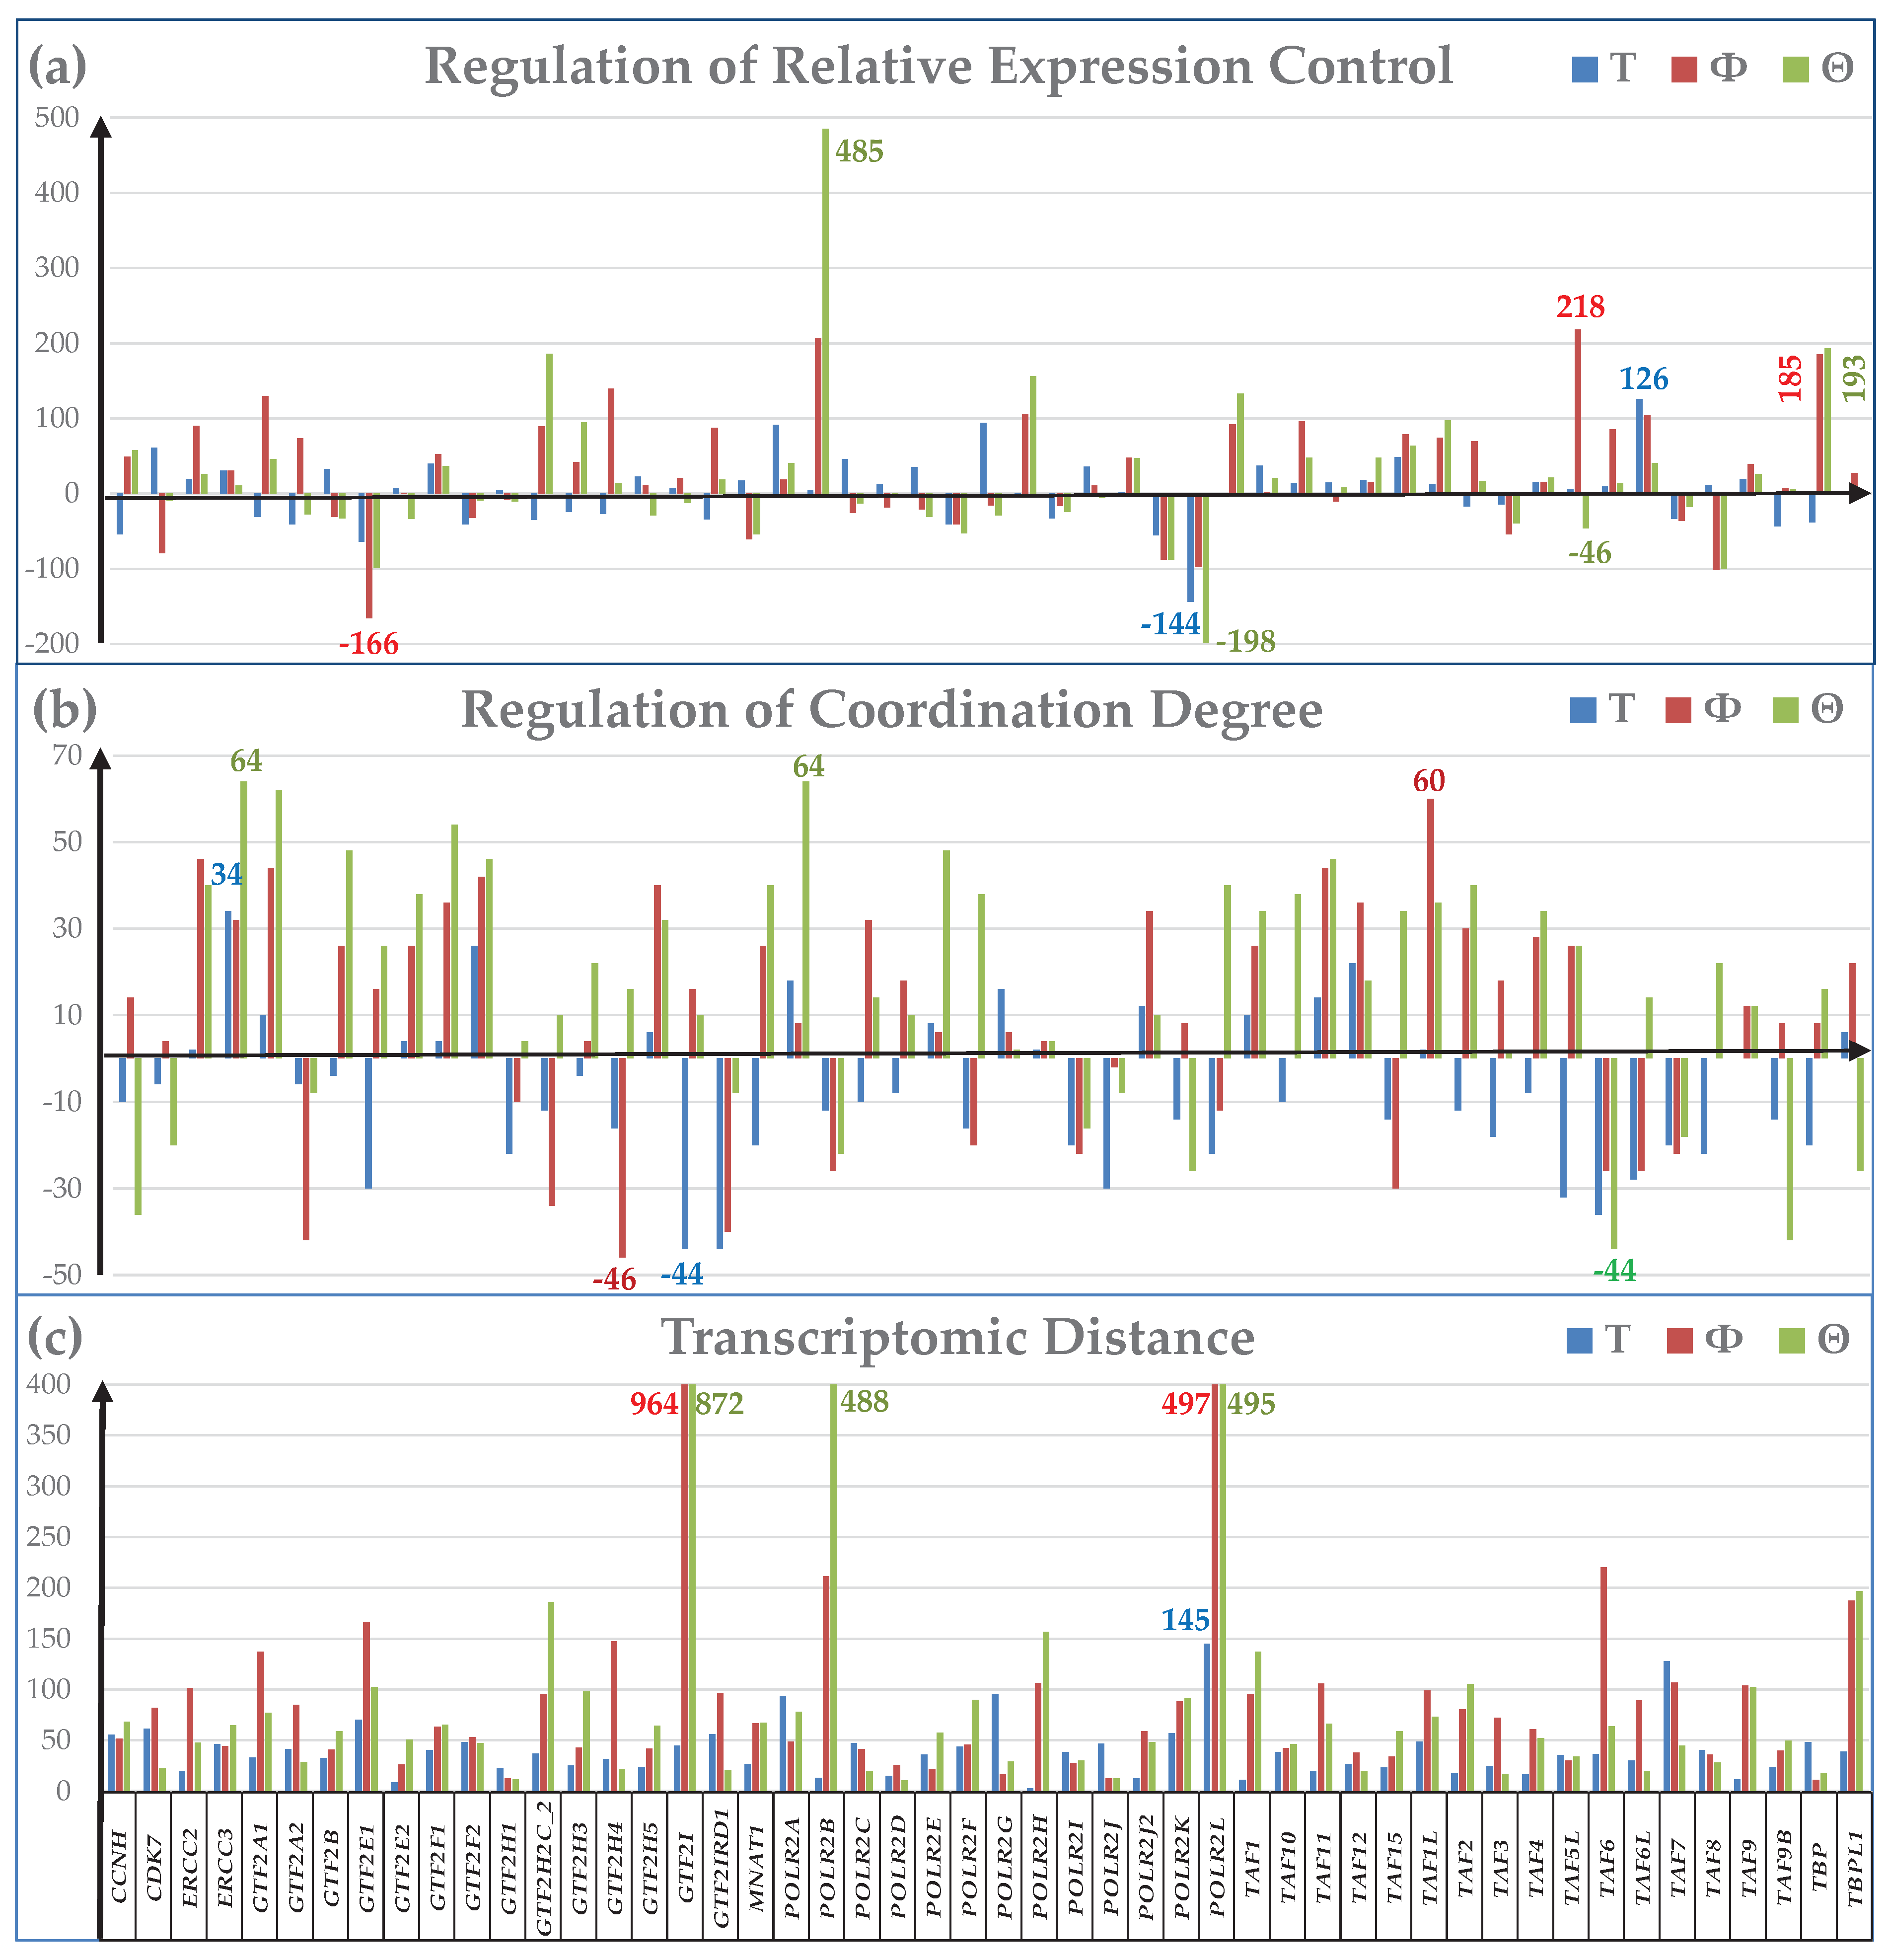
Figure 6.
Statistically (p < 0.05) significant transcriptomic network of the KEGG-constructed DNA Replication Pathway in the: (a)normal thyroid tissue, (b) papillary thyroid cancer tissue, (c) papillary thyroid cancer cell line BCPAP, and (d) anaplastic thyroid cancer cell line 8505C. Continuous red lines indicate significant expression synergism (e.g. RFC1 – RPA1 in (a)). Continuous blue lines (e. RPA1 – POLE4 in (c)) indicates significant expression antagonism. Dashed black lines (e.g. RPA2 – RFC4 in (b)) indicate significant independence of the two genes. Missing line means that the expression correlation was not (p < 0.05) statistically significant. Red/green/yellow background of the gene symbols indicates whether that gene was significantly up-/down-/not regulated. DPE = DNA polymerase ε complex; RPA = Replication proteins A; Helicase = MCM complex; DPA = DNA polymerase α-primase complex; DPD = DNA polymerase δ complex, Final = the end stage (RNaseHI – RNaseHII – Fen1 – DNA ligase).
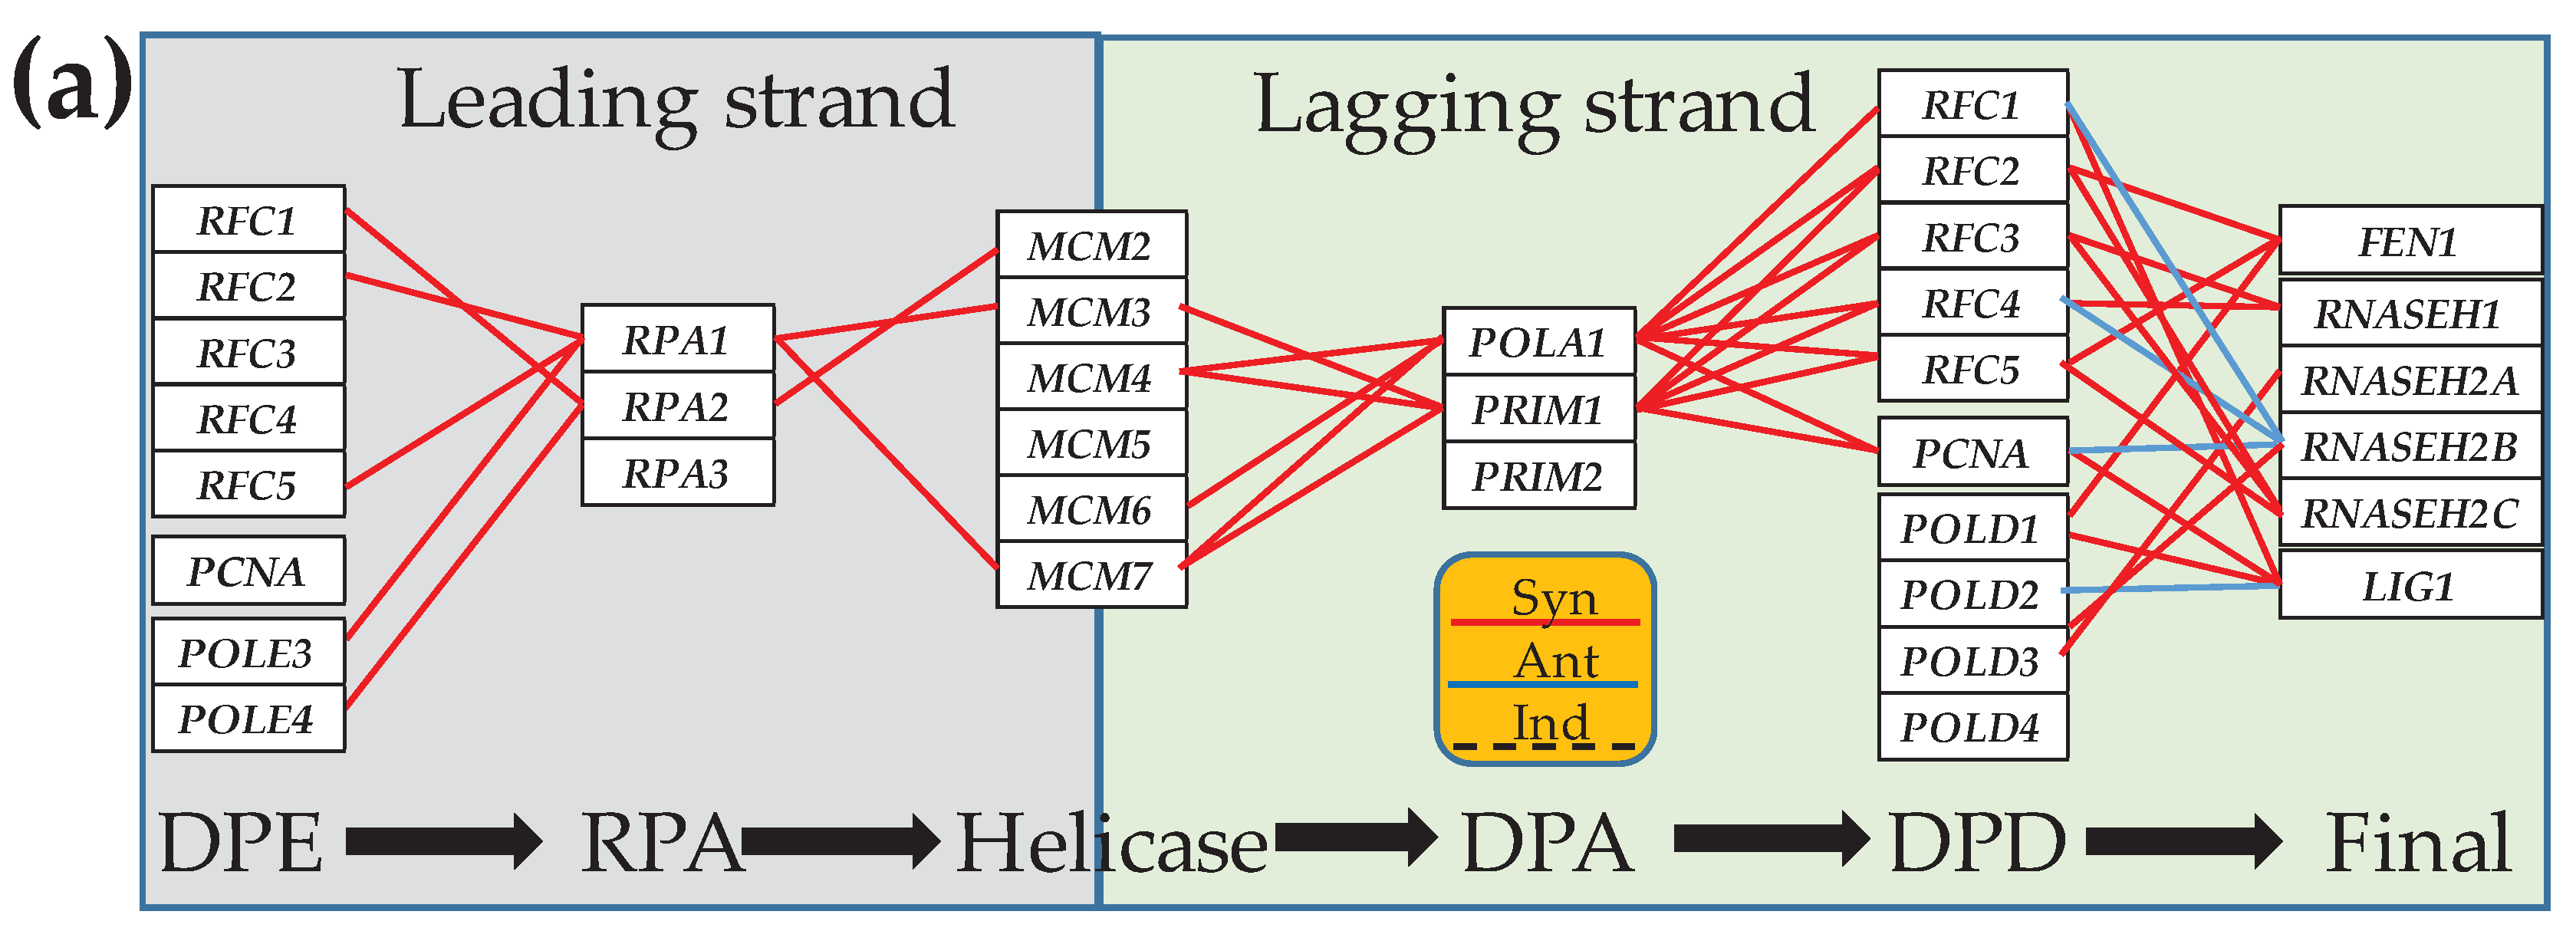
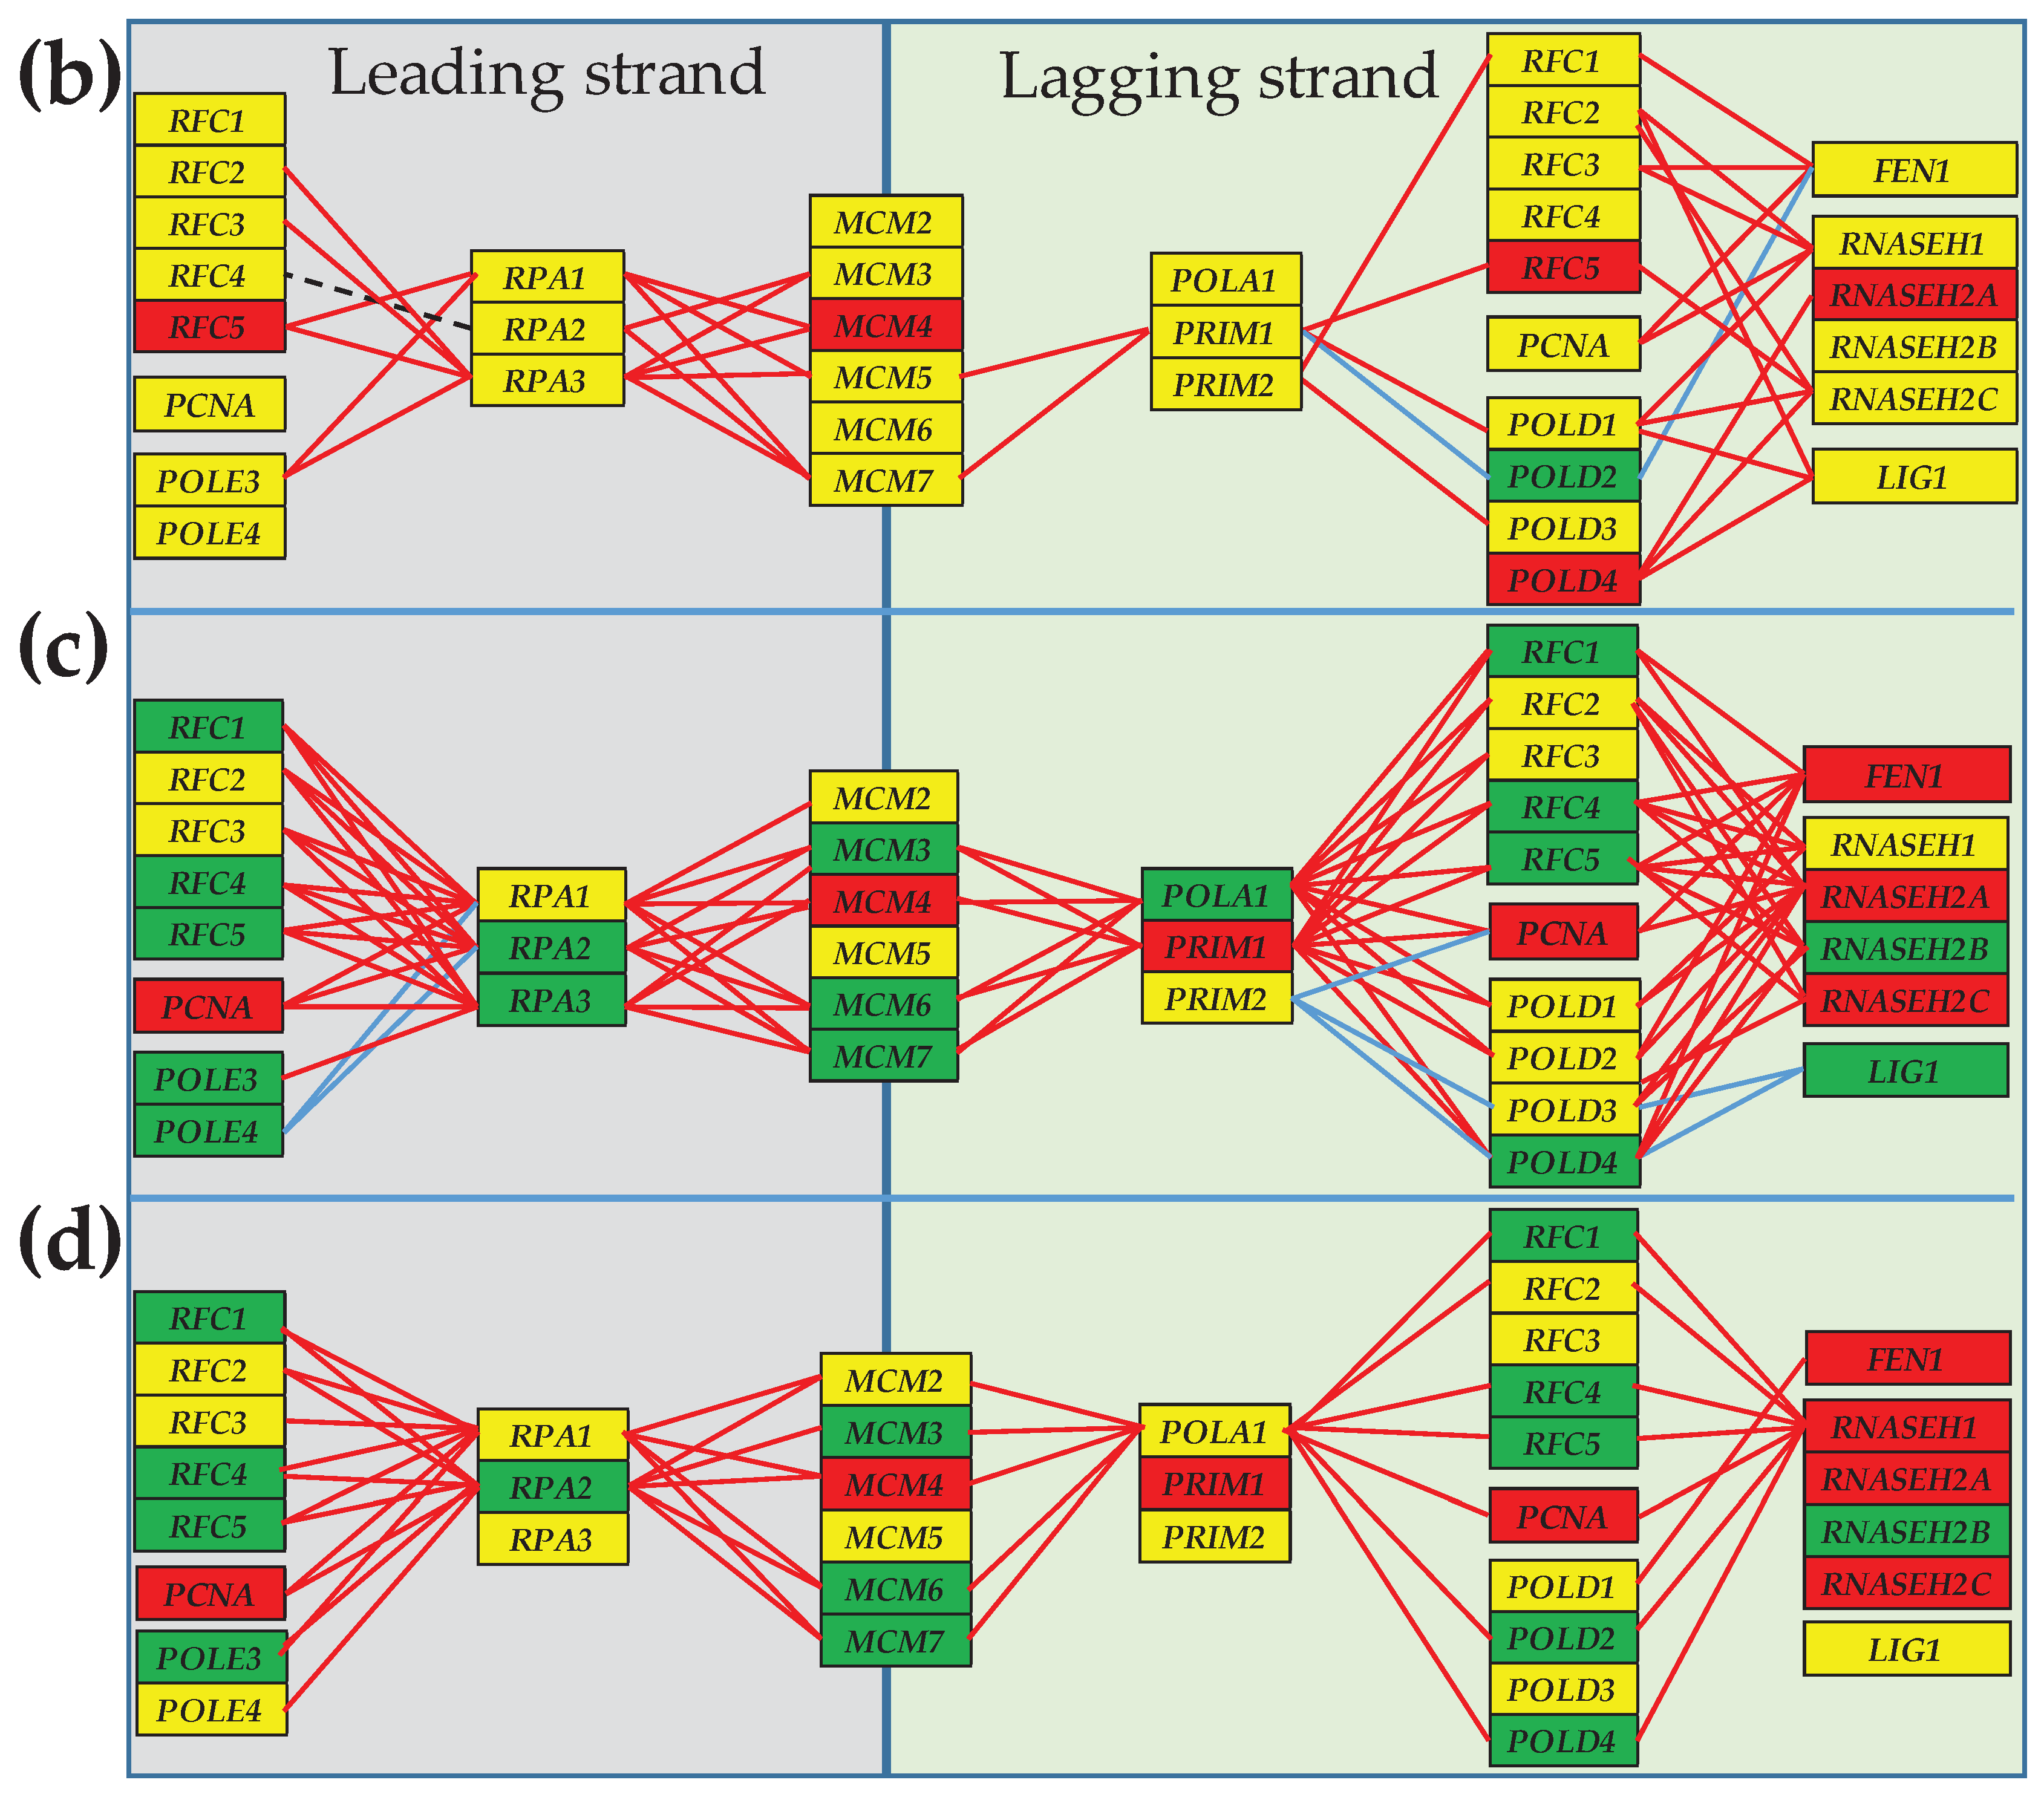
Figure 7.
Statistically (p < 0.05) significant synergism and antagonism of the expressions of the polymerase II genes with their direct binding partners in the normal thyroid tissue (a), papillary thyroid cancer tissue (b), papillary thyroid cancer cell line BCPAP (c) and anaplastic thyroid cancer cell line 8505C (d). Note the differences in the significant coupling and the regulation of the composing genes among the four conditions.
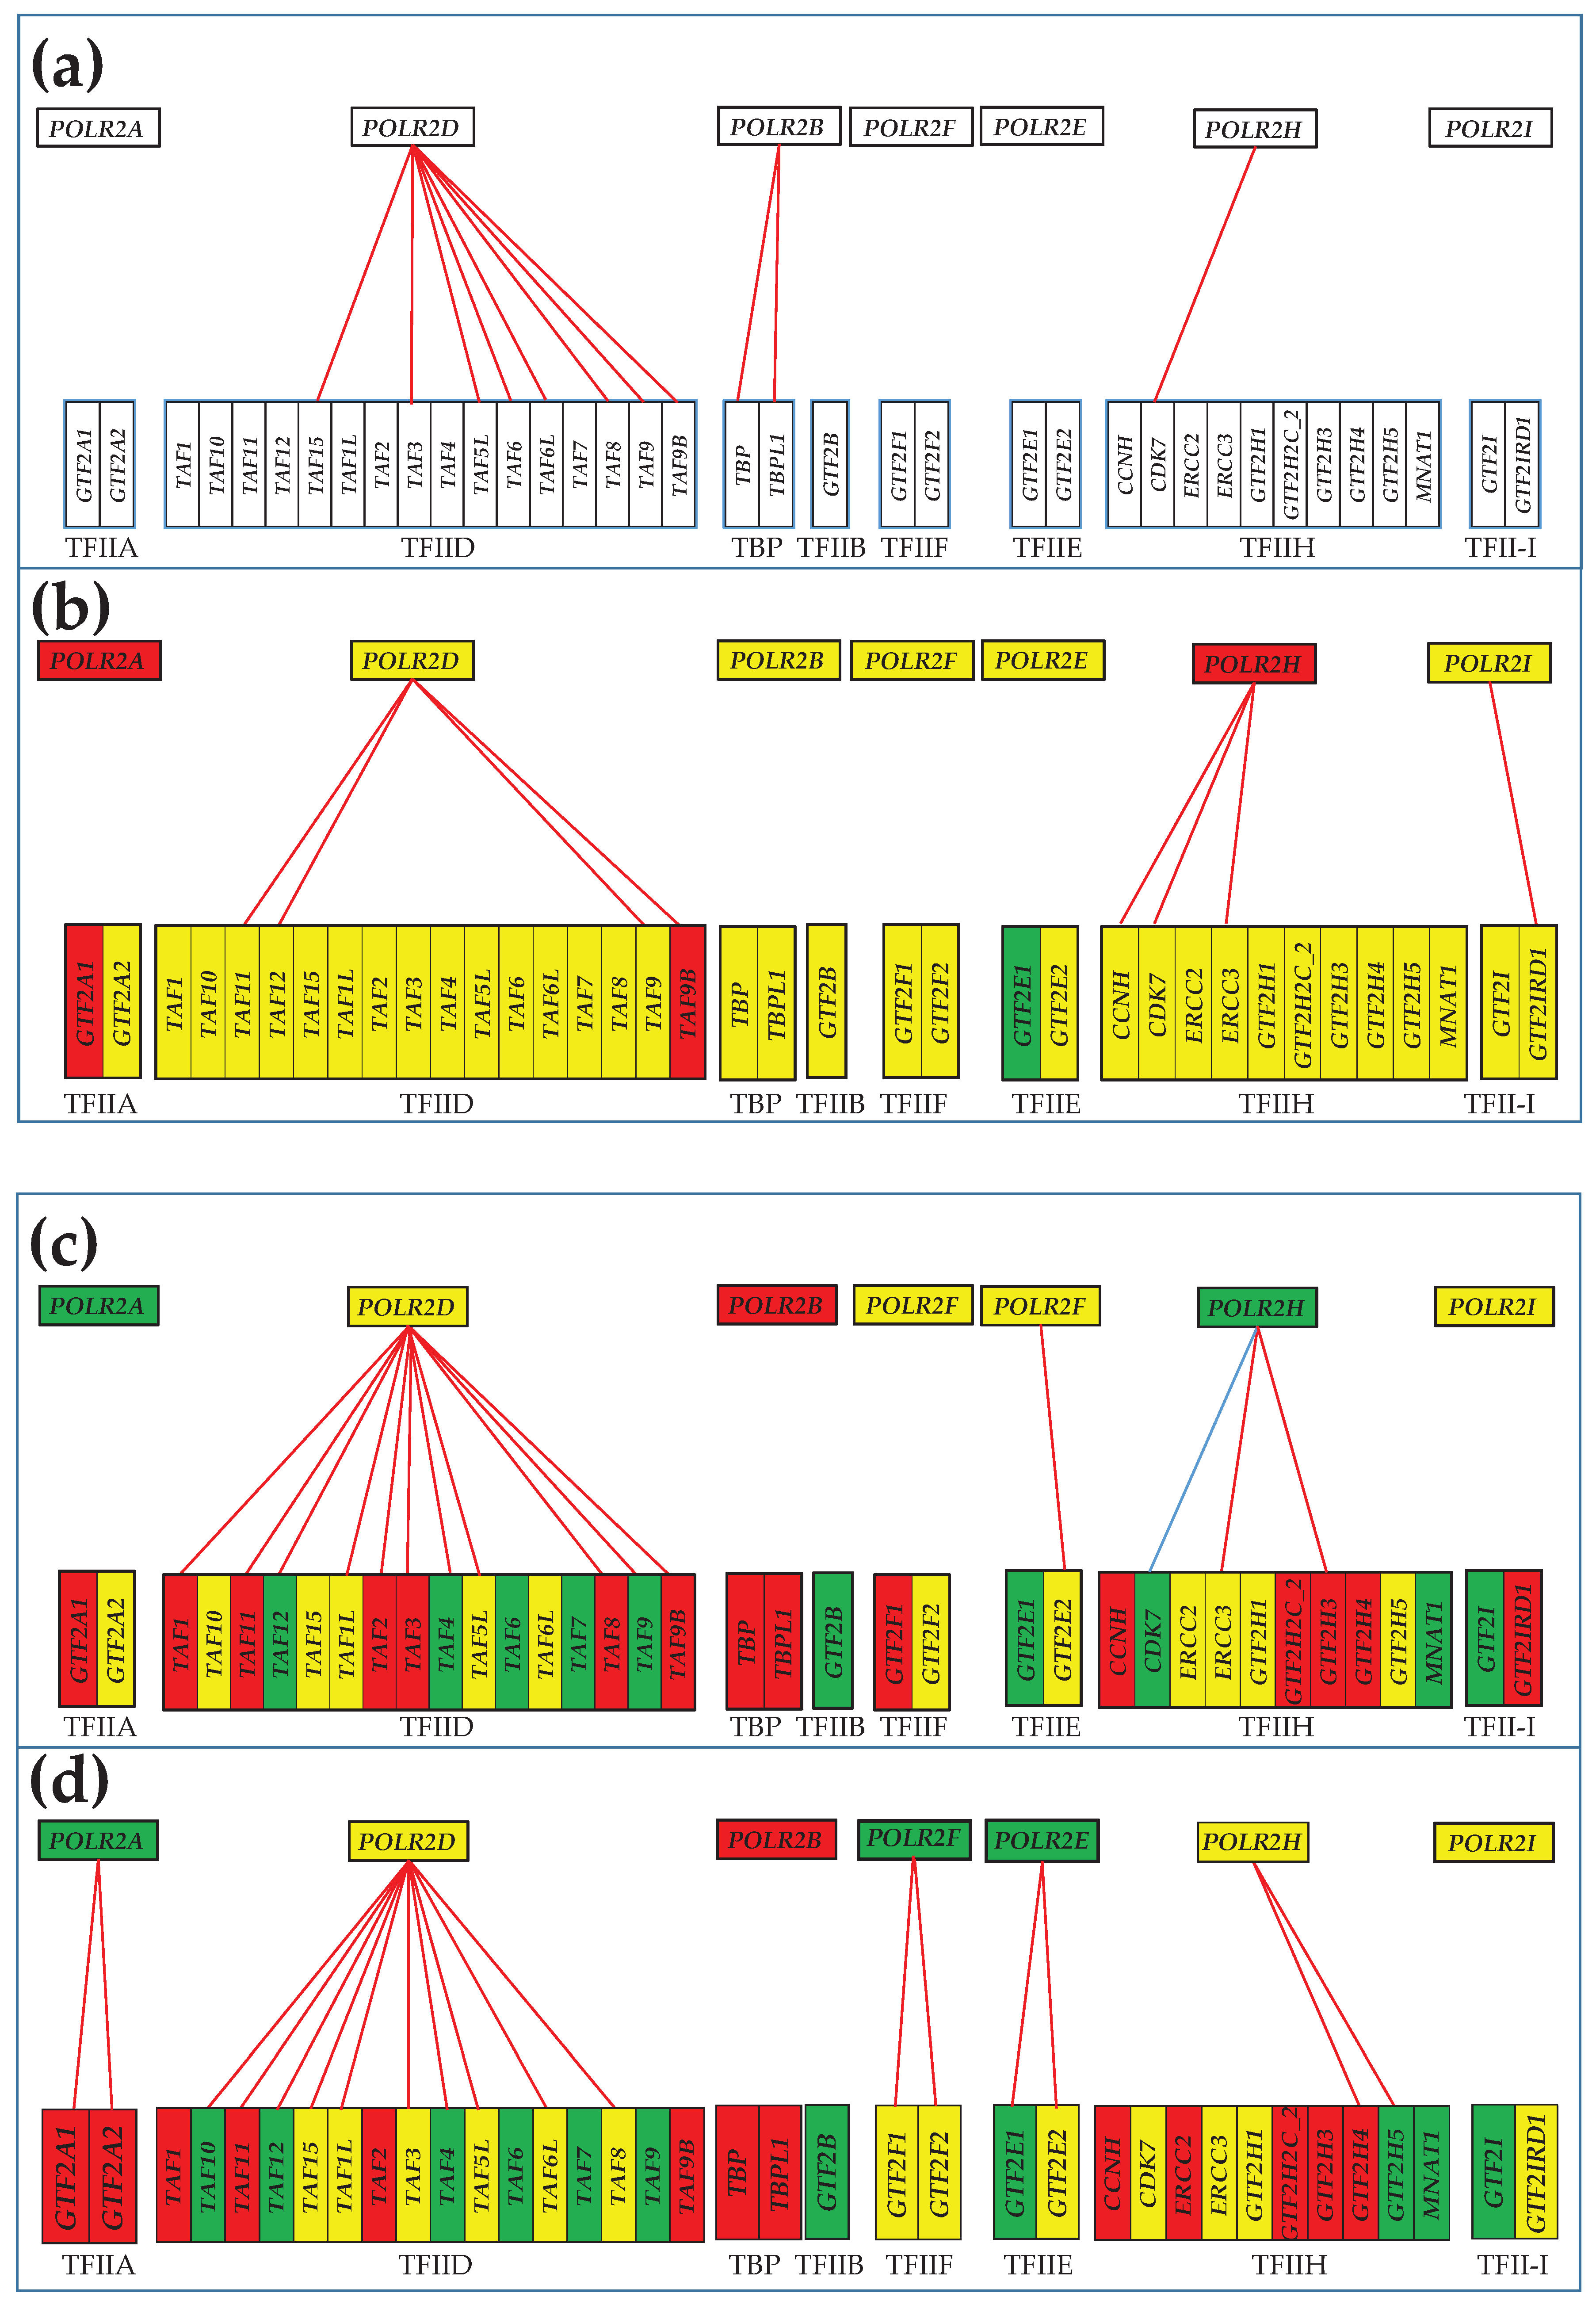

Table 1.
Statistically significantly up- and down-regulated genes from the KEGG-constructed functional pathways responsible for Transcription and Translation in the cancer nodule of the surgically removed thyroid tumor. Symbols of up-regulated genes in bold letters.
Table 1.
Statistically significantly up- and down-regulated genes from the KEGG-constructed functional pathways responsible for Transcription and Translation in the cancer nodule of the surgically removed thyroid tumor. Symbols of up-regulated genes in bold letters.
| TRANSCRIPTION | |
|---|---|
| RNA polymerase | POLR1B, POLR2A, POLR2C, POLR2H, POLR2J, POLR2J2 |
| Basal transcription factors |
GTF2A1, TAF9B, GTF2E1 |
| Splicesome |
CDC40, EFTUD2, HNRNPA1, HNRNPC, LSM5, PHF5A, RBM8A, RBMX, SNRNP70, SNRPD1, SNRPG BCAS2, HSPA1A, LSM6, PPIL1, PRPF40A, RNU2-1, RNVU1-18, SRSF6 |
| TRANSLATION | |
| Ribosome |
MRPL14, MRPL21, MRPS6, RPL14, RPL28, RPL30, RPLP1 RPL10A, RPL17, RPL18A, RPL21, RPL23, RPL26, RPL27, RPL31, RPL34, RPL35A, RPL6, RPS10, RPS12, RPS14, RPS16, RPS20, RPS25, RPS27, RPS3A, RPS5, RPS6, RPS7, RPS8 |
| Aminoacyl-tRNA biosynthesis | IARS2, NARS2 |
| Nucleocytoplasmic transport |
KPNA6, NUP205, NXF1, NXF3, RBM8A, TNPO2 NUP153, NUP93, XPO4 |
| mRNA surveillance pathway |
NXF1, NXF3, PAPOLG, PPP2CA, PPP2R2D, PPP2R3B, RBM8A, SMG6 PELO, PPP2R2B |
| Ribosome biogenesis in eukaryotes |
DROSHA, FBLL1, HEATR1, NHP2, NXF1, NXF3, POP4, RCL1, RPP40 FBL, SNORD3B-1 |
Table 2.
Significantly up-regulated (bold) and down-regulated genes from the KEGG-constructed functional pathways responsible for Folding, Sorting and Degradation, Replication and Repair, and Chromosome in the cancer nodule of the surgically removed thyroid tumor.
Table 2.
Significantly up-regulated (bold) and down-regulated genes from the KEGG-constructed functional pathways responsible for Folding, Sorting and Degradation, Replication and Repair, and Chromosome in the cancer nodule of the surgically removed thyroid tumor.
| FOLDING, SORTING AND DEGRADATION | |
|---|---|
| Protein export | SRP9 |
| Protein processing in endoplasmic reticulum |
BAX, BCAP31, DERL1, DNAJA1, EDEM1, FBXO2, HSP90AA1, HSPH1, MAP2K7, P4HB, RAD23B, SSR3, TUSC3, UBE2D1, UBE2D2, UBXN1, YOD1 BAG2, BCL2, CALR, CRYAB, HERPUD1, HSPA1A, HYOU1, MAN1A1, MAN1C1, WFS1, XBP1 |
| SNARE interactions in vesicular transport |
STX4, VAMP1, VAMP4, VAMP8 STX11, STX1A, STX2 |
| Ubiquitin mediated proteolysis |
CBL, DDB2, FBXO2, HERC4, KEAP1, MAP3K1, MGRN1, RNF7, UBA1, UBB, UBE2A, UBE2C, UBE2D1, UBE2D2, UBE2H PPIL2 |
| Proteasome | PSMA7, PSMB1, PSMB2, PSMB3, PSMB4, PSMD14, PSMD4, PSMD6, PSME4 |
| RNA degradation |
CNOT10, ENO3, EXOSC1, EXOSC3, LSM5, PFKM LSM6 |
| REPLICATION AND REPAIR | |
| DNA replication |
MCM4, POLD4, RFC5, RNASEH2A POLD2 |
| Base excision repair |
NEIL1, PARP1, PNKP, POLD4, RFC5 POLD2, POLG2 |
| Nucleotide excision repair |
DDB2, POLD4, POLR2A, POLR2C, POLR2H, POLR2J, POLR2J2, RAD23B, RFC5, XPA POLD2 |
| Mismatch repair |
MSH2, MSH6, POLD4, RFC5 POLD2 |
| Homologous recombination |
POLD4, RAD50, XRCC3 POLD2 |
| Non-homologous end-joining | RAD50 |
| Fanconi anemia pathway |
FANCE, FANCI, POLH, RMI2 FAN1 |
| CHROMOSOME | |
| ATP-dependent chromatin remodeling |
ARID1A, BAZ1A, BAZ2A, BCL7A, BCL7B, BCL7C, HDAC1, KAT5, MEAF6, PBRM1, RSF1 S, MARCA4, SMARCD3, SMARCE1, YEATS4 CECR2 ING3 MBD2 |
| Polycomb repressive complex |
AEBP2, CBX2, CBX4, EZH1, HDAC1, PHF19, SCMH1, TEX10, UBE2D1, UBE2D2, YAF2 ASXL3, USP16 |
Disclaimer/Publisher’s Note: The statements, opinions and data contained in all publications are solely those of the individual author(s) and contributor(s) and not of MDPI and/or the editor(s). MDPI and/or the editor(s) disclaim responsibility for any injury to people or property resulting from any ideas, methods, instructions or products referred to in the content. |
© 2024 by the authors. Licensee MDPI, Basel, Switzerland. This article is an open access article distributed under the terms and conditions of the Creative Commons Attribution (CC BY) license (http://creativecommons.org/licenses/by/4.0/).
Copyright: This open access article is published under a Creative Commons CC BY 4.0 license, which permit the free download, distribution, and reuse, provided that the author and preprint are cited in any reuse.


