
Submitted:
09 October 2025
Posted:
09 October 2025
You are already at the latest version
Abstract
Papillary thyroid carcinoma (PTC) is the most common endocrine malignancy, yet the transcriptional hierarchies linking endocrine signaling to tumor progression remain poorly defined. Here, we integrated gene-expression profiles from two independent cohorts (TCGA-THCA and GSE33630) to identify consensus transcriptional master regulators (TMRs) driving PTC. After normalization and differential expression analysis, we reconstructed regulon networks with ARACNe-AP, inferred TMR activity using VIPER, and integrated evidence across datasets via Fisher’s meta-analysis. This cross-cohort strategy yielded 50 shared TMRs, predominantly from the Zinc Finger, Forkhead, ETS, and nuclear receptor families. Network topology highlighted PBX4, GATAD2A, BHLHE40, HEY2, and TEAD4 as upstream regulators controlling other TMRs. Functional enrichment revealed activation of NOTCH, MAPK, PI3K, and TGF-β signaling and enrichment of early and late estrogen-response programs, uncovering a noncanonical role of SMAD9 in TGF-β signaling. Together, these findings delineate the transcriptional and hormonal circuitry underlying thyroid tumorigenesis, providing a regulatory framework for biomarker-driven therapies based on network activity states.
Keywords:
papillary thyroid carcinoma
; transcriptional master regulators
; gene regulatory networks
; molecular endocrinology
; estrogen signaling
; TGF-β signaling
; meta-analysis
1. Introduction
Thyroid cancer is the most common type of endocrine cancer, making up about 1.0–1.5% of all new cancer diagnoses each year. Its prevalence has steadily increased worldwide, except in Africa, where detection may be limited.[1] At the molecular level, cancer develops due to genetic dysregulation, causing changes in gene expression.[2,3] As high-throughput technologies evolve rapidly, it becomes crucial to analyze and use methods that enable efficient exploration and utilization of genomic data. In this context, systems biology supports integrating diverse information, allowing a comprehensive understanding of the disease on a global scale.
At the molecular level, the progression of thyroid cancer is driven by genetic dysregulation. Some transcription factors (TFs) are described as transcriptional master regulators (TMRs), which control networks of target genes that determine cell differentiation, regulate signaling pathways, modulate hormonal responses, and influence tumor invasiveness, positioning themselves at the top of a regulatory hierarchy.[4]
In this context, Gene Regulatory Network (GRN) inference enables the identification of key TMR-target genes in the development of this disease. GRNs are obtained using computational algorithms that identify the regulatory actions of TFs on all genes in the expression profile, defining the regulon (the set of genes regulated by a TMR) for each TF. This process is known as deconvolution.[5] In this study, we employed network deconvoolution using Mutual Information, which measures dependencies between two variables and was developed based on Shannon’s information theory.[6,7] This type of network infers links between pairs of nodes based on the information they share.[8,9]
In papillary thyroid carcinoma (PTC), there is still a lack of an integrated framework to robustly identify TMRs and regulon networks that control the molecular programs of the disease. Specifically, the hierarchical organization of these regulators and the collective biological functions they influence have not been clearly defined, which limits understanding of tumor progression and reduces the potential to use them as prognostic biomarkers or therapeutic targets[3,4,10] . Our study uses a transcriptomic meta-analysis combining independent cohorts to infer regulatory networks, identify key transcriptional master regulators, and examine their effects on important processes like differentiation, signaling, and tumor plasticity in thyroid cancer.
We primarily focused on identifying transcriptional master regulators (TMRs) and their influence on genes that control the Hallmarks of Cancer. These hallmarks include ten biological traits seen during tumor development.[3,11,12] We identified TMRs that are key in papillary thyroid cancer, including TEAD4. These TMRs not only govern essential transcriptional programs but are also linked to signaling pathways such as NOTCH, MAPK, PI3K/AKT, and estrogen response pathways, as well as processes like epithelial-to-mesenchymal transition and tumor plasticity.
Characterizing these networks and regulatory nodes improves our understanding of thyroid cancer biology, providing potential prognostic biomarkers and therapeutic targets. Zinc-finger enrichment among TMRs. Grouping the 50 TMRs by transcription factor family revealed an overrepresentation of zinc-finger proteins—including ZNF, ZBTB, ZKSCAN, ZFP, and CCCH-type (ZC3H) subfamilies—with eight significant members in our set (ZBTB2, ZBTB25, ZBTB5, ZKSCAN3, ZKSCAN5, ZFP62, ZNF548, ZC3H8). This superfamily is one of the largest in the cell and participates in various cellular processes such as development, differentiation, metabolism, and autophagy; its proteins can interact with DNA, RNA, poly(ADP-ribose), and other proteins.[13] Although zinc-finger factors have been implicated in multiple cancers and several members act as oncogenes[14] , their specific roles in thyroid cancer progression are still not fully understood. Notably, ZBTB2 overexpression can promote proliferation, migration, and invasion.[15] The observed enrichment of zinc-finger TMRs here suggests a potential regulatory hub relevant to papillary thyroid carcinoma progression.
2. Results and Discussion
2.1. Meta-Analysis of Master Regulators
The meta-analysis combining VIPER-based MRA from TCGA-THCA and GSE33630 (papillary thyroid carcinoma, adenocarcinoma, NOS) identified 50 transcriptional master regulators (TMRs) with FDR-adjusted Fisher’s combined p < 0.05, supported across both cohorts. As shown in Figure 1, many transcription factors did not reach strong significance; however, this set of 50 TMRs also showed positive mean NES values (greater than 1), emphasizing their role as key regulators in PTC.
Forkhead (FOX) family TMRs. We identified three TMRs from the Forkhead family. Notably, FOXE1 is a well-characterized regulator of thyroid development and differentiation; its dysregulation has been linked to thyroid tumorigenesis and metastatic progression through modulation of the epithelial–mesenchymal transition via ZEB1.[16,17,18] We also detected FOXP2, which has been implicated in tumor establishment, with overexpression associated with increased proliferation, migration, evasion of apoptosis, metastasis, and immune cell infiltration. In our analysis, FOXQ1 was overexpressed, a pattern reported to correlate with worse prognosis in thyroid cancer patients.
Nuclear receptor TMRs. We identified four transcription factors from the nuclear receptor superfamily—RARA, RARB, RXRG, and ERRγ (also known as ESRRG). This finding is clinically significant because retinoids have been shown to induce redifferentiation of thyroid cells and restore radioiodine uptake, although responses vary; in this context, RARβ/RXRγ expression has been linked to increased treatment sensitivity in thyroid cancer cell lines and tumors.[19,20,21] Additionally, ERRγ (ESRRG) has emerged as a promising drug target, as ERRγ inverse agonists boost sodium–iodide symporter (NIS) expression and improve radioiodine uptake in models of papillary and anaplastic thyroid carcinoma.[22,23,24] This TMR hub and its regulons provide a mechanistic framework for their role in disease, highlighting potential therapeutic opportunities.
ETS family. TMRs include ETV1, ETV4, and ETV5—members of the ETS (E26 transformation-specific) family—who are involved in activating the canonical MAPK pathway in PTC.[25] Their presence among the top 50 TMRs aligns with disease biology. Functionally, ETV4 promotes proliferation and invasion, while ETV5 mediates BRAF^V600E signaling and drives growth and epithelial–mesenchymal transition, highlighting their roles as pro-oncogenic nodes.[26,27,28] Additionally, 15 other transcription factor families are represented in our analysis, each with fewer TMRs; the mapping between the 50 TMRs and their families is summarized in Table 1.
2.2. Putative TMR–TMR Regulatory Interactions
Under the classical definition, a transcriptional master regulator (TMR) is a transcription factor that determines cell fate and typically sits at the top of the regulatory hierarchy.[4] At this level, a TMR can control many downstream genes, while relatively few genes regulate its own activity.[4,29] Additionally, TMRs may regulate the expression of other TMRs, creating transcriptional activation cascades that enhance coordinated responses across gene regulatory networks.[10]
In this context, our goal was to determine whether, within the inferred regulon network, some TMRs not only regulate their downstream targets but also control other TMRs, positioning them as potential key regulators in the transcriptional circuitry of this neoplasm. After identifying the 50 TMRs that were significant and concordant across the two cohorts (TCGA-THCA/GSE33630), we scanned promoter regions of these 50 TMRs on hg38 using the asymmetric TSS window specified in Methods (−2000/+200 on the positive strand; −200/+2000 on the negative strand). Motifs were available for a subset of TMRs based on public databases, and we used those to search for predicted binding sites among the 50 TMRs, thereby assembling a map of putative TMR–TMR connections (Figure 2). We also examined the differential expression patterns for the 50 TMRs and found directional concordance across datasets in all cases (outer ring, blue/red), which reinforces the biological coherence of their behavior. Finally, to place these predictions in the context of thyroid cancer regulation, motif–promoter hits were filtered to retain only those supported by mutual-information edges from our ARACNe-AP deconvolution, providing an integrated view of how these TMRs may coordinate gene expression programs in PTC.
2.3. Functional Relevance of the 50 TMRs
To evaluate the biological importance of the 50 identified TMRs in thyroid cancer, we performed enrichment analysis of the combined regulon network against KEGG pathways and MSigDB Hallmarks (Figure 3). As expected, thyroid hormone synthesis was significantly enriched in the KEGG pathways. We also observed enrichment of valine, leucine, and isoleucine biosynthesis and degradation pathways. Although these amino acids do not directly regulate thyroid function, they are essential for metabolic balance and nutritional health, which can indirectly influence thyroid physiology. Importantly, dysregulation of branched-chain amino acid (BCAA) metabolism has been observed in various cancers.[30] In thyroid cancer, this dysregulation can activate mTORC1 signaling, promoting protein synthesis and cell growth.[31] Metabolomic studies also suggest that BCAAs could be potential biomarkers.[32]
Cytoskeletal remodeling and junctional integrity. Actin cytoskeleton remodeling and tight junctions also appeared as enriched categories among genes regulated by the TMR meta-regulon (Figure 4). This supports our previous finding that several TMR families are involved in epithelial–mesenchymal transition (EMT) and metastasis. Both cytoskeletal reorganization and junctional remodeling become dysregulated in cancer and are essential for executing EMT[33] , as well as for forming invadopodia that promote invasion and metastatic spread.[34]
Estrogen-responsive programs in Hallmarks. Enrichment of MSigDB Hallmarks identified two categories related to estrogen signaling—estrogen response (early) and estrogen response (late) (Figure 4b). It is well established that estrogens act as growth factors in both benign and malignant thyroid cells, activating the MAPK and PI3K pathways, which can coexist with oncogenic mutations such as BRAF mutations or RET/PTC rearrangements.[35] In cell models, estrogen exposure increases VEGF expression, promoting angiogenesis and migration,[36] possibly through an ERα/KRT19 axis.[37] Our findings not only support the importance of these pathways but also expand the network of genes and TMRs that may regulate this program in PTC.
2.4. Pathway Involvement at the Individual TMR Level
After establishing the global functions of the TMRs, we then evaluated their specific roles within signaling pathways through per-regulon ORA for each of the 50 TMRs. Significant enrichment was found for 18 TMRs in KEGG and for 19 TMRs in the MSigDB Hallmark collection. The results of these individual enrichments are summarized in Figure 4.
2.4.1. The Estrogen Response is the Most TMR-Rich Program
Among Hallmark pathways, estrogen response showed the highest number of associated TMRs in both early and late phases (Figure 5). For the early estrogen response, we found significant enrichment of nine TMRs: SMAD9, GRHL3, MAFB, PLAG1, ETV5, TFCP2L1, TEAD4, SETBP1, and EBF4. In contrast, during the late estrogen response, the first five regulators—SMAD9, GRHL3, MAFB, PLAG1, and ETV5—were still present, but TFCP2L1, TEAD4, SETBP1, and EBF4 were not; instead, GATAD2A appeared. This pattern indicates that these five shared TMRs form a core module driving overall estrogen signaling dysregulation, while TFCP2L1, TEAD4, SETBP1, and EBF4 may mainly influence immediate early responses. Consistent with this, early responses in thyroid models involve inducing VEGF, KRT19, and activating MAPK/PI3K signaling, while the late phase includes ongoing angiogenesis, survival pathways, and microenvironmental adaptation—features likely regulated by GATAD2A.
2.4.2. Four TMRs Dominate Pathway Involvement
FOXQ1, RUNX2, SMAD9, and GRHL3, each exhibiting the highest number of enriched categories (four each, Figure 5). In the TMR–TMR promoter analysis, FOXQ1 is regulated by ETV5 and forms a reciprocal loop with GRHL3 (FOXQ1 ↔︎ GRHL3), indicating a feed-forward/feedback module that could position FOXQ1 above or alongside GRHL3 in regulating p53 signaling, apical junctions, and early/late estrogen responses. The RUNX2-centered regulatory node is overexpressed and, in our analysis, controls KRAS signaling, apical junctions, and coagulation—all categories linked to epithelial–mesenchymal transition (EMT), which also appears enriched. Notably, in the ARACNe- and motif-supported network, RUNX2 is regulated by BHLHE40, one of the potential central nodes highlighted by our hub analysis. Our analysis also shows that SMAD9 exhibits significant enrichment for the TGF-β signaling pathway; an intriguing result, given that canonical TGF-β mediators in cancer are SMAD2/3, whereas SMAD1/5/9 usually mediate BMP signaling within the same superfamily.[38,39] This suggests a non-canonical role for SMAD9 in TGF-β signaling in PTC, thereby expanding the repertoire of transcriptional regulators involved in disease progression. Along these lines, the combined enrichment of estrogen response (early/late) and UV response indicates potential crosstalk among hormonal, genotoxic-stress, and TGF-β superfamily pathways.[40,41] Consistent with its central role, SMAD9 is regulated by TEAD4, another potential central node, in the ARACNe/motif-supported network. Overall, these findings highlight the importance of SMAD9 beyond its traditional role in BMP signaling, suggesting it may serve as an alternative regulator in thyroid cancer biology.
2.5. Top-of-Cascade TMRs
We introduce an objective, quantile-based criterion to prioritize “top-of-cascade” candidates on the ARACNe-supported, motif-backed network: transcription factors (TFs) with out-degree in the upper quartile (Q3) and in-degree in the lower quartile (Q1). Under this rule, five TFs emerge as robust driver-node candidates—PBX4 (out/in = 10/3), GATAD2A (7/2), BHLHE40 (7/3), HEY2 (7/3), and TEAD4 (7/3). Their excess of outgoing and paucity of incoming connections suggest a high hierarchical position and a potential capacity to initiate or propagate transcriptional programs in PTC.
This is a conservative assessment because the filter requires both sequence-level motif evidence and ARACNe support: (i) not all panel TMRs have available motifs, and (ii) we used a single representative motif per TF, which does not account for all recognition variants of each regulator. As a result, some plausible interactions may be excluded, and TMRs with high global out-degree could fall below the quantile thresholds under these constraints. Below, we analyze each factor by considering network placement, cross-cohort differential expression, regulon-level enrichments, and prior evidence, showing how these nodes could initiate or propagate transcriptional programs in PTC.
2.5.1. PBX Homeobox 4 (PBX4)
PBX4, a PBX homeobox transcription factor that acts as an HOX cofactor, has been linked to various tumor types. An extensive pan-cancer study reported widespread dysregulation of PBX4, with overexpression in several cancers but notable underexpression in thyroid carcinoma (THCA), along with associations to stage, methylation, immune infiltration, and pathways connected to MAPK signaling and transcriptional misregulation.[42] In our combined THCA analysis (TCGA-THCA and GSE33630), PBX4 was also downregulated in tumors compared to normal tissue, consistent with the pan-cancer findings. Although our master-regulator meta-analysis identified other transcription factors as primary network drivers, the consistent repression of PBX4 in PTC indicates a context-dependent role that should be monitored, including as a potential indicator of pathway rewiring rather than a primary upstream regulator in this disease.
2.5.2. GATA Zinc Finger Domain Containing 2A (GATAD2A)
The network-level signal we observe for GATAD2A (p66α) aligns with functional data in thyroid models. In anaplastic thyroid cancer cell lines, shRNA knockdown of GATAD2A suppressed proliferation and colony formation, induced G2/M arrest, and markedly increased apoptosis as shown by Annexin V/7-AAD and sub-G1 assays, along with consistent cleavage of caspase-3 and PARP.[43] Moreover, in papillary thyroid cancer (PTC), a circRNA-driven pathway (hsa_circ_0058124/NOTCH3/GATAD2A) promotes proliferation, migration/invasion, and in vivo tumor growth; the axis depends on NOTCH3–GATAD2A modulation and is proposed as a disease driver in PTC.[44] Mechanistically, GATAD2A can also function as a p53 co-activator in breast cancer models by physically interacting with p53, enhancing p53 binding at target promoters (e.g., BAX, NOXA, GADD45A, PAI-1), and suppressing growth and migration. Higher GATAD2A levels are associated with a better prognosis.[45] Although these findings are from breast systems, they support a broader role for GATAD2A as a chromatin-linked modulator of tumor suppressive transcriptional programs, consistent with the context-dependent behavior of NuRD subunits.
2.5.3. Basic Helix-Loop-Helix Family Member e40 (BHLHE40)
In our integrated analysis, BHLHE40/DEC1 is overexpressed and sits upstream of RUNX2, whose regulon converges on KRAS signaling, apical junctions, and coagulation—programs tightly linked to EMT—indicating BHLHE40 as a coordinator of pro-oncogenic modules in PTC. This placement aligns with thyroid cancer experiments, which show that BHLHE40 sustains proliferation and invasiveness and functionally cooperates with NOTCH1. Specifically, BHLHE40 regulates NOTCH1; its overexpression accelerates growth and invasion, while γ-secretase inhibition (DAPT) or NOTCH1 silencing reduces the BHLHE40-driven phenotype.[46] Complementing these data, cohort analyses in THCA report BHLHE40 upregulation associated with immune infiltration (B cells, CD4+ T cells, neutrophils, macrophages, and dendritic cells), and functional evidence indicates that BHLHE40 knockdown decreases proliferation, migration, invasion, and metastasis traits.[47] Mechanistically, BHLHE40 can act as either a repressor or an activator, depending on its partners and the chromatin context. In immune and other systems, it modulates cytokine output, cell-cycle control, and metabolism, providing a framework for coupling stress or inflammatory cues to tumor-intrinsic programs in PTC.[48]
In anaplastic thyroid carcinoma (ATC), an H19–miR-454-3p–BHLHE40 axis activates PI3K/AKT signaling: H19 sponges miR-454-3p to de-repress BHLHE40, and BHLHE40 overexpression rescues the anti-proliferative and anti-migratory effects of H19 knockdown.[49] Along with the DEC1↔NOTCH1 positive feedback[46] , these findings outline two converging routes—NOTCH and H19–miR-454-3p–BHLHE40 (PI3K/AKT)—through which BHLHE40 can connect with EMT-related pathways, consistent with our RUNX2-focused pathway observations.
Beyond thyroid cancer, BHLHE40 is widely involved in various malignancies, highlighting its importance in oncology: breast,[50,51,52] colorectal,[53,54,55] choriocarcinoma,[56] endometrial,[57,58] esophageal,[59] gastric,[60,61,62] glioma,[63,64,65] HeLa models,[66,67] hepatocellular carcinoma,[68,69] non–small-cell lung,[70] oral squamous cell carcinoma,[71,72] and pancreatic cancer.[73,74,75,76,77]
2.5.4. Hes Related Family bHLH Transcription Factor with YRPW Motif 2 (HEY2)
In our integrative analysis of papillary thyroid carcinoma (PTC), HEY2 was found to be overexpressed, and its regulon was enriched for estrogen-responsive programs, indicating crosstalk between Notch signaling and hormone-responsive circuitry in PTC. Independent functional data in PTC support a pro-tumorigenic role for HEY2: the miR-599→HEY2 axis directly targets the HEY2 3′UTR (dual-luciferase), and either overexpressing miR-599 or silencing HEY2 reduces proliferation, migration, invasion, and EMT while promoting apoptosis; these effects are associated with increased E-cadherin/Bax and decreased BCL2, N-cadherin, Vimentin, Snail/Slug, and Notch pathway markers (NOTCH1, DLL1, HES1, NICD, JAG1). Overall, these experiments validate HEY2 as a Notch-dependent driver and suggest that restoring miR-599 or inhibiting HEY2 could be a viable therapeutic approach in PTC.[78]
Across various other cancers, HEY2 is often upregulated and linked to aggressive traits, highlighting its pro-oncogenic role. In esophageal squamous cell carcinoma, HEY2 is overexpressed in about 30% of tumors and associates with lymph node metastasis, aligning with Notch pathway activation during disease progression. In non-small-cell lung cancer, a competing endogenous RNA axis involving PRNCR1–miR-448–HEY2 increases HEY2 levels; restoring miR-448 or silencing PRNCR1 reduces proliferation, migration, invasion, and EMT, with partial rescue by HEY2 re-expression. Mechanistically, HEY proteins (including HEY1, HEY2, and HEY-L) are direct Notch targets that act as bHLH transcriptional repressors through E/N-box binding. This framework explains how Notch→HEY2 signaling connects developmental or stress signals to EMT-related outcomes—consistent with the estrogen-response enrichment seen in the HEY2 regulon in PTC.[79,80,81,82]
2.5.5. TEA Domain Transcription Factor 4 (TEAD4)
TEAD4 is a key transcriptional effector of Hippo pathway output, working with YAP/TAZ to regulate programs related to growth, survival, and epithelial plasticity depending on lineage and context. In our integrated PTC analysis, TEAD4 was under-expressed, indicating a relative decrease in canonical YAP–TEAD signaling. Mechanistically, this matches evidence that the tumor suppressor NF2 (Merlin) directly interacts with TEAD4 (FERM and C-terminal regions) to inhibit its palmitoylation, decrease nuclear localization, and promote destabilization—thereby limiting TEAD4-dependent transcription independently of LATS1/2 and YAP.[83] Additionally, an in-vitro thyroid study reports low TEAD4 expression in tumor tissues and cells, demonstrating that forced TEAD4 overexpression reduces viability, migration, and invasion, reverses EMT markers (↓N-cadherin, ↓Vimentin; ↑E-cadherin), and influences Wnt signaling (↑WNT3A). Pharmacologic Wnt blockade (IWR-1-endo) negates these effects, supporting a TEAD4→Wnt axis that limits pro-metastatic programs in thyroid models.[84] A recent review further places TEAD4 at the intersection of epithelial plasticity, stress signaling, and therapy response across cancers, while highlighting lineage-specific behaviors.[85]
Across various cancers, TEAD4 frequently functions as a pro-oncogenic effector of YAP/TAZ; however, its regulatory role and potency are dependent on context, influenced by lineage, cofactors, and Hippo signaling pathways. Notable examples include signals in bladder,[86,87] brain,[88] breast,[89,90,91] cervical,[92] colorectal,[93,94,95,96,97,98] cutaneous melanoma,[99] esophageal,[100,101] gastric,[102,103,104,105,106,107,108] hepatocellular carcinoma,[109,110] laryngeal,[111] lung adenocarcinoma,[112,113] renal cell carcinoma,[114,115,116] and stomach adenocarcinoma.[117] In this context, the PTC-specific downregulation we observe suggests that Hippo pathway regulation—possibly through NF2-mediated TEAD4 inhibition—may counteract other drivers of proliferation in papillary thyroid tumors.[83]
2.6. Therapeutic Implications
Based on our meta-analysis, two key, actionable pathways in PTC emerge: (i) a NOTCH3–GATAD2A module where GATAD2A (p66α) is involved in transcriptional regulation and NuRD-linked chromatin programs, and (ii) a BHLHE40–NOTCH dependency that connects stress and inflammatory signals to tumor-inherent growth and invasion. These findings support biomarker-guided strategies aimed at disrupting oncogenic inputs into NOTCH3–GATAD2A, restoring GATAD2A-driven activation of tumor-suppressing pathways, or targeting vulnerabilities associated with the NuRD complex identified by our TMR subnetwork.[44] Additionally, pharmacologic blockade of NOTCH signaling (such as DAPT) reduces the growth and invasive traits driven by BHLHE40 overexpression, endorsing therapies that target the BHLHE40–NOTCH axis. Since BHLHE40 can act as an activator or repressor by partnering with HDACs, combining modulation of NOTCH signaling with epigenetic regulation presents a promising approach in BHLHE40-high PTC cases.[46,48]
A third druggable node intersects TEAD4 biology. TEAD palmitoylation is crucial for TEAD stability and YAP binding, and small-molecule palmitoylation inhibitors or covalent TEAD ligands can reduce YAP/TEAD transcriptional activity.[87] Additionally, the NF2–TEAD4 interface itself acts as a regulatory chokepoint: NF2 (Merlin) directly binds to TEAD4, inhibiting its palmitoylation, decreasing nuclear residency, and promoting ubiquitin-dependent degradation—thereby limiting TEAD4 activity independently of LATS1/2 and YAP.[83] Given our cohort-specific TEAD4 downregulation, these mechanisms explain why Hippo pathway constraints may be active in PTC and suggest that restoring NF2 function or mimicking its inhibitory contact could suppress TEAD4 where it is oncogenic, while TEAD-axis agents could still target compensatory YAP/TEAD circuitry.
Collectively, these threads support a translational framework that pairs pathway-informed agents with molecular stratification: (a) NOTCH3/GATAD2A-high or BHLHE40-high tumors prioritized for NOTCH inhibition with or without epigenetic co-targeting; (b) YAP/TEAD-signature–high tumors considered for TEAD-directed agents such as verteporfin (YAP–TEAD disruptor), TED-347 (covalent palmitate-pocket binder), or L06 (auto-palmitoylation inhibitor).[85] Prospective testing in PTC models should include functional readouts of EMT, migration/invasion, and Wnt/MAPK outputs, and incorporate response biomarkers for the NOTCH3–GATAD2A, BHLHE40–NOTCH/HDAC, and TEAD/NF2 palmitoylation axes to account for context-specific roles and pathway crosstalk intrinsic to thyroid cancer.
3. Materials and Methods
To ensure robustness and avoid single-cohort bias, we analyzed two independent cohorts of papillary thyroid carcinoma, adenocarcinoma, NOS: the TCGA-THCA project and the GEO study GSE33630.[118] The overall workflow, summarized in Figure 6, combines differential expression analysis, gene set enrichment, regulon inference, and master regulator analysis. The code for this study is available at https://github.com/hachepunto/TiroidesMasterRegulators.
3.1. Data Acquisition and Preprocessing
TCGA-THCA. Transcriptomic data were obtained from the Genomic Data Commons (GDC) using the TCGAbiolinks package. We restricted the cohort to samples with a primary diagnosis of Papillary adenocarcinoma, NOS. From raw count files generated by the STAR–Counts workflow, non-protein-coding features were removed, keeping only genes annotated as protein-coding. Duplicate gene symbols were consolidated by applying the statistical mode across expression values. Genes with at least 10 reads in more than 80% of samples were retained, followed by TMM normalization (trimmed mean of M-values)[119] implemented in edgeR[120], and subsequent transformation to CPM (counts per million).
GSE33630 (GEO). Raw “.CEL” files were downloaded from GEO. Affymetrix Human Genome U133 Plus 2.0 arrays were normalized using RMA (Robust Multi-array Average).[121] Probe annotation was performed with g:Profiler2[122] to map to HGNC symbols, retaining a single identifier per gene by selecting the probe with the highest B-statistic. Genes with low expression (mean log₂ ≤ 4) and low variability (bottom 25% by variance) were subsequently removed.
3.2. Differential Expression Analysis
TCGA-THCA. To identify differentially expressed genes (DEGs) between tumors and normal tissues, we used limma[123] with voom transformation[124] on the CPM-normalized matrix. A linear model was fitted to the tumor versus normal contrast, followed by empirical Bayes variance moderation (eBayes). Genes with adjusted p (FDR) < 0.05 and |logFC| ≥ 1 were considered significant.
GSE33630. Differential expression was analyzed with limma, comparing papillary thyroid carcinoma (PTC) directly to normal samples. After Bayesian moderation, genes were retained based on the same criteria (FDR < 0.05 and |logFC| ≥ 1). Results were consolidated into a single identifier per gene, producing a reliable DEG profile for the GEO cohort.
3.3. Regulon Network Inference
Regulatory networks were inferred using ARACNe-AP (Algorithm for the Reconstruction of Accurate Cellular Networks, Adaptive Partitioning)[125] , based on the curated transcription factor compendium from Lambert et al. (2018).[126]
TCGA-THCA. We used the CPM-normalized expression matrix restricted to protein-coding genes from tumor samples diagnosed as Papillary adenocarcinoma, NOS. The network was generated with a significance threshold of p = 1 × 10⁻⁸, and 100 independent runs with different random seeds were performed, followed by the ARACNe consolidation step to obtain the final network. The resulting network included approximately 234,000 interactions.
3.4. Master Regulator Analysis (MRA)
Master regulator analysis27,28 was performed using VIPER (Virtual Inference of Protein-Activity by Enriched Regulon Analysis) implementation.29 For each dataset, we used the ARACNe-AP-inferred regulon network along with a tumor-versus-normal differential expression signature. VIPER estimates the regulatory activity of each transcription factor by analyzing the enrichment of its targets within the signature and evaluating significance against permutation-based null models. This approach identifies the transcription factors most likely to drive the transcriptional programs (transcriptional master regulators, TMRs) observed in papillary thyroid carcinoma.
3.5. Integration of MRA Results by Meta-Analysis (Fisher’s Method)
To identify robust and reproducible master regulators across independent cohorts, we integrated the VIPER MRA p-values from TCGA-THCA and GSE33630 using p-value meta-analysis. Each dataset contributed one p-value per transcription factor, derived from the significance of the VIPER enrichment. We combined p-values using Fisher’s method[127] , which transforms them into a log-likelihood statistic:
where pi denotes the p-value for the regulator in dataset i, and y k is the number of studies combined (two in our case). Under the null hypothesis of independence, the resulting statistic follows a χ2 distribution with 2k degrees of freedom. We implemented this method using the metap library.[128]
This approach enables the detection of transcription factors that are consistent across both studies, even when the signal within an individual dataset is not sufficiently strong. Additionally, we computed the mean NES and recorded sign concordance across cohorts (without using it as an exclusion criterion). The meta-analysis identified 50 TMRs with FDR < 0.05, which constitute the core of this study.
3.6. Motif Analysis of TMRs
Binding motifs were retrieved from JASPAR2022[129,130,131] as position frequency matrices (PFMs), selecting the latest version for each TF and converting them into position weight matrices (PWMs). We chose JASPAR2022 over newer versions because, at the time of analysis, it was the most recent supported by TFBSTools[132] , ensuring reproducibility and compatibility of the workflow. To expand coverage beyond the initial set of JASPAR-only motifs, we added missing TFs with motifs from CIS-BP33, standardizing all matrices to PWMs and implementing a source-priority scheme (JASPAR manual > JASPAR automatic > CIS-BP). Metadata for each TF–motif, including source and identifiers, was recorded to ensure reproducibility. For each TMR with an available motif, we scanned the promoters of the 50 TMRs on hg38 using an asymmetric TSS window (−2000/+200 on the positive strand; −200/+2000 on the negative strand) with min.score = 85%. To minimize false positives, we retained only motif–target pairs supported by the ARACNe-AP network in at least one dataset, combining sequence evidence with coexpression/MI support.
3.7. Differential Expression of TMRs Via Meta-Analysis (Fisher + IVW Fixed Effect)
For the 50 validated TMRs, we evaluated whether they show consistent changes in expression between tumors and controls by integrating evidence from both cohorts.
Combining significance levels. For each TMR, differential-expression p-values from each dataset were combined using Fisher’s method.
(k = 2), followed by multiple-testing correction (FDR).
Combining effect sizes (logFC). Complementarily, we combined log fold-changes using a common-effect (fixed-effect) inverse-variance–weighted (IVW) meta-analysis[133,134] :
yielding a two-sided p-value for that was subsequently FDR-adjusted. Standard errors for each cohort were estimated from limma outputs (t-statistic and logFC).
Finally, we verified directional concordance of the effect (sign of logFC) across datasets. This Fisher + IVW scheme jointly assesses the significance and magnitude of change, improving robustness to cohort-specific variability.
3.8. Functional Enrichment of the Meta-Regulon
To characterize the biological processes collectively controlled by the identified TMRs, we created a meta-regulon defined as the union of targets regulated by the 50 validated TMRs, combining regulons from both datasets. Over-representation analyses (ORA) were performed on this set for MSigDB Hallmarks[135] , KEGG, and GO, for each dataset, using the corresponding universe of expressed genes as background. Term-level p-values were then combined across cohorts using Fisher’s method and adjusted for FDR. This layer summarizes the biological programs shared by the combined network of TMR targets.
4. Conclusions
A cross-cohort meta-analysis of TCGA-THCA and GSE33630 identified 50 transcriptional master regulators (TMRs) in papillary thyroid carcinoma (PTC). These include members of the Zinc Finger, Forkhead, nuclear receptor, and ETS families—groups with established roles in proliferation, migration, metastasis, and thyroid differentiation. Using a quantile-based criterion on the ARACNe+motif network (high out-degree with low in-degree; upper-quartile vs. lower-quartile thresholds), the most consistent top-of-cascade candidates were PBX4, GATAD2A, BHLHE40, HEY2, and TEAD4. Within this framework, we observed the interactions BHLHE40 → RUNX2 and TEAD4 → SMAD9, as well as a reciprocal loop between FOXQ1 and GRHL3, indicating hierarchical modules with potential system-level impact.
Functionally, estrogen response became a key program, with strong Hallmark enrichment observed across cohorts. The early and late components were supported by nine TMRs—SMAD9, GRHL3, MAFB, PLAG1, ETV5, TFCP2L1, TEAD4, SETBP1, and EBF4—highlighting a hormonal axis likely important to PTC initiation and progression.
Regulon-level analyses further implicated SMAD9 in TGF-β signaling, indicating non-canonical activity (usually associated with BMP) and possible crosstalk with estrogen and genotoxic stress pathways. Along with the edges TEAD4 → SMAD9 and BHLHE40 → RUNX2, these findings highlight SMAD9—and the quantile-prioritized TMR set—as key regulators with potential functional and therapeutic significance in PTC.
Limitations. Combining two independent cohorts from different platforms and requiring dual support (motif + ARACNe) enhances robustness but is conservative; it may miss plausible interactions if they fail either filter, and motif coverage (JASPAR/CIS-BP) limits inference. Additional cohorts and functional perturbations will be essential to confirm and extend these findings.This section is not mandatory but can be added to the manuscript if the discussion is unusually long or complex.
Author Contributions
Conceptualization, H.T; methodology, H.T. and E.H.-L.; software, H.T., O.Z.-M.; validation, H.T., and O.Z.-M.; formal analysis, H.T., and O.Z.-M.; investigation, D.T.-C., H.T., and O.Z.-M.; data curation, O.Z.-M., H.T. and D.T.-C.; writing—original draft preparation, O.Z.-M.; writing—review and editing, D.T.-C., H.T., E.H.-L. and O.Z.-M.; visualization, H.T.; supervision, E.H.-L. All authors have read and agreed to the published version of the manuscript.
Funding
This research received no external funding.
Institutional Review Board Statement
Not applicable.
Informed Consent Statement
Not applicable.
Data Availability Statement
The data used in this study were derived from public domain resources, including the Gene Expression Omnibus (GSE33630, https://www.ncbi.nlm.nih.gov/geo/query/acc.cgi?acc=GSE33630) and The Cancer Genome Atlas Thyroid Cancer dataset (TCGA-THCA, https://doi.org/10.7937/K9/TCIA.2016.9ZFRVF1B). Analysis scripts and reproducible code are available at https://github.com/hachepunto/TiroidesMasterRegulators.
Acknowledgments
The results published here are in part based upon data generated by the TCGA Research Network: https://www.cancer.gov/tcga.
Conflicts of Interest
The authors declare that the research was conducted in the absence of any commercial or financial relationships that could be construed as a potential conflict of interest.
References
- Pellegriti, G.; Frasca, F.; Regalbuto, C.; Squatrito, S.; Vigneri, R. Worldwide Increasing Incidence of Thyroid Cancer: Update on Epidemiology and Risk Factors. J. Cancer Epidemiology 2013, 2013, 965212. [CrossRef]
- Vogelstein, B.; Kinzler, K.W. Cancer Genes and the Pathways They Control. Nat. Med. 2004, 10, 789–799. [CrossRef]
- Hanahan, D.; Weinberg, R.A. Hallmarks of Cancer: The Next Generation. Cell 2011, 144, 646–674. [CrossRef]
- Chan, S.S.-K.; Kyba, M. What Is a Master Regulator? J. Stem Cell Res. Ther. 2013, 03. [CrossRef]
- Chen, H.; Mundra, P.A.; Zhao, L.N.; Lin, F.; Zheng, J. Highly Sensitive Inference of Time-Delayed Gene Regulation by Network Deconvolution. BMC Syst. Biol. 2014, 8, S6–S6. [CrossRef]
- Margolin, A.A.; Nemenman, I.; Basso, K.; Wiggins, C.; Stolovitzky, G.; Favera, R.; Califano, A. ARACNE: An Algorithm for the Reconstruction of Gene Regulatory Networks in a Mammalian Cellular Context. Bmc Bioinformatics 2006, 7, S7. [CrossRef]
- Margolin, A.A.; Wang, K.; Lim, W.K.; Kustagi, M.; Nemenman, I.; Califano, A. Reverse Engineering Cellular Networks. Nat Protoc 2006, 1, 662–671. [CrossRef]
- Meyer, P.E.; Lafitte, F.; Bontempi, G. Minet: A R/Bioconductor Package for Inferring Large Transcriptional Networks Using Mutual Information; BMC Bioinformatics; BioMed Central Ltd, 2008;
- Guzzi, P.H.; Mercatelli, D.; Ceraolo, C.; Giorgi, F.M. Master Regulator Analysis of the SARS-CoV-2/Human Interactome. J Clin Medicine 2020, 9, 982. [CrossRef]
- Hernández-Lemus, E.; Baca-López, K.; García-Herrera, R. The Role of Master Regulators in Gene Regulatory Networks. Pap. Phys. 2014, 7, 070011. [CrossRef]
- Hanahan, D.; Weinberg, R.A. The Hallmarks of Cancer. Cell 2000, 100, 57–70. [CrossRef]
- Fouad, Y.A.; Aanei, C. Revisiting the Hallmarks of Cancer. Am. J. cancer Res. 2017, 7, 1016–1036.
- Cassandri, M.; Smirnov, A.; Novelli, F.; Pitolli, C.; Agostini, M.; Malewicz, M.; Melino, G.; Raschellà, G. Zinc-Finger Proteins in Health and Disease. Cell Death Discov. 2017, 3, 17071. [CrossRef]
- Jen, J.; Wang, Y.-C. Zinc Finger Proteins in Cancer Progression. J. Biomed. Sci. 2016, 23, 53. [CrossRef]
- Du, X.; Wang, J.-M.; Zhang, D.-L.; Wu, T.; Zeng, X.-Y.; Jiang, J.-Y.; Du, Z.-X. AUF1 Promotes Proliferation and Invasion of Thyroid Cancer via Downregulation of ZBTB2 and Subsequent TRIM58. Front. Oncol. 2021, 11, 681736. [CrossRef]
- Xu, L.; Yang, Z.; Zhao, Q.; Feng, H.; Kuang, J.; Liu, Z.; Chen, L.; Zhan, L.; Yan, J.; Cai, W.; et al. Effect of FOXP2 Transcription Factor on Immune Infiltration of Thyroid Cancer and Its Potential Clinical Value. Front. Immunol. 2022, 13, 982812. [CrossRef]
- Yang, F.; Xiao, Z.; Zhang, S. FOXP2 Regulates Thyroid Cancer Cell Proliferation and Apoptosis via Transcriptional Activation of RPS6KA6. Exp. Ther. Med. 2022, 23, 434. [CrossRef]
- Zou, H.; Tang, C.; Chen, H. FOXP2 Regulates the Proliferation, Migration, and Apoptosis of Thyroid Carcinoma Cells via Wnt/β-Catenin Signaling Pathway. Trop. J. Pharm. Res. 2022, 20, 1609–1614. [CrossRef]
- Haugen, B.R.; Larson, L.L.; Pugazhenthi, U.; Hays, W.R.; Klopper, J.P.; Kramer, C.A.; Sharma, V. Retinoic Acid and Retinoid X Receptors Are Differentially Expressed in Thyroid Cancer and Thyroid Carcinoma Cell Lines and Predict Response to Treatment with Retinoids. J. Clin. Endocrinol. Metab. 2004, 89, 272–280. [CrossRef]
- Short, S.C.; Suovuori, A.; Cook, G.; Vivian, G.; Harmer, C. A Phase II Study Using Retinoids as Redifferentiation Agents to Increase Iodine Uptake in Metastatic Thyroid Cancer. Clin. Oncol. 2004, 16, 569–574. [CrossRef]
- Buffet, C.; Wassermann, J.; Hecht, F.; Leenhardt, L.; Dupuy, C.; Groussin, L.; Lussey-Lepoutre, C. Redifferentiation of Radioiodine-Refractory Thyroid Cancers. Endocr.-Relat. Cancer 2020, 1, R113–R132. [CrossRef]
- Singh, T.D.; Jeong, S.Y.; Lee, S.-W.; Ha, J.-H.; Lee, I.-K.; Kim, S.H.; Kim, J.; Cho, S.J.; Ahn, B.-C.; Lee, J.; et al. Inverse Agonist of Estrogen-Related Receptor γ Enhances Sodium Iodide Symporter Function Through Mitogen-Activated Protein Kinase Signaling in Anaplastic Thyroid Cancer Cells. J. Nucl. Med. 2015, 56, 1690–1696. [CrossRef]
- Kim, J.; Hwang, H.; Yoon, H.; Lee, J.-E.; Oh, J.M.; An, H.; Ji, H.D.; Lee, S.; Cha, E.; Ma, M.J.; et al. An Orally Available Inverse Agonist of Estrogen-Related Receptor Gamma Showed Expanded Efficacy for the Radioiodine Therapy of Poorly Differentiated Thyroid Cancer. Eur. J. Med. Chem. 2020, 205, 112501. [CrossRef]
- Singh, T.D.; Lee, J.E.; Son, K.H.; Lee, B.R.; Kim, S.K.; Gulwani, D.; Sarangthem, V.; Jeon, Y.H. An Inverse Agonist of Estrogen-Related Receptor Gamma, GSK5182, Enhances Na+/I− Symporter Function in Radioiodine-Refractory Papillary Thyroid Cancer Cells. Cells 2023, 12, 470. [CrossRef]
- Oh, S.; Shin, S.; Janknecht, R. ETV1, 4 and 5: An Oncogenic Subfamily of ETS Transcription Factors. Biochim. Biophys. Acta (BBA) - Rev. Cancer 2012, 1826, 1–12. [CrossRef]
- Wang, L.; Zhang, Y.; Yang, J.; Liu, L.; Yao, B.; Tian, Z.; He, J. The Knockdown of ETV4 Inhibits the Papillary Thyroid Cancer Development by Promoting Ferroptosis Upon SLC7A11 Downregulation. DNA Cell Biol. 2021, 40, 1211–1221. [CrossRef]
- Puli, O.R.; Danysh, B.P.; McBeath, E.; Sinha, D.K.; Hoang, N.M.; Powell, R.T.; Danysh, H.E.; Cabanillas, M.E.; Cote, G.J.; Hofmann, M.-C. The Transcription Factor ETV5 Mediates BRAFV600E-Induced Proliferation and TWIST1 Expression in Papillary Thyroid Cancer Cells. Neoplasia 2018, 20, 1121–1134. [CrossRef]
- Jiang, W.; Xu, Y.; Chen, X.; Pan, S.; Zhu, X. E26 Transformation-Specific Variant 4 as a Tumor Promotor in Human Cancers through Specific Molecular Mechanisms. Mol. Ther. - Oncolytics 2021, 22, 518–527. [CrossRef]
- Ohno, S. Major Sex-Determining Genes. 1979, 67–78. [CrossRef]
- Xiong, H.; Liu, R.; Xu, K.; Chen, X.; Huang, L.; Shou, Y.; Huang, Y.; Sheng, H.; Lu, Y.; Zhang, H. Branched-Chain Amino Acid and Cancer: Metabolism, Immune Microenvironment and Therapeutic Targets. J. Transl. Med. 2025, 23, 636. [CrossRef]
- Wang, Z.; Yang, Y.; Xing, Y.; Si, D.; Wang, S.; Lin, J.; Li, C.; Zhang, J.; Yin, D. Combined Metabolomic and Lipidomic Analysis Uncovers Metabolic Profile and Biomarkers for Papillary Thyroid Carcinoma. Sci. Rep. 2023, 13, 17666. [CrossRef]
- Zhang, J.; Wen, X.; Li, Y.; Zhang, J.; Li, X.; Qian, C.; Tian, Y.; Ling, R.; Duan, Y. Diagnostic Approach to Thyroid Cancer Based on Amino Acid Metabolomics in Saliva by Ultra-Performance Liquid Chromatography with High Resolution Mass Spectrometry. Talanta 2021, 235, 122729. [CrossRef]
- Rubtsova, S.N.; Zhitnyak, I.Y.; Gloushankova, N.A. Phenotypic Plasticity of Cancer Cells Based on Remodeling of the Actin Cytoskeleton and Adhesive Structures. Int. J. Mol. Sci. 2021, 22, 1821. [CrossRef]
- Mgrditchian, T.; Brown-Clay, J.; Hoffmann, C.; Müller, T.; Filali, L.; Ockfen, E.; Mao, X.; Moreau, F.; Casellas, C.P.; Kaoma, T.; et al. Actin Cytoskeleton Depolymerization Increases Matrix Metalloproteinase Gene Expression in Breast Cancer Cells by Promoting Translocation of Cysteine-Rich Protein 2 to the Nucleus. Front. Cell Dev. Biol. 2023, 11, 1100938. [CrossRef]
- Derwahl, M.; Nicula, D. Estrogen and Its Role in Thyroid Cancer. Endocr.-Relat. Cancer 2014, 21, T273–T283. [CrossRef]
- Kamat, A.; Rajoria, S.; George, A.; Suriano, R.; Shanmugam, A.; Megwalu, U.; Prakash, P.B.; Tiwari, R.; Schantz, S. Estrogen-Mediated Angiogenesis in Thyroid Tumor Microenvironment Is Mediated Through VEGF Signaling Pathways. Arch. Otolaryngol.Head Neck Surg. 2011, 137, 1146–1153. [CrossRef]
- Song, Z.M.; Wang, Y.D.; Chai, F.; Zhang, J.; Lv, S.; Wang, J.X.; Xi, Y. Estrogen Enhances the Proliferation, Migration, and Invasion of Papillary Thyroid Carcinoma via the ERα/KRT19 Signaling Axis. J. Endocrinol. Investig. 2025, 48, 653–670. [CrossRef]
- Massagué, J. TGF-β Signaling in Development and Disease. FEBS Lett. 2012, 586, 1833–1833. [CrossRef]
- Schmierer, B.; Hill, C.S. TGFβ–SMAD Signal Transduction: Molecular Specificity and Functional Flexibility. Nat. Rev. Mol. Cell Biol. 2007, 8, 970–982. [CrossRef]
- Band, A.M.; Laiho, M. Crosstalk of TGF-β and Estrogen Receptor Signaling in Breast Cancer. J. Mammary Gland Biol. Neoplasia 2011, 16, 109–115. [CrossRef]
- Sanchez-Vega, F.; Mina, M.; Armenia, J.; Chatila, W.K.; Luna, A.; La, K.C.; Dimitriadoy, S.; Liu, D.L.; Kantheti, H.S.; Saghafinia, S.; et al. Oncogenic Signaling Pathways in The Cancer Genome Atlas. Cell 2018, 173, 321-337.e10. [CrossRef]
- Song, Y.; Ma, R. Identifying the Potential Roles of PBX4 in Human Cancers Based on Integrative Analysis. Biomolecules 2022, 12, 822. [CrossRef]
- Wang, Z.; Kang, J.; Deng, X.; Guo, B.; Wu, B.; Fan, Y. Knockdown of GATAD2A Suppresses Cell Proliferation in Thyroid Cancer in Vitro. Oncol. Rep. 2017, 37, 2147–2152. [CrossRef]
- Yao, Y.; Chen, X.; Yang, H.; Chen, W.; Qian, Y.; Yan, Z.; Liao, T.; Yao, W.; Wu, W.; Yu, T.; et al. Hsa_circ_0058124 Promotes Papillary Thyroid Cancer Tumorigenesis and Invasiveness through the NOTCH3/GATAD2A Axis. J. Exp. Clin. Cancer Res. 2019, 38, 318. [CrossRef]
- Zhang, Q.; Zhang, Y.; Zhang, J.; Zhang, D.; Li, M.; Yan, H.; Zhang, H.; Song, L.; Wang, J.; Hou, Z.; et al. P66α Suppresses Breast Cancer Cell Growth and Migration by Acting as Co-Activator of P53. Cells 2021, 10, 3593. [CrossRef]
- Gallo, C.; Fragliasso, V.; Donati, B.; Torricelli, F.; Tameni, A.; Piana, S.; Ciarrocchi, A. The bHLH Transcription Factor DEC1 Promotes Thyroid Cancer Aggressiveness by the Interplay with NOTCH1. Cell Death Dis. 2018, 9, 871. [CrossRef]
- Gong, Q.; Li, H. High Expression of BHLHE40 Promotes Immune Infiltration and Tumor Progression in Thyroid Cancer. Chin. J. Physiol. 2023, 66, 153–161. [CrossRef]
- Cook, M.E.; Jarjour, N.N.; Lin, C.-C.; Edelson, B.T. Transcription Factor Bhlhe40 in Immunity and Autoimmunity. Trends Immunol. 2020, 41, 1023–1036. [CrossRef]
- Wu, Y.; Yang, J.; Zhang, H.; Cheng, J.; Lei, P.; Huang, J. LncRNA H19 Influences Cellular Activities via the miR-454-3p/BHLHE40 Axis in Anaplastic Thyroid Carcinoma. Horm. Metab. Res. 2023, 56, 392–399. [CrossRef]
- Xue, J.; Dai, Y.; Li, G.; Lang, W.; Li, P.; Liu, Y.; Bao, H.; Zhao, D.; Pan, H. DEC1 Directly Interacts with Estrogen Receptor (ER) α to Suppress Proliferation of ER-Positive Breast Cancer Cells. Biochem. Biophys. Res. Commun. 2020, 528, 740–745. [CrossRef]
- Ming, X.; Bao, C.; Hong, T.; Yang, Y.; Chen, X.; Jung, Y.-S.; Qian, Y. Clusterin, a Novel DEC1 Target, Modulates DNA Damage-Mediated Cell Death. Mol. Cancer Res. 2018, 16, molcanres.0070.2018. [CrossRef]
- LIU, Y.; MIAO, Y.; WANG, J.; LIN, X.; WANG, L.; XU, H.-T.; WANG, E.-H. DEC1 Is Positively Associated with the Malignant Phenotype of Invasive Breast Cancers and Negatively Correlated with the Expression of Claudin-1. Int. J. Mol. Med. 2013, 31, 855–860. [CrossRef]
- Yang, S.; Zhang, D.; Sun, Q.; Nie, H.; Zhang, Y.; Wang, X.; Huang, Y.; Sun, Y. Single-Cell and Spatial Transcriptome Profiling Identifies the Transcription Factor BHLHE40 as a Driver of EMT in Metastatic Colorectal Cancer. Cancer Res. 2024, 84, 2202–2217. [CrossRef]
- Wang, J.; Li, B.; Yang, S.; Ma, C.; Liu, K.; Chen, X.; Cui, W. Upregulation of INHBA Mediated by the Transcription Factor BHLHE40 Promotes Colon Cancer Cell Proliferation and Migration. J. Clin. Lab. Anal. 2022, 36, e24539. [CrossRef]
- Shan, E.; Hao, Y.; Wang, H.; Zhang, Z.; Hu, J.; Wang, G.; Liu, W.; Yan, B.; Hiroaki, H.; Yang, J. Differentiated Embryonic Chondrocyte Expressed Gene-1 (DEC1) Enhances the Development of Colorectal Cancer with an Involvement of the STAT3 Signaling. Neoplasia 2022, 27, 100783. [CrossRef]
- Xu, Y.; Ren, B.; Wang, M. HIF-1α Contributes to Metastasis in Choriocarcinoma by Regulating DEC1 Expression. Clin. Transl. Oncol. 2023, 25, 1641–1649. [CrossRef]
- Asanoma, K.; Yagi, H.; Onoyama, I.; Cui, L.; Hori, E.; Kawakami, M.; Maenohara, S.; Hachisuga, K.; Tomonobe, H.; Kodama, K.; et al. The BHLHE40‒PPM1F‒AMPK Pathway Regulates Energy Metabolism and Is Associated with the Aggressiveness of Endometrial Cancer. J. Biol. Chem. 2024, 300, 105695. [CrossRef]
- Asanoma, K.; Liu, G.; Yamane, T.; Miyanari, Y.; Takao, T.; Yagi, H.; Ohgami, T.; Ichinoe, A.; Sonoda, K.; Wake, N.; et al. Regulation of the Mechanism of TWIST1 Transcription by BHLHE40 and BHLHE41 in Cancer Cells. Mol. Cell. Biol. 2015, 35, 4096–4109. [CrossRef]
- SEINO, H.; WU, Y.; MOROHASHI, S.; KAWAMOTO, T.; FUJIMOTO, K.; KATO, Y.; TAKAI, Y.; KIJIMA, H. Basic Helix-Loop-Helix Transcription Factor DEC1 Regulates the Cisplatin-Induced Apoptotic Pathway of Human Esophageal Cancer Cells. Biomed. Res. 2015, 36, 89. [CrossRef]
- Zheng, Y.; Shi, X.; Wang, M.; Jia, Y.; Li, B.; Zhang, Y.; Liu, Q.; Wang, Y. The Increased Expression of DEC1 Gene Is Related to HIF-1α Protein in Gastric Cancer Cell Lines. Mol. Biol. Rep. 2012, 39, 4229–4236. [CrossRef]
- Zheng, Y.; Jia, Y.; Wang, Y.; Wang, M.; Li, B.; Shi, X.; Ma, X.; Xiao, D.; Sun, Y. The Hypoxia-Regulated Transcription Factor DEC1 (Stra13, SHARP-2) and Its Expression in Gastric Cancer. OMICS A J. Integr. Biol. 2009, 13, 301–306. [CrossRef]
- Jia, Y.-F.; Xiao, D.-J.; Ma, X.-L.; Song, Y.-Y.; Hu, R.; Kong, Y.; Zheng, Y.; Han, S.-Y.; Hong, R.-L.; Wang, Y.-S. Differentiated Embryonic Chondrocyte-Expressed Gene 1 Is Associated with Hypoxia-Inducible Factor 1α and Ki67 in Human Gastric Cancer. Diagn. Pathol. 2013, 8, 37. [CrossRef]
- Li, X.-M.; Lin, W.; Wang, J.; Zhang, W.; Yin, A.-A.; Huang, Y.; Zhang, J.; Yao, L.; Bian, H.; Zhang, J.; et al. Dec1 Expression Predicts Prognosis and the Response to Temozolomide Chemotherapy in Patients with Glioma. Mol. Med. Rep. 2016, 14, 5626–5636. [CrossRef]
- Talasila, K.M.; Røsland, G.V.; Hagland, H.R.; Eskilsson, E.; Flønes, I.H.; Fritah, S.; Azuaje, F.; Atai, N.; Harter, P.N.; Mittelbronn, M.; et al. The Angiogenic Switch Leads to a Metabolic Shift in Human Glioblastoma. Neuro-Oncol. 2017, 19, 383–393. [CrossRef]
- Preusser, M.; Birner, P.; Ambros, I.M.; Ambros, P.F.; Budka, H.; Harris, A.L.; Hainfellner, J.A. DEC1 Expression in 1p-Aberrant Oligodendroglial Neoplasms. Histol. Histopathol. 2005, 20, 1173–1177. [CrossRef]
- Luan, X.; Zhao, Y.; Bu, N.; Chen, Y.; Chen, N. DEC1 Negatively Regulates CYP2B6 Expression by Binding to the CYP2B6 Promoter Region Ascribed to IL-6-Induced Downregulation of CYP2B6 Expression in HeLa Cells. Xenobiotica 2021, 51, 1343–1351. [CrossRef]
- Li, S.-M.H.; Liu, S.-T.; Chang, Y.-L.; Ho, C.-L.; Huang, S.-M. Metformin Causes Cancer Cell Death through Downregulation of P53-Dependent Differentiated Embryo Chondrocyte 1. J. Biomed. Sci. 2018, 25, 81. [CrossRef]
- Kunadirek, P.; Ariyachet, C.; Sriphoosanaphan, S.; Pinjaroen, N.; Sirichindakul, P.; Nookaew, I.; Chuaypen, N.; Tangkijvanich, P. Identification of BHLHE40 Expression in Peripheral Blood Mononuclear Cells as a Novel Biomarker for Diagnosis and Prognosis of Hepatocellular Carcinoma. Sci. Rep. 2021, 11, 11201. [CrossRef]
- MURAKAMI, K.; WU, Y.; IMAIZUMI, T.; AOKI, Y.; LIU, Q.; YAN, X.; SEINO, H.; YOSHIZAWA, T.; MOROHASHI, S.; KATO, Y.; et al. DEC1 Promotes Hypoxia-Induced Epithelial-Mesenchymal Transition (EMT) in Human Hepatocellular Carcinoma Cells. Biomed. Res. 2017, 38, 221–227. [CrossRef]
- Liu, Y.; Wang, L.; Lin, X.-Y.; Wang, J.; Yu, J.-H.; Miao, Y.; Wang, E.-H. The Transcription Factor DEC1 (BHLHE40/STRA13/SHARP-2) Is Negatively Associated with TNM Stage in Non-Small-Cell Lung Cancer and Inhibits the Proliferation through Cyclin D1 in A549 and BE1 Cells. Tumor Biol. 2013, 34, 1641–1650. [CrossRef]
- Yang, L.; Zeng, L.; Wang, Z.; Hu, X.; Xiong, H.; Zhang, T.; Chen, W.; Xia, K.; Su, T. Differentiated Embryo Chondrocyte 1, Induced by Hypoxia-Inducible Factor 1α, Promotes Cell Migration in Oral Squamous Cell Carcinoma Cell Lines. Oral Surg., Oral Med., Oral Pathol. Oral Radiol. 2022, 133, 199–206. [CrossRef]
- You, J.; Lin, L.; Liu, Q.; Zhu, T.; Xia, K.; Su, T. The Correlation between the Expression of Differentiated Embryo-Chondrocyte Expressed Gene l and Oral Squamous Cell Carcinoma. Eur. J. Méd. Res. 2014, 19, 21. [CrossRef]
- Qi, W.; Liu, Q.; Fu, W.; Shi, J.; Shi, M.; Duan, S.; Li, Z.; Song, S.; Wang, J.; Liu, Y. BHLHE40, a Potential Immune Therapy Target, Regulated by FGD5-AS1/miR-15a-5p in Pancreatic Cancer. Sci. Rep. 2023, 13, 16400. [CrossRef]
- Wang, L.; Liu, Y.; Dai, Y.; Tang, X.; Yin, T.; Wang, C.; Wang, T.; Dong, L.; Shi, M.; Qin, J.; et al. Single-Cell RNA-Seq Analysis Reveals BHLHE40-Driven pro-Tumour Neutrophils with Hyperactivated Glycolysis in Pancreatic Tumour Microenvironment. Gut 2023, 72, 958–971. [CrossRef]
- WU, Y.; SATO, F.; YAMADA, T.; BHAWAL, U.K.; KAWAMOTO, T.; FUJIMOTO, K.; NOSHIRO, M.; SEINO, H.; MOROHASHI, S.; HAKAMADA, K.; et al. The BHLH Transcription Factor DEC1 Plays an Important Role in the Epithelial-Mesenchymal Transition of Pancreatic Cancer. Int. J. Oncol. 2012, 41, 1337–1346. [CrossRef]
- Wang, W.; Reiser-Erkan, C.; Michalski, C.W.; Raggi, M.C.; Quan, L.; Yupei, Z.; Friess, H.; Erkan, M.; Kleeff, J. Hypoxia Inducible BHLHB2 Is a Novel and Independent Prognostic Marker in Pancreatic Ductal Adenocarcinoma. Biochem. Biophys. Res. Commun. 2010, 401, 422–428. [CrossRef]
- Yoon, D.Y.; Buchler, P.; Saarikoski, S.T.; Hines, O.J.; Reber, H.A.; Hankinson, O. Identification of Genes Differentially Induced by Hypoxia in Pancreatic Cancer Cells. Biochem. Biophys. Res. Commun. 2001, 288, 882–886. [CrossRef]
- Wang, D.; Tang, X.; Liang, Q.; Zeng, X.; Yang, J.; Xu, J. microRNA-599 Promotes Apoptosis and Represses Proliferation and Epithelial-mesenchymal Transition of Papillary Thyroid Carcinoma Cells via Downregulation of Hey2-depentent Notch Signaling Pathway. J. Cell. Physiol. 2020, 235, 2492–2505. [CrossRef]
- Forghanifard, M.M.; Taleb, S.; Abbaszadegan, M.R. Notch Signaling Target Genes Are Directly Correlated to Esophageal Squamous Cell Carcinoma Tumorigenesis. Pathol. Oncol. Res. 2015, 21, 463–467. [CrossRef]
- Cheng, D.; Bao, C.; Zhang, X.; Lin, X.; Huang, H.; Zhao, L. LncRNA PRNCR1 Interacts with HEY2 to Abolish miR-448-Mediated Growth Inhibition in Non-Small Cell Lung Cancer. Biomed. Pharmacother. 2018, 107, 1540–1547. [CrossRef]
- Kanno, K.; Ishiura, S. Differential Effects of the HESR/HEY Transcription Factor Family on Dopamine Transporter Reporter Gene Expression via Variable Number of Tandem Repeats. J. Neurosci. Res. 2011, 89, 562–575. [CrossRef]
- Fahim, Y.; Yousefi, M.; Izadpanah, M.H.; Forghanifard, M.M. TWIST1 Correlates with Notch Signaling Pathway to Develop Esophageal Squamous Cell Carcinoma. Mol. Cell. Biochem. 2020, 474, 181–188. [CrossRef]
- Wu, M.; Hu, L.; He, L.; Yuan, L.; Yang, L.; Zhao, B.; Zhang, L.; He, X. The Tumor Suppressor NF2 Modulates TEAD4 Stability and Activity in Hippo Signaling via Direct Interaction. J. Biol. Chem. 2024, 300, 107212. [CrossRef]
- Zhang, B.; Wang, Q.; Ji, Y.; Zhang, X.; Xue, L.; Shi, Q.; Li, J. TEAD4 Overexpression Suppresses Thyroid Cancer Progression and Metastasis in Vitro by Modulating Wnt Signaling. J. Biosci. 2022, 47, 3. [CrossRef]
- Liu, M.; Hu, W.; Meng, X.; Wang, B. TEAD4: A Key Regulator of Tumor Metastasis and Chemoresistance - Mechanisms and Therapeutic Implications. Biochim. Biophys. Acta (BBA) - Rev. Cancer 2024, 1879, 189050. [CrossRef]
- Wang, J.; Shen, C.; Zhang, J.; Zhang, Y.; Liang, Z.; Niu, H.; Wang, Y.; Yang, X. TEAD4 Is an Immune Regulating-Related Prognostic Biomarker for Bladder Cancer and Possesses Generalization Value in Pan-Cancer. DNA Cell Biol. 2021, 40, 798–810. [CrossRef]
- Zhu, C.; Li, L.; Zhang, Z.; Bi, M.; Wang, H.; Su, W.; Hernandez, K.; Liu, P.; Chen, J.; Chen, M.; et al. A Non-Canonical Role of YAP/TEAD Is Required for Activation of Estrogen-Regulated Enhancers in Breast Cancer. Mol. Cell 2019, 75, 791-806.e8. [CrossRef]
- Suzuki, M.; Kondo, A.; Ogino, I.; Arai, H.; Tomita, T.; Sredni, S.T. Overexpression of TEAD4 in Atypical Teratoid/Rhabdoid Tumor: New Insight to the Pathophysiology of an Aggressive Brain Tumor. Pediatr. Blood Cancer 2017, 64, e26398. [CrossRef]
- Li, F.; Wang, X.; Zhang, J.; Zhang, J.; Jing, X.; Jiang, Q.; Zhou, J.; Cao, L.; Peng, H.; Tong, D.; et al. RBM8A, a New Target of TEAD4, Promotes Breast Cancer Progression by Regulating IGF1R and IRS-2. J. Transl. Med. 2024, 22, 823. [CrossRef]
- He, L.; Yuan, L.; Sun, Y.; Wang, P.; Zhang, H.; Feng, X.; Wang, Z.; Zhang, W.; Yang, C.; Zeng, Y.A.; et al. Glucocorticoid Receptor Signaling Activates TEAD4 to Promote Breast Cancer Progression. Cancer Res. 2019, 79, 4399–4411. [CrossRef]
- Wang, C.; Nie, Z.; Zhou, Z.; Zhang, H.; Liu, R.; Wu, J.; Qin, J.; Ma, Y.; Chen, L.; Li, S.; et al. The Interplay between TEAD4 and KLF5 Promotes Breast Cancer Partially through Inhibiting the Transcription of p27Kip1. Oncotarget 2015, 6, 17685–17697. [CrossRef]
- Mori, S.; Takeuchi, T.; Ishii, Y.; Yugawa, T.; Kiyono, T.; Nishina, H.; Kukimoto, I. Human Papillomavirus 16 E6 Upregulates APOBEC3B via the TEAD Transcription Factor. J. Virol. 2017, 91, 10.1128/jvi.02413-16. [CrossRef]
- Li, Q.; Tong, D.; Jing, X.; Ma, P.; Li, F.; Jiang, Q.; Zhang, J.; Wen, H.; Cui, M.; Huang, C.; et al. MAD2L1 Is Transcriptionally Regulated by TEAD4 and Promotes Cell Proliferation and Migration in Colorectal Cancer. Cancer Gene Ther. 2023, 30, 727–737. [CrossRef]
- Song, J.; Dang, X.; Shen, X.; Liu, Y.; Gu, J.; Peng, X.; Huang, Z.; Hong, W.; Cui, L.; Liu, C.-Y. The YAP–TEAD4 Complex Promotes Tumor Lymphangiogenesis by Transcriptionally Upregulating CCBE1 in Colorectal Cancer. J. Biol. Chem. 2023, 299, 103012. [CrossRef]
- Guo, Y.; Zhu, Z.; Huang, Z.; Cui, L.; Yu, W.; Hong, W.; Zhou, Z.; Du, P.; Liu, C.-Y. CK2-Induced Cooperation of HHEX with the YAP-TEAD4 Complex Promotes Colorectal Tumorigenesis. Nat. Commun. 2022, 13, 4995. [CrossRef]
- Tang, J.-Y.; Yu, C.-Y.; Bao, Y.-J.; Chen, L.; Chen, J.; Yang, S.-L.; Chen, H.-Y.; Hong, J.; Fang, J.-Y. TEAD4 Promotes Colorectal Tumorigenesis via Transcriptionally Targeting YAP1. Cell Cycle 2018, 17, 102–109. [CrossRef]
- Liu, Y.; Wang, G.; Liang, Z.; Mei, Z.; Wu, T.; Cui, A.; Liu, C.; Cui, L. Lysyl Oxidase: A Colorectal Cancer Biomarker of Lung and Hepatic Metastasis. Thorac. Cancer 2018, 9, 785–793. [CrossRef]
- Liu, Y.; Wang, G.; Yang, Y.; Mei, Z.; Liang, Z.; Cui, A.; Wu, T.; Liu, C.-Y.; Cui, L. Increased TEAD4 Expression and Nuclear Localization in Colorectal Cancer Promote Epithelial–Mesenchymal Transition and Metastasis in a YAP-Independent Manner. Oncogene 2016, 35, 2789–2800. [CrossRef]
- Yuan, H.; Liu, H.; Liu, Z.; Zhu, D.; Amos, C.I.; Fang, S.; Lee, J.E.; Wei, Q. Genetic Variants in Hippo Pathway Genes YAP1, TEAD1 and TEAD4 Are Associated with Melanoma-specific Survival. Int. J. Cancer 2015, 137, 638–645. [CrossRef]
- He, S.; Zhang, H.; Xiao, Z.; Bhushan, S.; Gao, K.; Wang, W. The Interaction of TEA Domain Transcription Factor 4 (TEAD4) and Yes-Associated Protein 1 (YAP1) Promoted the Malignant Process Mediated by Serum/Glucocorticoid Regulated Kinase 1 (SGK1). Bioengineered 2021, 12, 601–614. [CrossRef]
- Li, Y.; Zhu, X.; Yang, M.; Wang, Y.; Li, J.; Fang, J.; Guo, W.; Ma, S.; Guan, F. YAP/TEAD4-induced KIF4A Contributes to the Progression and Worse Prognosis of Esophageal Squamous Cell Carcinoma. Mol. Carcinog. 2021, 60, 440–454. [CrossRef]
- Geng, H.; Liu, G.; Hu, J.; Li, J.; Wang, D.; Zou, S.; Xu, X. HOXB13 Suppresses Proliferation, Migration and Invasion, and Promotes Apoptosis of Gastric Cancer Cells through Transcriptional Activation of VGLL4 to Inhibit the Involvement of TEAD4 in the Hippo Signaling Pathway. Mol. Med. Rep. 2021, 24, 722. [CrossRef]
- Im, J.-Y.; Kim, D.-M.; Park, H.; Kang, M.-J.; Kim, D.-Y.; Chang, K.Y.; Kim, B.-K.; Won, M. VGLL1 Phosphorylation and Activation Promotes Gastric Cancer Malignancy via TGF-β/ERK/RSK2 Signaling. Biochim. Biophys. Acta (BBA) - Mol. Cell Res. 2021, 1868, 118892. [CrossRef]
- Shuai, Y.; Ma, Z.; Liu, W.; Yu, T.; Yan, C.; Jiang, H.; Tian, S.; Xu, T.; Shu, Y. TEAD4 Modulated LncRNA MNX1-AS1 Contributes to Gastric Cancer Progression Partly through Suppressing BTG2 and Activating BCL2. Mol. Cancer 2020, 19, 6. [CrossRef]
- Teng, K.; Deng, C.; Xu, J.; Men, Q.; Lei, T.; Di, D.; Liu, T.; Li, W.; Liu, X. Nuclear Localization of TEF3-1 Promotes Cell Cycle Progression and Angiogenesis in Cancer. Oncotarget 2016, 7, 13827–13841. [CrossRef]
- Zhou, Y.; Huang, T.; Zhang, J.; Wong, C.C.; Zhang, B.; Dong, Y.; Wu, F.; Tong, J.H.M.; Wu, W.K.K.; Cheng, A.S.L.; et al. TEAD1/4 Exerts Oncogenic Role and Is Negatively Regulated by miR-4269 in Gastric Tumorigenesis. Oncogene 2017, 36, 6518–6530. [CrossRef]
- Lim, B.; Park, J.-L.; Kim, H.-J.; Park, Y.-K.; Kim, J.-H.; Sohn, H.A.; Noh, S.-M.; Song, K.-S.; Kim, W.-H.; Kim, Y.S.; et al. Integrative Genomics Analysis Reveals the Multilevel Dysregulation and Oncogenic Characteristics of TEAD4 in Gastric Cancer. Carcinogenesis 2014, 35, 1020–1027. [CrossRef]
- Meng, J.-R.; Tang, H.-Z.; Zhou, K.-Z.; Shen, W.-H.; Guo, H.-Y. TFF3 and Survivin Expressions Associate with a Lower Survival Rate in Gastric Cancer. Clin. Exp. Med. 2013, 13, 297–303. [CrossRef]
- Luo, W.; Li, Y.; Zeng, Y.; Li, Y.; Cheng, M.; Zhang, C.; Li, F.; Wu, Y.; Huang, C.; Yang, X.; et al. Tea Domain Transcription Factor TEAD4 Mitigates TGF-β Signaling and Hepatocellular Carcinoma Progression Independently of YAP. J. Mol. Cell Biol. 2023, 15, mjad010. [CrossRef]
- Cai, J.; Chen, T.; Jiang, Z.; Yan, J.; Ye, Z.; Ruan, Y.; Tao, L.; Shen, Z.; Liang, X.; Wang, Y.; et al. Bulk and Single-Cell Transcriptome Profiling Reveal Extracellular Matrix Mechanical Regulation of Lipid Metabolism Reprograming through YAP/TEAD4/ACADL Axis in Hepatocellular Carcinoma. Int. J. Biol. Sci. 2023, 19, 2114–2131. [CrossRef]
- Tsinias, G.; Nikou, S.; Mastronikolis, N.; Bravou, V.; Papadaki, H. Expression and Prognostic Significance of YAP, TAZ, TEAD4 and P73 in Human Laryngeal Cancer. Histol. Histopathol. 2020, 35, 983–995. [CrossRef]
- Hu, Y.; Mu, H.; Deng, Z. The Transcription Factor TEAD4 Enhances Lung Adenocarcinoma Progression through Enhancing PKM2 Mediated Glycolysis. Cell Biol. Int. 2021, 45, 2063–2073. [CrossRef]
- Zhang, Q.; Fan, H.; Zou, Q.; Liu, H.; Wan, B.; Zhu, S.; Hu, Y.; Li, H.; Zhang, C.; Zhou, L.; et al. TEAD4 Exerts Pro-metastatic Effects and Is Negatively Regulated by miR6839-3p in Lung Adenocarcinoma Progression. J. Cell. Mol. Med. 2018, 22, 3560–3571. [CrossRef]
- Park, M.A.; Lee, Y.H.; Gu, M.-J. High TEAD4 Expression Is Associated With Aggressive Clear Cell Renal Cell Carcinoma, Regardless of YAP1 Expression. Appl. Immunohistochem. Mol. Morphol. 2023, 31, 649–656. [CrossRef]
- Gu, C.; Huang, Z.; Chen, X.; Liu, C.; Rocco, G.; Zhao, S.; Xie, H.; Chen, J.; Dai, C.; Chen, C. TEAD4 Promotes Tumor Development in Patients with Lung Adenocarcinoma via ERK Signaling Pathway. Biochim. Biophys. Acta (BBA) - Mol. Basis Dis. 2020, 1866, 165921. [CrossRef]
- Ma, W.; Liu, N.; Zhuang, W.; Li, X.; Zhang, G.; Gan, W.; Guo, H. Clinical Features of Renal Cell Carcinoma Associated with Xp11.2 Translocation/TFE3 Gene Fusions-Single-Center Study. Natl. Méd. J. China 2018, 98, 3068–3073. [CrossRef]
- Xu, D.; Han, G.; Zhou, X.; Yong, H.; Jia, Y.; Zhao, F.; Shi, H. TEAD4 Activates PCSK9 to Promote Stomach Adenocarcinoma Cell Stemness through Fatty Acid Metabolism. Digestion 2024, 105, 243–256. [CrossRef]
- Tomás, G.; Tarabichi, M.; Gacquer, D.; Hébrant, A.; Dom, G.; Dumont, J.E.; Keutgen, X.; Fahey, T.J.; Maenhaut, C.; Detours, V. A General Method to Derive Robust Organ-Specific Gene Expression-Based Differentiation Indices: Application to Thyroid Cancer Diagnostic. Oncogene 2012, 31, 4490–4498. [CrossRef]
- Robinson, M.D.; Oshlack, A. A Scaling Normalization Method for Differential Expression Analysis of RNA-Seq Data. Genome Biol 2010, 11, R25. [CrossRef]
- Robinson, M.D.; McCarthy, D.J.; Smyth, G.K. edgeR: A Bioconductor Package for Differential Expression Analysis of Digital Gene Expression Data. Bioinformatics 2010, 26, 139–140. [CrossRef]
- Irizarry, R.A.; Hobbs, B.; Collin, F.; Barclay, Y.D.B.; Antonellis, K.J.; Scherf, U.; Speed, T.P. Exploration, Normalization, and Summaries of High Density Oligonucleotide Array Probe Level Data. Biostatistics 2003, 4, 249–264. [CrossRef]
- Kolberg, L.; Raudvere, U.; Kuzmin, I.; Vilo, J.; Peterson, H. Gprofiler2 -- an R Package for Gene List Functional Enrichment Analysis and Namespace Conversion Toolset g:Profiler. F1000Research 2020, 9, ELIXIR-709. [CrossRef]
- Ritchie, M.E.; Phipson, B.; Wu, D.; Hu, Y.; Law, C.W.; Shi, W.; Smyth, G.K. Limma Powers Differential Expression Analyses for RNA-Sequencing and Microarray Studies. Nucleic Acids Res 2015, 43, e47–e47. [CrossRef]
- Law, C.W.; Chen, Y.; Shi, W.; Smyth, G.K. Voom: Precision Weights Unlock Linear Model Analysis Tools for RNA-Seq Read Counts. Genome Biol 2014, 15, R29. [CrossRef]
- Lachmann, A.; Giorgi, F.M.; Lopez, G.; Califano, A. ARACNe-AP: Gene Network Reverse Engineering through Adaptive Partitioning Inference of Mutual Information. Bioinformatics 2016, 32, 2233–2235. [CrossRef]
- Lambert, S.A.; Jolma, A.; Campitelli, L.F.; Das, P.K.; Yin, Y.; Albu, M.; Chen, X.; Taipale, J.; Hughes, T.R.; Weirauch, M.T. The Human Transcription Factors. Cell 2018, 175, 598–599. [CrossRef]
- Won, S.; Morris, N.; Lu, Q.; Elston, R.C. Choosing an Optimal Method to Combine P-values. Stat. Med. 2009, 28, 1537–1553. [CrossRef]
- Dewey, M. Metap: Meta-Analysis of Significance Values. CRAN: Contrib. Packag. 2014. [CrossRef]
- Rauluseviciute, I.; Riudavets-Puig, R.; Blanc-Mathieu, R.; Castro-Mondragon, J.A.; Ferenc, K.; Kumar, V.; Lemma, R.B.; Lucas, J.; Chèneby, J.; Baranasic, D.; et al. JASPAR 2024: 20th Anniversary of the Open-Access Database of Transcription Factor Binding Profiles. Nucleic Acids Res. 2023, 52, D174–D182. [CrossRef]
- Sandelin, A.; Alkema, W.; Engström, P.; Wasserman, W.W.; Lenhard, B. JASPAR: An Open-access Database for Eukaryotic Transcription Factor Binding Profiles. Nucleic Acids Res. 2004, 32, D91–D94. [CrossRef]
- Castro-Mondragon, J.A.; Riudavets-Puig, R.; Rauluseviciute, I.; Lemma, R.B.; Turchi, L.; Blanc-Mathieu, R.; Lucas, J.; Boddie, P.; Khan, A.; Pérez, N.M.; et al. JASPAR 2022: The 9th Release of the Open-Access Database of Transcription Factor Binding Profiles. Nucleic Acids Res. 2021, 50, D165–D173. [CrossRef]
- Tan, G.; Lenhard, B. TFBSTools: An R/Bioconductor Package for Transcription Factor Binding Site Analysis. Bioinformatics 2016, 32, 1555–1556. [CrossRef]
- Fleiss, J. Review Papers : The Statistical Basis of Meta-Analysis. Stat. Methods Méd. Res. 1993, 2, 121–145. [CrossRef]
- Viechtbauer, W. Conducting Meta-Analyses in R with the Metafor Package. J. Stat. Softw. 2010, 36. [CrossRef]
- Liberzon, A.; Birger, C.; Thorvaldsdóttir, H.; Ghandi, M.; Mesirov, J.P.; Tamayo, P. The Molecular Signatures Database Hallmark Gene Set Collection. Cell Syst. 2015, 1, 417–425. [CrossRef]
Figure 1.
Meta–analysis volcano plot of transcriptional master regulators (TMRs). The volcano plot shows the mean normalized enrichment score (Mean NES, x–axis) versus the –log10 transformed Fisher’s combined p-value (y–axis) across TCGA and GEO datasets. Each point represents a transcription factor (TF). Vertical dashed lines indicate the cutoff for |Mean NES| > 1, and the horizontal dashed line marks a meta–adjusted p-value of 0.05. Grey points denote non-significant TFs, green points indicate those significant for mean NES only, and red points represent TFs significant for both mean NES and meta–adjusted p-value. Labels highlight selected significant TFs.
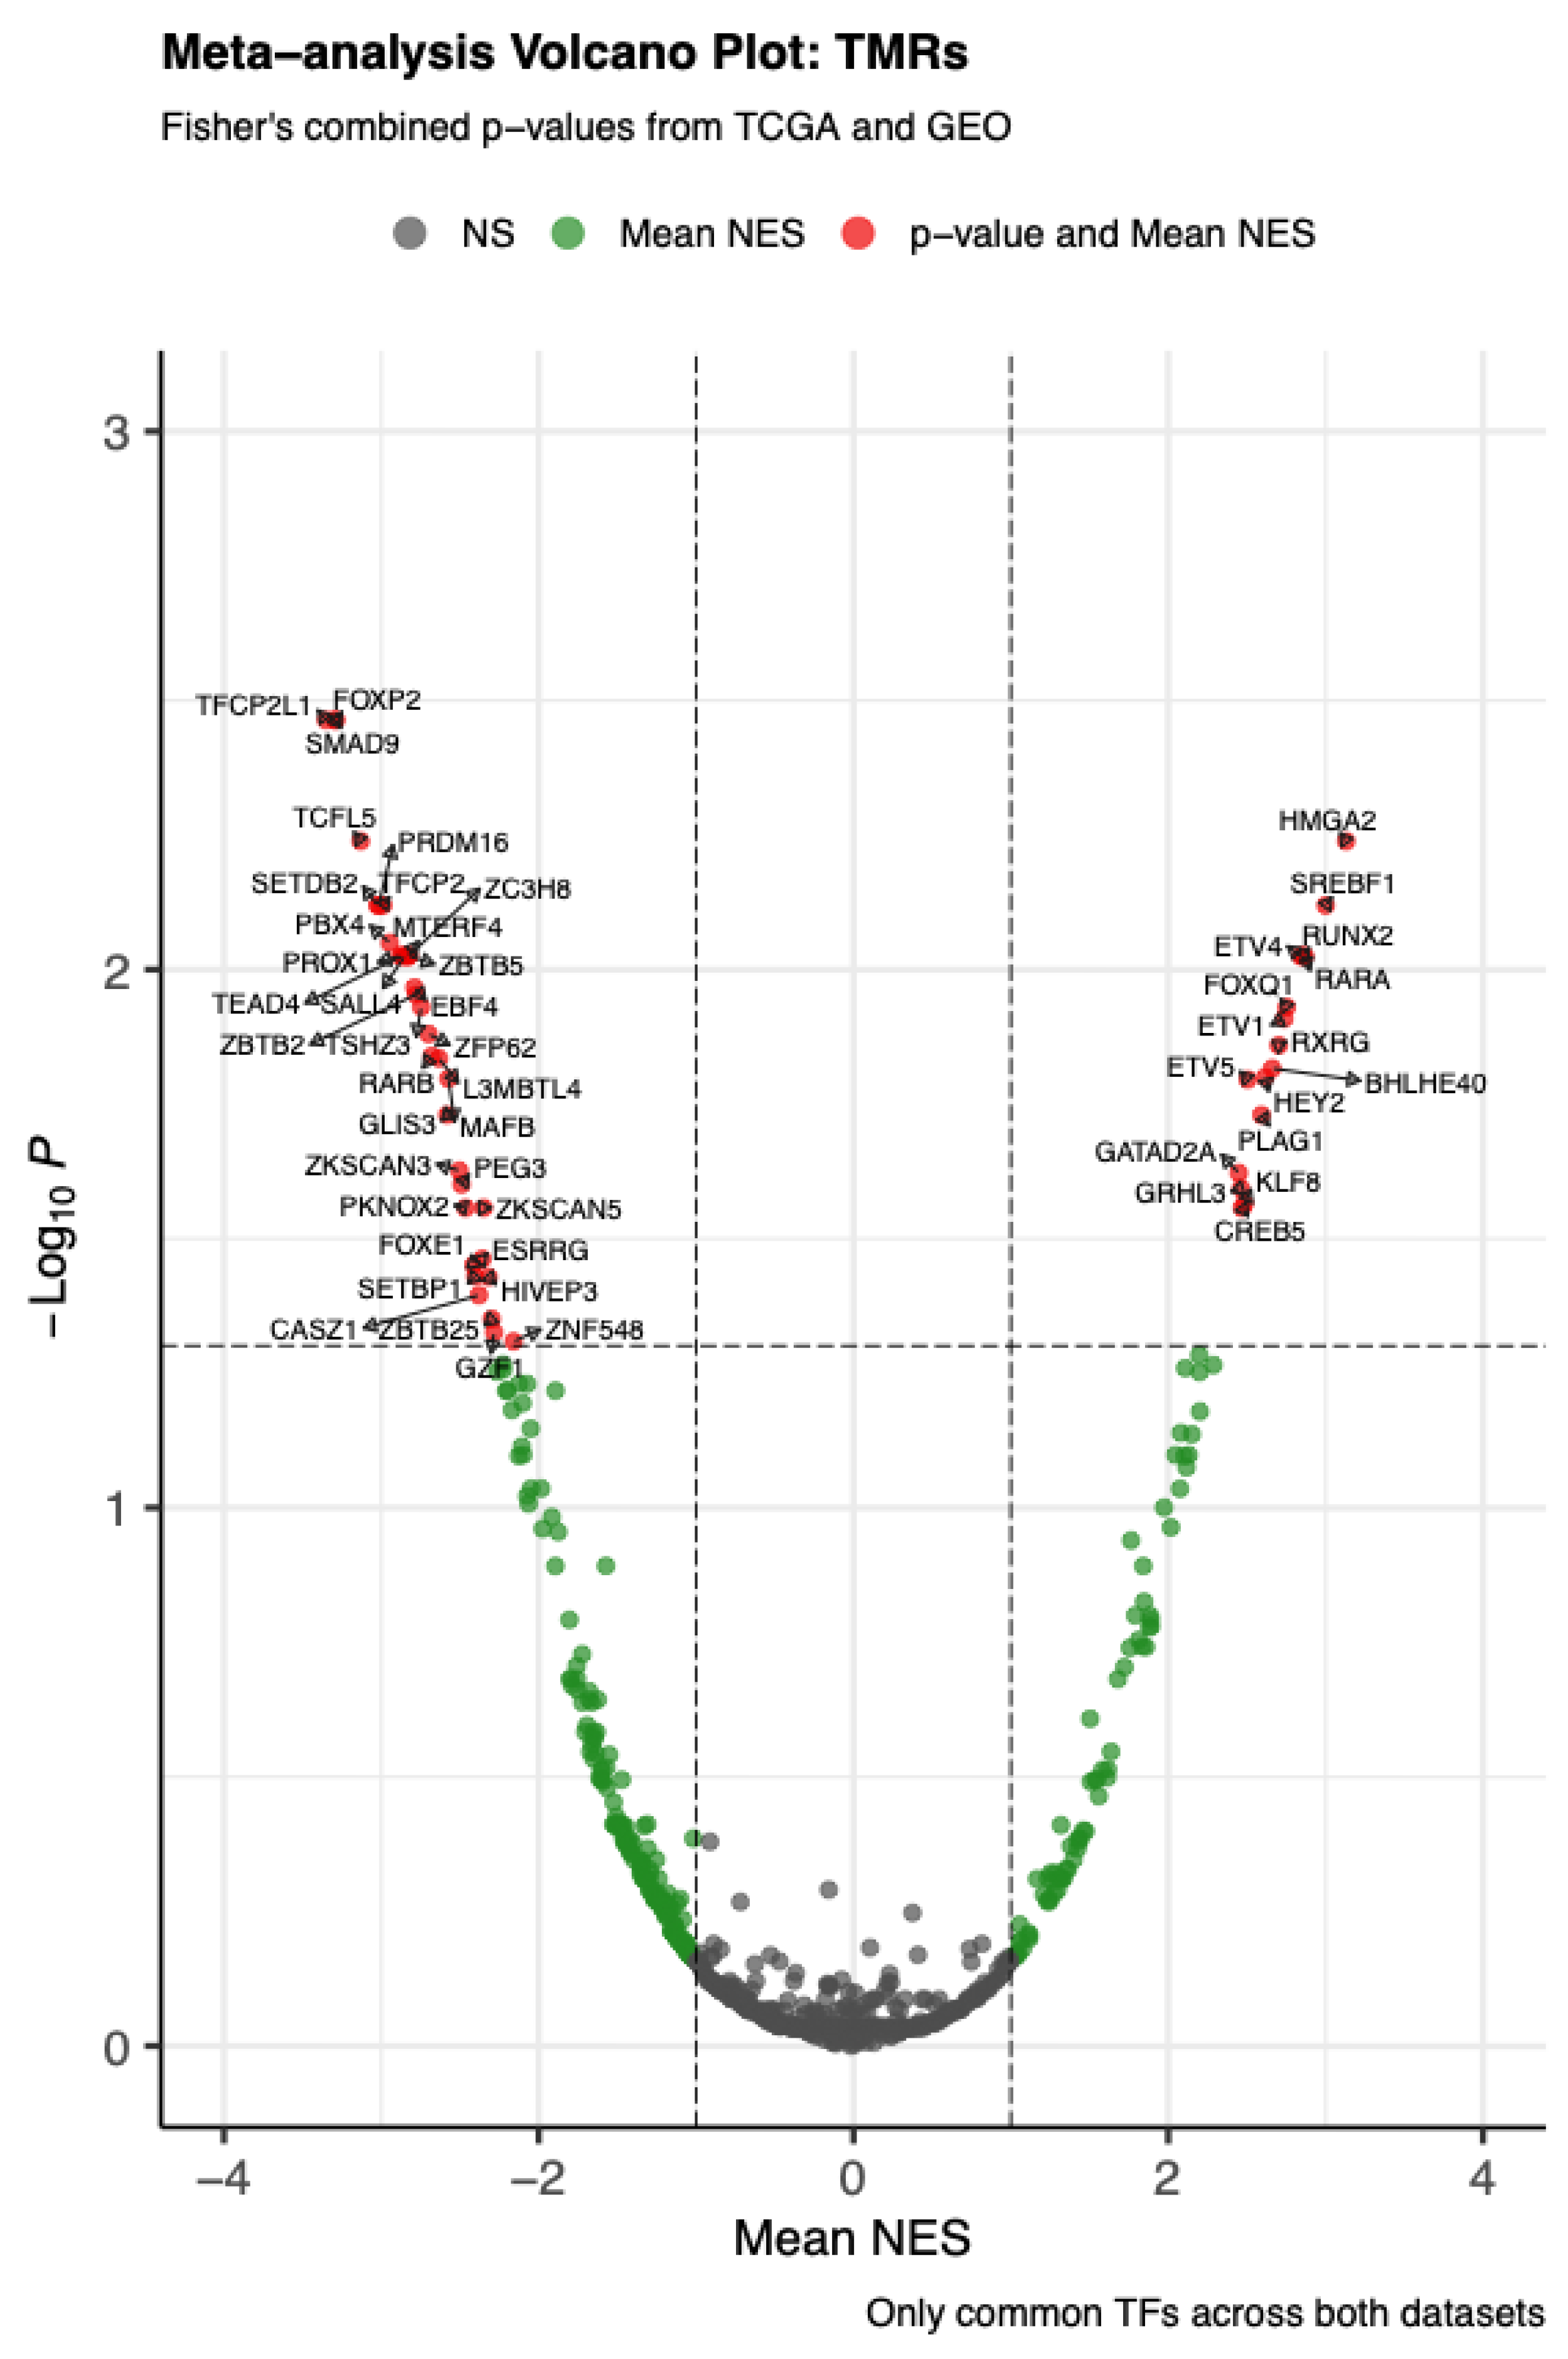
Figure 2.
Circos plot showing directional interactions among the 50 transcriptional master regulators identified in NOS-like thyroid cancer. Each arc represents a TMR, uniquely colored for easy visual identification. Outgoing links indicate predicted regulatory targets (arrows), while incoming links show regulators acting on that TMR. Arc halos demonstrate the consensus direction of differential expression across TCGA and GEO datasets (red = up-regulated, blue = down-regulated). Links are colored according to their originating TMR and weighted by motif support, with additional annotation indicating ARACNe mutual information support (thick, saturated = high support; thin, lighter = low support). Numbers in parentheses beside each TMR specify the number of outgoing versus incoming supported interactions (targets/regulators). This integrated visualization highlights candidate regulatory hubs and their coordinated activity in thyroid tumorigenesis.
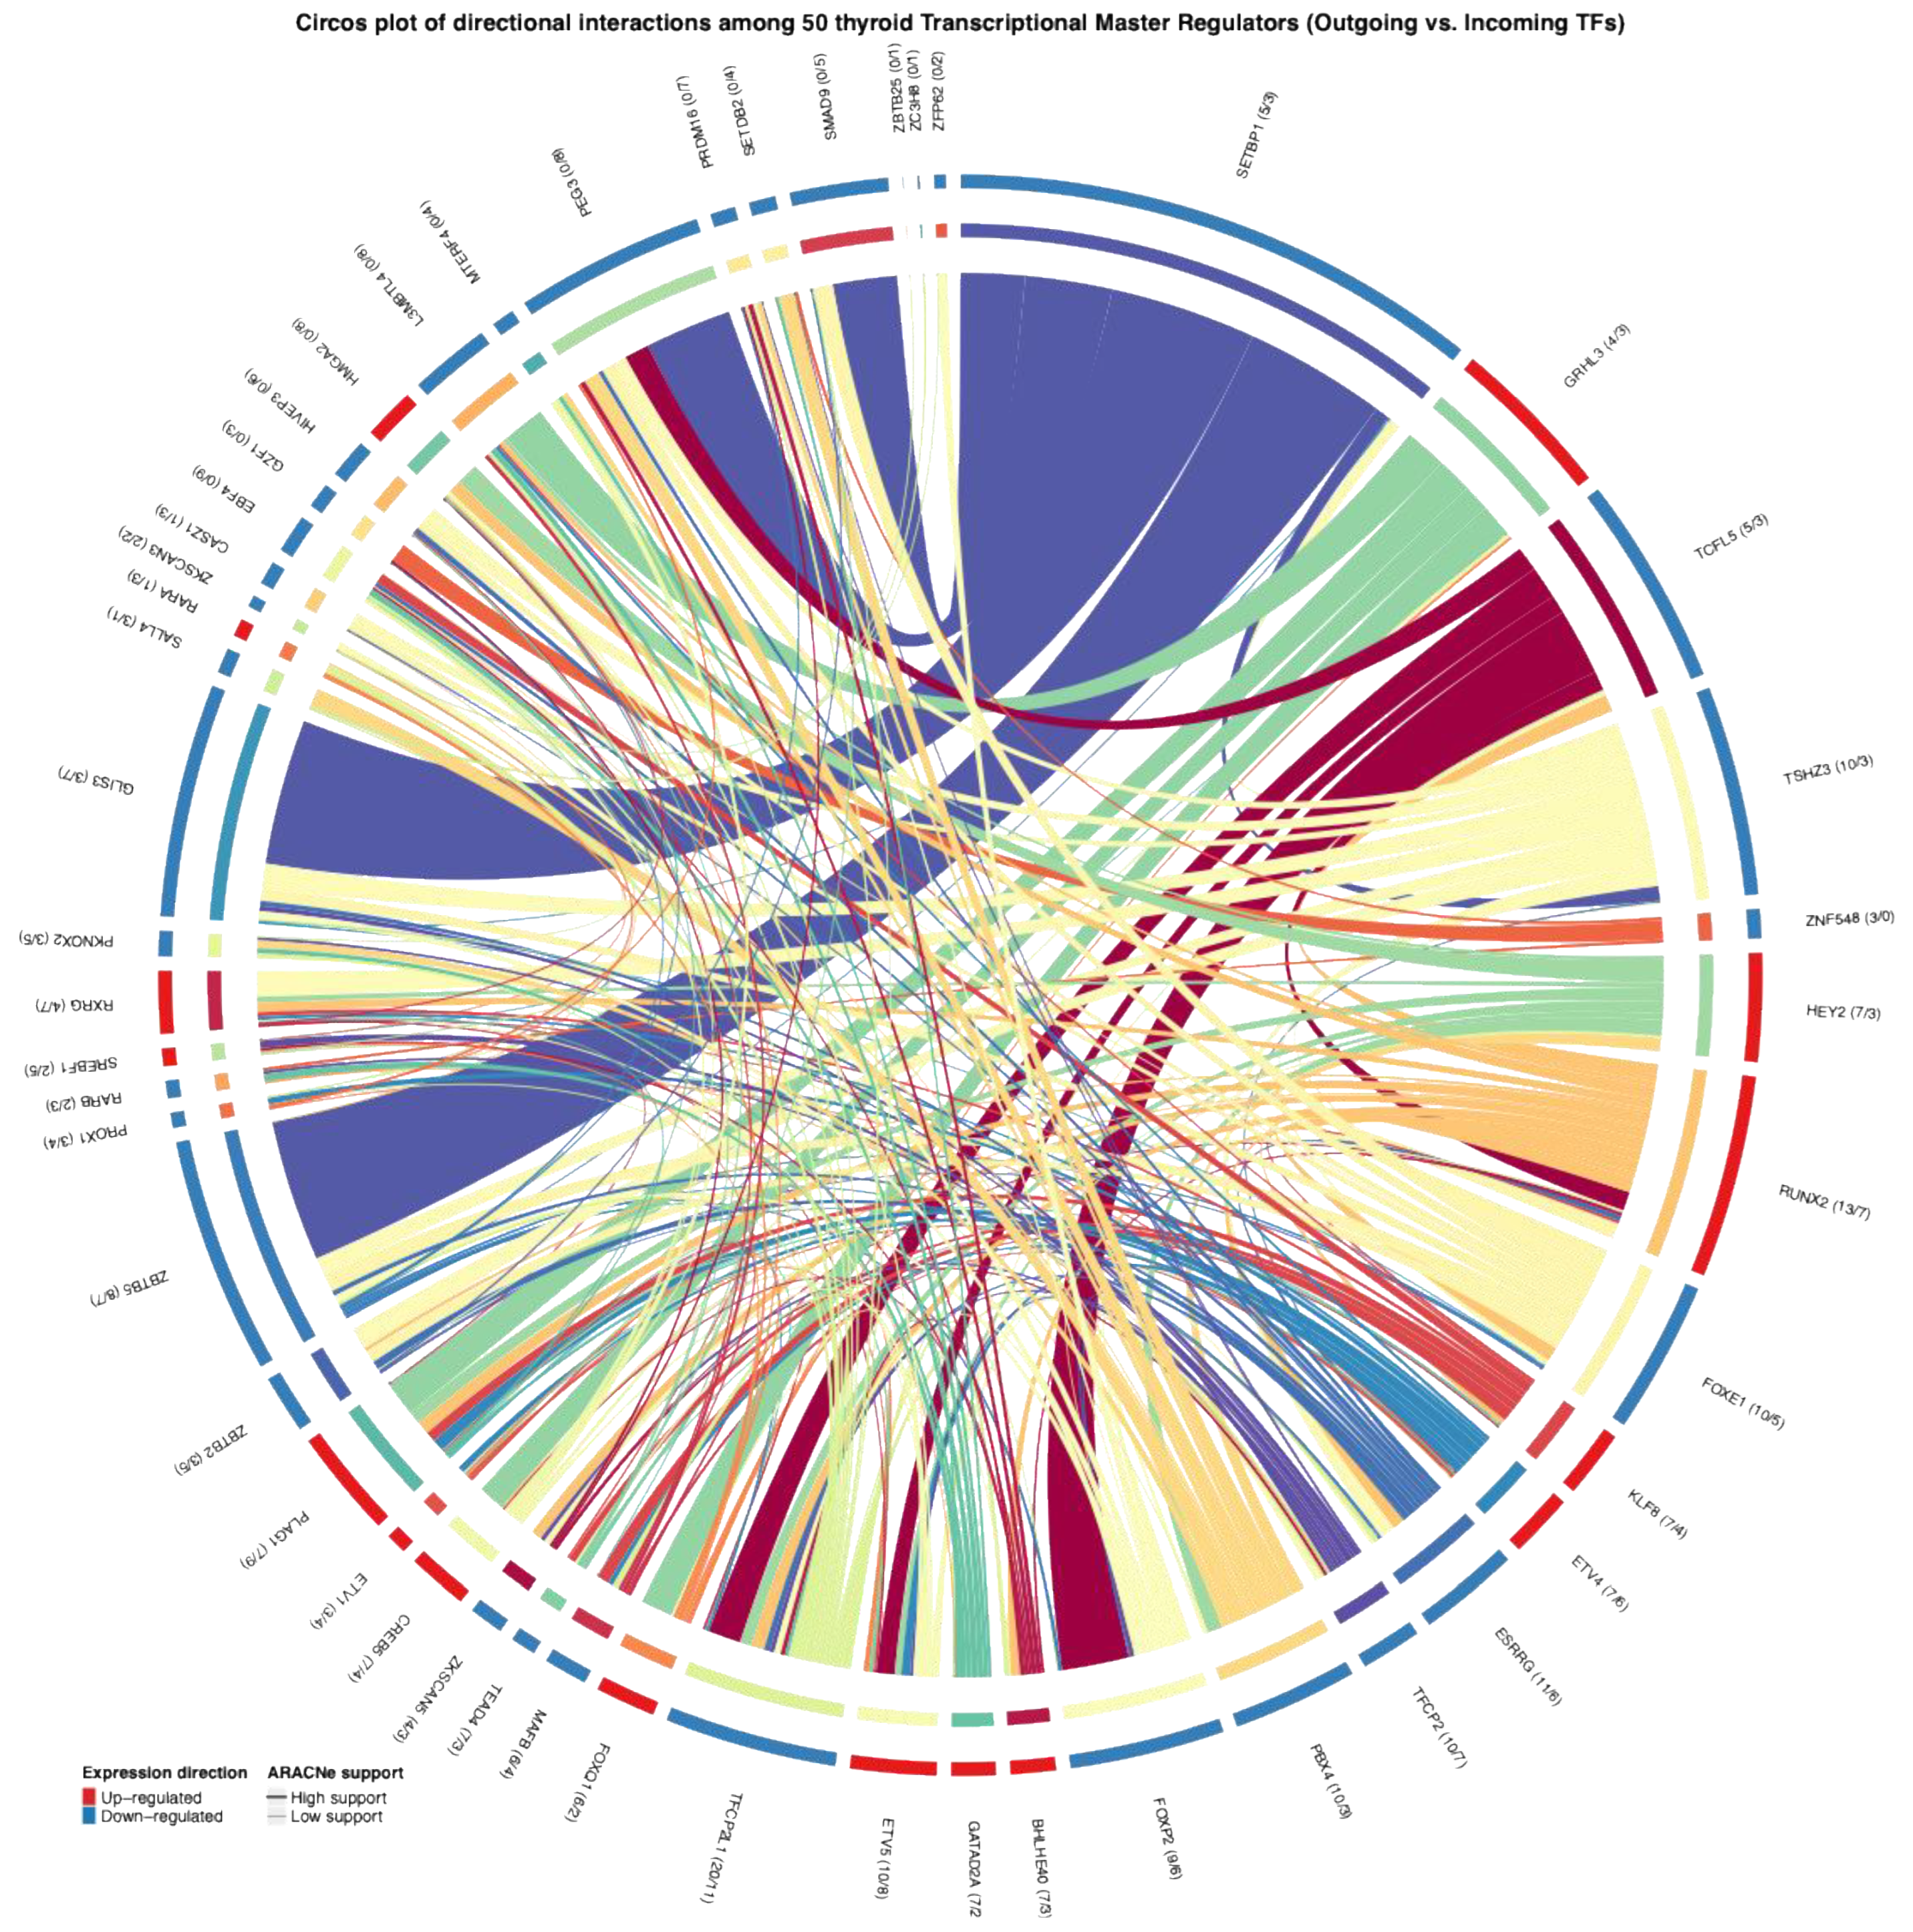
Figure 3.
Meta-analysis of functional enrichment across the combined targets of the 50 TMRs. Over-representation analysis (ORA) results for (a) KEGG pathways and (b) MSigDB Hallmarks. Only pathways significantly enriched in both datasets (GEO and TCGA) were retained, and p-values were combined using Fisher’s method followed by FDR correction. The x-axis represents the average fold enrichment across datasets, while color intensity indicates the –log₁₀ of the FDR-adjusted meta p-value. No significant enrichments were detected in Gene Ontology (GO) terms.
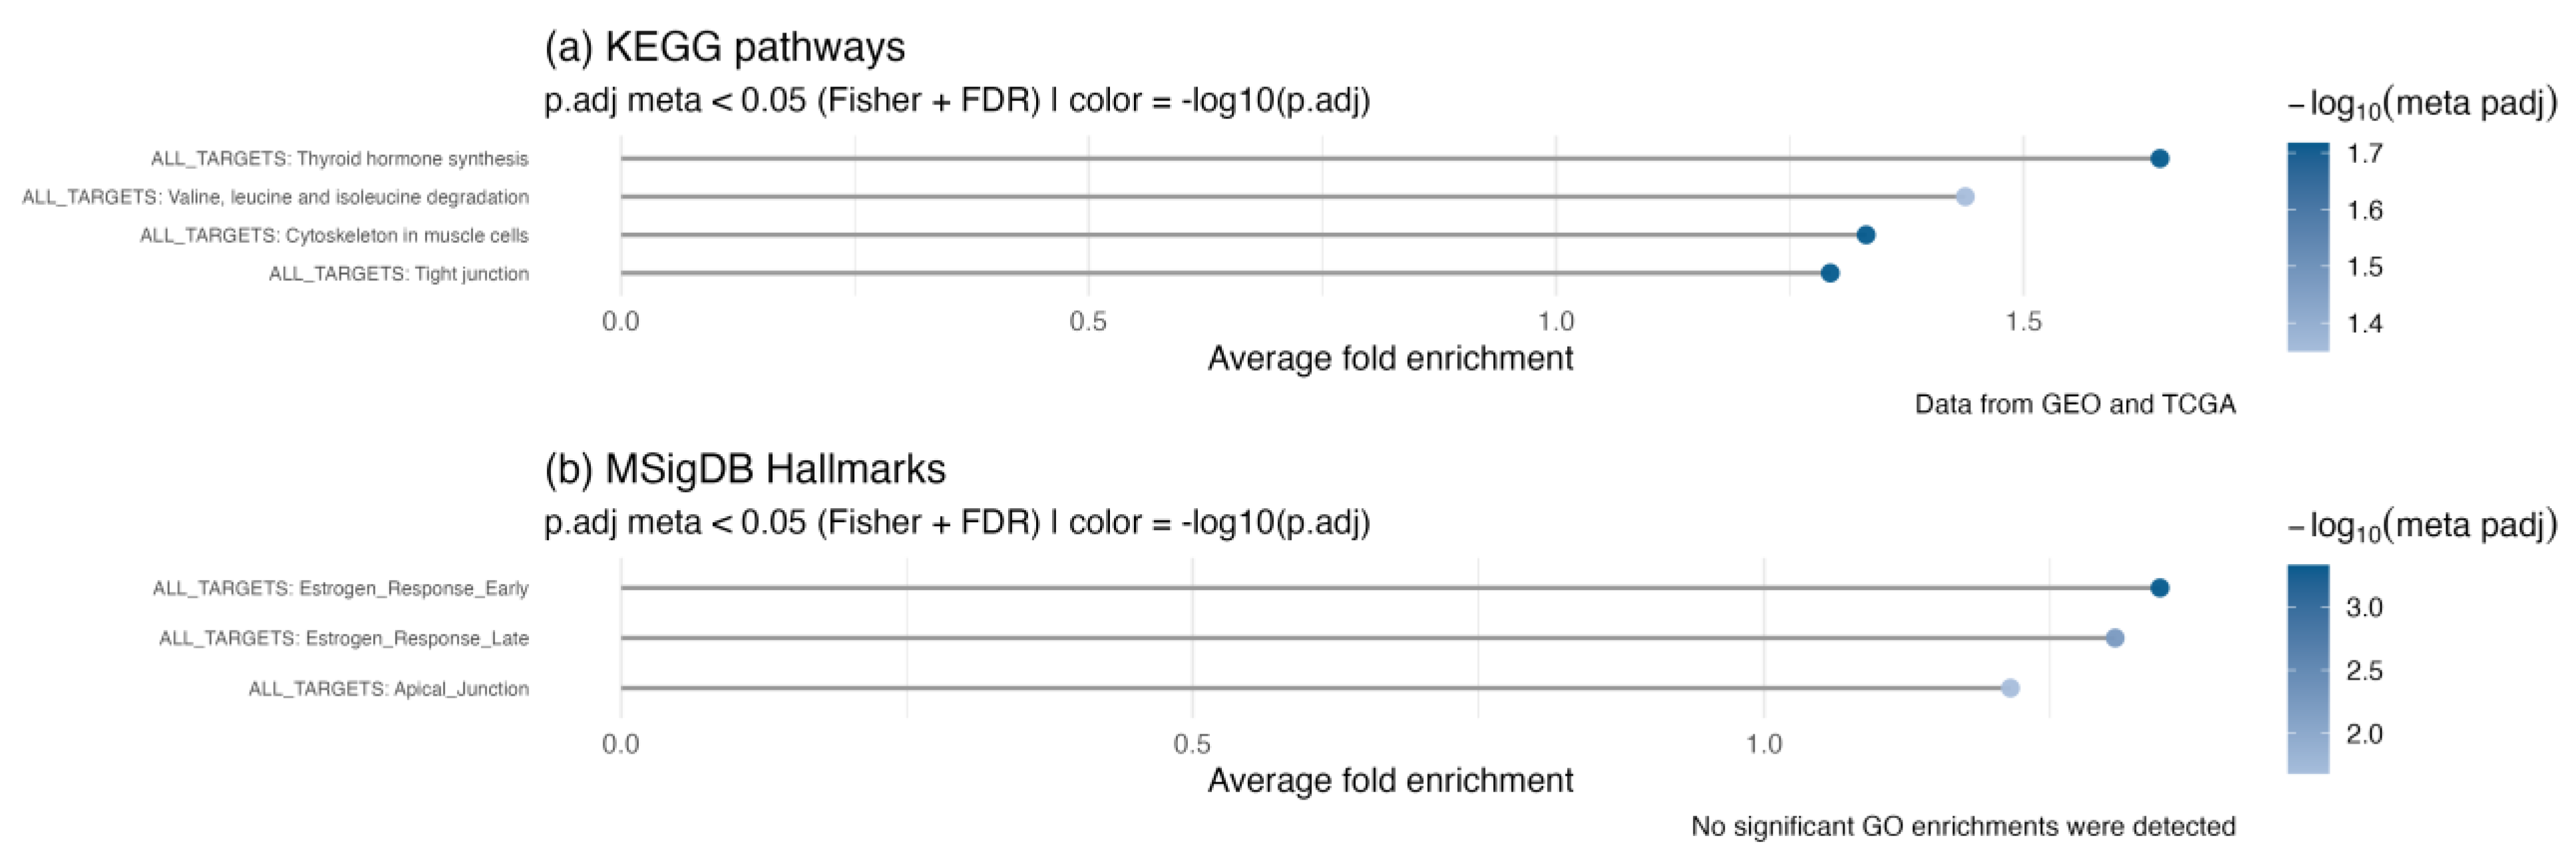
Figure 4.
Meta-analysis of functional enrichment across transcriptional master regulator (TMR) regulons. Panels show over-representation analysis (ORA) results for regulons identified in both TCGA and GEO datasets. (A) Hallmark gene sets reveal consistent enrichment in estrogen response, inflammatory, and epithelial–mesenchymal transition pathways. (B) KEGG pathways highlight signaling cascades such as TGF-β, TNF, and adipocytokine signaling, as well as immune processes including antigen presentation and cytokine interactions, and thyroid hormone synthesis. (C) Gene Ontology (GO) categories are primarily associated with RUNX2 regulons, including actin filament and extracellular matrix organization. The x-axis displays the average fold enrichment across datasets, point size represents |mean NES|, and color intensity reflects the –log₁₀ of the FDR-adjusted meta p-value (Fisher’s method, FDR < 0.05).
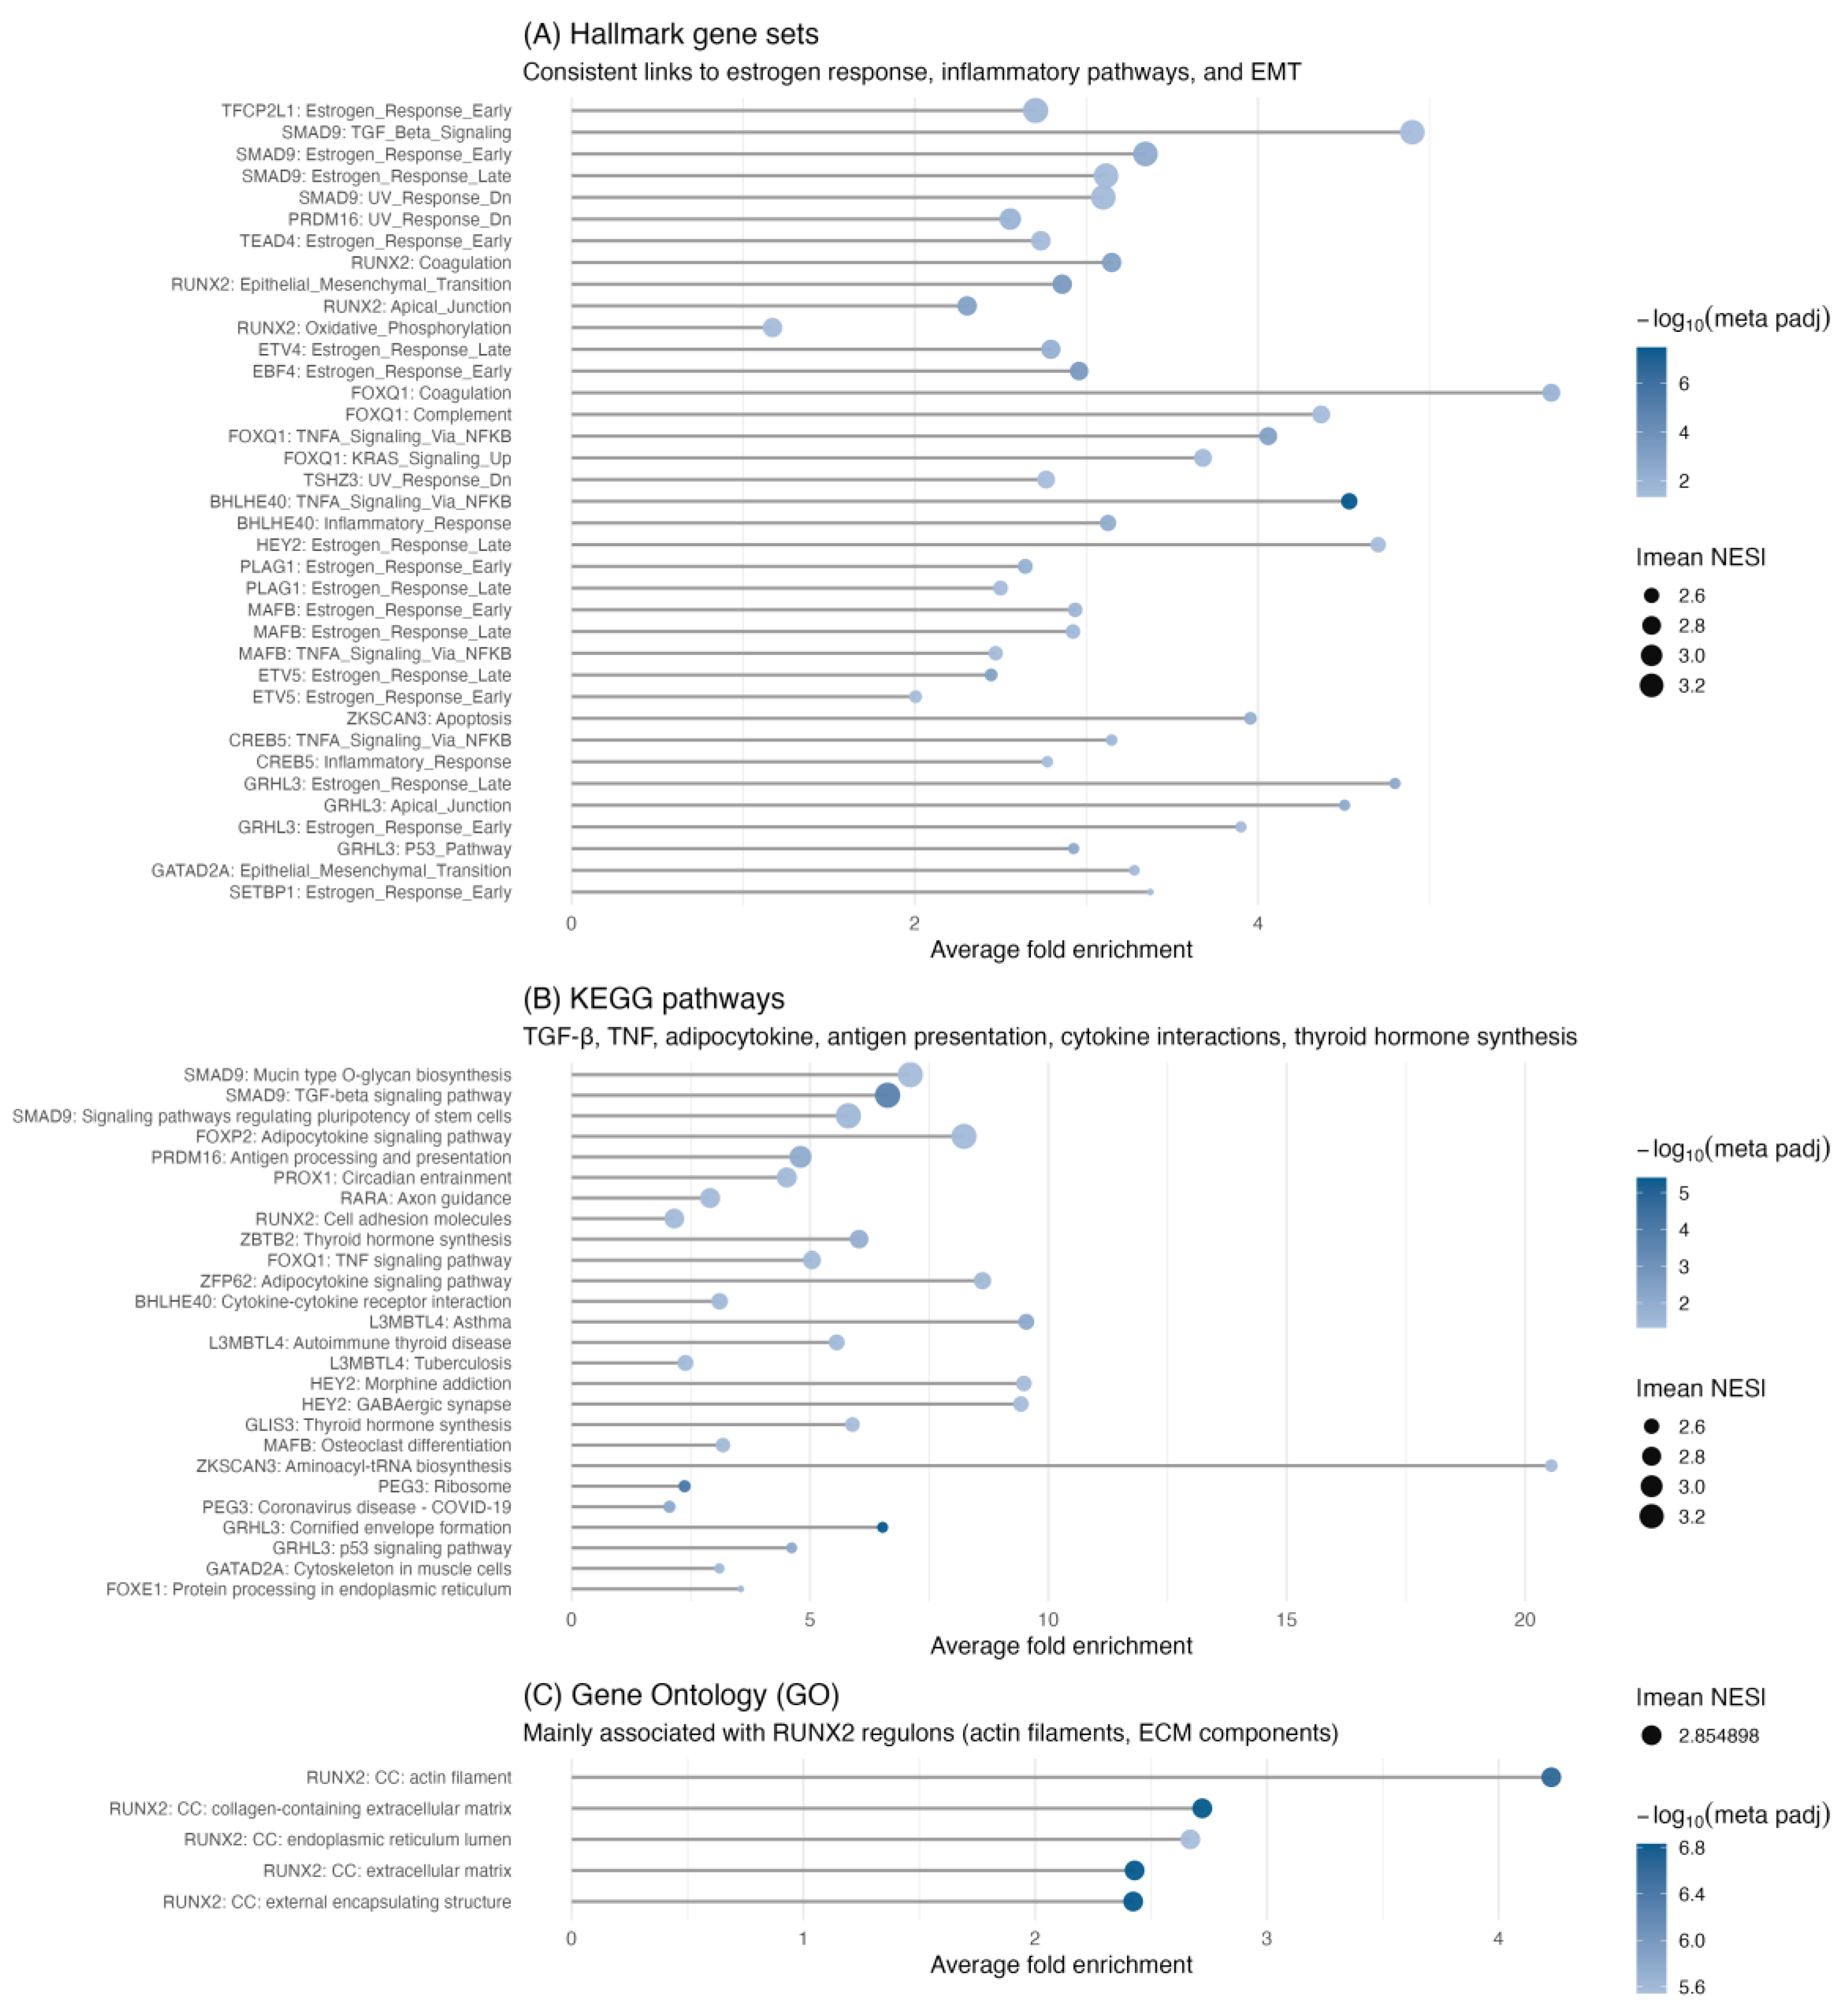
Figure 5.
Hallmark pathway enrichment across TMR regulons. Bubble-style upset-like heatmap showing the overlap between transcriptional master regulators (TMRs, y-axis) and enriched hallmark pathways (x-axis) identified by meta-analysis of over-representation analysis (ORA) across GEO and TCGA datasets. Bubble color represents the −log₁₀ of the meta-adjusted p-value, and bubble size indicates the mean normalized enrichment score (NES) of each TMR. Vertical bars indicate the number of hallmarks enriched per TMR, while horizontal bars represent the number of TMRs associated with each hallmark. Notably, the top four TMRs (SMAD9, RUNX2, GRHL3, and FOXQ1) collectively account for 11 out of 13 enriched hallmarks (~85%), suggesting that a limited subset of regulators drives most hallmark-associated transcriptional programs in thyroid cancer.
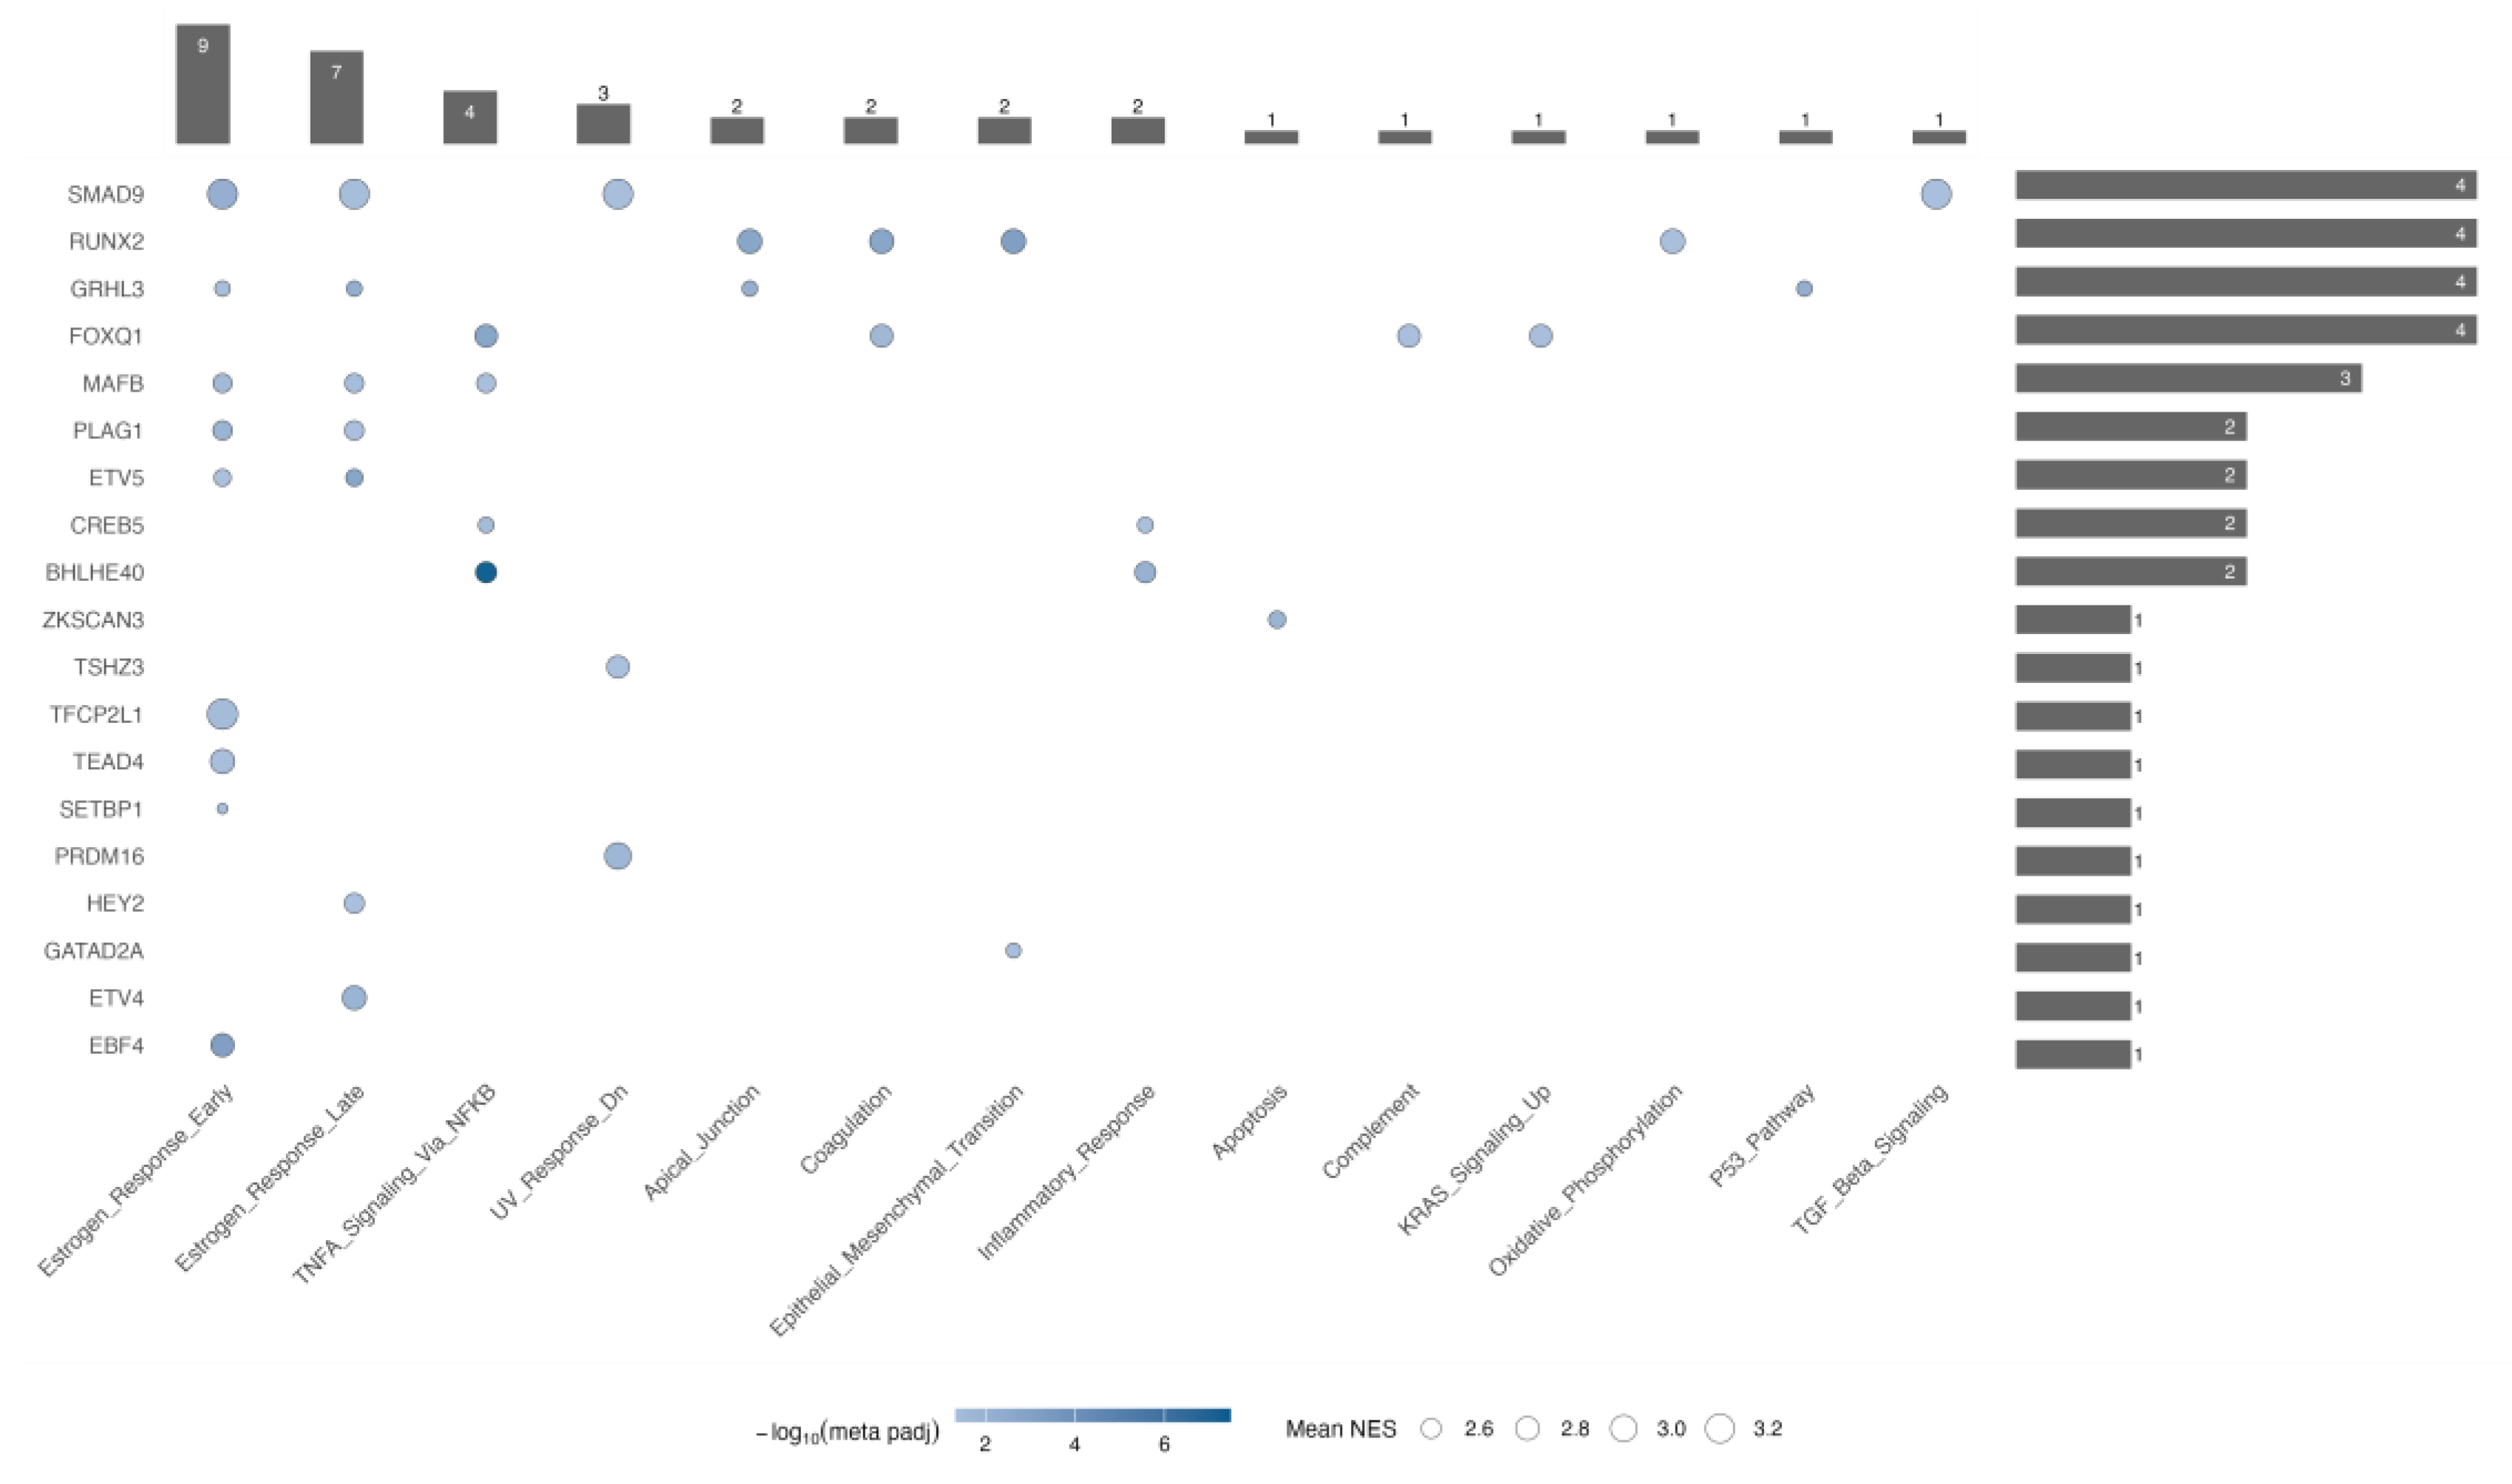
Figure 6.
Overview of the analytical pipeline to identify and validate Transcriptional Master Regulators (TMRs) in NOS-like thyroid cancer. (a) Gene-expression data from TCGA-THCA (Papillary adenocarcinoma, NOS) and an independent cohort (GSE33630, GEO) serve as inputs. (b) A transcriptional regulon network is inferred with ARACNe-AP using the curated human TF list from Lambert et al. (2018). (c) Master Regulator Analysis (MRA) is performed with VIPER, integrating a tumor-vs-normal expression signature and a permutation-based null model to score TF activity in each dataset. (d) In parallel, differential expression is computed with limma. (e) MRA outputs from both datasets are integrated by Fisher’s method to prioritize consensus TMRs shared across cohorts. (f) Over-representation analysis (ORA) is applied to TMR regulons in each cohort using KEGG pathways (left) and MSigDB Hallmarks (right), with the expressed-gene background as universe. (g) ORA results are meta-analyzed across cohorts (Fisher) and FDR-adjusted to highlight the most significant biological categories. (h) Regulatory plausibility is evaluated by promoter-motif analysis using JASPAR2022/TFBSTools; motif–target links are retained only when supported by ARACNe-inferred TF–target edges, integrating sequence evidence with network structure.
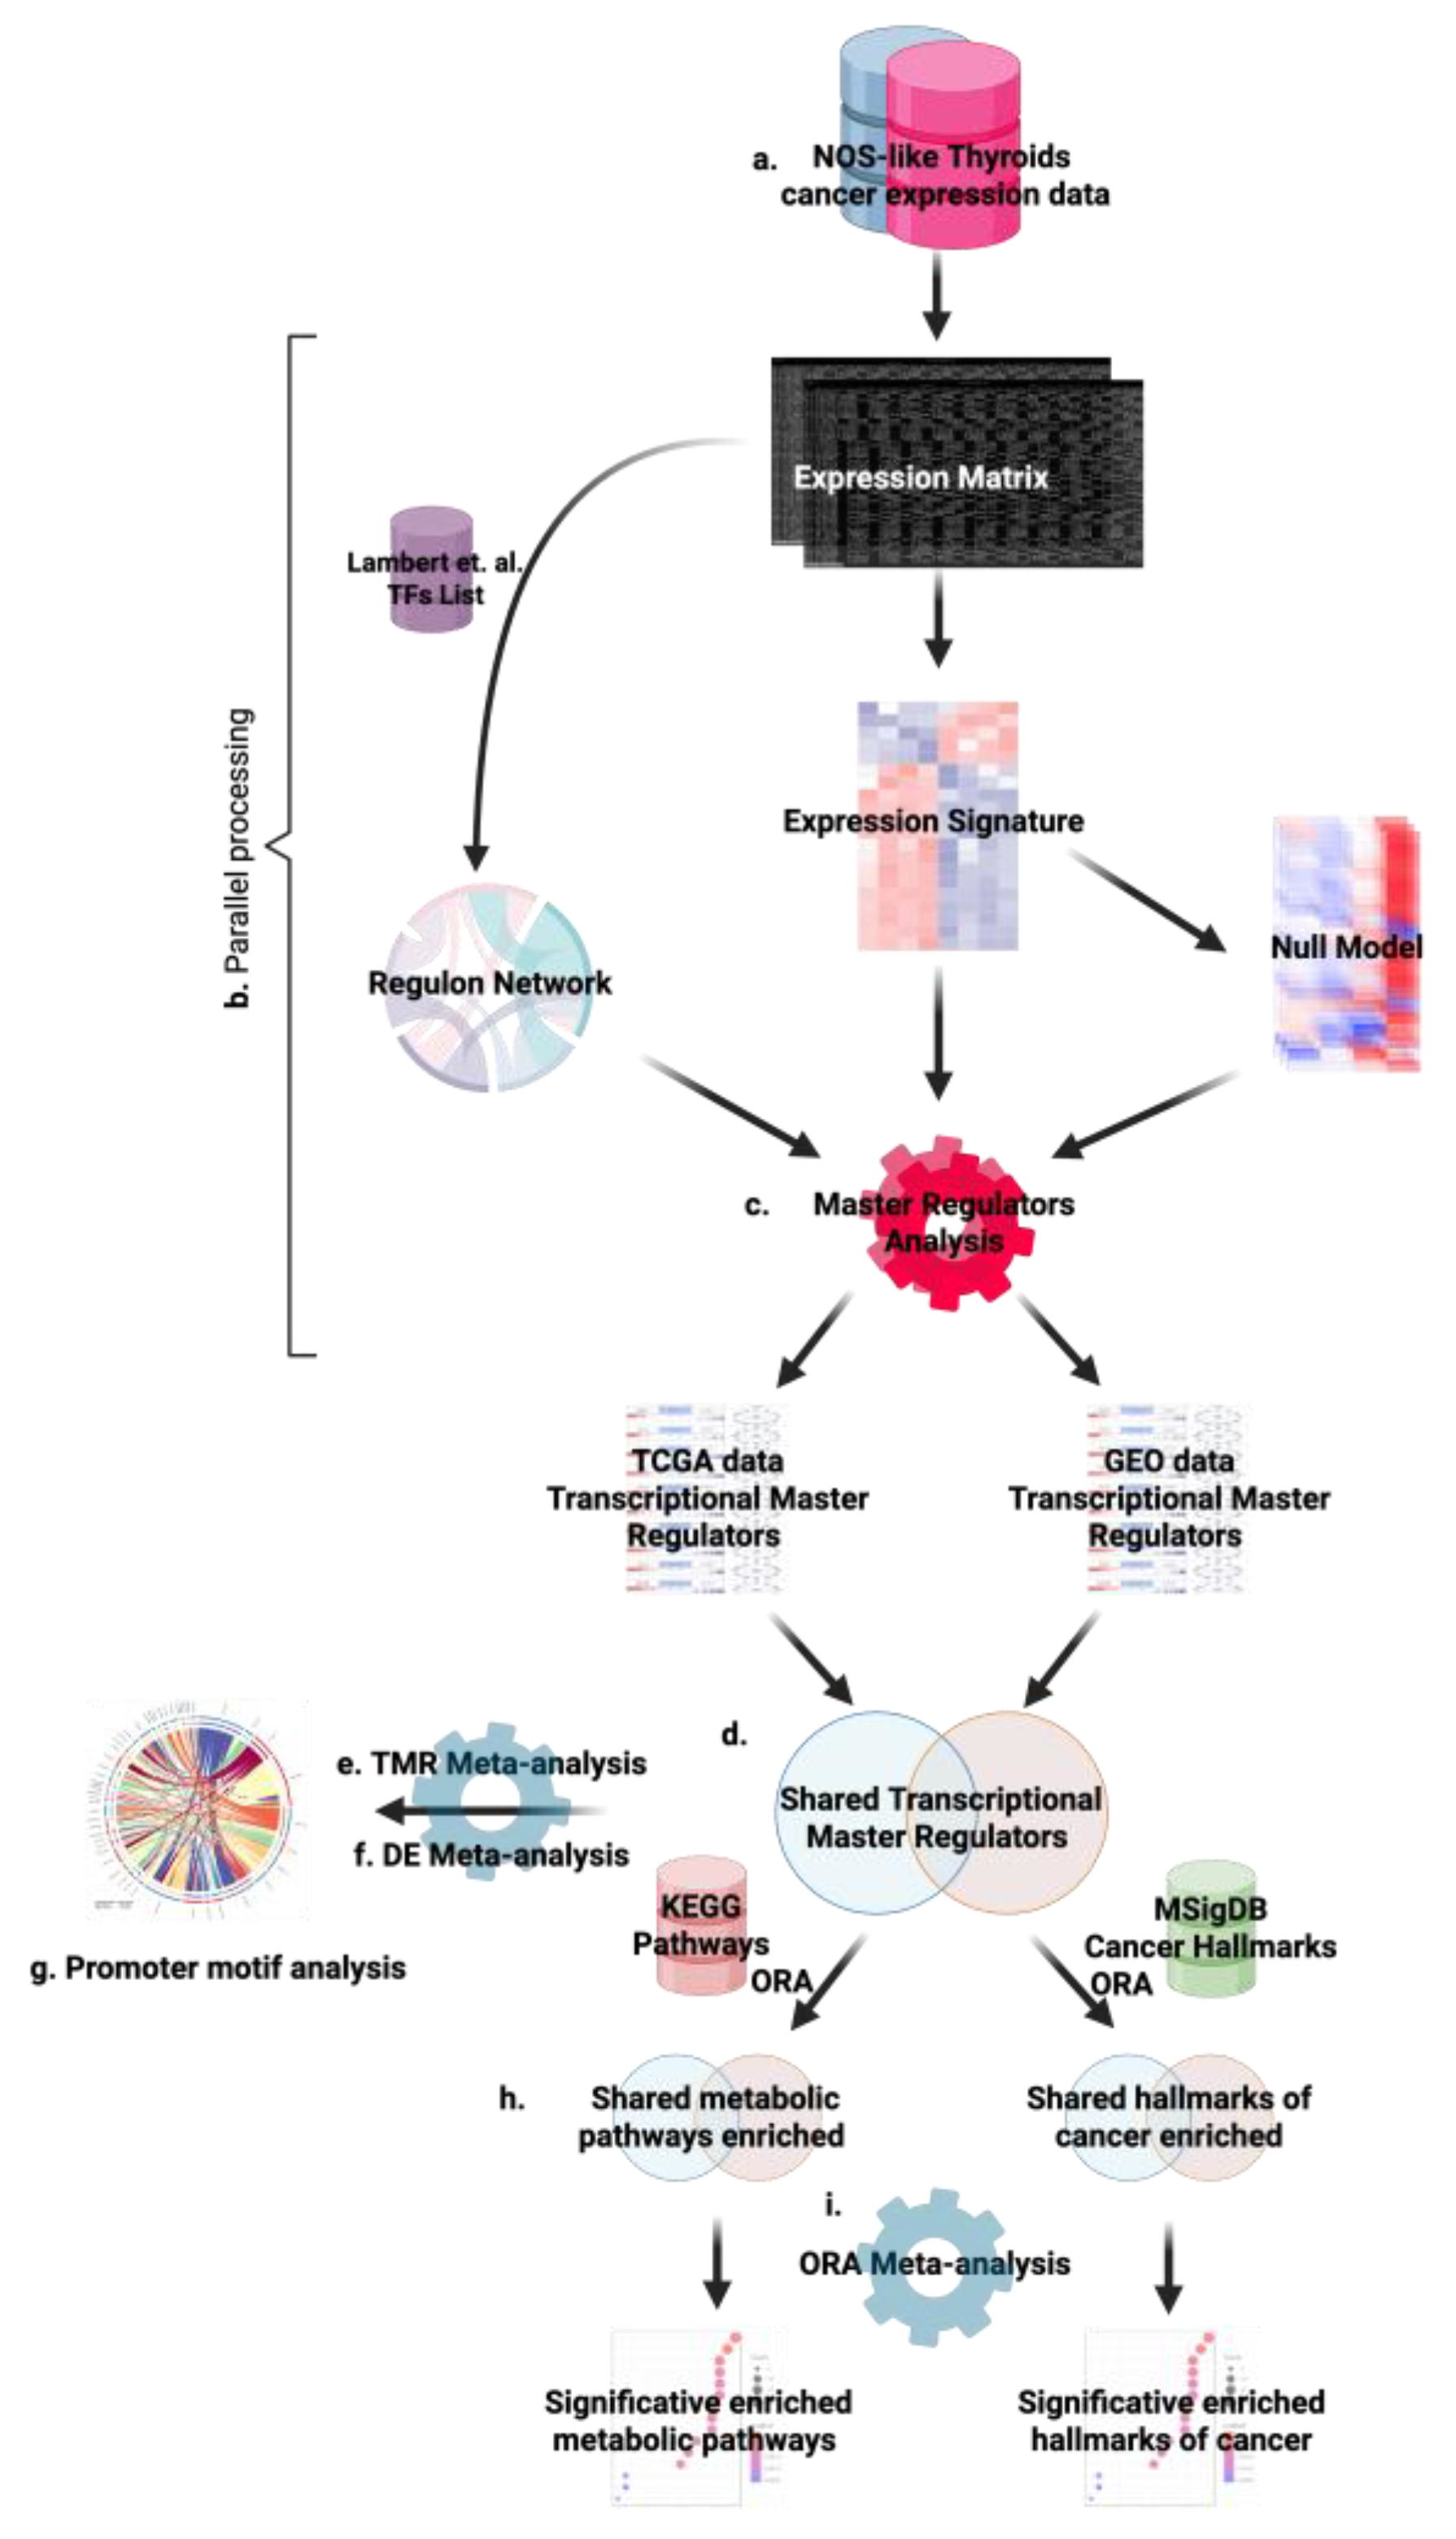

Table 1.
Transcription factor families of the 50 transcriptional master regulators (TMRs) identified in papillary thyroid carcinoma (PTC).
Table 1.
Transcription factor families of the 50 transcriptional master regulators (TMRs) identified in papillary thyroid carcinoma (PTC).
| Transcription Factor Family | TMRs |
|---|---|
| Zinc Finger | ZBTB2, ZBTB25, ZBTB5, ZKSCAN3, ZKSCAN5, ZFP62, ZNF548, ZC3H8 |
| Forkhead (FOX) | FOXE1, FOXP2, FOXQ1 |
| Basic Helix-Loop-Helix (bHLH) | BHLHE40, HEY2 |
| ETS | ETV1, ETV4, ETV5 |
| Nuclear Receptors (NR) | ESRRG, RARA, RARB, RXRG |
| Kruppel-like / C2H2 zinc finger-related | KLF8 |
| Sall | SALL4 |
| PRDM | PRDM16 |
| SMAD | SMAD9 |
| TEAD | TEAD4 |
| TFCP | TFCP2, TFCP2L1 |
| PLAG | PLAG1 |
| PROX | PROX1 |
| RUNX | RUNX2 |
| SREBF | SREBF1 |
| PBX | PBX4 |
| MAF | MAFB |
| GRHL | GRHL3 |
| GLIS | GLIS3 |
| Others / Unclassified | CASZ1, CREB5, GATAD2A, GZF1, HMGA2, L3MBTL4, MTERF4, PEG3, PKNOX2, TCF15, TSHZ3 |
Disclaimer/Publisher’s Note: The statements, opinions and data contained in all publications are solely those of the individual author(s) and contributor(s) and not of MDPI and/or the editor(s). MDPI and/or the editor(s) disclaim responsibility for any injury to people or property resulting from any ideas, methods, instructions or products referred to in the content. |
© 2025 by the authors. Licensee MDPI, Basel, Switzerland. This article is an open access article distributed under the terms and conditions of the Creative Commons Attribution (CC BY) license (http://creativecommons.org/licenses/by/4.0/).
Copyright: This open access article is published under a Creative Commons CC BY 4.0 license, which permit the free download, distribution, and reuse, provided that the author and preprint are cited in any reuse.


