
Submitted:
08 September 2025
Posted:
09 September 2025
You are already at the latest version
Abstract
Background: Ultra-processed foods (UPFs) comprise 65% of US household food purchases and are considered more convenient and economical than many minimally foods. Despite evidence linking UPF consumption with adverse health outcomes, the Dietary Guidelines for Americans (DGAs) have not addressed UPFs. While previous theoretical work demonstrated a menu containing >80% of energy from UPFs could be designed to align with the DGAs, direct comparisons with alternative menus having similar ingredients are essential to understanding real-world tradeoffs. Objective: To examine the convenience, cost, diet quality, and shelf-stability in theoretical diets aligned with DGAs but varying in UPF content. Methods: We created three 7-day, 2000-kcal menus using similar ingredients but varying in convenience and UPFs as classified by the Nova system by four PhD-level dietitians: UPF (91% energy from UPFs), minimally processed alternatives (MPF) (19% UPFs), and convenience-focused (CONV) menus (96% UPFs). The menus were analyzed according to their Healthy Eating Index (HEI)-2015, cost, shelf stability, and a novel meal inconvenience score. A weekly shopping simulation model estimated annual costs and waste for 4-person households. Results: The MPF menu achieved the highest HEI score (91/100) compared to UPF (85/100) and CONV (74/100). Annual costs were highest for MPF ($22,571), followed by UPF ($20,163) and CONV ($20,130), with food waste representing 17%, 16%, and 6% of expenditures, respectively. Inconvenience scores differed between UPF and CONV (p=0.006), and between MPF and CONV (p<0.001), but not between UPF and MPF (p=0.148). Shelf stability analysis showed the CONV menu offered the longest shelf life. Conclusions: While healthy eating patterns can be achieved with varying levels of UPFs, significant trade-offs exist between convenience, cost, diet quality, and shelf stability. Future work should consider these practical constraints when investigating healthy eating patterns.
Keywords:
ultra-processed food
; Nova classification
; dietary guidelines
; convenience
Introduction
Diets high in ultra-processed foods (UPFs) according to the Nova food classification system (category 4) [1], have been shown to increase weight gain from ad libitum energy intake [2,3], and are associated with an increased risk of obesity, cardiometabolic and other chronic diseases [4,5,6,7]. UPFs have become a prominent component of the American diet, accounting for 65% of foods purchased by US households [8], and contributing 57% of total energy intake amongst US adults [9].
Despite the health implications of high UPF consumption and their ubiquity in the US food supply, the Dietary Guidelines for Americans (DGAs) have not explicitly addressed UPFs or how they fit within the context of healthy dietary patterns [10]. The DGAs have traditionally used a nutrient-focused approach to develop recommendations for dietary patterns across the lifespan aimed at promoting health and reducing the risk of chronic disease [11]. However, nutrient-focused dietary guidelines likely benefit from consideration of food processing classifications given that the widespread consumption of UPFs often stem, in part, from characteristics beyond nutrition, namely: their shelf stability, decreased production costs, enhanced palatability, and greater convenience [12].
Convenience, in particular, has become a critical factor in food choice for consumers [13], due to changing work patterns and growing perception of cooking as a high-effort, time intensive task [14]. Recently, Hess et al. 2025 quantified time differences demonstrating that a less-processed menu requires triple the preparation time of a similar, more-processed menu [15]. These practical advantages contributing to food choice are especially important to households facing food insecurity, which often rely on UPFs more than households with food security due to constraints on time, cooking facilities, and financial resources [16,17,18].
The 2025-2030 DGAs Committee has recognized the associations between diets high in UPF and obesity, and emphasized the need for further research in this area [19]. More specifically, there is increased concern and competing ideas for appropriately identifying specific UPF categories due to the complex interaction with purpose, processing, and nutrition [20,21,22]. In this context, a recent study by Hess et al. demonstrated the theoretical possibility of a menu high in UPFs (>80% of energy) that but still adheres to the nutritional goals of the DGAs as measured with the Healthy Eating Index-2015 (HEI-2015) [20]. The authors reported they also successfully created a less processed menu with poor nutritional quality according to the HEI-2015 [23], a result that was unsurprising because DGA recommendations have not addressed UPFs and therefore do not affect scoring for HEI-2015. This study raised an important question about a fundamental disconnect: the Nova classification system of processing makes no mention of nutrients nor do the DGAs make any mention of food processing.
It is important to consider factors influencing dietary patterns in the real-world that drive food choice, and the ability for sustainable nutritional recommendations to be implemented. Therefore, we analyzed how menus with varying levels of UPFs compare across multiple dimensions, including convenience, diet quality, price, palatability, and shelf stability. We created theoretical menus with similar ingredients that were aligned with the DGAs but differing in levels of UPFs and convenience to explore tradeoffs with costs and diet quality.
Methods
Menu Creation
We found the UPF menu items on the same 2 websites of national retail grocery chains used in the previous study by Hess et al. [20]. To create the MPF menu, we identified more minimally processed alternatives (Nova 1-3) that most closely matched the ingredient list for each original UPF menu item. The selection criteria were as follows:
1) Ingredient similarity: Priority was given to items containing the same or similar first ingredient (e.g., “Raisins: Raisins” was replaced by “Golden Raisins: Golden raisins, sulfur dioxides (sulfites) added as a preservative”)
2) Functional equivalence: Items served the same purpose in the meal as the UPF original (e.g., canned tomatoes and tomatoes can both be used as sandwich toppings).
3) Alternative selection: If a similar ingredient list was not available on either supermarket website, an MPF with the same function was selected (e.g., butter as an alternative to margarine as a bread spread).
4) Price-based: Items were searched from lowest to highest price, the cheapest total priced item was selected in cases of items sold in multiple sizes (e.g., a 16 oz can of beans for $0.85 vs. a 28 oz. can of beans for $1.58)
5) Maintain portions: The UPF weight of each item was maintained. In cases of dissimilar presentation of food items (e.g., sliced fresh tomato vs diced canned tomato), FoodData Central [24] was used to match food weights.
6) Default to UPF: In cases where no suitable MPF alternatives were found, the original UPF was used.
For several items from the UPF menu, Nova 1-3 alternatives could not be found on the supermarket websites, including commercial foods that are, by definition, Nova 4, such as bread, jams, and yogurt with added sugar [1]. To achieve the target of >80% of energy from Nova 1-3, we identified simple homemade alternatives by searching online for basic recipes with similar ingredients (e.g., “5 Minute Strawberry Yogurt”) [25] and replaced the UPF items with Nova 1-3 recipes comprising multiple items. These homemade versions were substituted into the meal plans until the >80% of energy from Nova 1-3 threshold was reached. A summary of homemade substitutes can be found in Supplemental Table S1.
Inconvenience Metric
A previously created convenience typology [26] was used to develop an inconvenience metric (Table 1). This inconvenience metric was applied to create a menu designed to be convenient (CONV) and to score the inconvenience level across all meals in each theoretical menu. The convenience typology classifies the degree of convenience of a food item based on preparation-time, readiness, and preservation, and the food item’s role in a meal (i.e., ingredient, accessory component, or full meal) [26] . Food items were categorized according to the sub-category that matched that eating occasion (e.g., peaches can be a single meal component within the MPF fruit salad (2a) or a ready-to-eat snack (0c)). Menu items were placed in 3 main categories: inconvenient (scored 2), semi-convenient (scored 1), and fully convenient (scored 0). The a-c subcategories within each convenience level represent distinct food usage contexts rather than just preparation convenience. Category ‘a’ items are primary meal components intended for main dishes, ‘b’ represents accessory ingredients and condiments that enhance but don’t constitute a complete dish on their own, and category ‘c’ represents self-contained food items that are typically consumed independently (snacks, bread products, etc.).
The CONV menu was created using the same 6-step search methods as described above for the MPF menu but instead prioritizing more convenient alternatives rather than processing (e.g., a frozen breakfast burrito (0a) in place of the individual component ingredients like eggs (2a), beans (1a), and cheese (1c)). If more convenient alternatives were not found, the original UPF item was maintained. If a more convenient alternative was found that did not contain all the components of the original UPF meal item, the missing component original UPF items were maintained to ensure nutritional equivalence. The inconvenience score of each menu was calculated by summing the individual inconvenience scores (ranging from 0-2, as shown in Table 1) of each food item within a meal and then averaging these meal scores across all 35 meals to determine the final inconvenience score for each menu.
Determination of Nova Categorization
Food items in each menu were classified into 1 of 4 of the Nova categories for their degree of processing 1) unprocessed or minimally processed foods, 2) processed culinary ingredients, 3) processed foods, and 4) UPF [27]. Four doctoral-level dietitians completed surveys implemented in Research Electronic Data Capture [28] in which they were presented with the name of food items and their respective ingredients list (e.g., “Golden Raisins: Golden raisins, sulfur dioxides (sulfites) added as a preservative”) and asked to categorize food items in the MPF and CONV menus by their Nova categorization 1-4. Nova categorization reference materials were provided to review the categorization of Nova based on previous publications [20,29] (Supplemental Figure S1). In cases of uncertainty, raters were instructed to select the more conservative option (i.e., more-processed option for the MPF menu and less processed version for the CONV menu). Discordant items were discussed amongst the group and voted on after the initial survey. Additionally, as a quality assurance measure, we embedded 11 known UPF food items in the MPF menu survey and 7 known minimally processed foods in the CONV menu survey to verify that graders were carefully reading and accurately categorizing items throughout the survey [30].
Shelf Stability in Context of 7-Day Menu
To determine shelf stability within each menu, we replicated the methods conducted in Hess et al. investigating the standard American diet at different levels of processing [23]. Foods were first designated as packaged or unpackaged, with produce and meat/protein products considered unpackaged. Shelf-stability was determined using time (days) to expiration as indicated for best matching food categories and formats (shelf-stable, frozen, or refrigerated) on the U.S. Department of Agriculture’s FoodKeeper App [31]. The Greater Pittsburgh Community Food Bank Shelf Life manual [32], as well as refrigerator and freezer storage charts [33,34], were consulted when items were not found on the FoodKeeper App. The most conservative time to expiration (shortest) was used when an expiration range was indicated.
Two instances of expiry were collected for each item: one with the food item in its format at purchase (Unopened), and one that considers the context of a weekly meal plan scenario where participants could consume meals in any order (Opened). For the opened expiration dates, if items were used multiple times across the menu, expiration was evaluated as if they were opened on day one to determine if they would remain stable between day one and day 7. Items only used once and individually wrapped items were assessed in their unopened state.
Menu Cost and Leftover Food Calculations
The price of selected items was captured in Sept-Nov of 2023 from grocery retailers in the Northern Great Plains region of the United States. Serving costs were calculated as the quantity of each food item required to achieve the 2000 kcal menus (e.g., 8 fl. oz of milk from a 64 oz carton). This cost represents the actual amounts of food consumed in the 7-day menus. The total cost was represented as the cost incurred by the consumer to purchase the entire container. Leftover food amount is the difference between the total number of food servings in the purchased unit minus the actual food consumed (serving amount). To demonstrate how menu costs compare to nutrition assistance benefits offered to food insecure populations, we evaluated serving costs with example food plan costs for Supplemental Nutrition Assistance Program (SNAP) beneficiaries set by the United States Department of Agriculture (USDA).
Annual Cost Analysis Using 52-Week Shopping Simulation
Because initial menu costs include leftover food at the end of the week, these values represented an overestimate of the true costs of these menus. Therefore, we created a simulation model of weekly household purchasing behaviors using R Studio version 4.4.3 [35]. The simulation tracked item inventory, consumption rate, container prices, shelf stability before and after opening, and expenditure each week over a 52-week period. The simulation incorporated several parameters:
- (1)
- Daily Consumption Rates: The daily consumption rates were calculated by dividing the total quantity used for the 4-person household across the 7-day menu by 7. For example, the UPF menu required 8.71 containers of milk over the week, so the daily consumption rate was 1.24 containers per day (8.71/7=1.24). Ready-to-eat food items that are intended to be consumed upon purchase (e.g., a pre-made chicken wrap), were consumed immediately each week in the model.
- (2)
- Inventory Tracking: The model maintained a running inventory of food items, tracking both unopened containers and opened containers currently in use. When a container was opened, its shelf life was updated according to expiration timeframes of an opened container from the FoodKeeper App [31] and supplementary resources [32-34]. Proportion of items that remained in the inventory until their expiration date was counted as wasted value and removed.
- (3)
- Shopping Frequency: Weekly shopping trips were simulated, with purchases based on anticipated needs for the coming week while considering existing inventory levels. The model assumed consumers would purchase items only when current inventory levels were insufficient to meet the week’s requirements. When multiple containers were purchased, they were opened sequentially as consumption required, with each newly opened container’s expiration timer reset to the opened shelf-life duration. Annual costs were calculated from all food purchased throughout the 52 weeks.
The simulation was validated through comparing single-food item cost calculations between the simulation model and simplified excel calculations that implemented the basic consumption rate, shelf life, and cost.
Determination of Nutrient Content
Macronutrient and micronutrient contents for all three menus were determined using the Food Processor Nutrition Analysis Software (Version 11.14.9 Trustwell: Beaverton, OR) [36]. To ensure methodologically consistency across comparisons, we recalculated the nutrient profile of the original UPF menu from Hess et al. using the Food processor Nutrition Analysis Software, the same approach applied to the MPF and CONV menus, rather than relying on the previously published nutrient values calculated using different software. Each menu item was matched with its equivalent in the analysis program, prioritizing exact matches. Nutrition information for items not found to have an equivalent were manually entered from nutrition labels and manufacturer’s data.
Determination of HEI-2015 Scores
Each 7-day menu was assessed for the average diet quality score using the Healthy Eating Index-2015 (HEI-2015) [37]. Foods within each 7-day menu were matched with equivalents in the 2017-2018 Food and Nutrient Database for Dietary Studies to determine the servings of 37 food groups [38]. The daily servings were averaged across the weekly menus and used to calculate the 13 total dietary components of the HEI-2015, four of which reflect components to consume in moderation (refined grains, sodium, added sugar, and saturated fats) while the remainder reflect components to prioritize adequacy (total fruits, whole fruits, total vegetables, greens and beans, whole grains, dairy, total protein foods, seafood and plant proteins, fatty acids) [39]. Moderation components are scored on not exceeding maximum thresholds (e.g., saturated fats score 10/10 points when ≤8% of total energy). Adequacy is scored on meeting or exceeding amounts per kcal (e.g., dairy scores 10 points for achieving ≥2.0-cup equivalents per 1000 kcal).
Energy Density and Hyper-Palatable Foods
Non-beverage energy density was calculated by dividing the total energy (kcal) of each 7-day menu by the total weight (grams) oof each 7-day menu, excluding liquids. Foods were also consider hyper-palatable (HPF) if they met any of the following thresholds for nutrient combinations: 1.) fat and sodium (> 25% energy from fat, ≥ 0.30% sodium by weight), 2.) fat and simple sugars (> 20% energy from fat, > 20% energy from sugar), and 3.) carbohydrates and sodium (> 40% energy from carbohydrates, ≥ 0.20% sodium by weight) [40]. The percentage of non-beverage energy from HPF was estimated at the level of food eaten in the same bite including liquids eaten with solids (e.g., cereal and milk).
Statistical Analysis
ANOVA and Tukey’s HSD post-hoc test were conducted using the ‘irr’ package [41] in R version 4.4.3 [35] to compare mean inconvenience scores between menus. Median time to expiration of each menu was determined in both the unopened and opened context using the Kaplan-Meier survival analysis method. The Wilcoxon homogeneity testing of survival curves was used to determine overall differences between menus, followed by pairwise comparisons with Bonferroni correction to control for multiple testing. For each context (unopened and opened), p-values from the three pairwise comparisons (UPF vs. MPF, UPF vs. CONV, and MPF vs. CONV) were multiplied by the number of comparisons (n=3) to obtain adjusted p-values. Statistical significance was determined at the α=0.05 level after adjustment. All survival analyses were found using the survival [42] and survminer [43] packages in R statistical software [35].
Results
Menus and Energy from Ultra-Processed Foods
Three distinct menus were developed for comparison in this study: an ultra-processed menu (UPF), a minimally processed menu (MPF), and a convenience menu (CONV). Dietitian agreement was high after initial assessment, with full agreement on 10 out of 11 quality assurance items for the MPF menu and on 6 out of 7 quality assurance items for the CONV menu. Raters subsequently reached consensus regarding final Nova categorization for each food item used in analyses presented herein.
The UPF menu reflecting items matching Hess et al. contained 91% of energy from Nova category 4 [20], while the MPF menu had 19% of energy from UPF (Table 2 and Table 3), and the convenience menu consisted of 96% of energy from UPF (Table 4 and Table 5). The percentage of energy from each Nova category can be found in Table 6.
Meal Inconvenience Score
ANOVA results showed mean inconvenience scores differed significantly across the three menu types (p <0.001) Figure 1. The MPF showed the highest inconvenience score (5.89 ± 1.52), followed by UPF (4.31 ± 1.46) and CONV (1.91 ± 0.82).
Shelf Stability of the Initial 7-Day Menus
Packaged foods comprised 87% of energy on the UPF menu, 77% of energy on the MPF menu, and 92% of energy on the CONV menu. The fraction of energy from foods that are frozen, refrigerated, and shelf stable in the Unopened and Opened conditions can be found in Figure 2C. The convenience menu had the highest proportion of energy stored in the freezer which stayed consistent in each context. There was a shift toward a greater proportion of energy stored in the refrigerator in the Opened compared to Unopened context for all menus.
The Kaplan-Meier survival curves and median shelf-life values for each menu under both Unopened and Opened conditions are depicted in Figure 2A,B. In the Unopened context, median survival times were 182 days for the UPF and CONV menu, but only 30 days for the MPF menu. In the Opened context, median survival times decreased substantially to 14 days for both the UPF and MPF menus, while the CONV menu maintained a longer shelf life of 60 days. The CONV menu had a longer shelf-life than the MPF menu in both the Unopened (+46 days, p<0.001) and Opened (+152 days, p=0.003) contexts. While the CONV and UPF menus had similar shelf life when Unopened (182 days, p>0.99), the CONV is estimated to last 46 days longer than UPF once Opened (p=0.02).
Nutrient Content, Energy Density, and Hyper-Palatable Foods
Macro and micronutrient contents, energy density (kcal/g), and proportion of energy from HPFs are found in Table 7. **
Diet Quality
Out of a maximum score of 100, the average HEI-2015 score was 74, 85, 91 for the CONV, UPF, and MPF menus respectively. The UPF menu scored lower than the MPF menu primarily due to higher sodium and lower whole grain content, while the CONV menu was further penalized on added sugars, refined grains, and fatty acids (Figure 3).
Initial Food Cost
The total initial cost to purchase everything in each 1-week menu are presented in Table 8. The CONV menu had the lowest total cost, 25% cheaper than the MPF menu and 22% cheaper than the UPF menu for a 1-person household. However, the UPF menu had the lowest price per serving, at 7% cheaper than the MPF menu and 9% cheaper than the convenience menu. For a 4-person household the CONV menu still had the lowest total cost, but this was less pronounced compared to the 1-person household total, 12% lower than MPF and 4% lower than the UPF menu.
Figure 4 shows the serving costs for all these menus in comparison to the USDA Thrifty Food Plan weekly per person cost during the same time frame when the food costs for our menus were estimated. The USDA Thrifty Food Plan had a maximum value of ~$72 corresponding to the highest amount allotted, or the supplemental assistance provided to feed a 14-19 year old male [44,45], and all 3 menus exceeded that. All individual cost information can be found in Supplementary Table S2.
Annual Cost Analysis Using 52-Week Shopping Simulation
The 52-week shopping simulation revealed distinct cost patterns across the three menu types for a 4-person household found in Figure 5. Annually, the MPF menu had the highest cost ($22,571) and was approximately 12% more expensive than the UPF ($20,163) menu which was like the CONV menu ($20,130).
Food waste due to expiration can also be found in Figure 6. The MPF menu and UPF menus showed similar waste patterns, with waste representing 17% ($3,932) and 16% ($3,210) of total annual food expenditure respectively. The CONV menu demonstrated the lowest waste, accounting for 6% ($1,109) of total food expenditure.
The MPF menu showed the highest variability week to week, ranging from approximately $400 to over $530. The UPF menu showed variability with costs typically ranging from $380 to $490 per week and the CONV menu generally stayed between $360 and $420. The R code can be found in the Supplementary Figure S2.
Discussion
Ultra-processed foods are widely consumed by Americans, yet the trade-offs that exist between their processing level (e.g., convenience, cost) for nutrition quality remain poorly understood. To examine these trade-offs, we replicated and extended previous theoretical approaches by developing a matched MPF menu to directly compare against a UPF menu aligned with the Dietary Guidelines for Americans. Surprisingly, we found that the MPF and UPF menus were remarkably similar in shelf-stability, price, and convenience—an unexpected finding given common assumptions about minimally processed foods being less practical. However, the UPF menu as previously designed adhered to precise caloric targets and portion adjustments that may not reflect typical consumption patterns. When we instead created a convenience-optimized version of the same UPF menu to better reflect real-world consumer selection preferences, we observed this approach indeed reduced food waste and improved shelf stability, and convenience compared to the original menu. However, the CONV menu reduced diet quality as assessed by HEI-2015. This highlights the need for a more nuanced approach to evaluating how UPF selection behaviors, in part influenced by convenience considerations, impact overall dietary quality.
The MPF menu was developed to provide direct comparison to the UPF menu with regards to price, HEI, and nutrient profiles, while also giving insight into the feasibility of producing the two menus. Our reanalysis of the UPF menu yielded an HEI-2015 score of 85/100 compared to the originally published 86/100, with the 1-point difference occurring in the fatty acid ratio component. Additionally, our nutrient analysis using the Food Processor Nutrition Analysis Software produced slightly different macronutrient values compared to the original study’s use of the National Data System for Research (NDSR), which likely contributed to the HEI score variation. The UPF menu scored a B (between 80 and 89) compared to our replicant MPF menu which scored an A on the HEI-2015 (≥90) [39], primarily due to the UPF menu’s higher sodium content and lower whole grain content. The CONV menu scored a C (between 70-79) which was notably worse than the other menus despite attempts to match their ingredients. The lower score of the CONV menu reflected deficiencies across multiple components, particularly in whole grains, seafood and plant proteins, and fatty acids, while also exceeding recommended limits for sodium, refined grains, and saturated fats, despite mirroring the overall meals from the MPF and UPF menus.
The misalignment between nutritional outcomes, processing classification, and consumption behaviors becomes apparent when examining convenience in American food purchasing patterns. The majority (57%) of Americans report convenience significantly impacts food purchasing decisions [13], with nearly 75% of foods purchased being ready-to-eat/heat [46], a category largely dominated by UPFs in the US [47,48]. Hess et al. 2025 demonstrated that a menu more similar to the UPF dominated food system took significantly less time to prepare than less-processed alternatives [15], yet interestingly, our inconvenience scoring revealed no significant convenience differences between UPF and MPF menus. This suggests that processing level does not necessarily determine convenience, as convenience encompasses more than just preparation—including shelf-life, level of preparedness, and the context in which a food is eaten. Notably, both our MPF menu (19% energy from UPFs) and the Hess et al. less-processed menu (20% energy from UPFs) achieved similar Nova classification levels. This demonstrates that even within similar processing classifications, significant variation exists in practical implementation. Similarly, the UPF menu relied on UPF substitutions that barely met classification criteria (such as choosing golden raisins with sulfur dioxide preservatives over sun-dried raisins with no additives) and used unconventional portion sizes (e.g., 1 oz of breakfast sausage or half a hamburger bun). Thus, the careful portion control required to achieve a 2000 energy menu may not reflect the potential qualities of UPFs that lead to overconsumption. These design constraints suggest that a menu can be designed to align with the dietary guidelines but not reflect the convenience-driven food choices that dominate real-world eating patterns of UPFs. Both the MPF and UPF menus remain impractical for populations with limited cooking skills, busy lifestyles, or financial constraints.
Critically, compared to the UPF and MPF menus, the CONV menu led to significantly lower inconvenience scores but resulted in lower diet quality (HEI 74/100 vs. 86/100 for UPF). The menu’s closer alignment to average American diet quality (59/100 HEI) provides a more ecologically valid representation of typical UPF consumption patterns, particularly when considering its demonstrated advantages in reduced food waste and higher convenience score. This ecological validity is especially important for food-insecure populations, who often rely on convenience stores with limited healthy options and an emphasis on sugar-sweetened beverages and energy-dense snacks [49,50,51]. Given the reality of convenience as one of the top drivers of food purchases [52], future work should investigate how convenience and UPFs are currently integrated into healthy, affordable dietary patterns.
A lesser acknowledged benefit of UPF formulation is their shelf stability. Our findings on this dimension align with those reported by Hess et al. (2024), who found that in an unopened context, a Western-style diet containing more UPFs had significantly longer shelf stability (median 182 days) compared to less processed alternatives (median of 35 days) [23]. When unopened, the UPF and CONV menus both had a shelf stability of 182 days compared to 30 days for the MPF menu. However, we considered not only the unopened context they used in their analysis, but also an opened context that may better reflect real-world consumption patterns over the course of a week. We demonstrated that in the opened context, the UPF’s shelf stability was not statistically different compared to the MPF menu (14 days), but the CONV menu had significant advantages (60 days). Our 52-week shopping simulation further demonstrated the advantages of the CONV menu which had the lowest annual cost ($20,130 vs. $22,371 for MPF, $20,163 for UPF) and dramatically reduced food waste (72% less than MPF, 65% less than UPF), highlighting how shelf stability translates into real economic advantages. Beyond direct cost savings, the increased food waste for the UPF and MPF menus could reflect additional time and effort required around planning meals and frequent shopping to minimize food waste. These findings may have important implications for the 17.7 million Americans that experience both low-income and low-access to supermarkets [53] as these households often depend on less frequent grocery shopping at supermarkets [54,55] which is related to lower consumption of perishable goods such as fruit and vegetables [56] and a lower overall diet quality [57,58].
While we present weekly cost estimates for 1-person households in Supplementary Table S3, the shopping simulation was limited to a 4-person household due to the substantial food waste. The conservative shelf-life guidelines from authoritative food safety sources such as foodsafety.gov [31-34], resulted in unrealistic waste projections for a 1-person household in all menus. Therefore, we excluded the 1-person household analysis in this manuscript. This reveals a gap between controlled menu design and actual consumption, purchasing, and storage patterns that warrants further investigation.
These findings collectively demonstrate the complex trade-offs between processing, convenience, cost, and nutritional quality that characterize American food choices. The MPF menu achieved the highest diet quality, yet the CONV menu—designed for superior convenience—demonstrated both reduced cost (just below the UPF menu) and significantly lower food waste than both menus. These practical advantages may help explain why convenience-driven UPF consumption dominates real-world dietary patterns despite nutritional compromises.
Limitations
Our menu design methods, using a sample MyPyramid (retired 2011) menu [20] to align with the DGAs, may not reflect commonly consumed foods or eating patterns typically associated with UPFs and convenience in the current American diet. However, our inclusion of a convenience-focused (CONV) menu provides valuable contrast to more typical real-world consumption patterns. While our development of an inconvenience metric and measurement of shelf stability allows for practical comparison of menu feasibility beyond nutritional adequacy. Furthermore, while our menus were designed with controlled portions, real-world UPF consumption typically involves ad libitum intake that results in greater energy consumption. We observed minimal differences in energy density and modest increases in hyper-palatable foods across menus, but controlled feeding studies are needed to determine how meal convenience food choices may affect ad libitum intake of UPFs. Finally, although our convenience assessment is constrained by a typology that primarily evaluates individual food items, our adapted methodology quantifies the cumulative burden of preparing multiple components within a meal. This approach recognizes that meal preparation complexity increases as more items are involved, requiring greater attention, time, and coordination from consumers. Future research should build upon this framework to develop a more comprehensive convenience measure that incorporates consumer input and evaluates additional dimensions of convenience – e.g., empirical preparation and cooking times, food acquisition, cooking skills, etc. - at the meal level.
Conclusions
While it is theoretically possible to create a nutritionally high quality menu of predominantly ultra-processed foods, real-world drivers of consumption such as convenience and shelf stability reveal fundamental challenges with this approach. Our findings demonstrate that a previously examined theoretical menu created with high amounts of UPFs provides cost benefits but no convenience or shelf-life advantages over a minimally moderate processed alternative. However, when optimized for convenience, a UPF menu provides significant benefits for cost, convenience, and shelf life, albeit at the cost of nutritional quality. These trade-offs highlight the complex tensions in consumer food choices that need to be investigated beyond single-dimensional analyses, requiring integrated assessment of nutritional quality alongside real-world factors like cost, convenience, and shelf stability.
Supplementary Materials
The following supporting information can be downloaded at the website of this paper posted on Preprints.org.
Author Contributions
CAC, AH, KDH: designed research; CAC: Curated data; CAC, VLD, AK, ABC, CS: conducted research; CAC: analyzed data; CAC: wrote original draft; CAC, AH: visualization. All authors read, revised, and approved the final manuscript.
Funding
None.
Acknowledgments
This research was supported by the Intramural Research Program of the National Institute of Diabetes and Digestive and Kidney Diseases (NIDDK) within the National Institutes of Health (NIH). The contributions of the NIH author(s) are considered Works of the United States Government. The findings and conclusions presented in this paper are those of the author(s) and do not necessarily reflect the views of the NIH or the U.S. Department of Health and Human Services.
Conflicts of Interest
None.
References
- Monteiro, C.A.; Cannon, G.; Levy, R.B.; Moubarac, J.C.; Louzada, M.L.; Rauber, F.; Khandpur, N.; Cediel, G.; Neri, D.; Martinez-Steele, E.; et al. Ultra-processed foods: what they are and how to identify them. Public Health Nutr 2019, 22, 936–941. [Google Scholar] [CrossRef]
- Hall, K.D.; Ayuketah, A.; Brychta, R.; Cai, H.; Cassimatis, T.; Chen, K.Y.; Chung, S.T.; Costa, E.; Courville, A.; Darcey, V.; et al. Ultra-Processed Diets Cause Excess Calorie Intake and Weight Gain: An Inpatient Randomized Controlled Trial of Ad Libitum Food Intake. Cell Metab 2019, 30, 226. [Google Scholar] [CrossRef]
- Hamano, S.; Sawada, M.; Aihara, M.; Sakurai, Y.; Sekine, R.; Usami, S.; Kubota, N.; Yamauchi, T. Ultra-processed foods cause weight gain and increased energy intake associated with reduced chewing frequency: A randomized, open-label, crossover study. Diabetes Obes Metab 2024, 26, 5431–5443. [Google Scholar] [CrossRef]
- Lane, M.M.; Davis, J.A.; Beattie, S.; Gomez-Donoso, C.; Loughman, A.; O'Neil, A.; Jacka, F.; Berk, M.; Page, R.; Marx, W.; et al. Ultraprocessed food and chronic noncommunicable diseases: A systematic review and meta-analysis of 43 observational studies. Obes Rev 2021, 22, e13146. [Google Scholar] [CrossRef]
- Taneri, P.E.; Wehrli, F.; Roa-Diaz, Z.M.; Itodo, O.A.; Salvador, D.; Raeisi-Dehkordi, H.; Bally, L.; Minder, B.; Kiefte-de Jong, J.C.; Laine, J.E.; et al. Association Between Ultra-Processed Food Intake and All-Cause Mortality: A Systematic Review and Meta-Analysis. Am J Epidemiol 2022, 191, 1323–1335. [Google Scholar] [CrossRef]
- Wang, M.; Du, X.; Huang, W.; Xu, Y. Ultra-processed Foods Consumption Increases the Risk of Hypertension in Adults: A Systematic Review and Meta-analysis. Am J Hypertens 2022, 35, 892–901. [Google Scholar] [CrossRef] [PubMed]
- Yuan, L.; Hu, H.; Li, T.; Zhang, J.; Feng, Y.; Yang, X.; Li, Y.; Wu, Y.; Li, X.; Huang, H.; et al. Dose-response meta-analysis of ultra-processed food with the risk of cardiovascular events and all-cause mortality: evidence from prospective cohort studies. Food Funct 2023, 14, 2586–2596. [Google Scholar] [CrossRef] [PubMed]
- Popkin, B.M.; Miles, D.R.; Taillie, L.S.; Dunford, E.K. A policy approach to identifying food and beverage products that are ultra-processed and high in added salt, sugar and saturated fat in the United States: a cross-sectional analysis of packaged foods. Lancet Reg Health Am 2024, 32, 100713. [Google Scholar] [CrossRef] [PubMed]
- Juul, F.; Parekh, N.; Martinez-Steele, E.; Monteiro, C.A.; Chang, V.W. Ultra-processed food consumption among US adults from 2001 to 2018. Am J Clin Nutr 2022, 115, 211–221. [Google Scholar] [CrossRef]
- Pomeranz, J.L.; Mande, J.R.; Mozaffarian, D. U.S. Policies Addressing Ultraprocessed Foods, 1980-2022. Am J Prev Med 2023, 65, 1134–1141. [Google Scholar] [CrossRef]
- Services, U.S.D.o.A.a.U.S.D.o.H.a.H. Dietary Guidelines for Americans, 2020-2025. 9th Edition. Availabe online: https://www.dietaryguidelines. 2020. [Google Scholar]
- Monteiro, C.A.; Levy, R.B.; Claro, R.M.; Castro, I.R.R.d.; Cannon, G. A new classification of foods based on the extent and purpose of their processing. Cadernos de Saúde Pública. [CrossRef]
- Council, I.F.I. 2024 Food & Health Survey; june 20, 2024.
- Imtiyaz, H.; Soni, P.; Yukongdi, V. Assessing the Consumers' Purchase Intention and Consumption of Convenience Food in Emerging Economy: The Role of Physical Determinants. Sage Open 2023, 13. [Google Scholar] [CrossRef]
- 10.1177/21582440221148434.
- Hess, J.M.; Comeau, M.E.; Palmer, D.G. Preparation time does not reflect nutrition and varies based on level of processing. The Journal of Nutrition, 1016; /23. [Google Scholar] [CrossRef]
- Aljahdali, A.A. Food insecurity and ultra-processed food consumption in the Health and Retirement Study: Cross-sectional analysis. The Journal of nutrition, health and aging 2025, 29, 100422. [Google Scholar] [CrossRef] [PubMed]
- Leung, C.W.; Fulay, A.P.; Parnarouskis, L.; Martinez-Steele, E.; Gearhardt, A.N.; Wolfson, J.A. Food insecurity and ultra-processed food consumption: the modifying role of participation in the Supplemental Nutrition Assistance Program (SNAP). The American Journal of Clinical Nutrition 2022, 116, 197–205. [Google Scholar] [CrossRef]
- Leung, C.W.; Epel, E.S.; Ritchie, L.D.; Crawford, P.B.; Laraia, B.A. Food Insecurity Is Inversely Associated with Diet Quality of Lower-Income Adults. Journal of the Academy of Nutrition and Dietetics 2014, 114, 1943–1953.e1942. [Google Scholar] [CrossRef]
- 2025 Dietary Guidelines Advisory Committee: Meeting 5 (Day 2). Departments of Health and Human Services (HHS): 2024.
- Hess, J.M.; Comeau, M.E.; Casperson, S.; Slavin, J.L.; Johnson, G.H.; Messina, M.; Raatz, S.; Scheett, A.J.; Bodensteiner, A.; Palmer, D.G. Dietary Guidelines Meet NOVA: Developing a Menu for A Healthy Dietary Pattern Using Ultra-Processed Foods. J Nutr 2023, 153, 2472–2481. [Google Scholar] [CrossRef]
- Gibney, M.J. Ultra-Processed Foods: Definitions and Policy Issues. Curr Dev Nutr 2019, 3, nzy077. [Google Scholar] [CrossRef] [PubMed]
- Price, E.J.; Du, M.; McKeown, N.M.; Batterham, M.J.; Beck, E.J. Excluding whole grain-containing foods from the Nova ultraprocessed food category: a cross-sectional analysis of the impact on associations with cardiometabolic risk measures. Am J Clin Nutr 2024, 119, 1133–1142. [Google Scholar] [CrossRef]
- Hess, J.M.; Comeau, M.E.; Scheett, A.J.; Bodensteiner, A.; Levine, A.S. Using Less Processed Food to Mimic a Standard American Diet Does Not Improve Nutrient Value and May Result in a Shorter Shelf Life at a Higher Financial Cost. Current Developments in Nutrition, /01. [CrossRef]
- Agriculture, U.S.D.o. FoodData Central. Availabe online: https://fdc.nal.usda.gov/ (accessed on November). (accessed on November).
- Osipov, O. 5 Minute Strawberry Yogurt. Availabe online: https://ifoodreal.
- Daniels, S.; Glorieux, I. Convenience, food and family lives. A socio-typological study of household food expenditures in 21st-century Belgium. Appetite 2015, 94, 54–61. [Google Scholar] [CrossRef]
- Martinez-Steele, E.; Khandpur, N.; Batis, C.; Bes-Rastrollo, M.; Bonaccio, M.; Cediel, G.; Huybrechts, I.; Juul, F.; Levy, R.B.; da Costa Louzada, M.L.; et al. Best practices for applying the Nova food classification system. Nature Food 2023 4:6, -01. [CrossRef]
- Harris, P.A.; Taylor, R.; Thielke, R.; Payne, J.; Gonzalez, N.; Conde, J.G. Research electronic data capture (REDCap)--a metadata-driven methodology and workflow process for providing translational research informatics support. J Biomed Inform 2009, 42, 377–381. [Google Scholar] [CrossRef]
- Monteiro, C.A. , Cannon, G., Lawrence, M., Costa Louzada, M.L. and Pereira Machado, P. Ultra-processed foods, diet quality, and health using the NOVA classification system.
- Jones, M.S.; House, L.A.; Gao, Z. Respondent Screening and Revealed Preference Axioms: Testing Quarantining Methods for Enhanced Data Quality in Web Panel Surveys. Public Opinion Quarterly, /01. [CrossRef]
- Services, U.S.D.o.H.a.H. FoodKeeper App. Availabe online: foodsafety.gov (accessed on ). 17 February.
- Greater Pittsburgh Community Food Bank Shelf Life of Food Bank Products.
- (FDA), F.a.D.A. Refrigerator & Freezer Storage Chart. Availabe online: https://www.fda. 7443. [Google Scholar]
- Huffstetler, E. Refrigerator and Freezer Storage Charts. 2019.
- Team, R. RStudio: Integrated Development Environment for R, RStudio, PBC: Boston, MA, 2025.
- <i>The Food Processor Nutrition Analysis Software</i>, 11.14. The Food Processor Nutrition Analysis Software, 11.14.9; ESHA Research, Inc.: 2022.
- Agriculture, U.D.o. How the HEI Is Scored. Availabe online: https://www.fns.usda.gov/cnpp/how-hei-scored (accessed on Nov 6). (accessed on Nov 6).
- Service, A.R. Food Patterns Equivalents Database. Availabe online: https://www.ars.usda.gov/northeast-area/beltsville-md-bhnrc/beltsville-human-nutrition-research-center/food-surveys-research-group/docs/fped-methodology/ (accessed on Nov 6). (accessed on Nov 6).
- Krebs-Smith, S.M.; Pannucci, T.E.; Subar, A.F.; Kirkpatrick, S.I.; Lerman, J.L.; Tooze, J.A.; Wilson, M.M.; Reedy, J. Update of the Healthy Eating Index: HEI-2015. Journal of the Academy of Nutrition and Dietetics, /01. [CrossRef]
- Fazzino, T.L.; Rohde, K.; Sullivan, D.K. Hyper-Palatable Foods: Development of a Quantitative Definition and Application to the US Food System Database. Obesity (Silver Spring) 2019, 27, 1761–1768. [Google Scholar] [CrossRef]
- Gamer, M.a.L. , Jim and Singh, Ian Fellows Puspendra irr: Various Coefficients of Interrater Reliability and Agreement, 0.84.1; CRAN: 2019.
- Therneau, T. A Package for Survival Analysis in R., 3.5-7; CRAN: 2023.
- Kassambara, A.K., M.; Biecek, P. survminer: Drawing Survival Curves using 'ggplot2', 0.4.9; CRAN: 2021.
- Service, F.a.N. USDA Food Plans: Monthly Cost of Food Reports. Availabe online: https://www.fns.usda.
- Agriculture, U.S.D.o. Official USDA Thrifty Food Plan: U.S. Average, 23. Availabe online: https://fns-prod.azureedge.us/sites/default/files/resource-files/Cost_Of_Food_Thrifty_Food_Plan_October_2023. 20 October.
- Poti, J.M.; Mendez, M.A.; Ng, S.W.; Popkin, B.M. Is the degree of food processing and convenience linked with the nutritional quality of foods purchased by US households? Am J Clin Nutr 2015, 101, 1251–1262. [Google Scholar] [CrossRef]
- Baker, P.; Machado, P.; Santos, T.; Sievert, K.; Backholer, K.; Hadjikakou, M.; Russell, C.; Huse, O.; Bell, C.; Scrinis, G.; et al. Ultra-processed foods and the nutrition transition: Global, regional and national trends, food systems transformations and political economy drivers. Obes Rev 2020, 21, e13126. [Google Scholar] [CrossRef]
- Insights, P.M. Ready to Eat Food Market Size Value Will Grow Over USD 489.3 Billion by 2034, at 9.7% CAGR: Prophecy Market Insights. Availabe online: https://www.globenewswire.com/news-release/2024/08/30/2938563/0/en/Ready-to-Eat-Food-Market-Size-Value-Will-Grow-Over-USD-489-3-Billion-by-2034-at-9-7-CAGR-Prophecy-Market-Insights.html (accessed on Nov 6). (accessed on Nov 6).
- Lenk, K.M.; Winkler, M.R.; Caspi, C.E.; Laska, M.N. Food shopping, home food availability, and food insecurity among customers in small food stores: an exploratory study. Translational Behavioral Medicine 10, 10. [CrossRef]
- Morland, K.; Filomena, S. Disparities in the availability of fruits and vegetables between racially segregated urban neighbourhoods | Public Health Nutrition | Cambridge Core. Public Health Nutrition. [CrossRef]
- Gebauer, H.; Laska, M.N.; Gebauer, H.; Laska, M.N. Convenience Stores Surrounding Urban Schools: An Assessment of Healthy Food Availability, Advertising, and Product Placement. Journal of Urban Health 2011 88:4, -14. [CrossRef]
- Council, I.F.I. Food & Health Survey. 2023.
- Service, U.E.R. Food Access Research Atlas. Availabe online: https://www.ers.usda.gov/data-products/food-access-research-atlas/documentation#:~:text=Using%20this%20measure%2C%20an%20estimated%201.9%20million%20households%2C%20or%201.7,20%20miles%20from%20a%20supermarket. (accessed on November). (accessed on November).
- Gustat, J.; O'Malley, K.; Luckett, B.G.; Johnson, C.C. Fresh produce consumption and the association between frequency of food shopping, car access, and distance to supermarkets. Preventive Medicine Reports, /01. [CrossRef]
- Liese, A.D.; Bell, B.A.; Barnes, T.L.; Colabianchi, N.; Hibbert, J.D.; Blake, C.E.; Freedman, D.A. Environmental influences on fruit and vegetable intake: results from a path analytic model | Public Health Nutrition | Cambridge Core. Public Health Nutrition. [CrossRef]
- Gustat, J.; Lee, Y.-S.; O'Malley, K.; Luckett, B.; Myers, L.; Terrell, L.; Amoss, L.; Fitzgerald, E.; Stevenson, P.T.; Johnson, C.C. Personal characteristics, cooking at home and shopping frequency influence consumption. Preventive Medicine Reports, /01. [CrossRef]
- Banks, J.; Fitzgibbon, M.L.; Schiffer, L.A.; Campbell, R.T.; Antonic, M.A.; Braunschweig, C.L.; Odoms-Young, A.M.; Kong, A. Relationship between Grocery Shopping Frequency and Home- and Individual-level Diet Quality among Low-income Racial/Ethnic Minority Households with Preschool-age Children. Journal of the Academy of Nutrition and Dietetics 120, 120. [CrossRef] [PubMed]
- Changes in the local food-at-home environment, supplemental nutrition assistance program participation, and dietary quality: Evidence from FoodAPS. Journal of the Agricultural and Applied Economics Association 2022, 1. [CrossRef]
Figure 1.
Bar graph depicting the mean inconvenience scores across 35 meals within each menu, with error bars showing the 95% confidence intervals. Horizontal lines indicate Tukey post-hoc test results, (** = p < 0.001 for MPF-CONV, * = p = 0.03 for UPF-CONV, ns [not significant] = p =0.22 for UPF-MPF).
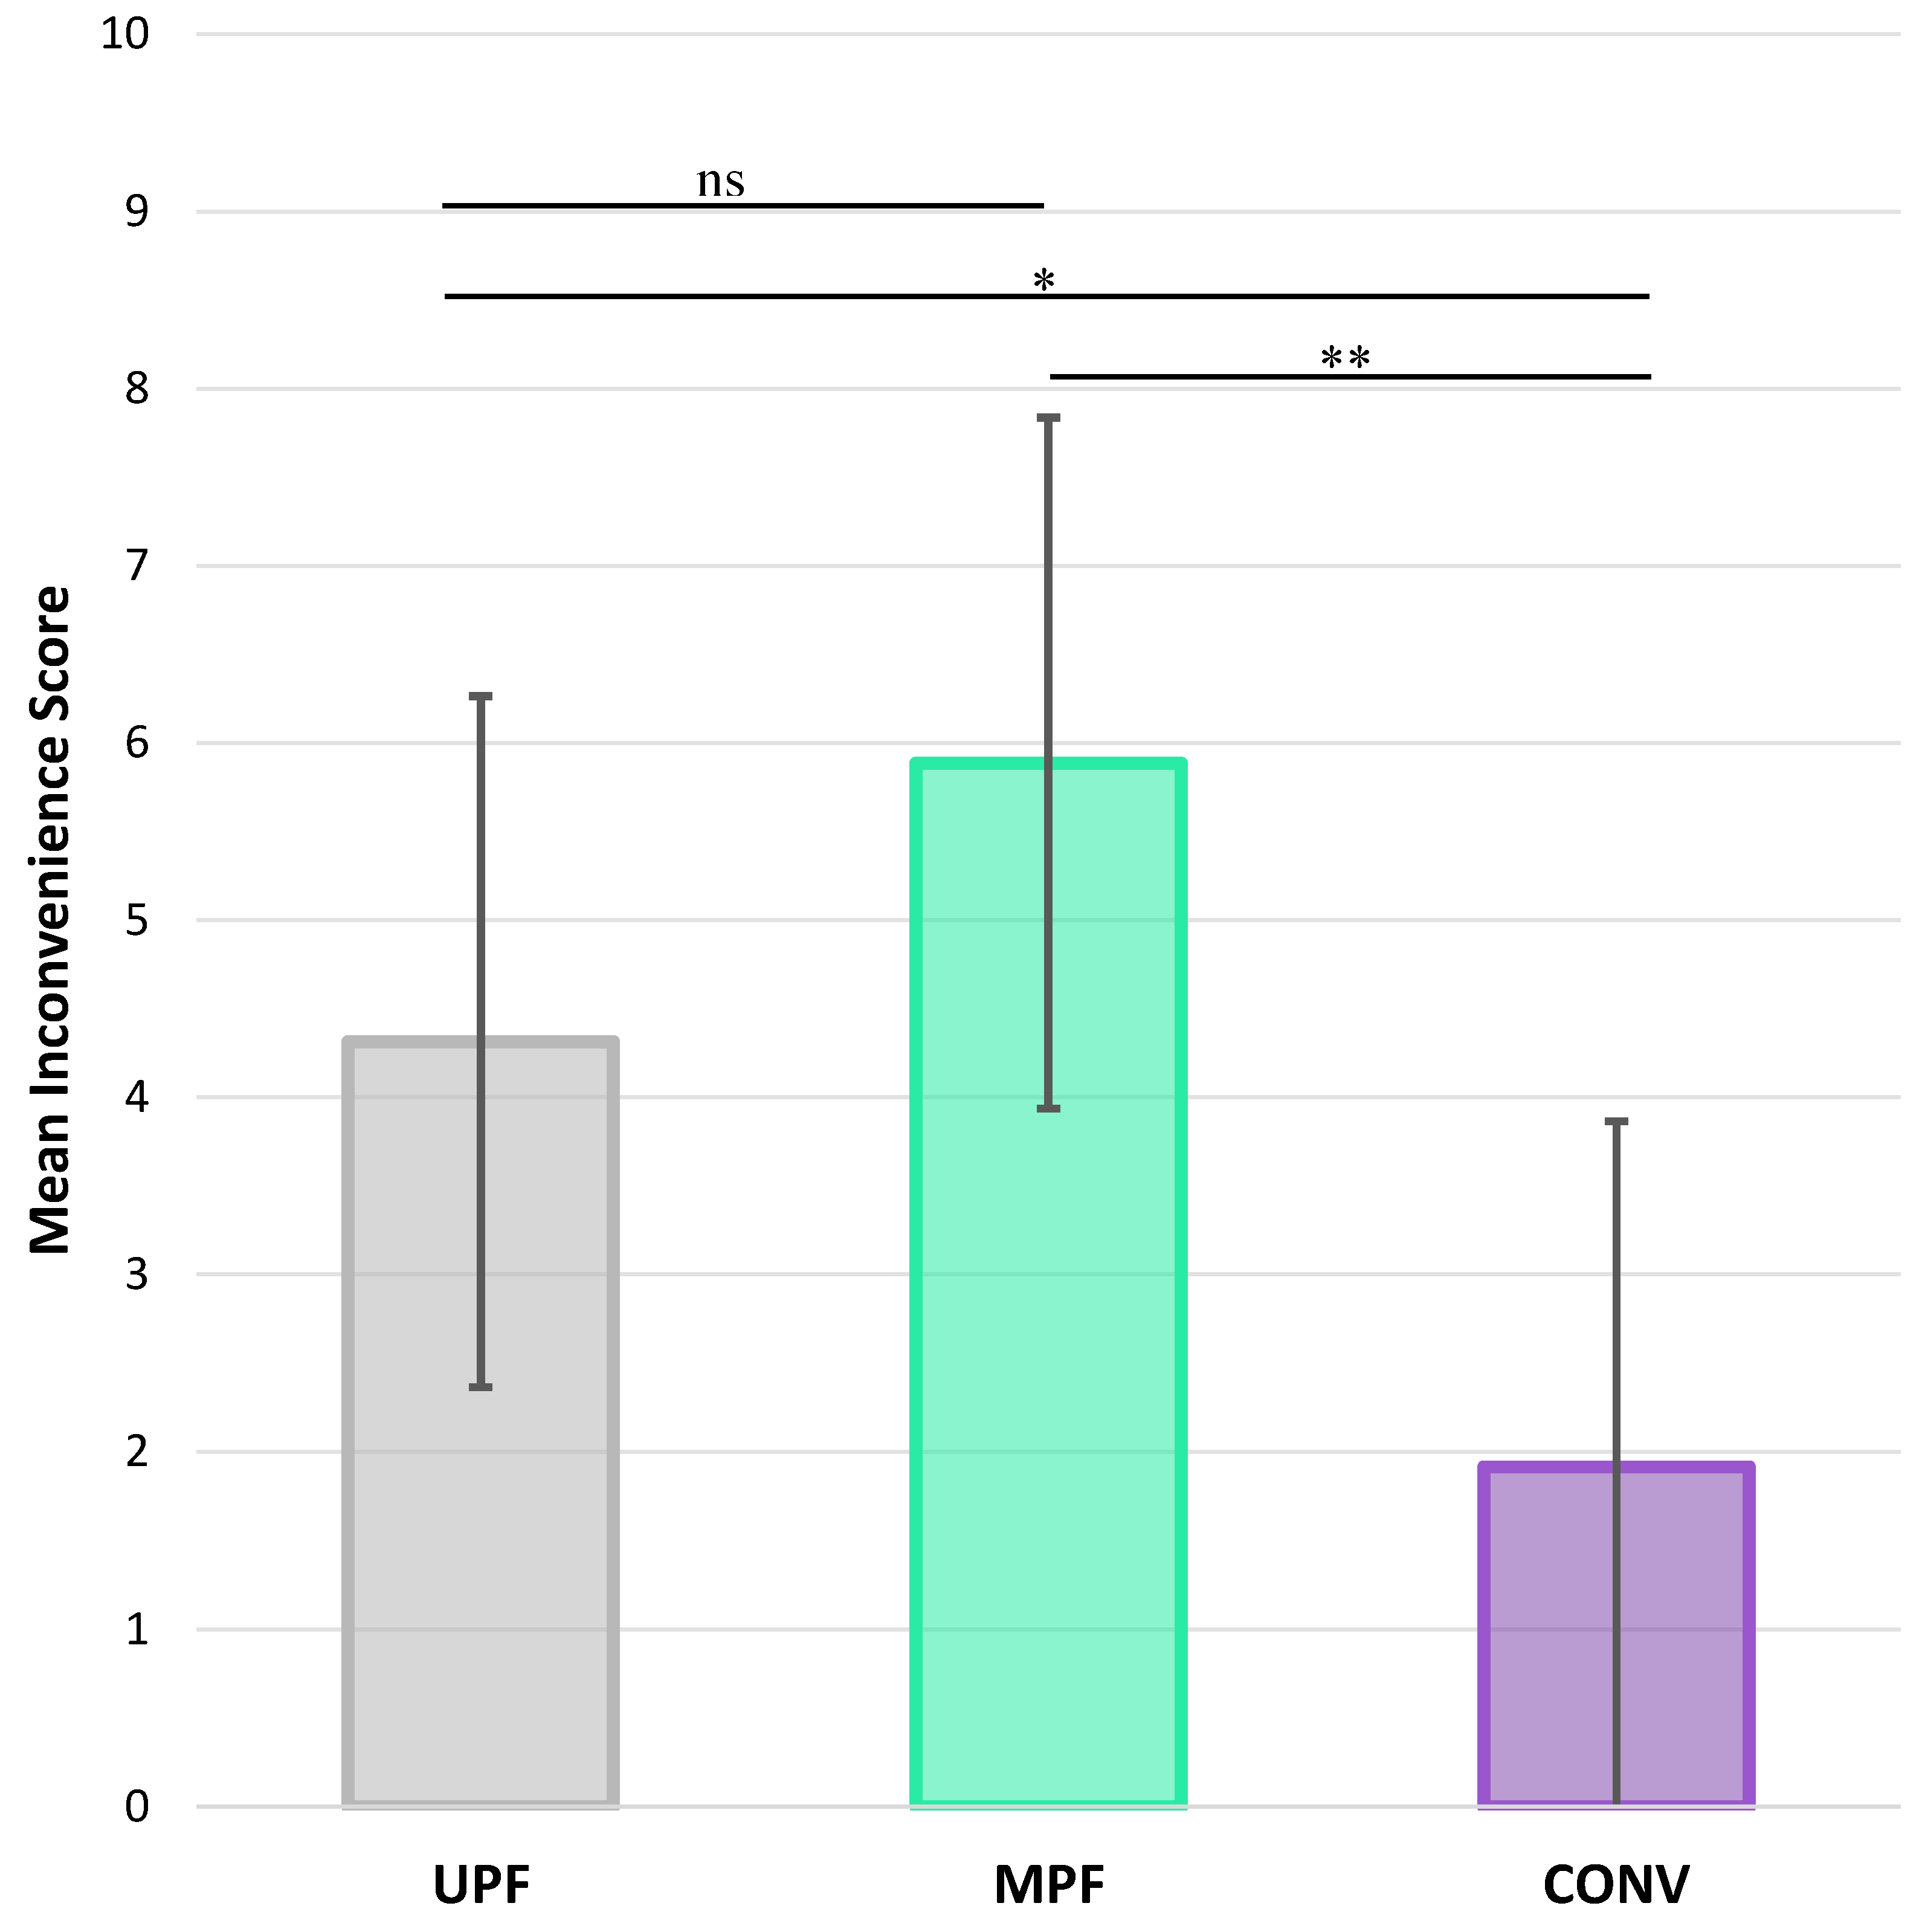
Figure 2.
(A,B) Kaplan-Meier survival curves representing the time (days) of food item shelf life across a year. Dotted lines (vertical and horizontal) indicate median survival times of 182, 30, and 182 days for unopened UPF, MPF, and CONV menus, respectively, and 14, 14, and 60 days when opened. Statistical differences between all menu groups were assessed using Wilcoxon (Gehan-Breslow) homogeneity testing of survival curves, with a p-value of p<0.001 for the unopened context and p<0.05 for opened. C. Percent of energy from each menu that are frozen, refrigerated, or shelf stable within the unopened and opened analysis for the ultra-processed food (UPF), minimally processed food (MPF), and convenience (CONV) menus.
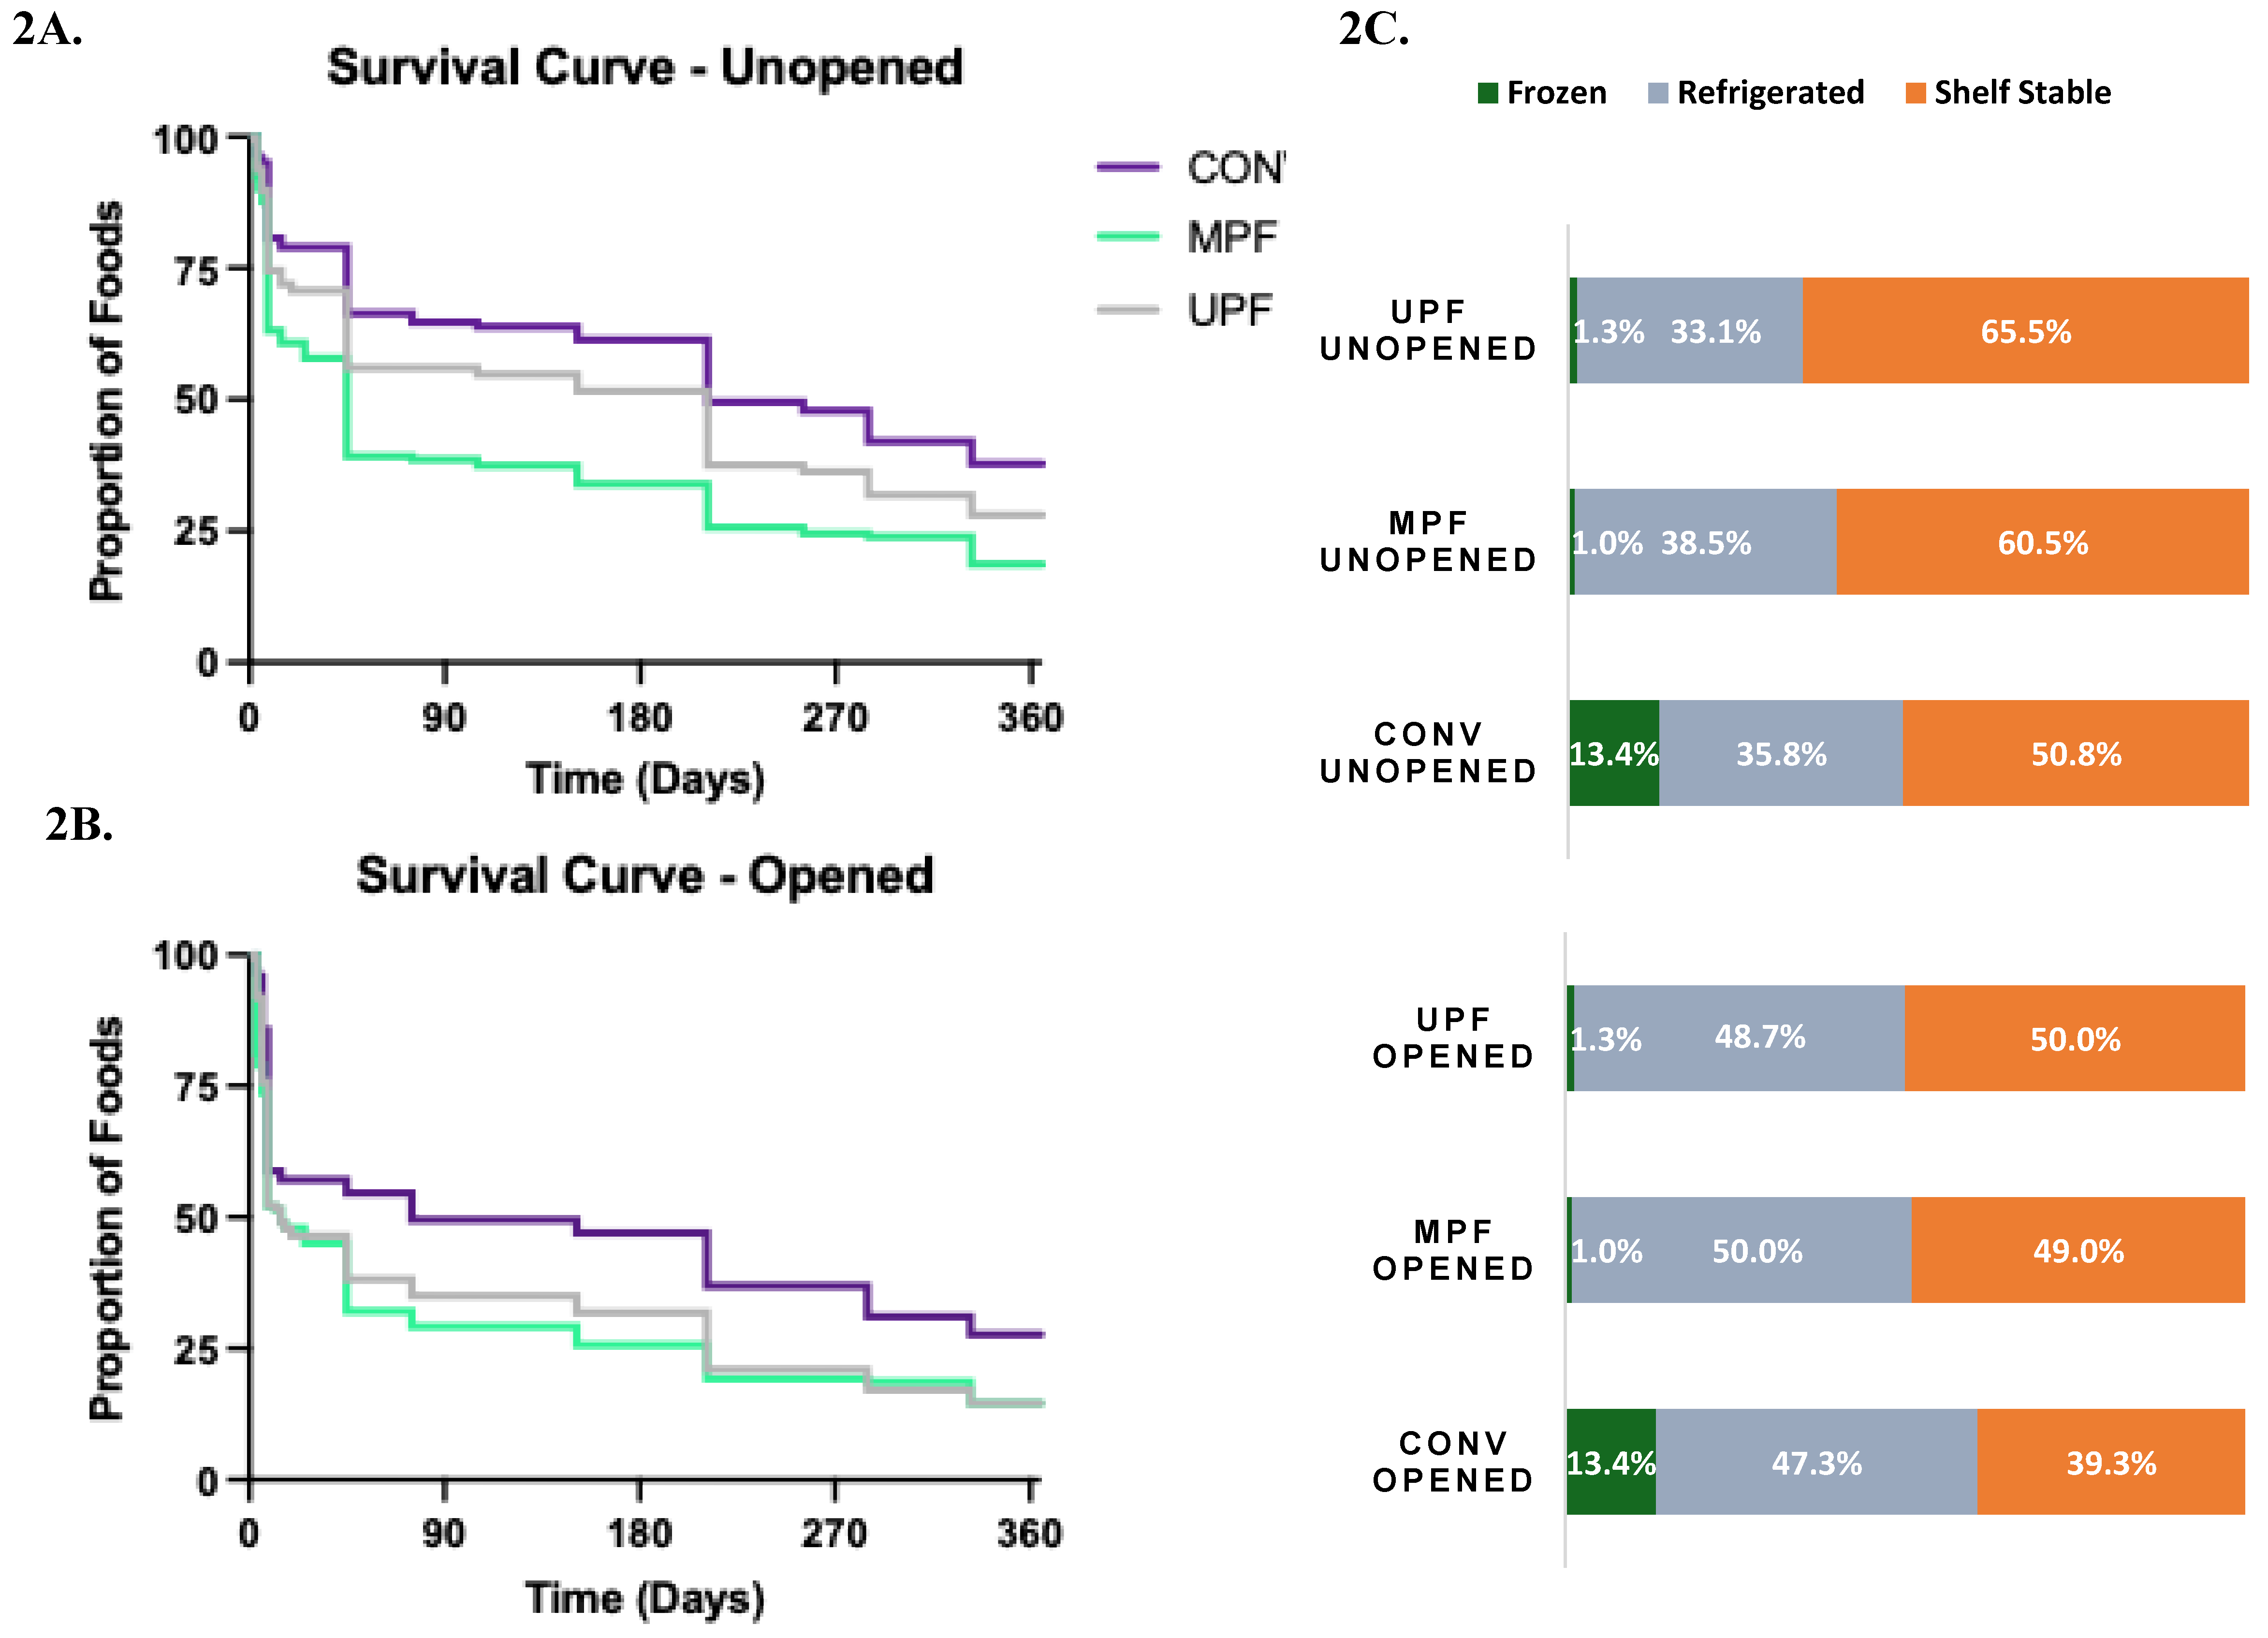
Figure 3.
Radar plot comparing the 13 components of the HEI-2015 scores across ultra-processed food (UPF), minimally processed food (MPF), and convenience (CONV) menus. The plot’s outer circumference represents optimal scores, with scores plotted as distances from the center. For adequacy components (such as whole fruits), points closer to the outer edge indicate higher, more desirable intakes. For moderation components (sodium, added sugar, refined grains, saturated fat), points closer to the outer edge indicate lower, more desirable intakes.
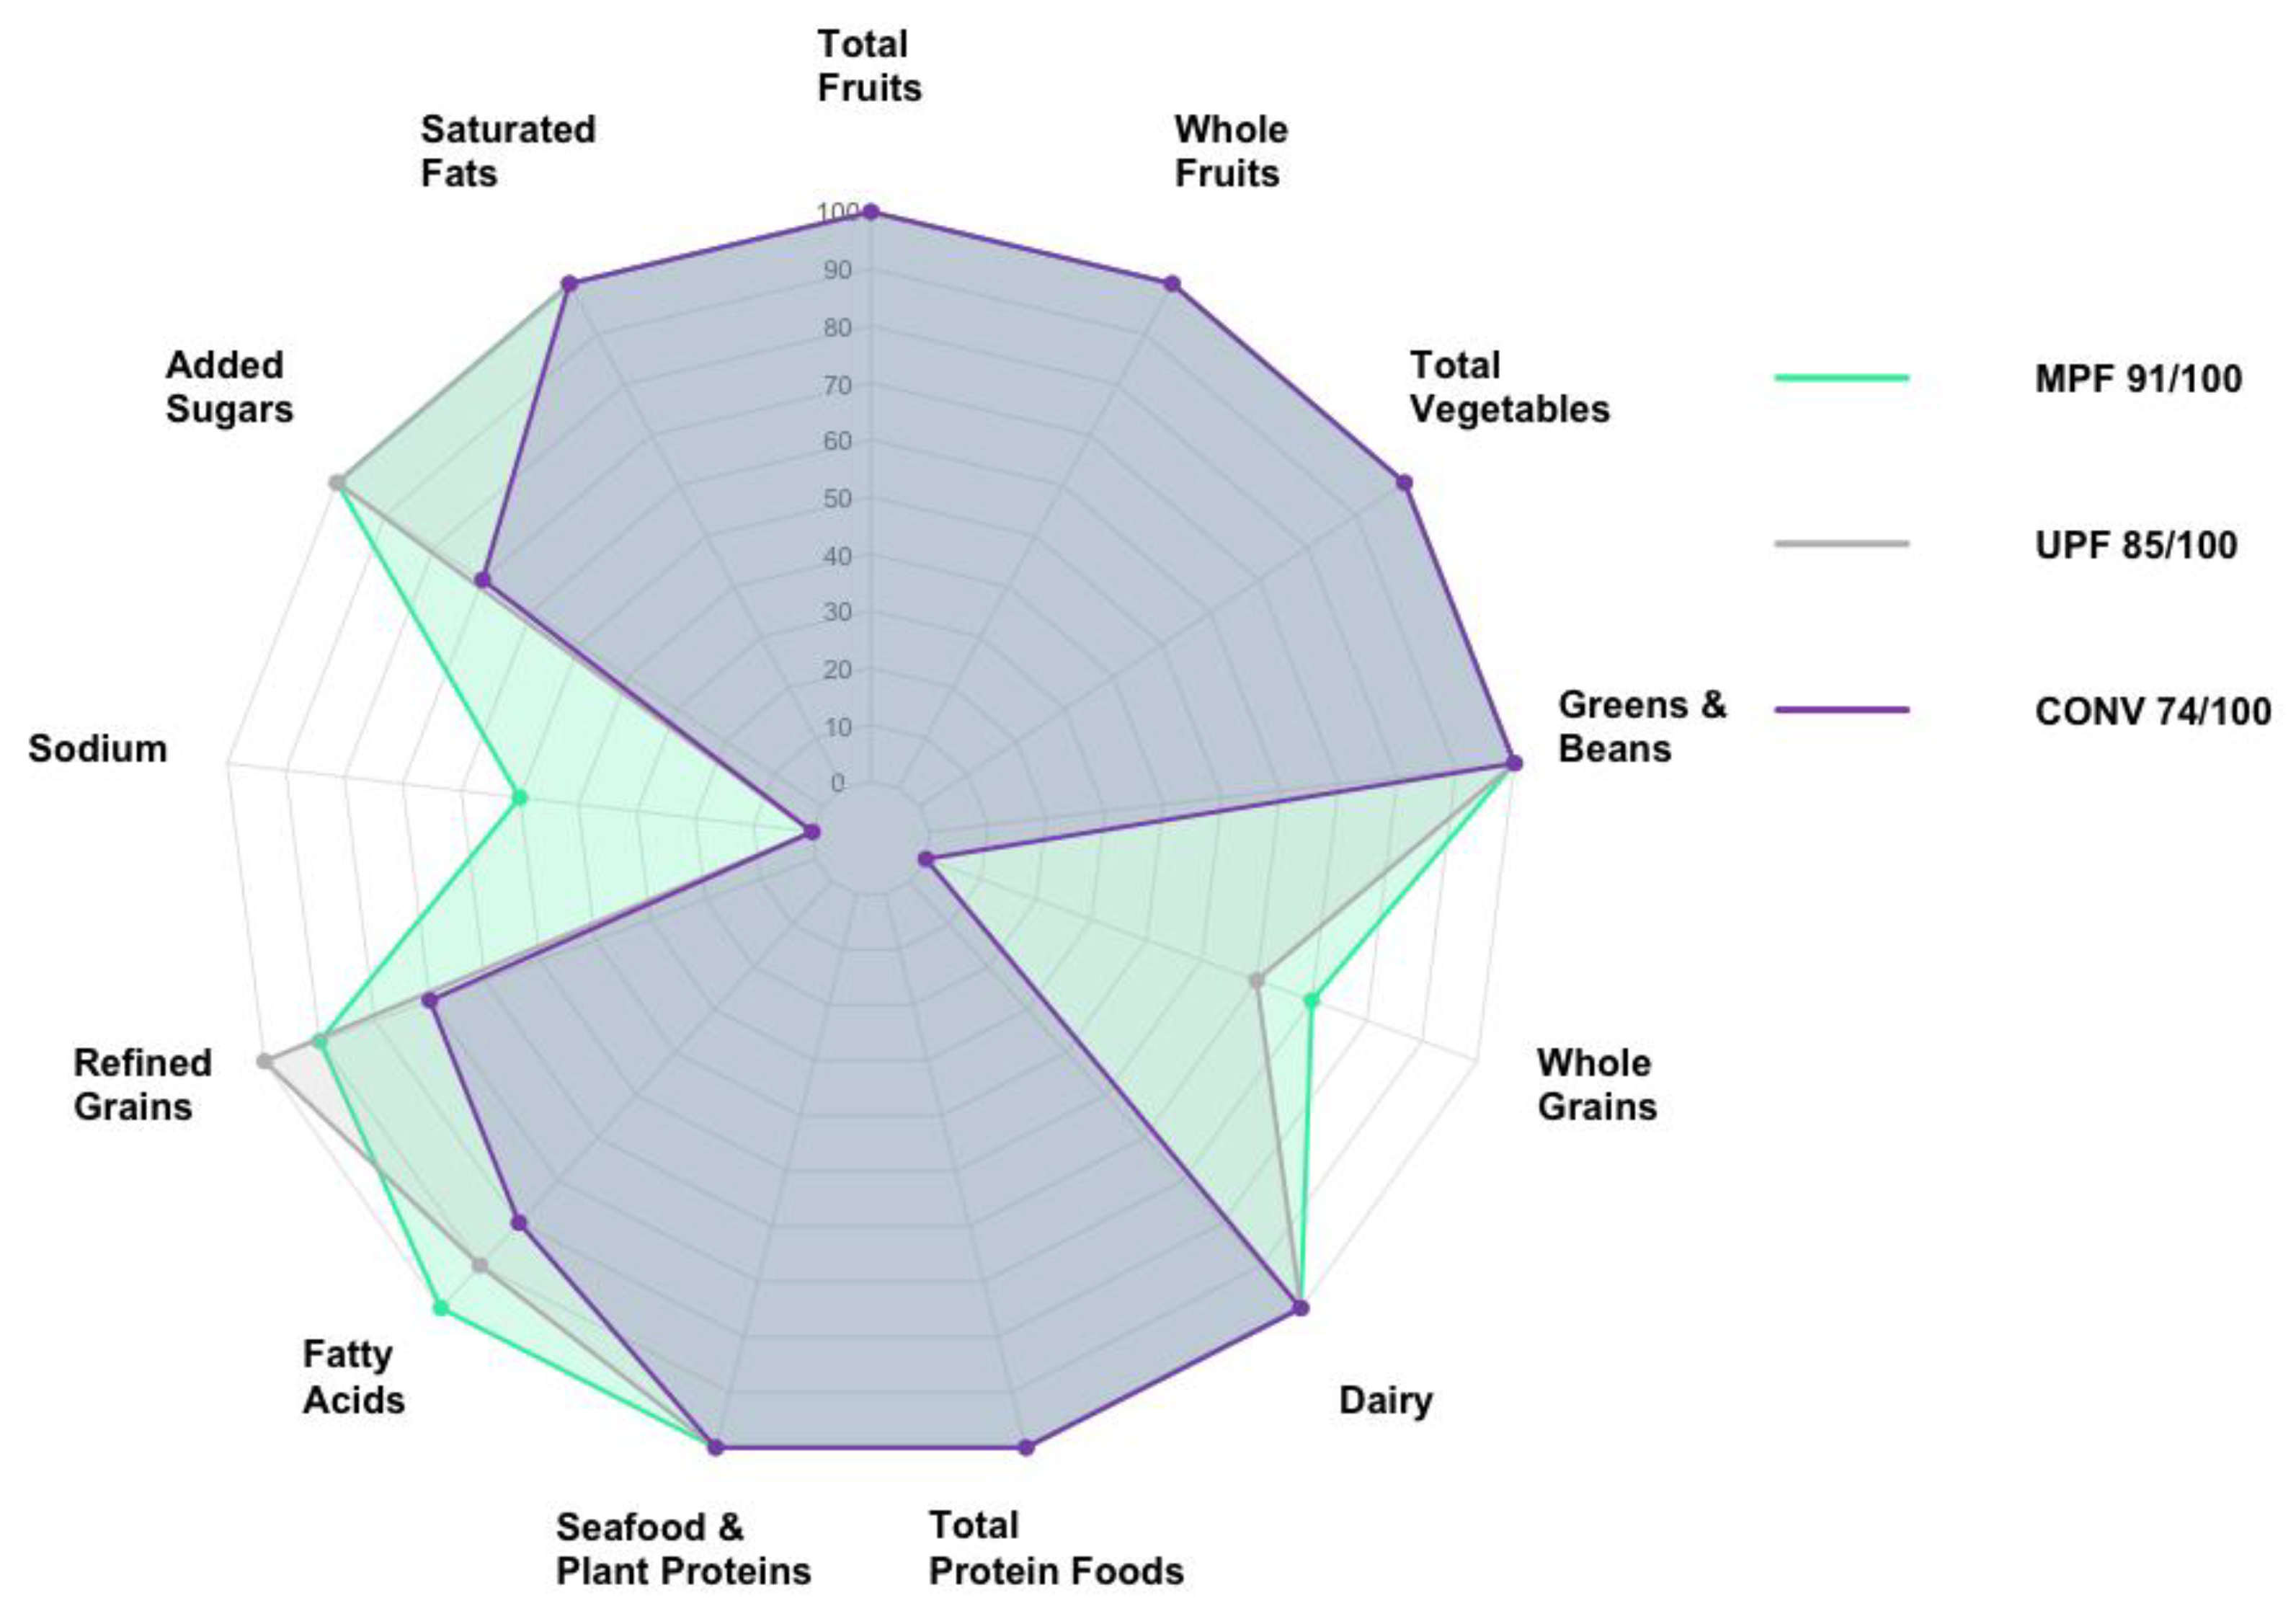
Figure 4.
Comparison of the initial serving cost of the ultra-processed food (UPF), minimally processed food (MPF), and convenience (CONV) menus and the USDA Thrifty Food Plan. The Thrifty Food Plan represents the largest maximal allotment of SNAP benefits for October 2023, a value of $71.80, providing supplemental assistance for a 14-19 year old male [45].
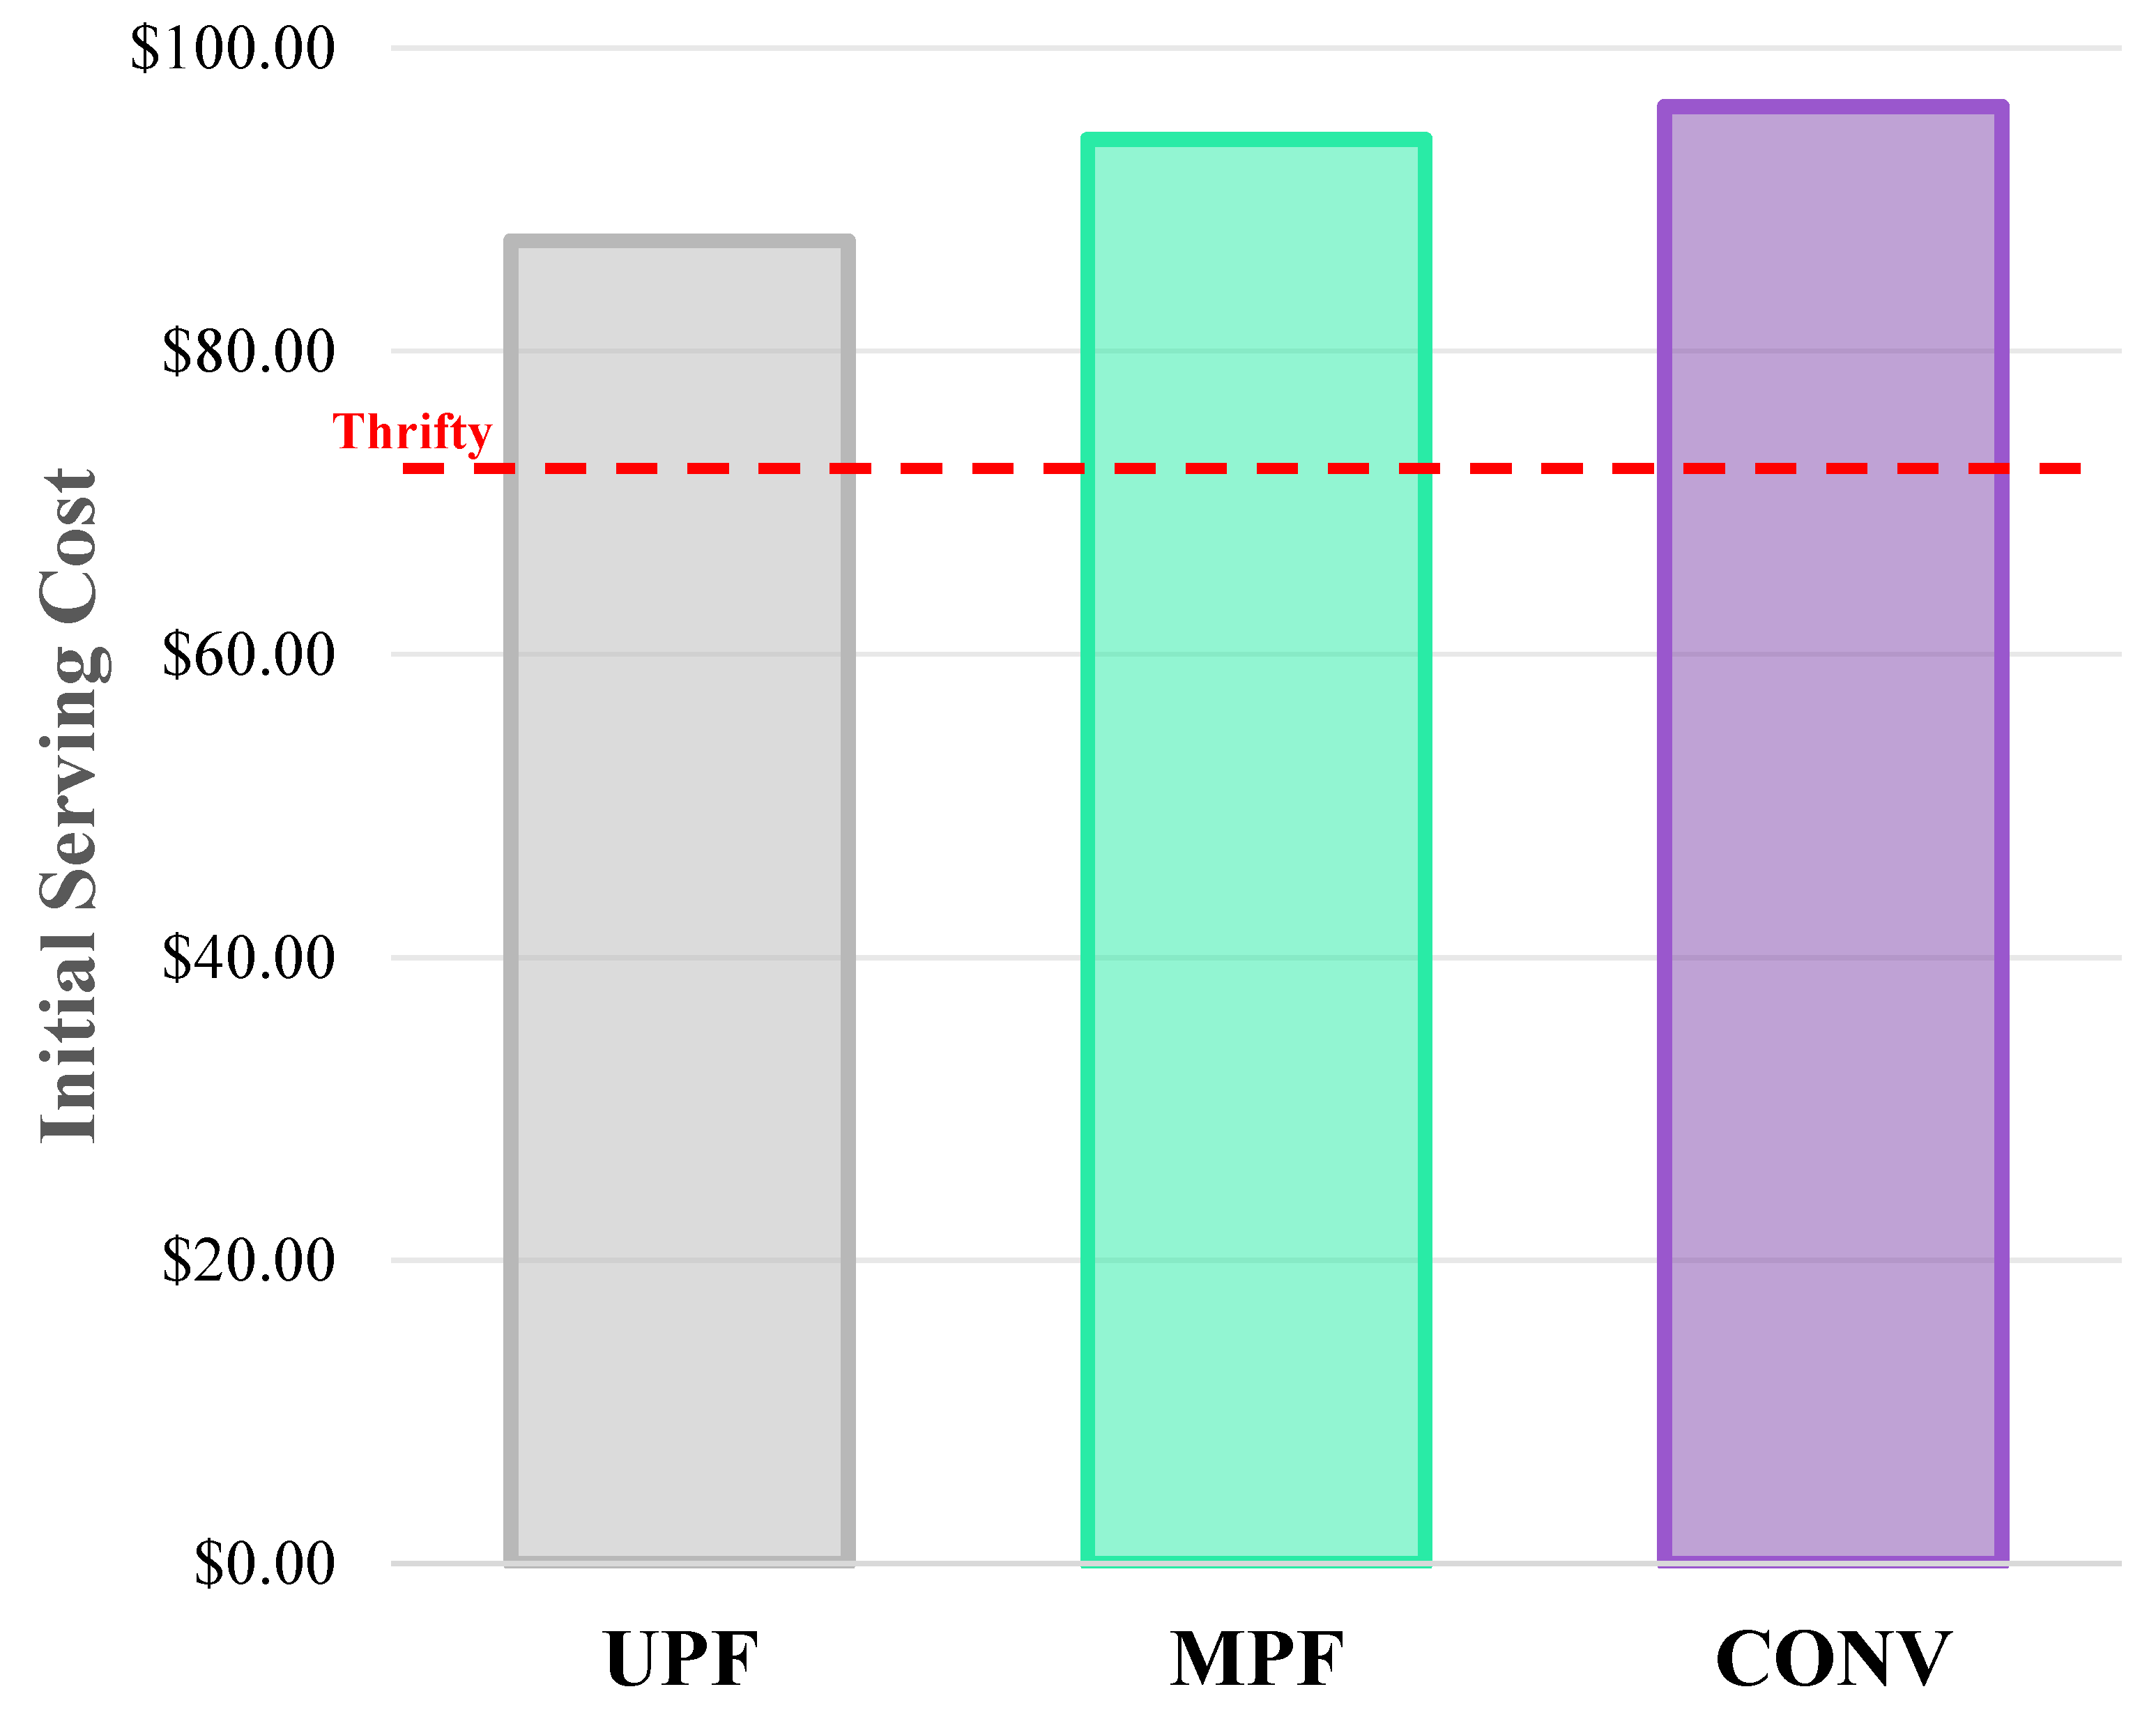
Figure 5.
Bar graph showing shopping simulation annual grocery costs for a 4-person household for the ultra-processed food (UPF), minimally processed food (MPF), and convenience (CONV) menus. The value of food items that went past expiration dates before consumption and counted as wasted was represented by diagonal hatching.
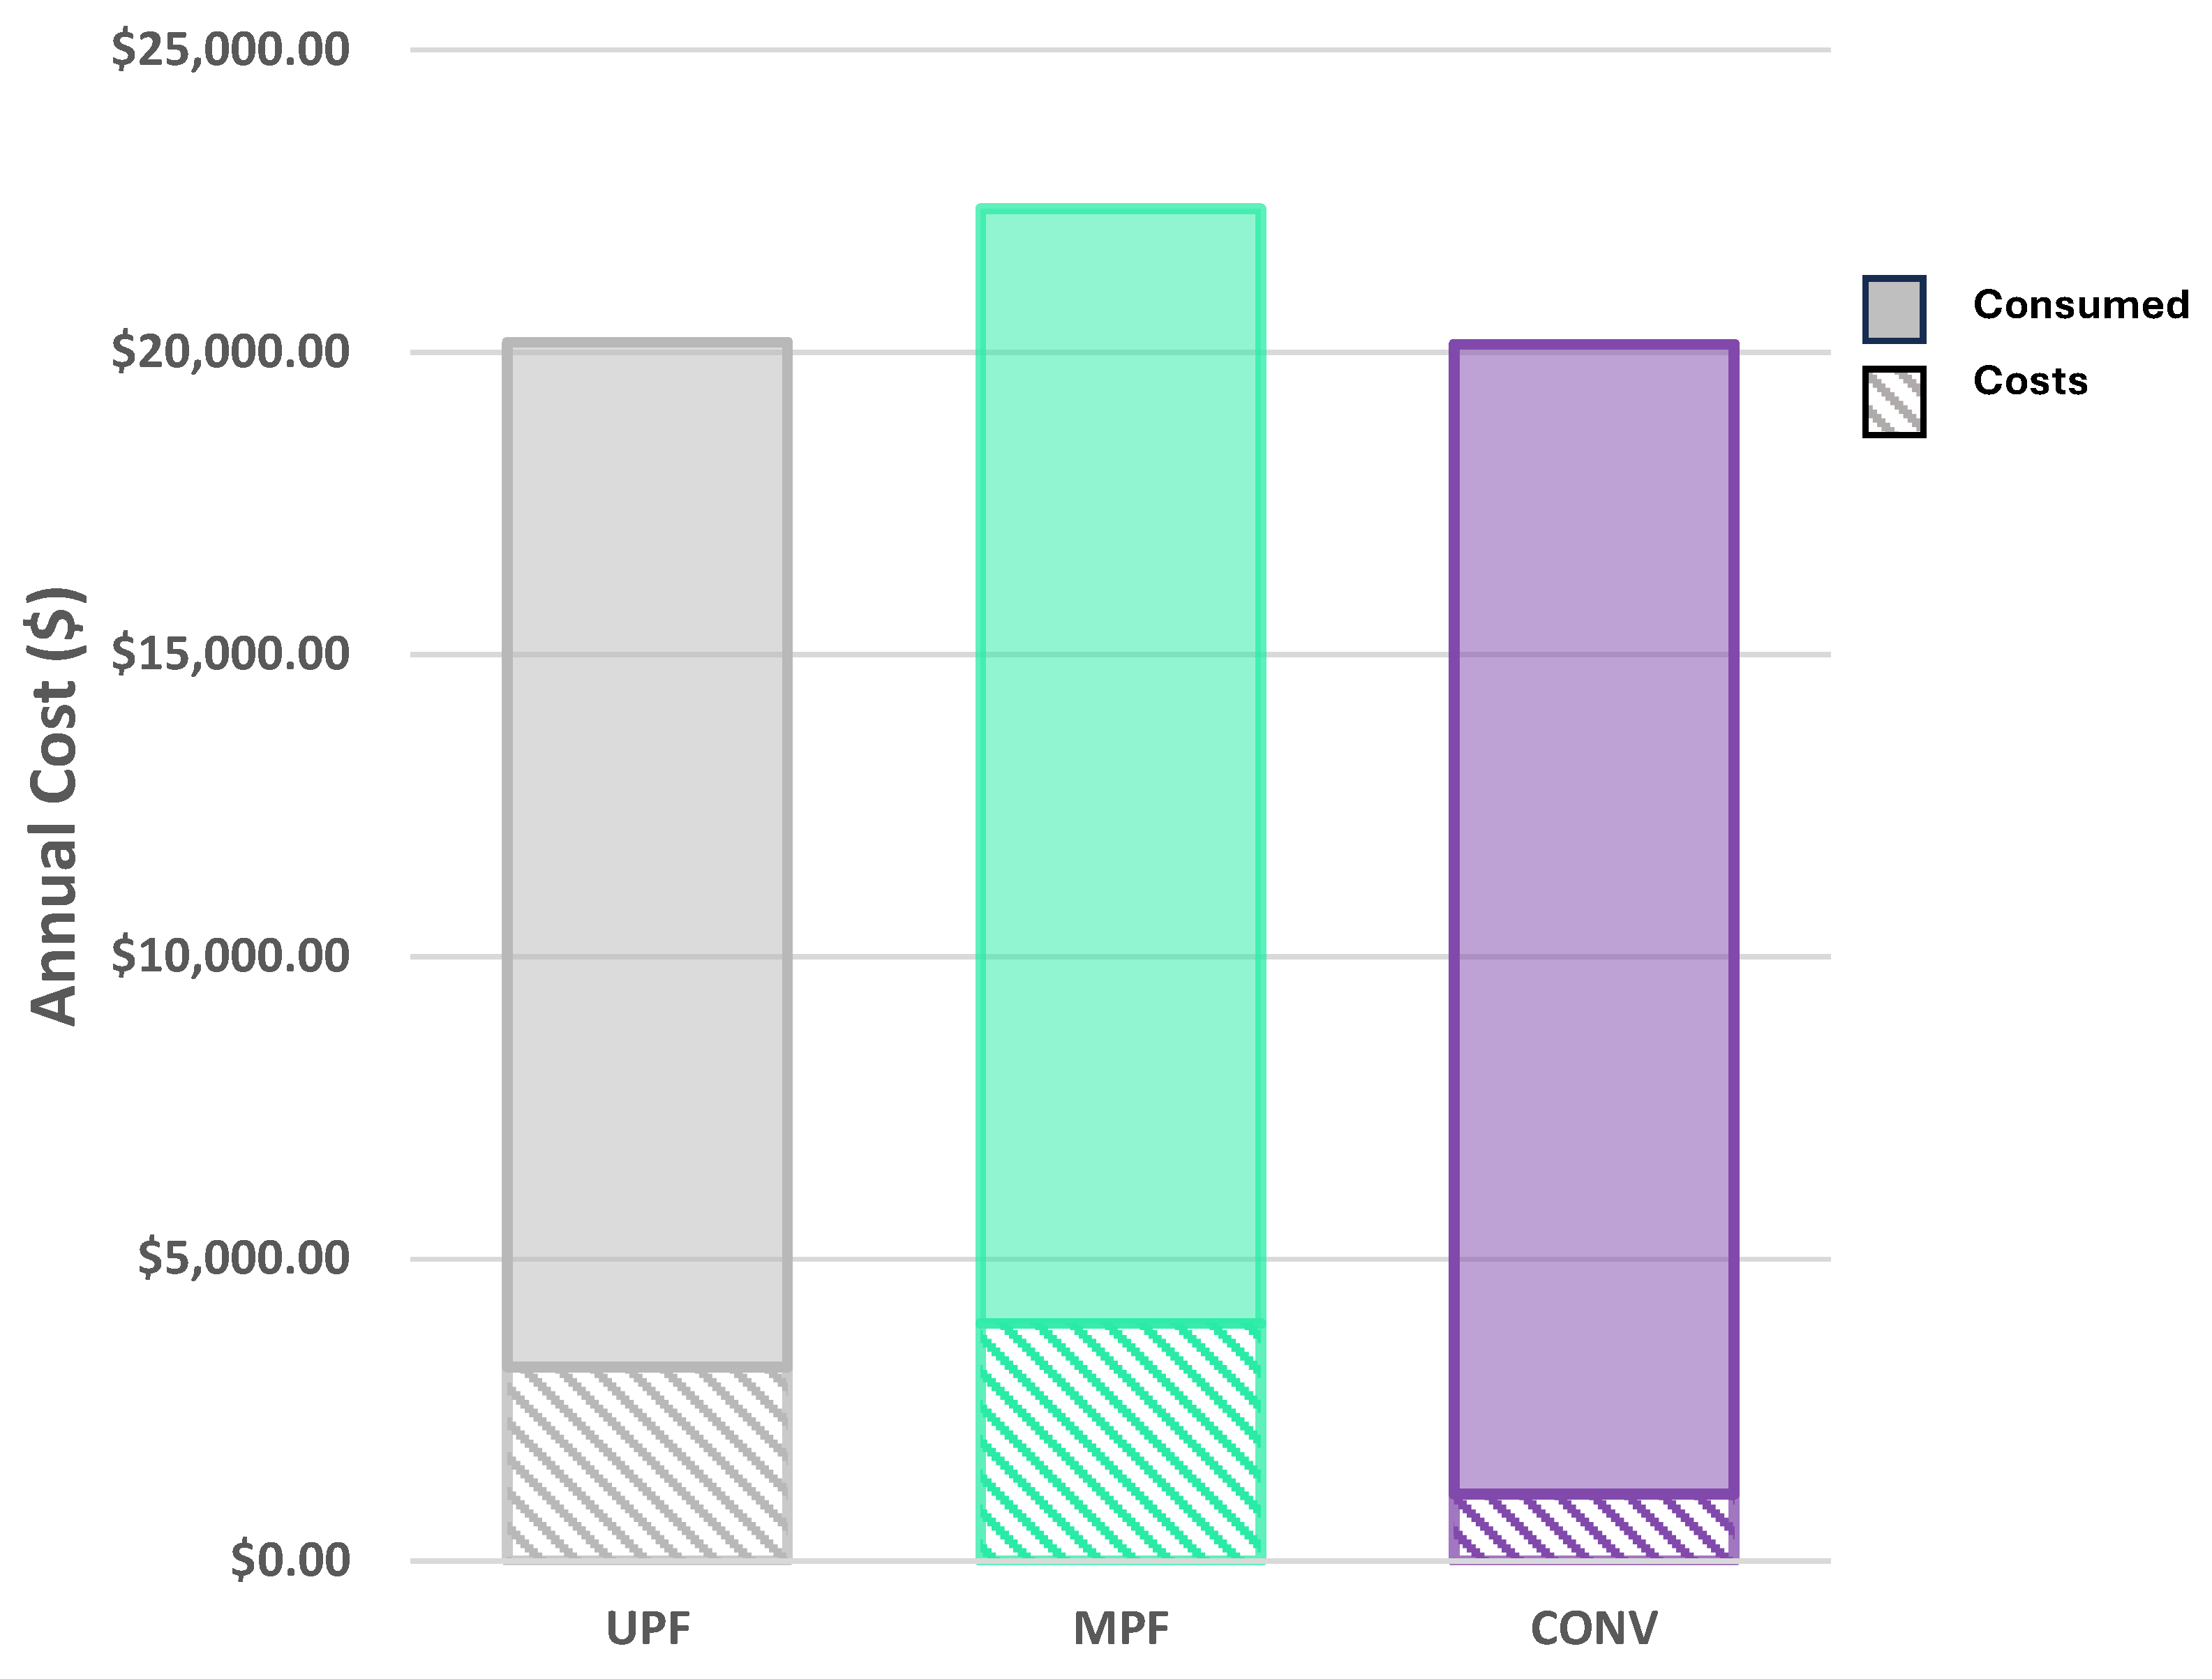
Figure 6.
Line graph depicting weekly grocery purchases required for a 4-person household to maintain the ultra-processed food (UPF), minimally processed food (MPF), and convenience (CONV) menus over a 52-week period.
Figure 6.
Line graph depicting weekly grocery purchases required for a 4-person household to maintain the ultra-processed food (UPF), minimally processed food (MPF), and convenience (CONV) menus over a 52-week period.
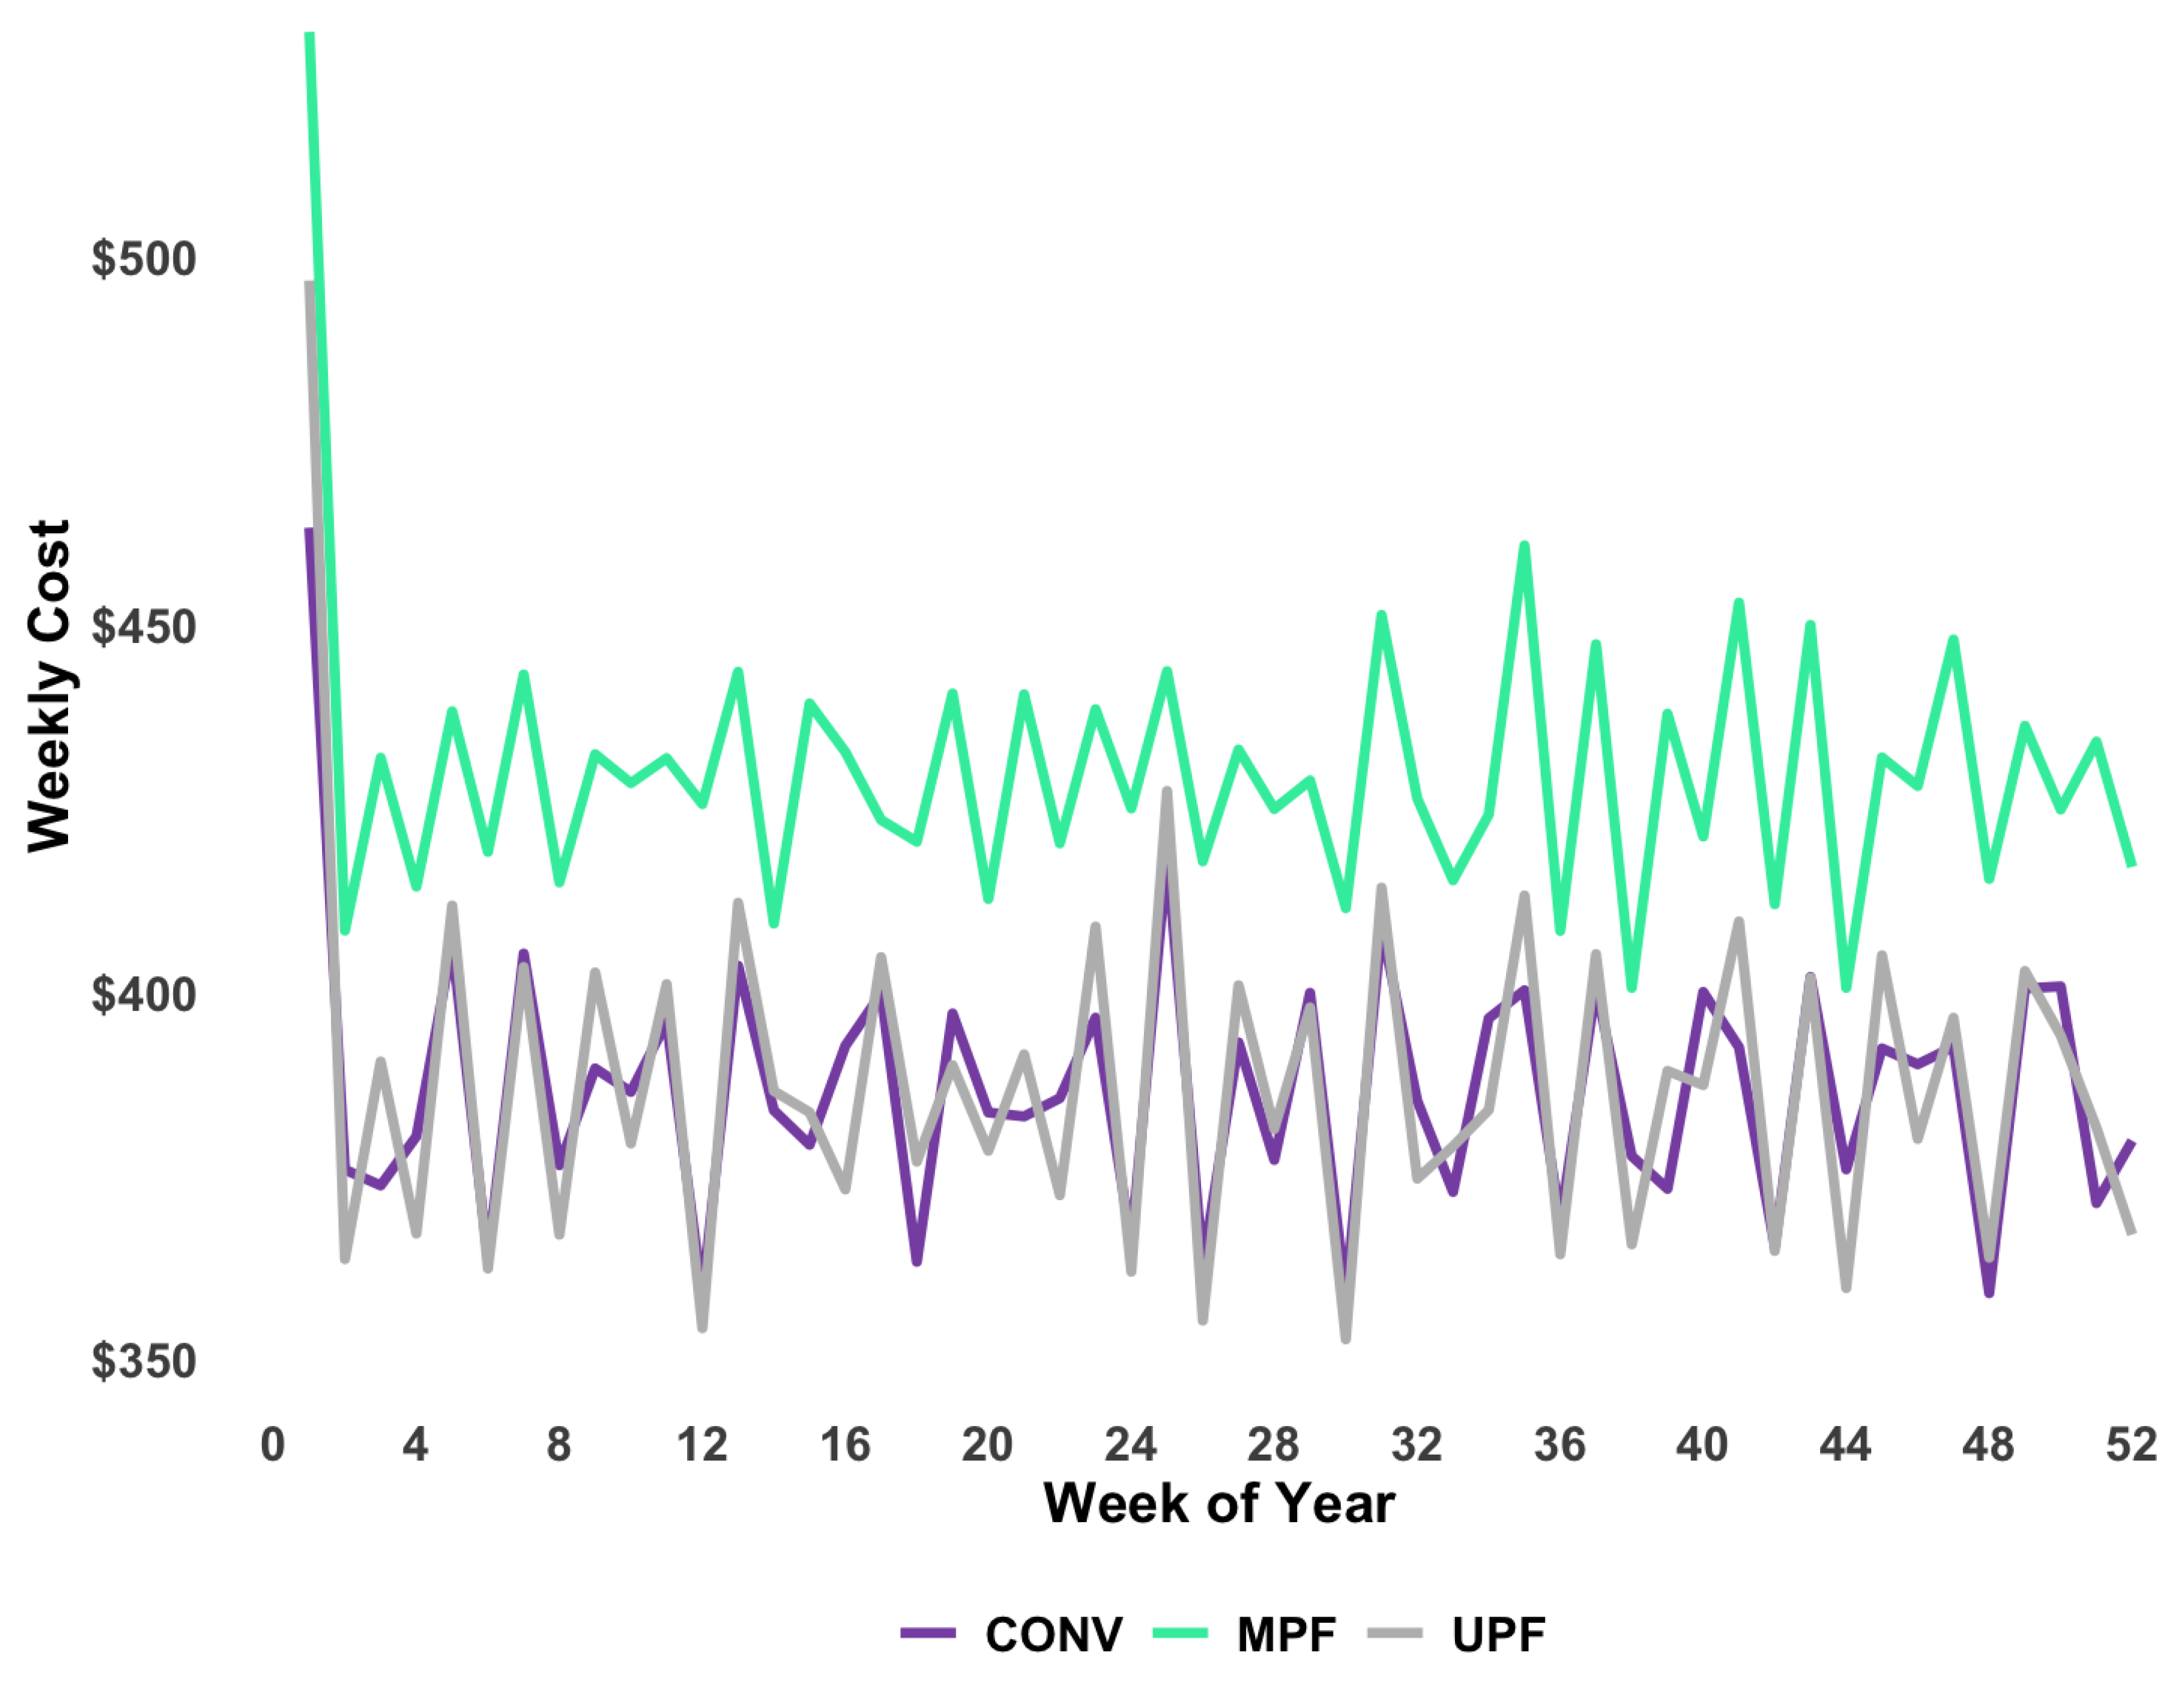

Table 1.
Food convenience classification typology adapted from Daniels et al. 2015 [26]. Foods are categorized by inconvenience levels (0-2, where higher scores indicate more preparation required) and grouped into meal ingredients, accessory ingredients, and ready-to-eat items. .
Table 1.
Food convenience classification typology adapted from Daniels et al. 2015 [26]. Foods are categorized by inconvenience levels (0-2, where higher scores indicate more preparation required) and grouped into meal ingredients, accessory ingredients, and ready-to-eat items. .
| Category | Inconvenient (2) |
Semi-Convenient (1) |
Convenient (0) |
|
|---|---|---|---|---|
| Score | ||||
| Meal Ingredients | Full (fast) Meals | |||
| (2a) Single meal components used for cooking from scratch (Fresh meat (cuts), fish and seafood, vegetables, fruit, rice, eggs, pasta and potatoes) |
(1a) Partially prepared and/or preserved single meal components (Canned, frozen, smoked or pre- prepared fish or seafood, frozen meat products, potato croquettes, French fries, frozen, tinned or dried vegetables (e.g., dried beans), canned, dried, frozen or candied fruits) |
(0a) Complete fast meals (e.g., ready-to-(h)eat meals (based on vegetables, meat or fish), premade soups, pizza, lasagna, or canned pasta dishes, ready-made diet meals, baby food, ready-to-eat sandwiches) |
(0a) Meals out (e.g., away-from-home food or restaurant expenditures) |
|
| Accessory Ingredients | ||||
| (2b) Accessory meal ingredients (e.g., fats, oils, dried herbs, spices, flour, yeast, starch and flavors) |
(1b) Ready-made accessory stuffs (e.g., sauces (e.g., pre-prepared pesto or store- bought pasta sauces, mayonnaise, mustard, apple sauce), bouillon cubes, meat juices, liquid meat preparations) |
|||
| (1c) ‘Other’ (e.g., Bread, sandwich fillings, milk products and breakfast cereals) |
(0c) ‘Ready-to-eat’ snacks (e.g., biscuits, cakes, sweets, crisps, ice cream) |
|||
Table 2.
2000 kcal 7-day minimally processed food (MPF) menu with < 20% energy from ultra-processed foods (Nova category 4) Day 1-4.
Table 2.
2000 kcal 7-day minimally processed food (MPF) menu with < 20% energy from ultra-processed foods (Nova category 4) Day 1-4.
| DAY 1 | DAY 2 | DAY 3 | DAY 4 | |
|---|---|---|---|---|
| BREAKFAST |
Breakfast burrito 1 flour tortilla 7” in diameter ¼ c. liquid egg whites (in 1 tsp butter) 1/3 c. canned black beans 1 oz shredded cheddar cheese 1 c. orange juice 1 c. nonfat milk |
Hot cereal ½ c. instant oatmeal 1 tbsp brown sugar 2 tbsp raisins 1 tsp butter ½ c. nonfat milk 1 c. apple juice |
Cold cereal 1 c. honey nut oat cereal † 1 c. nonfat milk 1 small banana 1 slice whole wheat toast † 1 tsp butter 1 c. grapefruit juice |
English muffin 1 whole wheat English muffin † 2 tsp butter 1 tbsp jam † 1 c. grapefruit juice 1 hard-boiled egg |
| LUNCH |
Turkey sandwich 2 slices whole wheat bread † 3 oz deli turkey † 2 slices tomato ¼ c. shredded romaine lettuce 1/8 c. mushrooms 1 ½ oz shredded mozzarella 1 tsp yellow mustard 3/4 c. frozen grilled potatoes 12 oz sparkling water* |
Taco salad 2 oz tortilla chips 2 oz ground turkey, sauteed in 1 tbsp sunflower oil ½ c. canned black beans ½ c. iceberg lettuce 1 tbsp canned diced tomato 1 oz shredded cheddar 2 tbsp salsa ½ c. guacamole 12 oz sparkling water † |
Tuna fish sandwich 2 slices rye bread* 3 oz cracked black pepper tuna 2 tsp mayonnaise † 1 tbsp diced celery ¼ c. shredded romaine lettuce 2 slices tomato 1 c. pear slices 1 c. nonfat milk |
Black bean soup 2 ¾ c. canned black bean soup 2 oz whole wheat bread/dinner roll* ½ c. frozen carrots 1 c. nonfat milk |
| DINNER |
Salmon rice bowl 2 packets lemon pepper salmon ½ c. white rice 1 tbsp chopped scallions ¼ c. diced cucumber 1 tbsp sesame seeds 3 tsp mayonnaise † 1 tsp hot sauce Toasted nori (4g package) ½ c. steamed broccoli 1 c. nonfat milk |
Spinach pasta bake 1 c. gluten-free pasta 2/3 c. cooked spinach ½ c. skim milk ricotta † ½ c. diced tomatoes 1 oz mozzarella cheese 1 oz whole wheat dinner roll* 1 c. nonfat milk |
Chicken dinner 3 oz rotisserie chicken 1 c. mixed greens 1.5 c. yams ½ c. sweet peas 1 oz whole wheat dinner roll † |
Pasta with meat sauce 1 c. gluten-free pasta ½ c. tomato sauce 3 oz extra lean group beef), in 2 tsp vegetable oil 3 tbsp grated Parmesan cheese Spinach salad 1 c. baby spinach leaves 1 c. mandarin oranges ½ oz glazed walnuts 3 tsp thousand island salad dressing † 1 c. nonfat milk |
| SNACK | 1 c. homemade fruit cocktail | ½ oz roasted almonds ¼ c. mandarin oranges 2 tbsp raisins |
¼ c. dried apricots 5 oz low-fat yogurt 1 oz brown sugar 1 oz strawberries |
1 c. low-fat yogurt 1 tbsp brown sugar |
† Denotes foods from Nova Category 4.
Table 3.
2000 kcal 7-day minimally processed food (MPF) menu with < 20% energy from ultra-processed foods Nova category 4) Day 5-7.
Table 3.
2000 kcal 7-day minimally processed food (MPF) menu with < 20% energy from ultra-processed foods Nova category 4) Day 5-7.
| DAY 5 | DAY 6 | DAY 7 | |
|---|---|---|---|
| BREAKFAST |
Cold cereal 1 c. shredded wheat cereal † 1 tbsp raisins 1 c. nonfat milk ½ c. peach slices 1 slice whole wheat toast † 1 tsp butter 1 tsp jelly † |
Peanut butter toast 2 slices whole wheat toast † 2 tsp butter 2 tbsp peanut butter ½ c. peach slices 1 c. nonfat milk |
Hot cereal ½ c. Instant oatmeal 2 tbsp raisins ½ c. nonfat milk 1 c. pear slices |
| LUNCH |
Chicken sandwich 2 oz whole wheat pita bread † ¼ c. romaine lettuce 2 slices tomato 3 oz deli-style turkey 1 tbsp thousand island dressing † 1 tsp yellow mustard ½ c. applesauce † 1 c. tomato juice † |
Chili on a baked potato 1 c. vegetarian chili 2 oz ground turkey sauteed in 1 tbsp canola oil 1 medium baked potato ½ c. pear slices ¾ c. grapefruit juice |
Clam chowder 1 c. soup ½ c. mushrooms ½ c. onions ¾ c. mixed vegetables 10 whole wheat crackers 1 c. nonfat milk |
| DINNER |
Steak dinner 5 oz grilled top loin steak ¾ c. frozen potatoes ½ c. frozen carrots 2 oz whole wheat dinner roll † 1 tsp butter 1 c. nonfat milk |
Pizza 2 7-inch tortillas (7”) 2 oz shredded mozzarella cheese ¼ c. tomato sauce 1 oz hot pork sausage † ¼ c. roasted red bell peppers 2 tbsp mushrooms 2 tbsp onions Green salad 1 c. leafy greens 3 tsp Italian salad dressing † 1 c. nonfat milk |
Vegetable stir fry 4 oz firm tofu † ½ c. water chestnuts † ¼ c. canned carrots 1 c. brown rice and quinoa with garlic 1 c. grapefruit juice |
| SNACK | 1 c. strawberry kefir † | 5 whole wheat crackers 1 oz honey-roasted chickpeas † ½ c. homemade fruit cocktail |
1 oz salt and pepper cashews 1 c. sliced peaches 1 c. plain greek yogurt 2 tbsp brown sugar |
Table 4.
2000 kcal 7-day convenience menu Day 1-4 .
| DAY 1 | DAY 2 | DAY 3 | DAY 4 | |
|---|---|---|---|---|
| BREAKFAST |
1 ct. Breakfast burrito 1 c. orange juice 1 c. nonfat milk |
Hot cereal ½ c. instant oatmeal 1 tsp soft margarine ½ c. nonfat ultrafiltered milk 1 c. apple juice |
Cold cereal 1 c. honey nut oat cereal 1 c. nonfat ultrafiltered milk 1 small banana* 1 slice whole wheat toast 1 tsp soft margarine 1 c. grapefruit juice |
English muffin 1 whole wheat English muffin 2 tsp soft margarine 1 tbsp jam 1 c. grapefruit juice 1 hard-boiled egg |
| LUNCH |
1 ct. Turkey and cheese sandwich 2 oz. canned tomato ¼ c. shredded romaine lettuce* 1/8 c. mushrooms 1 tsp yellow* mustard 3/4 c. frozen grilled potatoes 12 oz sparkling water |
1 ct. Chef salad kit 2 oz flavored tortilla chips ½ c. canned black beans 2 tbsp salsa ½ c. guacamole 12 oz sparkling water |
Tuna fish sandwich 2 slices rye bread 4 oz tuna salad ¼ c. shredded romaine lettuce* 2 oz. canned tomato 1 serving pear slices 1 c. nonfat ultrafiltered milk |
Black bean soup 2 ¾ c. canned black bean soup 2 oz whole wheat bread/dinner roll ½ c. canned carrots 1 c. nonfat ultrafiltered milk |
| DINNER |
Salmon rice bowl 2 packets lemon pepper salmon ½ c. white rice 1 tbsp chopped scallions* ¼ c. diced cucumber* 1 tbsp sesame seeds* 3 tsp mayonnaise 1 tsp hot sauce* Toasted nori (4g package)* ½ c. steamed broccoli* 1 c. nonfat ultrafiltered milk |
2 ½ c. Spinach ricotta ravioli ½ c. diced tomatoes 1 oz whole wheat dinner roll 1 c. nonfat ultrafiltered milk |
1 ct. chicken marsala 1 c. mixed greens 1 oz whole wheat dinner roll |
3 c. Pasta with meat sauce Spinach salad 1 c. baby spinach leaves* 2 servings mandarin oranges ½ oz glazed walnuts 3 tsp thousand island salad dressing 1 c. nonfat ultrafiltered milk |
| SNACK | 2 sv. fruit cocktail | ½ oz roasted almonds ¼ c. mandarin oranges 2 tbsp raisins |
¼ c. dried apricots 6 oz low-fat strawberry yogurt |
1 c. low-fat vanilla yogurt |
∗ denotes foods from Nova Categories 1-3 (i.e., minimally processed foods).
Table 5.
2000 kcal 7-day convenience menu Day 5-7.
| DAY 5 | DAY 6 | DAY 7 | |
|---|---|---|---|
| BREAKFAST |
Cold cereal 1 c. shredded wheat raisin cereal 1 c. nonfat ultrafiltered milk 1 sv. peach slices 1 slice whole wheat toast 1 tsp soft margarine 1 tsp jelly |
1 ct. Peanut butter pie 1 sv. peach slices 1 c. nonfat ultrafiltered milk |
Hot cereal ½ c. Instant oatmeal ½ c. nonfat ultrafiltered milk 2 sv. pear slices |
| LUNCH |
1 ct. Chicken caesar wrap 2 tbsp. canned tomato 1 tsp yellow mustard* ½ c. applesauce 1 c. tomato juice |
Chili and potato 1 c. turkey chili ¾ c. frozen grilled potato 1 sv.. pear slices ¾ c. mixed fruit juice |
Clam chowder 1 c. soup ½ c. mushrooms ½ c. onions ¾ c. mixed vegetables 10 whole wheat crackers 1 c. nonfat ultrafiltered milk |
| DINNER |
1 ct. Salisbury Steak and potatoes ½ c. honey glazed carrots 2 oz whole wheat dinner roll 1 tsp soft margarine 1 c. nonfat ultrafiltered milk |
1 ct. Pizza burrito 2 tbsp mushrooms Green salad 1 c. leafy greens* 3 tsp Italian salad dressing 1 c. nonfat ultrafiltered milk |
1 ct Tofu stir fry ½ c. water chestnuts ¼ c. canned carrots 1 c. cran-raspberry juice |
| SNACK | 1 c. strawberry kefir | 5 whole wheat crackers 1 oz honey-roasted chickpeas 1 sv. fruit cocktail |
1 oz dill pickle cashews 2 sv. sliced peaches 1 c. vanilla Greek yogurt |
∗ denotes foods from Nova Categories 1-3 (i.e., minimally processed).
Table 6.
Percentage of energy from each Nova category.
| UPF | MPF | CONV | |
|---|---|---|---|
| Group 1 and 2 Foods (minimally processed, unprocessed, and processed culinary ingredients) | 6% | 35% | 2% |
| Group 3 Foods (processed foods) | 3% | 45% | 2% |
| Group 4 Foods (ultra-processed foods) | 91% | 20% | 96% |
Table 7.
Nutrient Profile comparison of menus aligned with Dietary Guidelines for Americans.
| Nutrients | UPF | MPF | CONV |
|---|---|---|---|
| MACRONUTRIENTS | |||
| Energy (kcal) | 2025 | 2020 | 2000 |
| Non-beverage Energy density (kcal/g) | 1.24 | 1.22 | 1.30 |
| % Energy from Hyper-palatable Food | 46% | 37% | 55% |
| Protein (g) | 108 | 96 | 101 |
| Carbohydrate (g) | 281 | 282 | 276 |
| Added sugars (g) | 29 | 24 | 31 |
| Added sugar (teaspoon equivalents) | 6.92 | 5.73 | 7.40 |
| Fiber, total dietary (g) | 39 | 41 | 34 |
| Total fat (g) | 56.5 | 58.1 | 59.1 |
| Saturated fat (g) | 14.6 | 15.7 | 16.2 |
| Monounsaturated fat (g) | 20 | 22 | 20 |
| Polyunsaturated fat (g) | 16 | 17 | 15 |
| Omega-3 fat (g) | 0.84 | 0.87 | 0.74 |
| Omega-6 fat (g) | 6.32 | 6.94 | 4.67 |
| Cholesterol (mg) | 165 | 144.3 | 125.6 |
| Calcium (mg) | 1583 | 1456 | 1622 |
| Iron (mg) | 21.0 | 20.5 | 17.3 |
| Potassium (mg) | 3750 | 4141 | 3440 |
| Sodium (mg) | 4435 | 3109 | 5135 |
| Vitamin A, RAE (mcg) | 1530 | 1645 | 1210 |
| Vitamin D (IU) | 387.4 | 393.5 | 385.1 |
Table 8.
Initial Cost for Each One-Week Menu.
| UPF | MPF | CONV | |
|---|---|---|---|
| Initial Cost per Serving, 1-Person Household | $87.59 | $94.01 | $96.15 |
| Initial Total Cost, 1-Person Household | $296.90 | $304.89 | $227.49 |
| Initial Total Cost, 4-Person Household | $491.27 | $533.91 | $469.40 |
Disclaimer/Publisher’s Note: The statements, opinions and data contained in all publications are solely those of the individual author(s) and contributor(s) and not of MDPI and/or the editor(s). MDPI and/or the editor(s) disclaim responsibility for any injury to people or property resulting from any ideas, methods, instructions or products referred to in the content. |
© 2025 by the authors. Licensee MDPI, Basel, Switzerland. This article is an open access article distributed under the terms and conditions of the Creative Commons Attribution (CC BY) license (http://creativecommons.org/licenses/by/4.0/).
Copyright: This open access article is published under a Creative Commons CC BY 4.0 license, which permit the free download, distribution, and reuse, provided that the author and preprint are cited in any reuse.


