
Submitted:
25 February 2025
Posted:
26 February 2025
You are already at the latest version
Abstract
The consumption of ultra-processed foods (UPFs) has become a central topic in discussions surrounding public health, nutrition, and consumer behaviour. This study aims to investigate the key factors shaping customer perceptions and attitudes towards UPFs and explore their impact on purchase decisions. A total of 290 completed questionnaires from an online survey were analysed to identify the drivers influencing consumer actions and habits. Users’ opinions were systematized based on their attitudes towards UPFs, considering factors such as health consciousness, knowledge, subjective norms, and environmental concerns. Participants were then categorized using both traditional and advanced data analysis methods. Structural equation modelling (SEM), machine learning (ML), and multi-criteria decision-making (MCDM) techniques were applied to identify hidden dependencies between variables from the perspective of UPF consumers. The developed models reveal the underlying relationships that influence acceptance or rejection mechanisms for UPFs. The results provide specific recommendations for stakeholders across the food production and marketing value chain. Public health authorities can use these insights the findings to design targeted interventions that promote healthier food choices. Manufacturers and marketers can leverage the findings to optimize product offerings and communication strategies with a focus on less harmful options, aligning more closely with consumer expectations and health considerations. Consumers benefit from enhanced product transparency and tailored information that reflects their preferences and concerns, fostering informed and balanced decision-making. As attitudes toward UPFs evolve alongside changing nutrition and consumption patterns, stakeholders should regularly assess consumer feedback to mitigate the impact of these harmful foods on public health.
Keywords:
consumer behaviour
; public health
; food industry
; ultra-processed foods
; SEM
; machine learning
; multi-criteria decision making
; consumer satisfaction
; behaviour intention
; purchase intention
; structural equation modelling
; PLS-SEM
; MCDM
1. Introduction
Ultra-processed foods (UPFs), also referred to as industrially formulated food products, ready-to-eat convenience foods, or highly processed food items, have gained prominence in modern nutrition due to their affordability, extended shelf life, and convenience [1]. Initially, food processing was primarily aimed at preserving food and enhancing its safety. However, with the rise of industrial food production, an increasing number of food products contain additives, emulsifiers, artificial flavours, and preservatives, raising concerns about their impact on human health and well-being. Nowadays, UPFs account for a significant portion of global food consumption, displacing healthier unprocessed foods and influencing consumer preferences [2].
The growing prevalence of UPFs has sparked debates among policymakers, nutritionists, and consumers regarding their long-term effects on health. Studies suggest that frequent consumption of UPFs is linked to various non-communicable diseases, including obesity, cardiovascular issues, type 2 diabetes, and metabolic disorders [3,4]. In addition to health risks, the environmental impact of UPFs, such as increased carbon footprints due to industrial food processing and packaging, has also drawn attention [5]. As a result, understanding consumer attitudes toward UPFs has become essential for shaping dietary guidelines, public health policies, and sustainable food systems.
According to recent market analyses, the demand for UPFs continues to grow [6], driven by factors such as rapid urbanization, changing lifestyles, and aggressive food marketing strategies. The global UPF market has witnessed a steady increase in sales, particularly in middle- and high-income countries where convenience and affordability drive purchasing decisions [7]. Food companies continue to expand their product lines by introducing reformulated UPFs with reduced sugar, salt, and fat content, catering to health-conscious consumers while maintaining their market dominance [8].
Despite the public significance of the problem, there is no unified framework for studying consumer attitudes towards UPFs and their impact on dietary choices. Understanding the factors that shape consumer perceptions of UPFs and predicting their influence on purchasing behaviour is a complex issue due to three main reasons:
- The growing public debate surrounding UPFs involves health concerns, socio-economic factors, and environmental sustainability, all of which contribute to shifting consumer preferences [9]. For example, increased awareness of nutrition-related diseases and sustainable eating habits may lead consumers to reconsider their food choices, while economic constraints and lifestyle convenience continue to increase demand for UPFs.
- Although aggressive marketing, including digital advertising and celebrity endorsements, influences consumer trust and willingness to purchase these products [10], consumers are more mindful of the harmful consequences of consuming such foods. As a result, manufacturers have leveraged advancements in food technology and marketing strategies to offer and promote UPFs with healthier components, such as reduced sugar, fat, and salt content.
- The vast amount of data and the multifaceted nature of the problem require the application of innovative data analysis methods. Meanwhile, methods for analysing consumer attitudes and decision-making processes have expanded significantly with the integration of big data analytics, multi-criteria decision-making (MCDM), sentiment analysis, and other advanced artificial intelligence (AI) techniques [11]. These analytical methods, tools and technologies offer deeper insights into behavioural trends and help uncover the underlying motivations behind UPF consumption.
These challenges motivate us to examine consumer attitudes towards UPFs using both traditional statistical techniques and modern analytical methods, such as Structural Equation Modelling (SEM) and MCDM models.
The objective of this study is to develop and validate a comprehensive model that evaluates consumer attitudes toward UPFs by considering key behavioural factors such as perceived health conciseness, food knowledge, subjective norms, and environmental awareness. The model will also incorporate demographic and socio-economic factors, including income levels, gender, education, dietary habits, and consumer preferences in food shopping. By employing SEM with a dataset from 290 survey participants, this study aims to provide a structured approach to understanding the determinants of UPF consumption and their implications for public health policies and food industry strategies.
The main tasks of this study are as follows:
- Develop a conceptual model that allows for the systematic examination of consumer attitudes towards UPFs and the identification of underlying behavioural patterns influencing purchasing decisions.
- Gather and structure a dataset reflecting consumer experiences, perceptions, and preferences regarding UPFs, incorporating key socio-economic and demographic factors, and food preferences.
- Identify the main determinants that impact consumer willingness to purchase UPFs by reviewing previous studies and proposing appropriate analytical approaches to assess their impact.
- Construct and validate mathematical models based on the identified factors and compare the results with findings from prior research on food consumption behaviour.
This study employs SEM to examine data from 290 survey participants, exploring the impact of health awareness, taste preferences, and social factors on consumer attitudes toward UPFs. By combining statistical analysis with modern decision-making approaches, the research offers valuable insights for policymakers, the food industry, and sustainability experts aiming to promote more balanced and healthier dietary choices.
The structure of this paper is as follows: Section 2 examines the main characteristics of UPFs and their significance in contemporary dietary patterns. Section 3 provides an overview of existing research on consumer perceptions of UPFs, emphasizing the key psychological, socio-economic, and behavioural determinants of food choices. Section 4 outlines the questionnaire design, specifying the measurement indicators adapted from prior studies on food consumption and health awareness. Section 5 focuses on data analysis, where SEM and AI methods are applied to develop and validate mathematical models, followed by a comparative assessment with findings from previous research. Lastly, Section 6 summarizes the main conclusions, acknowledges the study limitations, and suggests potential directions for future investigations.
2. State-of-the-Art Review of Consumer Attitudes Towards Ultra-Processed Foods
UPFs are now deeply embedded in modern dietary patterns, influenced by by their widespread availability, cost-effectiveness, and extended shelf life. While UPFs offer a convenient food option for many consumers, increasing concerns about their potential health risks have fuelled academic and public debates. Several studies indicate that frequent consumption of UPFs is linked to negative health outcomes, including obesity, cardiovascular diseases, and metabolic disorders [12,13]. Additionally, the environmental impact of large-scale UPF production raises further concerns about sustainability and food system resilience [14].
Despite increasing awareness of these issues, consumer demand for UPFs remains strong, driven by aggressive marketing strategies, evolving food technologies, and shifts in lifestyle preferences. The rise of health-conscious consumers has prompted food manufacturers to reformulate UPFs by reducing sugar, fat, and sodium content or by incorporating functional ingredients. However, public scepticism about the actual health benefits of these reformulated products persists [15]. Consumers’ attitudes towards UPFs are dependent on various factors, including health awareness, price sensitivity, trust in food labelling, and socio-economic conditions.
2.1. Key Features and Taxonomy of Ultra-Processed Foods
The increasing presence of UPFs in modern diets has been propelled by advancements in food processing technology, evolving consumer lifestyles, and intensive marketing campaigns. UPFs are industrially formulated products that undergo multiple processing stages, incorporating additives, preservatives, and artificial flavour enhancers to improve their taste, texture, and shelf life. These foods are typically characterized by low nutritional value, high energy density, and a composition that includes refined sugars, unhealthy fats, and chemical stabilizers. The convenience, affordability, and extended durability of UPFs make them a preferred choice for many consumers, despite growing concerns regarding their impact on health and well-being [16].
Recent trends in UPF consumption reflect several key developments:
- Expansion of functional UPFs – In response to increasing health consciousness, food manufacturers are reformulating UPFs by incorporating added vitamins, fibre, probiotics, and protein-enriched alternatives. These so-called “healthier” UPFs aim to appeal to consumers looking for convenient yet nutritionally enhanced options.
- Growth of plant-based UPFs – The demand for plant-based diets has led to a surge in UPFs marketed as vegetarian or vegan alternatives, such as meat substitutes and dairy-free products. While these products align with sustainability and ethical consumption trends, they often remain highly processed, containing emulsifiers and synthetic ingredients.
- Increased reliance on digital food marketing – Brands leverage social media platforms, food delivery apps, and personalized advertising to target consumers with UPF promotions. The use of influencer endorsements and algorithm-driven recommendations have contributed to the growing acceptance and appeal of UPFs, particularly among younger consumers.
- Ultra-convenience in food innovation – The rise of ready-to-eat meals, instant snacks, and meal replacement products reflects a shift in consumer preferences toward faster and more effortless eating solutions. Many of these products prioritize convenience over nutritional value, contributing to an increased intake of ultra-processed foods.
- Sustainability challenges and reformulation efforts – Concerns over environmental sustainability have prompted some manufacturers to explore eco-friendly packaging, reduce food waste, and develop “clean-label” UPFs with fewer artificial additives. However, balancing sustainability with affordability and profitability remains a challenge.
Ultra-processed foods exhibit distinct characteristics that influence consumer choices and dietary patterns. They can be categorized based on multiple criteria, each reflecting different aspects of their composition, processing methods, and market positioning.
Nutritional profile: UPFs typically contain high levels of refined sugars, unhealthy fats, and artificial additives while lacking essential nutrients such as fibre, protein, and vitamins. Some categories of UPFs have been reformulated to include functional ingredients, such as added probiotics, plant-based proteins, or fortified micronutrients, catering to health-conscious consumers [17].
Degree of processing: UPFs can be classified based on the intensity of industrial processing involved in their production. Some undergo extensive chemical modifications, such as hydrogenation or extrusion, while others rely primarily on artificial preservatives and stabilizers to enhance shelf life and taste. This classification helps differentiate between minimally processed, processed, and ultra-processed food categories [18].
Marketing and branding strategies: The promotion of UPFs heavily depends on digital marketing, social media advertising, and influencer endorsements. Companies use targeted advertising campaigns, leveraging consumer behaviour data to increase brand visibility and sales. Additionally, the rise of plant-based and “healthier” UPFs reflects shifting consumer preferences influenced by wellness trends and environmental concerns [19].
Consumption context: UPFs can also be categorized based on their role in daily nutrition. Some are designed as meal replacements, such as protein bars and instant soups, while others function as snacks or indulgent treats, like packaged sweets and processed meat products. The convenience and affordability of these products make them appealing across different demographic groups [20].
Sustainability considerations: Another classification criterion relates to the environmental impact of UPF production. Some manufacturers are adopting eco-friendly packaging, reducing food waste, and reformulating products to align with sustainability goals. However, the industrial-scale production of many UPFs continues to contribute to resource depletion, greenhouse gas emissions, and plastic pollution [14].
The categorization of ultra-processed foods provides valuable insights for nutritionists, public health officials, and policymakers in shaping dietary guidelines and regulatory frameworks. Understanding the different types of UPFs and their appeal to consumers is essential for designing effective interventions that encourage healthier food choices while considering economic and lifestyle constraints.
2.2. Assessing Ultra-Processed Foods
Evaluating and comparing UPFs requires a structured approach that considers multiple dimensions of their impact on health, consumer behaviour, and the environment. Various assessment tools can be applied to analyse UPFs, broadly categorized into three main areas: nutritional metrics, composite indices, and theoretical models. These instruments provide valuable insights for industry stakeholders and policymakers in better understanding and regulating UPF consumption.
Nutritional metrics: UPFs are often evaluated based on their composition, including levels of added sugars, saturated fats, sodium, and artificial additives. Standardized scoring systems, such as the NOVA classification [21] help rank foods based on their degree of processing and nutritional quality. These tools enable consumers and health professionals to identify and compare the potential health risks associated with different UPFs.
Composite indices: Several compound indices integrate multiple factors to assess the overall health impact of UPFs such as Nutri-Score [22], Ofcom [23] and Health Star Rating (HSR) [24]. These indices often combine nutritional data with other key elements, such as glycaemic load, caloric density, and the presence of synthetic additives. In addition, consumer perception indices measure factors like taste, affordability, and brand trust, influencing UPF purchasing behaviour [25,26].
Theoretical models: Conceptual models provide a broader perspective on UPF consumption by incorporating psychological, social, and economic factors. Frameworks such as the Theory of Planned Behaviour (TPB) [27] and the Health Belief Model (HBM) [28] help explain consumer attitudes and decision-making regarding UPFs. Additionally, MCDM techniques and ML models have been applied to analyse the complex interactions between health awareness, convenience, and purchasing preferences.
By integrating these different assessment tools, researchers and policymakers can develop a more comprehensive understanding of UPFs and their role in modern diets. A well-rounded evaluation not only highlights potential health risks but also provides guidance for food industry innovations, regulatory policies, and consumer education strategies aimed at promoting healthier eating habits.
2.2.1. Nutrition Metrics
Nutrition metrics evaluate the dietary quality and health implications of UPFs in a manner similar to how traditional nutritional assessments measure food groups and dietary patterns. These metrics help quantify the nutritional composition, degree of processing, and potential health impacts of UPFs, providing insights for different stakeholder groups. Various organizations and research institutions have developed standardized indicators to assess the nutritional profile of food products, such as the NOVA classification system [21].
The most widely used nutrition metrics are detailed below.
Nutrient density scores: These scores measure the balance between beneficial nutrients (e.g., fibre, protein, vitamins, and minerals) and potentially harmful components (e.g., added sugars, saturated fats, and sodium). Systems such as Nutri-Score [22] use a color-coded rating from A (healthiest) to E (least healthy) to classify foods based on their overall nutritional quality. Similarly, the Health Star Rating (HSR), used in Australia and New Zealand, assigns a star rating (from 0.5 to 5) based on the overall healthiness of a product, considering its nutrient profile and processing level. [24].
Energy density: This metric calculates the number of calories per gram of food. UPFs tend to have a high energy density, meaning they provide more calories per gram, often due to high levels of added sugars and unhealthy fats. High energy density is linked to overconsumption and weight gain.
Ultra-processed food consumption ratios: Researchers often use dietary surveys to determine the proportion of an individual’s daily caloric intake that comes from UPFs. Studies have shown that higher UPF consumption is associated with poorer diet quality and increased risk of obesity, cardiovascular disease, and metabolic disorders.
Additive load index: This indicator quantifies the number and types of artificial additives, preservatives, and emulsifiers in a food product. High additive content is a defining feature of UPFs and has been linked to potential long-term health risks.
Glycaemic index (GI) and glycaemic load (GL): These measures assess the impact of UPFs on blood sugar levels. Many ultra-processed foods have a high GI, leading to rapid spikes in blood glucose, which can contribute to insulin resistance and an increased risk of type 2 diabetes.
The metrics employed for food classification (Section 2.1) can also be applied to evaluate the health implications of UPFs, helping consumers and policymakers make informed dietary choices.
2.2.2. Compound Indices
Each index combines multiple nutrition metrics, such as processing level, nutrient density, energy content, and additive load, to provide a comprehensive assessment of food quality.
Other indices focus on specific aspects of UPFs, such as the Additive Load Index, which quantifies the number and types of artificial additives in a food product, and the Ultra-Processed Food Consumption Ratio, which measures the proportion of an individual’s diet that comes from UPFs. Additionally, some dietary indices, such as the Dietary Inflammatory Index (DII), assess the potential inflammatory effects of food consumption, which can be particularly relevant when evaluating UPFs.
Despite the growing use of these indices, there is currently no universal standard for assessing UPFs. While organizations like the World Health Organization (WHO) and the Food and Agriculture Organization (FAO) provide general dietary guidelines, there is no globally recognized framework for systematically evaluating the health impact of ultra-processed foods. Moreover, emerging research continues to refine these indices, aiming to provide more accurate and actionable insights into food quality and its implications for public health.
2.2.3. Theoretical Models for Assessing Ultra-Processed Food
Several theoretical models have been developed to analyse the role of ultra-processed foods (UPFs) in nutrition, public health, and consumer behaviour. These models can evaluate the impact of UPFs on dietary patterns, health risks, and food choices.
The Nutrient Profiling Model (NPM) evaluates foods based on their nutrient content rather than processing levels. Systems such as Nutri-Score, the Health Star Rating (HSR), and the UK Ofcom Model assign scores to foods based on key nutritional factors, including saturated fat, sugar, sodium, fibre, and protein. These models provide guidance for both consumers and regulatory policies aimed at improving dietary choices [23].
The Energy Density Model explains how UPFs contribute to excessive energy intake by combining high caloric content with low satiety. This model suggests that the hyper-palatable nature of UPFs, enhanced by artificial additives and refined ingredients, encourages overconsumption, leading to increased risks of obesity and related health issues [29].
The Food Addiction Model applies psychological and neurobiological principles to examine the addictive-like properties of UPFs. It suggests that the combination of high sugar, fat, and salt in UPFs stimulates brain reward pathways, leading to compulsive eating behaviours and potential dependence [30,31].
Behavioural models, such as TPB [27] and HBM [28], are also used to assess consumer attitudes and perceptions toward UPFs. These models explore how health consciousness, perceived risks, and social norms shape food choices and dietary behaviours [27].
These theoretical models provide structured approaches to understanding UPFs’ nutritional and behavioural impact, offering valuable insights for developing public health policies and consumer education strategies.
3. Related Work
3.1. Consumer Attitudes Towards Ultra-Processed Foods and Their Influence on Purchase Intentions
Understanding consumer attitudes towards UPFs is essential for both businesses and policymakers seeking to balance market demands with public health objectives. By analysing the psychological, social, and economic factors that drive UPF consumption, this study aims to provide insights into how consumer decision-making processes align with broader health and sustainability trends. The findings will help guide targeted marketing approaches, regulatory frameworks, and consumer education programs designed to promote healthier food choices while addressing the realities of modern consumption patterns.
Contini et al. explored consumer behaviour (intention and consumption) toward convenience-processed foods by applying the SEM technique with nine input constructs and two output constructs to test a model using a dataset of 426 Italian consumers [32]. Four input constructs belonged to the group of belief factors, while the remaining five were classified as personal trait factors. Although convenience foods are not always ultra-processed, they often overlap with UPFs due to industrial processing, extended shelf life, and the inclusion of preservatives or artificial additives. The study reveals that six out of the ten hypotheses were supported, while the remaining three – related to value for money, taste, healthiness (from the belief factors group), and monetary resources (from the personal traits group) – were not supported. The hypothesis regarding the influence of intention on consumption was also confirmed.
To examine changes in consumer behaviour, including fast-food consumption and online purchasing patterns resulting from the pandemic, Yan et al. adopted the Value-Attitude-Behaviour (VAB) model and designed two models: a first-order and a second-order constructs model to predict buying intention among 325 young people who live in Bangladesh and consume fast food [33]. The first model analysed the relationships between seven input constructs—convenience, food quality, novelty seeking, subjective norms, and self-identification—and three output constructs: cognitive attitude, affective attitude, and buying intention. In the second-order model, utilitarian and hedonic values were considered higher-order reflective constructs. Utilitarian value was represented by convenience and food quality, while novelty seeking and subjective norms were interpreted as hedonic values. The study found that both higher-order constructs positively influenced cognitive and affective attitudes toward online fast-food purchasing. These attitudes, along with self-identity and subjective norms, were strongly and positively correlated with behavioural intention, whereas the role of food quality was found to be statistically insignificant.
Using the Theory of Consumption Values, Arroyo investigated how consumers rank food choice values using a dataset of 256 completed questionnaires from Mexican consumers [34]. The questionnaire was designed to measure seven food choice values along with selected psychographic constructs, including safety and sustainability, weight control, convenience, basic sensory attributes, traditionalism, emotional value, novelty of functional food, self-control, self-assessment of diet quality, and health consciousness. For data analysis, in addition to classical statistical methods, the author introduced decision trees (DTs) as an innovative analytical tool to better understand consumer choices. The results empirically validated food choice value metrics and revealed the underlying motives influencing snack and beverage choices.
Calvo-Porral et al. examined the relevance of nine factors influencing consumer acceptance of UPF products in Spain. This study proposed a measurement scale incorporating quality, time savings, price, effortless preparation, convenience, hedonism, marketing strategies, purchase intention, and satisfaction [35]. The objective was to develop an evaluation framework for assessing UPF consumption and demand. Using a survey-based approach, the study collected a dataset from 478 completed questionnaires. The results from Confirmatory Factor Analysis (CFA) confirmed that the standardized factor loadings of the first-order constructs were valid and that the model fit was adequate. The study provided marketers and food companies with a validated instrument to measure consumer acceptance and consumption of UPF products.
Norfalah et al. developed a research model to examine the moderating effect of consumer value on UPF consumption in Malaysia using Partial Least Squares Structural Equation Modelling (PLS-SEM) [36]. The conceptual framework was based on five constructs: functional, emotional, conditional, and social values, along with UPF continuance consumption. Analysis of the dataset, which included responses from 286 university students, confirmed the research hypotheses that UPF continuance consumption directly depends on these constructs. Furthermore, AI-based recommendations were found to enhance both the emotional appeal and promotional effectiveness, potentially increasing UPF consumption.
Theory of Consumption Value
Raj et al. proposed and verified the effects of extrinsic (price, packaging, advertisement, brand, labelling and word of mouth) and intrinsic (nutritional composition, taste, aroma, texture) factors on the attitude and purchase intention towards UPFs using 375 responses from India [37]. The conceptual model includes four key constructs and eight items per construct. The obtained results showed that the impact of extrinsic input construct on the output variables is statistically significant, however the intrinsic factor impacts only attitude but is not significantly correlated with purchase intention.
Stamatelou et al. developed a research model to determine the impact of knowledge and perceptions on consumption of Greek population [38]. The data were collected among 1126 adults through an online questionnaire with 16 questions for knowledge and perceptions assessment. To assess the consumption, the relevant data was collected through a food frequency questionnaire. The analysis of the obtained results revealed that according to the 40% of the participants have limited to no awareness regarding the term UPFs. An inverse dependence was observed between the knowledge and perceptions score and the overall consumption score of UPFs.
Yuan et al. investigated the key factors influencing consumer knowledge, attitudes, and practices (KAP) regarding preservatives among 515 pregnant women in China using regression analysis (RA) and SEM [39]. In this cross-sectional study, the authors found that while pregnant women had limited knowledge, they exhibited favourable attitudes and proactive practices toward harmful food components. The authors emphasized that improving knowledge, particularly concerning food safety, should be a focus of educational interventions.
Van der Merwe et al. examined the relationship between consumers’ subjective and objective knowledge of healthy foods and various healthy lifestyle choices among 157 South African corporate employees [40]. SEM confirmed a significant association between subjective knowledge and most healthy lifestyle choice categories but found no such link with objective knowledge. The findings of this cross-sectional study further emphasize the need to account for consumer demographic diversity when designing health education programs to improve their effectiveness, particularly in socially and economically diverse societies.
Zheng at al. analysed consumers’ willingness to purchase prepared dishes (PDs) and the moderating role of time pressure using SEM and 403 completed questionnaires of consumers in China [41]. The results showed that consumers’ attitudes towards buying PDs, perceived behavioural control, and subjective norms have a significant positive effect on purchase intention. However, behavioural attitudes only served as a full mediator between functional value, emotional value, and purchase intentions.
Consumer willingness to purchase UPFs is influenced by multiple factors, including taste preferences, convenience, price sensitivity, and health awareness. While some consumers are drawn to UPFs due to their affordability and ease of access, others may actively avoid them due to concerns over nutritional quality and long-term health risks. The perception of UPFs as either beneficial or harmful is often shaped by advertising strategies, food labelling, and expert recommendations, all of which contribute to varying degrees of consumer trust and acceptance.
3.2. Comparison of Existing Models of User Attitudes towards Social Media Influencers
The studies presented in the preceding subsection are grounded in theoretical frame-works such as Theory of Planned Behaviour (TPB), the Health Belief Model (HBM), and the Knowledge-Attitude-Practice (KAP) Model, which explore the psychological, social, and behavioural determinants of food consumption. Key factors in these models include health consciousness [34], knowledge about UPFs [38,39,40] and social norms [32,33], and sustainability concerns [34] all of which influence consumer attitudes, willingness to purchase, and actual buying behaviour.
The TPB posits that an individual’s intention to perform a behaviour is influenced by their attitudes toward the behaviour, subjective norms, and perceived behavioural control. This framework has been applied to predict healthy eating behaviours, demonstrating that attitudes and intentions are mediated by goals and needs [32,33,37,41].
The HBM examines how personal beliefs about health conditions influence health-related behaviours. It suggests that individuals’ perceptions of susceptibility to illness, severity of health conditions, benefits of preventive actions, and barriers to healthcare access determine their engagement in health-promoting behaviours [39].
The KAP Model assesses the relationship between knowledge, attitudes, and practices within specific contexts. It has been utilized to understand how educational interventions can modify dietary behaviours by enhancing knowledge and shaping positive attitudes toward healthy eating [33,38,39].
Collectively, these theoretical models provide comprehensive insights into the multifaceted factors influencing dietary decisions, thereby informing the development of effective interventions to promote healthier food choices.
Most of the studies investigating consumer behaviour towards food products have utilized Structural Equation Modelling (SEM) [32,33,36,37,39,40,41] and Confirmatory Factor Analysis (CFA) [34,35] due to its suitability for complex models with multiple latent variables and smaller sample sizes. In addition, some models have been developed using alternative approaches such ML algorithms like classification trees analysis to uncover hidden patterns in consumer data [34].
The key characteristics of the models addressing the factors influencing consumer behaviour towards UPFs are summarized in Table 1, providing an overview of the methodologies, theoretical foundations, and variables explored in this research domain.
The distribution of constructs in the above-mentioned models is as follows: purchase intention—5/10; attitude (including satisfaction) – 5/10; knowledge (including cognitive attitude) – 4/10; emotional value – 3/10; consumption – 3/10; food quality (including taste) – 3/10; price (including value for money, income and monetary resources) – 3/10; convenience—3/10; functional value – 2/10; time (including time pressure) – 2/10; social influence (including subjective norms) – 2/10; etc. The effectiveness of the models proposed in the literature, as measured by the coefficient of determination (R²), ranges from 50.3% [41] to 85.0% [33]. The root mean square error (RMSEA) values span between 0.05 and 0.08, with the number of latent variables varying from 2 to 11. The count of statistically significant factors fluctuates within this range.
Despite extensive research on the factors shaping consumer attitudes toward UPFs, there is still no widely accepted framework for assessing their nutritional impact and health consequences. Moreover, studies on UPF consumption patterns and their broader implications, particularly across diverse socio-economic and cultural contexts, remain limited. Existing research does not fully capture the evolving nature of dietary preferences, public health awareness and data analysis methods. Therefore, advancing methodological approaches and conducting empirical investigations in this field can help bridge these gaps and generate valuable insights for public health policymakers and the food industry.
3.3. Main Factors Affecting Consumer Attitudes Towards Ultra-Processed Foods and Their Impact on Buying Decisions
The Health Belief Model (HBM) and the Theory of Planned Behaviour (TPB) can be adapted and applied to understand consumer attitudes and decision-making regarding the consumption of UPFs. Based on the literature review, the primary factors influencing consumer behaviour towards UPFs are represented in a theoretical model consisting of four key input constructs: health consciousness, knowledge about UPFs, social norms, and environmental concerns. The following section offers a detailed overview of the constructs in our proposed model.
The Health Belief Model (HBM) and the Theory of Planned Behaviour (TPB) offer valuable frameworks for understanding consumer attitudes and decision-making related to UPF consumption. Drawing on existing research, key factors shaping consumer behaviour toward UPFs are integrated into a theoretical model comprising four primary input constructs: health consciousness, knowledge of UPFs, social norms, and environmental concerns. These factors determine consumer attitudes, which subsequently influence purchase intentions and actual buying behaviour. This framework provides a holistic perspective on how individual factors (such as health awareness and product knowledge) and external social influences (such as subjective norms and environmental considerations) interact to impact UPF consumption. The following section presents a detailed overview of the constructs within this proposed model.
3.3.1. Health Consciousness
Health consciousness refers to the extent to which individuals are aware of and concerned about their health, influencing their daily decisions, including dietary choices. It represents an individual’s motivation to engage in behaviours that promote physical well-being and prevent health risks. In the context of UPF consumption, health-conscious consumers are more likely to critically evaluate food products based on their nutritional content, ingredients, and potential health risks associated with high levels of sugar, saturated fats, sodium, and artificial additives.
Previous research has shown that health consciousness significantly affects food purchasing behaviour, with higher health awareness leading to a preference for natural, minimally processed foods and a reduced intake of UPFs [42]. Consumers with high health consciousness are also more likely to read nutrition labels, consider dietary guidelines, and adopt health-promoting practices such as balanced diets and physical activity [43,44]. This construct plays a critical role in shaping attitudes towards UPFs, as individuals prioritize long-term health outcomes over short-term convenience and taste preferences.
3.3.2. Knowledge About Ultra-Processed Foods
Knowledge about UPFs refers to an individual’s understanding of the composition, processing methods, and health implications associated with these products. This includes awareness of the presence of artificial additives, preservatives, high sugar content, and the potential links between UPF consumption and chronic health conditions such as obesity, diabetes, and cardiovascular diseases. Knowledge can be both objective (factual information about UPFs) and subjective (perceived understanding based on personal beliefs).
Studies indicate that consumers with higher levels of nutritional knowledge are better equipped to make healthier food choices and are more likely to limit their consumption of UPFs [38, 45]. Educational campaigns and food labelling systems, such as the Nutri-Score and Health Star Rating, have proven effective in improving consumer knowledge and reducing the appeal of unhealthy food options. Furthermore, misinformation or lack of knowledge may contribute to the widespread acceptance of UPFs, particularly in younger populations and low-income communities.
3.3.3. Social Norms
Social norms refer to the shared beliefs, values, and behaviours within a community or social group that influence individual decision-making. In the context of UPF consumption, social norms can shape dietary habits through peer influence, family practices, cultural expectations, and media exposure. This includes both descriptive norms (perceptions of what others do) and injunctive norms (perceptions of what others approve or disapprove of).
Research shows that individuals are more likely to adopt eating behaviours consistent with those of their social circles, particularly when influenced by family, friends, and online communities [46,47]. Social media platforms also play a pivotal role in normalizing UPF consumption through influencer marketing, food trends, and targeted advertising. Conversely, health-oriented social environments can promote healthier eating patterns, reducing the consumption of UPFs and encouraging fresh, whole foods.
3.3.4. Environmental Concerns
Environmental concerns reflect the degree to which individuals are aware of and motivated by the environmental impacts of their consumption choices. This includes concerns about resource depletion, greenhouse gas emissions, plastic pollution, and the ecological footprint associated with the production, packaging, and distribution of UPFs. As environmental sustainability becomes a global priority, many consumers are considering the broader implications of their dietary patterns.
Studies suggest that environmentally conscious consumers tend to prefer foods with a lower ecological impact, such as plant-based diets and locally sourced products, and are more likely to reduce their UPF consumption due to the high environmental costs associated with industrial food processing [48,49]. Public awareness campaigns highlighting the environmental footprint of food products, including carbon labelling and sustainable certifications, have also influenced purchasing behaviours towards more eco-friendly options.
3.3.5. Attitude
Attitude towards UPFs refers to an individual’s overall evaluation of these products, which can be positive or negative based on personal beliefs, health concerns, and consumption experiences. This psychological construct reflects both affective (emotions and feelings about UPFs) and cognitive (knowledge and beliefs about their health and environmental impacts) components. Attitudes are shaped by various factors, including health consciousness, social norms, marketing exposure, and environmental awareness.
Empirical studies suggest that negative attitudes towards UPFs are strongly associated with concerns about their nutritional quality, potential health risks, and environmental footprint [50]. Conversely, positive attitudes often stem from the convenience, affordability, and taste appeal of these products, especially among younger consumers and busy professionals [51]. Understanding consumer attitudes is critical, as they serve as key mediators in behavioural models, influencing both the intention and actual purchasing behaviour related to UPFs.
3.3.6. Willingness to Purchase
Willingness to purchase UPFs reflects the extent to which consumers are inclined to buy these products in the future. It represents a behavioural intention influenced by attitudes, perceived social norms, personal values, and product-related factors such as price, taste, and convenience. This construct is central to understanding consumer behaviour, as it often predicts actual purchasing decisions, especially in fast-moving consumer goods markets.
Several studies highlight that willingness to purchase UPFs is positively associated with factors such as convenience, affordability, and aggressive marketing strategies [52]. However, health concerns, sustainability awareness, and nutritional knowledge tend to reduce purchase intentions, particularly among health-conscious individuals [53]. Additionally, demographic variables such as age, income level, and education significantly moderate the relationship between attitudes and purchase intentions towards UPFs.
3.3.7. Actual Buying Behaviour
Actual buying behaviour towards UPFs refers to the observed purchasing patterns and consumption habits of individuals concerning these products. It represents the final stage in the decision-making process, influenced by prior attitudes, purchase intentions, and external factors such as marketing strategies, availability, and socioeconomic status. Unlike willingness to purchase, which reflects intentions, actual buying behaviour captures real consumer actions based on routine practices and situational factors.
Research indicates that despite growing health awareness, UPFs continue to dominate food markets globally due to their convenience, aggressive advertising, and widespread availability in modern retail environments [32]. Price sensitivity, time constraints, and taste preferences often outweigh health-related concerns, leading to the frequent consumption of UPFs, especially among younger populations and urban dwellers [36]. Additionally, impulsive buying tendencies, influenced by promotional offers and attractive packaging, significantly affect the actual purchase of UPFs.
Based on the synthesis and comparison of existing models for consumer attitudes towards UPFs (Table 1) and an analysis of key factors influencing food-related decision-making, the research hypotheses in this study are formulated as follows (Figure 1). The proposed structural model integrates psychological, social, and environmental constructs, reflecting the complex nature of consumer decision-making processes regarding food choices.
H1:
There is a significant impact of health consciousness on consumer attitude towards ultra-processed foods.
H2:
There is a significant impact of knowledge about UPFs on consumer attitude towards ultra-processed foods.
H3:
There is a significant impact of social norms on consumer attitude towards ultra-processed foods.
H4:
There is a significant impact of environmental concerns on consumer attitude towards ultra-processed foods.
H5:
There is a significant impact of attitude towards ultra-processed foods on consumer willingness to purchase.
H6:
There is a significant impact of consumer willingness to purchase towards their actual buying behaviour.
H7:
Customer demographic characteristics have statistically significant mediating effects on consumer attitudes, willingness to purchase or on purchase decisions.
Note: The demographic characteristics include gender, age, educational level and residence.
The proposed hypotheses help determine the impact of key factors on various aspects of consumer attitudes toward UPFs. In the next section, we present an integrated approach to analyse how these factors shape purchasing behaviour concerning attitudes toward UPF products.
4. Research Methodology
The formulated hypotheses aim to reveal the significance of the identified factors on various aspects of consumer attitudes towards UPFs. In the following section, this study adopts an integrated approach to evaluate how these factors influence consumer purchasing behaviour, focusing on the relationships between health consciousness, knowledge about UPFs, social norms, environmental concerns, and attitudes towards UPFs, as well as their impact on willingness to purchase and actual buying behaviour.
4.1. Questionnaire Design and Data Collection
The survey approach was selected as the primary method for gathering comprehensive data on consumer attitudes toward UPFs. An online questionnaire was developed, following established methodologies [32,33,34], and comprised sections on introduction, demographics, experience with UPFs, attitudes towards them, purchasing intentions and their actual consumption. Each construct was measured using items adapted from previous studies to ensure both relevance and validity in capturing the determinants of UPF consumption.
Indicators for Question 9 (health consciousness) and Question 10 (knowledge) were adapted from the research of Arroyo [34], and Yan et al. [33], Yuan et al. [39] and van der Merwe [40] respectively. The health consciousness and knowledge factors consist of three and two indicators respectively. The two items for Question 11 (subjective norms) were sourced from the works of Contini et al. [32], Yan et al. [33] and Norfalah et al. [36]. Question 12, which measures environmental concerns was obtained from the work of Arroyo [34]. The indicators for Question 13 (attitude) were adapted from the research of Yan et al. [33], Calvo-Porral et al. [35], Raj et al. [37], Yuan et al. [39], and Zheng et al. [41]. The indicators for buying intention and consumption came from Contini et al. [32], Yan et al. [33], Calvo-Porral et al. [35], Raj et al. [37] and Zheng et al. [41]; and Contini et al. [32], Norfalah et al. [36], Stamatelou et al. [38] and Yuan et al. [39]. The last four factors (environmental concerns, attitude, willingness to purchase and actual buying behaviour) consist of three indicators each. To incorporate the participants’ opinionsand suggestions, the last question (Question 16) was included based on recommendations from food marketing experts [54]. The research details and questionnaire link were disseminated through partner organizations via classic web and social media communications.
Our structural equation model (SEM) operationalized these constructs in a sequential framework, whereby health consciousness, UPF knowledge, subjective norms, and environmental concerns were posited to influence overall consumer attitude, willingness to purchase and actual buying behaviour. This comprehensive model, grounded in established theory and empirical evidence, provides robust insights into the determinants of UPF consumption and informs potential interventions aimed at promoting healthier dietary choices.
4.2. Questionnaire Measurements and Scales
Half of the survey questionnaire questions (8 out of 16) are structured as “multiple choice grid” questions, utilizing a five-point Likert scale ranging from “strongly disagree” to “strongly agree.” An additional 30% of the questionnaire (5 out of 16) consists of “multiple choice” questions. Two questions require open-ended text responses, entered into text fields designated as “short answer” or “paragraph” in Google Forms. Finally, one question is formulated using a five-point linear scale.
4.3. Data Analysis Methods
The analytical approaches used to explore consumer attitudes towards ultra-processed foods (UPFs) can be broadly categorized into three groups: statistical methods, ML techniques, and MCDM approaches.
The first group, statistical methods, focuses on measuring, summarizing, and visualizing the key characteristics of multi-dimensional datasets. This includes techniques such as normality tests, t-tests, analysis of variance (ANOVA), chi-squared tests, and regression analysis. A prominent method within this category is partial least squares structural equation modelling (PLS-SEM), which is well-suited for analysing complex models with latent variables, particularly when working with smaller sample sizes.
The second group, ML methods, encompasses techniques like cluster analysis, predictive modelling, and sentiment analysis. These methods help uncover hidden patterns and relationships within data. For example, cluster analysis identifies groups of consumers with similar attitudes, while sentiment analysis evaluates subjective opinions from text data. Unlike traditional statistical approaches that emphasize hypothesis testing and causal inference, ML methods are data-driven, focusing on pattern recognition and predictive analytics based on historical data.
The third category, MCDM methods, offers a structured framework for evaluating complex decisions where multiple factors must be considered simultaneously. In the context of UPF research, MCDM techniques can be applied to assess consumer preferences, rank influencing factors, and support policy-making decisions related to public health and nutrition.
Statistical methods such as SEM are suitable for hypothesis testing and examining theoretical models, while ML techniques excel at identifying trends and making predictions from large datasets. Alternatively, MCDM approaches provide a comprehensive framework for analysing multiple factors simultaneously, offering multi-faceted insights into consumer behaviour and preferences.
The integration of these diverse analytical methods enhances UPF research by providing a holistic view, improving the accuracy of findings, enabling detailed consumer segmentation, supporting data-driven decision-making, and fostering more effective health policy recommendations.
5. Data Analysis
The proposed methodology (Section 4) has been applied to address the research tasks.
Customers’ Data Collection
We disseminated the online survey link through institutional websites, email, and social media channels. The survey targeted Bulgarian online consumers, and participation was entirely voluntary. Created using Google Forms, the questionnaire consisted of 16 items designed to assess consumer perceptions of the variables explored in this study [54]. Data collection took place between 7 March 2024 and 26 May 2024, yielding a total of 290 completed responses.
To ensure data quality, we performed a duplicate check. Although no fully identical rows were found, partial duplicates were identified within responses related to the model constructs (Questions #9 to #16) for six participants (#2, #6, #7, #101, #206, and #274). As none of the entries were completely identical across all variables, all responses were retained for analysis.
Figure 2 illustrates the degree of similarity among respondents’ answers, with closer distances indicating greater similarity. A colour gradient represents dissimilarity, ranging from full coincidence (0—lavender) to maximum difference (16—purple). The dissimilarity matrix was visualized using the fviz_dist() function from the factoextra package in R v.4.4.1.
Data Storage
The questionnaire and the dataset containing respondents’ answers are publicly available in an online repository [54].
Data Encoding
Coding rules and the processed dataset are also accessible online. Of the 16 questions, responses to 14 have been systematically coded. Additionally, open-text responses (related to municipality and opinions) underwent qualitative processing.
Data Preprocessing
Preprocessing procedures were applied to ensure data accuracy, consistency, and readiness for analysis.
Statistical Analysis
To profile the survey participants, descriptive statistical analyses were conducted, including percentage distributions, descriptive statistics, and correlation analysis.
Main Characteristics of Respondents in the Sample
Table 2 summarizes the demographic characteristics of the survey participants. The majority were female, representing 77% of the total sample (Question 1). Participants under the age of 30 comprised 64% of the respondents (Question 2). Furthermore, the survey predominantly included individuals from urban areas, accounting for 97.6% of the total responses (Question 3).
The majority of survey participants were from Plovdiv Province, accounting for 71% of the total responses. Respondents from Haskovo Province made up 7%, while those from Pazardzhik Province represented 6% of the sample (Question 4). Overall, the survey predominantly covered the South-central region, which included 88% of the participants, followed by the Southeastern and Southwestern regions with 7.9% and 2.4%, respectively.
Our respondents are nearly equally divided into two groups based on their family income: 47% have an income below the necessary net monthly income for the maintenance of a working person, while 53% have an income above this threshold (Question 5). In terms of educational background, 42.1% of the respondents had attained education beyond secondary school, while 57.9% held a secondary school degree (Question 6).
Most respondents consume UPFs in small amounts, with the majority keeping their intake below 25% of their daily diet. Only a small portion of respondents (6.2%) have a diet where UPFs constitute the majority of their intake (Question 7). In contrast, the findings from a study analysing data from the National Health and Nutrition Examination Survey (NHANES) between 1999 and 2018 showed that the estimated percentage of total energy intake from UPFs among U.S. youths increased to 67.0% [55]. One possible explanation is that the respondents in this sample belonged to Generation Z and Generation Alpha classifications, while our sample is more diversified. The obtained weighted average share of UPFs daily consumption (34.5%) align with the findings from a study examining household availability of UPFs across nineteen European countries. This study reported that the average household availability of UPFs ranged from 10.2% in Portugal and 13.4% in Italy to 46.2% in Germany and 50.4% in the UK. This suggests that our country has a middle prevalence of UPF consumption in comparison with other European countries [56].
Processed meat, packaged breads and pasta, and snacks are among the most frequently consumed UPFs. In contrast, instant soups and pasta, sweetened dairy products, sweetened cereals, and frozen meals have the highest non-consumption rates (Question 8). These findings partially align with those from a study on convenience food consumption in Germany [57], which identified sweetened yogurt, pizza, and chips as among the most widely consumed products.
Feature selection
To illustrate the range of attitudes towards UPFs, hierarchical clustering combined with heat maps was applied. Figure 3 displays the clustering of observations, while Figure 4 highlights the grouping of attributes. The heat maps feature a colour gradient representing standardized values, from lavender (indicating the lowest value around −3.01) to purple (indicating the highest value around 4.04). The dendrogram positioned above Figure 3 shows how respondents are grouped based on similar attitudes, while the dendrogram in Figure 4 (right) highlights relationships between variables. These visualizations reveal clusters with comparable characteristics, with no evident outliers or irregularities. The heat maps were generated using the Heat Map widget in Orange 3.22.0 software.
5.1. Clustering
To uncover groups of consumers with similar characteristics and to identify variables influencing their attitudes, cluster analysis was conducted using the k-means algorithm (Figure 5 and Table 3). The optimal number of clusters was determined through the elbow and silhouette methods, both indicating that two clusters provided the best solution. These clusters comprised 134 and 156 respondents, respectively. As illustrated in Figure 5, the clusters are clearly separated when k = 2, demonstrating that the k-means algorithm effectively distinguishes groups of consumers with comparable attitudes towards online influencers.
The first cluster (Cluster 1) comprised 134 customers, demonstrating more awareness towards consumption of UPFs. They exhibited higher ratings for their health concerns (Question 9, HC), better knowledge (Question 10, UPFK), less social pressure (Question 11, SN), environmental concerns (Question 12, EC), attitudes towards UPFs (Question 13, ATT), buying intention (Question 14, WP), and actual buying behaviour (Question 15, ABB) (Table 3). Among the indicators, knowledge (Question 10, UPFK), attitudes (Question 13, ATT), and health consciousness (Question 9, HC) exerted the strongest influence on overall UPF perception. Meanwhile, the second cluster (unconcerned consumers) reflected less concerns about social norms (Question 11, SN) and less knowledge about UPFs (Question 10, UPFK), with minimal intention to buy (Question 14, WP) and consume these harmful food (Question 15, ABB). Table 3 illustrates the average values of the indicators for both clusters, along with the differences between these estimates.
5.2. Sentiment Analysis
Following preprocessing and filtering, 113 responses remained, reflecting user perceptions about this food category. They are processed via sentiment analysis and the responses yielded the following scores: 30 negative (average value –0.172), 28 neutral, and 55 positive (average value 0.241). Overall, respondents generally do not supported the spread of UPFs despite their convenience and lower cost, particularly for busy individuals or those on a budget. The sentiment analysis was performed by computing a polarity value for each text entry and categorizing it as Positive, Negative, or Neutral based on its numerical value, using Python and the TextBlob library.
The detailed analysis showed that a significant portion of the group wishes to reduce or avoid UPF consumption, citing factors such as newly acquired nutrition knowledge, personal health improvements, and a desire to make better dietary choices. However, convenience and lower cost remain major barriers for others, particularly those in busy or low-income households, as UPFs are often more accessible and affordable. The call for stronger regulations is evident among a noteworthy number of respondents, who suggest policies ranging from better product labelling to outright bans, emphasizing the need for government intervention to protect public health. While a significant number of respondents report a shift in their attitudes toward UPFs, induced by increased awareness and education, others remain indifferent or unchanged in their stance. Throughout, the tension between personal choice and systemic issues is evident, as many argue that increased public awareness, stricter regulation, and the availability of healthier food alternatives could help curb UPF consumption.
5.3. SEM Model of Customer Attitude and Purchase Behaviour Towards UPFs
Based on a review of prior studies (see Section 3), there is a lack of consensus regarding the definition of inputs and outputs for evaluating consumer perceptions and attitudes towards social media influencers. To address this issue, we applied the PLS-SEM method using SmartPLS (version 3.2.9) [58]. Additionally, a standard five-step procedure was followed for constructing the PLS-SEM model.
Step 1. Formulate Hypotheses
Seven research hypotheses were formulated at the end of Section 3, focusing on the relationships between the input and output variables.
Step 2. Identify Indicators for Latent Variables
Six constructs were measured by 19 indicator variables from the survey questionnaire. The measurement model includes 10 input indicators: Health Consciousness (HC): HC1, HC2, HC3; Knowledge about UPFs (UPFK): UPFK1, UPFK2; Subjective Norms (SN): SN1, SN2, and Environmental Concerns (EC): EC1, EC2, EC3.
It also comprises nine output indicators: Attitude towards UPFs (ATT): ATT1, ATT2, ATT3; Willingness to Purchase (WP): WP1, WP2, WP3, and Actual Buying Behaviour (ABB): ABB1, ABB2, ABB3
These relationships are illustrated in Figure 6.
Step 3. Conduct Numerical Modelling
We ran the PLS algorithm to estimate model parameters and evaluate the measurement and structural models.
Step 4. Assess the Model’s Suitability
If the model fits the data, proceed to Step 5. Otherwise, return to Step 3 to refine it.
The initial assessment of outer loadings showed that most indicators fit well. However, ABB2 displayed a very low outer loading (0.076), below acceptable thresholds. Consequently, we returned to Step 3 and removed ABB2. After this adjustment, all outer loadings were within acceptable limits, allowing us to continue verifying reliability and validity (Step 4).
5.3.1. Validity and Reliability
In the first phase of validity assessment, both the measurement and structural models are examined. The measurement model establishes construct validity and reliability through evaluations of construct reliability, indicator reliability, convergent validity, and discriminant validity. In contrast, the structural model verifies the significance of the proposed relationships.
5.3.2. Factor Loadings
Factor loadings represent how strongly each item correlates with its designated principal component. Higher absolute values indicate a stronger relationship between an item and its underlying factor. In our study, all items have loadings above the recommended threshold of 0.5 [59,60]. The resulting measurement model and corresponding factor loadings are presented in Figure 7 and Table 4.
5.3.3. Indicator Multicollinearity
To assess multicollinearity among indicators, the study employs the Variance Inflation Factor (VIF). A VIF value below five suggests acceptable levels of multicollinearity. Table 5 presents the VIF values for each indicator, all of which are within the acceptable range [61].
For the final two factors, the DG rho values (0.697 and 0.482) are outside the recommended range. The value of 0.697 is almost at the borderline of acceptability, whereas 0.482 clearly falls below the threshold. Nonetheless, the remainder of the constructs meet the recommended criteria, supporting the overall reliability of the model.
5.3.4. Reliability Analysis
There are two main approaches to assess construct reliability (i.e., repeatability): Dillon–Goldstein’s rho (also known as rho_A in SmartPLS) and composite reliability (CR). For robust reliability, both DG rho and CR should ideally be above 0.7 [60]. In our study, the DG rho values ranged from 0.482 to 0.697, while the CR values spanned from 0.781 to 0.864 (see Table 5), indicating that all constructs exhibit acceptable reliability.
5.3.5. Construct Validity
Construct validity was evaluated through assessments of both convergent and discriminant validity.
5.3.6. Convergent Validity
Convergent validity, which measures the consistency among different indicators of the same concept, was examined using the average variance extracted (AVE); a value of 0.5 or higher is generally considered satisfactory [61]. All constructs surpassed this threshold (Table 5), confirming good convergent validity.
5.3.7. Discriminant Validity
Discriminant validity, or the degree to which constructs are distinct from one another, was assessed using the Fornell–Larcker criterion, which requires that the square root of the AVE for each construct exceeds its correlations with other constructs.
5.3.8. Fornell and Larker Criterion
As detailed in Table 6, this condition was met for all constructs, providing strong evidence of discriminant validity.
5.3.9. Cross-Loadings
The cross-loadings analysis examines whether each item is more strongly associated with its intended construct than with any other in the model. In this study, the findings (see Table 7) show that all items load more highly on their designated constructs (italicised) than on alternative constructs. Therefore, the examination of cross-loadings supports the confirmation of discriminant validity.
5.3.10. Heterotrait–Monotrait Ratio (HTMT)
The heterotrait–monotrait (HTMT) ratio is used to evaluate the correlations between constructs to confirm discriminant validity. While literature thresholds generally range from 0.85 to 0.9, the results from this study (see Table 8) indicate that all HTMT ratios are below the upper limit of 0.9 and are statistically significant.
5.3.11. Path Coefficients and Evaluation of the Structural Model—Hypotheses Testing
The p-values indicate that both knowledge and subjective norms have a moderate impact on attitudes toward UPFs, while environmental concerns exert a significant effect. In addition, attitudes toward UPFs strongly influence willingness to purchase, and willingness to purchase in turn has a very high impact on actual buying behaviour. All p-values are below 1%, with the exception of the health consciousness effect on attitude toward UPFs, which exceeds 20% (see Figure 8 and Table 9). These results generally support our hypotheses—with the exception of H1—and are in line with most previous research. Notably, all predictor variables have positive regression coefficients.
Within the structural model, the pathways from knowledge to attitude towards UPFs and from subjective norms to attitude towards UPFs display moderate effects. In contrast, the influence of Attitude towards UPFs on Willingness to Purchase—and the subsequent effect on Actual Buying Behaviour—are considerably stronger (see Table 9). Moreover, the Q² values confirm the model’s predictive relevance, with all values remaining above zero.
We found no moderating effects of demographics on the construct relationships, except for educational level. Educational level appears to alter, to some extent, the causal relationships between attitude and willingness to purchase, as well as between willingness to purchase and actual buying behavior. In these cases, the coefficients (β) are 0.085 and −0.075, with p-values of 0.113 and 0.116, respectively.
Step 5. Interpret the obtained results.
One possible explanation for the rejection of the first hypothesis (H1) (β = 0.079 and p > 0.05) linking health consciousness to attitudes towards UPFs is that the majority of our respondents were young individuals. Younger consumers may prioritize other factors—such as taste, convenience, or social influence—over health concerns when evaluating food choices. This demographic might also perceive the health risks associated with UPFs differently than older populations, leading to a weaker relationship between health consciousness and their attitudes towards these foods. Another possible explanation is that the conceptualisation of health consciousness might not have fully captured the specific attitudes toward UPFs. Respondents who are generally health conscious may still perceive UPFs as acceptable if they believe these foods offer convenience or align with other lifestyle priorities. This could be due to a gap between general health awareness and the nuanced understanding of UPF-related risks, thereby weakening the hypothesized link between health consciousness and attitudes toward UPFs.
The support for the hypothesis H2 (β = 0.197 and p < 0.001) linking knowledge to attitude towards UPFs can be explained by the fact that greater knowledge can reduce uncertainty and enhance risk perception, prompting consumers to reassess their dietary choices. As individuals become more aware of the ingredients, processing methods, and long-term consequences of consuming UPFs, they are likely to adopt attitudes that favour healthier alternatives, thereby reinforcing the significant influence of knowledge on consumer attitudes. Additionally, increased knowledge often correlates with improved nutrition literacy and access to reliable information sources. This empowers consumers to critically evaluate UPF marketing claims and make informed decisions, further solidifying the positive relationship between knowledge and a more cautious, health-oriented attitude toward UPFs.
Subjective norms influence attitudes towards UPFs (H3) (β = 0.117 and p < 0.05) by shaping individuals’ perceptions of what is considered acceptable or desirable within their social circles. When family, friends, or influential social groups express concerns about UPF consumption or promote healthier eating habits, individuals are more likely to adopt a similar attitude, aligning their personal beliefs with those of their peers. Additionally, social pressure and the desire for social conformity play crucial roles. People often adjust their dietary choices to meet the expectations of significant others, thereby reinforcing attitudes that reflect the prevailing social sentiment. This dynamic, rooted in social learning and normative influence, strengthens the relationship between subjective norms and a more cautious, health-conscious stance towards UPFs. However, with a beta of 0.117, this suggests a relatively weak but still significant influence of subjective norms on attitudes towards UPFs, indicating that while social pressures play a role, the impact is not as strong as other factors in shaping consumer attitudes.
The hypothesis H4, linking environmental concerns to attitudes towards UPFs, is supported (β = 0.491 and p < 0.001)) due to growing awareness among consumers about the environmental impact of food production, particularly that of UPFs. Individuals who are conscious of the ecological consequences—such as carbon footprints, packaging waste, and resource depletion—are more likely to adopt an attitude that opposes the consumption of products associated with significant environmental harm. Increasingly, many consumers who value sustainability and care about the planet’s future are motivated to choose plant-based, minimally processed foods over UPFs, strengthening the link between environmental concerns and attitudes toward ultra-processed foods. H4 is supported because consumers with strong environmental concerns tend to be more aware of the ecological impacts associated with ultra-processed food production, such as excessive packaging waste, high energy consumption, and carbon emissions. This heightened awareness leads them to form more critical attitudes toward UPFs, aligning with broader sustainable consumption practices and reinforcing the negative perception of UPFs within environmentally conscious social circles.
H5 is supported (β = 0.527 and p < 0.001) because individuals with a positive attitude towards UPFs often associate them with greater convenience, taste, or perceived value, which further strengthens their willingness to purchase such products. Additionally, a positive attitude can influence consumer behaviour by creating a sense of trust and satisfaction, making the prospect of purchasing UPFs more appealing, especially when marketing messages align with their personal preferences. H5 is supported because a positive attitude toward UPFs makes these products appear more attractive, reducing perceived risks and enhancing consumer confidence in their quality. Additionally, favourable attitudes often foster brand loyalty, leading to repeated purchase behaviour, while effective marketing and social influences further reinforce this positive perception. Moreover, when consumers associate UPFs with convenience and desirable taste attributes, their willingness to purchase is further increased.
H6 is supported (β = 0.694 and p < 0.001) because a high willingness to purchase typically translates into actual buying behaviour, indicating that when consumers express strong intentions, they are likely to follow through with their purchases. Additionally, this consistency suggests that willingness to purchase is a reliable predictor of market behaviour, reflecting stable consumer decision-making processes that drive the transition from intention to action.
Our testing partially supports H7 regarding educational level, unlike the rest of the moderating sub-hypotheses. For the paths between attitude and willingness to purchase (β = 0.085 and p = 0.113), and attitude and willingness to purchase and actual buying behaviour (β = –0.075 and p = 0.118), individuals that are more educated are less reliant on independent variables in comparison to their counterparts. This may be attributed to the enhanced critical thinking skills fostered by higher education, which enable these consumers to more effectively assess information and evaluate the credibility of claims. As a result, educated individuals tend to be more sceptical of marketing messages and endorsements related to UPFs, placing less emphasis on such factors when forming their attitudes.
To examine the mediating role of demographic characteristics on consumer attitudes towards UPFs, willingness to purchase, and actual purchase decisions, a series of ANOVA tests were conducted. The results reveal statistically significant differences in the mean values of key constructs across different demographic groups. A difference was observed in HC between male and female respondents, which suggests that gender may influence the degree to which individuals consider health factors when making food choices. Significant differences were also identified in SN, ATT, and WP across different age groups. This indicates that perceptions of social expectations and personal attitudes towards UPFs, as well as purchasing intentions, vary with age. Respondents with different income levels exhibited significant differences in their knowledge about UPFs, which implies that financial status may be associated with varying levels of understanding and awareness and their potential health implications. Education level significantly influenced SN, EC, and ATT and this suggests that higher education levels may be linked to increased awareness of environmental and societal perspectives on food consumption. The proportion of UPFs in an individual’s daily menu was found to be significantly related to HC, SN, EC, ATT, WP, and ABB, which reinforces the notion that frequent UPF consumption is associated with varying attitudes, perceived norms, and purchasing behaviours.
The results provide empirical support for the hypothesis H7. The observed differences in health consciousness, social norms, and environmental concerns across demographic groups highlight the importance of tailored marketing strategies and public health campaigns.
As presented in Table 9, the R² values are 0.508, 0.278, and 0.482 for consumer attitude towards UPFs, buying intention, and consumption, respectively. This indicates that approximately 51% of the variability in consumer attitude towards UPFs, 28% of the variability in buying intention, and 48% of the variability in consumption are explained by their respective predictor variables—namely, knowledge, subjective norms, and environmental concerns for consumer attitude; consumer attitude for buying intention; and willingness to purchase for consumption. Based on standard thresholds, the model for consumer attitude demonstrates a strong explanatory power, while those for buying intention and consumption are classified as moderate.
5.4. Other Models of Customer Attitudes towards UPFs
To explore the relationships between the input and output constructs, we applied five ML algorithms as detailed in Table 10. The mean square error (MSE) measures the average squared difference between predicted and actual values, while the mean absolute error (MAE) reflects the average of the absolute differences. In addition, the root mean square error (RMSE) is defined as the square root of the MSE, offering an error metric in the same units as the output variable. Linear regression consistently achieved superior performance across all evaluation metrics, followed by the AdaBoost and Random Forest methods.
While SEM approach typically yields lower R² values (from 0.508 to 0.694) compared to ML techniques, their main strength lies in the clear interpretability of the results. In contrast, ML models often achieve higher accuracy (ranging from 0.816 to 0.999) but tend to produce predictions that are less transparent and more difficult to explain. Ultimately, the choice between these methods depends on the specific objectives and requirements of the analysis.
Applying the coefficients from the SEM, we also can use well-established MCDM methods, such as the VIseKriterijumska Optimizacija I Kompromisno Resenje (VIKOR) to evaluate alternatives by calculating the distance from the ideal solution to identify the best compromise solution. In this case, the obtained complex composite index assesses consumer satisfaction towards UPF alternatives. Another distance-based MCDM method is the Combined Compromise Solution (CoCoSo) method. CoCoSo integrates both additive and multiplicative aggregation approaches to rank alternatives based on their weighted criteria values and the distances from ideal solutions, providing a robust compromise ranking of compared UPF options.
6. Conclusions
Ultra-processed foods have transformed the modern food landscape, influencing consumer choices and dietary habits. This study shows that factors such as health consciousness, UPF knowledge, and subjective norms are key determinants of consumer behaviour. The results call for targeted policies, product innovation, and effective public education to promote healthier and more sustainable food choices.
The key findings of the study are:
- According to the demographic analysis, 98% of respondents live in urban areas, 76% are under the age of 40, and 77% are female. In terms of education, the respondents were evenly distributed between high school and higher educational levels.
- The participants were grouped into two statistically significant clusters. The first cluster consists of users who demonstrate more knowledge and awareness of UPFs and exhibit higher concern about their impact on both personal health and the environment. In contrast, the second cluster includes respondents with fewer concerns about social norms and the possible impacts of frequent UPF consumption.
The theoretical SEM models revealed the following dependencies:
- There is no statistically significant impact of health consciousness (H1) on attitudes towards UPFs.
- UPF knowledge (H2), social norms (H3), and environmental concerns (H4) all have statistically significant effects on attitudes towards UPFs.
- Attitudes towards UPFs (H5) significantly influence customer willingness to purchase.
- Consumer willingness to purchase (H6) has a statistically significant effect on actual buying behaviour.
- Additionally, demographic factors such as age, gender, educational level, and place of residence (H7) significantly affect customers’ attitudes, willingness to purchase, and purchase decisions.
Our contributions to the study of UPF consumption include identifying the key drivers behind consumer attitudes and purchasing behaviour related to UPFs. In particular, we propose models that researchers and policymakers can utilize to develop effective strategies for reducing UPF intake and promoting healthier dietary practices. Food producers, retailers, and industry stakeholders can also leverage these models to reformulate products, adopt transparent marketing practices, and introduce healthier alternatives, thereby aligning their strategies with public health objectives.
Given the complexities of UPFs and their impact on health and the environment, all stakeholders must take action. Consumers can contribute by choosing products with fewer additives, engaging with health-focused content, advocating for improved food policies, and supporting businesses that prioritize sustainable, healthier options. For food producers, retailers, and industry stakeholders, it is essential to innovate in product reformulation and adopt transparent marketing practices. SMEs should explore niche markets by offering healthier, less processed alternatives, while larger corporations can use their resources to boost product quality and sustainability. These strategies build consumer trust and foster a more health-conscious, environmentally responsible food landscape. For policymakers and regulators, adopting strict guidelines and public education campaigns to communicate UPF health risks is recommended. This could involve mandatory labelling, fiscal measures (e.g., taxes on UPFs or subsidies for healthier alternatives), and partnerships with health organizations to promote evidence-based nutrition, ultimately encouraging healthier consumption and reducing long-term healthcare costs.
This study has several limitations. First, the sample size and its characteristics may not fully capture the diversity of demographic perspectives. Second, consumer perceptions are complex, influenced by a range of psychological, social, and cultural factors that were not fully addressed in our analysis. Third, the focus was solely on individual consumer attitudes, omitting valuable insights from marketing experts and business representatives, which may result in an incomplete picture of the broader UPF landscape.
Future research should aim to overcome these limitations by broadening the participant pool to include additional demographics, such as Generation Alpha, and by investigating both direct and indirect relationships between variables using advanced SEM techniques. Comparative studies across different countries, with particular attention to the moderating effects of socio-economic factors like income and region, would also be beneficial. Furthermore, exploring the evolution of consumer behaviour in a post-pandemic environment and applying fuzzy MCDM methods to understand the multi-attribute interdependencies influencing consumer satisfaction in UPF marketing are recommended to ensure that future strategies foster ethical, socially responsible, and inclusive digital transformations.
Author Contributions
Conceptualization, G.I., T.Y., and Y.D.; modelling, G.I., T.Y., M.R., and S.K.-B.; validation, G.I. and T.Y.; formal analysis, T.Y.; resources, G.I., T.Y., Y.D., M.R., S.K.-B., and A.D.; writing—original draft preparation, G.I.; writing—review and editing, G.I., T.Y., and Y.D.; visualization, T.Y. and S.K.-B.; supervision, G.I.; project administration, Y.D.; funding acquisition, G.I. and T.Y. All authors have read and agreed to the published version of the manuscript.
Funding
This research was partially funded the Ministry of Education and Science and by the National Science Fund, co-founded by the European Regional Development Fund, Grant No. BG05M2OP001-1.002-0002 and BG16RFPR002-1.014-0013-M001 “Digitization of the Economy in Big Data Environment”.
Informed Consent Statement
Not applicable.
Data Availability Statement
The data stored as csv and pdf files are publicly available at https://data.mendeley.com/datasets/4m9k8xwbmt/1 (accessed on 23 February 2025).
Acknowledgements
The authors thank the academic editor and anonymous reviewers for their insightful comments and suggestions.
Conflicts of Interest
The authors declare no conflicts of interest.
References
- Monteiro, C.A.; Cannon, G.; Levy, R.B.; Moubarac, J.C.; Louzada, M.L.; Rauber, F.; Khandpur, N.; Cediel, G.; Neri, D.; Martinez-Steele, E.; Baraldi, L.G.; Jaime, P.C. Ultra-processed foods: What they are and how to identify them. Public Health Nutr. 2019, 22, 936–941. [Google Scholar] [CrossRef] [PubMed]
- Wood, B.; Robinson, E.; Baker, P.; et al. What is the purpose of ultra-processed food? An exploratory analysis of the financialisation of ultra-processed food corporations and implications for public health. Glob. Health 2023, 19, 85. [Google Scholar] [CrossRef] [PubMed]
- Elizabeth, L.; Machado, P.; Zinöcker, M.; Baker, P.; Lawrence, M. Ultra-processed foods and health outcomes: A narrative review. Nutrients 2020, 12, 1955. [Google Scholar] [CrossRef] [PubMed]
- Gregory, A.; Ultra-Processed Food Linked to 32 Harmful Effects to Health, Review Finds. The Guardian 2024. Available online: https://www.theguardian.com/society/2024/feb/28/ultra-processed-food-32-harmful-effects-health-review (accessed on 1 February 2025).
- Anastasiou, K.; Baker, P.; Hadjikakou, M.; Hendrie, G.A.; Lawrence, M. A conceptual framework for understanding the environmental impacts of ultra-processed foods and implications for sustainable food systems. J. Clean. Prod. 2022, 368, 133155. [Google Scholar] [CrossRef]
- Ballard Brief. The Overconsumption of Ultra-Processed Foods in the United States. Available online: https://ballardbrief.byu.edu/issue-briefs/the-overconsumption-of-ultra-processed-foods-in-the-united-states (accessed on 1 February 2025).
- Gangopadhyay, A. Ultraprocessed Foods and Cancer in Low-Middle-Income Countries. Nutr. Cancer 2023, 75, 1863–1873. [Google Scholar] [CrossRef]
- Onyeaka, H.; Nwaiwu, O.; Obileke, K.; Miri, T.; Al-Sharify, Z.T. Global Nutritional Challenges of Reformulated Food: A Review. Food Sci. Nutr. 2023, 11, 2483–2499. [Google Scholar] [CrossRef]
- Pereira, T.N.; Bortolini, G.A.; Campos, R.D.F. Barriers and Facilitators Related to the Adoption of Policies to Reduce Ultra-Processed Foods Consumption: A Scoping Review. Int. J. Environ. Res. Public Health 2023, 20, 4729. [Google Scholar] [CrossRef]
- Russell, C.; Dickie, S.; Baker, P.; Lawrence, M. Does the Australian health star rating system encourage added sugar reformulation? Trends in sweetener use in Australia. Nutrients 2021, 13, 898. [Google Scholar] [CrossRef]
- Kliestik, T.; Zvarikova, K.; Lăzăroiu, G. Data-driven machine learning and neural network algorithms in the retailing environment: Consumer engagement, experience, and purchase behaviors. Econ. Manag. Financ. Markets 2022, 17, 57–69. [Google Scholar]
- Juul, F.; Vaidean, G.; Lin, Y.; Deierlein, A.L.; Parekh, N. Ultra-processed foods and incident cardiovascular disease in the Framingham Offspring Study. J. Am. Coll. Cardiol. 2021, 77, 1520–1531. [Google Scholar] [CrossRef]
- Levy, R.B.; Rauber, F.; Chang, K.; Louzada, M.L.D.C.; Monteiro, C.A.; Millett, C.; Vamos, E.P. Ultra-processed food consumption and type 2 diabetes incidence: a prospective cohort study. Clin. Nutr. 2021, 40, 3608–3614. [Google Scholar] [CrossRef] [PubMed]
- Kesse-Guyot, E.; Allès, B.; Brunin, J.; Fouillet, H.; Dussiot, A.; Berthy, F.; …; Touvier, M. Environmental impacts along the value chain from the consumption of ultra-processed foods. Nat. Sustain. 2023, 6, 192–202. [Google Scholar] [CrossRef]
- Popkin, B.M.; Barquera, S.; Corvalan, C.; Hofman, K.J.; Monteiro, C.; Ng, S.W.; Swart, E.C.; Taillie, L.S. Towards unified and impactful policies to reduce ultra-processed food consumption and promote healthier eating. Lancet Diabetes Endocrinol. 2021, 9, 462–470. [Google Scholar] [CrossRef]
- Lane, M.M.; Gamage, E.; Du, S.; Ashtree, D.N.; McGuinness, A.J.; Gauci, S.; Baker, P.; Lawrence, M.; Rebholz, C.M.; Srour, B.; Touvier, M.; Jacka, F.N.; O’Neil, A.; Segasby, T.; Marx, W. Ultra-processed food exposure and adverse health outcomes: umbrella review of epidemiological meta-analyses. BMJ 2024, 384. [Google Scholar] [CrossRef]
- Martini, D.; Godos, J.; Bonaccio, M.; Vitaglione, P.; Grosso, G. Ultra-Processed Foods and Nutritional Dietary Profile: A Meta-Analysis of Nationally Representative Samples. Nutrients 2021, 13, 3390. [Google Scholar] [CrossRef]
- Monteiro, C.A.; Cannon, G.; Lawrence, M.; Costa Louzada, M.D.; Pereira Machado, P. Ultra-processed foods, diet quality, and health using the NOVA classification system. FAO: Rome, Italy, 2019, 48.
- Wood, B.; Williams, O.; Nagarajan, V.; et al. Market strategies used by processed food manufacturers to increase and consolidate their power: a systematic review and document analysis. Glob. Health 2021, 17, 17. [Google Scholar] [CrossRef]
- Baker, P.; Machado, P.; Santos, T.; Sievert, K.; Backholer, K.; Hadjikakou, M.; Russell, C.; Huse, O.; Bell, C.; Scrinis, G.; Worsley, A.; Friel, S.; Lawrence, M. Ultra-processed foods and the nutrition transition: Global, regional and national trends, food systems transformations and political economy drivers. Obes. Rev. 2020, 21, e13126. [Google Scholar] [CrossRef]
- Monteiro, C.A.; Cannon, G.; Levy, R.B.; Moubarac, J.-C.; Louzada, M.L.C.; Rauber, F.; Khandpur, N.; Cediel, G.; Neri, D.; Martinez-Steele, E.; Baraldi, L.G.; Jaime, P.C. Ultra-processed foods: what they are and how to identify them. Public Health Nutr. 2018, 21, 4–11. [Google Scholar] [CrossRef]
- Julia, C.; Ducrot, P.; Péneau, S.; Deschamps, V.; Méjean, C.; Fézeu, L.; Touvier, M.; Hercberg, S.; Kesse-Guyot, E. Discriminating nutritional quality of foods using the 5-Color nutrition label in the French food market: consistency with nutritional recommendations. Nutr. J. 2015, 14, 100. [Google Scholar] [CrossRef]
- Scarborough, P.; Rayner, M.; Stockley, L.; Black, A. Nutrition professionals’ perception of the ‘Ofcom’ nutrient profiling model. Br. J. Nutr. 2013, 109, 769–775. [Google Scholar]
- Jones, A.; Rådholm, K.; Neal, B. Defining “unhealthy”: A systematic analysis of alignment between the Australian Health Star Rating system and dietary guidelines. Nutrients 2018, 10, 501. [Google Scholar] [CrossRef] [PubMed]
- Feyzabadi, V.Y.; Mohammadi, N.K.; Omidvar, N.; Karimi-Shahanjarini, A.; Nedjat, S.; Rashidian, A. Factors associated with unhealthy snacks consumption among adolescents in Iran’s schools. Int. J. Health Policy Manag. 2017, 6, 519–528. [Google Scholar] [CrossRef] [PubMed]
- Poudel, B.; Tiraphat, S.; Hong, S.A. Factors associated with junk food consumption among urban school students in Kathmandu District of Nepal. J. Public Health Dev. 2018, 16, 59–72. https://bit.ly/3z89eBw.
- Ajzen, I. The theory of planned behavior. Organ. Behav. Hum. Decis. Process. 1991, 50, 179–211. [Google Scholar] [CrossRef]
- Rosenstock, I.M.; Strecher, V.J.; Becker, M.H. Social learning theory and the Health Belief Model. Health Educ. Q. 1988, 15, 175–183. [Google Scholar] [CrossRef]
- Drewnowski, A.; Almiron-Roig, E. Human perceptions and preferences for fat-rich foods. In Fat Detection: Taste, Texture, and Post Ingestive Effects 2010; pp. 265–290.
- Gearhardt, A.N.; Yokum, S.; Stice, E.; Corbin, W.R.; Brownell, K.D. Food addiction and obesity: evidence from bench to bedside. J. Addict. Med. 2011, 5, 235–242. [Google Scholar]
- Schulte, E.M.; Avena, N.M.; Gearhardt, A.N. Which foods may be addictive? The roles of processing, fat content, and glycemic load. PLoS One 2015, 10, e0117959. [Google Scholar] [CrossRef]
- Contini, C.; Boncinelli, F.; Gerini, F.; Scozzafava, G.; Casini, L. Investigating the role of personal and context-related factors in convenience foods consumption. Appetite 2018, 126, 26–35. [Google Scholar] [CrossRef]
- Yan, C.; Siddik, A.B.; Masukujjaman, M.; Dong, Q.; Hamayun, M.; Guang-Wen, Z.; Ibrahim, A.M. Bi-dimensional values and attitudes toward online fast food-buying intention during the COVID-19 pandemic: An application of VAB model. Front. Nutr. 2022, 9, 894765. [Google Scholar] [CrossRef]
- Arroyo, P. The influence of food values on snacks and beverage choices: an experimental study in Mexico. Estud. Gerenc. 2023, 39, 387–401. [Google Scholar] [CrossRef]
- Calvo-Porral, C.; Rivaroli, S.; Orosa-González, J. Proposal and Validation of a Measurement Scale of the Acceptance of Ultra-Processed Food Products. Foods 2024, 13, 1481. [Google Scholar] [CrossRef] [PubMed]
- Norfarah, N.; Ali, S.M.; Suzlipah, S. How AI-Powered Recommendations Moderate the Effect of Consumer Value on Ultra-Processing Food Consumption? Glob. Bus. Manag. Res. 2024, 16. [Google Scholar]
- Raj, S.; Choudhury, M.; Mishra, B.B.; Samal, A.R. The role of extrinsic and intrinsic factors on the purchase intention toward processed food: a cross-sectional study in India. Int. J. Bus. Emerg. Mark. 2024, 16, 21–49. Available online: https://www.inderscienceonline.com/doi/abs/10.1504/IJBEM.2024.135107. [CrossRef]
- Stamatelou, D.; Leonti, E.; Komzia, T.; Strati, G.; Arsenou, E.; Vlastaridou, E.; Panagiotakos, D. Knowledge, perceptions and consumption of ultra-processed foods in the Greek population: A cross-sectional epidemiological study. Arch. Hell. Med. 2024, 41. [Google Scholar]
- Yuan, S.; Liu, W.; Shen, Z.; Ren, M.; Hao, S. Knowledge, attitude, and practice toward food preservatives among pregnant women. 2024.
- van der Merwe, D.; de Beer, H.; Ellis, S.; Bester, P.; Marais, F.; Steyn, A. Consumer objective and subjective knowledge about healthy foods: An approach to promote healthy lifestyle choices in South Africa. PLoS One 2024, 19, e0296504. [Google Scholar] [CrossRef]
- Zheng, S.; Wang, L.; Yu, Z. The Impact of Multidimensional Perceived Value on Purchase Intentions for Prepared Dishes in China: The Mediating Role of Behavioral Attitudes and the Moderating Effect of Time Pressure. Foods 2024, 13, 3778. [Google Scholar] [CrossRef]
- Mai, R.; Hoffmann, S. How to combat the unhealthy= tasty intuition: The influencing role of health consciousness. J. Public Policy Mark. 2015, 34, 63–83. [Google Scholar] [CrossRef]
- Wood, M.; Shukla, P. Weight bias, health consciousness and behavioral actions. Eat. Behav. 2016, 23, 200–205. [Google Scholar] [CrossRef]
- Busse, K.R.; Dino, M.E.; Martin, S.L.; Mayol, N.R.L.; Bechayda, S.A.; Adair, L.S.; Ammerman, A.S. Awareness, experiences, and beliefs related to ultra-processed foods among young people in Cebu, Philippines. Appetite 2024, 203, 107688. [Google Scholar] [CrossRef]
- Sarmiento-Santos, J.; Souza, M.B.; Araujo, L.S.; Pion, J.M.; Carvalho, R.A.; Vanin, F.M. Consumers’ understanding of ultra-processed foods. Foods 2022, 11, 1359. [Google Scholar] [CrossRef]
- Nguyen, T.T.; Cashin, J.; Ching, C.; Baker, P.; Tran, H.T.; Weissman, A.; Nguyen, T.T.; Mathisen, R. Beliefs and norms associated with the use of ultra-processed commercial milk formulas for pregnant women in Vietnam. Nutrients 2021, 13, 4143. [Google Scholar] [CrossRef] [PubMed]
- Cairns, G. A critical review of evidence on the sociocultural impacts of food marketing and policy implications. Appetite 2019, 136, 193–207. [Google Scholar] [CrossRef] [PubMed]
- Cavaliere, A.; Ricci, E.C.; Solesin, M.; Banterle, A. Can health and environmental concerns meet in food choices? Sustainability 2014, 6, 9494–9509. [Google Scholar] [CrossRef]
- Frehner, A.; Van Zanten, H.H.; Schader, C.; De Boer, I.J.; Pestoni, G.; Rohrmann, S.; Muller, A. How food choices link sociodemographic and lifestyle factors with sustainability impacts. J. Clean. Prod. 2021, 300, 126896. [Google Scholar] [CrossRef]
- Colozza, D. A qualitative exploration of ultra-processed foods consumption and eating out behaviours in an Indonesian urban food environment. Nutr. Health 2024, 30, 613–623. [Google Scholar] [CrossRef]
- Haneberg, J.; Molin, M.; Gjeitung Byfuglien, M.; Garnweidner-Holme, L. Vegetarians’ and vegans’ experiences with and attitudes towards ultra-processed foods (UPF): a qualitative study. BMC Nutr. 2024, 10, 121. [Google Scholar] [CrossRef]
- D’Angelo Campos, A.; Ng, S.W.; Duran, A.C.; Khandpur, N.; Taillie, L.S.; Christon, F.O.; Hall, M.G. “Warning: ultra-processed”: an online experiment examining the impact of ultra-processed warning labels on consumers’ product perceptions and behavioral intentions. Int. J. Behav. Nutr. Phys. Act. 2024, 21, 115. [Google Scholar] [CrossRef]
- Egnell, M.; Boutron, I.; Péneau, S.; Ducrot, P.; Touvier, M.; Galan, P.; Fezeu, L.; Porcher, R.; Ravaud, P.; Hercberg, S.; Kesse-Guyot, E.; Julia, C. The impact of the Nutri-Score front-of-pack nutrition label on purchasing intentions of unprocessed and processed foods: post-hoc analyses from three randomized controlled trials. Int. J. Behav. Nutr. Phys. Act. 2021, 18, 1–12. [Google Scholar] [CrossRef]
- Ilieva, G.; Yankova, T.; Ruseva, M.; Dzhabarova, Y.; Klisarova-Belcheva, S.; Dimitrov, A. Ultra-Processed Foods – Exploring Consumer Attitudes and Consumption Behaviour. Mendeley Data 2024. Available online: https://data.mendeley.com/drafts/7dng3s8sfv.
- Wang, L.; Martínez Steele, E.; Du, M.; Pomeranz, J.L.; O’Connor, L.E.; Herrick, K.A.; Luo, H.; Zhang, X.; Mozaffarian, D.; Zhang, F.F. Trends in Consumption of Ultraprocessed Foods Among US Youths Aged 2–19 Years, 1999–2018. JAMA 2021, 326, 519–530. [Google Scholar] [CrossRef]
- Monteiro, C.A.; Moubarac, J.C.; Levy, R.B.; Canella, D.S.; Louzada, M.L.D.C.; Cannon, G. Household availability of ultra-processed foods and obesity in nineteen European countries. Public Health Nutr. 2018, 21, 18–26. [Google Scholar] [CrossRef]
- Dittmann, A.; Werner, L.; Hörz, L.; Luft, T.; Finkbeiner, F.; Storcksdieck genannt Bonsmann, S. Sociodemographic and behavioural differences between frequent and non-frequent users of convenience food in Germany. Front. Nutr. 2024, 11, 1369137. [Google Scholar] [CrossRef]
- Ringle, C.M.; Wende, S.; Becker, J.-M. SmartPLS 4; SmartPLS GmbH: Bönningstedt, Germany, 2024. [Google Scholar]
- Pett, M.A.; Lackey, N.R.; Sullivan, J.J. Making Sense of Factor Analysis: The Use of Factor Analysis for Instrument Development in Health Care Research; Sage Publications: Thousand Oaks, CA, USA, 2003; 368 p.
- Hair, J.F., Jr.; Black, W.C.; Babin, B.J.; Anderson, R.E. Multivariate Data Analysis, 7th ed.; Pearson: Edinburgh, UK, 2014. [Google Scholar]
- Fornell, C.; Bookstein, F.L. Two Structural Equation Models: LISREL and PLS Applied to Consumer Exit-voice Theory. J. Mark. Res. 1982, 19, 440–452. [Google Scholar] [CrossRef]
Figure 1.
Structural diagram of the research hypotheses.
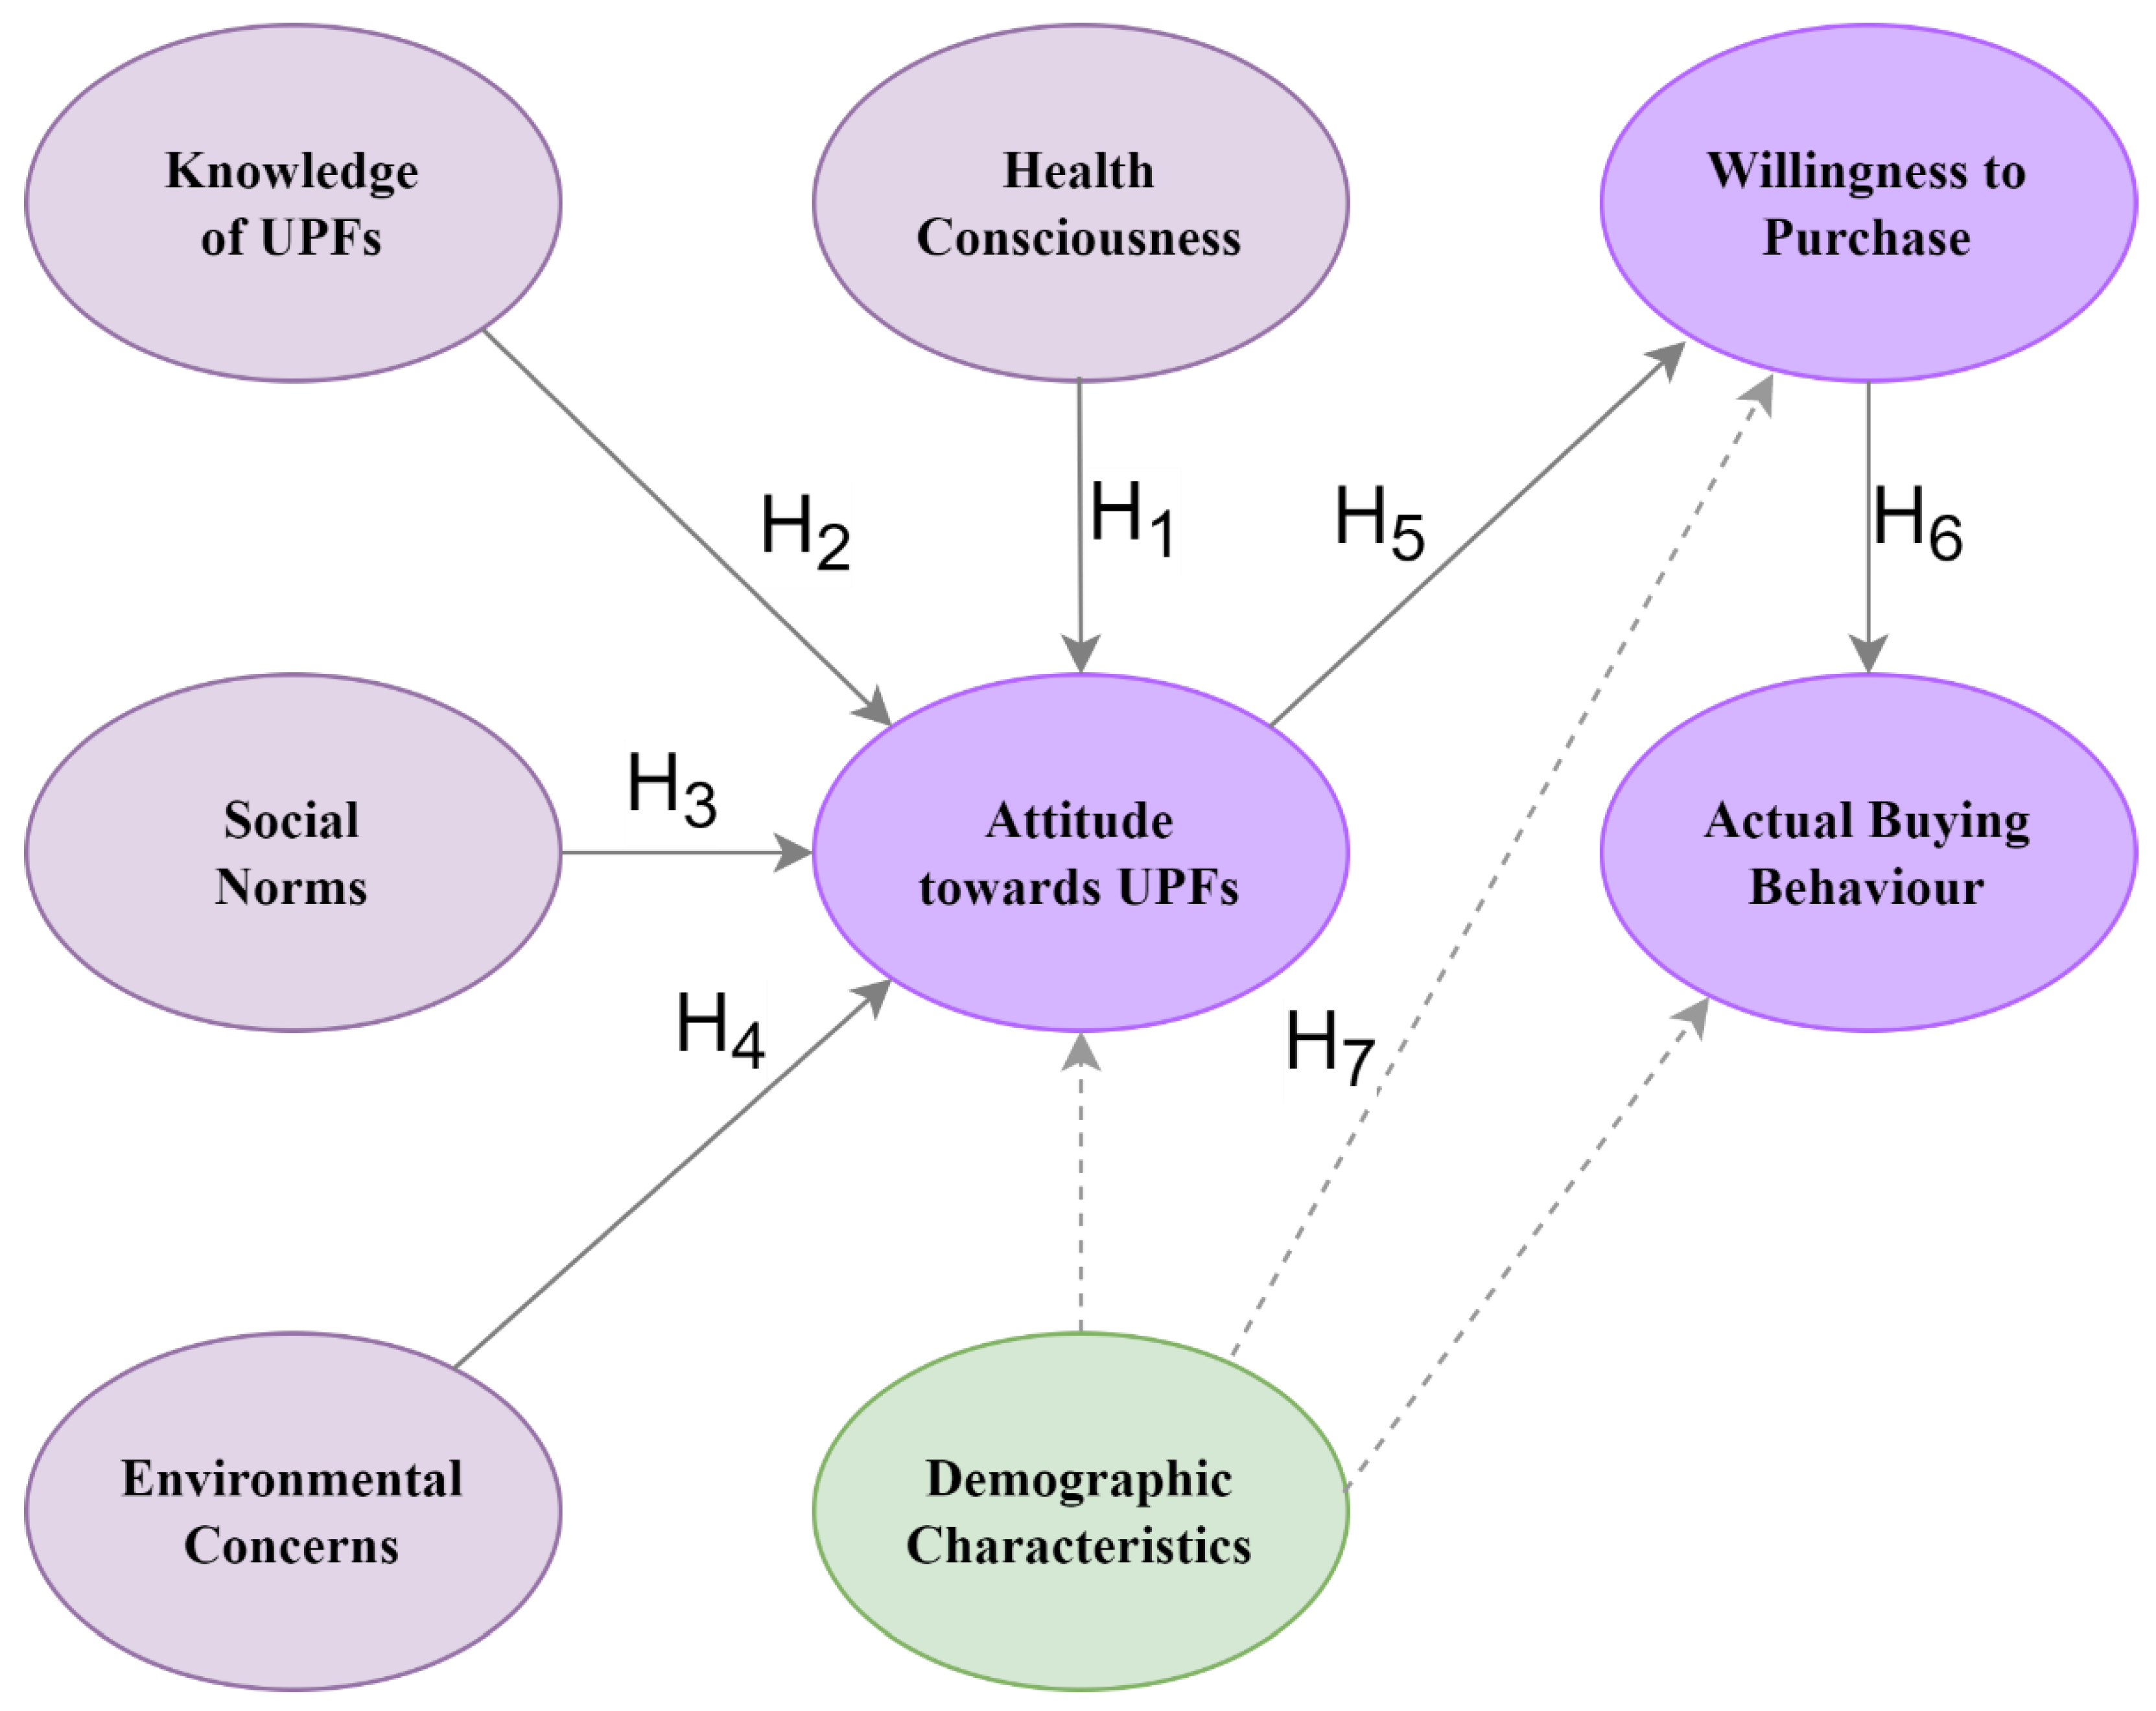
Figure 2.
The ordered dissimilarity matrix of the respondents’ answers.
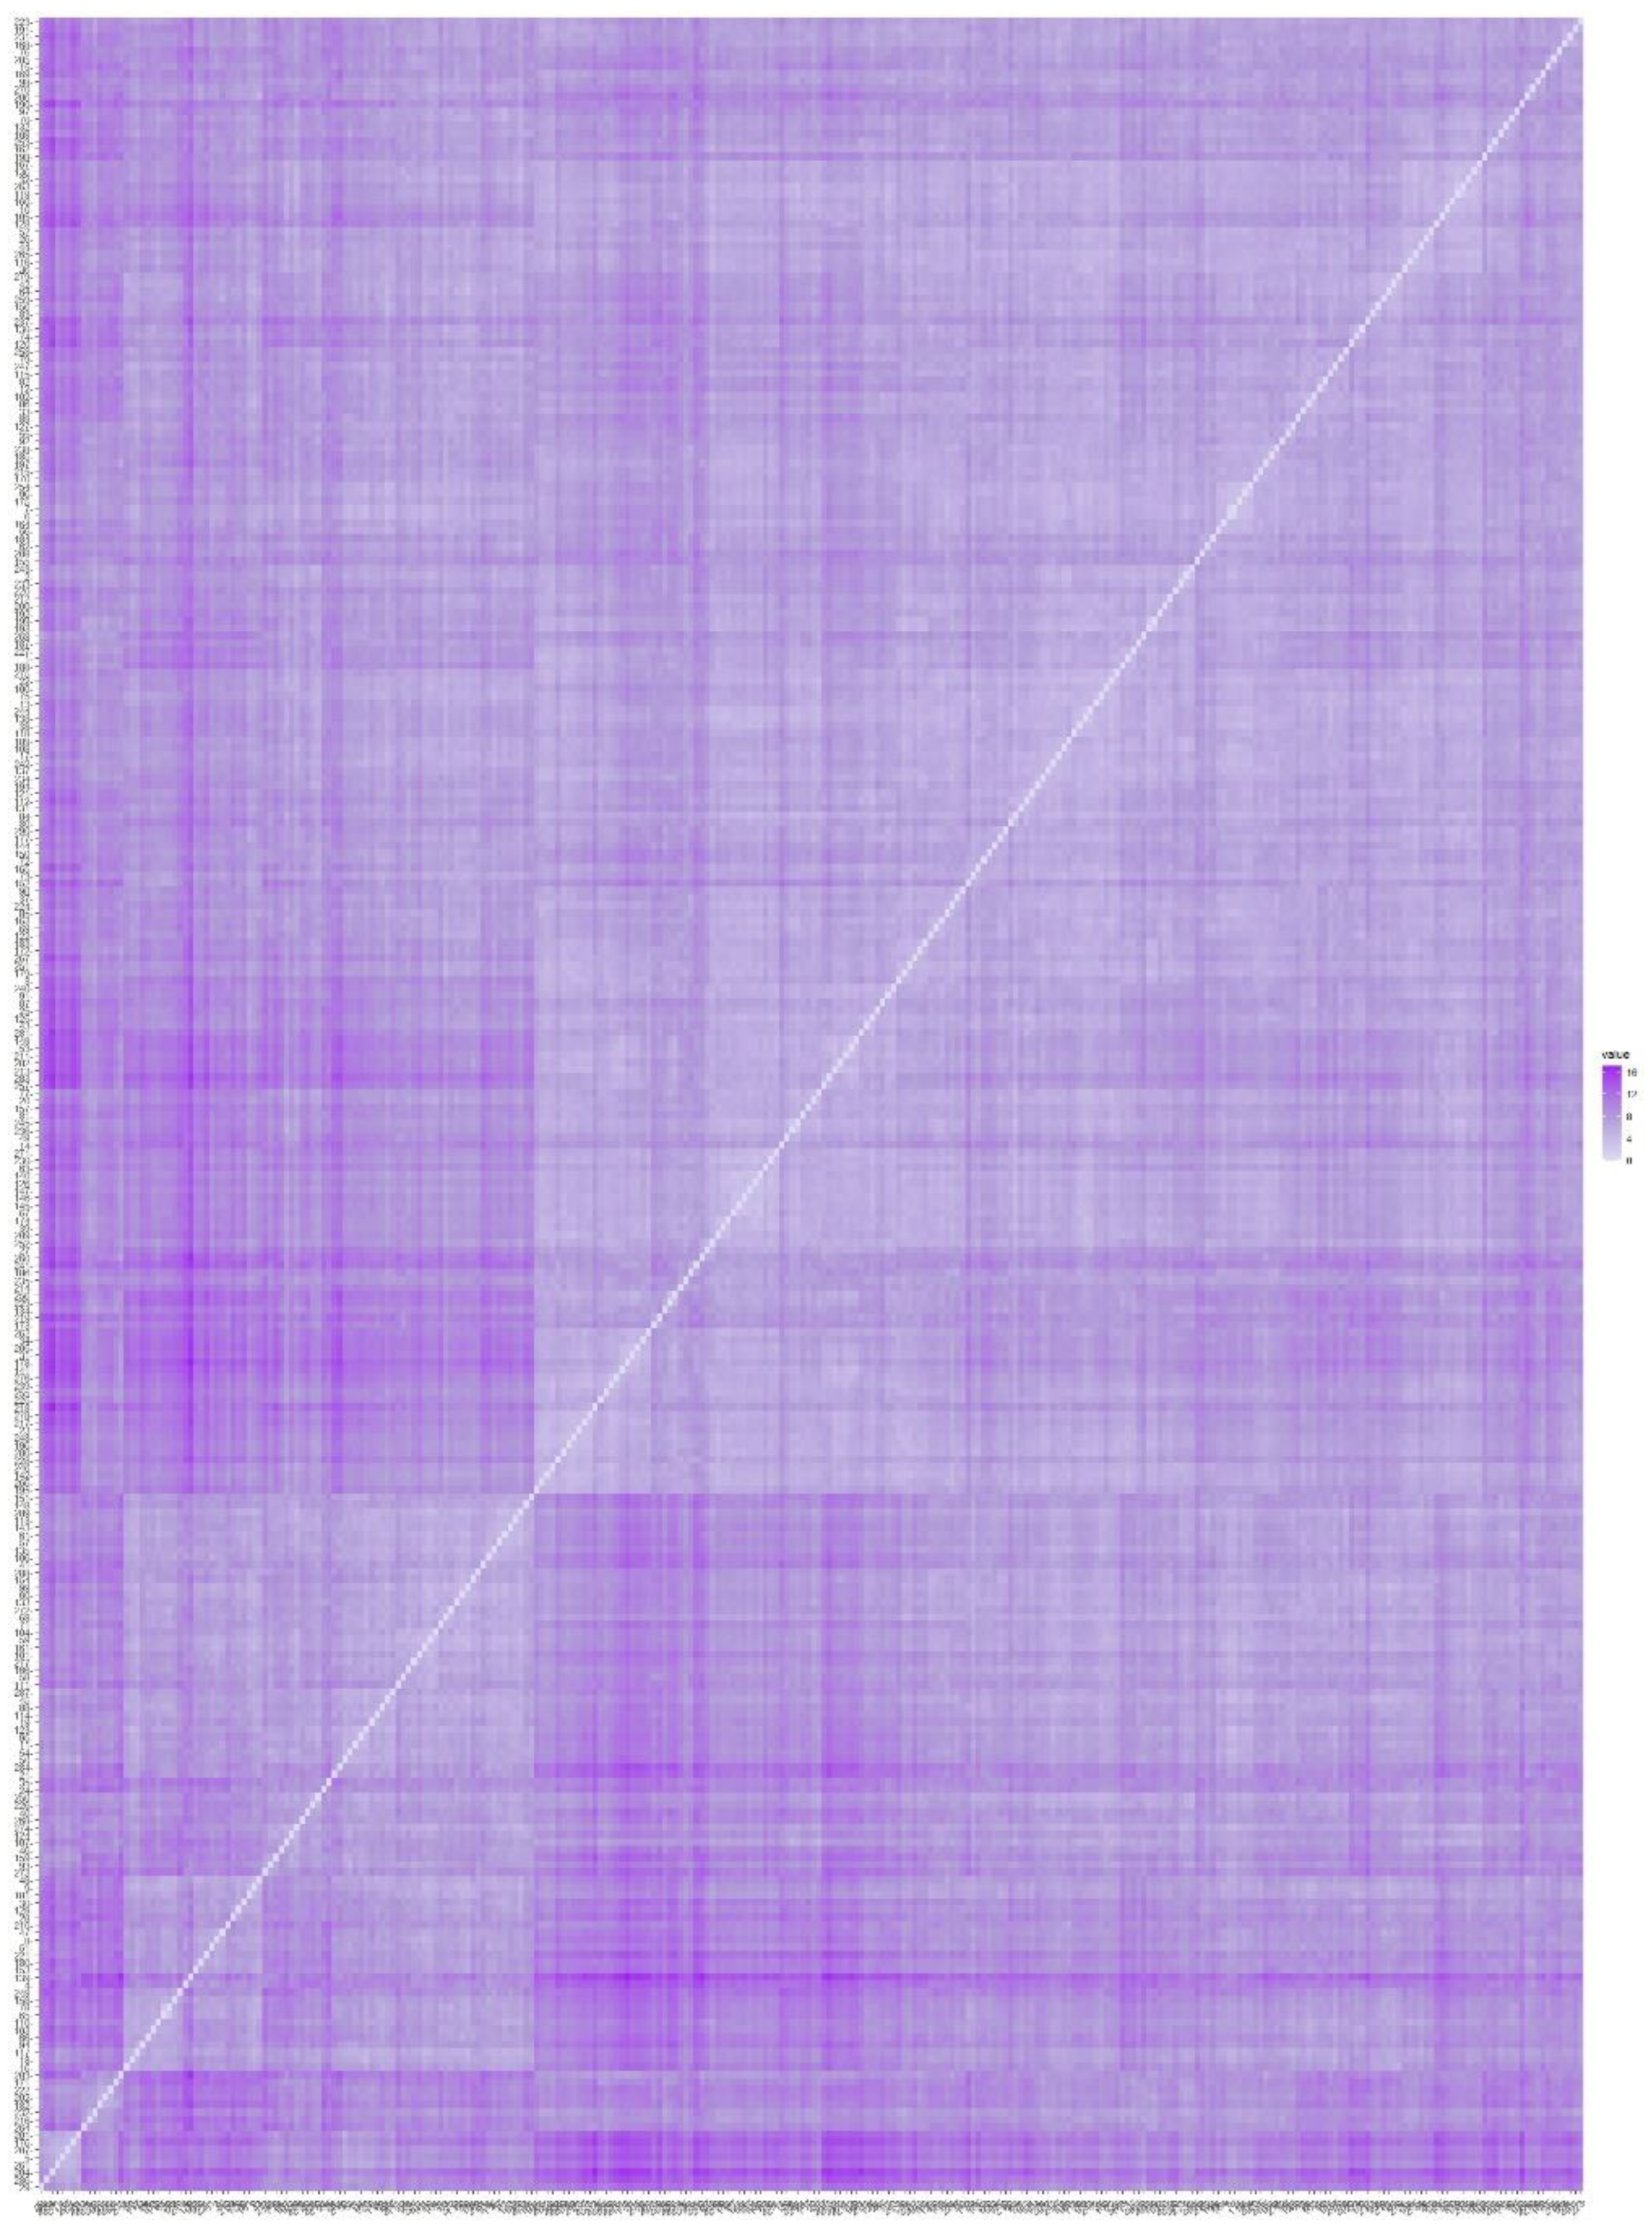
Figure 3.
Hierarchical group heat map, shown by respondents.
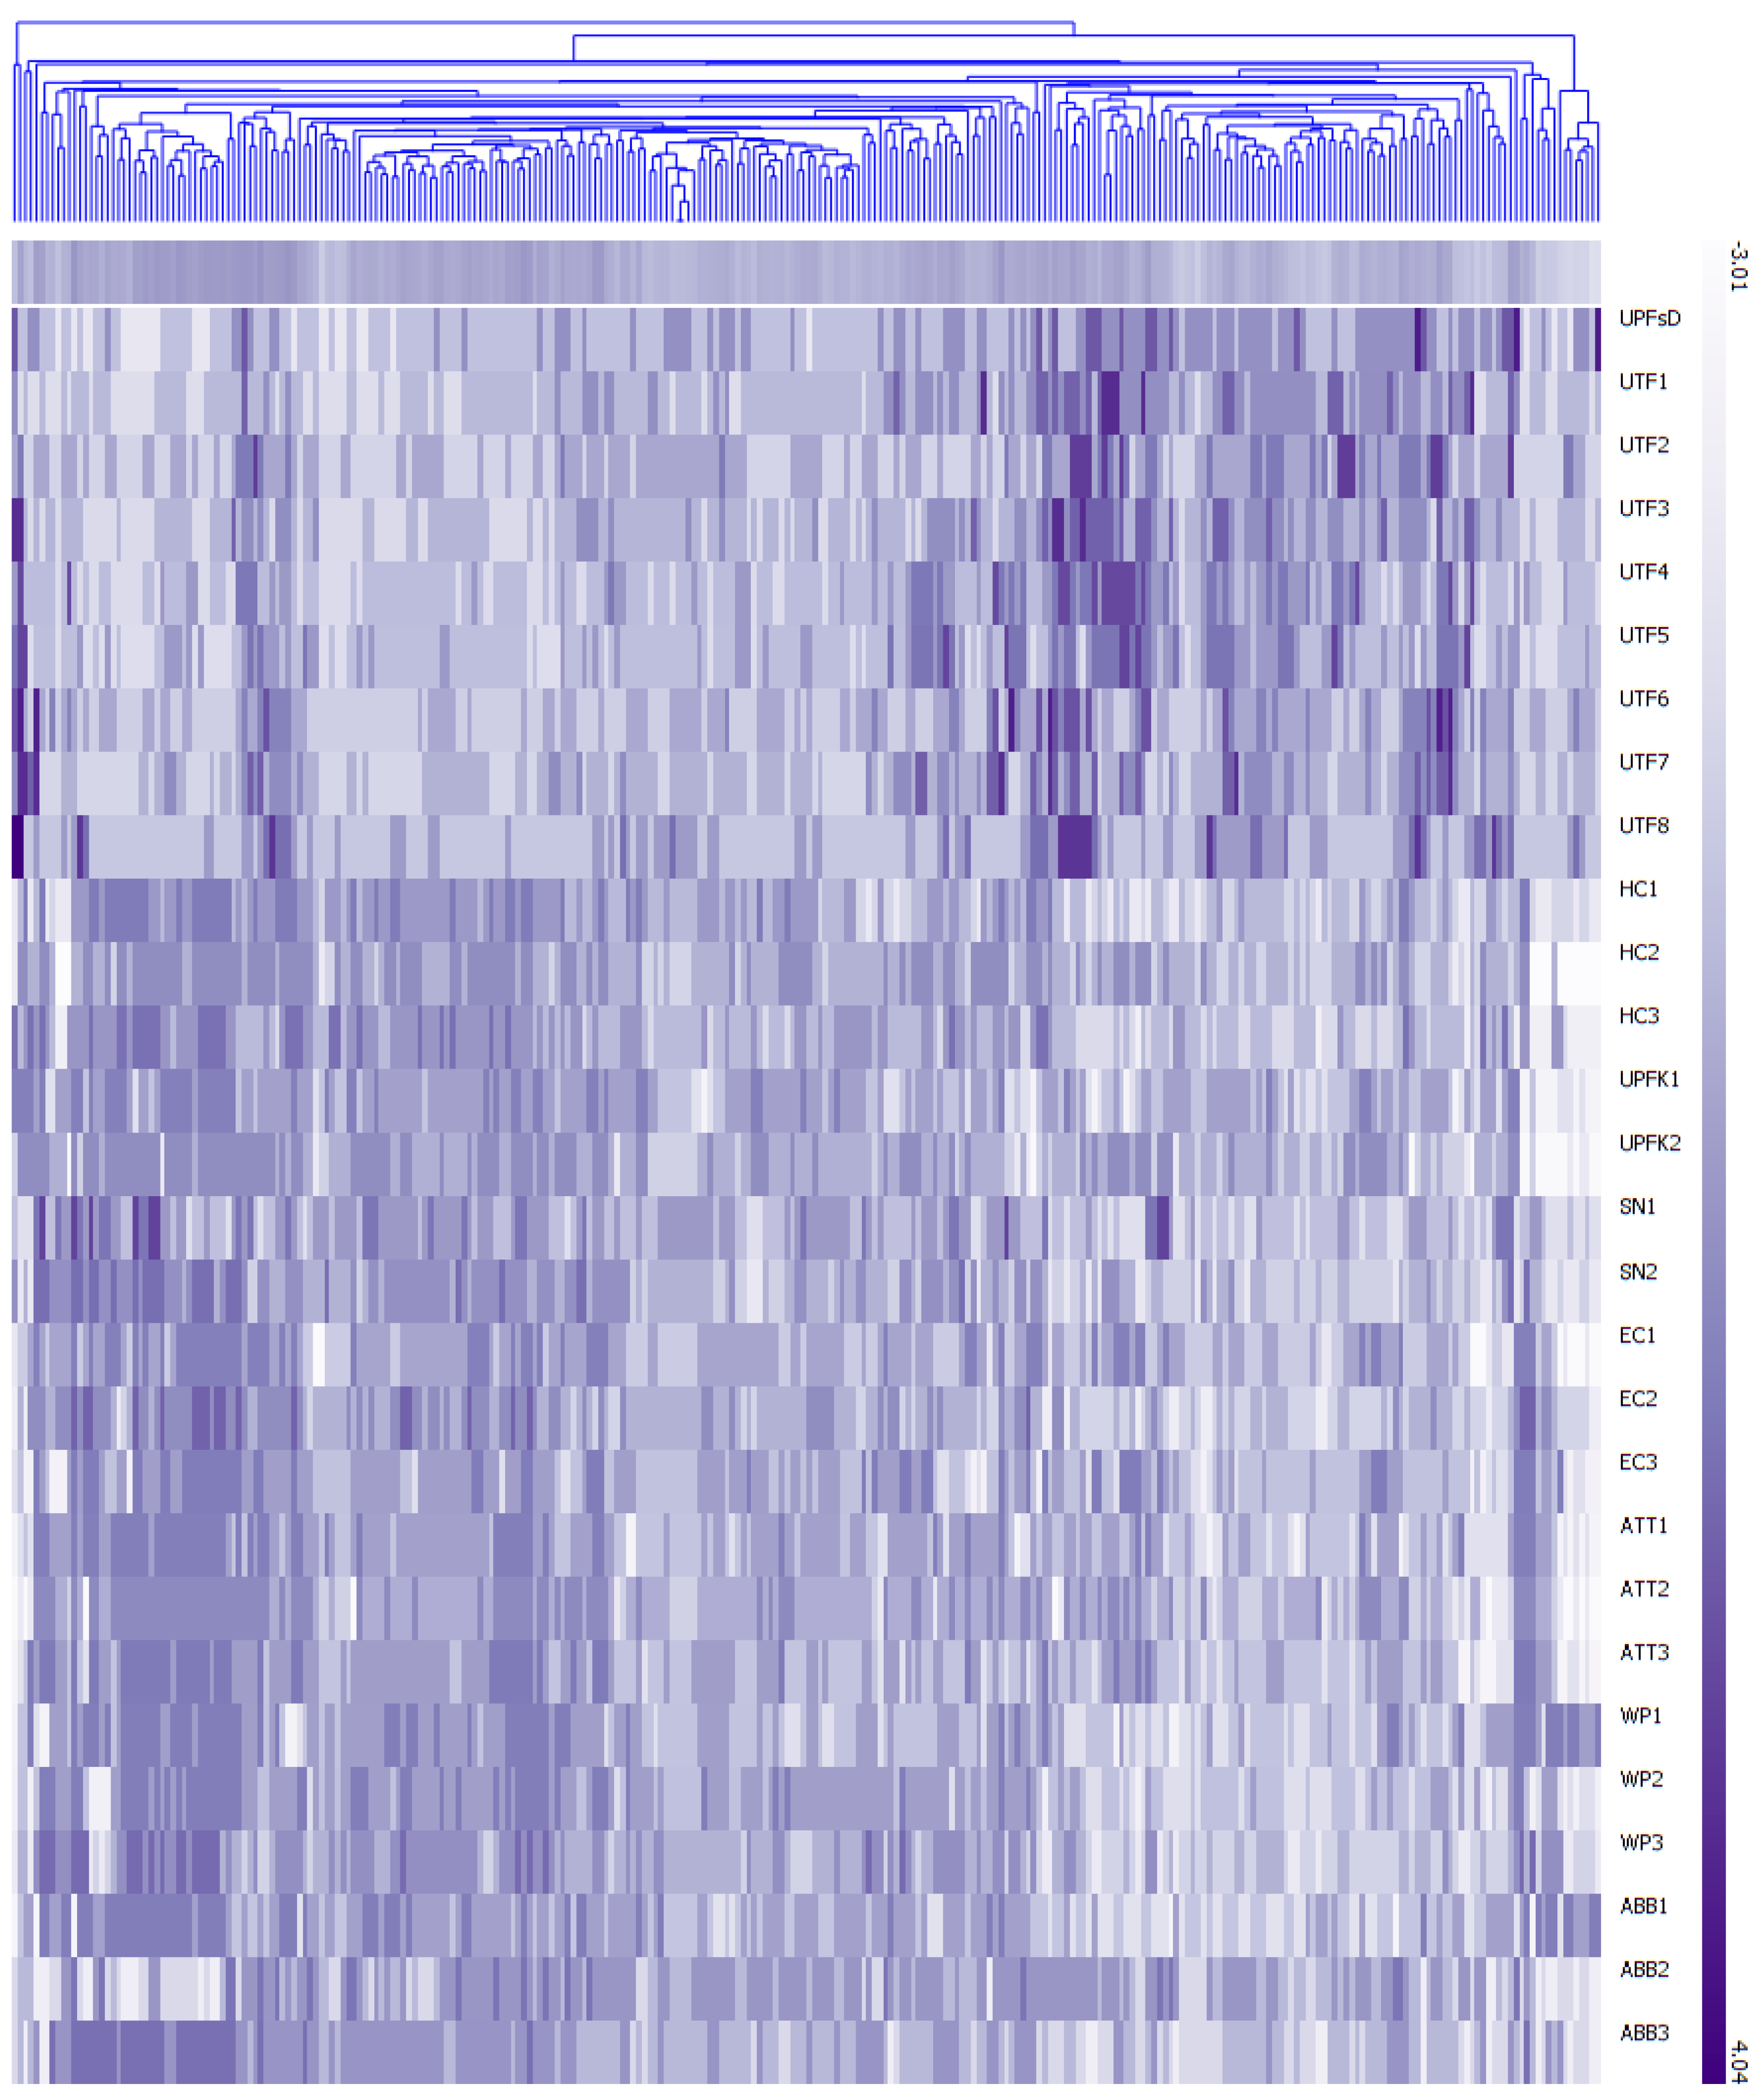
Figure 4.
Hierarchical group heat map, shown by indicators.
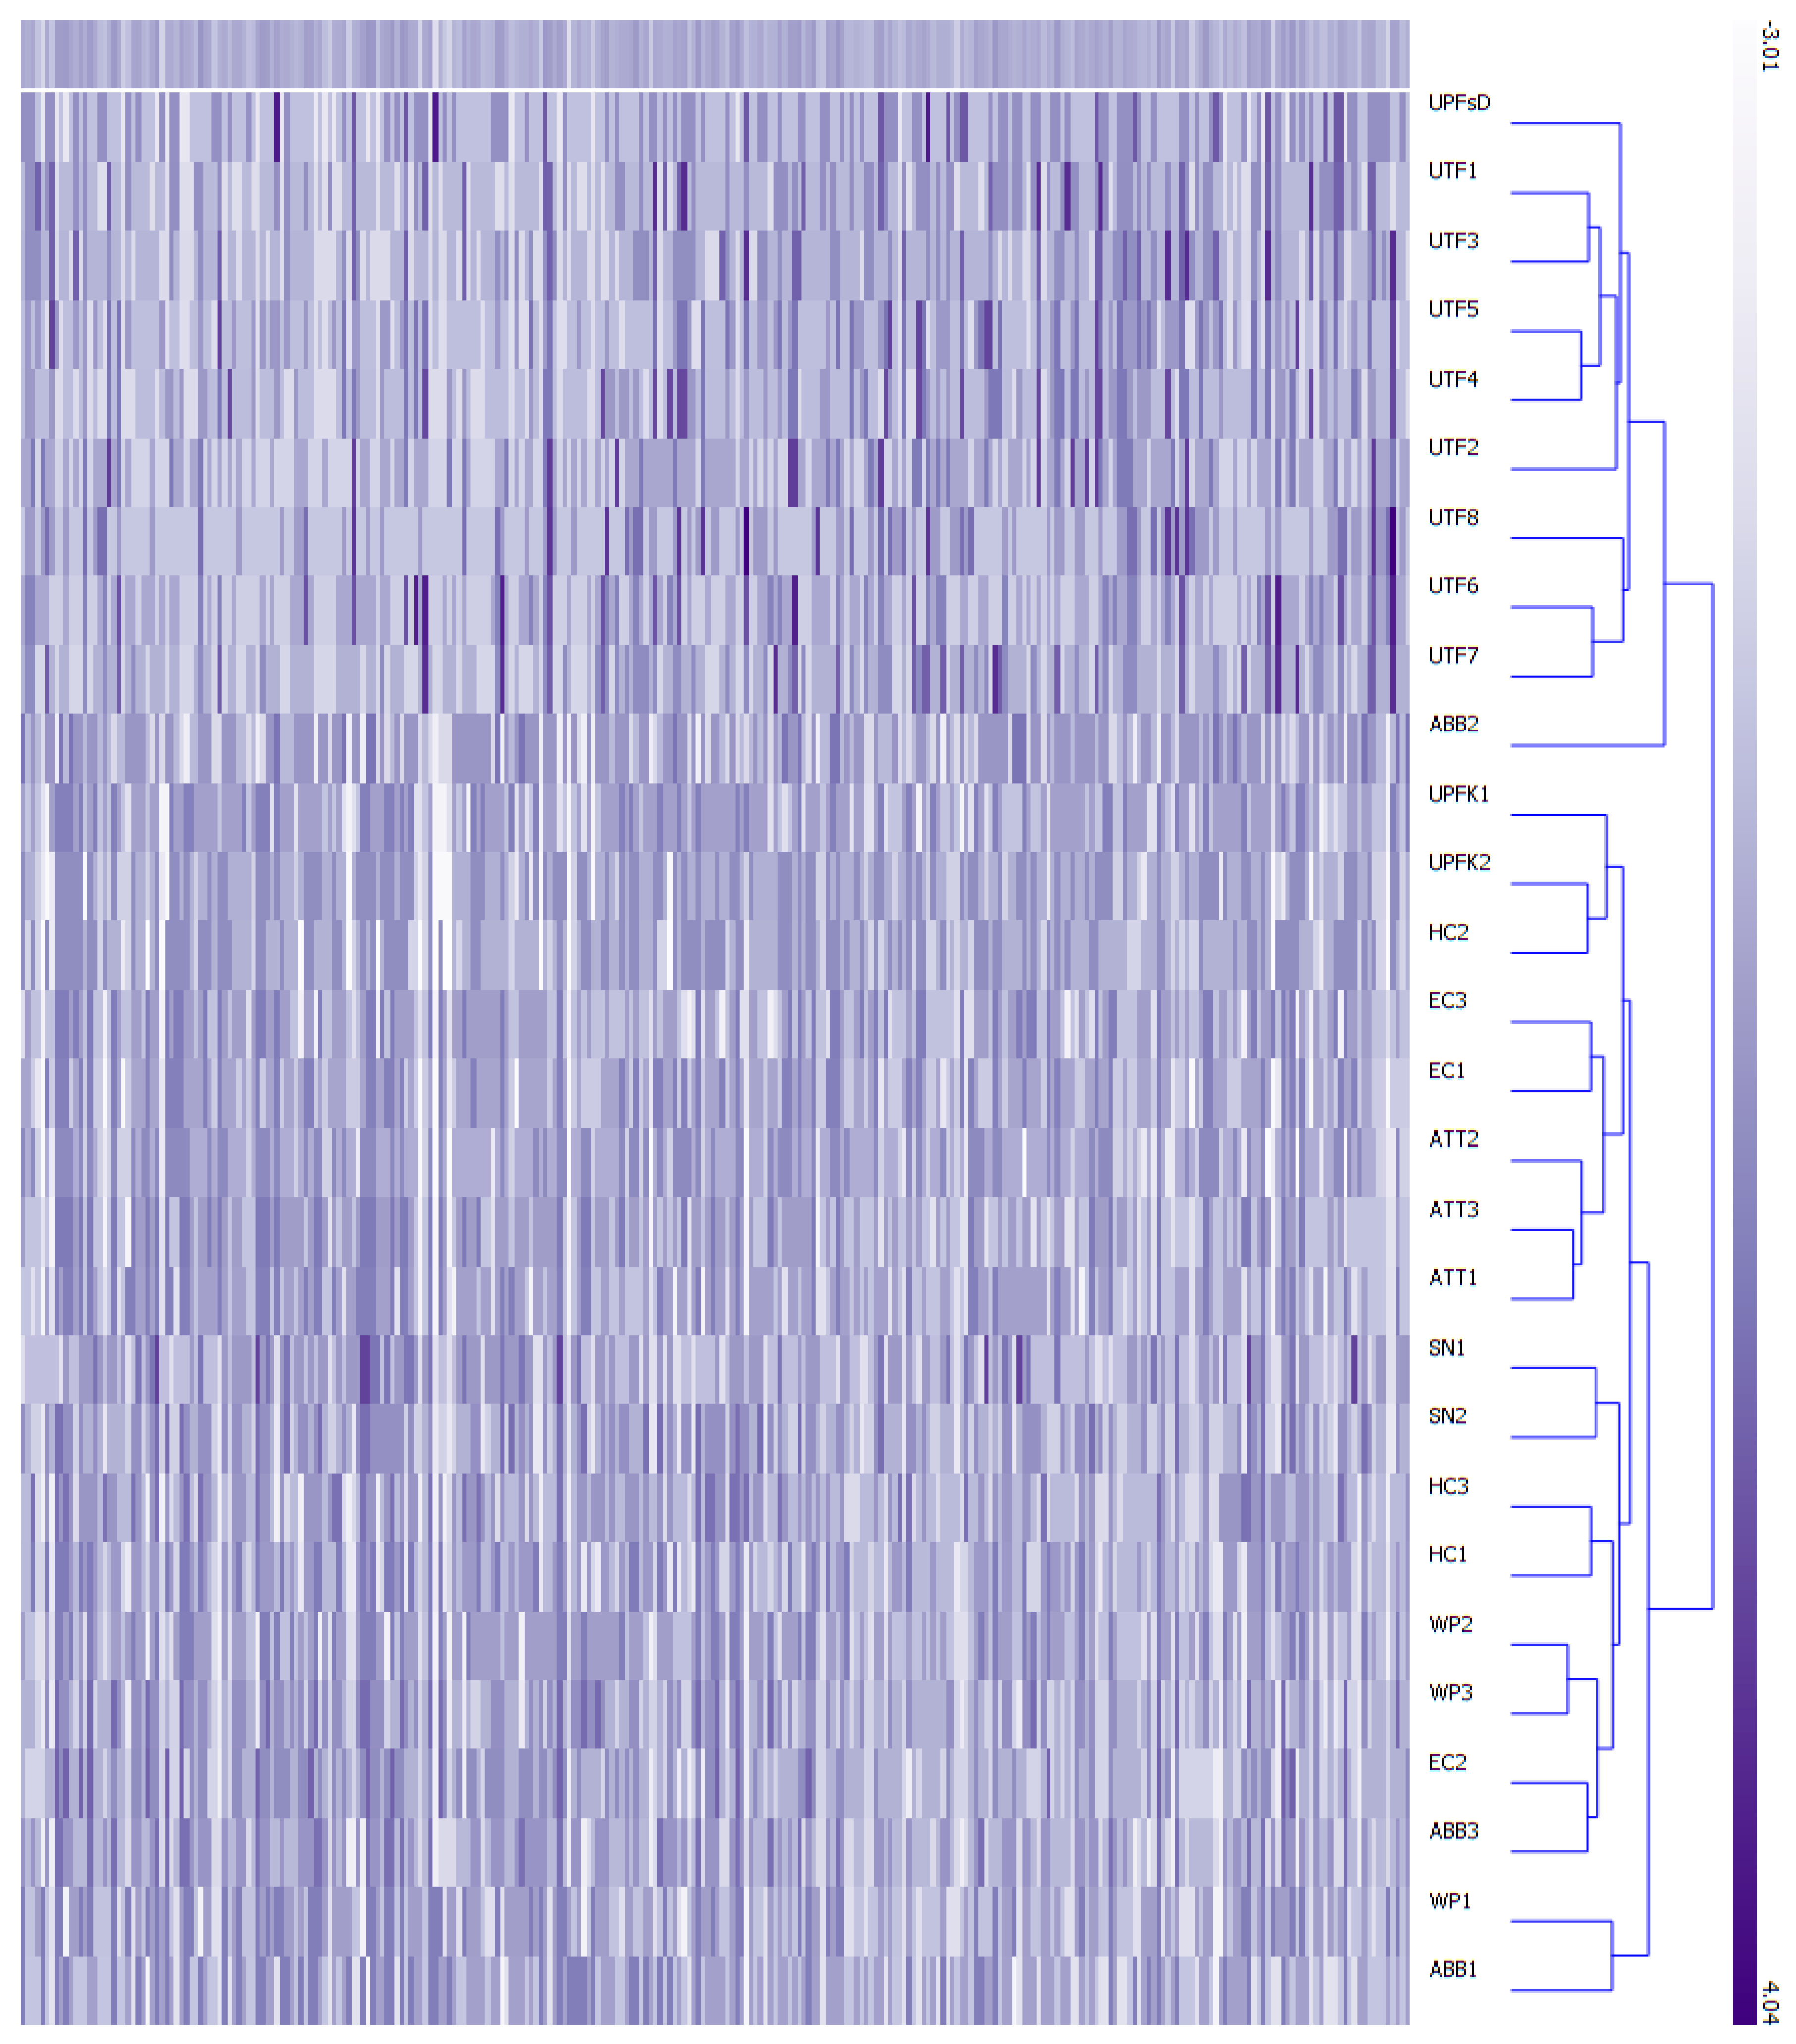
Figure 5.
Consumer clusters created by k-means (k = 2, 3, 4, 5), using 19 input indicators.
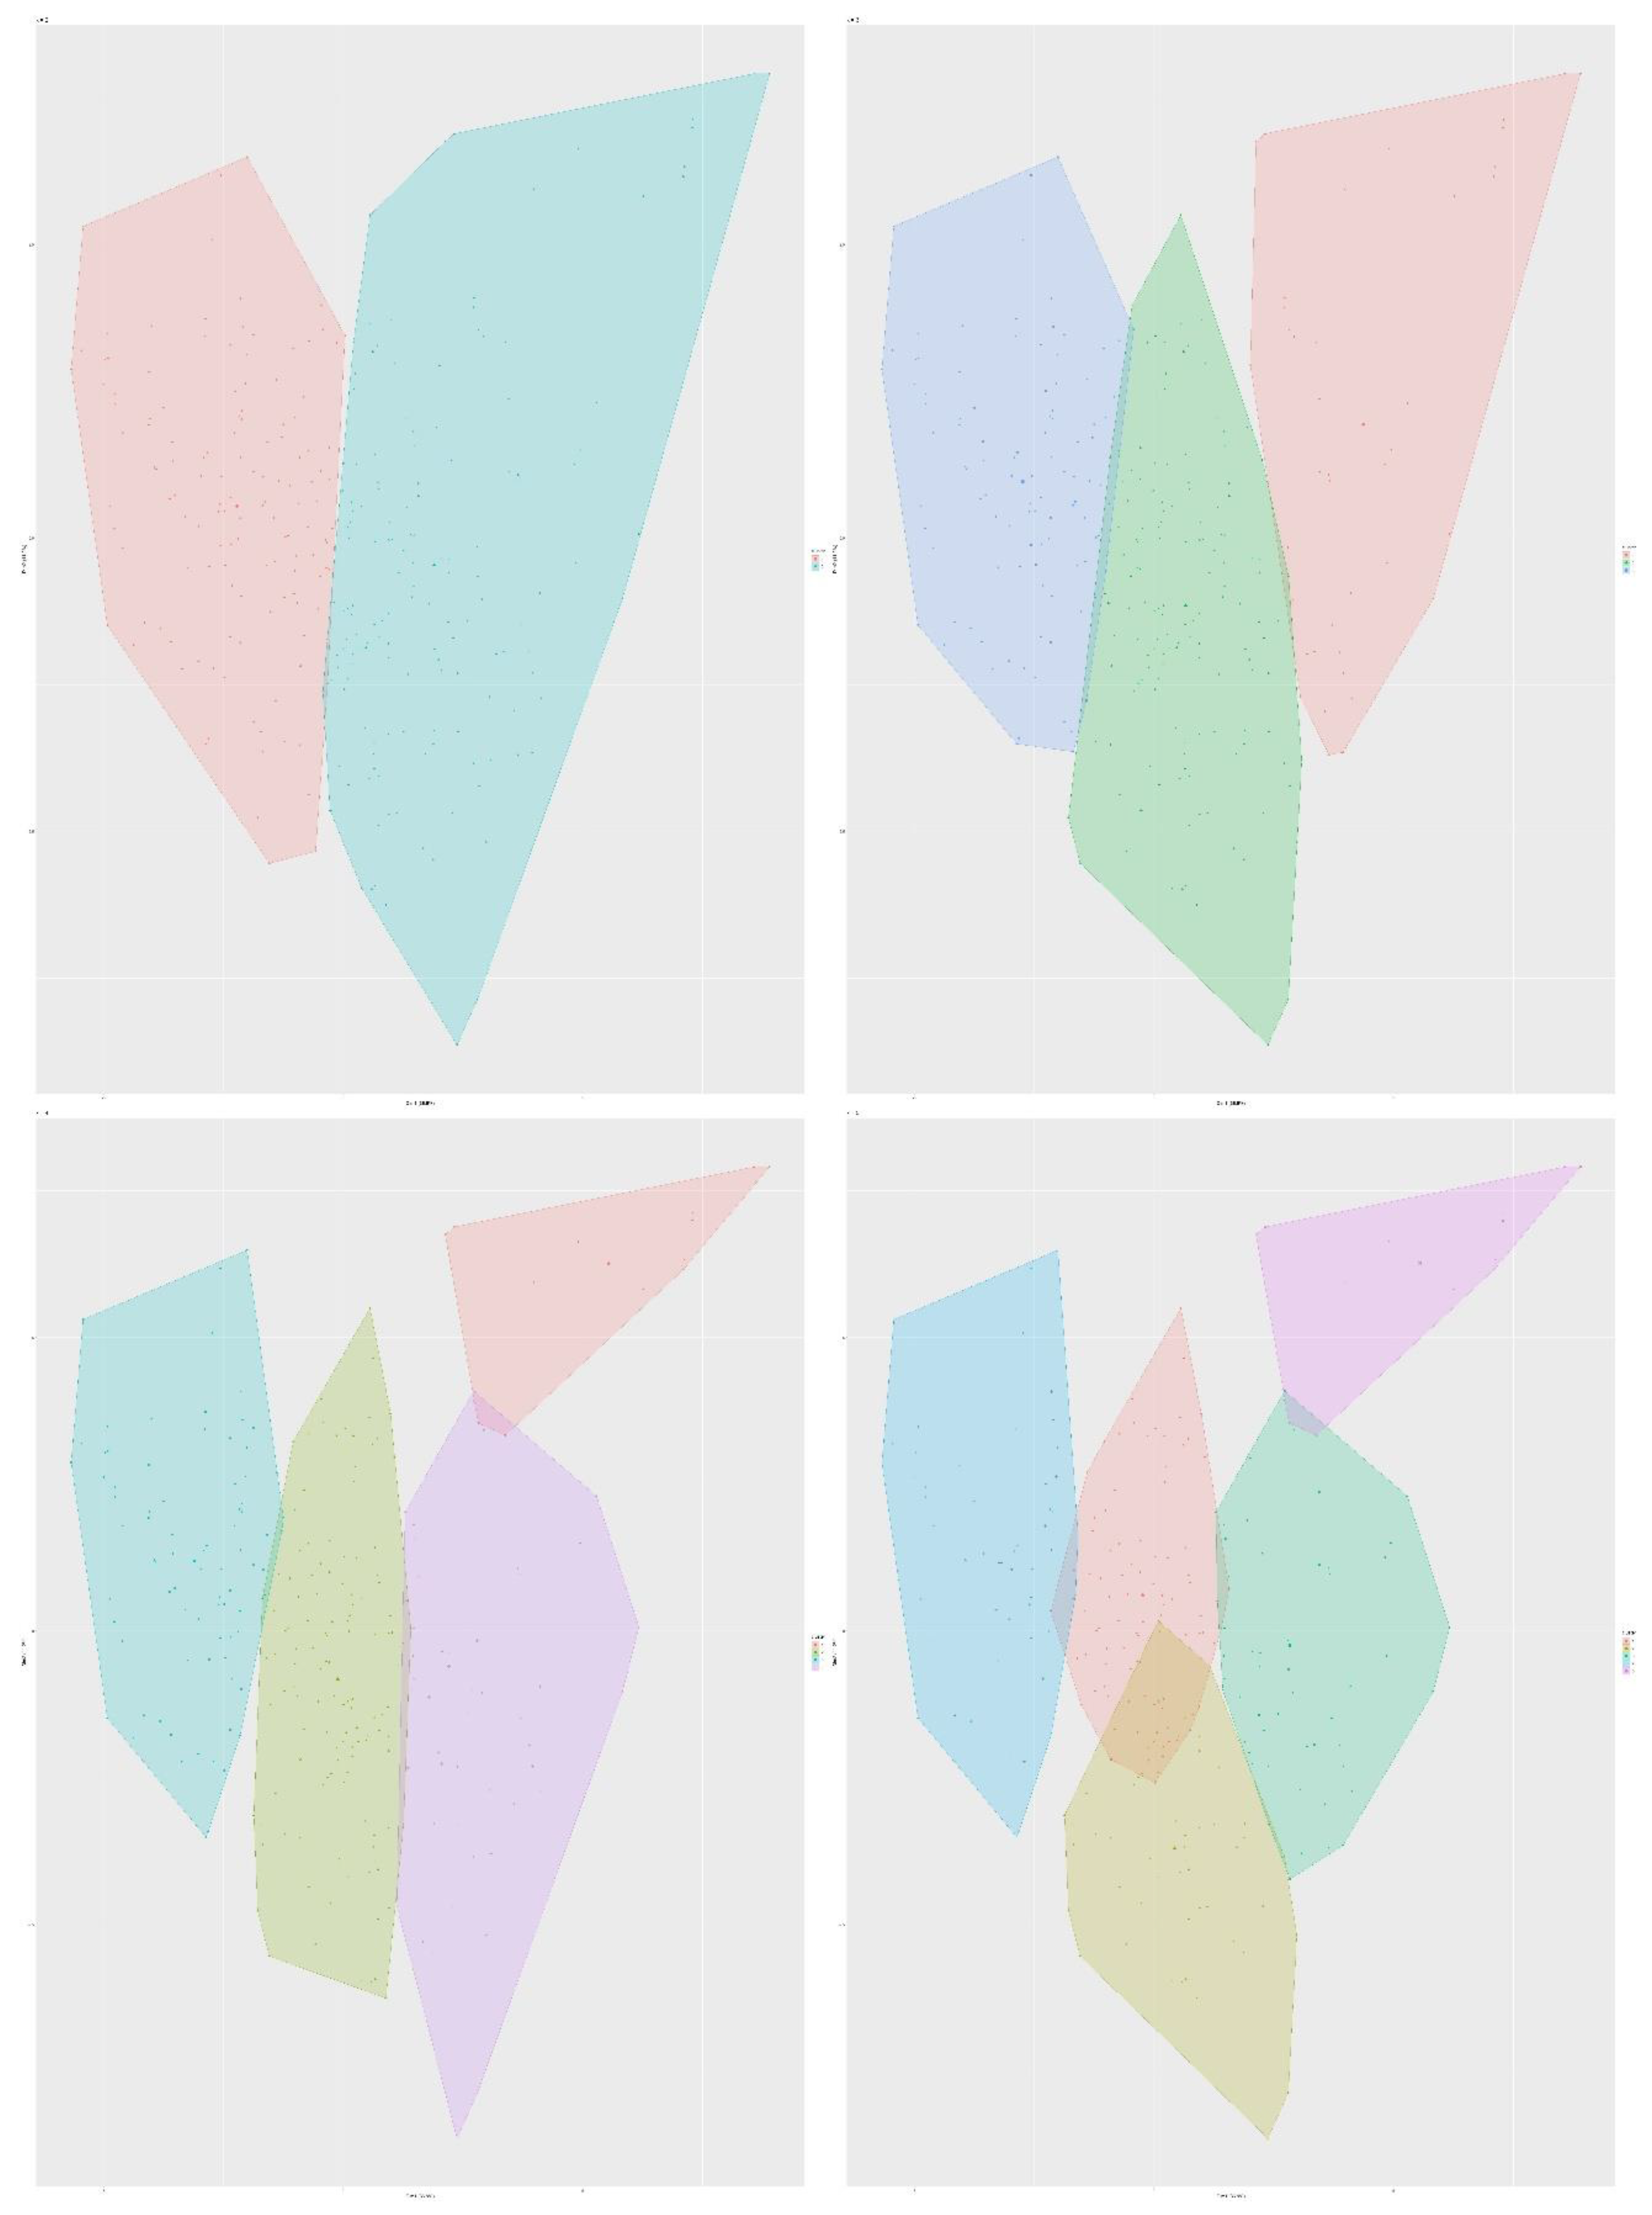
Figure 6.
Measurement model with seven latent variables and 19 indicator variables.
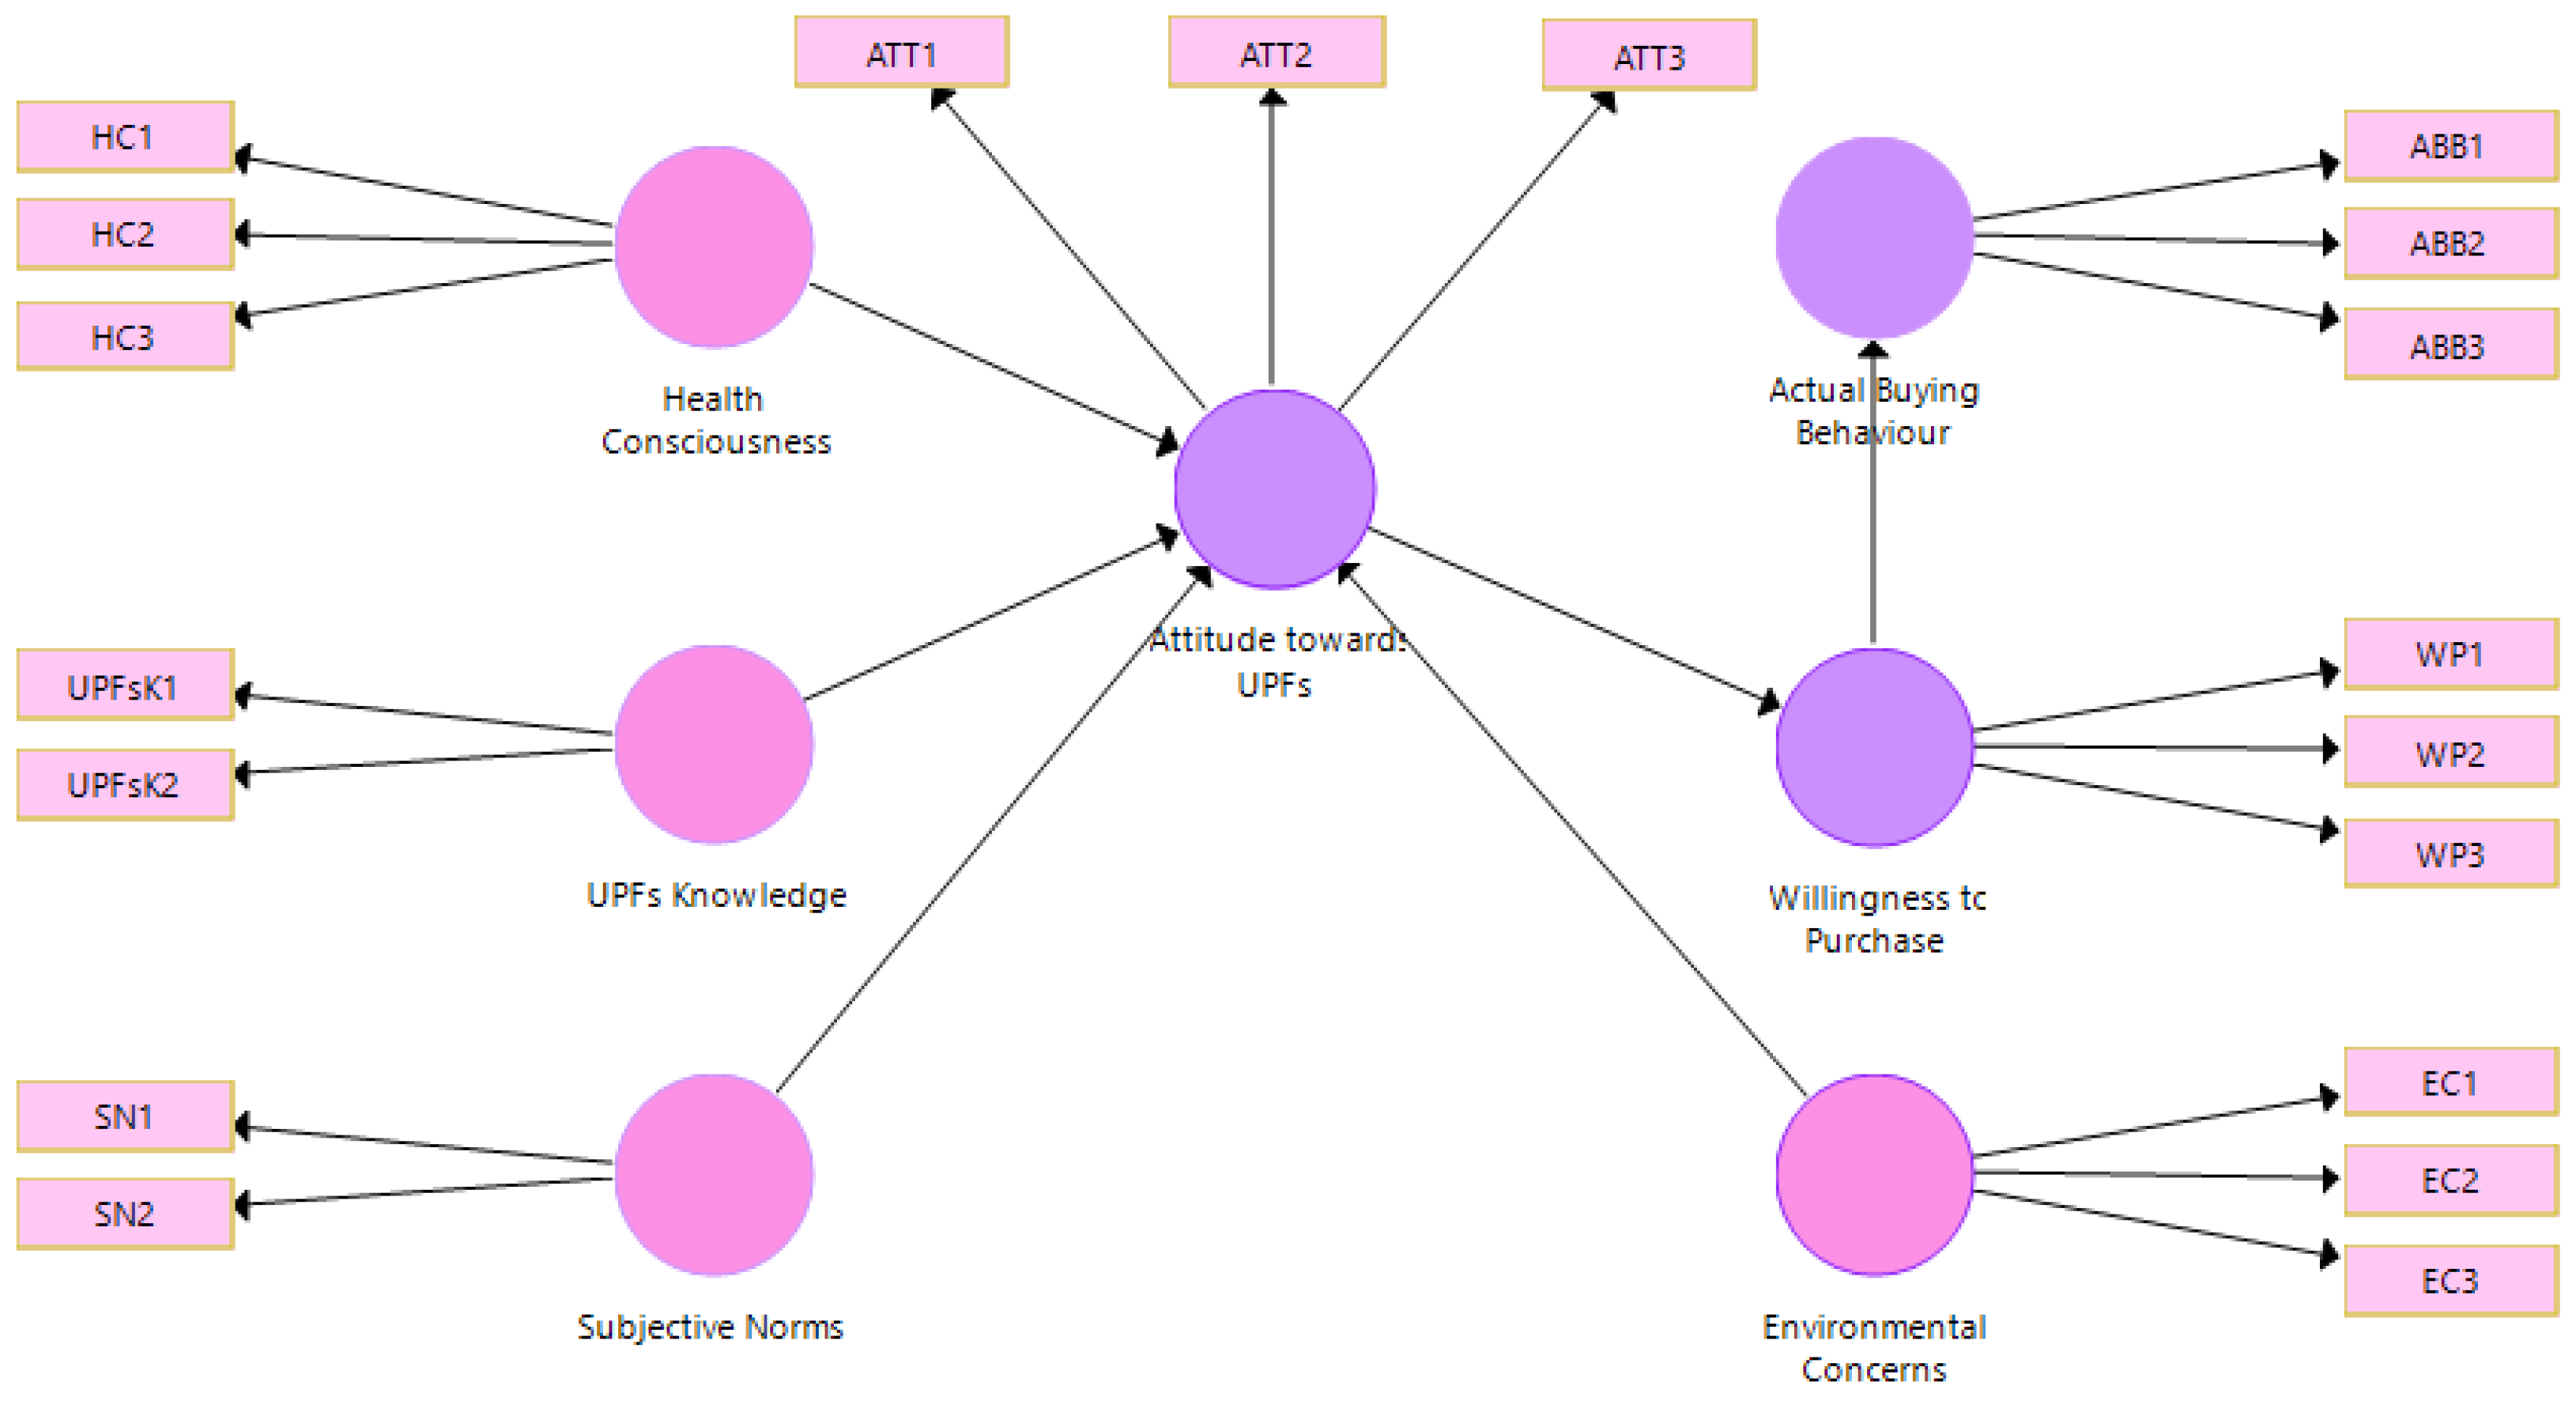
Figure 7.
SEM procedure validity result—path coefficients and coefficients of determination.

Figure 8.
Path coefficients and p-values—inner and outer models.
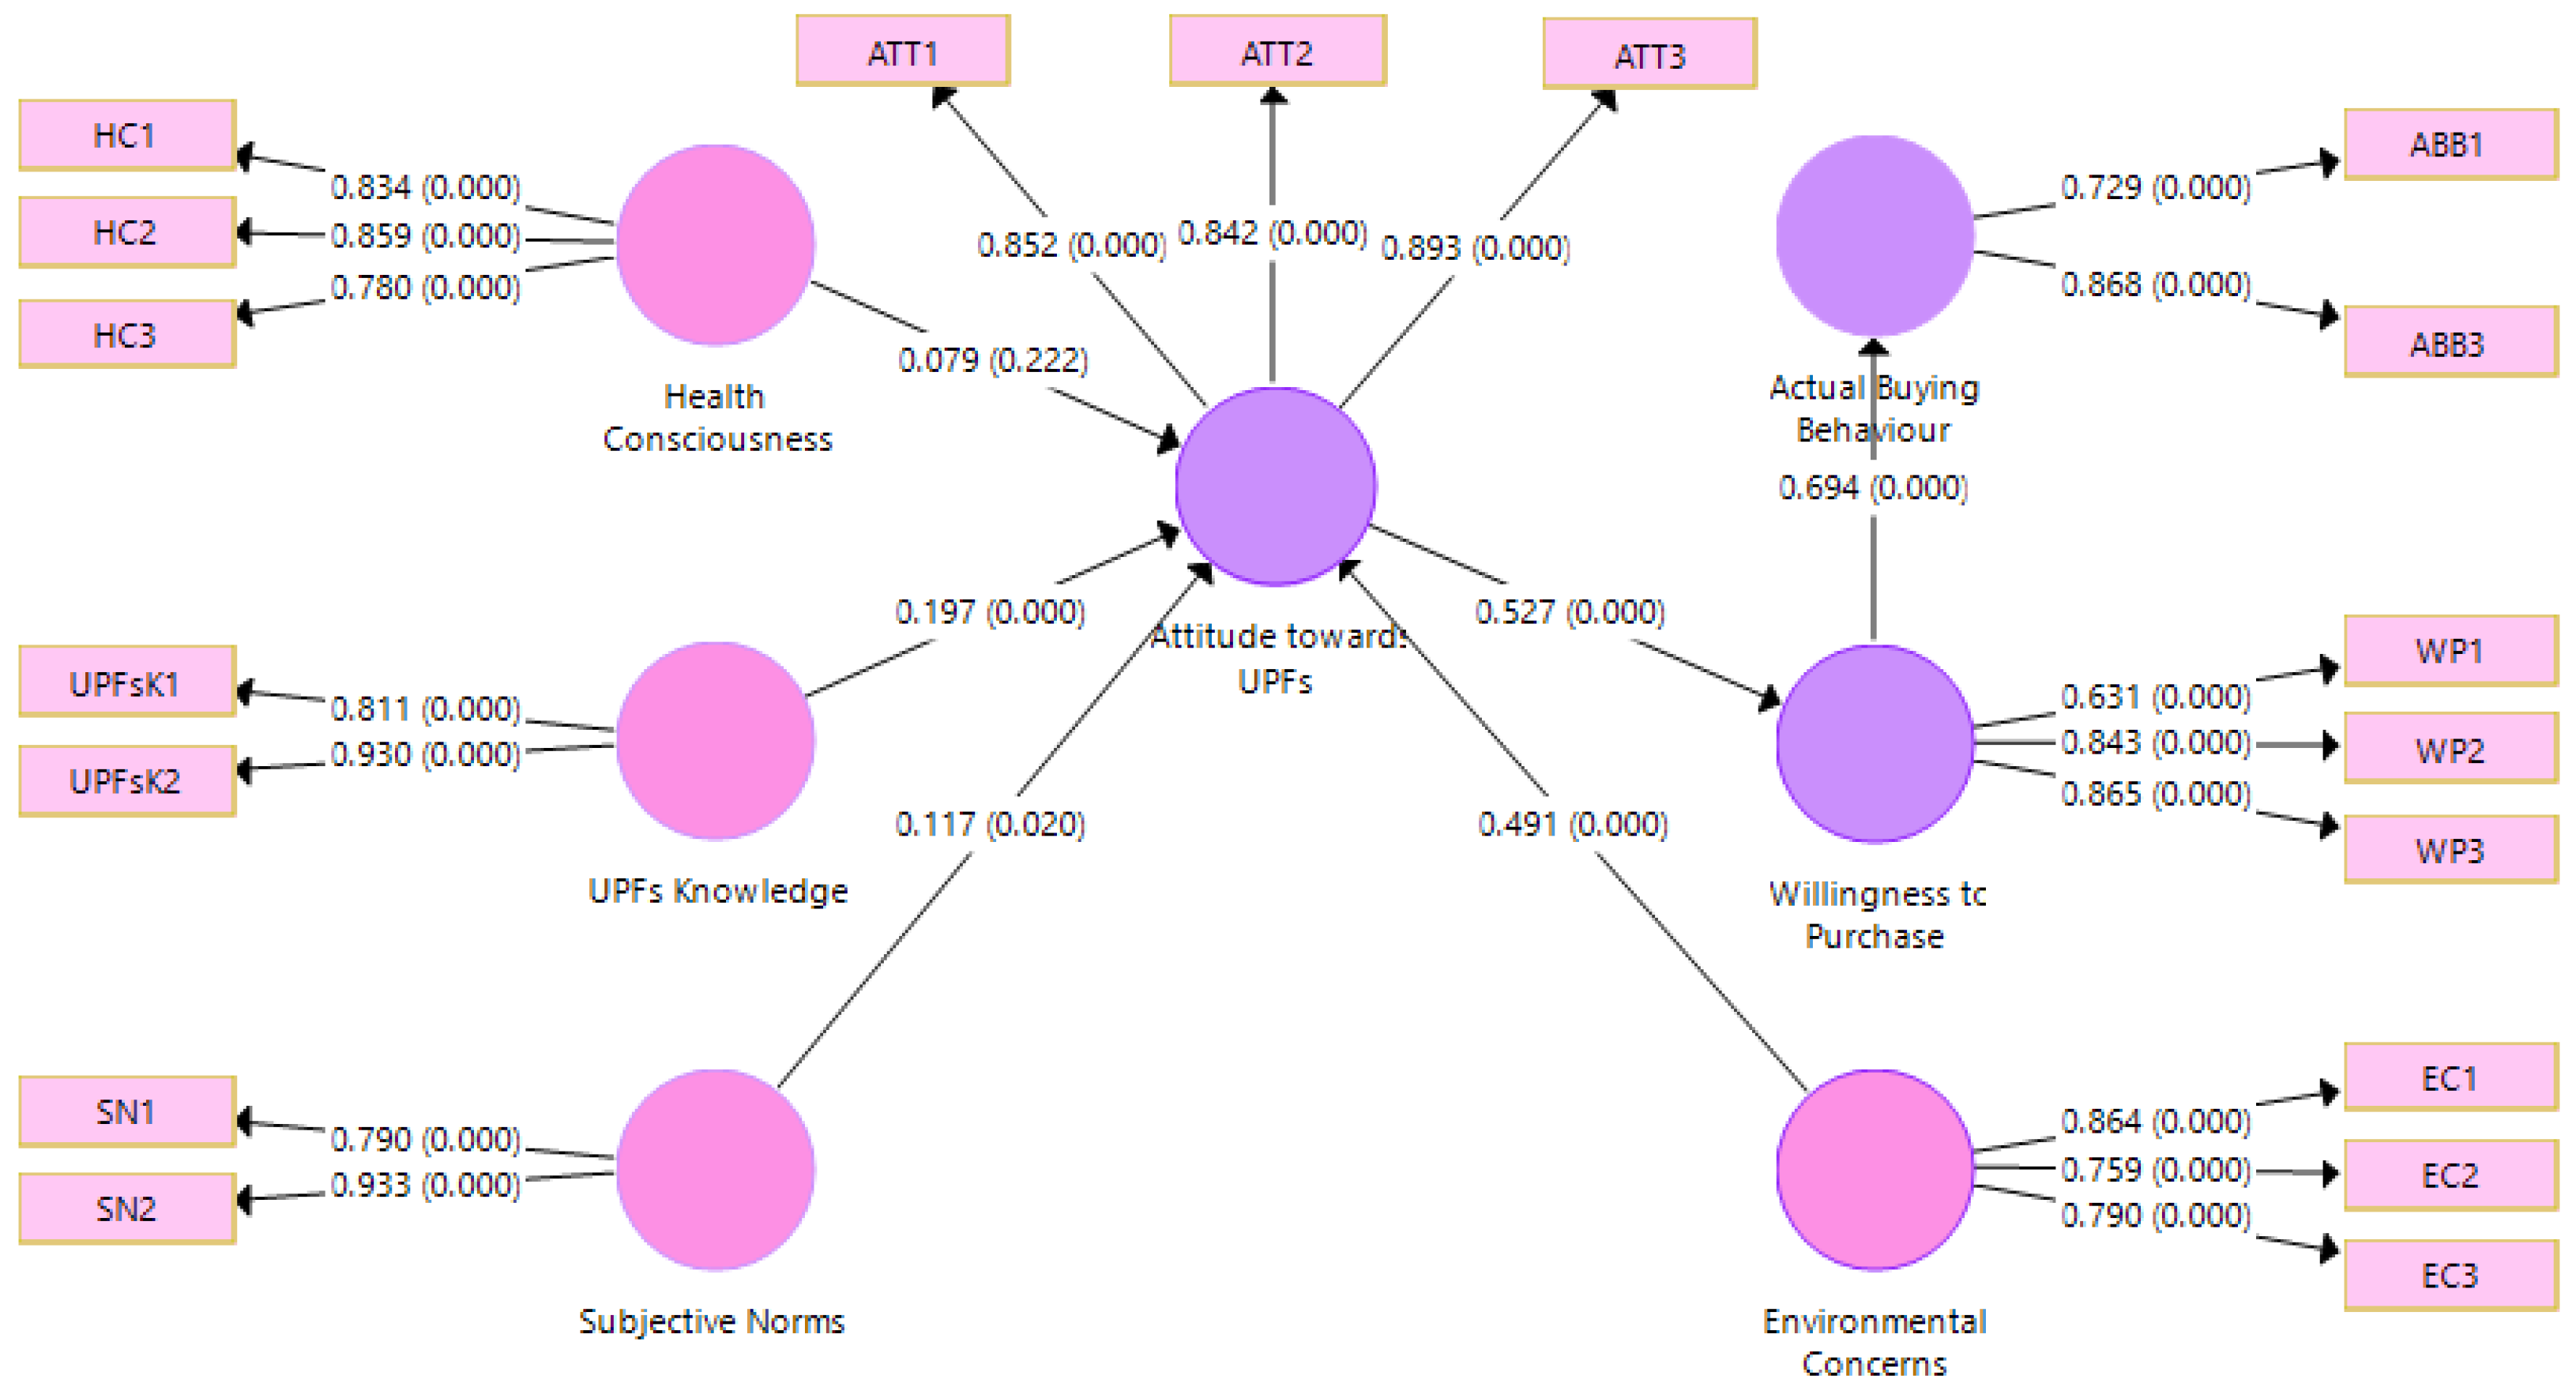

Table 1.
Comparison of models on UPFs perception: consumer attitudes, purchase intentions and actual buying behaviour.
Table 1.
Comparison of models on UPFs perception: consumer attitudes, purchase intentions and actual buying behaviour.
| Reference | Study Design |
Evaluation Factors (Number) |
Statistically Significant Factors (Number) |
Model Quality (s) |
|---|---|---|---|---|
| Contini et al. 2018 [32] | SEM | Value for money, Taste, Naturalness, Healthiness, Cooking skills, Time pressure, Monetary resources, Social influence, Market availability (9) → Intention → Consumption | Naturalness, Cooking skills, Time pressure, Social influence, Market availability (5) | R2: 0.74; 0.63 |
| Yan et al. 2022 [33] | SEM | Convenience, Food quality, Novelty seeking, Subjective norms, Self-identification, Utilitarian value, Hedonic value (7) → Cognitive attitude, Affective attitude (2) → Buying intention (1) | Convenience, Novelty seeking, Subjective norms, Self-identification, Utilitarian value, Hedonic value (6) | R2: 0.85, 0.77; 0.79 |
| Arroyo 2023 [34] | CFA, DTs | Safety and sustainability, Weight control, Convenience, Basic sensory attributes, Traditionalism, Emotional value, Novelty of functional foodSelf-control, Self-assessment of diet quality, Health consciousness (10) | Safety and sustainability, Weight control, Convenience, Basic sensory attributes, Traditionalism, Emotional value, Novelty of functional foodSelf-control, Self-assessment of diet quality, Health consciousness (10) | Accuracy: 0.78, 0.90 |
| Calvo-Porral et al. 2024 [35] | CFA | Quality, Time, Price, Effortless preparation, Convenience, Hedonism, Marketing strategies (7) → Satisfaction → Purchase intention | Quality, Time, Price, Effortless preparation, Convenience, Hedonism, Marketing strategies (7) | RMSEA: 0.05 |
| Norfarah et al. 2024 [36] | SEM | Functional, Emotional, Confidential, Social values (4) → Continuance consumption | Functional, Emotional, Confidential, Social values (4) | R2: 0.50 |
| Raj et al. 2024 [37] | SEM | Extrinsic factors, Intrinsic factors (2) -→ Attitude → Purchase intention | Extrinsic factors, Intrinsic factors – partial effect (2) | RMSEA: 0.05; 0.07 |
| Stamatelou et al. 2024 [38] | Statistical methods | Knowledge and perceptions (1) → Consumption | Knowledge and perceptions (1) | ST: 0.04 |
| Yuan et al. 2024 [39] | RA, SEM | Knowledge, Attitude, Practice (3) | Knowledge, Attitude, Practice (3) | RMSEA: 0.06 |
| Van der Merwe et al. 2024 [40] | SEM | Knowledge, Income (2) → Food and sleep, Exercise and relaxation, Dedicated efforts, Not smoking | Knowledge, Income (2) | RMSEA:0.07 |
| Zheng et al. 2024 [41] | SEM | Functional, Emotional, Confidential values (3) → Attitude, Perceived control → Willingness to buy | Functional, Emotional, Confidential values (3) | RMSEA: 0.06; R2: 0.52; 0.52 |
Note: In the last column, R2 represents the determination coefficient, RMSEA denotes the root mean square error of approximation, and ST indicates the standard error. The symbol “;” separates the coefficient value(s) for “Attitude(s)” from those for “Purchase Intention” and “Consumption”.
Table 2.
Customer profiles in the sample (n = 290).
| Variables of the Sample | No. of Consumers | Percentage (%) | |
|---|---|---|---|
| 1. Gender | Male | 68 | 23.4 |
| Female | 222 | 76.6 | |
| 2. Age | Under 20 | 229 | 41.0 |
| Between 21 and 30 | 67 | 23.1 | |
| Between 31 and 40 | 33 | 11.4 | |
| Between 41 and 50 | 37 | 12.8 | |
| Over 50 | 34 | 11.7 | |
| 3. Place of residence | City | 196 | 67.6 |
| Town | 88 | 30.3 | |
| Village | 6 | 2.1 | |
| 4. Municipality | - | - | |
| 5. Monthly income per household member | Less than BGN 1438 | 137 | 47.2 |
| More than BGN 1438 | 153 | 52.8 | |
| 6. Education | High school | 168 | 57.9 |
| Bachelor | 59 | 20.3 | |
| Master | 58 | 19.7 | |
| PhD | 6 | 2.1 | |
| 7. Share of UPFs in your daily menu | I do not consume (0%) | 26 | 9.0 |
| Less than 25% | 149 | 51.4 | |
| Between 25% and 50% | 97 | 33.4 | |
| Between 50% and 75% | 15 | 5.2 | |
| Over 75% | 3 | 1.0 | |
| 8. How are the UPFs you consume divided by product group (I do not consume (0%), Less than 25%, Between 25% and 50%, Between 50% and 75%, Over 75%) | Snacks | 53, 142, 70, 19, 6 | 18.3, 49.0, 24.1, 6.6, 2.1 |
| Frozen meals | 107, 136, 34, 13, 0 | 36.9, 46.9, 11.7, 4.5, 0.0 | |
| Fast food | 68, 140, 54, 23, 5 | 23.4, 48.3, 18.6, 7.9, 1.7 | |
| Packaged breads and pasta | 52, 136, 54, 32, 16 | 17.9, 46.9, 18.6, 11.0, 5.5 | |
| Processed meat | 46, 135, 61, 39, 9 | 15.9, 46.6, 21.0, 13.4, 3.1 | |
| Sweetened cereals | 125, 113, 32, 14, 6 | 43.1, 39.0, 11.0, 4.8, 2.1 | |
| Sweetened dairy products | 82, 135, 46, 20, 7 | 28.3, 46.6, 15.9, 6.9, 2.4 | |
| Instant soups and pasta | 177, 76, 24, 11, 2 | 61.0, 26.2, 8.3, 3.8, 0.7 | |
Table 3.
Average values by cluster and the absolute differences between clusters, shown by constructs indicators.
Table 3.
Average values by cluster and the absolute differences between clusters, shown by constructs indicators.
| HC1 | HC2 | HC3 | UPFK1 | UPFK2 | SN1 | SN2 | |
|---|---|---|---|---|---|---|---|
| Cluster 1 | 4.119 | 4.552 | 3.858 | 4.045 | 4.455 | 2.828 | 3.858 |
| Cluster 2 | 2.628 | 3.660 | 2.840 | 3.256 | 3.654 | 2.160 | 2.449 |
| Difference | 1.491 | 0.892 | 1.018 | 0.788 | 0.801 | 0.668 | 1.409 |
| EC1 | EC2 | EC3 | ATT1 | ATT2 | ATT3 | WP1 | |
| Cluster 1 | 4.194 | 3.672 | 3.985 | 4.172 | 4.463 | 4.097 | 3.090 |
| Cluster 2 | 3.385 | 2.577 | 3.173 | 3.128 | 3.571 | 3.128 | 2.128 |
| Difference | 0.809 | 1.095 | 0.812 | 1.043 | 0.892 | 0.969 | 0.961 |
| WP2 | WP3 | ABB1 | ABB2 | ABB3 | |||
| Cluster 1 | 4.187 | 3.694 | 3.097 | 3.381 | 3.970 | ||
| Cluster 2 | 2.994 | 2.596 | 2.212 | 3.237 | 2.667 | ||
| Difference | 1.193 | 1.098 | 0.885 | 0.143 | 1.303 |
Table 4.
Factor loadings for indicators.
| Indicator Variable |
Factor Loading | Indicator Variable |
Factor Loading | Indicator Variable |
Factor Loading |
|---|---|---|---|---|---|
| HC1 | 0.834 | SN2 | 0.933 | ATT3 | 0.893 |
| HC2 | 0.859 | EC1 | 0.864 | WP1 | 0.631 |
| HC3 | 0.780 | EC2 | 0.759 | WP2 | 0.843 |
| UPFK1 | 0.811 | EC3 | 0.790 | WP3 | 0.865 |
| UPFK2 | 0.930 | ATT1 | 0.852 | ABB1 | 0.729 |
| SN1 | 0.790 | ATT2 | 0.842 | ABB2 | 0.868 |
Table 5.
Construct reliability (DG rho and CR), convergent validity (AVE) and multicollinearity (VIF).
Table 5.
Construct reliability (DG rho and CR), convergent validity (AVE) and multicollinearity (VIF).
| Factor | DG rho | CR | AVE | VIF |
|---|---|---|---|---|
| Health consciences | 0.799 * | 0.864 * | 0.680 * | 1.781 * |
| Knowledge about UPFs | 0.804 * | 0.864 * | 0.761 * | 1.484 * |
| Subjective norms | 0.817 * | 0.855 * | 0.747 * | 1.356 * |
| Environmental concerns | 0.751 * | 0.847 * | 0.649 * | 1.484 * |
| Attitude towards UPFs | 0.831 * | 0.897 * | 0.744 * | 1.000 * |
| Willingness to purchase | 0.697 | 0.827 * | 0.619 * | 1.000 * |
| Actual buying behaviour | 0.482 | 0.781 * | 0.647 * |
Symbol “*” means: DG rho—Dillon–Goldstein’s rho > 0.7; CR—composite reliability > 0.6; AVE—average variance extracted > 0.5; VIF—variance inflation factors < 5.
Table 6.
Discriminant validity—Fornell and Larker criterion.
| Factor | Actual Buying Behaviour | Attitude Towards UPFs | Environmental Concerns | Health Consciousness | Subjective Norms | Knowledge About UPFs | willingness to Purchase |
|---|---|---|---|---|---|---|---|
| Actual buying behaviour | 0.802 | ||||||
| Attitude towards UPFs | 0.477 | 0.863 | |||||
| Environmental concerns |
0.473 | 0.662 | 0.806 | ||||
| Health consciousness |
0.511 | 0.490 | 0.509 | 0.825 | |||
| Subjective norms |
0.537 | 0.427 | 0.429 | 0.456 | 0.864 | ||
| Knowledge about UPFs | 0.294 | 0.479 | 0.409 | 0.549 | 0.323 | 0.872 | |
| Willingness to purchase | 0.694 | 0.527 | 0.506 | 0.476 | 0.452 | 0.278 | 0.787 |
Note: Italics represent the square root of AVE.
Table 7.
Discriminant validity—cross-loadings.
| Indicator Variable |
Actual Buying Behaviour |
Attitude Towards UPFs | Environmental Concerns | Health Consciousness | Subjective Norms | Knowledge About UPFs | Willingness to Purchase |
|---|---|---|---|---|---|---|---|
| ABB1 | 0.729 | 0.218 | 0.167 | 0.264 | 0.329 | 0.055 | 0.461 |
| ABB3 | 0.868 | 0.509 | 0.54 | 0.522 | 0.512 | 0.372 | 0.635 |
| ATT1 | 0.439 | 0.852 | 0.555 | 0.39 | 0.413 | 0.390 | 0.488 |
| ATT2 | 0.344 | 0.842 | 0.543 | 0.444 | 0.313 | 0.425 | 0.377 |
| ATT3 | 0.447 | 0.893 | 0.613 | 0.437 | 0.377 | 0.425 | 0.494 |
| EC1 | 0.311 | 0.624 | 0.864 | 0.453 | 0.305 | 0.476 | 0.327 |
| EC2 | 0.555 | 0.490 | 0.759 | 0.394 | 0.492 | 0.194 | 0.600 |
| EC3 | 0.298 | 0.468 | 0.790 | 0.377 | 0.254 | 0.283 | 0.321 |
| HC1 | 0.523 | 0.403 | 0.463 | 0.834 | 0.435 | 0.403 | 0.508 |
| HC2 | 0.285 | 0.477 | 0.449 | 0.859 | 0.261 | 0.555 | 0.286 |
| HC3 | 0.513 | 0.301 | 0.327 | 0.780 | 0.491 | 0.369 | 0.416 |
| SN1 | 0.323 | 0.260 | 0.276 | 0.290 | 0.790 | 0.198 | 0.290 |
| SN2 | 0.561 | 0.444 | 0.438 | 0.467 | 0.933 | 0.335 | 0.461 |
| UPFK1 | 0.294 | 0.311 | 0.293 | 0.469 | 0.297 | 0.811 | 0.252 |
| UPFK2 | 0.239 | 0.494 | 0.405 | 0.496 | 0.279 | 0.93 | 0.243 |
| WP1 | 0.580 | 0.247 | 0.281 | 0.237 | 0.231 | 0.062 | 0.631 |
| WP2 | 0.514 | 0.516 | 0.473 | 0.489 | 0.387 | 0.350 | 0.843 |
| WP3 | 0.552 | 0.457 | 0.424 | 0.378 | 0.432 | 0.221 | 0.865 |
| ABB1 | 0.729 | 0.218 | 0.167 | 0.264 | 0.329 | 0.055 | 0.461 |
| ABB3 | 0.868 | 0.509 | 0.540 | 0.522 | 0.512 | 0.372 | 0.635 |
| ATT1 | 0.439 | 0.852 | 0.555 | 0.390 | 0.413 | 0.390 | 0.488 |
| ATT2 | 0.344 | 0.842 | 0.543 | 0.444 | 0.313 | 0.425 | 0.377 |
Table 8.
Discriminant validity—HTMT.
| Factor | Actual Buying Behaviour | Attitude Towards UPFs | Environmental Concerns | Health Consciousness | Subjective Norms | Knowledge About UPFs | Willingness to Purchase |
|---|---|---|---|---|---|---|---|
| Actual buying behaviour | |||||||
| Attitude towards UPFs | 0.735 | ||||||
| Environmental concerns |
0.778 | 0.840 | |||||
| Health consciousness |
0.865 | 0.597 | 0.663 | ||||
| Subjective norms |
0.889 | 0.537 | 0.59 | 0.631 | |||
| Knowledge about UPFs | 0.488 | 0.603 | 0.536 | 0.734 | 0.449 | ||
| Willingness to purchase | 1.243 | 0.692 | 0.728 | 0.668 | 0.628 | 0.397 |
Table 9.
The path coefficients of the relationship between latent variables. → A.
| Hypothesis | β | Sample Mean | SD | t Statistics | p-Values | R2 | Q2 |
|---|---|---|---|---|---|---|---|
| Attitude towards UPFs → Willingness to purchase | 0.527 | 0.527 | 0.051 | 10.385 | 0 | 0.278 | 0.169 |
| Environmental concerns → Attitude towards UPFs | 0.491 | 0.485 | 0.063 | 7.786 | 0 | 0.508 | 0.365 |
| Health consciousness → Attitude towards UPFs | 0.079 | 0.083 | 0.063 | 1.259 | 0.209 | ||
| Subjective norms → Attitude towards UPFs | 0.117 | 0.115 | 0.051 | 2.312 | 0.021 | ||
| Knowledge → Attitude towards UPFs | 0.197 | 0.205 | 0.056 | 3.505 | 0 | ||
| Willingness to purchase → Actual buying behaviour | 0.694 | 0.696 | 0.039 | 17.833 | 0 | 0.482 | 0.300 |
Table 10.
Results of using ML algorithms to predict user attitudes towards UPFs.
| ML Method | MSE | RMSE | MAE | R2 |
|---|---|---|---|---|
| Decision Tree | 0.058 | 0.240 | 0.108 | 0.926 |
| SVM | 0.143 | 0.378 | 0.239 | 0.816 |
| Random Forest | 0.027 | 0.164 | 0.091 | 0.965 |
| Linear Regression | 0.001 | 0.025 | 0.020 | 0.999 |
| AdaBoost | 0.028 | 0.167 | 0.064 | 0.964 |
Disclaimer/Publisher’s Note: The statements, opinions and data contained in all publications are solely those of the individual author(s) and contributor(s) and not of MDPI and/or the editor(s). MDPI and/or the editor(s) disclaim responsibility for any injury to people or property resulting from any ideas, methods, instructions or products referred to in the content. |
© 2025 by the authors. Licensee MDPI, Basel, Switzerland. This article is an open access article distributed under the terms and conditions of the Creative Commons Attribution (CC BY) license (http://creativecommons.org/licenses/by/4.0/).
Copyright: This open access article is published under a Creative Commons CC BY 4.0 license, which permit the free download, distribution, and reuse, provided that the author and preprint are cited in any reuse.


