
Submitted:
24 June 2024
Posted:
25 June 2024
You are already at the latest version
Abstract
Hybrid methods are a suitable option to extract dietary patterns associated with health outcomes. This study aimed to identify dietary patterns of Brazilian adults (20-59 years old; n=28,153) related to dietary components associated with the risk of obesity. Data from the 2017-2018 Brazilian National Dietary Survey were analyzed. Food consumption was obtained through 24-hour recall. Dietary patterns were extracted using partial least squares regression. The selected response variables were energy density (ED), percentage of total fat (%TF), and fiber density (FD). In addition, 32 food groups were established as predictor variables. The first dietary pattern, named as energy-dense and low-fiber (ED-LF), included with positive factor loadings: solid fats, breads, added-sugar beverages, fast foods, sauces, pasta, and cheeses, and with negative factor loadings: rice, beans, vegetables, water, and fruits. Higher adherence to the ED-LF dietary pattern was observed for individuals >40 years old, from urban areas, in the highest income level, who were not on a diet, reporting away-from-home food consumption, and having ≥1 snack/day. Eating patterns with similar characteristics are often associated with an increased risk of obesity. The results are consistent with recommendations to increase the consumption of fresh foods and to reduce ultra-processed products.
Keywords:
Obesity
; Nutrition Surveys
; Diet
; Feeding behavior
; Adult
1. Introduction
Obesity is recognized as a global epidemic and is a public health concern due to its association with an increased risk of non-communicable diseases [1,2]. In Brazil, the prevalence of obesity among adults increased by 8.5 percentage points between 2006 and 2019 [3], when 26.8% of adults were classified as having obesity [4]. Moreover, in 2023, in Brazilian state capitals, among the adults, the prevalence of overweight was 61.4% and obesity, 24.3% [5]. According to Estivaleti et al. [3], the trend towards an increase in the prevalence of obesity tends to continue and the projections indicate that, by 2030, 30% of the Brazilian adult population will be affected by obesity.
Unhealthy diet is a major risk factor associated with obesity, and dietary pattern analysis is considered an appropriate analytical strategy to ascertain the association between diet and health outcomes [6]. This approach takes into account the complexity of diet, rather than solely focusing on specific foods or nutrients [6,7,8]. Among the methods available to identifying dietary patterns, hybrid methods that combine hypothesis-oriented approaches and statistics procedures allow to extract dietary patterns that may predict the outcome of interest [9]. One of those methods is the partial least squares (PLS) regression, which maximizes the explanation of the variability of food and nutrient intake or biomarkers associated with the outcome [9]. Dietary pattern analysis has been applied in national [10] and international [11,12] studies that investigated the association between dietary patterns with obesity.
In Brazil, a cross-sectional study carried out with adult residents in a low-income urban area found that a Western eating pattern, composed of fast foods, added-sugar beverages, and sweets, was directly associated with the body mass index (BMI) and waist circumference among women. These associations remained after adjustment by age, education, smoking, physical activity, and energy intake. Moreover, a traditional pattern, based mainly on rice and beans, exhibited an inverse association [10]. In a cohort study with young Brazilian adults (23-25 years old), the Bar eating pattern, composed of alcoholic beverages, processed meats, and snacks, was associated with a greater prevalence of excess weight and abdominal obesity for both sexes [13]. Muniz et al. [14] analyzed data from the same cohort and found that unhealthy eating patterns, characterized by fast foods, processed meats, sauces, and alcoholic and added-sugar beverages, were associated with a higher risk of obesity and excess body fat percentage, independent of sex, skin color, family income, schooling, smoking, physical activity and reporting quality.
The identification of dietary patterns, especially when based on hypothesis-driven methods may provide important information to support health promotion actions. Therefore, this study aims to identify dietary patterns related to dietary components that are potentially associated with excessive weight gain.
2. Materials and Methods
Ethical Statement
In the 2017-2018 Brazilian National Dietary Survey (NDS), the study was deemed exempt by the Committee of Ethics in Research of the Institute of Social Medicine, State University of Rio de Janeiro (review number 4.316.087), under the Brazilian National Health Council Resolution number 466/2012 and Operational Act number 001/2013, since data are de-identified and publicly available (www.ibge.gov.br).
Study Design and Population
This cross-sectional study analyzed data from the Brazilian National Dietary Survey (NDS) conducted by the Brazilian Institute of Geography and Statistics (acronym in Portuguese: IBGE) from the 2017-2018 Household Budget Survey (HBS). The HBS adopts a cluster sample design with two stages of selection. The NDS was carried out in a subsample randomly selected of the households included in the HBS, obtaining data on individual food consumption of subjects aged 10 years old and over. In 2017-2018, the HBS main sample included 57,920 households, and the NDS subsample encompassed 20,112 households [15]. Data from 28,153 adults (20 to 59 years old) were analyzed after excluding pregnant and lactating women (n = 1,200).
Dietary Data Collection
Two 24-hour recalls (24hR) were applied on non-consecutive days within one-week span by means of in-person interviews using procedures based on the Multiple-Pass Method [16] and a tablet-supported software including a database with 1,832 food items. The individuals reported all foods and beverages (including water) consumed during the day before the interview, reporting detailed information on portion size, cooking method, time and local of consumption, and named the meal or consumption occasion (breakfast, lunch, dinner, snacks) [15]. For specific foods, the possible addition of 12 items was questioned using yes-no questions: olive oil, margarine/butter, sugar, non-caloric sweetener, honey, molasses, mayonnaise, ketchup, mustard, soy sauce, grated cheese, and whipping cream [15].
Energy and nutrient intake were estimated using the Brazilian Food Composition Table (TBCA) v. 7.0 [17] taking account the addition of items to specific foods. To this end, standardized procedures were considered since no information on the amount added to food was available. A maximum of 20% of the amount consumed (in grams) was estimated, summing up the addition of all fat-based items (for example: if the participant added olive oil and grated cheese, the intake of each one was estimated as 10% of the amount reported). A maximum of 10% of the amount consumed was estimated for the total addition of sugar, honey, molasses, ketchup, mustard, or soy sauce.
The foods reported in the first 24-hour recall were categorized into 32 food groups according to their nutritional characteristics (Coffee and tea; Water; Rice; Beans; Sugars; Beef and pork; Bread; Vegetables; Solid fats; Poultry; Fruit juice; Roots and tubers; Fruits; Fast food; Cookies and crackers; Pasta; Sugar-sweetened beverages; Vegetable oils; Eggs; Cakes and baked goods; Candies, sweets and desserts; Processed meats; Cheeses, Corn and corn-dishes, Milk, Whole grains, Dairy beverages; Fish; Non-caloric sweeteners; Soups and broths; Sauces; Alcoholic beverages) (Supplemental Table S1).
Dietary Pattern Analysis
Partial least squares (PLS) regression method was applied to identifying dietary patterns, including the following response variables: energy density (ED) (kcal/gram), proportion (%) of energy intake provided by total fat (%TF), and fiber density (FD) (gram/1,000 kcal). The response variables were chosen considering the World Health Organization recommendations [18,19] and studies pointing out that these dietary components are related to the increased risk of obesity [11,20]. The energy density was calculated by the ratio between energy intake and the amount consumed (kcal/gram), excluding beverages. Fiber density was estimated by calculating grams of fiber intake per 1,000 kcal, and %TF represented the proportion of total daily energy intake provided by total fat. The predictor variables, the intake (in grams) of the 32 food groups, were standardized.
Food groups with factor loadings ≥ |0.15| were retained in the patterns. The standardized individual dietary pattern scores were categorized into quintiles. The PLS analysis was performed in the “PROC PLS” command in SAS OnDemand for Academics.
Characterization of the Study Population
The studied population was characterized according to sociodemographic variables: (a) sex (female or male); (b) age group (20 to 39 years old and 40 to 59 years old); (c) urban or rural household situation; (d) monthly per capita family income (estimated from the sum of household incomes divided by the number of household members and classified according to multiples of Brazil official minimum wage [MW] at the middle of the study, i.e., US$ 298.50 in January 2018 in: <0.5, 0.5–1.0, 1.0–2.0 and >2 MW); (e) being or not on a diet at the time of the interview; (f) away-from-home (if at least one food was eaten away from home throughout the day) or at-home only food consumption; and (g) snacking habits: no snacks or at least one snack reported throughout the day [15].
Statistical Analysis
Pearson’s correlation coefficient was calculated between predictor factor loadings, response variables, and scores of the dietary pattern identified. Dietary pattern scores were categorized into quintiles. Means and proportions (%) of socio-demographic and dietary habit variables were estimated for the total population and according to dietary pattern quintiles.
All analyses considered the complex sample and study design effect and were performed using SAS On Demand (welcome.oda.sas.com). Differences in means and proportions across the analyzed categories were evaluated based on the 95% confidence interval (95%CI) overlapping.
3. Results
Three dietary patterns, explaining together 48.8% of the variation of the response variables variation, were extracted. The first dietary pattern explained 4.2% of the food consumption variation and the most variation of the response variables (32.0%, being ED: 46.7%, %TF: 2.5%, and FD: 46.7%). Patterns 2 and 3 explained the variability of food consumption by 3.8% and 4.3%, respectively. Regarding response variable variability, these patterns explain 12.0% and 4.8%, respectively. The food groups retained in patterns 2 and 3 did not present an interpretable composition. Thus, only the first pattern was considered in the analysis due to its interpretability. In the first dietary pattern, the foods retained with positive factor loadings were fast foods (+0.30), breads (+0.27), solid fats (+0.26), sugar-sweetened beverages (+0.23), sauces (+0.21), and cheeses (+0.15). Additionally, beans (-0.54), rice (-0.36), fruits (-0.18), vegetables (-0.16), and water (-0.15) were retained with negative factor loadings (Figure 1). Therefore, this pattern was named as energy-dense and low-fiber pattern (ED-LF). The ED-LF pattern scores were directly correlated with ED (r = 0.686; p < 0.01) and inversely correlated with FD (r = -0.699; p < 0.01), while a weak positive correlation was observed with %TF (r = 0.156; p < 0.01). The highest correlation coefficient between the predictors (food groups) and the ED-LD dietary pattern scores was for fast foods (r = 0.361; p < 0.01), whereas the lowest negative correlation coefficients were estimated for beans (r = -0.639; p < 0.01) and rice (r = -0.431; p < 0.01). The highest positive correlation coefficients between energy density and food groups were estimated for breads (r = 0.249; p < 0.01), and fast foods (r = 0.243; p < 0.01); and the lowest negative coefficients were estimated for beans (r = -0.327; p < 0.01) and fruits (r = -0.269; p < 0.01), while for FD and %TF, the highest coefficients were estimated for beans and vegetables (r = 0.673; p < 0.01; r = 0.226; p < 0.01, respectively) (Table 1).
Overall, the mean ED-LF dietary pattern score was 0.10 and the quintile score means varied from -1.53 (quintile 1: least adherence; healthier) to 1.54 (quintile 5: most adherence; unhealthier). In general, mean energy density was 1.78 kcal/gram, fiber density mean was 13.2 g/1000 kcal and total fat intake mean was 29.8% of total energy intake. Across the quintiles of the ED-LF dietary pattern scores, the energy density means varied between 1.35 and 2.27 kcal/gram, the fiber density means, between 22.0 and 7.5 g/1000 kcal, and total fat intake, between 27.7% and 30.9% of total energy intake. For all food groups positively loaded in the ED-LF dietary pattern, the mean intake increased across the quintiles of the dietary pattern scores, and the greatest increments were observed for sauces, fast foods and sugar-sweetened beverages. The mean intake of sauces was 0.3 g/day in quintile 1 and 5.7 g/day in quintile 5, for fast foods, the mean daily intake varied between 12.5 g and 97.3 g and for sugar-sweetened beverages, between 34.7 and 203.5 g. For all inversely loaded food groups, the mean daily intake of food groups reduced across the quintiles of the ED-LF food groups. The greatest reductions were observed for beans and fruits. The mean bean intake in quintile 1 was 415.1 g/day and, in quintile 5, 76.3 g/day. The mean fruit intake was 113.7 g/day in quintile 1 and 30.9 g/day in quintile 5 (Table 2).
Most of the adults lived in the Southeast region (42.8%) and in urban areas (86.3%), and 31.3% earned between 1 and 2 minimum wages. Women comprised 50.2% of the investigated population and 54.6% of examined individuals were between 20 and 40 years old. Regarding dietary habits, 13.1% reported being on a diet, 16.9% reported the use of supplements in the 30 days prior to the interview, 47.9% reported away-from-home eating, and 85.7% reported having at least one snack per day (Table 3).
In quintile 5 of the ED-LF dietary pattern score, were classified 20.8% of the women and 25.0% of the men, 19.7% of 20-40 years old individuals and 25.5% of those >40 years old. In urban areas, 24.4% of the individuals were classified in the quintile 5 while, in rural area this proportion was 13.1%. In the lowest income level, 14.9% of the adults were classified in quintile 5 and in the highest income level, 28.0%. Among individuals reporting being on a diet, 14.4% were categorized in quintile 5, while among those who were not on a diet, this proportion was 24.1%. Comparing individuals that reported using or not supplements there was no difference in the distribution according to the quintiles of the ED-LF dietary pattern (quintile 5: 24.6% and 22.5%). Among those reporting away-from-home food consumption, 26.2% were classified in the quintile 5, while among individuals who reported only at-home eating, this proportion was 19.8%. Comparing individuals who had at least one snack and those reporting not snacking, the proportion of individuals in quintile 5 was 23.5% and 18.8%, respectively (Table 3).
In quintile 1 of the ED-LF dietary pattern score, were classified 22.4% of men and 14.1% of women and 19.6% of individuals aged between 20 and 40 years old and 17.1% of those over 40 years old. In rural area, 31.1% of the individuals were classified in the quintile 1 while, in urban area this proportion was 16.2%. In the lowest income level, 23.6% of the adults were classified in quintile 1, while in the highest income level, 13.1%. Among individuals reporting being on a diet or not, there was no difference in the proportions in the quintile 1 (18.2%, for both). Individuals who reported using supplements were 14.9% in quintile 1 and among those who did not, 18.9%. Among those reporting eating only at-home food consumption, 20.0% were classified in the quintile 1, while among individuals reporting away-from-home eating, this proportion was 16.3%. Comparing individuals who did not snack and those snacking at least once a day, the proportion of individuals in quintile 1 was 19.9% and 18.0% (Table 3).
4. Discussion
A dietary pattern characterized by low consumption of staple and fresh foods and high intake of foods rich in sugars and fats was identified in Brazilian adults and named as energy-dense and low-fiber (ED-LF) dietary pattern.
Greater adherence to the ED-LF pattern, meaning higher proportions of individuals in the fifth quintile and lower proportions in the first quintile when compared to their counterparts, were observed for the age range over 40 years old, in urban areas, in the highest income category, and for those reporting away-from-home food consumption. Furthermore, individuals reporting not being on a diet and ≥1 snack per day also presented greater adherence to the ED-LF pattern, as the proportion in the quintile 5 was higher than that observed for their counterparts. On the other hand, individuals aged 20 to 40 years old, in rural areas, in the lowest income class, and those reporting at-home only food consumption adhered lower to the ED-LF dietary pattern. As adherence to this dietary pattern increased, the mean intake of sauces, fast foods, and sugar-sweetened beverages increased by 19, 8 and 6 times, respectively, and the mean intake of beans and fruit reduced by 5 and 4 times, respectively.
Hybrid methods were applied to identify dietary patterns using dietary components associated with excess weight and extracted similar dietary patterns to that identified in this study [11,12,21,22]. A study examined 4,908 Australian adults and applied the Reduced Rank Regression (RRR) using energy density, fiber density and total sugar as response variables, extracted a dietary pattern characterized by low-fiber density and high added sugar content, which was associated with greater prevalence of overweight and obesity (Prevalence Ratio = 1.09) [21]. In a Canadian study with 11,748 adults, the PLS was applied to derive dietary patterns and energy density, fiber density and total fat were selected as response variables, the results showed that the adherence to an “energy-dense, high-fat, and low-fiber density” dietary pattern characterized by fast foods, soda, whole grains, solid fats, processed meats, cheeses, baked goods, sugars, and low intake of fruits, vegetables, and yogurt, was associated to increased obesity odds (Odds Ratio = 2.69) [11]. In another Canadian population-based study with 12,049 adults, Ng, Jessri and L’Abbe [12] also identified a “energy-dense, high-fat, and low-fiber” dietary pattern using energy density, fiber density and total fat as response variables, characterized by fast foods, sugar-sweetened beverages and salty snacks, and low intake of fruits, vegetables, vegetable juices, whole grains, legumes and soy, pasta and rice dishes, which was associated with increased odds of obesity (OR = 2.40). Livingstone et al. [22] evaluated 625 Australian adults (between 18 and 30 years old) and used the RRR to extract dietary patterns using energy density, free sugars, saturated fat and fiber as response variables. The first identified dietary pattern was characterized by high intake of sugar-sweetened beverages, baked goods, and savory products and low intake of vegetables and pome/berry/stone fruit and was associated with increased odds of overweight/obesity (Odds Ratio = 1.22).
ED-LF eating pattern contradicts the recommendations of the Brazilian dietary guidelines [23,24] since it is characterized by consumption of nutritious staples like rice and beans and fresh foods, combined with high consumption of energy-dense, high-sugar, and ultra-processed products. This dietary pattern may increase the risk of nutritional deficiencies and adverse health effects and expresses the changes observed in the Brazilian nutrition scenario, since the regular consumption of beans has been reduced [25,26]. The rice-and-beans combination has low-energy density, low glycemic index, and high fiber content; therefore, provides benefits for the prevention of weight gain and chronic non-communicable diseases [27,28,29]. The low consumption of fresh foods, such as vegetables and fruits, is also in line with the trends observed in the Brazilian population, especially because the consumption of fruits and vegetables is restricted by the limited affordability and accessibility related to these items [30,31]. The World Health Organization [18] recommends the consumption of at least 400 grams per day of vegetables and fruits, however, the overall mean intake of fruits and vegetables (113.6 g/day) as well as the mean of those who adhere least to the ED-LF dietary pattern (quintile 1: 189.2 g/day) are far below the recommended level. The positive correlation between beans’ intake and dietary fiber density probably indicates that beans are an important source of fiber in the Brazilian diet. The ED-LF dietary pattern was also marked by low intake of water. Encouraging water consumption to replace sugar-sweetened beverages has been adopted as a strategy to reduce weight gain [32,33].
The ED-LF dietary pattern was positively loaded on foods with high energy density, rich in sugars and fats, and with low nutrient content, such as sugar-sweetened beverages, fast foods, and sauces that are mostly ultra-processed products. The consumption of these items has increased in the last decades and is associated with weight gain in adults [34,35,36,37,38], and they are usually eaten to replace more complex meals at lunch or dinner [39].
Divergent to our results, in general, adults over 40 years old adopt healthier diets than younger ones [40,41]. Greater adherence to the ED-LF dietary pattern in urban areas is consistent with the unfavorable food environment observed in most medium and big cities, in which the availability and accessibility to low-quality food items, such as the ultra-processed foods, is largely widespread [42,43,44].
Consistently with other studies, no dieters adhered more to the ED-LF pattern, since dieters usually are more careful in healthier food choices [45,46]. Furthermore, eating-away-from-home and snacking have been associated with a poorer diet characterized by higher content of calories, added sugars and solid fats, and reduced intake of whole grains and vegetables [47,48]. Bezerra et al. [49], analyzing data from the same NDS observed that the most outstanding caloric contribution of foods away-from-home came from alcoholic beverages, snacks, soda, pizza, candies, and sandwiches.
In Brazil, similar dietary patterns have been identified and associated with weight gain indicators in adults. Cunha et al. [10], in a cross-sectional study, investigated 1,009 Brazilian adults and identified a direct association between a Western dietary pattern (composed by fast foods, sugar-sweetened beverages, fruit juice, milk and dairy products, cakes and cookies) with BMI (β = 0.74, p = 0.02) and waist circumference among women (β = 13.61, p = 0.02). Another cross-sectional study analyzed data from 2,034 adults included in the Ribeirão Preto (State of São Paulo) cohort and observed direct association between a Bar dietary pattern (composed by alcoholic beverages, snacks, pork, sausage, eggs, bacon, seafood and mayonnaise) and excess weight (BMI ≥ 25 kg/m²) and elevated waist circumference in both sexes (Prevalence Ratio = 1.46 and 2.19, respectively) [13].
The identified dietary pattern agrees with the shift of culinary traditions of home-prepared meals to ready-to-eat processed items [50] that are energy-dense, rich in sugars and fats. Besides their deleterious effect on health, such eating habits have negative impact on the environmental sustainability, mainly because the basis of these items are products from the agribusiness, which is related to deforestation, reduction of biodiversity, widespread use of pesticides, exhaustion of water reserves, emission of greenhouse gases, intensive use and improper disposal of packaging, rural exodus and, finally, its commercialization occurs mainly through unfair commercial practices. Therefore, in addition to the environmental impact, all these conditions have social and economic negative repercussions [51,52,53]. Therefore, healthier and sustainable diets have been encouraged in dietary guidelines, not only to reduce obesity and communicable diseases, but also to minimize the environmental impact of food systems and provide food security. Such diets are mostly plant-based, based on pulses, fruits, vegetables, and nuts, and combined with reduced portions of animal-based foods [24,54,55,56].
The identification of dietary pattern based on the first day of 24hR is a limitation of the study; however, statistics strategies used to estimate usual intake from two 24hR are limited to calculating individual estimates of food and nutrient intake [57], which are necessary to extract dietary patterns. Beyond the nationally representative sample, one strength of the study is the use of the 24hR incorporating procedures to improve data quality, a recommended method for obtaining food consumption data as it enables detailed information and is less subjected to systematic error [58,59,60]. Additionally, adopting a hybrid method and using variables on the obesity causal pathway are adequate strategies to identify dietary patterns [9].
5. Conclusions
The findings emphasize the importance of monitoring in the nutrition surveillance system [5,61,62] the intake of foods that may indicate the healthiness potential of the diet, such as staple foods and ultra-processed items, specifically: sugar-sweetened beverages, processed meats, fruits, vegetables, rice, and beans.
The results endorse the adequacy of public health policies, such as adopting a food labeling policy that makes it easier to identify products with higher contents of added sugar, saturated fats, and sodium [63]. Another important measure was the modification of the basic food basket to adapt to the Brazilian dietary guidelines in order to prioritize staple, regional, and fresh foods and to prohibit the inclusion of ultra-processed foods [64]; the products in the official food basket are subject to tax incentives to reduce their price.
In general, an energy-dense and low-fiber dietary pattern, characterized by a low intake of fruits, vegetables, and staple foods and a high intake of fast foods and sugar-sweetened beverages, may contribute to the obesity scenario in Brazil. Individuals over 40 years old, living in urban areas, with monthly per capita income > 2 minimum wages, and those reporting away-from-home eating are the groups with greater adherence to this dietary pattern. The results are relevant to targeting and tailoring strategies of healthy eating promotion to prevent excessive weight gain among adults and guarantee the human right to healthy food.
Supplementary Materials
The following supporting information can be downloaded at: Preprints.org, Table S1: Food groups mentioned in the 24-hour recall by adults. Brazil, National Dietary Survey, 2017-2018.
Author Contributions
Conceptualization, I.A.A., M.J., L.S.M., E.M.Y., R.S. and R.A.P.; Methods I.A.A., M.J., L.S.M., T.S.L., E.M.Y., R.S. and R.A.P.; Formal Analysis, I.A.A., M.J., L.S.M., L.E.S.G., T.S.L., R.S. and R.A.P.; Writing—Original Draft Preparation, I.A.A., M.J., L.S.M., L.E.S.G., T.S.L., E.M.Y, R.S. and R.A.P.; Writing—Review & Editing, I.A.A., M.J., L.S.M., L.E.S.G., T.S.L., E.M.Y, R.S. and R.A.P.; Supervision, E.M.Y., R.S. and R.A.P.
Funding
This study was financed in part by the Brazilian Federal Agency for Support and Evaluation of Graduate Education (CAPES) in the form of a scholarship awarded to IAA in Brazil and during her internship carried out at the University of British Columbia, Vancouver, Canada - Finance Code 001.
Informed Consent Statement
In the 2017-2018 Brazilian National Dietary Survey (NDS), the study was deemed exempt by the Committee of Ethics in Research of the Institute of Social Medicine, State University of Rio de Janeiro (review number 4.316.087), under the Brazilian National Health Council Resolution number 466/2012 and Operational Act number 001/2013, since data are de-identified and publicly available (www.ibge.gov.br).
Conflicts of Interest
The authors declare no conflicts of interest.
References
- World Health Organization. Draft recommendations for the prevention and management of obesity over the life course, including potential targets. 2021. Available online: https://www.who.int/publications/m/item/who-discussion-paper-draft-recommendations-for-the-prevention-and-management-of-obesity-over-the-life-course-including-potential-targets(accessed on January 2024).
- NCD Risk Factor Collaboration (NCD-RisC). Worldwide trends in underweight and obesity from 1990 to 2022: a pooled analysis of 3663 population-representative studies with 222 million children, adolescents, and adults. Lancet 2024, 403, 1027–1050. [Google Scholar] [CrossRef]
- Estivaleti, J.M.; Guzman-Habinger, J.; Lobos, J.; et al. Time trends and projected obesity epidemic in Brazilian adults between 2006 and 2030. Sci Rep 2022, 12, 12699. [Google Scholar] [CrossRef]
- Ferreira, A.P.S.; Szwarcwald, C.L.; Damacena, G.N.; et al. Increasing trends in obesity prevalence from 2013 to 2019 and associated factors in Brazil. Rev Bras Epidemiol 2021, 24, e210009. [Google Scholar] [CrossRef] [PubMed]
- Brasil. Ministério da Saúde, Secretaria de Vigilância em Saúde e Ambiente & Departamento de Análise Epidemiológica e Vigilância de Doenças Não Transmissíveis. Vigitel Brasil 2023: Vigilância de fatores de risco e proteção para doenças crônicas por inquérito telefônico: estimativas sobre frequência e distribuição sociodemográfica de fatores de risco e proteção para doenças crônicas nas capitais dos 26 estados brasileiros e no Distrito Federal em 2023. 2023. Available online: https://www.gov.br/saude/pt-br/centrais-de-conteudo/publicacoes/svsa/vigitel/vigitel-brasil-2023-vigilancia-de-fatores-de-risco-e-protecao-para-doencas-cronicas-por-inquerito-telefonico/view(accessed on January 2024).
- Hu, F.B. Dietary pattern analysis: a new direction in nutritional epidemiology. Curr Opin Lipidol 2002, 13, 3–9. [Google Scholar] [CrossRef] [PubMed]
- Michels, K.B.; Schulze, M.B. Can dietary patterns help us detect diet–disease associations? Nutr Res Rev 2005, 18, 241–248. [Google Scholar] [CrossRef] [PubMed]
- United States Department of Agriculture (USDA). A series of systematic reviews on the relationship between dietary patterns and health outcomes. 2014; 501p. Available online: https://nesr.usda.gov/sites/default/files/2019-06/DietaryPatternsReport-FullFinal2.pdf(accessed on January 2024).
- Hoffmann, K.; Schulze, M.B.; Schienkiewitz, A.; et al. Application of a New Statistical Method to Derive Dietary Patterns in Nutritional Epidemiology. Am J Epidemiol 2004, 159, 935–944. [Google Scholar] [CrossRef] [PubMed]
- Cunha, D.B.; Almeida, R.M.; Sichieri, R.; et al. Association of dietary patterns with BMI and waist circumference in a low-income neighborhood in Brazil. Br J Nutr 2010, 104, 908–913. [Google Scholar] [CrossRef] [PubMed]
- Jessri, M.; Wolfinger, R.D.; Lou, W.Y.; et al. Identification of dietary patterns associated with obesity in a nationally representative survey of Canadian adults: application of a priori, hybrid, and simplified dietary pattern techniques. AJCN 2017, 105, 669–684. [Google Scholar] [CrossRef]
- Ng, A.P.; Jessri, M.; L’Abbe, M.R. Using partial least squares to identify a dietary pattern associated with obesity in a nationally-representative sample of Canadian adults: Results from the Canadian Community Health Survey-Nutrition 2015. PloS one 2021, 16, e0255415. [Google Scholar] [CrossRef]
- Arruda, S.P.M.; Silva, A.A.; Kac, G.; et al. Dietary patterns are associated with excess weight and abdominal obesity in a cohort of young Brazilian adults. Eur J Nutr 2016, 55, 2081–2091. [Google Scholar] [CrossRef]
- Muniz, S.C.R.S.; Barbieri, M.A.; Sanches, G.F.; et al. Dietary pattern changes, obesity and excess body fat in adults of a Brazilian birth cohort. J Hum Nutr Diet 2023, 36, 191–202. [Google Scholar] [CrossRef] [PubMed]
- Instituto Brasileiro de Geografia e Estatística, Diretoria de Pesquisas, Coordenação de Trabalho e Rendimento. Pesquisa de Orçamentos Familiares 2017-2018: análise do consumo alimentar pessoal no Brasil (Household Budget Survey 2017-2018: analysis of personal food consumption in Brazil); IBGE: Rio de Janeiro, 2020; Available online: https://biblioteca.ibge.gov.br/visualizacao/livros/liv101742.pdf(accessed on January 2024).
- Conway, J.M.; Ingwersen, L.A.; Moshfegh, A.J. Accuracy of dietary recall using the USDA five-step multiple-pass method in men: an observational validation study. J Am Diet Assoc 2004, 104, 595–603. [Google Scholar] [CrossRef]
- Giuntini, E.B.; Coelho, K.S.; Grande, F.; et al. 12th IFDC 2017 Special issue—Brazilian Nutrient Intake Evaluation Database: an essential tool for estimating nutrient intake data. J Food Compos Anal 2019, 83, 103286. [Google Scholar] [CrossRef]
- World Health Organization. Diet, nutrition and the prevention of chronic diseases: report of a Joint WHO/FAO Expert Consultation; WHO Technical Report Series, No. 916; World Health Organization: Geneva, 2003; Available online: https://www.who.int/publications/i/item/924120916X pdf(accessed on March 2024).
- World Health Organization. Healthy diet WHO Fact Sheet, No 394. 2018. Available online: https://www.who.int/publications/m/item/healthy-diet-factsheet394(accessed on January 2024).
- Stelmach-Mardas, M.; Rodacki, T.; Dobrowolska-Iwanek, J.; et al. Link between Food Energy Density and Body Weight Changes in Obese Adults. Nutrients 2016, 8, 229. [Google Scholar] [CrossRef]
- Livingstone, K.M.; McNaughton, S.A. Dietary patterns by reduced rank regression are associated with obesity and hypertension in Australian adults. Br J Nutr 2017, 117, 248–259. [Google Scholar] [CrossRef]
- Livingstone, K.M.; Sexton-Dhamu, M.J.; Pendergast, F.J.; et al. Energy-dense dietary patterns high in free sugars and saturated fat and associations with obesity in young adults. Eur J Nutr 2022, 61, 1595–1607. [Google Scholar] [CrossRef] [PubMed]
- Brasil. Ministério da Saúde, Secretaria de Atenção à Saúde &Departamento de Atenção Básica. Guia alimentar para a população brasileira (Dietary Guidelines for the Brazilian population), 2nd ed.; Ministério da Saúde, Secretaria de Atenção àSaúde, Departamento de Atenção Básica: Brasília, 2014; Available online: https://bvsms.saude.gov.br/bvs/publicacoes/guia_alimentar_populacao_brasileira_2ed.pdf(accessed on April 2024).
- Willett, W.; Rockström, J.; Loken, B.; et al. Food in the Anthropocene: the EAT-Lancet Commission on healthy diets from sustainable food systems. Lancet 2019, 393, 447–492. [Google Scholar] [CrossRef]
- Granado, F.S.; Maia, E.G.; Mendes, L.L.; et al. Reduction of traditional food consumption in Brazilian diet: trends and forecasting of bean consumption (2007-2030). Public health Nutr 2021, 24, 1185–1192. [Google Scholar] [CrossRef] [PubMed]
- Santin, F.; Gabe, K.T.; Levy, R.B.; et al. Food consumption markers and associated factors in Brazil: distribution and evolution, Brazilian National Health Survey, 2013 and 2019. Cad Saude Publica 2022, 38, e00118821. [Google Scholar] [CrossRef]
- Sichieri, R. Dietary Patterns and Their Associations with Obesity in the Brazilian City of Rio de Janeiro. Obes Res 2002, 10, 42–48. [Google Scholar] [CrossRef]
- Sardinha, A.N.; Canella, D.S.; Martins, A.P.B.; et al. Dietary sources of fiber intake in Brazil. Appetite 2014, 79, 134–138. [Google Scholar] [CrossRef] [PubMed]
- Reynolds, A.; Mann, J.; Cummings, J.; et al. Carbohydrate quality and human health: a series of systematic reviews and meta-analyses. Lancet 2019, 393, 434–445. [Google Scholar] [CrossRef]
- Claro, R.M.; Monteiro, C.A. Family income, food prices, and household purchases of fruits and vegetables in Brazil. Rev Saude Publica 2010, 44, 1014–1020. [Google Scholar] [CrossRef] [PubMed]
- Verly-Jr, E.; Oliveira, D.C.R.S.; Sichieri, R. Custo de uma alimentação saudável e culturalmente aceitável no Brasil em 2009 e 2018. Rev Saude Publica 2021, 55 (Suppl. 1), 7s. [Google Scholar]
- Hernández-Cordero, S.; Barquera, S.; Rodríguez-Ramírez, S.; et al. Substituting water for sugar-sweetened beverages reduces circulating triglycerides and the prevalence of metabolic syndrome in obese but not in overweight Mexican women in a randomized controlled trial. J Nutr 2014, 144, 1742–1752. [Google Scholar] [CrossRef]
- Duffey, K.J.; Poti, J. Modeling the Effect of Replacing Sugar-Sweetened Beverage Consumption with Water on Energy Intake, HBI Score, and Obesity Prevalence. Nutrients 2016, 8, 395. [Google Scholar] [CrossRef]
- Marino, M.; Puppo, F.; Del Bo’, C.; et al. A Systematic Review of Worldwide Consumption of Ultra-Processed Foods: Findings and Criticisms. Nutrients 2021, 13, 2778. [Google Scholar] [CrossRef] [PubMed]
- Cordova, R.; Kliemann, N.; Huybrechts, I.; et al. Consumption of ultra-processed foods associated with weight gain and obesity in adults: A multi-national cohort study. Clin Nutr 2021, 40, 5079–5088. [Google Scholar] [CrossRef] [PubMed]
- Malik, V.S.; Hu, F.B. The role of sugar-sweetened beverages in the global epidemics of obesity and chronic diseases. Nat Rev Endocrinol 2022, 18, 205–218. [Google Scholar] [CrossRef]
- Lara-Castor, L.; Micha, R.; Cudhea, F.; et al. Sugar-sweetened beverage intakes among adults between 1990 and 2018 in 185 countries. Nat Commun 2023, 14, 5957. [Google Scholar] [CrossRef]
- Nguyen, M.; Jarvis, S.E.; Tinajero, M.G.; Yu; et al. Sugar-sweetened beverage consumption and weight gain in children and adults: a systematic review and meta-analysis of prospective cohort studies and randomized controlled trials. Am J Clin Nutr 2023, 117, 160–174. [Google Scholar] [CrossRef]
- Kant, A.K.; Graubard, B.I. 40-year trends in meal and snack eating behaviors of American adults. J Acad Nutr Diet 2015, 115, 50–63. [Google Scholar] [CrossRef]
- Bezerra, I.N.; Gurgel, A.O.C.; Barbosa, R.G.B.; et al. Dietary Behaviors among Young and Older Adults in Brazil. J Nutr Health Aging 2018, 22, 575–580. [Google Scholar] [CrossRef]
- Zhao, H.; Andreyeva, T. Diet Quality and Health in Older Americans. Nutrients 2022, 14, 1198. [Google Scholar] [CrossRef]
- Costa, D.V.P.; Lopes, M.S.; Mendonça, R.D.; et al. Food consumption differences in Brazilian urban and rural areas: the National Health Survey. Cien Saude Colet 2021, 26, 3805–3813. [Google Scholar] [CrossRef] [PubMed]
- Vilar-Compete, M.; Burrola-Méndez, S.; Lozano-Marrufo, A.; et al. Urban poverty and nutrition challenges associated with accessibility to a healthy diet: a global systematic literature review. Int J Equity Health 2021, 20, 40. [Google Scholar] [CrossRef] [PubMed]
- Westbury, S.; Ghosh, I.; Jones, H.M.; et al. The influence of the urban food environment on diet, nutrition and health outcomes in low-income and middle-income countries: a systematic review. BMJ Glob Health 2021, 6, e006358. [Google Scholar] [CrossRef]
- Ridder, D.; Adriaanse, M.; Evers, C.; et al. Who diets? Most people and especially when they worry about food. Appetite 2014, 80, 103–108. [Google Scholar] [CrossRef] [PubMed]
- Giacone, L.; Siegrist, M.; Hartmann, C. Food choices for weight loss: what dietary strategies would people use? Br J Nutr 2024, 131, 1268–1280. [Google Scholar] [CrossRef]
- Nagao-Sato, S.; Reicks, M. Food Away from Home Frequency, Diet Quality, and Health: Cross-Sectional Analysis of NHANES Data 2011-2018. Nutrients 2022, 14, 3386. [Google Scholar] [CrossRef]
- Wellard-Cole, L.; Davies, A.; Allman-Farinelli, M. Contribution of foods prepared away from home to intakes of energy and nutrients of public health concern in adults: a systematic review. Crit Rev Food Sci Nutr 2022, 62, 5511–5522. [Google Scholar] [CrossRef]
- Bezerra, I.N.; Vasconcelos, T.M.; Cavalcante, J.B.; et al. Evolution of out-of-home food consumption in Brazil in 2008-2009 and 2017-2018. Ver Saude Publica 2021, 55, 6s. [Google Scholar]
- Food and Agriculture Organization of the United Nations (FAO). Globalization of food systems in developing countries: impact on food security and nutrition. 2004; 97p. Available online: https://www.fao.org/documents/card/es?details=25f0d49b-c900-5879-9cdf-ffbaa70ce6e3/(accessed on January 2024).
- Baker, P.; Machado, P.; Santos, T.; et al. Ultra-processed foods and the nutrition transition: Global, regional and national trends, food systems transformations and political economy drivers. Obes Rev 2020, 21, e13126. [Google Scholar] [CrossRef] [PubMed]
- Fardet, A.; Rock, E. Ultra-Processed Foods and Food System Sustainability: What Are the Links? Sustainability 2020, 12, 6280. [Google Scholar] [CrossRef]
- Anastasiou, K.; Baker, P.; Hadjikakou, M.; et al. A conceptual framework for understanding the environmental impacts of ultra-processed foods and implications for sustainable food systems. J Clean Prod 2022, 368, 133155. [Google Scholar] [CrossRef]
- Popkin, B.M.; Reardon, T. Obesity and the food system transformation in Latin America. Obes Rev 2018, 19, 1028–1064. [Google Scholar] [CrossRef] [PubMed]
- Burkhart, S.; Craven, D.; Horsey, B.; et al. The role of diets and food systems in the prevention of obesity and non-communicable diseases in Fiji; FAO, 2021; 160p, Available online: https://www.fao.org/3/cb5194en/cb5194en.pdf(accessed on January 2024).
- Parajára, M.C.; Colombet, Z.; Machado, Í.E.; et al. Mortality attributable to diets low in fruits, vegetables, and whole grains in Brazil in 2019: evidencing regional health inequalities. Public Health 2023, 224, 123–130. [Google Scholar] [CrossRef]
- Luo, H.; Dodd, K.W.; Arnold, C.D.; et al. Advanced Dietary Analysis and Modeling: A Deep Dive into the National Cancer Institute Method. J Nutr 2022, 152, 2615–2625. [Google Scholar] [CrossRef]
- Dodd, K.W.; Guenther, P.M.; Freedman, L.S.; et al. Statistical methods for estimating usual intake of nutrients and foods: a review of the theory. J Am Diet Assoc 2006, 106, 1640–1650. [Google Scholar] [CrossRef]
- Thompson, F.E.; Kirkpatrick, S.I.; Subar, A.F.; et al. The National Cancer Institute’s Dietary Assessment Primer: A Resource for Diet Research. J Acad Nutr Diet 2015, 115, 1986–1995. [Google Scholar] [CrossRef]
- Gibson, R.S.; Charrondiere, U.R.; Bell, W. Measurement Errors in Dietary Assessment Using Self-Reported 24-Hour Recalls in Low-Income Countries and Strategies for Their Prevention. Adv Nutr 2017, 8, 980–991. [Google Scholar] [CrossRef] [PubMed]
- Brasil. Ministério da Saúde, Secretaria de Atenção à Saúde & Departamento de Atenção Básica. Marco de referência da vigilância alimentar e nutricional na atenção básica; MS: Brasília, 2015; Available online: https://bvsms.saude.gov.br/bvs/publicacoes/marco_referencia_vigilancia_alimentar.pdf(accessed on April 2024).
- Louzada, M.L.C.; Couto, V.D.C.S.; Rauber, F.; et al. Food and Nutrition Surveillance System markers predict diet quality. Rev Saude Publica 2023, 57, 82. [Google Scholar] [CrossRef] [PubMed]
- Gomes, F.D.S.; Corvalán, C.; Deliza, R.; et al. Editorial: Strengthening food labeling policies in Brazil. Front Nutr 2023, 10, 1196243. [Google Scholar] [CrossRef] [PubMed]
- Brasil. Decreto No 11.936, de 5 de março de 2024. Dispõe sobre a composição da cesta básica de alimentos no âmbito da Política Nacional de Segurança Alimentar e Nutricional e da Política Nacional de Abastecimento Alimentar. 2024. Available online: https://www.mdpi.com/2075-471X/12/6/90(accessed on April 2024).
Figure 1.
Factor loadings of food groups included the “energy-dense and low-fiber” adults’ dietary pattern extracted using Partial Least Squares. Brazil, National Dietary Survey, 2017-2018. Food groups with factor loadings ≥ |0.15| were retained in the dietary pattern.
Figure 1.
Factor loadings of food groups included the “energy-dense and low-fiber” adults’ dietary pattern extracted using Partial Least Squares. Brazil, National Dietary Survey, 2017-2018. Food groups with factor loadings ≥ |0.15| were retained in the dietary pattern.
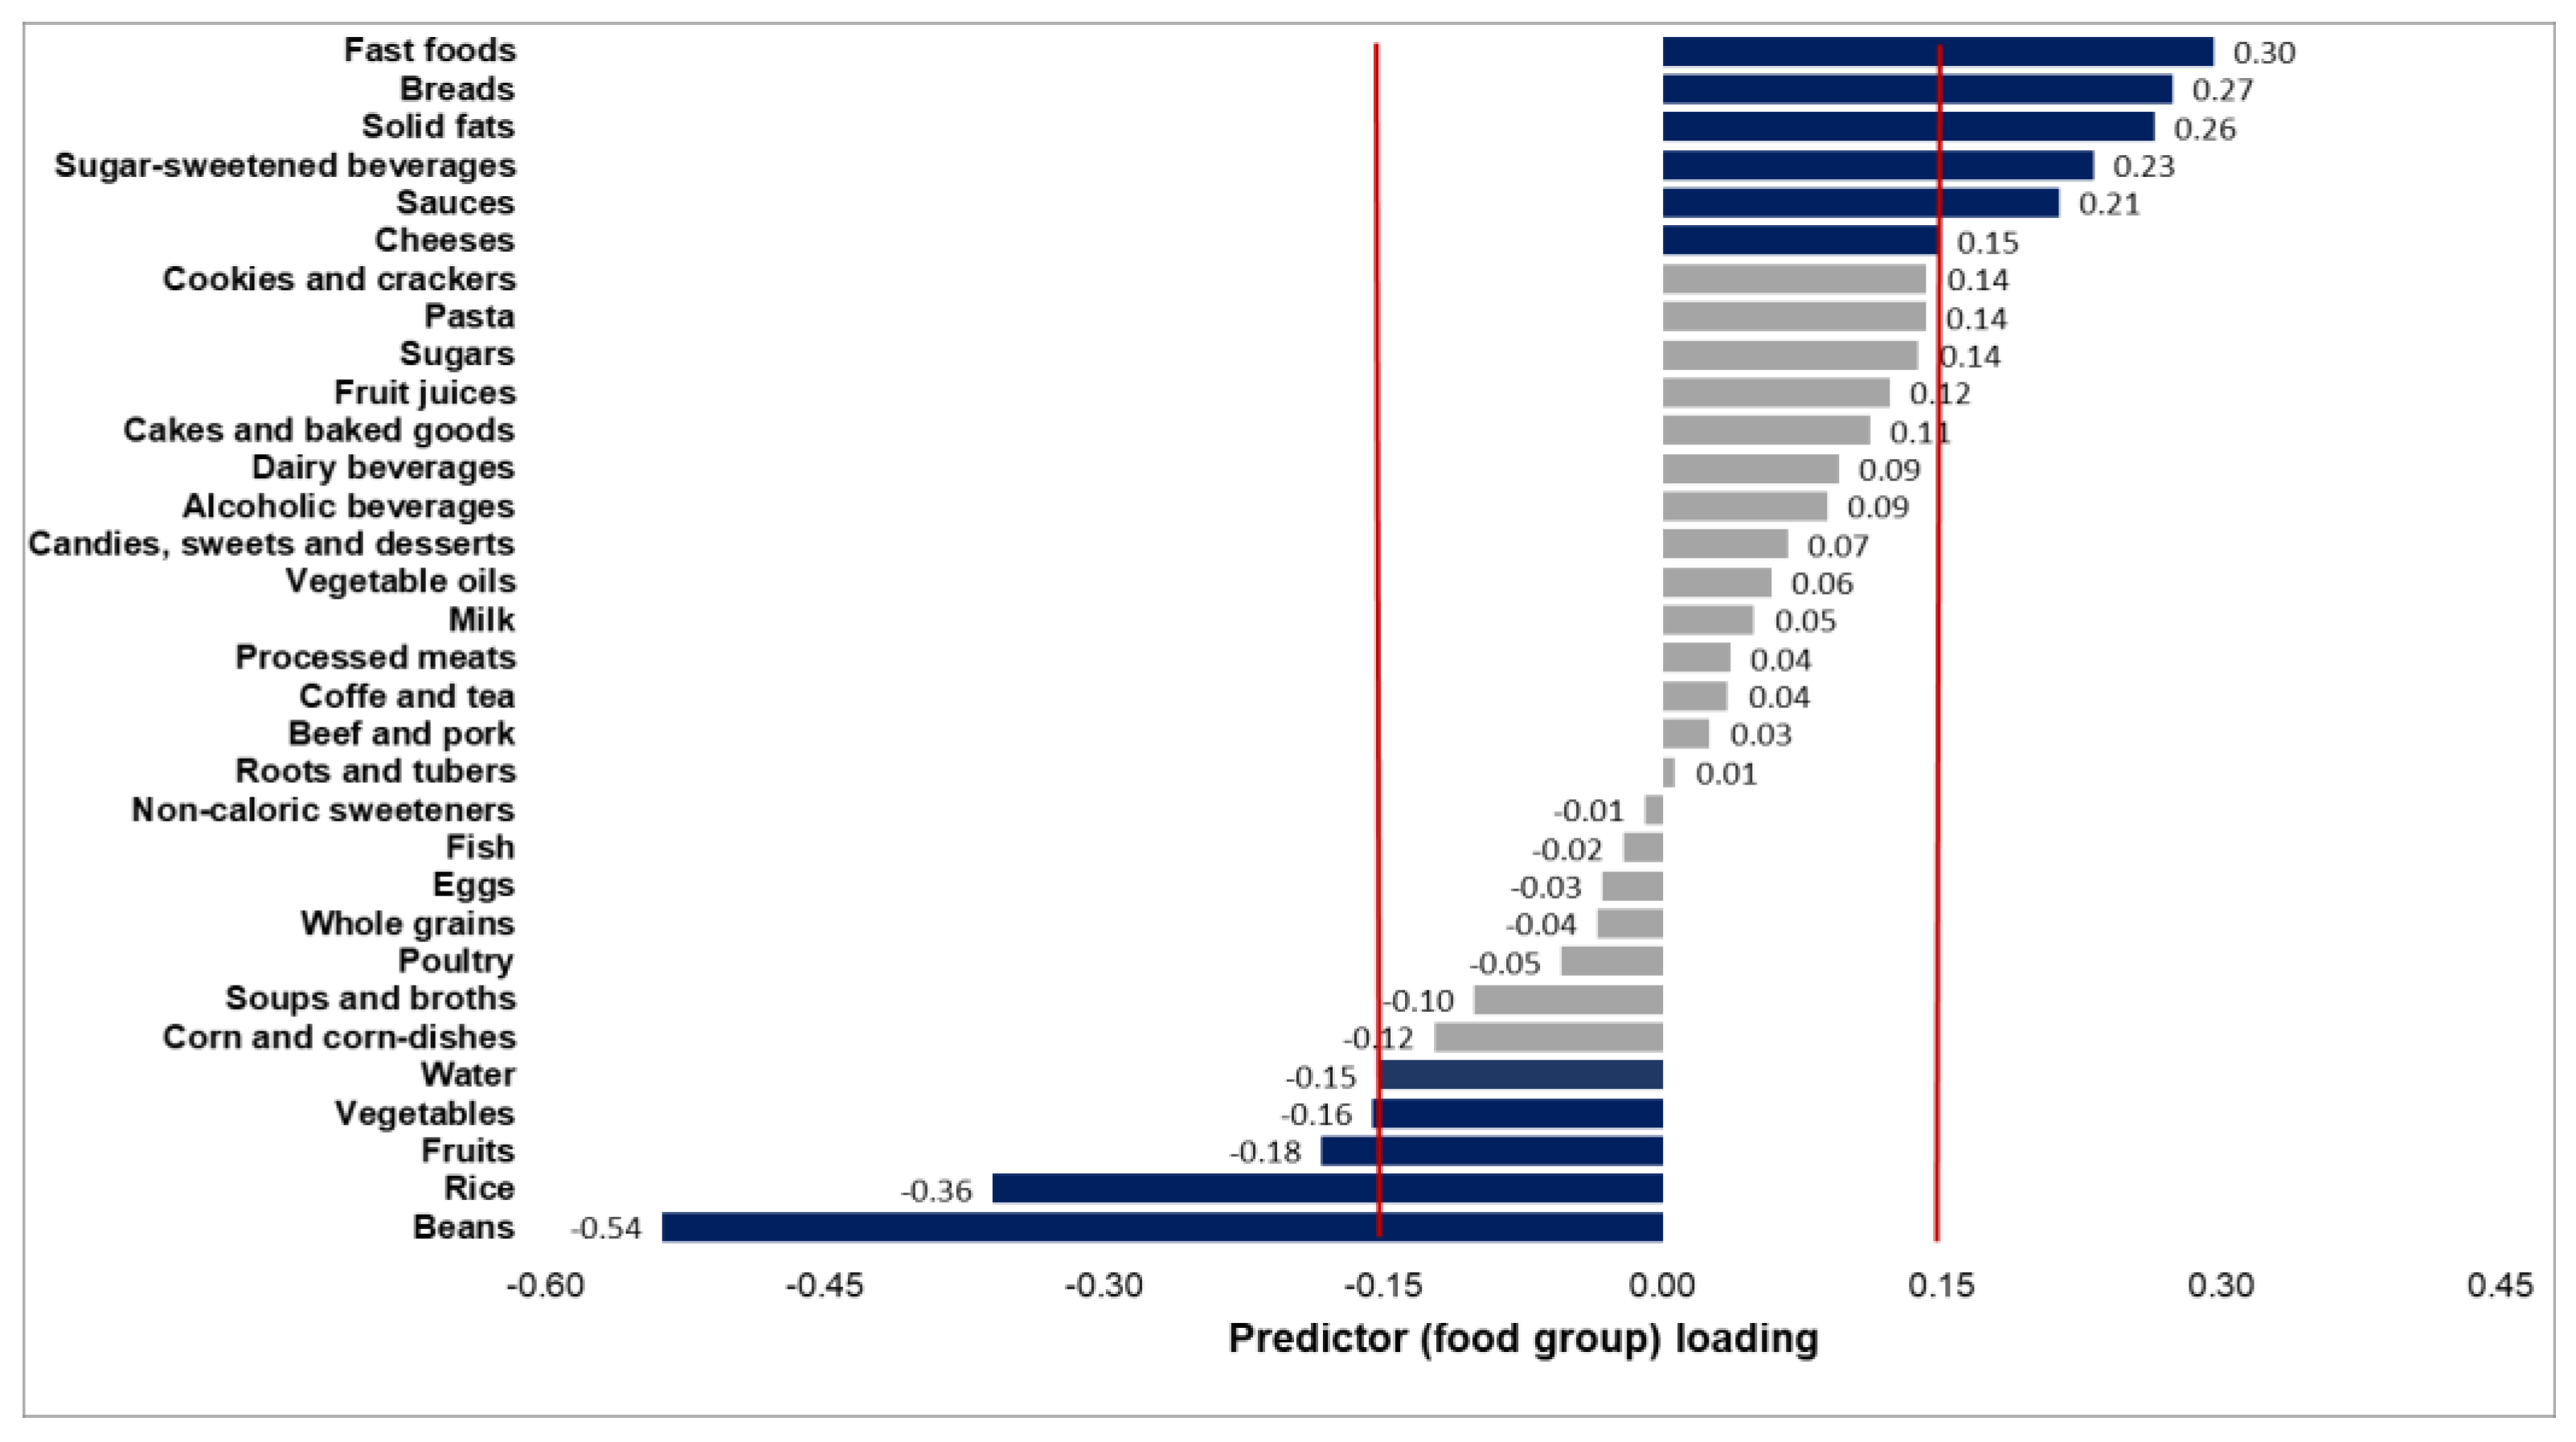

Table 1.
Pearson correlation coefficients between predictor loadings, response variables, and scores of the 1 PLS-derived energy-dense and low-fiber (ED-LF) dietary pattern. Brazil, adults (20-59 years old). National Dietary Survey, 2017-2018.
Table 1.
Pearson correlation coefficients between predictor loadings, response variables, and scores of the 1 PLS-derived energy-dense and low-fiber (ED-LF) dietary pattern. Brazil, adults (20-59 years old). National Dietary Survey, 2017-2018.
| Response variables | ED-LF dietary pattern scores | |||
|---|---|---|---|---|
| Energy density | Fiber density | % Energy from total fat | PLS | |
| Predictor variables † | ||||
| Positive associations | ||||
| Solid fats | 0.222 | -0.077 | 0.120 | 0.290 |
| Breads | 0.249 | -0.094 | 0.008 § | 0.294 |
| Sugar-sweetened beverages | 0.136 | -0.155 | -0.033 | 0.274 |
| Fast foods | 0.243 | -0.172 | 0.064 | 0.361 |
| Sauces | 0.104 | -0.086 | 0.072 | 0.268 |
| Cheeses | 0.081 | -0.105 | 0.144 | 0.189 |
| Inverse associations | ||||
| Rice | -0.204 | 0.241 | -0.113 | -0.431 |
| Beans | -0.327 | 0.673 | -0.080 | -0.639 |
| Vegetables | -0.226 | 0.105 | 0.226 | -0.185 |
| Water | -0.072 | 0.062 | -0.005 ¥ | -0.177 |
| Fruits | -0.269 | 0.088 | -0.089 | -0.216 |
| Response variables | ||||
| Energy density | 1 | -0.608 | 0.299 | 0.686 |
| Fiber density | 1 | -0.244 | -0.699 | |
| % Energy from total fat | 1 | 0.156 | ||
1 PLS, partial least squares regression. † Food groups retained in the ED-LF dietary pattern with factor loadings ≥ |0.15|. P-value for all correlation coefficients < 0.01 except for § breads (p = 0.178) and ¥ water (p = 0.455) vs. % energy from total fat.
Table 2.
Means of the energy-dense and low-fiber (ED-LF) dietary pattern scores, response variables and positive and inverse loaded food groups’ intake across the quintiles of the dietary pattern scores. Brazil, adults (20-59 yo), National Dietary Survey, 2017-2018.
Table 2.
Means of the energy-dense and low-fiber (ED-LF) dietary pattern scores, response variables and positive and inverse loaded food groups’ intake across the quintiles of the dietary pattern scores. Brazil, adults (20-59 yo), National Dietary Survey, 2017-2018.
| Food groups | All | Quintiles of the ED-LF dietary pattern | ||||
|---|---|---|---|---|---|---|
| Quintile 1 | Quintile 2 | Quintile 3 | Quintile 4 | Quintile 5 | ||
| Dietary pattern score | 0.10 (0.07; 0.13) |
-1.53 (-1.57; -1.49) |
-0.47 (-0.48; -0.45) |
0.04 (0.02; 0.05) |
0.53 (0.51; 0.54) |
1.54 (1.51; 1.57) |
| Response variables | ||||||
| Energy density (kcal/g) | 1.78 (1.77; 1.79) |
1.35 (1.34; 1.36) |
1.52 (1.51; 1.53) |
1.71 (1.70; 1.72) |
1.93 (1.92; 1.95) |
2.27 (2.25; 2.29) |
| Fiber density (g/1,000 kcal) | 13.2 (13.0; 13.4) |
22.0 (21.7; 22.3) |
16.0 (15.8; 16.2) |
12.5 (12.3; 12.7) |
9.7 (9.5; 9.8) |
7.5 (7.4; 7.7) |
| Total fat intake (%) | 29.8 (29.6; 30.0) |
27.7 (27.4; 28.1) |
29.3 (29.0; 29.7) |
30.2 (29.8; 30.6) |
30.4 (30.0; 30.7) |
30.9 (30.5; 31.3) |
| Positively loaded food groups (g/day) † | Grams per day | |||||
| Solid fats | 7.7 (7.4; 8.1) |
3.8 (3.4; 4.2) |
4.7 (4.3; 5.0) |
5.9 (5.5; 6.4) |
8.2 (7.7; 8.8) |
14.6 (13.7; 15.5) |
| Breads | 50.2 (48.8; 51.6) |
27.7 (25.7; 29.6) |
35.4 (33.2; 37.6) |
42.1 (39.7; 44.5) |
55.7 (52.8; 58.6) |
82.7 (78.8; 86.6) |
| Sugar-sweetened beverages | 88.7 (83.5; 93.9) |
34.7 (27.6; 41.8) |
42.2 (35.9; 48.4) |
46.1 (40.8; 51.5) |
93.0 (83.4; 102.7) |
203.5 (188.3; 218.7) |
| Fast foods | 40.3 (38.1; 42.5) |
12.5 (10.1; 15.0) |
16.6 (14.5; 18.7) |
23.6 (21.1; 26.1) |
39.5 (35.9; 43.2) |
97.3 (90.3; 104.4) |
| Sauces | 1.7 (1.5; 1.9) |
0.3 (0.1; 0.4) |
0.3 (0.2; 0.5) |
0.5 (0.4; 0.7) |
0.8 (0.7; 1.0) |
5.7 (4.8; 6.6) |
| Cheeses | 6.1 (5.6; 6.7) |
2.3 (1.8; 2.8) |
2.9 (2.5; 3.4) |
4.2 (3.6; 4.9) |
6.5 (5.4; 7.5) |
13.2 (11.4; 15.0) |
| Inversely loaded food groups (g/day) † | ||||||
| Rice | 141.1 (137.8; 144.5) |
244.8 (235.8; 253.8) |
149.0 (143.3; 154.7) |
126.2 (120.9; 131.4) |
114.1 (109.4; 118.8) |
88.5 (84.2; 92.8) |
| Beans | 188.1 (183.3; 192.9) |
415.1 (403.8; 426.4) |
220.1 (213.5; 226.6) |
152.4 (146.3; 158.5) |
113.6 (107.9; 119.3) |
76.3 (71.6; 81.1) |
| Vegetables | 48.1 (46.2; 50.0) |
75.5 (70.1; 80.9) |
57.0 (53.2; 60.8) |
47.8 (43.6; 52.0) |
38.1 (35.4; 40.8) |
27.8 (25.6; 30.0) |
| Water | 1231.8 (1205.4; 1258.2) |
1530.2 (1467.0; 1591.4) |
1334.8 (1279.9; 1389.7) |
1208.4 (1159.5; 1257.4) |
1124.4 (1082.5; 1166.3) |
1022.5 (980.4; 1064.6) |
| Fruits | 65.5 (62.5; 68.5) |
113.7 (104.3; 123.0) |
83.4 (77.0; 89.8) |
61.8 (56.7; 68.9) |
47.8 (43.4; 52.2) |
30.9 (27.6; 34.2) |
† Food groups retained in the ED-LF dietary pattern with factor loadings ≥ |0.15|.
Table 3.
Distribution (%; 95% confidence interval) of adults (20-59 years old) according to sociodemographic variables and quintiles of energy-dense and low-fiber (ED-LF) dietary pattern. Brazil, National Dietary Survey, 2017-2018.
Table 3.
Distribution (%; 95% confidence interval) of adults (20-59 years old) according to sociodemographic variables and quintiles of energy-dense and low-fiber (ED-LF) dietary pattern. Brazil, National Dietary Survey, 2017-2018.
| Characteristics | All | Quintiles of the ED-LF dietary pattern | ||||
|---|---|---|---|---|---|---|
| Quintile 1 | Quintile 2 | Quintile 3 | Quintile 4 | Quintile 5 | ||
| Sex | ||||||
| Female | 50.2 |
14.1 (13.3; 15.0) |
20.2 (19.2; 21.2) |
21.9 (20.8; 22.9) |
23.0 (21.9; 24.2) |
20.8 (19.6; 21.9) |
| Male | 49.8 |
22.4 (21.3; 23.5) |
18.3 (17.2; 19.4) |
17.0 (16.0; 18.1) |
17.3 (16.3; 18.4) |
25.0 (23.7; 26.3) |
| Age (years old) | ||||||
| 20–40 | 54.6 |
19.6 (18.5; 20.7) |
21.2 (20.1; 22.3) |
19.7 (18.6; 20.8) |
19.8 (18.7; 20.9) |
19.7 (18.5; 21.0) |
| >40–59 | 45.4 |
17.1 (16.1; 18.1) |
17.6 (16.6; 18.7) |
19.3 (18.1; 20.4) |
20.5 (19.4; 21.6) |
25.5 (24.1; 26.9) |
| Area of living | ||||||
| Urban | 86.3 |
16.2 (15.3; 17.1) |
18.7 (17.8; 19.6) |
19.8 (18.9; 20.7) |
20.9 (20.0; 21.8) |
24.4 (23.3; 25.6) |
| Rural | 13.7 |
31.1 (28.9; 33.2) |
22.7 (21.2; 24.2) |
17.5 (15.9; 19.1) |
15.7 (14.2; 17.1) |
13.1 (11.6; 14.7) |
| Monthly per capita family income † | ||||||
| <0.5 | 16.1 | 23.6 (21.7; 25.5) |
22.5 (20.7; 24.2) |
20.3 (18.5; 22.1) |
18.7 (17.1; 20.4) |
14.9 (13.2; 16.6) |
| 0.5–1.0 | 24.4 | 21.5 (20.0; 23.0) |
19.8 (18.5; 21.2) |
19.4 (18.0; 20.8) |
20.3 (18.9; 21.7) |
19.0 (17.3; 20.6) |
| 1.0–2.0 | 31.3 | 17.5 (16.2; 18.9) |
19.4 (18.1; 20.8) |
18.8 (17.6; 20.1) |
18.8 (17.5; 20.2) |
25.4 (23.3; 27.4) |
| >2.0 | 28.2 |
13.1 (11.8; 14.4) |
16.7 (15.1; 18.3) |
19.8 (17.9; 21.7) |
22.5 (20.8; 24.1) |
28.0 (25.9; 30.0) |
| Being on a diet | ||||||
| Yes | 13.1 | 18.2 (16.6; 19.9) |
23.6 (21.7; 25.5) |
23.6 (21.8; 25.5) |
20.1 (18.1; 22.1) |
14.4 (12.7; 16.1) |
| No | 86.9 | 18.2 (17.4; 19.1) |
18.6 (17.8; 19.4) |
18.8 (17.9; 19.7) |
20.2 (19.3; 21.1) |
24.1 (23.0; 25.3) |
| Away-from-home food consumption | ||||||
| Yes | 47.9 |
16.3 (15.3; 17.4) |
17.5 (16.4; 18.6) |
19.1 (18.1; 20.2) |
20.8 (19.7; 22.0) |
26.2 (24.9; 27.5) |
| No | 52.1 |
20.0 (18.9; 21.1) |
20.9 (19.8; 22.0) |
19.7 (18.5; 21.0) |
19.6 (18.5; 20.7) |
19.8 (18.4; 21.2) |
| Snacking habits | ||||||
| At least one snack per day | 85.7 | 18.0 (17.1; 18.8) |
19.0 (18.2; 19.8) |
19.2 (18.4; 20.1) |
20.3 (19.4; 21.1) |
23.5 (22.5; 24.6) |
| No snacks | 14.3 | 19.9 (17.6; 22.1) |
20.8 (18.4; 23.2) |
20.8 (18.7; 23.0) |
19.7 (17.4; 21.9) |
18.8 (15.9; 21.7) |
† monthly per capita family income categorized in multiples of the country’s official minimum wage in the middle of the surveys (January 2018: US$ 298.50) [15].
Disclaimer/Publisher’s Note: The statements, opinions and data contained in all publications are solely those of the individual author(s) and contributor(s) and not of MDPI and/or the editor(s). MDPI and/or the editor(s) disclaim responsibility for any injury to people or property resulting from any ideas, methods, instructions or products referred to in the content. |
© 2024 by the authors. Licensee MDPI, Basel, Switzerland. This article is an open access article distributed under the terms and conditions of the Creative Commons Attribution (CC BY) license (http://creativecommons.org/licenses/by/4.0/).
Copyright: This open access article is published under a Creative Commons CC BY 4.0 license, which permit the free download, distribution, and reuse, provided that the author and preprint are cited in any reuse.


