
Submitted:
22 August 2025
Posted:
25 August 2025
You are already at the latest version
Abstract
Nature is a reliable laboratory to offer a rich variety of successful solutions to a broad array of scientific and engineering problems. The inspiration from nature has prompted the development of novel designs for high-performance materials and technologies. In the current work, 3D-printed specimens were fabricated from nature-inspired infill patterns such as gyroid and honeycomb. FDM printing filament was made from banana microfibers, a crop waste mixed with PLA to develop biocomposites favourable to the principles of the circular economy. For investigating the impact of infill density, raster orientation, and banana microfibre load, a Taguchi T9 design of experiment was adopted, offering nine different print conditions. Different mechanical characterizations, like tensile, flexural, compressive, impact, interfacial shear strength, and natural frequency, were conducted. Maximum tensile strength (62.45 ± 2.10 MPa), tensile modulus (5.04 ± 0.07 GPa), and natural frequency (60.36 ± 1.16 Hz) were achieved in the fourth print condition. Maximum flexural strength (79.78 ± 3.51 MPa) and compressive strength (60.73 ± 2.10 MPa) were observed for the seventh condition, whereas maximum impact strength (22.17 ± 0.83 kJ/m²) and elongation at break (1.82 ± 0.04%) were observed with the first condition. Inasmuch as the various conditions were best under different properties, the VIKOR multi-criteria decision analysis was utilized, and the third condition (50% infill density, 45° raster orientation, 9% banana fibre loading, honeycomb pattern) was found as the optimal overall. These banana-waste-based PLA biocomposites demonstrate strong potential to replace conventional materials in various industrial and engineering applications.
Keywords:
3D printing
; short fiber composite
; biocomposite
; bioinspired design
; mechanical properties
1. Introduction
Additive manufacturing (AM), particularly 3D printing, has proven to be a revolutionary technology for developing polymer composites, which can produce intricate three-dimensional (3D) polymer composite structures layer by layer [1]. Various additive manufacturing processes exist, including fused deposition modelling (FDM), binder jetting (BJ), vat photopolymerization (VP), powder bed fusion (PBF), sheet lamination (SL), material jetting (MJ), and directed energy deposition (DED) to print composite material parts. Among these numerous AM methods, FDM has come to the fore for developing natural fiber-reinforced PLA-based composites (NFRCs) and plastic-based products due to its ability to balance sustainability (eco-friendliness, biodegradability, recyclability, and low cost) with technological advantages (improved mechanical and thermal properties) and being operationally easy, cost-effective, and reliable [2,3]. FDM is carried out by extruding a thermoplastic filament from a heated nozzle to build the desired shape layer upon layer [4]. This approach has become well-applied in industrial, biomedical, and educational contexts, demonstrating its diversity and increasing applicability in various areas [5,6].
Growing international concern over the use of fossil fuel, plastic waste, and carbon emissions emphasizes the need for environmentally friendly alternatives, since plastics are predominantly fossil-based, non-biodegradable, and estimated to increase to 12,000 million tons of landfill by 2050, with 400 million tons being produced every year [7,8,9]. This has hastened the evolution of bio composites, which present the advantage of recyclability, biodegradability, strength, light weight, and cost-effectiveness [10]. With reduced impact on human health and the ecosystem, bio-based polymer and natural fiber bio-composites are substituting conventional plastics [11]. The market for natural fiber reinforced composites has exponentially increased as they have a low cost of manufacturing, easy availability, ability to meet environmental requirements, and enhanced mechanical properties. The natural fiber composites market has been valued at around $7.59 to $9.44 billion in 2024, with the forecast reaching $16.27 to $18.65 billion by 2030 at a CAGR of 11.5% to 12.0% [12]. It is propelled by rising demand from the automotive and construction industries based on a push toward sustainability and the use of green materials [13]. Plant, animal, and agro or food waste-derived natural fibers are very good reinforcements for PLA matrices in many engineering uses. Banana, coir, pineapple leaf, and rice husk fibers are obtained from agricultural and food waste and provide a green route for polymer reinforcement. With accelerated growth in agro-food waste because of increased consumption, there are serious environmental issues [14]. Agro-industrial activities produce approximately 0.14 trillion tons of biomass waste each year, set to expand by 60% by 2050, adding to toxic emissions and global warming, according to the UN [15]. Recycling or reusing these residues minimises dependence on plants and wood, reduces the use of traditional plastic, and encourages biodegradable, non-toxic, and reusable materials [16]. Of these, banana (Musa spp.) (banana pseudostem), with a production of approximately 119 million tonnes worldwide, is one of the most important producers of agro waste. India alone produces 29 million tonnes every year, which is generated in vast quantities as residues. Four tonnes of waste are produced from each tonne of harvested banana fruit, and this is primarily pseudostem, which is the major source for fiber extraction. Instead of providing this waste to rot and contaminate, the use of banana fibers in polymer composites provides a sustainable option that converts waste into value while enabling year-round, renewable fiber crop production without damaging ecosystems [17,18]. PLA, a biopolymer produced from renewable vegetable sources such as maize and potatoes, is emerging as a sustainable alternative to petroleum-based plastics [19]. In recent years, PLA has attracted considerable attention for use in packaging, electronics, and automotive applications [20]. It acts as an environmentally friendly matrix, replacing non-biodegradable petroleum-derived polymers [21]. PLA provides excellent printability, high strength, and biocompatibility [22]; however, it still faces challenges in 3D printing, including brittleness and limited structural integrity [23].
Significant research has been dedicated to developing bamboo fiber (BF) and PLA-based fiber composites, with a focus on diverse processing approaches and their influence on the final properties of the material. PLA reinforced with natural fibers (NF) has been shown to deliver mechanical performance that is often comparable to, or better than, that of PLA reinforced with synthetic fibers [24,25]. Komal et al. [26] examined BF–PLA composites and demonstrated that variations in molding techniques alter fiber dispersion and alignment, which in turn affect the mechanical response. Improvements in PLA compatibility and stability have been achieved by incorporating surface-treated BF into the PLA matrix through melt mixing. Multiple studies have reported the fabrication of PLA–BF biocomposites via melt compounding [27]. Asmawi et al. [28] worked on starch/PLA blend bionanocomposites reinforced with sugar palm nanocellulose fibers, noting that higher starch content reduced mechanical performance due to starch brittleness. Suryanegara et al. [29] produced PLA nanocomposites reinforced with microfibrillated cellulose using solvent blending and hot pressing, where dichloromethane effectively dissolved semi-crystalline PLA. Satriyatama et al. [30] developed PLA–wheat bran composites, while Depuydt et al. [31] incorporated plasticizers with bamboo and flax fibers into PLA, finding that long bamboo fibers enhanced stiffness. Stoof et al. [32] reinforced PLA with hemp and harakeke fibers, recommending the addition of plasticisers for improved properties. Felix et al. [33] combined jute and hemp fibers in equal proportions with PLA via compression molding. Jia et al. fabricated PLA–microcrystalline cellulose composites through melt extrusion, whereas Ye et al. [34] employed twin-screw extrusion to prepare PLA/polycaprolactone/microcrystalline cellulose systems. Wasti et al. [35] produced PLA–lignin composite filaments and observed that 5 wt% lignin retained tensile strength, while higher loadings caused deterioration. Tao et al. [36] studied wood flour-filled PLA for additive manufacturing, identifying changes in microstructural characteristics. Suteja et al. [37] demonstrated that continuous pineapple leaf fibers could improve PLA tensile strength in 3D printing applications. Vigneshwaran et al. [38] investigated the effects of printing parameters such as layer height, infill density, and pattern on PLA/wood composite performance. Ahmed et al. [39] developed PLA composite filaments reinforced with cellulose nanocrystals, showing tensile strength improvements at 0.75–1 wt% loading, with a decline at 2 wt%. Kumar et al. [40] explored PLA-based composite filaments for multi-material printing, noting a reduction in mechanical strength with increased filler content. Banana-PLA is one of the feasible biocomposite filaments in 3D printing. Literature reports indicate that incorporating banana microfiber into PLA improves its mechanical properties while also contributing to a reduction in the carbon footprint of the printed parts. However, the addition of banana particles increases the viscosity of the composite, often leading to nozzle clogging during the printing process. Furthermore, several challenges have been noted, including inconsistency in mechanical properties and weak interfacial bonding. Additional issues associated with natural fibers include their hydrophilic nature and poor interaction with the polymer matrix. These problems can be mitigated through chemical treatment of the fibers or the use of suitable coupling agents [41,42].
Despite the growing trend of research in additive manufacturing, much of the current literature focuses primarily on conventional engineering infill patterns. In contrast, the application of bioinspired designs in 3D printing is an emerging area within structural engineering, drawing inspiration from patterns found in nature, such as fish scales and bone structures [43]. These natural patterns have been shown to enhance mechanical performance while reducing the overall weight of printed components. Studies have indicated that incorporating such geometries as infill designs can significantly improve the strength, energy absorption, and structural integrity of printed parts. Among these, honeycomb and gyroid patterns have gained particular attention due to their superior strength-to-weight ratio [44,45]. These bioinspired infill structures also contribute to enhanced flexibility, impact resistance, and energy dissipation in 3D printed components [46].
Numerous studies have explored the use of bioinspired patterns in polymer-based materials, demonstrating their potential for a wide range of high-performance engineering applications. However, a significant research gap exists concerning the 3D printing of biocomposites with complex, nature-inspired geometries. This study addresses that gap by developing environmentally friendly composites through the reinforcement of polylactic acid (PLA) with micron-sized banana fiber. The banana-PLA filament was fabricated with three filler loadings: 3%, 6%, and 9%. 3D printing was conducted at three different infill densities (50%, 75%, and 100%) and with varying raster angles of 0°, +45°, and ±45°. Three infill patterns were used to fabricate the samples: two bioinspired structures, gyroid and honeycomb and one conventional linear (rectilinear) pattern. To minimise the number of experimental trials, the Taguchi T9 design of experiments method was implemented, resulting in the fabrication of nine distinct samples, each printed under different parameter combinations. Mechanical characterization was carried out for all the samples. To identify the most suitable configuration among the alternatives, the VIKOR multi-criteria decision-making method was applied. The comparative analysis indicates that the developed banana-PLA composites exhibit promising properties for advanced engineering applications.
2. Materials and Methods
2.1. Materials
Bio based polylactic acid (PLA) pellets (4043D; Nature Works; USA) were procured from Srushti Global, Maharashtra, India. Banana fiber (BF), the reinforcing filler, was purchased from Fiber Region, Chennai, India. The sodium hydroxide pellet (NaOH) and acetone, for chemical treatment of banana fiber, were procured from Merck Life Science Private Limited, India and were supplied by Sri Durga Laboratory Equipment Supplies, Chennai, India, with a stated purity of 99% and are used for treatment.
2.2. Chemical Treatment and Development of Banana Microfiber
The alkali treatment of the banana fibers was performed with a 5% (w/v) sodium hydroxide (NaOH) solution to increase surface properties and interfacial adhesion with the PLA matrix. The NaOH solution was made by dissolving 5g of NaOH pellets in 100 mL of distilled water at room temperature. This was mixed on a magnetic stirrer at 750 rpm for about 5 to 8 minutes to get a complete dissolution as well as homogeneity. After getting the solution ready, banana fibers were kept immersed in the 5% NaOH solution, and the beaker was put on a magnetic stirrer kept at 48°C with a stirring speed of 430 rpm kept constant. The fibers were left in the alkali bath for 8 hours to permit efficient removal of amorphous and non-cellulosic material like lignin, hemicellulose, wax, and other surface impurities. After the treatment time, the fibers were washed several times with distilled water and then rinsed using acetone to remove trace amounts of alkali and low molecular weight organic material. The treated fibers were further dried in a hot air oven at 65 °C for 24 hours to desiccate and finalise the process of chemical modification. The chemically modified fiber was then put into a grinder and ground for 15 to 20 minutes [47,48]. After that, the ground fiber was sieved using a sieve range of 150µm and collected for blended with PLA pellets.
This alkali treatment modifies the surface of the fibers by dissolving hydrogen bonds in the network structure, enhancing surface roughness, and improving fiber crystallinity. The basic mechanism of surface modification is the dissociation of NaOH into Na⁺ and OH⁻ ions. On immersion, these ions react with the hydroxyl groups of the cellulose in banana fibers, causing removal of the non-cellulosic material and contributing to a cleaner and more reactive fiber surface. This chemically modified cellulose tends to be more crystalline and thermally stable, favouring better compatibility with the polymer matrix in composite applications [49,50].
2.3. PLA and Banana Microfiber Composite Filament Making
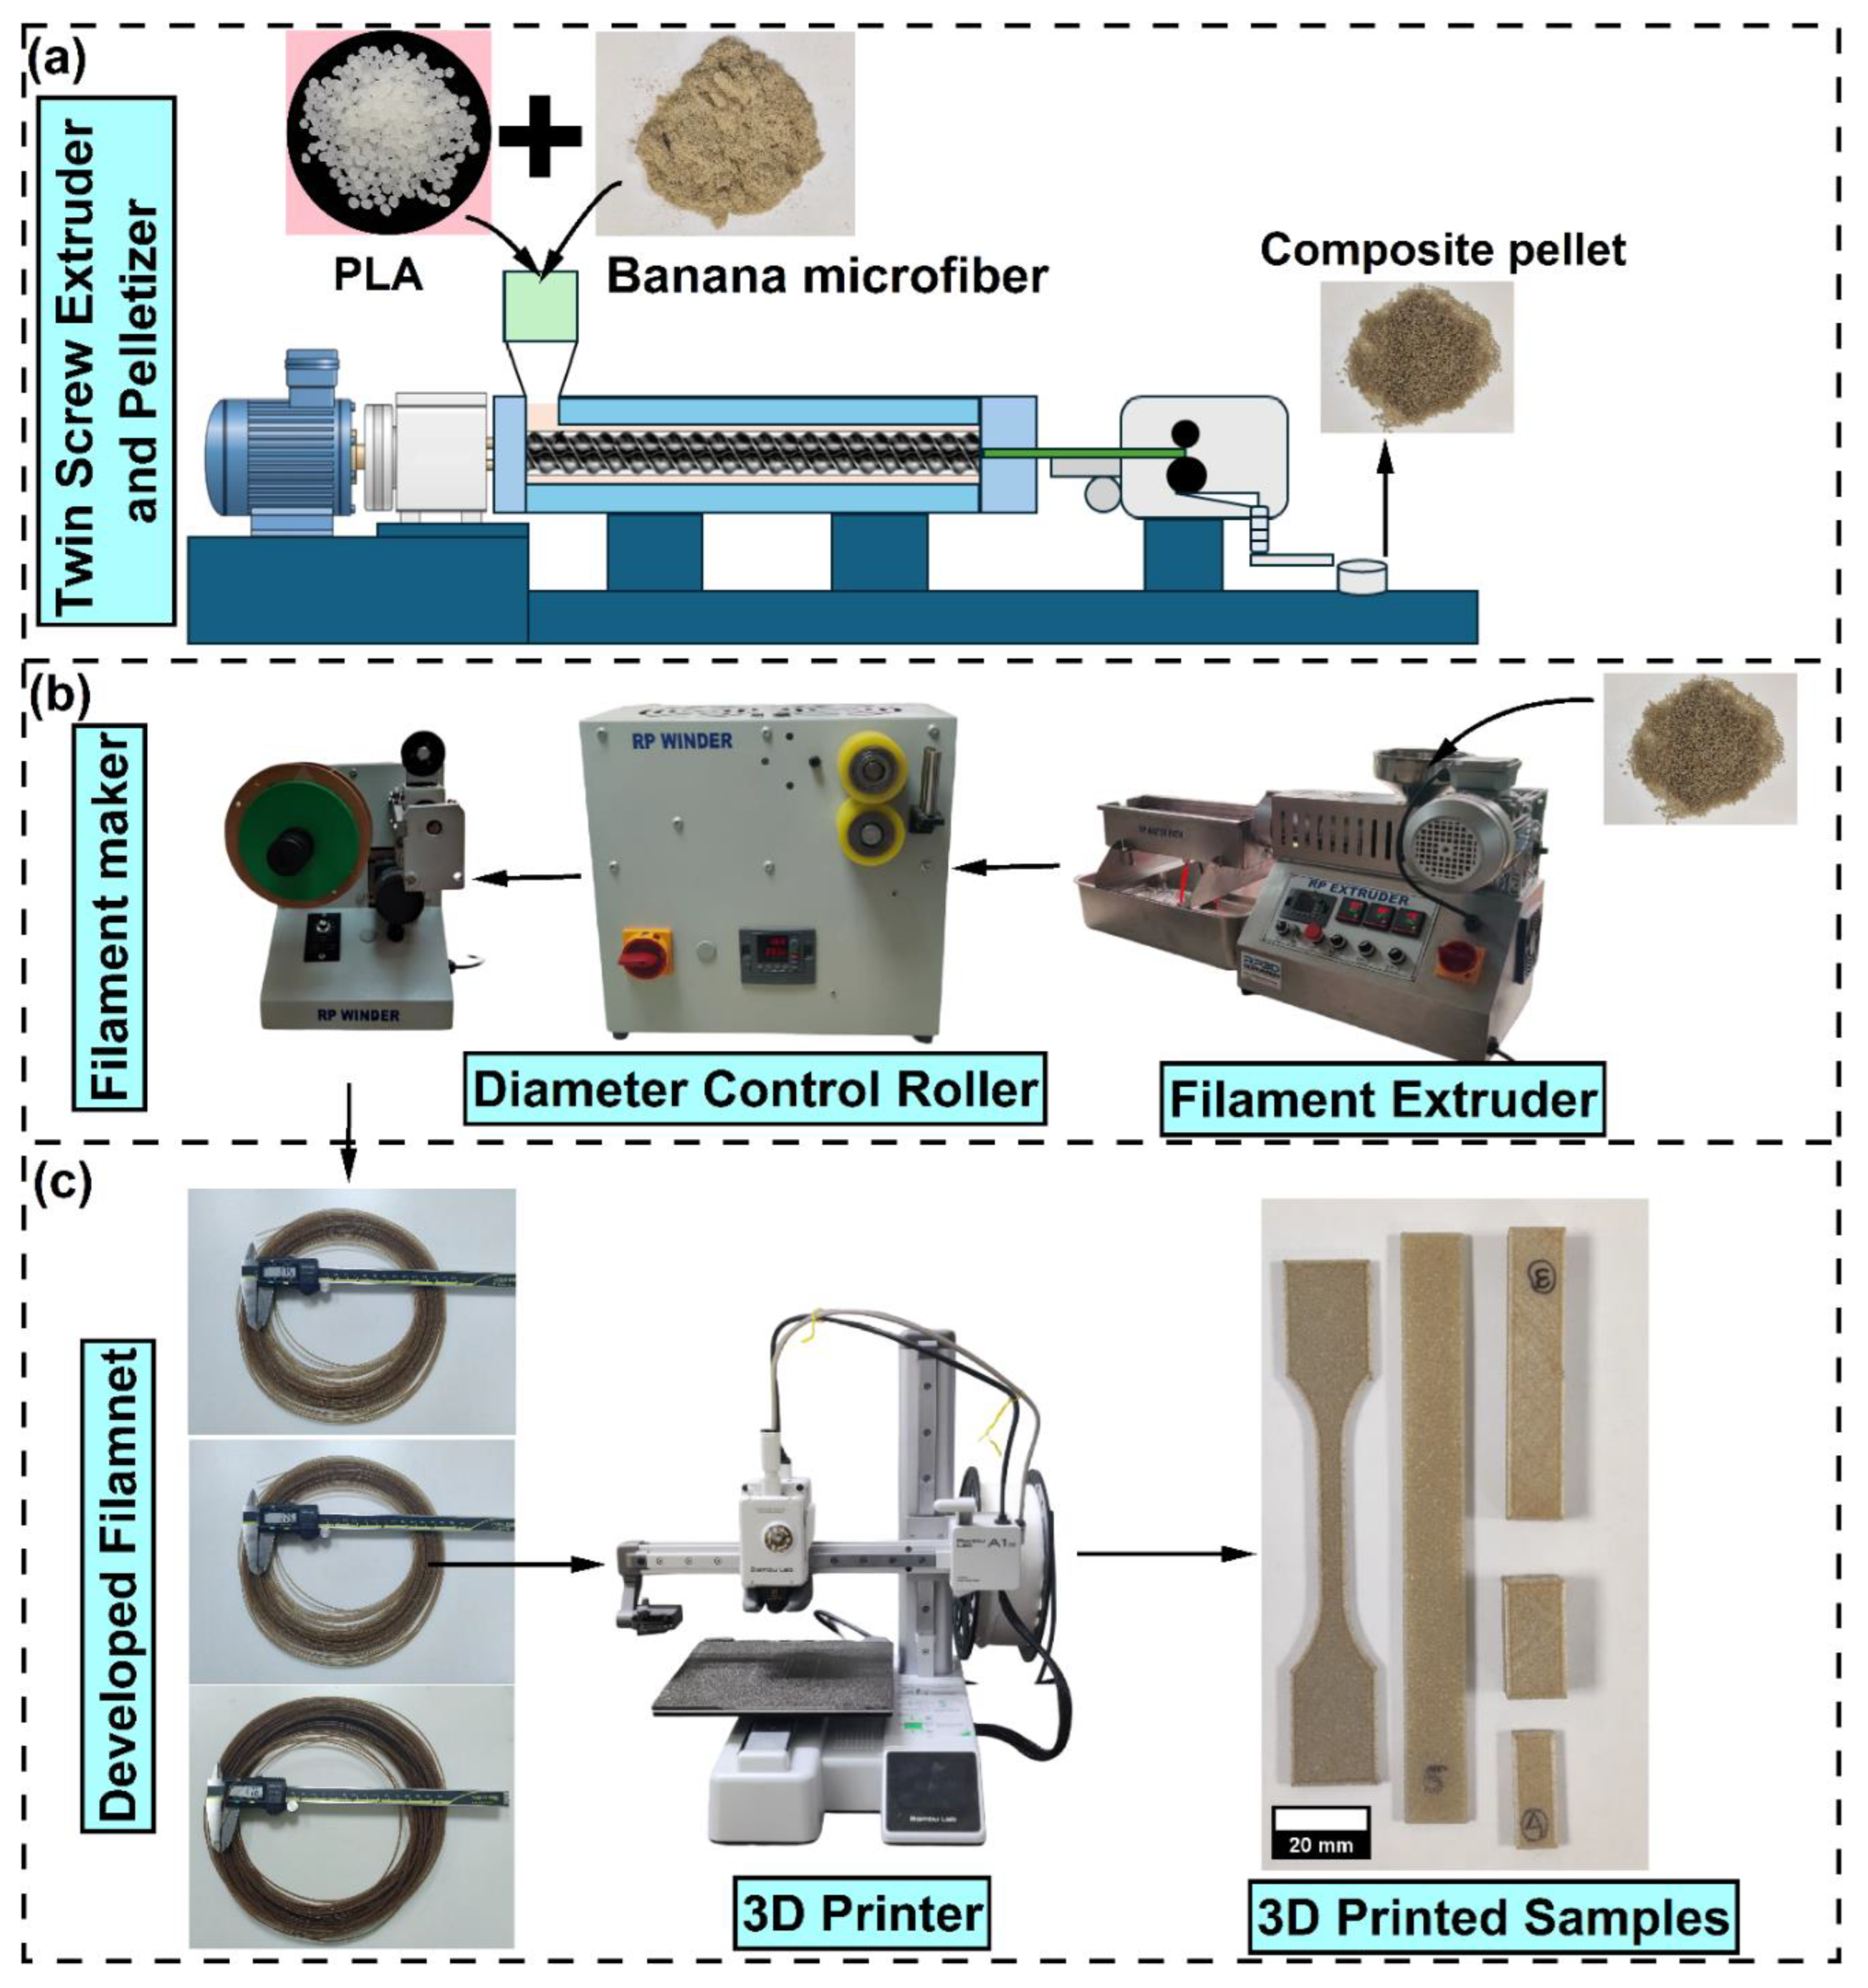
A twin-screw extruder (Model: FUE-1MI, FLYTECH ENGINEERS, Chennai, India) was used to blend the banana microfiber of three different weight fractions (3%, 6% and 9%) with PLA polymer. The twin extruder has four heating zones (feeding zone, melting zone, mixing zone and discharge zone). The blending process was carried out with the following temperature settings: 170°C at the feeding zone, 210°C at the melting zone, 190°C in the mixing zone, and 200°C at the discharge zone. The twin screw extruder used for this process had a length-to-diameter (L/D) ratio of 25:1 and a compression ratio of 2.5:1. The screw rotation speed was maintained at 60 rpm, and the material was fed at a rate of 20 grams per minute. The discharge nozzle diameter was used of 2 mm, and discharged blended material was then cooled down in air and put into a pelletizer machine to convert it into composite pellets. Following pelletization, the composite pellets were preheated to 45°C and then fed into a 3D printer filament maker (manufacturer: RP Extruder, Chennai, India). This equipment consists of a single screw extruder integrated with a roller and filament winder. During extrusion, the barrel temperature was maintained between 150°C and 180°C, and the feeding rate was set at 25 g/min. The extrudate exited through a nozzle with a diameter of 1.8 mm and was immediately passed through a water bath to facilitate cooling. Subsequently, the cooled filament was guided through the roller and collected by the filament winder. As a result, a composite filament suitable for 3D printing was produced, with a final diameter of 1.75 ± 0.1 mm. Figure 1a,b show the use of a twin-screw extruder for preparing composite pellets and a filament maker for producing composite filaments, respectively. Figure 1c displays the developed filaments, the 3D printer used for printing them, and the various 3D-printed samples prepared for testing.
2.4. 3D-Printing of Composite Filament
The Fusion 360 (student version) was used to design different ASTM standards for 3D printing. The CAD models were imported into Bambu Studio was used to slice and generate G code for the CAD models. The Bambu Lab A1 mini 3D printer was used to print the different CAD models using bio-composite filaments. To investigate how different parameters, including bio-inspired infill pattern, infill density, infill direction, and banana filler content, affect the mechanical properties of 3D-printed parts, the Taguchi L9 orthogonal array design was used. The levels of varied parameters are presented in Table 1. The experimental design was formulated with Minitab software (student version) by following the Taguchi method, as shown in Table 2. For a reduced number of trials in comparison to the full factorial approach, Taguchi methodology provides a more efficient method for the identification of major influencing parameters, hence reducing experimental effort and cost [31].
Figure 1.
(a) Twin-screw extruder, (b) RP filament maker used in the present experiment, (c) developed composite filament along with Bambu lab 3D printer and 3d Printed sample for different testing .
Figure 1.
(a) Twin-screw extruder, (b) RP filament maker used in the present experiment, (c) developed composite filament along with Bambu lab 3D printer and 3d Printed sample for different testing .
In the present investigation, an L9 orthogonal array was utilised to vary the chosen input parameters systematically. In order to ensure experimental consistency, some process parameters were fixed in all trials. These parameters are printing temperature, nozzle diameter, bed temperature, thickness of top and bottom layer, shell thickness, initial layer height, initial line width, retraction speed, and retraction distance. The values of these fixed parameters are listed in Table 3. The different infill patterns inside 3D printed samples are presented in Figure 2.
Figure 2.
Different bioinspired infill patterns inside 3D printed samples.
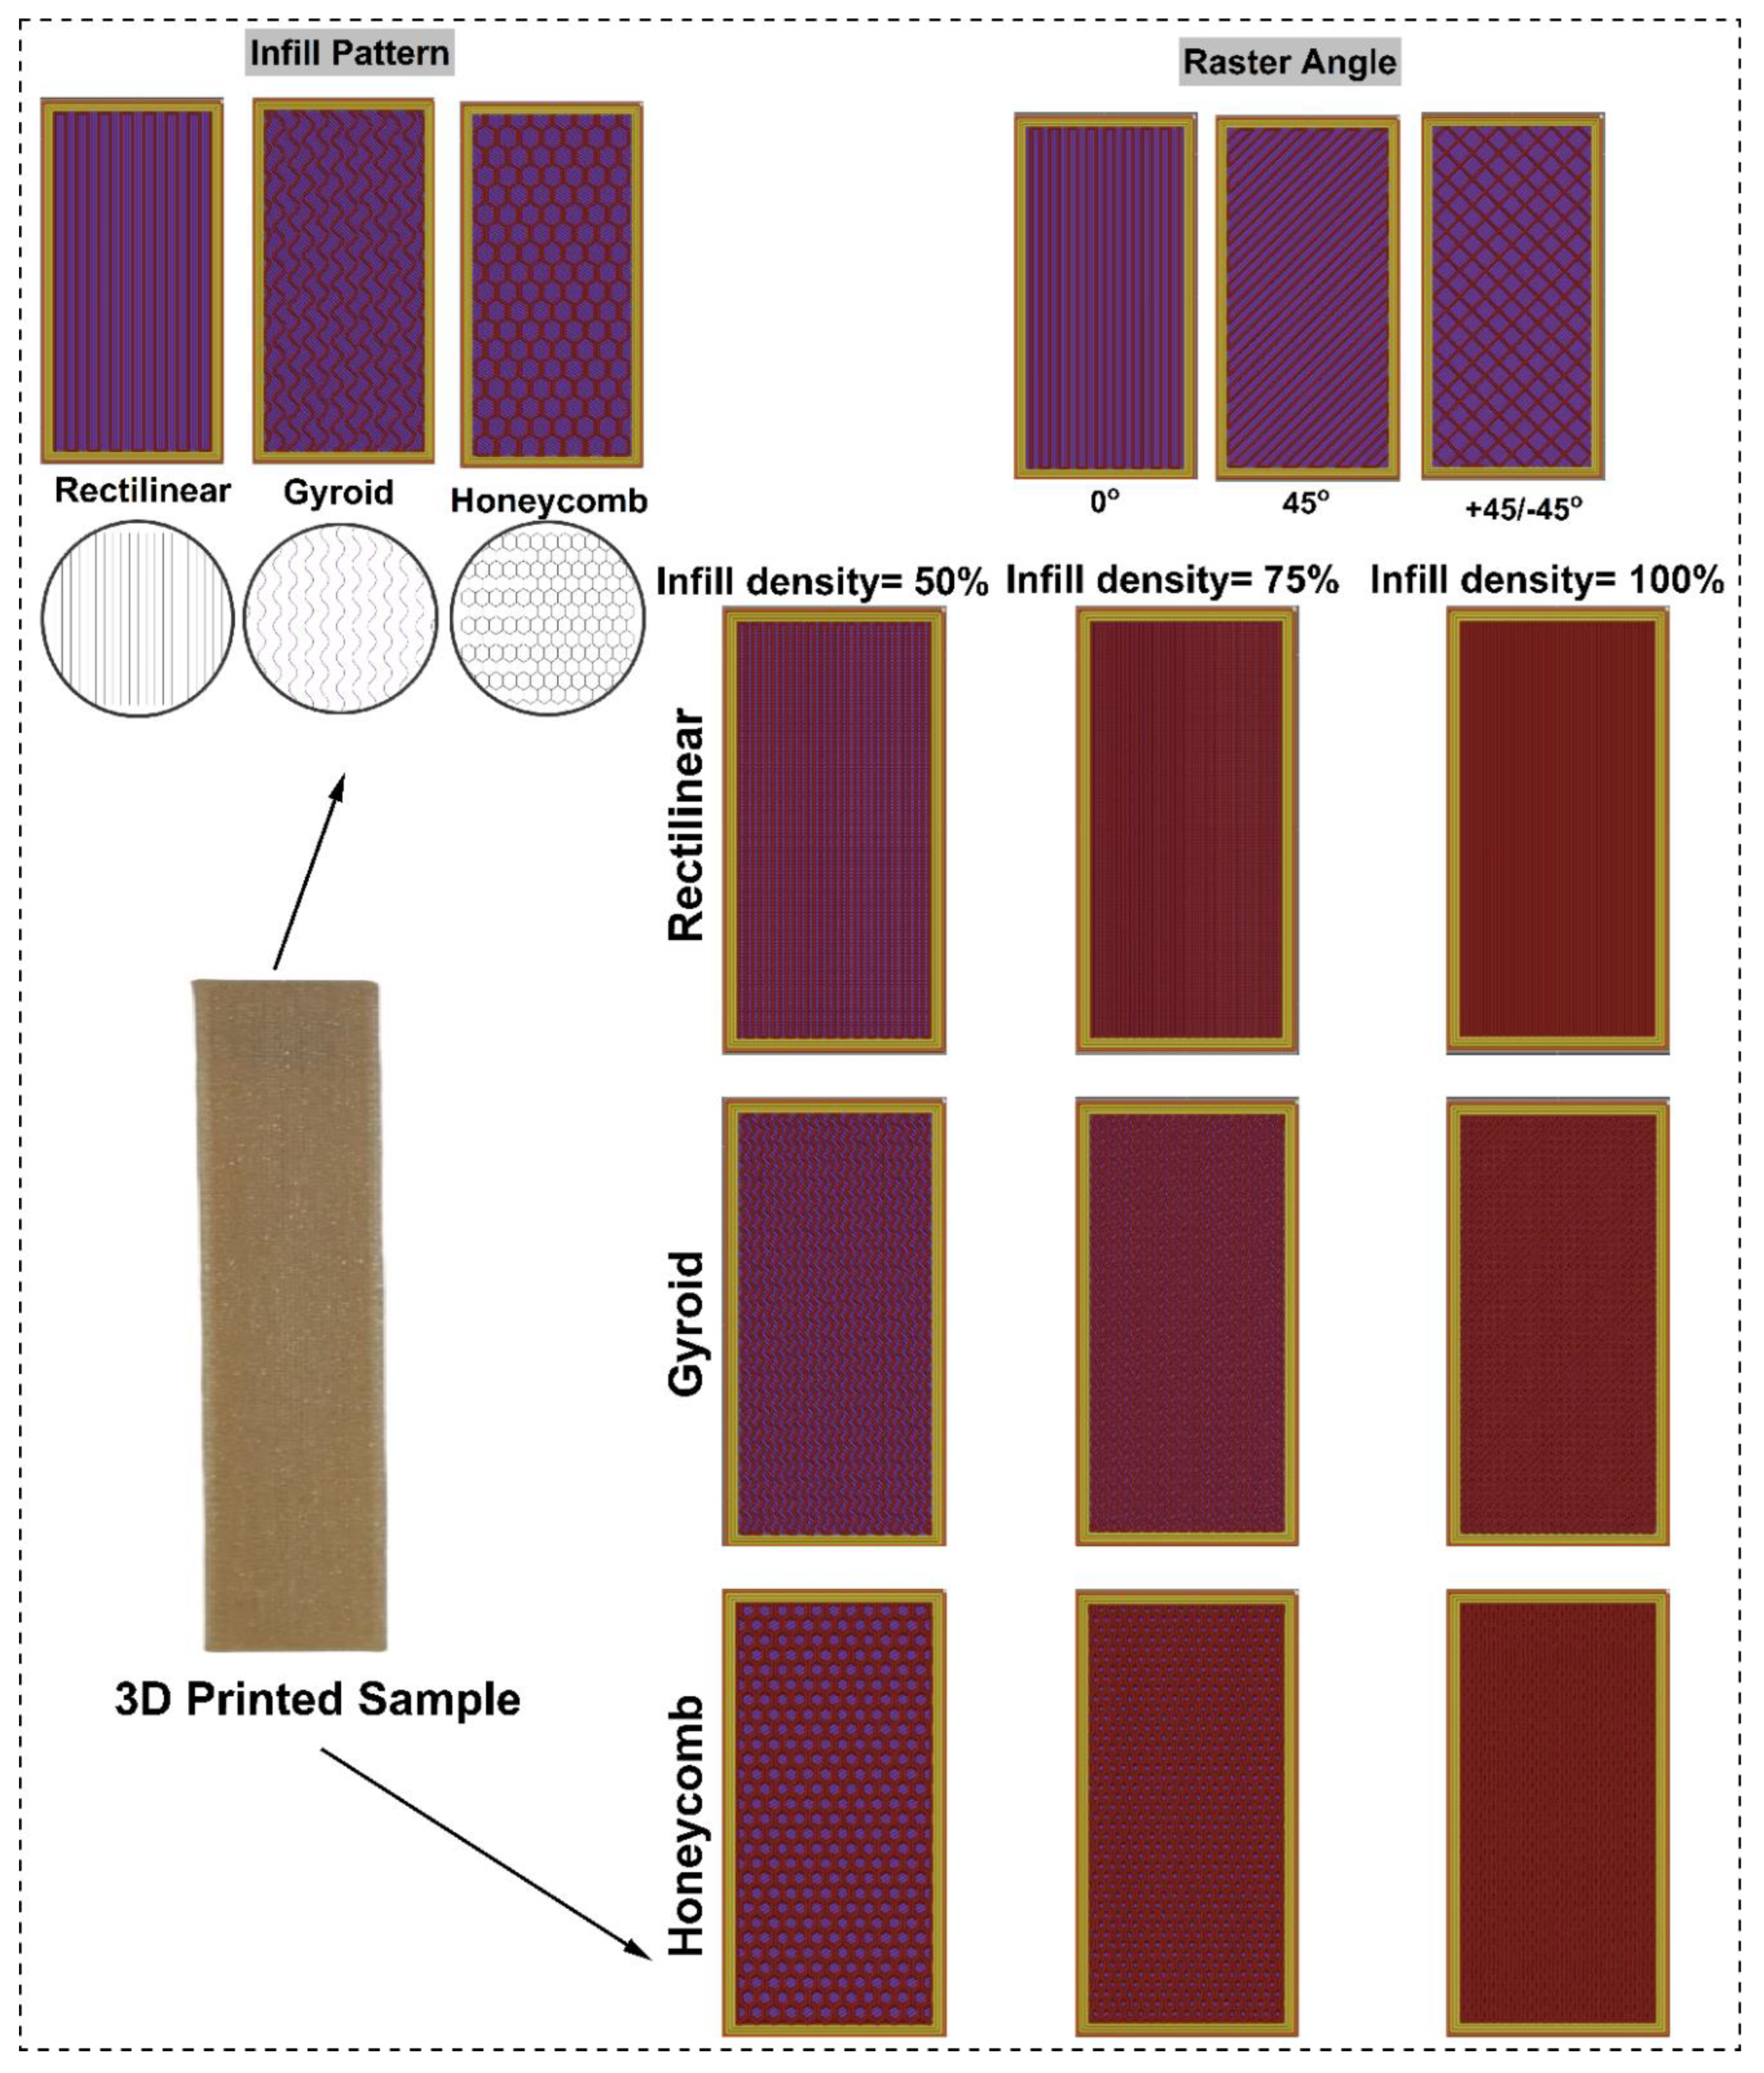

Table 1.
Level of varied parameters.
| Printing parameter or reinforcing parameter | Level | ||
| 1 | 2 | 3 | |
| Infill density (%) | 50 | 75 | 100 |
| Raster Angle (°) | 0 | 45 | -45/+45 |
| Infill pattern | Rectilinear | Triangular | Honeycomb |
| Filler density (%) | 5 | 10 | 15 |
Table 2.
Taguchi L9 orthogonal array of DOE.
| Experiments | Infill density (%) | Raster Angle (°) | Infill pattern | Filler density (%) |
| Exp-1 | 50 | 0 | Gyroid | 3 |
| Exp-2 | 50 | 45 | Rectilinear | 6 |
| Exp-3 | 50 | +45/-45 | Honeycomb | 9 |
| Exp-4 | 75 | 0 | Rectilinear | 9 |
| Exp-5 | 75 | 45 | Honeycomb | 3 |
| Exp-6 | 75 | +45/-45 | Gyroid | 6 |
| Exp-7 | 100 | 0 | Honeycomb | 6 |
| Exp-8 | 100 | 45 | Gyroid | 9 |
| Exp-9 | 100 | +45/-45 | Rectilinear | 3 |
Table 3.
Constant parameters for 3D printing.
| Parameters | Units | Value |
| Nozzle size | mm | 0.4 |
| Shell thickness | mm | 0.4 |
| Top/bottom layer thickness | mm | 0.6 |
| Initial layer height | mm | 0.1 |
| Layer thickness | mm | 0.12 |
| Bed temperature | °C | 55 |
| Printing temperature | °C | 190 |
| Printing speed | mm/sec | 50 |
2.5. Characterisation of Treated and Untreated Banana Microfiber
Chemically treated and untreated banana fibers were analysed by X-ray diffraction (XRD), scanning electron microscopy (SEM), and thermogravimetric analysis (TGA). Scanning electron microscopy (FESEM) (Carl ZEISS EVO 18-Germany) was used to study the morphological changes caused by chemical treatment, and the fiber size (length and diameter) was measured using ImageJ software. The effect of treatment on the crystalline structure of the fibers was studied employing a BRUKER D8 Advance X-ray diffractometer (RIGAKU and MINIFLEX 6G BENCHTOP) with Cu-Kα radiation (wavelength 1.542 Å), at 15 mA and 40 kV. XRD patterns were obtained at the scanning speed of 2°/min with a step of 0.02° over a 2θ range of 10°–60°. Crystallinity index and crystallite size were calculated with the Ruland–Vonk method (Eq. 1) and Scherrer's equation (Eq. 2), respectively. Thermal stability of untreated and treated fibers was analysed by TGA, conducted under nitrogen atmosphere from room temperature (25°C) to 600°C with a constant heating rate of 10°C/min.
Here, %Cr denotes the crystallinity index, AT represents the total area under the XRD curve, and AAm refers to the area corresponding to the amorphous region.
CS donates for crystalline size. K, λ, β and θ stand for Scherrer’s constant, wavelength of radiation, full-width half maximum of the peak and Bragg angle, respectively [51].
2.6. Characterisation of Composite Filament
Thermal properties and viscoelastic properties of the developed filament were analysed by performing Differential Scanning Calorimetry (DSC) and viscosity analysis, respectively. Differential scanning calorimetry (DSC) was conducted on PLA and PLA composites with 3%, 6%, and 9% banana fiber with a TA Instruments (SETARAM Model: Setline) in non-isothermal mode and a heat–cool–heat cycle. Around 8–10 mg samples were put in aluminium pans, with an empty aluminium pan used as the reference. The initial heating run was carried out from room temperature to 200 °C at a heating rate of 10 °C/min to remove the thermal history of the samples. The samples were maintained at 200 °C for 2 min, then cooled to −70 °C at a cooling rate of 10 °C/min. A second cycle was then carried out from −70 °C to 180 °C at the same heating rate. Nitrogen purge gas was kept constant at 50 mL/min during the experiment to avoid oxidative degradation. From the DSC graph, the glass transition temperature (Tg), crystalline temperature (Tc) and melting temperature (Tm) were determined. The crystallinity percentage of the filament (Xc) was computed according to Eq. 3.
is the heat of fusion from DSC, ϕ is the weight fraction of the polymer in the mixture, and is the melting enthalpy of a 100% crystalline polymer (93.7 J/g for PLA4043D) [52].
The rheological behaviour of developed different composite filaments and PLA were studied using a strain-controlled Anton Paar modular compact rheometer (MCR502 Twin Drive). At the linear viscoelastic (LVE) region of materials, a constant strain of 1% was used to perform the dynamic frequency sweep test at angular speeds from 100 to 0.1 rad/s. The rheological tests were performed in the dynamic oscillatory mode at a temperature of 190°C.
2.7. Characterization of 3D Printed Composites
The printed composites were evaluated through tensile, flexural, compression, impact, natural frequency, and interlaminar shear strength tests. For each type, three samples were tested under different conditions, and the mean values along with the standard deviations are reported. A universal testing machine (Instron 3365, Norwood, MA, USA) with a 5 kN load cell was used to determine the tensile and flexural properties of the 3d printed composites. Tensile testing was conducted with ASTM D638 (Type IV) [53] at a crosshead rate of 1 mm/min. Flexural properties were determined according to ASTM D790 [54] standards at a crosshead speed of 1 mm/min. The flexural load and displacement were recorded from the machine, and flexural strength, flexural modulus and flexural strain have been calculated by using equations 4, 5 and 6, respectively.
In this context, , , and represent the flexural strength, flexural modulus, and flexural strain, respectively. denotes the flexural load, L is the span length, t is the specimen thickness, b is the specimen width, δ indicates the deflection, and corresponds to the slope of the load–deflection curve. The compressive properties and interlaminar shear strength properties of the 3D-printed composite specimens were tested using a Kalpak Universal testing machine (KIC-2-0200-C, Pune, India), equipped with a 20 kN load cell. The compressive samples were printed as per the ASTM D1621 [55] standard (l wh=12.525.512.5mm) and samples for the short beam shear test have been printed as per ASTM D1184 [56]. The compression testing of the sample has been done up to 30% of the sample’s height with a crosshead speed of 1mm/min, and load displacement data has been recoded from the machine. Compressive strength was calculated by the applied load divided by the original horizontal cross-sectional area of the specimen. For the short beam shear test, a span length of 18 mm was used, with the crosshead speed maintained at 1 mm/min. The load-displacement data was recorded during the test. The short beam strength or interlaminar shear strength has been calculated by using equation 7.
P stand for breaking load in N, whereas b and d stand for width and depth of the tested samples in mm. Notched Izod impact strength was determined by a Zwick/Roell HIT25P impact tester (5 J capacity) under ASTM D256 conditions [57]. The vibration test was performed on a 3D-printed specimen (120 × 12 × 3 mm) to determine its first natural frequency. An input signal from a waveform generator (Agilent 33220A) was amplified using a power amplifier (HBK Type 2732) and fed to a modal exciter (HBK Type 4824) to induce vibration. Out-of-plane tip displacement was measured using a laser displacement sensor (optoNCDT 1700, Micro-Epsilon) positioned at the free end of the cantilever sample. The sensor output was collected via a DAQ module (NI 9239, National Instruments) and recorded in real time. The displacement data was processed in MATLAB using FFT to extract the first natural frequency from the resonance peaks.
2.8. Optimising Printing Parameters Using the MCDM Technique
In this study, a multi-attribute decision-making (MADM) approach was employed to optimize the 3D printing parameters for enhanced mechanical performance. Among various MADM methods, the VIKOR technique was selected, as it enables ranking of alternatives based on their proximity to the ideal solution while considering both the best and worst possible outcomes [58]. The decision matrix was formulated using experimental data obtained from Taguchi L9 design of experiments, incorporating multiple mechanical properties of the printed samples. To ensure unbiased evaluation, the weight of each criterion was determined using the Shannon entropy method, eliminating subjective influence. The normalized decision matrix was then constructed to remove the effect of differing units of measurement, allowing a fair comparison across parameters. This systematic approach enabled the identification of the most suitable printing parameter combination for achieving optimal mechanical performance in the 3D printed composite.
2.8.1. Shannon Entropy Method
Entropy weights are calculated according to steps that have been established and verified by different scientists to calculate the weight of certain parameters. Weighting findings indicate that the higher value is better than the lower one. The process of calculating weight utilized in this essay is as follows [59,60]:
Step-1: Development of decision matrix, D, as in equation (8).
Here
Step-2: Normalization of decision matrix, Nij as per equation (9)
Step-3: Calculation of entropy value, Ej as per equation (10)
where k= here m is number of alternatives
Step-4: Calculation of weightage () of different criteria using equation (11).
2.8.2. VIKOR Process
VIKOR (VlseKriterijumska Optimizacija I Kompromisno Resenje) is a multi-criteria decision-making method designed to identify the best alternative by considering both the closeness to the ideal solution and a compromise between conflicting criteria. It is particularly effective in problems where trade-offs between multiple performance measures are required. The step of the process is as follows [58,61]:
Step-1: Normalization of the decision matrix using equation (12).
Here
Step-2: Standardized value of weightage is calculated by using equation (13).
Here
Step-3: Subsequently, equations (14) to (17) are applied to determine the positive and negative ideal solutions
Step-4: Thereafter, the equations (18) and (19) are used to calculate regret measurement and utility calculation for each solution, which is non-dominated
Here and are . Equation (20) was further used to calculate the VIKOR index. The lower the VIKOR index, prefer the alternative.
is stand for the weighting factor varied between [0 and 1].
Step-5: In the last step, the sensitivity analysis has been done with the difference value starting from 0 to 1 with an interval of 0.1.
3. Results and Discussion
3.1. Characterization of Banana Microfiber
The morphology of chemically treated and untreated banana microfibers was observed using a scanning electron microscope (SEM). Figure 3ab show the surface and structure of untreated banana fibers. The untreated fibers have a wax coating [47,48] and surface impurities that can form weak Van der Waals bonds with the PLA matrix. Such weak binding limits the load transfer from the matrix to the fiber, resulting in poor mechanical properties of the resulting composite. Due to chemical treatment, the wax and impurities from the microfiber’s surface have been removed and increase the surface roughness [47,51], which enhances mechanical interlocking and interfacial adhesion between the PLA matrix and banana fibers. This may effectively enhance the thermo-mechanical properties of the biocomposite. Similar observation was reported by Saha and Kumari in their research work on the study of bamboo–epoxy composites. Figure 3c,d show the distribution curve and average value of the diameter and length of the treated banana microfiber. The average length and diameter of the treated fiber have been recorded as 111.6±33.8 µm and 51.0±19.0 µm, respectively. The average diameter of the untreated banana fiber was measured as 63.8±29.3 µm. Alkaline treatment penetrates the fiber cell walls, leading to fragmentation during washing, drying, or subsequent processing. Further, the NaOH treatment removes hemicellulose and lignin from the fibers, leading to cell wall collapse or shrinkage and lumen diameter reduction [62]. The effect of chemical treatment on the crystalline nature of banana fibers was further examined by using X-ray diffractometry (XRD). XRD patterns of the untreated and treated fibers are shown in Figure 3e. In both cases, three prominent crystalline peaks were observed at 2θ = 15.8°, 22.3°, and 35.8° corresponding to the (110), (002), and (004) planes, respectively [50,51]. These peaks are attributed to the crystalline cellulose present in the α and β forms of the banana fibers. The crystallinity index of untreated banana fibers was 48.4%, which increased to 71.84% after treatment with NaOH. This rise can be explained by the removal of non-crystalline contents such as lignin, hemicellulose, extractives, and wax, a fact also supported by the results obtained with SEM. The crystalline size of the untreated and treated banana fiber is measured as 2.4±0.8 nm and 2.8±0.4 nm, respectively. To understand the thermal stability of the treated and untreated banana fiber, thermogravimetric analysis has been performed, and thermograms are presented in Figure 3f. The thermal stability of untreated and treated banana microfiber has been assessed by monitoring weight loss over four temperature ranges. The degradation temperature data for untreated and treated microfibers are summarised in Table 4. The initial weight loss phase occurred between 25°C and 150°C, which matched the evaporation of naturally occurring moisture in the banana fiber. The second phase, between 151°C and 250°C, corresponds to the evaporation of extractives, waxes, and other impurities. The third phase, between 251°C and 380°C, was due to the degradation of cellulose, hemicellulose. The fourth phase, which occurred between 381°C and 600°C, was due to the decomposition of lignin and the highly crystalline cellulose [63,64]. From the thermogram, it is observed that the mass loss of the treated banana fiber is very less in the temperature range up to 200°C (in this range, most loss with treated microfiber is due to the presence of moisture in it). This indicates that the treated microfiber can be printed along with PLA matrix in 190 to 200°C without losing its constitution and thus mechanical properties.
Figure 3.
SEM image of (a) untreated and (b) treated banana microfiber, (c) diameter and (d) length distribution of treated fiber, (e) XRD pattern and (f) thermogram of treated and untreated fiber.
Figure 3.
SEM image of (a) untreated and (b) treated banana microfiber, (c) diameter and (d) length distribution of treated fiber, (e) XRD pattern and (f) thermogram of treated and untreated fiber.
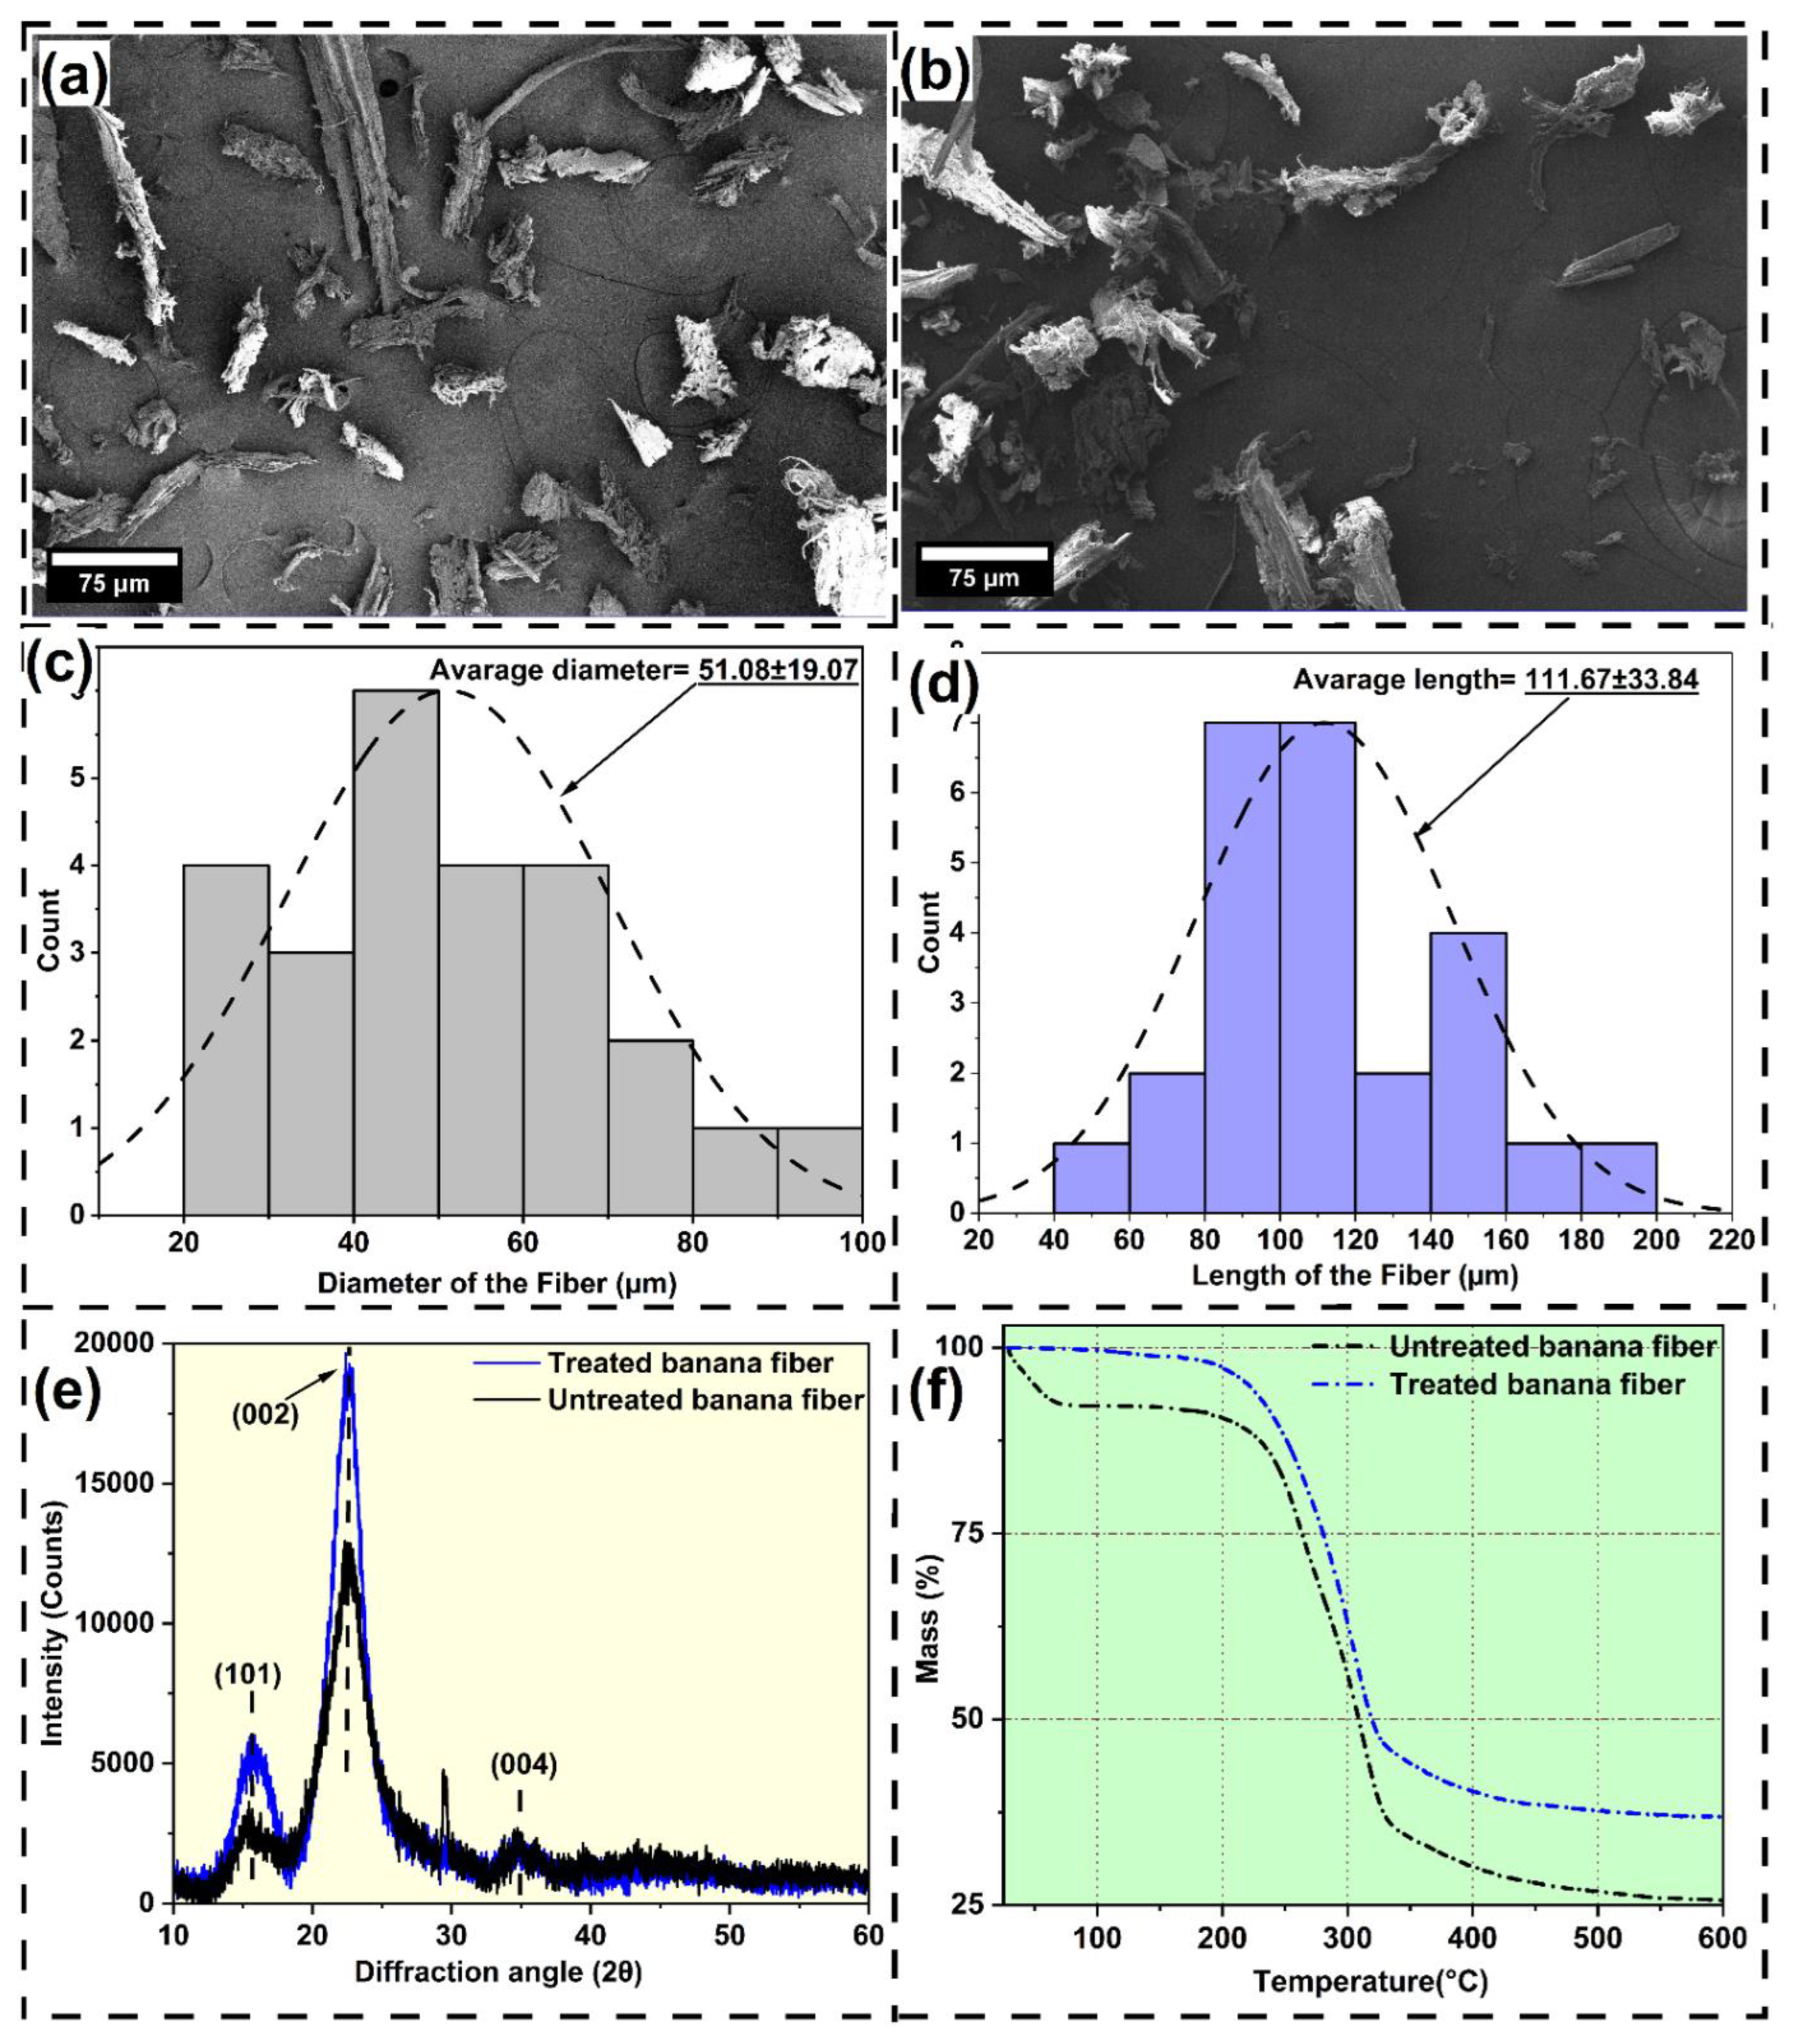
Table 4.
Thermal properties of untreated and treated banana fiber from the thermogram.
| Microfiber | Stage-I weight loss (%) | Stage-II weight loss (%) | Stage-III weight loss (%) | Stage-IV weight loss (%) | Residual mass (%) |
| Untreated Banana | 7.98 | 11.12 | 61.42 | 18.66 | 25.66 |
| Treated Banana | 1.16 | 11.03 | 52.83 | 11.05 | 36.91 |
3.2. Characterization of Banana Microfiber Blend PLA Filament
The glass transition temperature (Tg), cold crystalline temperature (Tcc), and melting temperature (Tm) of the developed PLA and PLA-banana composite filament have been determined from the DSC plot. Figure 4 represents the DSC curve, and Table 5 describes the details of the DSC curve. It has been observed that the addition of banana microfiber to PLA results in an increase in the glass transition temperature of the developed filament. For virgin PLA filament, the Tg has been recorded as 58.99°C, whereas the maximum glass transition temperature is observed as 67.99°C with 9% banana fibre loaded PLA. Banana fibers restrict the mobility of PLA polymer chains due to better interfacial adhesion. The fibers act as a physical barrier, requiring more energy (higher temperature) to initiate segmental motion. This is a sign of improved stiffness and dimensional stability at higher service temperatures. For cold crystalline temperature, there is a very slight increase with the blending of microfiber into PLA. The addition of banana fibers slightly delays cold crystallisation because fiber matrix interactions reduce chain mobility. The delay is small, suggesting fibers also act as nucleating sites that help crystals form without a significant shift in overall kinetics. With melting temperatures, the opposite trend has been observed compared to the glass transition temperature. The addition of microfiber reduces the melting temperature of the blended filament. The incorporation of microfibers disrupts the perfection of PLA crystalline regions, leading to slightly less perfect crystals that melt at a lower temperature. This is common in natural-fibre composites. Introduction of banana microfiber into the PLA matrix led to a small but steady increase in crystallinity of the filament, from 10.02% for virgin PLA to 12.13% for PLA with 9% banana microfiber. As effective nucleating agents, banana fibers promote the formation of a greater crystalline phase during cooling. This resulting increase in crystallinity enhances stiffness, dimensional stability, and wear resistance of printed parts, leading to improved mechanical performance and durability for functional products [26].
Figure 4.
DSC plot for virgin PLA and different microfiber reinforced PLA composite filament.
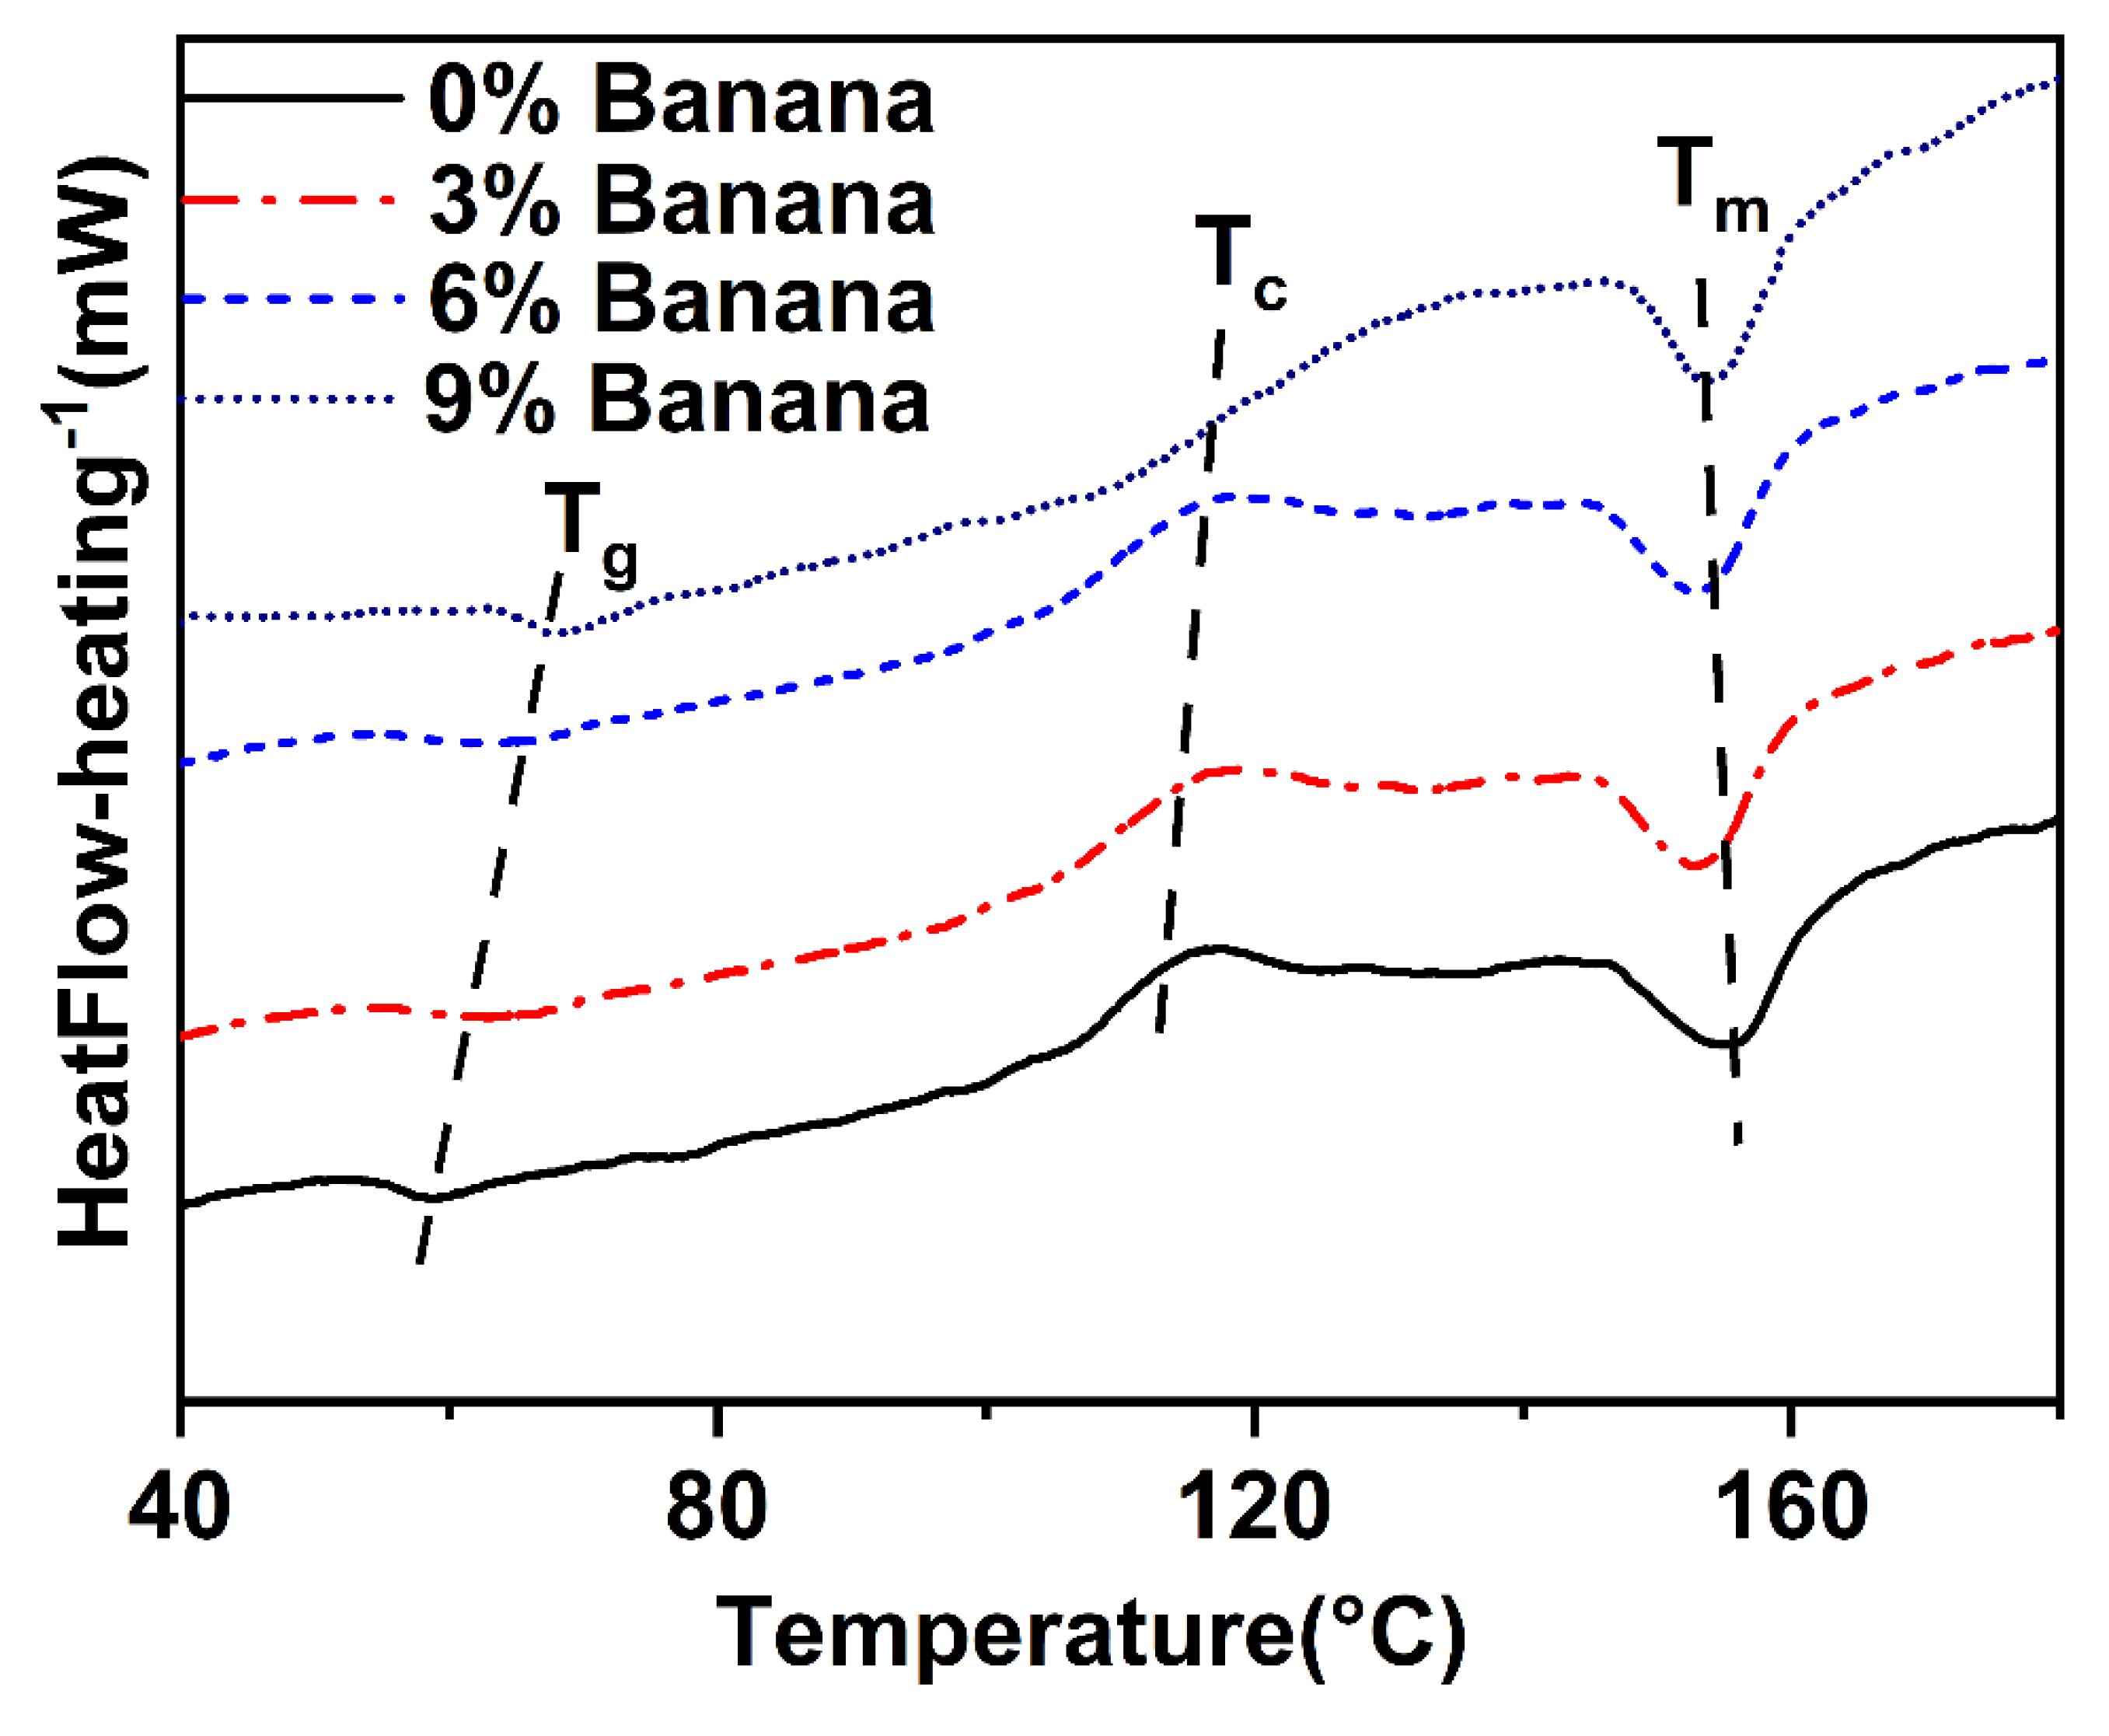
Table 5.
Different temperature details from the DSC curve.
| Banana microfiber (%) |
Tg (°C) |
TCC (°C) |
Tm (°C) |
Enthalpy (J/g) |
Crystallinity (%) |
| 0 | 58.99 | 116.21 | 155.01 | 9.31 | 10.02 |
| 3 | 62.92 | 116.47 | 154.26 | 9.41 | 10.47 |
| 6 | 65.97 | 116.78 | 153.25 | 9.89 | 11.32 |
| 9 | 67.99 | 117.02 | 152.10 | 10.26 | 12.13 |
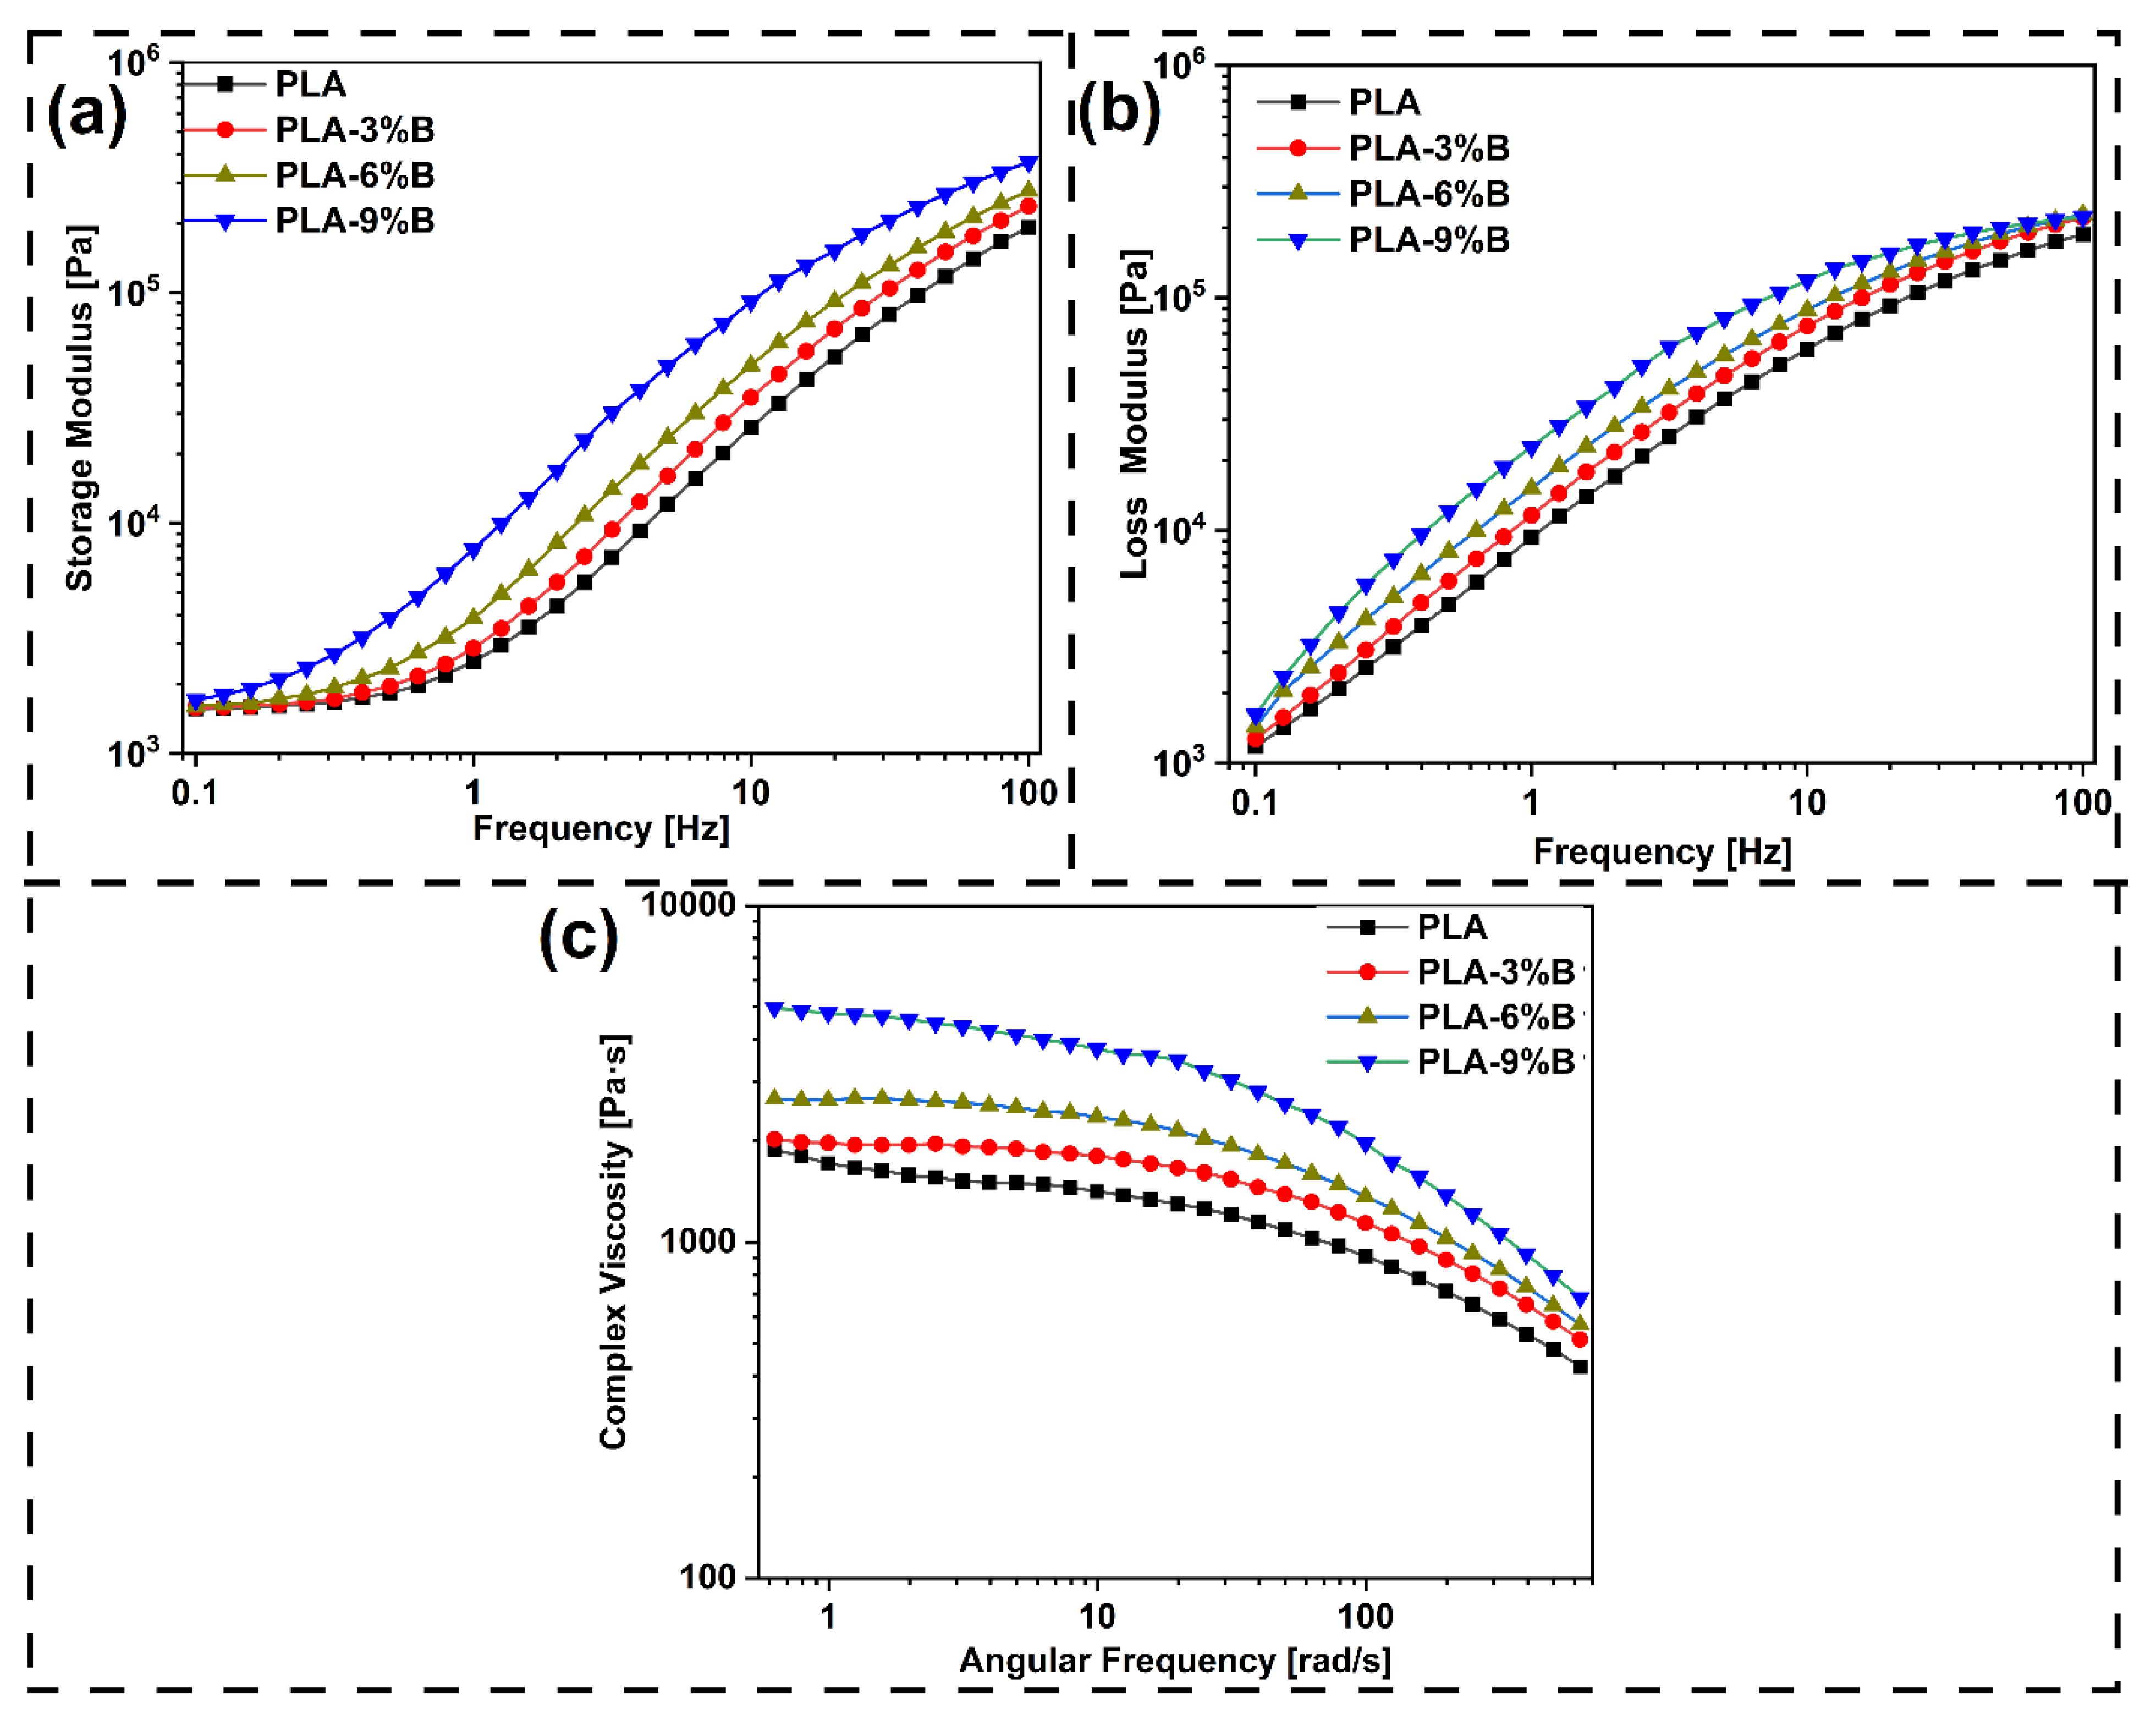
To study the behaviour of the PLA-banana composite during the printing process and gain insights into its melt flow properties and melt chain dynamics, rheological measurements were conducted at 190°C (printing temperature). With increasing frequency, storage modulus (Gʹ) and loss modulus (Gʺ) of the composite increased correspondingly, typical of linear viscoelastic behaviour, as seen in Figure 5a,b. The behaviour is characteristic of reinforced polymeric systems, where a high rate of deformation suppresses molecular relaxation and promotes greater elastic response. Addition of banana fibers also suppresses chain mobility, leading to greater resistance to deformation (increased Gʹ) and greater interfacial frictional losses (increased Gʺ) at high frequencies [65]. Additionally, the addition of banana microfibers resulted in an overall increase in the magnitude of both moduli. This can be due to suppression of PLA chain mobility due to the rigid fiber network and a high level of interfacial interactions between the fibers and matrix. The increase in Gʹ indicates greater elastic response due to the stiffening effect of the fibers, while the increase in Gʺ indicates greater energy dissipation at the fiber–matrix interface on deformation. In complex viscosity, the addition of banana microfiber has been found to increase this property. Complex viscosity (η*) goes higher with increased banana fiber loading due to greater resistance to flow caused by rigid fiber networks and extensive interfacial adhesion with the PLA matrix, limiting the mobility of polymer chains. With increased frequency, η* reduces, a clear indication of shear-thinning behaviour. At increased frequencies, the polymer chains and fibers align with the flow, disrupting weak agglomerates, hence reducing resistance to flow. This shear-thinning phenomenon is preferable in 3D printing since this leads to a reduction in viscosity during the extrusion process while providing greater viscosity after deposition for improved shape stability [66]. The rheological behaviour of polymers in extrusion printing is significantly affected by shear thinning, as indicated by the flow behaviour index "n." In the present study, the value of "n" was obtained by fitting the data in Figure 5c to the Carreau modified model. The smaller "n" value indicates a greater shear-thinning effect, which is beneficial to extrusion printing. Shear thinning allows the material to possess low viscosity in the nozzle, where it has high shear rates, and thus ease extrusion and reduce the printing pressure. Once the material leaves the nozzle and the shear rate drops rapidly, the viscosity rises rapidly, effectively preventing oozing and maintaining the desired shape of the extrudate in the stand-off zone. It is also preferable that the material resists dripping and maintains its shape against the gravitational force in stand-off time and resists the stress of the following layers in deposition [67,68]. The above-mentioned requirements are fulfilled when the material exhibits a yield stress at quasi-zero-shear conditions, typically found at low frequencies. The different fitted parameters like zero shear viscosity (η0) and power law index, and σ0 from the Carreau modified model [52] have been presented in Table 6.
Table 6.
Fitting parameters of the Carreau Modified Model.
| Filament type | η0 (Pa s) | σ0 (Pa) | n |
| Neat PLA | 1869 | 0.31 | 0.32 |
| 3% Banana+PLA | 2010 | 0.35 | 0.40 |
| 6% Banana+PLA | 2719 | 0.38 | 0.43 |
| 9% Banana+PLA | 3470 | 0.43 | 0.51 |
The estimated flow behaviour index (also known as the power law index) for all the developed composite filaments is found to be less than 1. Thus, during process of extrusion in the 3D printer, the developed polymer composites undergo shear thinning behaviour, making them suitable for 3D printing.
3.3. Characterization of 3D Printed Composite
Figure 5.
(a) Storage modulus, (b) loss Modulus and (c) complex viscosity of different biocomposites and PLA filaments.
Figure 5.
(a) Storage modulus, (b) loss Modulus and (c) complex viscosity of different biocomposites and PLA filaments.
3.3.1. Tensile Testing
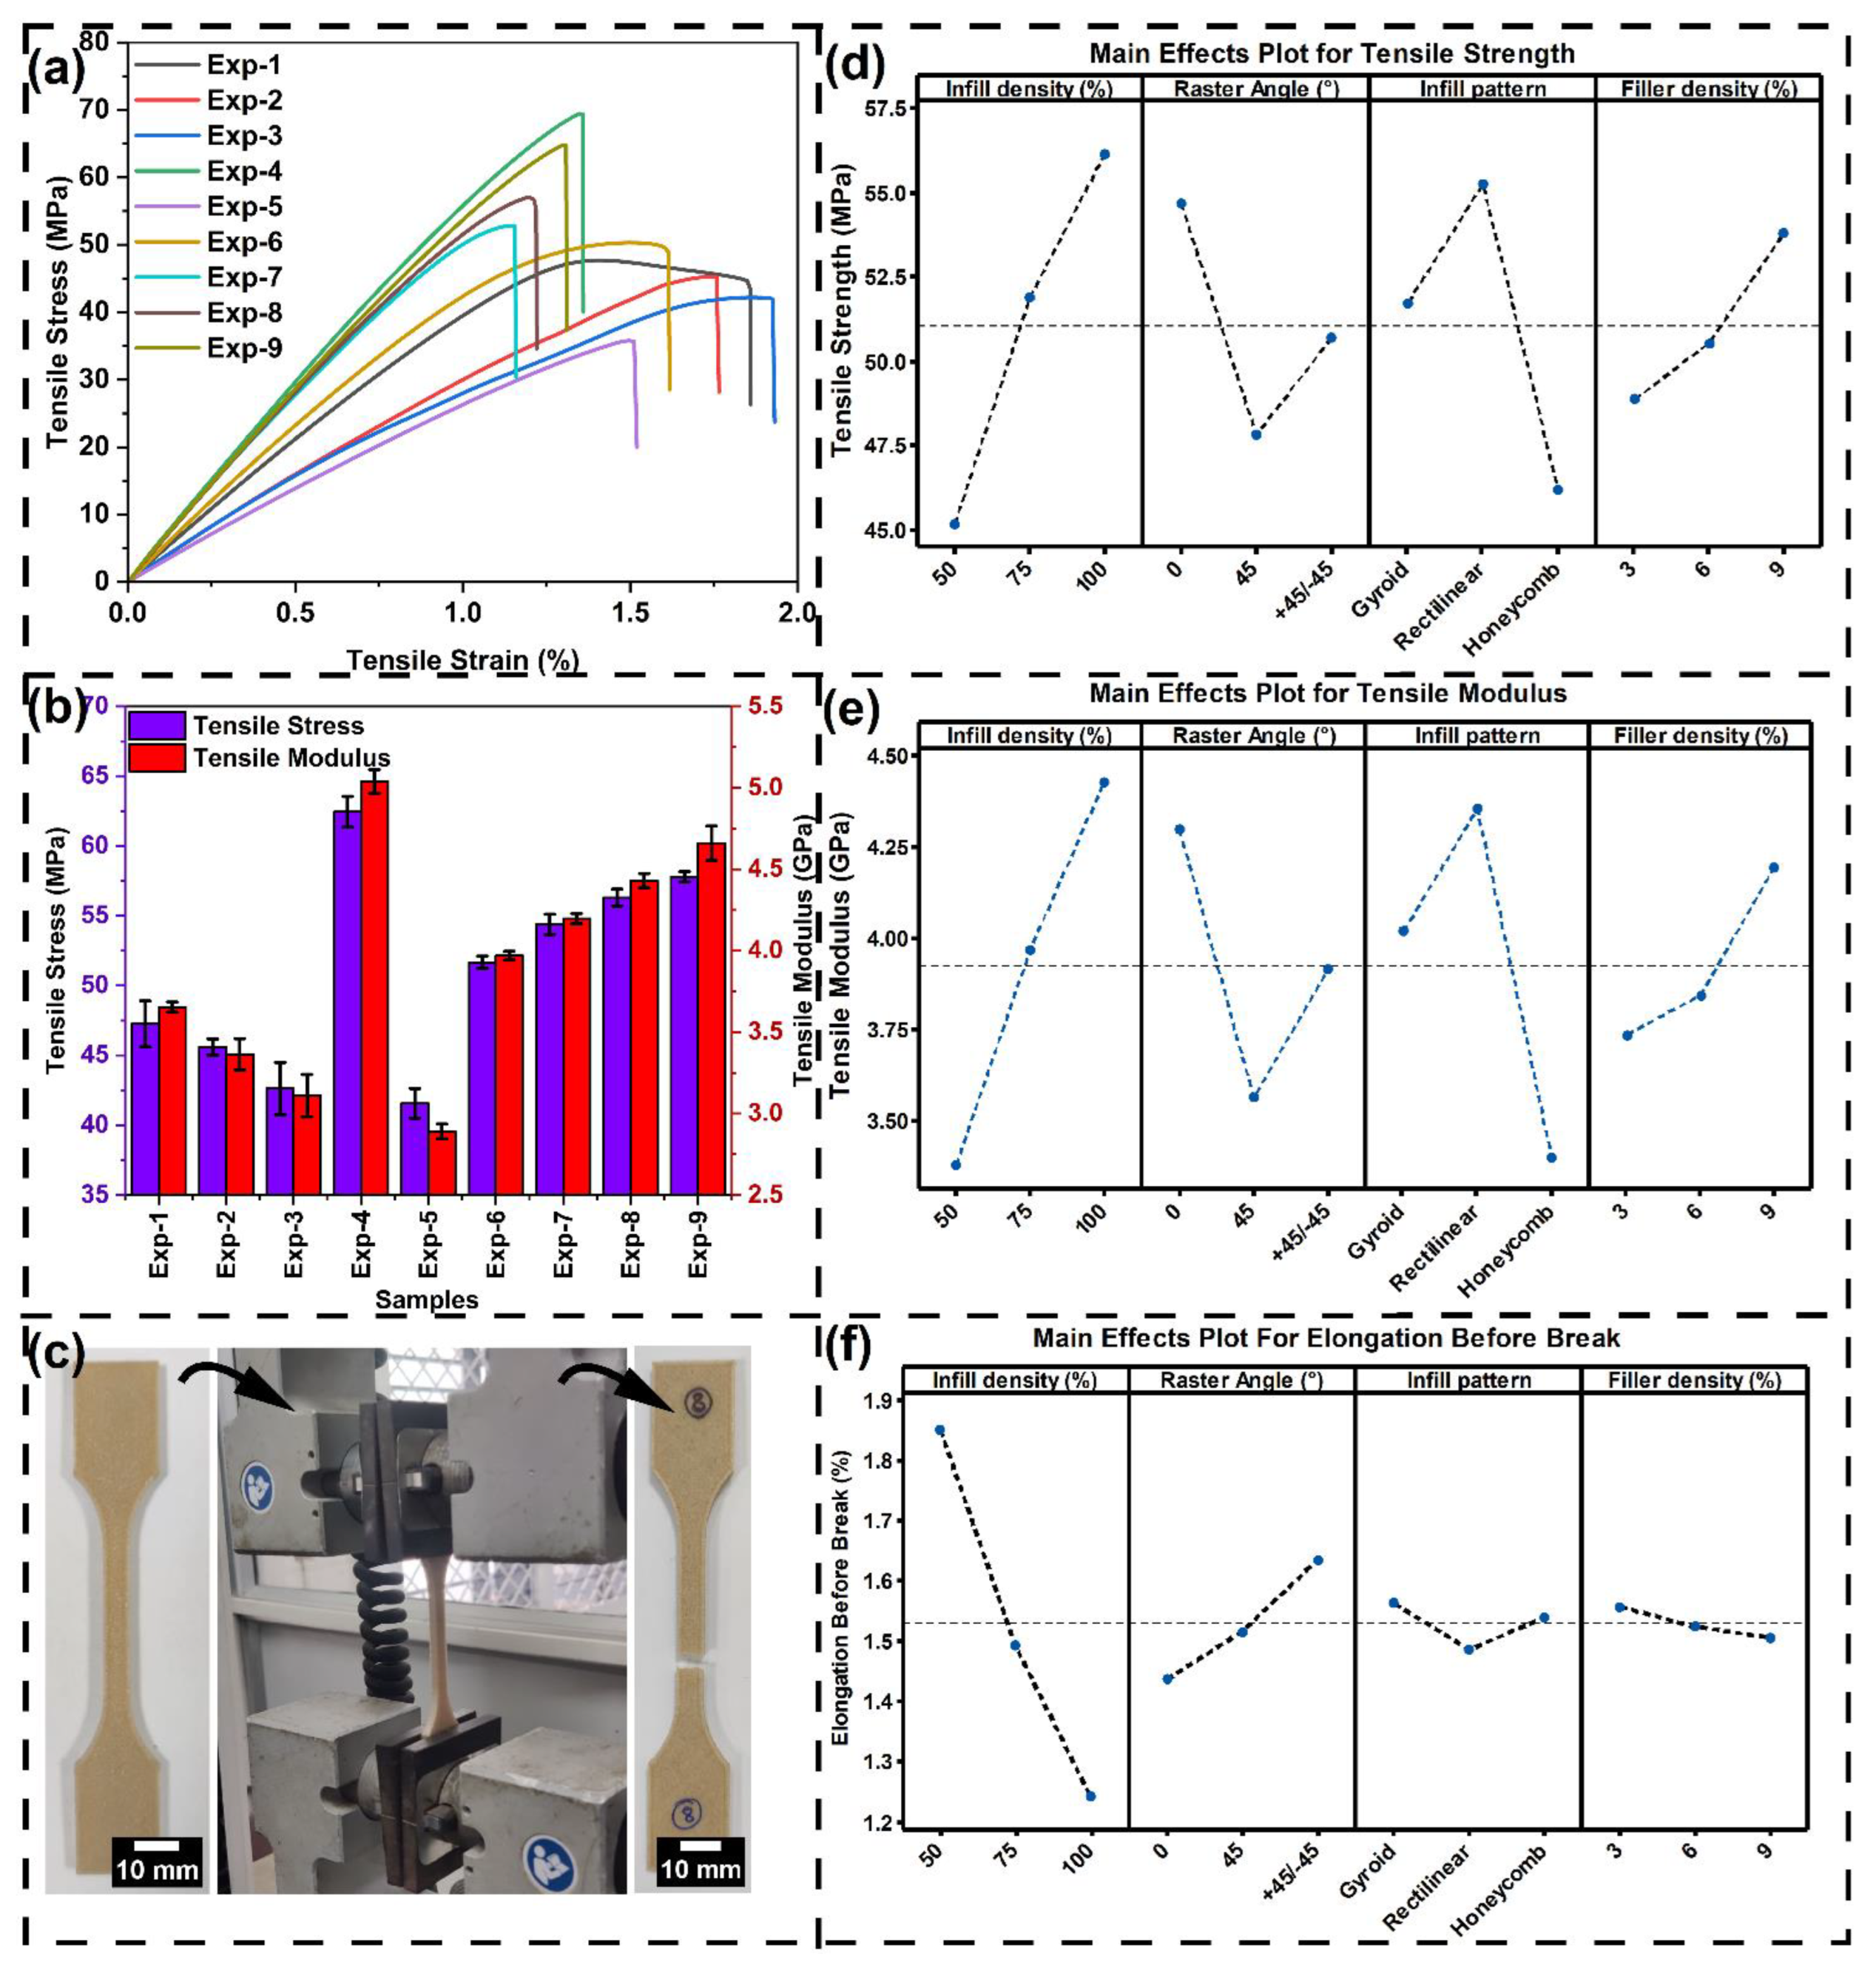
The influence of various printing parameters on the tensile properties of the printed samples is analyzed. The stress–strain curves, variations in tensile strength and modulus across different experiments, and the tensile sample with testing process are shown in Figure 6a–c. It is observed that testing under experimental condition 4 yields a maximum tensile strength of 62.45±1.10 MPa and a tensile modulus of 5.04±0.07 GPa. At the same time, the maximum elongation before break value is recorded as 1.82±0.04% with experimental condition 1. The minimum tensile strength of 41.56±0.45 MPa and tensile modulus of 2.89±0.05 GPa is observed with experimental condition 5. The lower elongation before break value of 1.15±0.05% is found in experimental condition 7. To assess the influence of printing parameters such as infill density (%), raster angle (°), infill pattern, and banana filler content (%), mean effect plots are generated and presented in Figure 6d–f for tensile strength, modulus, and elongation at break, respectively. It is observed that an increase in infill density and filler content leads to an increase in tensile strength and tensile modulus values. An increase in infill density enhances the internal structure of the printed part by the removal voids and contributes to increasing the load-bearing area of the cross-section. This further enables more effective stress transfer and reduces areas of weakness, resulting in maximum tensile strength and modulus. In the same way, the banana filler content strengthens the PLA matrix via fiber reinforcement. Banana fibers, being stiffer than the polymer matrix, enhance load transfer when dispersed and bonded well. The enhanced fiber–matrix interfacial adhesion enables the fibers to carry a higher proportion of the applied load, leading to increased tensile strength and stiffness [47,58]. The fillers also inhibit the polymer chain motion, thus enhancing the modulus. The higher tensile strength and modulus of the rectilinear infill pattern are primarily due to the straight orientation of continuous filament roads along the direction of the applied load, which favours a load-dominated mode of deformation over bending. From the viewpoint of fracture mechanics, the rectilinear pattern reduces the frequency of filament–filament junctions at off-axis angles, hence decreasing the number of potential sites of stress concentration at which crack nucleation occurs. The linear trajectories of loads enable the even distribution of stress, retarding crack initiation and retarding crack growth across the printed part. By contrast, gyroid and honeycomb structures have intrinsically curved or sloping filament paths that impose a bending-dominated mode of deformation. The geometries undergo localized rotation and flexure of the filament segments under tensile loading before actual tensile failure occurs, leading to decreased stiffness and strength. The intersecting curves also raise the interfacial junctions at non-parallel orientations, which can be stress risers and facilitate the crack growth when initiated. As a result, the rectilinear arrangement acts like a unidirectional composite with uninterrupted load paths, whereas the gyroid and honeycomb arrangements act more like cellular arrangements intended for impact absorption rather than for tensile strength optimisation. Maximum tensile strength and modulus were obtained with 0° infill direction, followed by ±45° and 45°. In the direction of 0°, the filament paths are directly aligned to the tensile loading direction, maximizing load transfer along intact paths of filaments with minimal bending influence [69].
This alignment reduces stress concentrations and enables a load-controlled deformation mode like that of unidirectional fiber-reinforced composites. The existence of continuous, parallel filaments also significantly retards crack growth because fracture must occur through the filament cross-section rather than following along weaker interfacial bonds. Under the ±45° orientation, the load is decomposed into tensile and shear components along the directions of the filaments along the filament paths. This causes partial bending of the filaments and shear deformation at the filament junctions before completing tensile failure, lower effective stiffness and strength than in the 0° orientation. 45° orientation is the poorest performing since filaments are neither aligned by the load axis nor positioned symmetrically to resist shear forces, causing enhanced inter-road slippage and premature failure. Stress transfer in this orientation is less efficient, and cracks in inclined filament interfaces can propagate more easily. This agrees with the previous observation regarding infill patterns, with the straight, load-aligned paths of the filament (e.g., rectilinear with 0° direction) being superior to oblique or curved paths (e.g., ±45°, gyroid, honeycomb) since they can maximize load capacity and reduce deformation through bending and shear. The addition of banana microfiber into PLA makes it brittle. It restricts polymer chain mobility and introduces stress concentration sites at the fiber–matrix interface, resulting in increased stiffness but reduced ductility. Due to that elongation before break value continuously decreased as the filler content increased. Moreover, higher infill density reduces the void and increases the stiffness. This affects in limiting the material’s plastic deformation ability and thus reduces the elongation before break value. The ±45° infill orientation has the highest elongation before failure because angled filaments are subjected to combined tensile and shear loading, allowing for more strain before failure. 45° raster angle-oriented samples have moderate elongation, and 0° raster angle-oriented samples fail earlier because they have unimpeded load alignment and limited deformation paths. Similarly, gyroid and honeycomb architectures with their curved and inclined load paths allow for more elastic deformation compared to the straight, load-aligned rectilinear structure, which prefers a more brittle, tensile-dominated failure [70].
Figure 6.
(a) Tensile stress-strain curve, (b) variation of tensile strength and modulus with different experimental conditions, (c) tensile testing of printed sample, mean effective plot for (d) tensile strength, (e) modulus and (f) elongation before break.
Figure 6.
(a) Tensile stress-strain curve, (b) variation of tensile strength and modulus with different experimental conditions, (c) tensile testing of printed sample, mean effective plot for (d) tensile strength, (e) modulus and (f) elongation before break.
3.3.2. Flexural Testing
The three point bending test has been performed to understand the flexural properties of the printed samples. Figure 7a presents the flexural stress-strain plot of the samples, and Figure 7b is the representation of the variation of flexural strength and flexural modulus with different experimental conditions as per the Taguchi T9 design of experiment process. The maximum flexural strength and flexural modulus are recorded as 79.78±3.51 MPa and 5.44±0.03 GPa, respectively, with the experimental condition 7. The lowest flexural properties are observed with the experimental condition 1. The flexural strength and flexural modulus with experiment 1 are recorded as 41±2.35 MPa and 3.12±0.03 GPa, respectively. To understand the effect of different printing parameters on flexural properties of the printed sample, the mean effective plot for flexural strength and flexural modulus is presented in Figure 7c,d, respectively. Similarly, flexural strength and flexural modulus have increased when the infill density and the filler weight fractions are increased because of the extension of the load path, filament alignment and deformation mechanisms that control tensile performance, controlling the material resistance to bending loads. The honeycomb structure has greater flexural strength and modulus because of its closed-cell nature, enabling even transmission of bending stresses through several paths of load and high resistance to localized buckling when subjected to compression [71]. The multi-directional stiffness provided by the hexagonal cell walls enables the structure to resist tensile and compressive stresses on opposite sides of the neutral axis as the structure bends. The rectilinear structure follows, whose linear filament paths yield very good stiffness along principal directions, but poor out-of-plane stability compared to the honeycomb's contained structure. Although it performs well in tension, its open-grid structure doesn’t perform well in redistributing bending stresses away from the loaded face. Gyroid structure has the lowest flexural performance since its smooth, curved paths sustain a bending-dominated mode of deformation. The curves under flexural loading can absorb localized shear and rotation before tensile or compressive loading, leading to lower stiffness and strength. The lack of stiff cell walls also enables greater elastic deformation, as is desirable for energy absorption but undesirable for the achievement of maximum flexural rigidity [72].
Figure 7.
(a) Flexural stress-strain curve, (b) flexural strength and modulus for different experimental conditions, mean effective plot for (c) flexural strength and (e) flexural modulus.
Figure 7.
(a) Flexural stress-strain curve, (b) flexural strength and modulus for different experimental conditions, mean effective plot for (c) flexural strength and (e) flexural modulus.
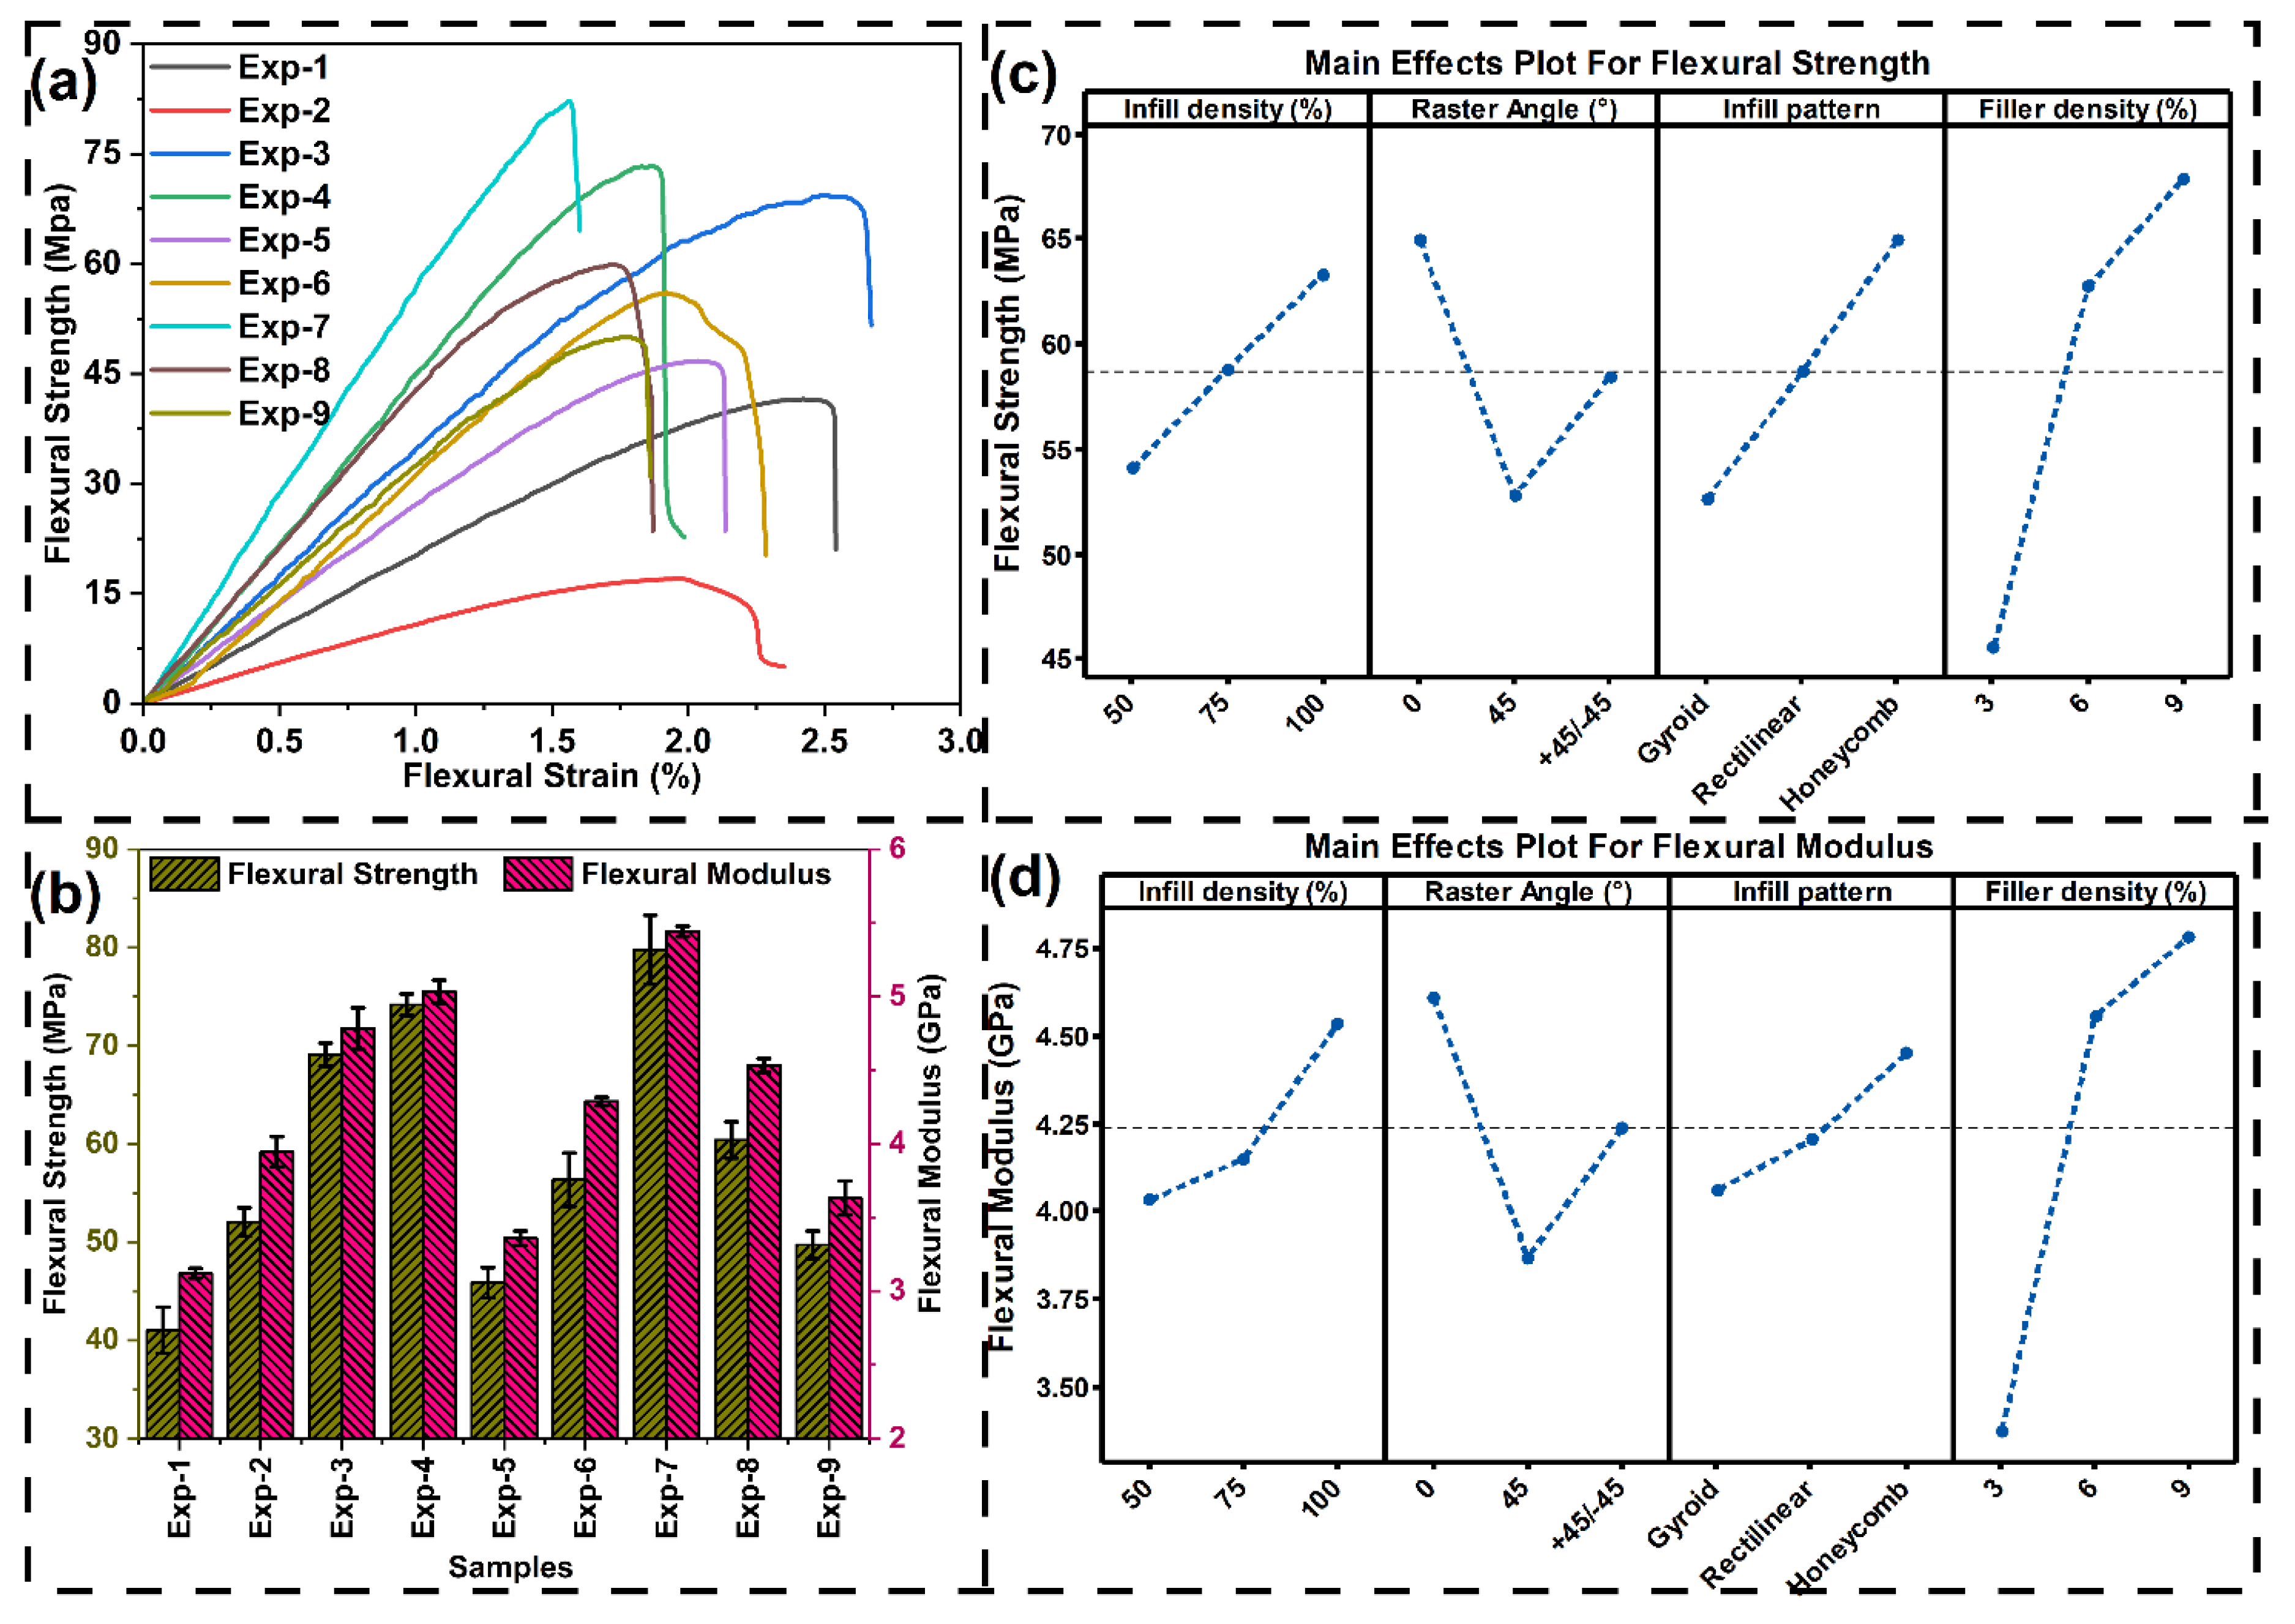
Figure 8.
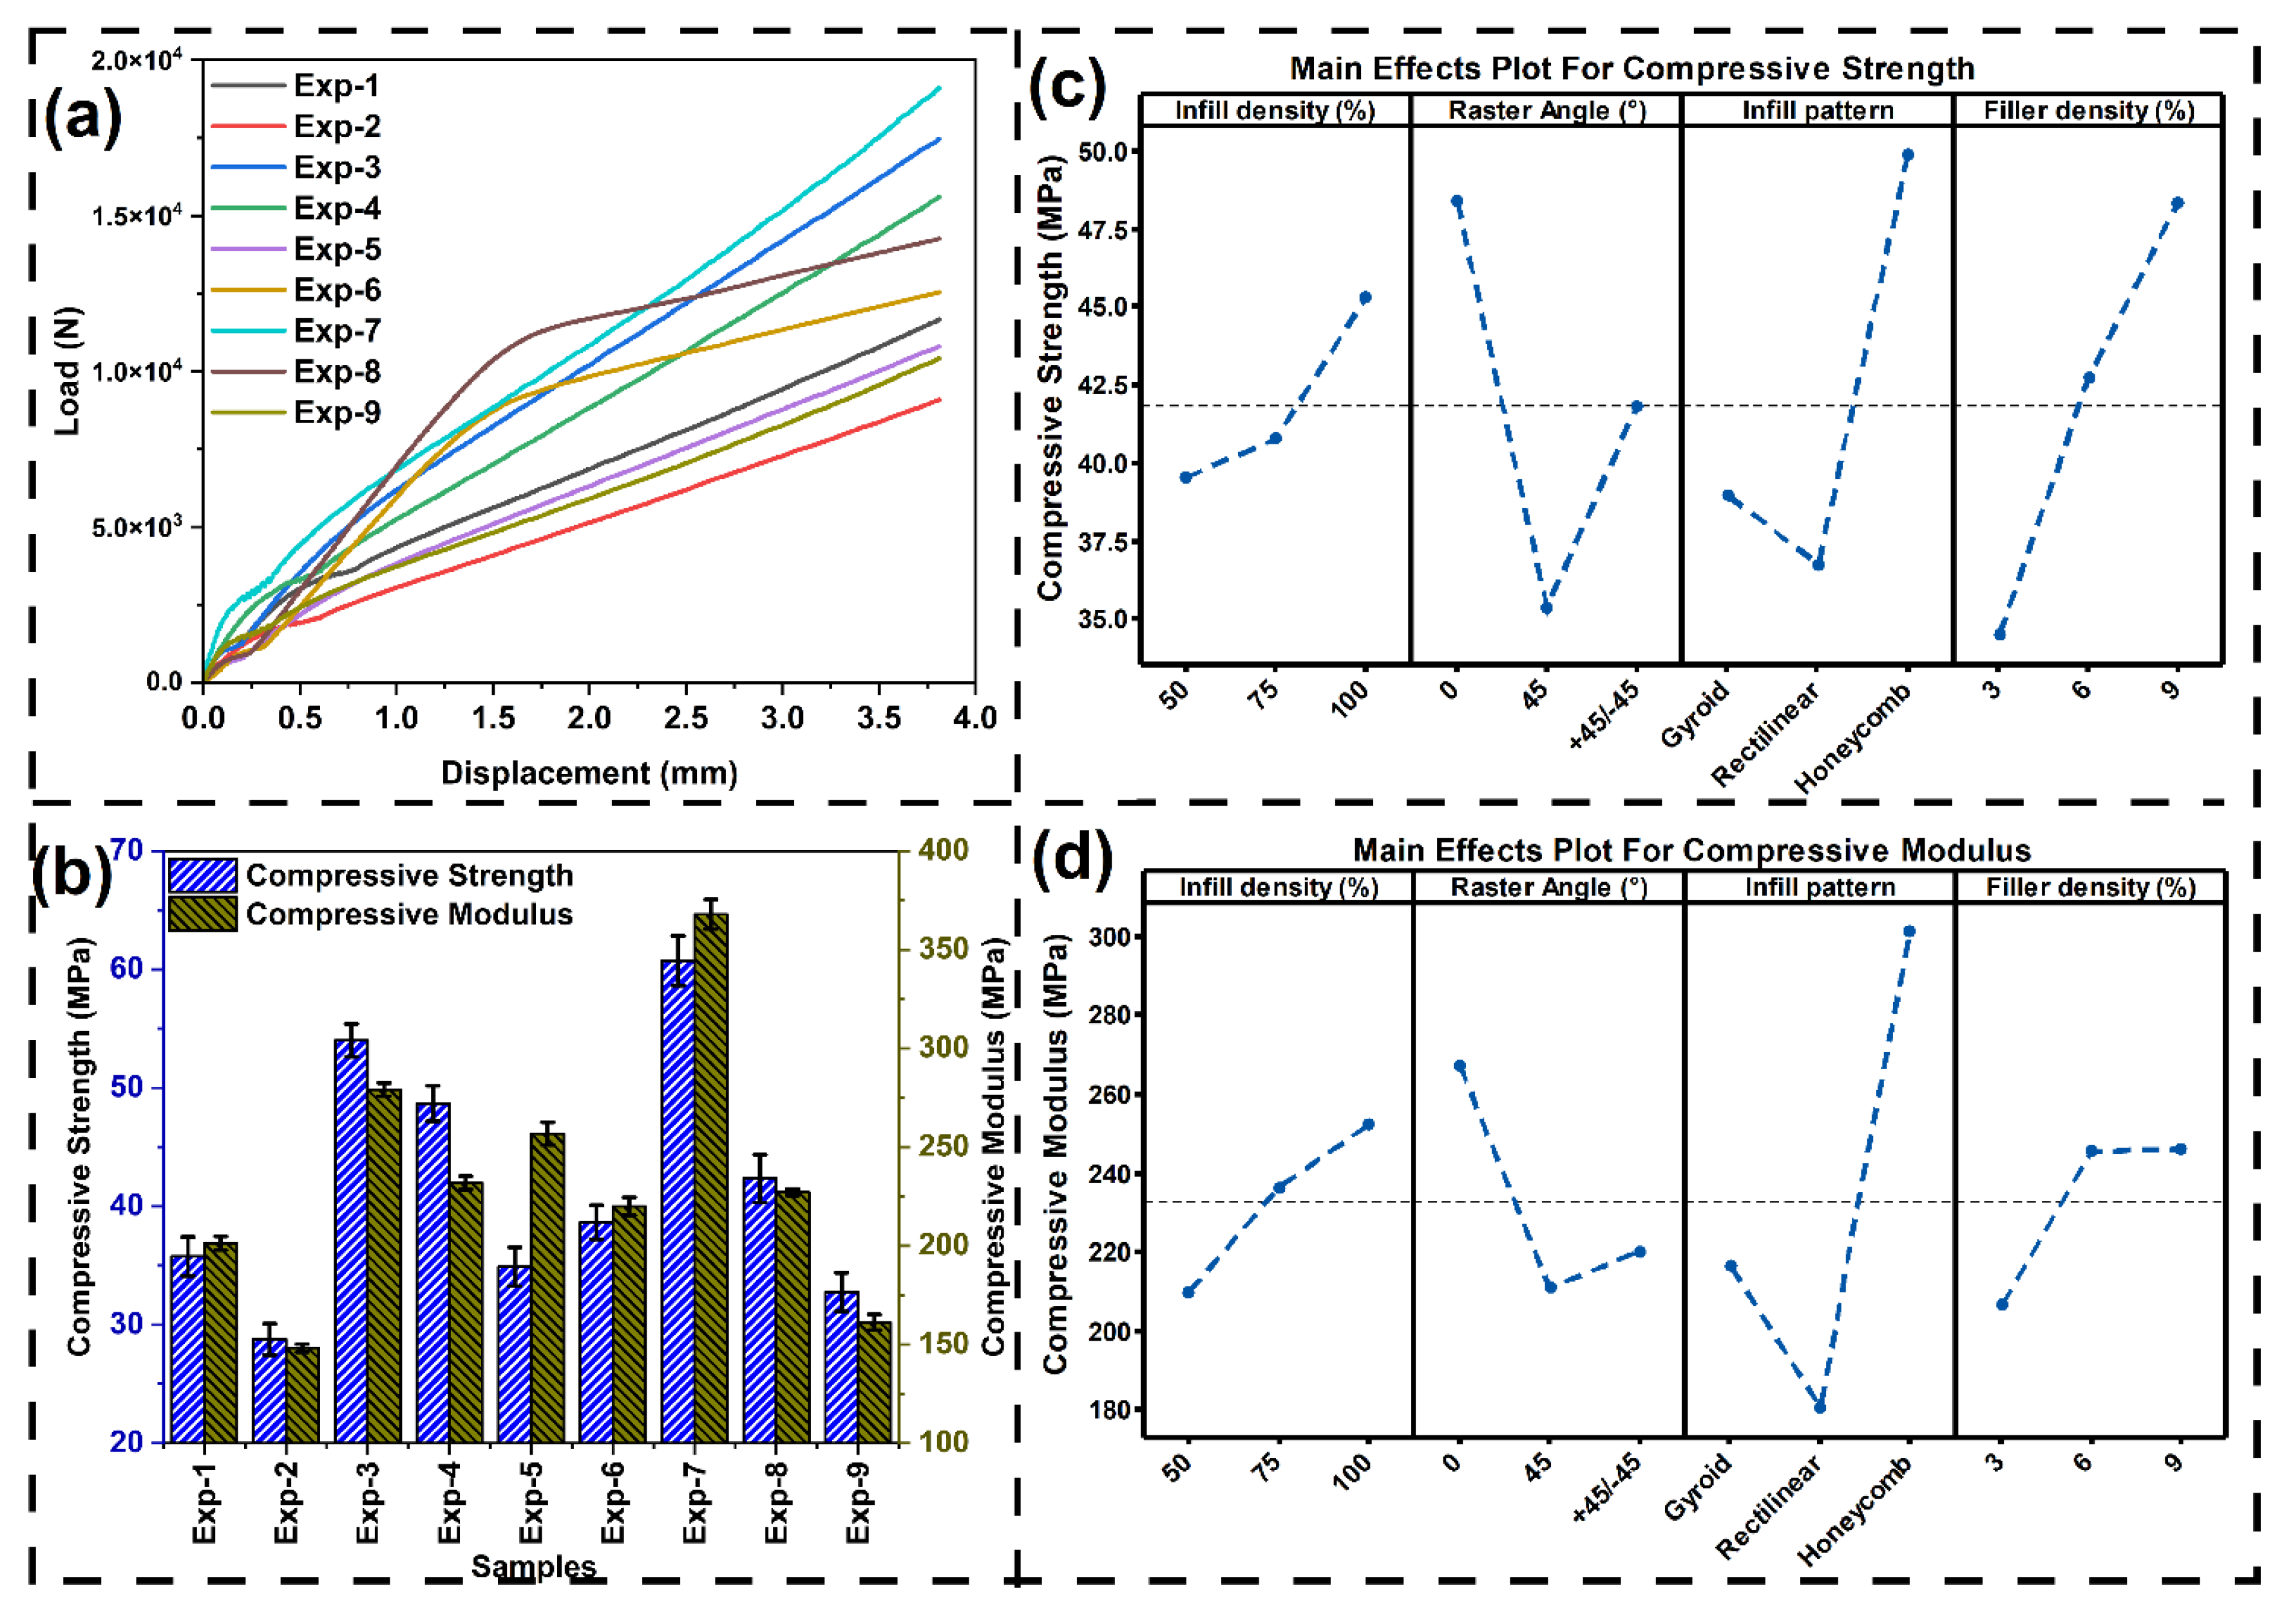
(a) Compressive load-displacement curve, (b) compressive strength and modulus for different experimental conditions, mean effective plot for (c) compressive strength and (d) compressive modulus.
Figure 8.
(a) Compressive load-displacement curve, (b) compressive strength and modulus for different experimental conditions, mean effective plot for (c) compressive strength and (d) compressive modulus.
3.3.3. Compression testing
The compressive load displacement curve, variation of compressive strength, and compressive modulus are presented in Figure 8a,b, respectively. The maximum compressive strength and maximum compressive modulus are reported as 60.73±2.10 MPa and 367.89±7.50 MPa, respectively, with experimental condition 7. The lowest compressive strength and compressive modulus are reported as 28.76±1.33 MPa and 148.22±2.00 MPa, respectively, with the second experimental condition. The effect of different printing parameters can be analysed by the mean effective plot for compressive strength and compressive modulus presented in Figure 8c,d, respectively. Like the tensile strength and tensile modulus, the compressive strength and compressive modulus also exhibit an increasing trend with higher infill density and banana fiber loading. Likewise, for raster angle, the maximum values are observed at 0° infill, followed by 45° and ±45°, consistent with the tensile property trends. For the infill pattern, the maximum compressive properties have been observed with honeycomb, followed by gyroid and rectilinear infill patterns. The honeycomb structure has better compressive properties since the closed-cell structure with hexagonal cells provides high load-carrying capacity and high compressive stability. Interlaced cell walls provide even stress distribution in different directions, minimizing localized deformation and delaying the structure's failure. Gyroid pattern, with 3D periodic continuous pattern allows better stress distribution than rectilinear, but its curved paths introduce localized bending and shearing that reduces its maximum compressive capability compared to honeycomb. The rectilinear pattern performances were the lowest in compression because its open-grid structure offers fewer load paths and lower lateral support and is thus more susceptible to local buckling under compression [73,74].
3.3.4. Short Beam Shear Testing
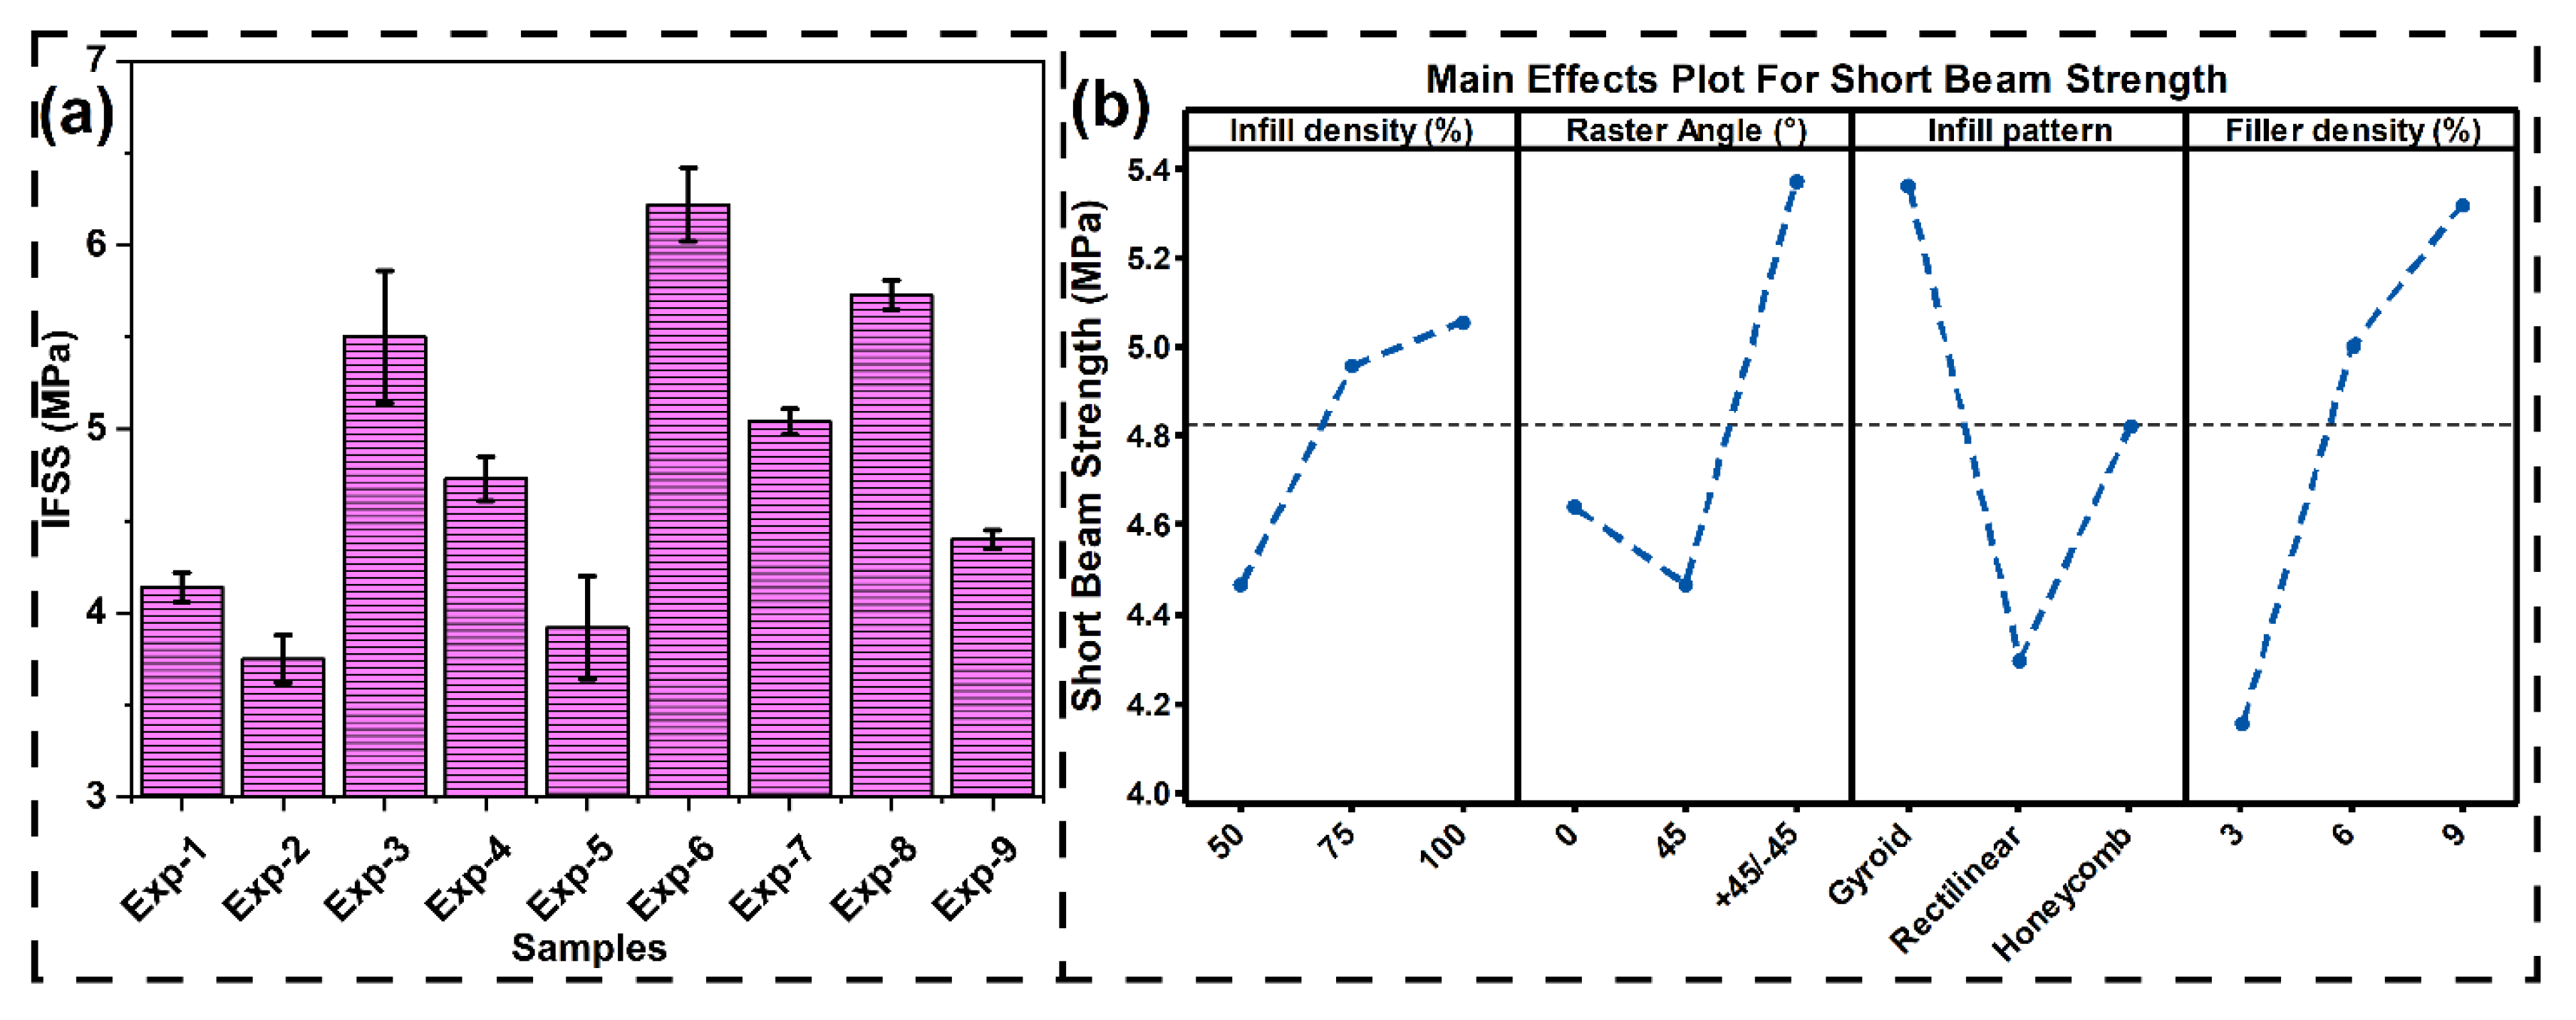
In 3D printed composites, interfacial shear strength (IFSS) is important since it signifies the efficiency of stress transfer between one printed layer to another. Enhanced load sharing, less debonding at the interface, and overall enhanced mechanical performance are ensured with higher IFSS. The Short beam shear test results are presented in Figure 9a. Maximum and minimum interfacial shear strength are recorded as 6.22±0.2 MPa and 3.75±0.13 MPa, respectively, for the testing conditions six (6) and two (2). To understand the effect of different printing parameters on IFSS, the mean effective plot is presented in Figure 9b. Incorporation of banana fiber enhances IFSS through mechanical interlocking and interfacial adhesion improvement between the fiber and PLA matrix, promoting better stress transfer. Higher infill density also enhances IFSS by minimizing internal voids, enhancing bonded surface area, and enabling more robust filament-filament fusion, which collectively reduces interfacial slippage upon loading. The ±45° raster orientation possesses the maximum IFSS since the orientation is favourable to combined tensile and shear loading at the interfaces, which ensures optimum utilization of interfacial bonding and mechanical interlocking. The 45° orientation possesses an IFSS between the ±45° and 0° orientations since the shear component exists but is less balanced than that of the ±45° orientation. The 0° orientation possesses predominantly pure tensile loading along the filament axis, which is less dependent on interfacial shear resistance, and possesses a lower IFSS value. Among all types of infill patterns, the gyroid shows higher IFSS due to its smooth, curved filament traces that form large interfacial areas and multidirectional contact points that favour mechanical interlocking and shear transfer. Honeycomb pattern is followed because its closed cell structure forms a good bonding area, but fewer multidirectional shear planes than the gyroid. Rectilinear pattern has the lowest IFSS because it consists of straight and unidirectional load paths with very little interfacial engagement in shear, hence diminishing the efficiency of stress transfer at the filament interfaces [75,76].
Figure 9.
(a) Variation of IFSS for different printed sample, (b) mean effective plot for IFSS.
3.3.5. Impact Testing
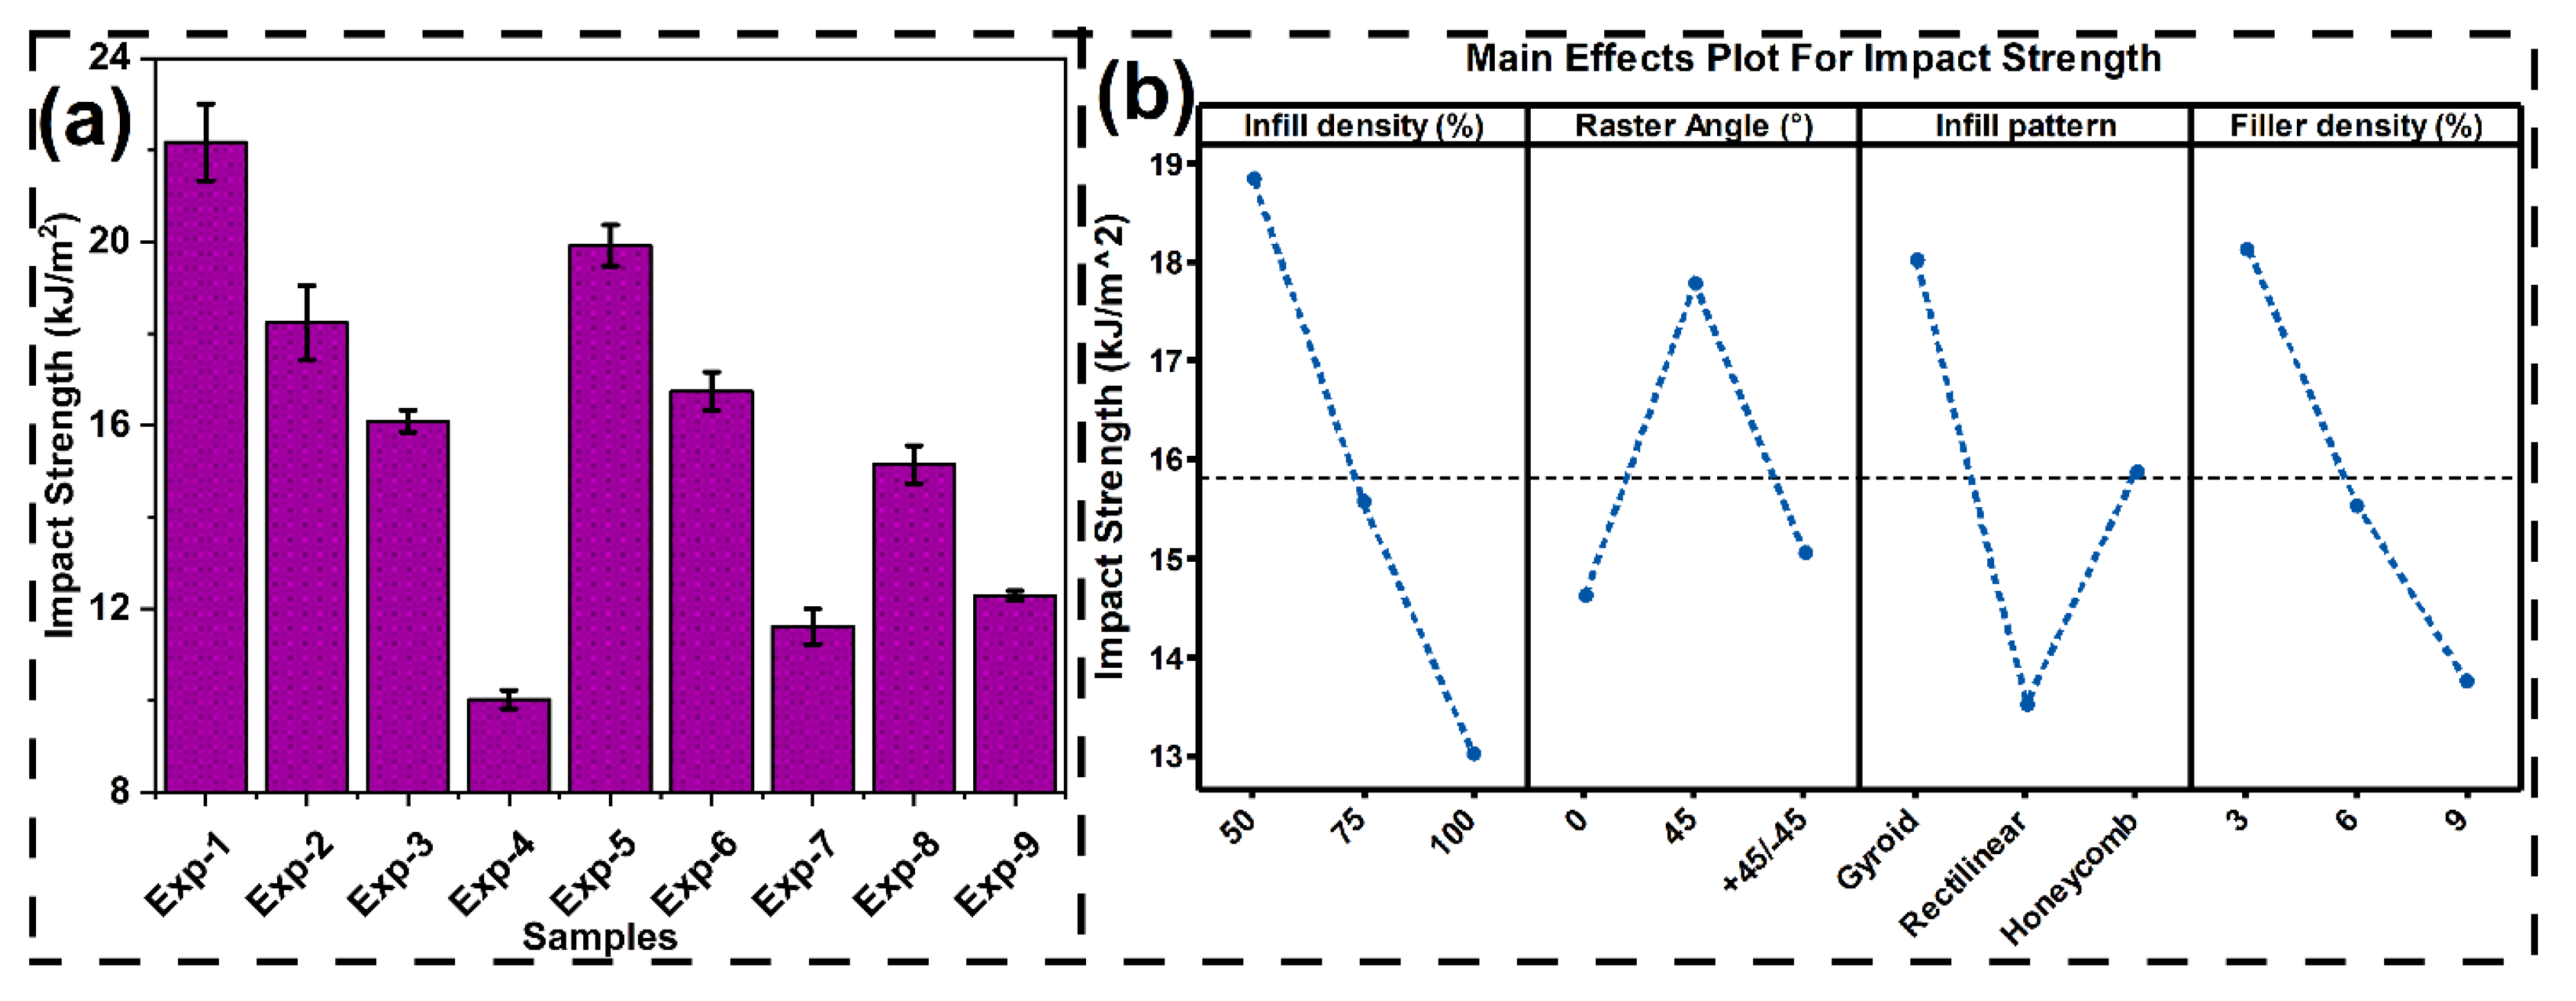
It is important to understand the impact strength of the different 3D printed samples for evaluating their potential in various engineering applications. The impact strength for different printed samples is presented in Figure 10a. The highest and lowest impact strengths are reported as 22.17±0.83 kJ/m2 and 10.02±0.2 kJ/m2 for experiment conditions 1 and 9, respectively. The mean effective plot for impact strength is presented in Figure 10b. This graph is used to understand the effect of different printing parameters on the impact strength of the printed samples. Increased infill density and banana-fiber content make the PLA composite stiffer and lower its ability to deform plastically, and consequently, less impact energy is dissipated through filament bending, ligament extension, and matrix yielding. Increased infill lowers cellular (void-mediated) deformation that would otherwise absorb energy upon impact, moving the response to a more brittle, load-dominated mode. Incorporating rigid banana fibers also limits polymer chain mobility and adds fiber–matrix interfaces that are stress concentrators; under high strain rates, these interfaces lead to early crack generation and restricted fiber pull-out, both of which lead to reduced impact toughness. Therefore, energy-absorbing mechanics are reduced (less shear yielding, crazing, and pull-out work), resulting in decreased impact strength. This property is directly related to the reduction in elongation at break, since both depend on the material’s plastic deformation capacity. With increasing fiber loading and infill density, ductility decreases, reducing strain to failure and the material's ability to absorb impact energy, though tensile modulus increases. In 3D printed samples with a raster angle of 45°, the inclined filaments increase shear and rotation when impacted, allowing greater energy absorption before failure. At ±45°, the effect continues, though to a lesser degree, as reversing angles are restrictive of motion. At 0°, the filaments are in the direction of the load and create a linear and more direct crack path of propagation, thus reducing energy absorption. The printed sample with a gyroid infill pattern exhibits better impact energy absorption due to the curved, continuous paths that distribute stress in multiple directions, making cracks travel a longer, more tortuous path. Honeycomb structures also have good impact resistance due to cell wall bending and buckling; however, their straighter configurations allow cracks to travel more readily than in gyroid structures. Rectilinear arrangements have the least energy absorption due to their linear paths having an open path for crack travel, with minimal bending and rotation to restrict this process [77,78].
Figure 10.
(a) Variation of impact strength for different printed sample, (b) mean effective plot for impact strength.
Figure 10.
(a) Variation of impact strength for different printed sample, (b) mean effective plot for impact strength.
3.3.6. Natural Frequency Analysis
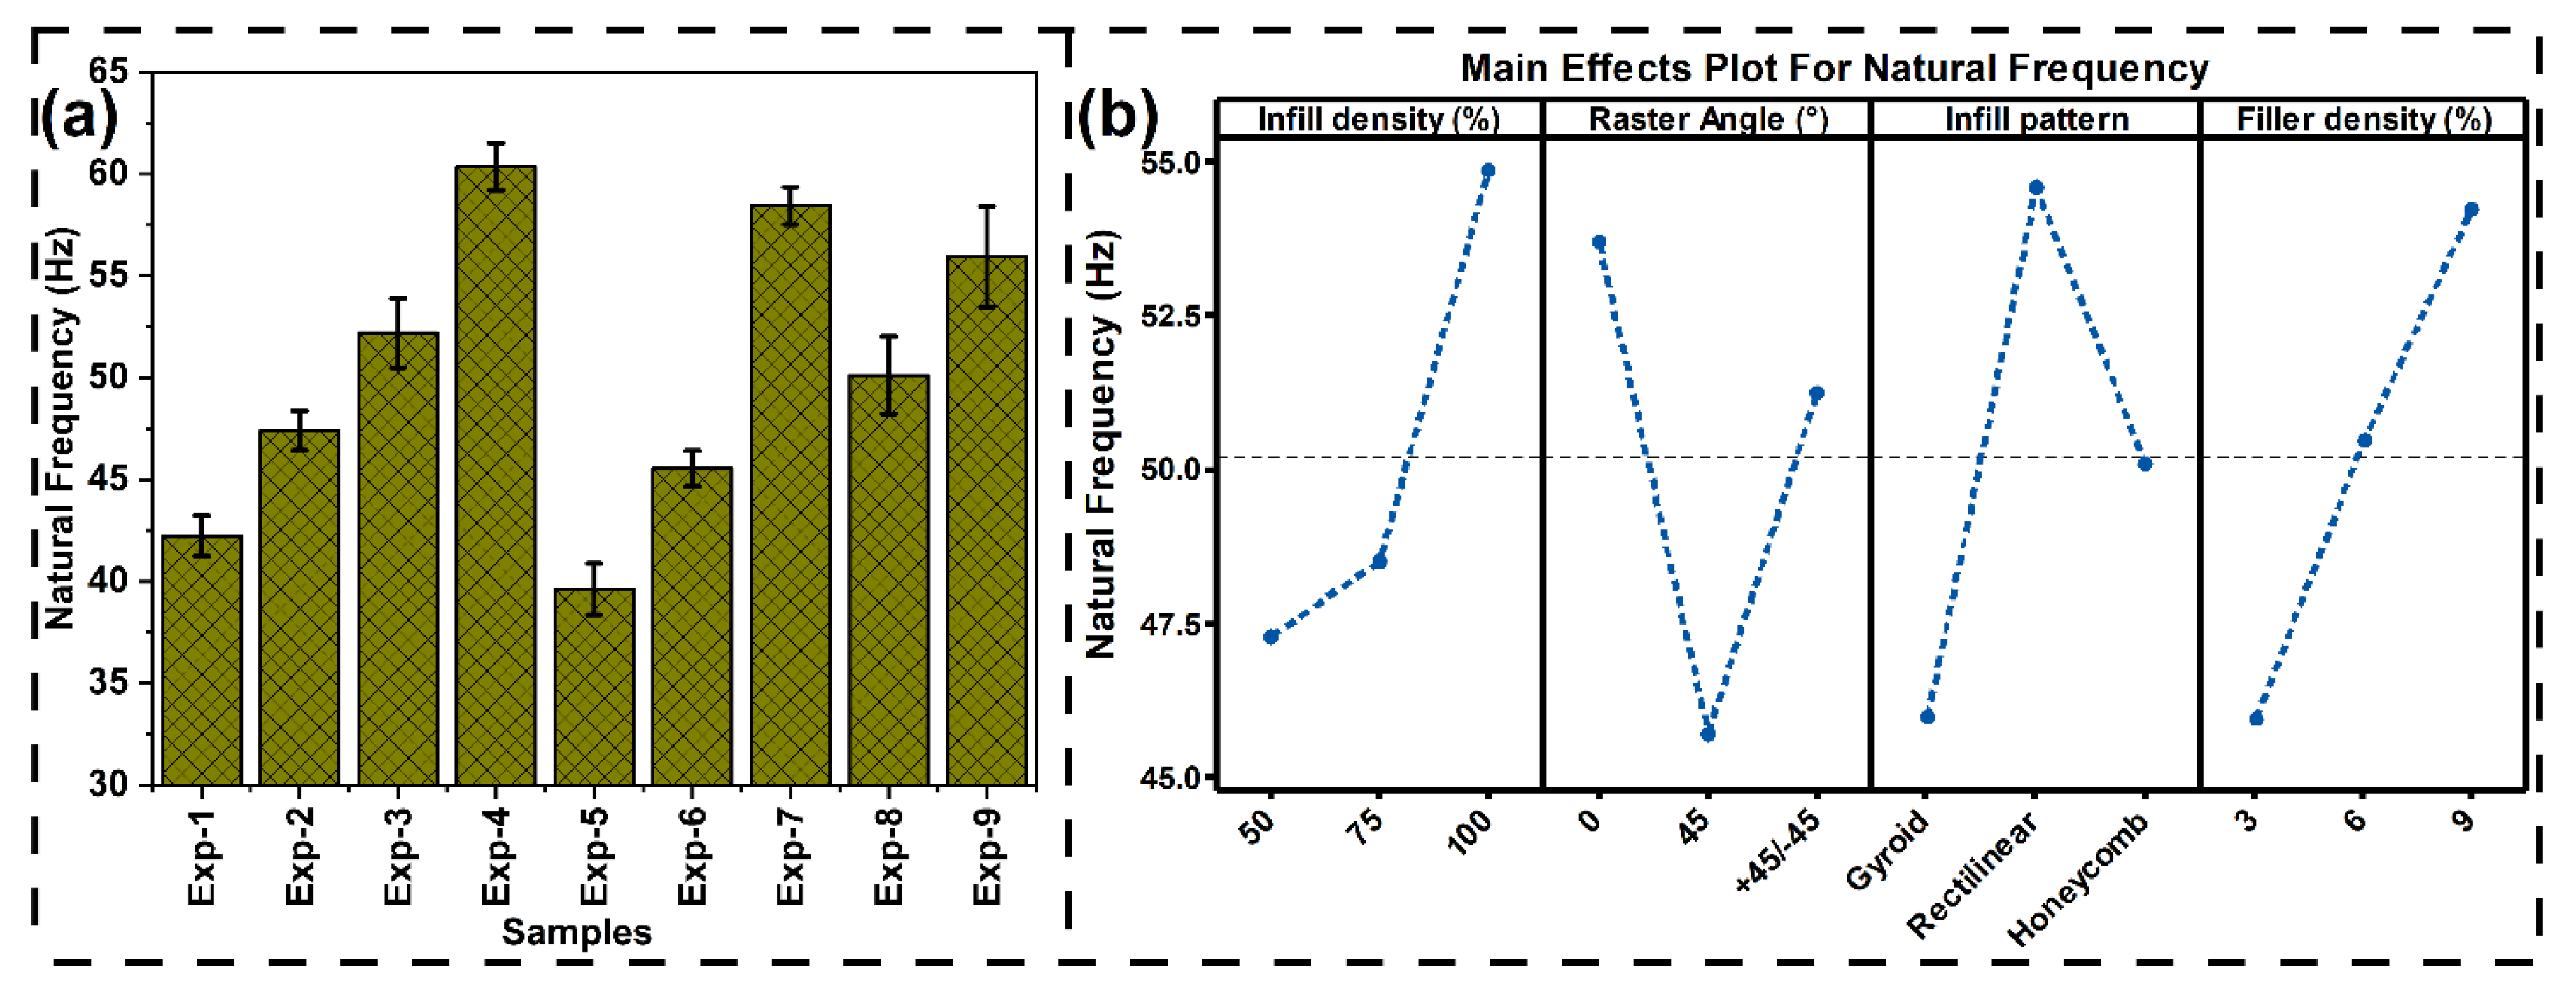
From a dynamic application point of view, it is important to understand the behaviour of printed composite in vibrating environments. Based on the frequency response function curve, the first three modes and their frequencies have been identified in this research. As all the modes have a similar trend, the Mode I frequency (natural frequency) has been used for further analysis. The variation of natural frequency with different experimental conditions is presented in Figure 11a. The maximum and the minimum natural frequencies are identified as 60.36±1.16 Hz and 39.62±1.26 Hz for experimental conditions 4 and 5, respectively. Further to understand the effect of different printing parameters, the mean effective graph is generated and presented in Figure 11b. The natural frequency variation with infill density and banana filler fraction is an identical stiffness-based mechanism as observed in the tensile results. Incorporation of fiber content and infill density increases the elastic modulus of the printed composite. As of the equation, [51] ( is the natural frequency, k is the stiffness, and m is the mass), increasing infill density increases the stiffness of the sample, whereas the increment in the mass is marginal. The addition of banana filler makes the sample lighter in weight, while simultaneously increasing its stiffness; thus, the overall natural frequency increases. The same stiffness factor is also the cause of the raster angle effect: 0° samples have the highest frequency because the filament is along the principal axis of vibration, therefore, the maximum axial stiffness. The ±45° orientation introduces a combination of axial and shear deformation modes, so there is a lower stiffness, and the 45° orientation favours shear compliance and reduces stiffness further, resulting in the lowest natural frequency. A comparable trend is observed for infill geometry as well, in which rectilinear is most prevalent due to its continuous, directionally oriented filament paths, leading to the highest stiffness. Honeycomb, although structurally stable, bears higher-angle junctions that lower direct axial stiffness, while the gyroid, with its smooth curved surfaces, provides the lowest stiffness, leading to the lowest natural frequency.
Figure 11.
(a) Variation of natural frequency for different printed sample, (b) mean effective plot for natural frequency.
Figure 11.
(a) Variation of natural frequency for different printed sample, (b) mean effective plot for natural frequency.
4. Optimisation of Printing Parameters Using VIKOR
Among the tested samples, the fourth experimental condition (with 75% infill density, 0° raster angle, rectilinear infill pattern and 9% banana fiber weight fraction) delivered the highest tensile and vibrational performance, while the seventh condition (with 100% infill density, 0° raster angle, honeycomb infill pattern and 6% banana fiber weight fraction) showed superior flexural and compressive strength. The sixth condition achieved the maximum interfacial shear strength (IFSS), and the first condition (with 50% infill density, 0° raster angle, gyroid infill pattern and 3% banana fiber weight fraction) exhibited the best impact resistance. This variation across properties makes it challenging to identify a single printing condition that performs best in all mechanical aspects. Therefore, a multi-criteria decision-making approach was adopted, with the weight of each mechanical property determined using the Shannon entropy method. The decision matrix is presented in Table 7, and Table 8 presents the weightage of different mechanical criteria calculated from the Shannon entropy method. After employing VIKOR multicriteria decision making, the sensitivity of the process is analysed and presented in Figure 12. The sensitivity analysis indicates the variation in ranking of the nine experimental condition alternatives (E1 to E9) for the variation of sensitivity factor (α) values ranging from 0.0 to 1.0. In the VIKOR method, the sensitivity factor (α) reflects the decision strategy, i.e., a smaller value of α focuses on the overall utility of the group (majority criteria), while a greater value of α focuses more on the individual regret minimisation (opposition criteria). From the plot, it is observed that experimental alternatives E2 and E9 are consistently ranked in the 9th and 8th places, respectively, across the entire range of α. This is an indication that their ranking when compared to other alternatives is not influenced, regardless of changes in decision priorities. The experimental alternative, E3, is always ranked first for all values of α from 0 to 0.8 and rank 2 at α=0.9-1.0, meaning it is the strongest alternative no matter the decision-making approach. Alternatives E1, E4, E5, E7, E6 and E8 exhibit variations in their ranks at certain values of α. For example, E8 fluctuates from rank 2 when α is 0 to rank 3 when 0.4≤ α ≥ 0.7. And further change its rank from 3 to 4 when α ≥ 0.7, thereby revealing considerable sensitivity to the relative weight given to collective utility over individual regret. Likewise, E4 fluctuates from rank 7 when α is 0.0 to rank 6 when α=0.4, the rank 5 when 0.5≤ α ≥ 0.7, and further rank 3 when α ≥ 0.8. Some options cross each other at mid-way α values (e.g., E1 and E5 cross each other from α=0.7, E4 and E1 between α=0.4), which indicates that the decision-maker's preference must be taken into consideration in the final decision. Alternatives like experimental condition E4 and E7 have a downward trend in their performances as α increases, whereas alternatives like E5, E6 and E8 have an upward trend, which implies different strengths concerning collective utility relative to individual regret performance. In conclusion, the analysis confirms that while in both cases, the E3 experimental condition (50% infill density, with ±45° raster angle, honeycomb infill pattern and 9% banana microfiber loading) remains the most preferred alternative across all scenarios.
Figure 12.
Sensitivity analysis of VIKOR.
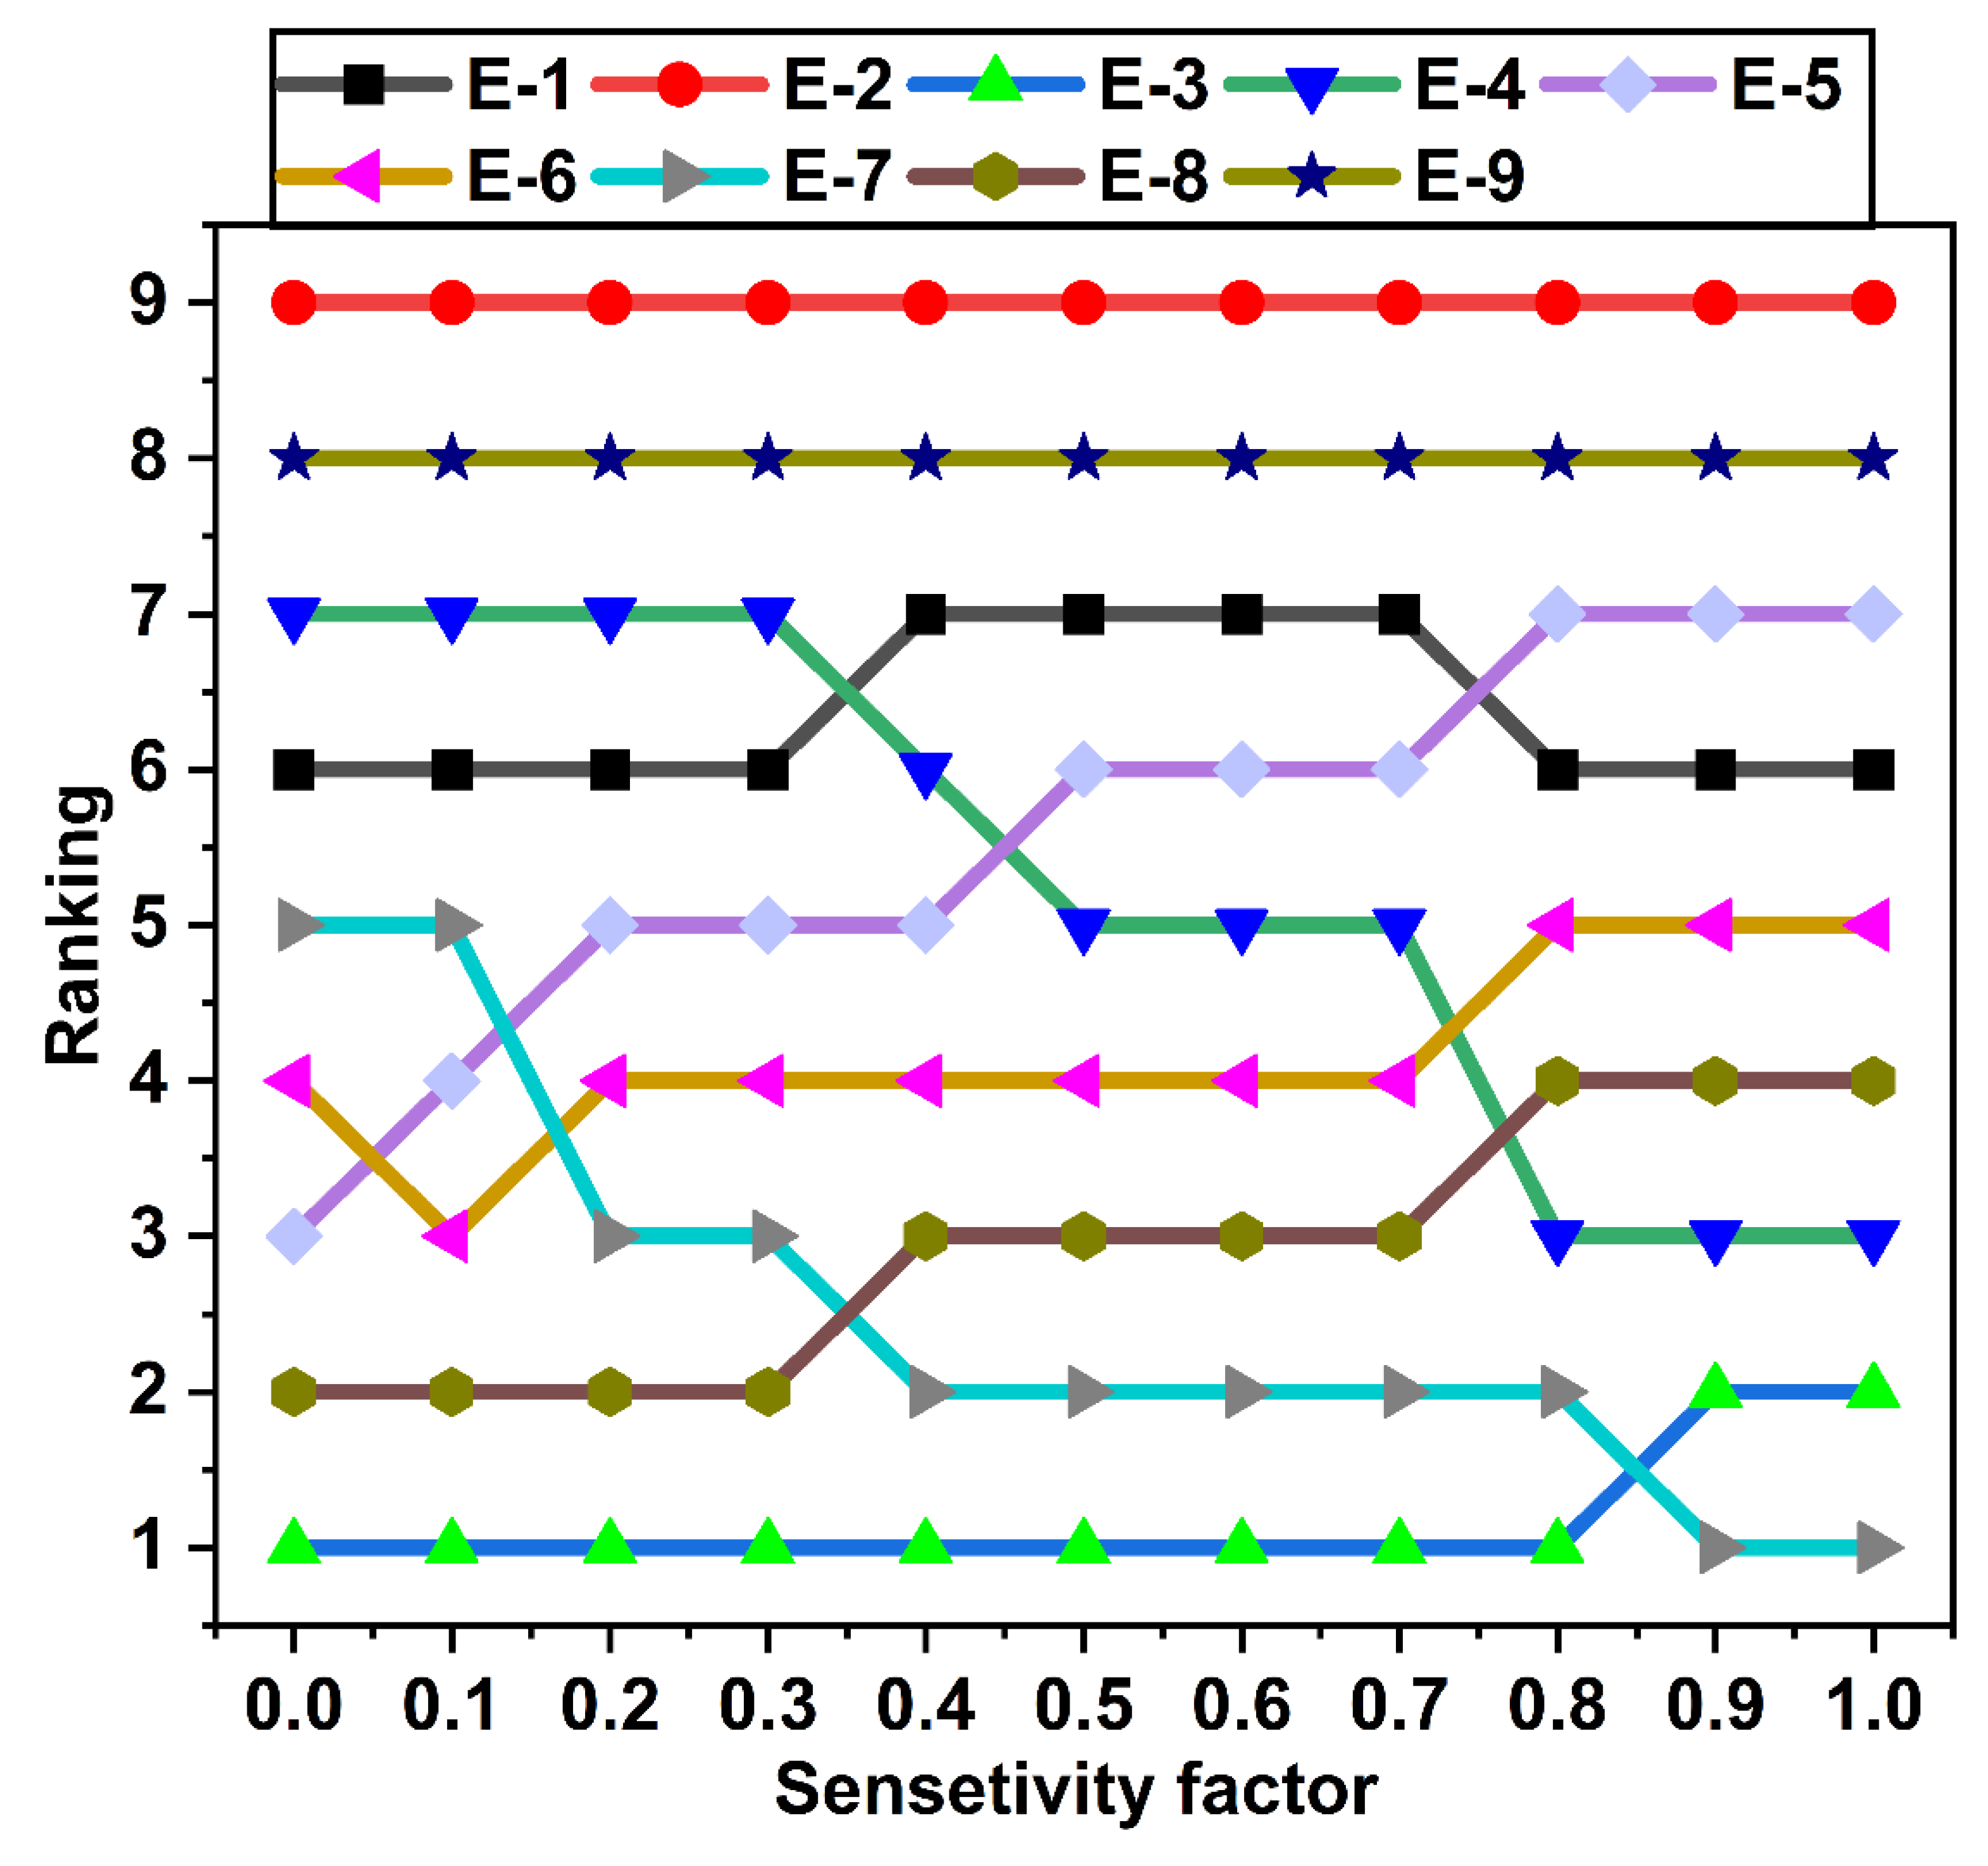
Table 7.
Decision matrix.
| Criteria → | C1 | C2 | C3 | C4 | C5 | C6 | C7 | C8 | C9 | C10 |
| Materials ↓ | Tensile Strength | Tensile Modulus | Elongation at break | Flexural Strength | Flexural Modulus | Compressive Strength | Compressive Modulus | IFSS | Impact Strength | Natural Frequency |
| (MPa) | (GPa) | (%) | (MPa) | (GPa) | (MPa) | (MPa) | (MPa) | (kJ/m2) | (Hz) | |
| E1 | 47.26 | 3.65 | 1.82 | 41.01 | 3.12 | 35.77 | 201.33 | 4.14 | 22.17 | 42.23 |
| E2 | 45.59 | 3.36 | 1.79 | 52.03 | 3.95 | 28.76 | 148.23 | 3.75 | 18.23 | 47.40 |
| E3 | 42.63 | 3.11 | 1.94 | 69.10 | 4.78 | 54.02 | 279.07 | 5.50 | 16.09 | 52.20 |
| E4 | 62.45 | 5.04 | 1.33 | 74.18 | 5.03 | 48.68 | 231.87 | 4.73 | 10.02 | 60.36 |
| E5 | 41.56 | 2.89 | 1.52 | 45.85 | 3.36 | 34.91 | 256.81 | 3.92 | 19.92 | 39.62 |
| E6 | 51.66 | 3.97 | 1.63 | 56.35 | 4.29 | 38.64 | 219.90 | 6.22 | 16.74 | 45.53 |
| E7 | 54.39 | 4.20 | 1.15 | 79.78 | 5.44 | 60.73 | 367.89 | 5.04 | 11.61 | 58.44 |
| E8 | 56.31 | 4.43 | 1.24 | 60.38 | 4.53 | 42.34 | 227.13 | 5.73 | 15.14 | 50.11 |
| E9 | 57.79 | 4.66 | 1.33 | 49.71 | 3.63 | 32.75 | 161.25 | 4.40 | 12.29 | 55.94 |
Table 8.
Weightage of different criteria.
| Criteria → | C1 | C2 | C3 | C4 | C5 | C6 | C7 | C8 | C9 | C10 |
| Weightage → | 0.0460 | 0.0793 | 0.0778 | 0.1155 | 0.0793 | 0.1430 | 0.1908 | 0.0720 | 0.1488 | 0.0471 |
5. Conclusion
This study investigates the impact of crucial 3D printing parameters like infill density, raster angle, bioinspired infill pattern, and banana fiber content percentage in the filament on the mechanical properties of biocomposites. Banana microfibers, treated with 5% NaOH to enhance crystallinity and interfacial bonding, were used as reinforcement. In-house 3D-printable filaments were developed, and specimens were fabricated following the Taguchi T9 design of experiments, incorporating variations in the selected printing parameters. Mechanical characterization was performed to evaluate the resulting performance of the different printing conditions. The VIKOR multi-criteria decision-making approach was employed to determine the most efficient printing conditions. Based on these experimental results, the following conclusions are drawn.
- The chemical treatment of banana fiber increases the crystallinity index of the lignocellulose fiber. Introduction of banana microfiber into the PLA matrix for composite filament enhances glass transition temperature (Tg), there are minor differences in cold crystalline temperature (Tcc), and a declining trend is observed with melting temperature (Tm) for composite filament in comparison with virgin PLA filament.
- Addition of Banana fiber into PLA matrix increases the value of storage modulus, loss modulus and complex viscosity. The flow behaviour index (n) value for composite filaments is found to be less than one, making it suitable for 3D printing.
- An increase in the proportion of banana microfiber within the filament increases stiffness and load-carrying capacity, leading to greater tensile, flexural, compressive, and interfacial shear strength and modulus. But brittleness was also enhanced, resulting in a decrease in elongation at break and lower impact strength of the printed composite.
- An increase in infill density decreases the internal voids and enhances the load distribution, therefore enhancing tensile, flexural, and compression strengths. Increased stiffness resulting from increased density, however, decreased the impact energy absorption capacity of the material to a limited degree.
- Specimens fabricated using a 45° raster angle had greater impact strength owing to the inclined filament path, permitting shear deformation and energy absorption during loading cycles. 0° and ±45° orientations, on the other hand, favoured tensile and flexural strength by orienting the filaments more orthogonally in the direction of the load path.
- The bioinspired gyroid architecture had the greatest impact strength owing to its continuous and curved nature, which serves to dissipate energy effectively. Honeycomb and rectilinear structures offered greater stiffness and strength but had lower energy absorption capacity under impact loading conditions.
- Multi-decision criteria, VIKOR, conclude the experimental condition E3 (50% infill density, with ±45° raster angle, honeycomb infill pattern and 9% banana microfiber loading) as the most effective printing condition to achieve overall better mechanical properties.
- Addition of banana fiber, an agro waste reduces the overall cost of the composite materials. For PLA-banana fiber composite the major cost comes from PLA. As the addition of banana fiber into PLA decreases the overall cost of materials and make the composite more affordable. Not only that most common biodegradability mechanism of materials depends on the moister sensitivity of the material. Addition of biomass make the composite hydrophilic, accelerated the rate of biodegradation.
This experimental study concludes that the developed biocomposite filament and its 3D printing have significant potential for numerous engineering applications. A future investigation might investigate the effects of hybrid reinforcement utilizing natural fibres and synthetic fibres, along with bioinspired infill patterns, on the strength-toughness balance of 3D printed biocomposites. Additionally, conducting long-term durability tests with cyclic loading conditions and environmental ageing will provide valuable insight into their suitability for real-world applications.
Funding
The present experimental work is funded through the institute's post-doctoral contingency grant and NFIG grant of IIT Madras and the Ministry of Education, Govt. of India.
Data Availability Statement
Data is available with corresponding author for reasonable request.
Acknowledgments
The authors would like to thank Composite Technology Centre, IIT Madras for providing twin screw extrusion and mechanical testing facilities. The authors are also grateful to Centre for Sustainable Polymers, IIT Guwahati for providing R.P extruder filament maker.
References
- Wang Y, Sultana J, Rahman MM, Ahmed A, Azam A, Mushtaq RT, et al. A Sustainable and Biodegradable Building Block: Review on Mechanical Properties of Bamboo Fibre Reinforced PLA Polymer Composites and Their Emerging Applications. Fibers and Polymers 2022;23:3317–42. [CrossRef]
- Rajendran Royan NR, Leong JS, Chan WN, Tan JR, Shamsuddin ZSB. Current state and challenges of natural fibre-reinforced polymer composites as feeder in fdm-based 3d printing. Polymers (Basel) 2021;13. [CrossRef]
- Kartal, Fuat, and Arslan Kaptan. Response of PLA material to 3D printing speeds: A comprehensive examination on mechanical properties and production quality. European Mechanical Science 8, no. 3 (2024): 137-144.
- Montalvo Navarrete JI, Hidalgo-Salazar MA, Escobar Nunez E, Rojas Arciniegas AJ. Thermal and mechanical behavior of biocomposites using additive manufacturing. International Journal on Interactive Design and Manufacturing 2018;12:449–58. [CrossRef]
- Leon-Becerra J, González-Estrada OA, Sánchez-Acevedo H. Comparison of Models to Predict Mechanical Properties of FR-AM Composites and a Fractographical Study. Polymers (Basel) 2022;14. [CrossRef]
- León-Becerra J, González-Estrada OA, Quiroga J. Effect of Relative Density in In-Plane Mechanical Properties of Common 3D-Printed Polylactic Acid Lattice Structures. ACS Omega 2021;6:29830–8. [CrossRef]
- Wang W, Ge J, Yu X, Li H. Environmental fate and impacts of microplastics in soil ecosystems: Progress and perspective. Science of the Total Environment 2020;708. [CrossRef]
- Arif ZU, Khalid MY, Sheikh MF, Zolfagharian A, Bodaghi M. Biopolymeric sustainable materials and their emerging applications. J Environ Chem Eng 2022;10. [CrossRef]
- Kopparthy SDS, Netravali AN. Review: Green composites for structural applications. Composites Part C: Open Access 2021;6. [CrossRef]
- Petković B, Agdas AS, Zandi Y, Nikolić I, Denić N, Radenkovic SD, et al. Neuro fuzzy evaluation of circular economy based on waste generation, recycling, renewable energy, biomass and soil pollution. Rhizosphere 2021;19. [CrossRef]
- Yaashikaa PR, Senthil Kumar P, Karishma S. Review on biopolymers and composites – Evolving material as adsorbents in removal of environmental pollutants. Environ Res 2022;212. [CrossRef]
- Natural Fiber Composite Market Size, Share and Trends_2025-2030. n.d.
- Barbhuiya S, Bhusan Das B, Kanavaris F. Biochar-concrete: A comprehensive review of properties, production and sustainability. Case Studies in Construction Materials 2024;20. [CrossRef]
- Barbhuiya S, Bhusan Das B, Kanavaris F. Biochar-concrete: A comprehensive review of properties, production and sustainability. Case Studies in Construction Materials 2024;20. [CrossRef]
- Sathish Kumar RK, Sasikumar R, Dhilipkumar T. Exploiting agro-waste for cleaner production: A review focusing on biofuel generation, bio-composite production, and environmental considerations. J Clean Prod 2024;435. [CrossRef]
- Uppal N, Pappu A, Gowri VKS, Thakur VK. Cellulosic fibres-based epoxy composites: From bioresources to a circular economy. Ind Crops Prod 2022;182. [CrossRef]
- Maseko KH, Regnier T, Meiring B, Wokadala OC, Anyasi TA. Musa species variation, production, and the application of its processed flour: A review. Sci Hortic 2024;325. [CrossRef]
- Scott GJ. A review of root, tuber and banana crops in developing countries: past, present and future. Int J Food Sci Technol 2021;56:1093–114. [CrossRef]
- Garlotta D. A Literature Review of Poly(Lactic Acid). vol. 9. 2001.
- Joseph TM, Kallingal A, Suresh AM, Mahapatra DK, Hasanin MS, Haponiuk J, et al. 3D printing of polylactic acid: recent advances and opportunities. International Journal of Advanced Manufacturing Technology 2023;125:1015–35. [CrossRef]
- Selvam A, Mayilswamy S, Whenish R. Strength Improvement of Additive Manufacturing Components by Reinforcing Carbon Fiber and by Employing Bioinspired Interlock Sutures. Journal of Vinyl and Additive Technology 2020;26:511–23. [CrossRef]
- Yiga VA, Lubwama M, Pagel S, Benz J, Olupot PW, Bonten C. Flame retardancy and thermal stability of agricultural residue fiber-reinforced polylactic acid: A Review. Polym Compos 2021;42:15–44. [CrossRef]
- Yiga VA, Lubwama M, Pagel S, Benz J, Olupot PW, Bonten C. Flame retardancy and thermal stability of agricultural residue fiber-reinforced polylactic acid: A Review. Polym Compos 2021;42:15–44. [CrossRef]
- Zini E, Scandola M. Green composites: An overview. Polym Compos 2011;32:1905–15. [CrossRef]
- Mohamed Shafeer PP, Pitchaimani J, Doddamani M. A short banana fiber—PLA filament for 3D printing: Development and characterization. Polym Compos 2025;46:4863–80. [CrossRef]
- Komal UK, Lila MK, Singh I. PLA/banana fiber based sustainable biocomposites: A manufacturing perspective. Compos B Eng 2020;180. [CrossRef]
- Shih YF, Huang CC. Polylactic acid (PLA)/banana fiber (BF) biodegradable green composites. Journal of Polymer Research 2011;18:2335–40. [CrossRef]
- Nazrin A, Sapuan SM, Zuhri MYM. Mechanical, physical and thermal properties of sugar palm nanocellulose reinforced thermoplastic starch (Tps)/poly (lactic acid) (pla) blend bionanocomposites. Polymers (Basel) 2020;12:1–18. [CrossRef]
- Suryanegara L, Yano H. Manufacture of Nanocomposites Based On Microfibrillated Cellulose and Polylactic Acid. 2015.
- Satriyatama A, Rochman VAA, Adhi RE. Study of the Effect of Glycerol Plasticizer on the Properties of PLA/Wheat Bran Polymer Blends. IOP Conf Ser Mater Sci Eng 2021;1143:012020. [CrossRef]
- Mohamed Shafeer PP, Pitchaimani J, Doddamani M. A short banana fiber—PLA filament for 3D printing: Development and characterization. Polym Compos 2025;46:4863–80. [CrossRef]
- Stoof D, Pickering K, Zhang Y. Fused deposition modelling of natural fibre/polylactic acid composites. Journal of Composites Science 2017;1. [CrossRef]
- Felix Sahayaraj A, Muthukrishnan M, Ramesh M. Experimental investigation on physical, mechanical, and thermal properties of jute and hemp fibers reinforced hybrid polylactic acid composites. Polym Compos 2022;43:2854–63. [CrossRef]
- Ye G, Li Z, Chen B, Bai X, Chen X, Hu Y. Performance of polylactic acid/polycaprolactone/microcrystalline cellulose biocomposites with different filler contents and maleic anhydride compatibilization. Polym Compos 2022;43:5179–88. [CrossRef]
- Wasti S, Triggs E, Farag R, Auad M, Adhikari S, Bajwa D, et al. Influence of plasticizers on thermal and mechanical properties of biocomposite filaments made from lignin and polylactic acid for 3D printing. Compos B Eng 2021;205. [CrossRef]
- Tao Y, Wang H, Li Z, Li P, Shi SQ. Development and application ofwood flour-filled polylactic acid composite filament for 3d printing. Materials 2017;10. [CrossRef]
- Suteja J, Firmanto H, Soesanti A, Christian C. Properties investigation of 3D printed continuous pineapple leaf fiber-reinforced PLA composite. Journal of Thermoplastic Composite Materials 2022;35:2052–61. [CrossRef]
- Vigneshwaran K, Venkateshwaran N. Statistical analysis of mechanical properties of wood-PLA composites prepared via additive manufacturing. International Journal of Polymer Analysis and Characterization 2019;24:584–96. [CrossRef]
- Ahmad ND, Kusmono, Wildan MW, Herianto. Preparation and properties of cellulose nanocrystals-reinforced Poly (lactic acid) composite filaments for 3D printing applications. Results in Engineering 2023;17. [CrossRef]
- Kumar S, Singh R, Singh TP, Batish A. Investigations of polylactic acid reinforced composite feedstock filaments for multimaterial three-dimensional printing applications. Proc Inst Mech Eng C J Mech Eng Sci 2019;233:5953–65. [CrossRef]
- Mahmud MZ Al, Rabbi SMF, Islam MD, Hossain N. Synthesis and applications of natural fiber-reinforced epoxy composites: A comprehensive review. SPE Polymers 2025;6. [CrossRef]
- Arunprasath K, Senthamaraikannan P, Suyambulingam I, Akash S, Karthic S, Vimal Chanth M, et al. Comprehensive review of advances in natural fiber composites for conductive and EMI shielding applications: Materials, mechanisms, and future prospects. Int J Biol Macromol 2025;320. [CrossRef]
- He Q, Tang T, Zeng Y, Iradukunda N, Bethers B, Li X, et al. Review on 3D Printing of Bioinspired Structures for Surface/Interface Applications. Adv Funct Mater 2024;34. [CrossRef]
- Siddique SH, Hazell PJ, Wang H, Escobedo JP, Ameri AAH. Lessons from nature: 3D printed bio-inspired porous structures for impact energy absorption – A review. Addit Manuf 2022;58. [CrossRef]
- Zhang Q, Yang X, Li P, Huang G, Feng S, Shen C, et al. Bioinspired engineering of honeycomb structure - Using nature to inspire human innovation. Prog Mater Sci 2015;74:332–400. [CrossRef]
- Helms M, Vattam SS, Goel AK. Biologically inspired design: process and products. Des Stud 2009;30:606–22. [CrossRef]
- Saha A, Kulkarni ND, Kumari P. Development of Bambusa tulda fiber-micro particle reinforced hybrid green composite: A sustainable solution for tomorrow’s challenges in construction and building engineering. Constr Build Mater 2024;441. [CrossRef]
- Bagla A, Kulkarni ND, Kumari P, Saha A. Development and Characterization of a Sustainable Bamboo-Polyvinylidene Fluoride Electro Spun Piezoelectric Nanogenerator Device for Smart Health Monitoring. ACS Appl Polym Mater 2025;7:5584–97. [CrossRef]
- Kumar S, Saha A. Graphene nanoplatelets/organic wood dust hybrid composites: physical, mechanical and thermal characterization. Iranian Polymer Journal (English Edition) 2021;30:935–51. [CrossRef]
- Kumar S, Saha A. Utilization of coconut shell biomass residue to develop sustainable biocomposites and characterize the physical, mechanical, thermal, and water absorption properties. Biomass Convers Biorefin 2024;14:12815–31. [CrossRef]
- Saha A, Kumari P. Effect of alkaline treatment on physical, structural, mechanical and thermal properties of Bambusa tulda (Northeast Indian species) based sustainable green composites. Polym Compos 2023;44:2449–73. [CrossRef]
- Hassan M, Mohanty AK, Misra M. Additive Manufacturing of a Super Toughened Biodegradable Polymer Blend: Structure-Property-Processing Correlation and 3D Printed Prosthetic Part Development. ACS Appl Polym Mater 2024;6:3849–63. [CrossRef]
- Test Method for Tensile Properties of Plastics 2014. [CrossRef]
- Test Methods for Flexural Properties of Unreinforced and Reinforced Plastics and Electrical Insulating Materials 2015. [CrossRef]
- International A, indexed by mero files. Standard Test Method for Compressive Properties Of Rigid Cellular Plastics 1. n.d.
- International A, indexed by mero files. Standard Test Method for Flexural Strength of Adhesive Bonded Laminated Assemblies 1. n.d.
- Test Methods for Determining the Izod Pendulum Impact Resistance of Plastics 2010. [CrossRef]
- Saha A, Kulkarni ND, Kumari P. Development of Bambusa tulda-reinforced different biopolymer matrix green composites and MCDM-based sustainable material selection for automobile applications. Environ Dev Sustain 2025;27:10655–91. [CrossRef]
- Kumar M, Kulkarni ND, Saha A, Kumari P. Using multi-criteria decision-making approach for material alternatives in TiO2/P(VDF-TrFE)/PDMS based hybrid nanogenerator as a wearable device. Sens Actuators A Phys 2024;372. [CrossRef]
- Kulkarni ND, Saha A, Kumari P. Utilizing multicriteria decision-making approach for material selection in hybrid polymer nanocomposites for energy-harvesting applications. Polym Compos 2024;45:6264–77. [CrossRef]
- Liu HC, You JX, You XY, Shan MM. A novel approach for failure mode and effects analysis using combination weighting and fuzzy VIKOR method. Applied Soft Computing Journal 2015;28:579–88. [CrossRef]
- Saha A, Kumari P. Functional fibers from Bambusa tulda (Northeast Indian species) and their potential for reinforcing biocomposites. Mater Today Commun 2022;31. [CrossRef]
- Lila MK, Komal UK, Singh Y, Singh I. Extraction and Characterization of Munja Fibers and Its Potential in the Biocomposites. Journal of Natural Fibers 2022;19:2675–93. [CrossRef]
- Komal UK, Lila MK, Singh I. Processing of PLA/pineapple fiber based next generation composites. Materials and Manufacturing Processes 2021;36:1677–92. [CrossRef]
- Das A, Gilmer EL, Biria S, Bortner MJ. Importance of Polymer Rheology on Material Extrusion Additive Manufacturing: Correlating Process Physics to Print Properties. ACS Appl Polym Mater 2021;3:1218–49. [CrossRef]
- Gao X, Qi S, Kuang X, Su Y, Li J, Wang D. Fused filament fabrication of polymer materials: A review of interlayer bond. Addit Manuf 2021;37. [CrossRef]
- Bertolino M, Battegazzore D, Arrigo R, Frache A. Designing 3D printable polypropylene: Material and process optimisation through rheology. Addit Manuf 2021;40. [CrossRef]
- Bertolino M, Battegazzore D, Arrigo R, Frache A. Designing 3D printable polypropylene: Material and process optimisation through rheology. Addit Manuf 2021;40. [CrossRef]
- Veeman D, Palaniyappan S. Process optimisation on the compressive strength property for the 3D printing of PLA/almond shell composite. Journal of Thermoplastic Composite Materials 2023;36:2435–58. [CrossRef]
- Aboelella MG, Ebeid SJ, Sayed MM. Layer combination of similar infill patterns on the tensile and compression behavior of 3D printed PLA. Sci Rep 2025;15. [CrossRef]
- Thirugnanasambandam A, Packkirisamy V, Narayanaswamy N, Rangappa SM, Siengchin S, Kechagias JD. Influence of infill patterns on the mechanical and antibacterial properties of 3D-printed polylactic acid reinforced with hydroxyapatite/magnesium oxide bone repair scaffolds. Emergent Mater 2025. [CrossRef]
- Goshtasbi A, Grignaffini L, Sadeghi A. Bio-inspired 3D printing approach for bonding soft and rigid materials through underextrusion. Sci Rep 2025;15. [CrossRef]
- Podroužek J, Marcon M, Ninčević K, Wan-Wendner R. Bio-inspired 3D infill patterns for additive manufacturing and structural applications. Materials 2019;12. [CrossRef]
- Silva C, Pais AI, Caldas G, Gouveia BPPA, Alves JL, Belinha J. Study on 3D printing of gyroid-based structures for superior structural behaviour. Progress in Additive Manufacturing 2021;6:689–703. [CrossRef]
- Cañero-Nieto JM, Campo-Campo RJ, Díaz-Bolaño I, Ariza-Echeverri EA, Deluque-Toro CE, Solano-Martos JF. Infill pattern strategy impact on the cross-sectional area at gauge length of material extrusion 3D printed polylactic acid parts. J Intell Manuf 2025. [CrossRef]
- Cañero-Nieto JM, Campo-Campo RJ, Díaz-Bolaño I, Ariza-Echeverri EA, Deluque-Toro CE, Solano-Martos JF. Infill pattern strategy impact on the cross-sectional area at gauge length of material extrusion 3D printed polylactic acid parts. J Intell Manuf 2025. [CrossRef]
- Sun Y, Tian W, Zhang T, Chen P, Li M. Strength and toughness enhancement in 3d printing via bioinspired tool path. Mater Des 2020;185. [CrossRef]
- Naik M, Thakur DG. Experimental investigation of effect of printing parameters on impact strength of the bio-inspired 3D printed specimen n.d.
Disclaimer/Publisher’s Note: The statements, opinions and data contained in all publications are solely those of the individual author(s) and contributor(s) and not of MDPI and/or the editor(s). MDPI and/or the editor(s) disclaim responsibility for any injury to people or property resulting from any ideas, methods, instructions or products referred to in the content. |
© 2025 by the authors. Licensee MDPI, Basel, Switzerland. This article is an open access article distributed under the terms and conditions of the Creative Commons Attribution (CC BY) license (http://creativecommons.org/licenses/by/4.0/).
Copyright: This open access article is published under a Creative Commons CC BY 4.0 license, which permit the free download, distribution, and reuse, provided that the author and preprint are cited in any reuse.


