
Submitted:
21 October 2025
Posted:
27 October 2025
You are already at the latest version
Abstract
Nature has always been a reliable source of innovation, providing rich and successful solutions for a broad scope of scientific and engineering problems. Drawing from these natural strategies, researchers have developed innovative designs for advanced materials and technologies. In this research, biocomposite samples were fabricated with bio-inspired infill patterns, most notably gyroid and honeycomb structures and using Fused Filament Fabrication (FFF) technique. The printing material was developed by infusing PLA with wood microparticles, a type of industrial/agro-forestry waste, to produce environmentally friendly biocomposites in accordance with the principles of the circular economy. To determine the impact of infill pattern, infill density, and temperature on printing, a Taguchi T9 design of experiment was employed, providing nine distinct printing conditions. Mechanical tests, including tensile, flexural, compressive, impact, interfacial shear strength, and natural frequency, were conducted. The highest tensile strength (86.33 ± 2.83 MPa), tensile modulus (4.98 ± 0.12 GPa), and natural frequency (64.45 ± 2.81 Hz) were observed with rectilinear infill pattern with 100% infill density, 200°C printing temperature and 60mm/sec printing speed (PRC-3). Whereas, the hexagon infill pattern, with 75% infill density, 200°C printing temperature and 40mm/sec printing speed (PRC-5) showed the greatest flexural strength (70.12 ± 3.06 MPa) and compressive strength (53.00 ± 2.66 MPa), while the gyroid infill pattern, 50% infill density with printing temperature of 200°C and 50mm/sec printing speed (PRC-7) showed maximum impact strength (24.69 ± 0.51 kJ/m²) and elongation at break (1.94 ± 0.02%). Because various printing conditions were best under different properties, the TODIM multi-criteria decision analysis approach was employed, and the fifth condition (75% infill density, 200°C printing temperature, 40 mm/s speed, honeycomb pattern) was the best overall. These PLA-wood micro particle biocomposites show significant potential to be sustainable substitutes for conventional materials for industrial and engineering applications.
Keywords:
biocomposite
; 3D-printing
; wood microparticles
; Bioinspired design
; mechanical properties
1. Introduction
Additive manufacturing (AM) is a technology for layer-by-layer fabrication of objects with complex shapes and geometries without the use of specific casting moulds and tools associated with traditional casting [1]. Fused Filament Fabrication (FFF) is one of the most popular among many AM methods in which thermoplastic materials supplied in filament form are melted, extruded, and deposited layer by layer over a build platform to build three-dimensional parts [2,3]. This technique not only facilitates the manufacturing of complex designs but also reduces material wastage since the process is highly optimized for near-zero waste. Therefore, AM has become an efficient alternative method to conventional manufacturing techniques for development of functional components [4]. The overuse of petroleum-based polymers in daily life contradicts the principles of sustainable development and environmentally friendly policies. Since it is impossible to eliminate plastics, their use can be reduced by targeting natural fiber polymer composites obtained by adding naturally derived fillers or fibers to the polymer matrices [5]. The use of natural fibers or particles in polymer composites has several advantages, such as biodegradability, lower price, and a good CO₂ balance [6]. While fiber-reinforced polymer composites offer a significant enhancement in mechanical properties, these properties are contingent on the orientation of the fibers. In contrast, the samples with natural fillers exhibit isotropic mechanical behaviours because the strength values for all testing directions are identical. Several studies have reported that natural filler–reinforced composites exhibit adequate strength and lower density and are cheaper, more highly available, and sustainable than synthetic fiber-based composites [7,8].
Recent studies have predominantly focused on improving the performance of 3D printed parts by incorporating inorganic and organic fillers into thermoplastic matrices. For instance, Arif et al. [9] reported that the incorporation of 3 wt% carbon nanotubes (CNTs) into the PEEK matrix through fused filament fabrication led to a 20% increase in Young’s modulus and a 66% increase in storage modulus. Likewise, Hanon et al. [10] showed that bronze particles reinforced PLA composites produced by FDM (Fused Deposition Modeling) (also known as FFF) had better tensile, flexural, and tribological properties when printed in the “on-edge” direction. These findings confirm the significant impact of the filler type and print orientation on the composites’ performance. While the inorganic fillers have been studied extensively, the sustainable development trend has focused attention on natural fillers and fibers for the polymeric filaments used in FDM [11]. The natural reinforcements suffer from non-uniform dispersion, porosity, void formation and inconsistent fiber dimensions, which need to be properly addressed during compounding and extrusion. However, studies have reported positive results [12]. Balla et al. [13] used soybean hull fibers as the reinforcement materials for thermoplastic elastomers to produce filaments (5–10 wt%), with chemical treatment improving fracture toughness. Bhagia et al. [14] fabricated poplar tree-reinforced polymeric filaments displayed a tensile strength of 37–54 MPa and a Young’s modulus of 2.9–4. 9 GPa. Hence, there is a need to adequately characterize natural fillers before their use in 3D printing [15,16]. Among several natural fillers, wood filler gained significant attention due to its substantial advantages not only as a reinforcement material in polymer composites but also as low-cost, abundant by-products that support a circular economy and net-zero waste goals [17]. Worldwide, merely 15% of wood waste is reused, whereas the U.S. alone produces around 300 million tonnes per year, most of which finds its way into landfills. In addition, industrial and forestry residues supply hundreds of millions of tonnes of wood waste annually in large economies, countries like China (~300 million tonnes), the U.S. (~18 million short tons), and Brazil (~30 million tonnes), indicating considerable untapped potential [18,19,20]. In India, sawmills and forestry operations generate an estimated 150–200 million tonnes of wood waste annually (approximately 410,000–550,000 tonnes per day), much of which is not utilised to its full potential. Meanwhile, more than 70 % of India's wood waste is just being used as fuel to burn in boilers or brick kilns, producing air pollution and reducing carbon credits [21,22]. Incorporating these waste wood micro-particles as fillers in Wood-PLA biocomposites enables the valorization of agricultural and forest residues, which would otherwise be disposed of by burning or landfilling. This is perfectly in line with the waste management and circular economy goals: turning discarded biomass into green value-added products for 3D printing. In addition, wood particle composites (WPCs) have low density, good outdoor durability, recyclability, and biological degradation resistance. Thus, WPC is already employed in the furniture, decking, cladding, automotive interior parts and decoration items. In 3D printing, blending wood fibers into PLA filaments leads to a stiffer product [23,24]. However, excessive wood loading results in a rough and brittle surface. For instance, a study revealed that while adding 10% wood increased tensile strength by 5%, increasing the content to 50% reduced it by 58% [25]. Various parameters affected the mechanical properties of a 3d printed part, like infill density, infill pattern, printing speed, printing temperature, etc [26].
Infill density and infill patterns are also important parameters that may significantly impact the overall performance of any FDM printed parts. For instance, recently, a study explored the effects of infill density of FDM printed parts and observed that tensile properties increased significantly with an increase in infill density [27]. A similar study based on coconut wood-PLA composite analyzed the effect of different infill patterns and infill density on bending behaviour, showing that different infill patterns and densities significantly affect the bending properties. For example, 25% infill density showed 7.13 MPa, and 75% infill density showed 23.18 MPa of flexural strength [28]. Like this study, a current study of wood-PLA composite obtained the optimized outcomes of bending behaviour in 75% infill density. The study also confirmed that an increase in infill density could linearly enhance the mechanical characteristics [29]. Though the above studies emphasize the effects of conventional infill patterns, such as rectilinear, triangular, and grid, recent research has moved toward bioinspired infill architecture that resembles nature. Patterns like gyroid, honeycomb, and Voronoi are widely studied because they achieve a combination of mechanical strength and low weight, like what is observed in nature (e.g., bones, shells, insect wings). The gyroid structure is a type of triply periodic minimal surface (TPMS) infill that reportedly offers superior load distribution, energy absorption, and isotropic behaviour than conventional rectilinear infills [30]. Honeycomb structures, which emulate the beehive’s design, are known for their high stiffness and strength-to-weight ratio and have been extensively studied in aerospace and packaging. The structures designed by 3D printing demonstrate better compressive and flexural performance with lower material cost [31]. A study showed that TPMS-based structures have higher specific strength and energy absorption, compared to lattice-based ones in a study with the gyroid design [32]. Similarly, a study on honeycomb and gyroid infills in PLA and its composites showed that these bioinspired geometries enhance the fatigue resistance and impact toughness of printed parts without a significant weight penalty [33]. However, the potential of bioinspired infill patterns in wood-PLA composites remains unexplored. Most of the work done on wood-filled composites concentrates mainly on infill density and the use of traditional rectilinear or grid infills. Therefore, the possibility of improving the mechanical and energy absorption properties of wood-PLA composites with the help of bioinspired infill geometries needs further investigation. Nozzle temperature (also known as printing temperature) is critical for the mechanical performance of PLA filaments. A review on FDM process parameters concluded that higher nozzle temperatures generally improve mechanical strength and dimensional accuracy of the printed parts, while lower temperatures tend to inhibit printing owing to high viscosity and inadequate flow [29,34]. These observations do not directly apply to natural fiber-reinforced composites (NFRCs). For example, in NFRC-based fibers, the best processing temperature is typically below 205°C, and overheating causes degradation of fibers with poor mechanical performance. The printing speed is another key factor that affects the deposition quality and properties of printed parts. Studies have demonstrated that lower printing speed leads to an increment in tensile strength. In the ABS parts, it was observed that the tensile strength decreased substantially at a speed exceeding 30 mm/s [35,36]. In the case of wood–polymer composites (WPCs), a drop in compressive strength of the samples was observed with increasing printing speed from 30 to 70 mm/s due to a respective decrease in part density [37]. Despite numerous studies on the effect of processing parameters such as nozzle temperature, print speed, and infill density of PLA filament, the potential use of wood–PLA as a sustainable material for 3D printing when combined with bioinspired infill patterns remains relatively unexplored. Most of the research studies focused on the printing parameters optimization to improve one mechanical property, such as tensile or compressive strength. However, there is still a huge research gap in optimizing the printing parameters for multi-attribute mechanical performance. In particular, the strategies to achieve a uniform improvement of mechanical properties such as tensile, flexural and compressive strength are not yet adequately developed.
Therefore, the present study focuses on the TODIM-based multi-attribute optimization of printing parameters, including bioinspired infill pattern, infill density, printing speed and printing temperature. Wood biomass collected from a local wood workshop was processed to develop 9 wt.% wood blended filaments, which were further used in 3D printing at varying parameters. To reduce the number of experiments, a Taguchi L9 design of experiment was adopted, leading to nine experimental trials combining three infill patterns (gyroid, honeycomb, and rectilinear), three infill densities (50%, 75%, and 100%), three printing temperatures (180, 190, and 200°C), and three printing speeds (40, 50, and 60 mm/s). The developed filament was characterized for printability, while the printed samples were subjected to various mechanical tests such as tensile, flexural, compressive, impact, short beam shear and natural frequency analyses. The effects of various printing parameters were thoroughly investigated, and the TODIM, multi attribute decision making method was utilized to find the best combination of printing parameters. The findings suggest that the engineered wood–PLA composites with bioinspired infill geometry may have great potential for everyday engineering applications in daily life, specifically as 3D-printed lightweight panels for automotive and aerospace (e.g., UAV) interiors; customized lightweight furniture with wood-like appearance; biodegradable packaging trays; as well as household products, toys, and lifestyle accessories.
2. Materials and Methodology
2.1. Materials
Bio-based polylactic acid (PLA) pellets (grade 4043D, Nature Works, USA) were received from Srushti Global, Maharashtra, India. Organic wood biomass was collected from the university's local carpentry workshop, where it forms a major by-product of wood processing operations. Sodium hydroxide pellets (NaOH) and acetone were provided by Merck Life Science Private Limited and distributed by Sri Durga Laboratory Equipment Supplies, Chennai. Both acetone and sodium hydroxide had a stated purity of 99% and were used in the chemical treatment of wood microparticles before fabrication of the composites.
2.2. Chemical Treatment and Development of Wood Micro Particles
Wood dust, one of the natural by-products of the timber industry, poses environmental issues when it is discarded or incinerated because it releases toxic gases into the air, contributing to air pollution and global warming. To make better use of this biomass, the obtained wood dust was processed for its utilization as a reinforcement material in green composite manufacturing. Firstly, a powerful magnet was used to remove fine magnetic impurities, especially iron residues. Removal of grease, non-ferrous metallic particles, and soil contamination were among the most important challenges in the preparation of the material. In this regard, the wood dust was thoroughly washed with water and acetone under magnetic stirring. The purified material was subsequently oven-dried at 60°C for 8 hours. The dried wood dust was then subjected to grinding for 30 min to achieve uniform particle morphology and subsequent sieving through a mesh of grid size 100 microns in order to obtain the required particle size. The resulting particles from this process are hereinafter named as untreated wood particles. The wood particles were treated with a 5% sodium hydroxide (NaOH) solution for 8 hours at 48°C and 500 rpm, a procedure known as alkalization. Following chemical treatment, the particles were washed with distilled water and acetone until a neutral pH of 7 was achieved. The particles were then dried in an oven at 60°C for 8 to 12 hours. These processed materials are referred to as treated wood particles.
2.3. Development of Wood-PLA Biocomposite Filament
A twin-screw extruder (Model: FUE-1MI, FLYTECH ENGINEERS, Chennai, India) was used to blend wood microparticles at a 9% weight fraction with PLA polymer. PLA filament having 9% wood content was selected since below 9%, there is no noticeable improvement in mechanical properties, while above 9%, the higher wood content increases the risk of nozzle clogging in the 3D printer [38,39]. From different previous studies, around 9–10% wood offers a good balance of strength and print reliability, making it the most suitable choice for performance and ease of printing process [40,41]. Since a higher weight fraction of reinforcement particle caused clogging issues during 3D printing, for this study, the wood particle reinforcement was fixed at 9% by weight. The twin crew extruder had four heating zones: feeding, melting, mixing, and discharge. The process involved temperature settings of 170°C, 210°C, 190°C, and 200°C for the respective zones. The length-to-diameter (L/D) ratio of the extruder was 25:1, with a discharge nozzle diameter of 2mm, and its compression ratio was 2.5:1. Rotation of the screw was kept at 60 rpm, and the feed rate of the blended material was kept as 20 grams per minute. The mixed material was air-cooled and pelletized to produce composite pellets. These pellets were initially preheated to 45°C and then fed into a 3D printer filament maker (RP Extruder, Chennai, India), which comprised a single-screw extruder, roller, and filament winder. At the time of filament extrusion, the barrel temperature was regulated at 150°C to 180°C, and the feed was at 25 g/min. The extrudate was passed through a 1.8 mm nozzle and was cooled immediately in a water bath. The cooled filament (greater than glass transition temperature) was then guided through the roller and collected by the filament winder (filament temperature was less than glass transition temperature) to give a composite filament appropriate for 3D printing with a finished diameter of 1.75 ± 0.1 mm. The schematic of the filament development process is presented in Figure 1.
2.4. 3D Printing of Wood-PLA Biocomposite Filament
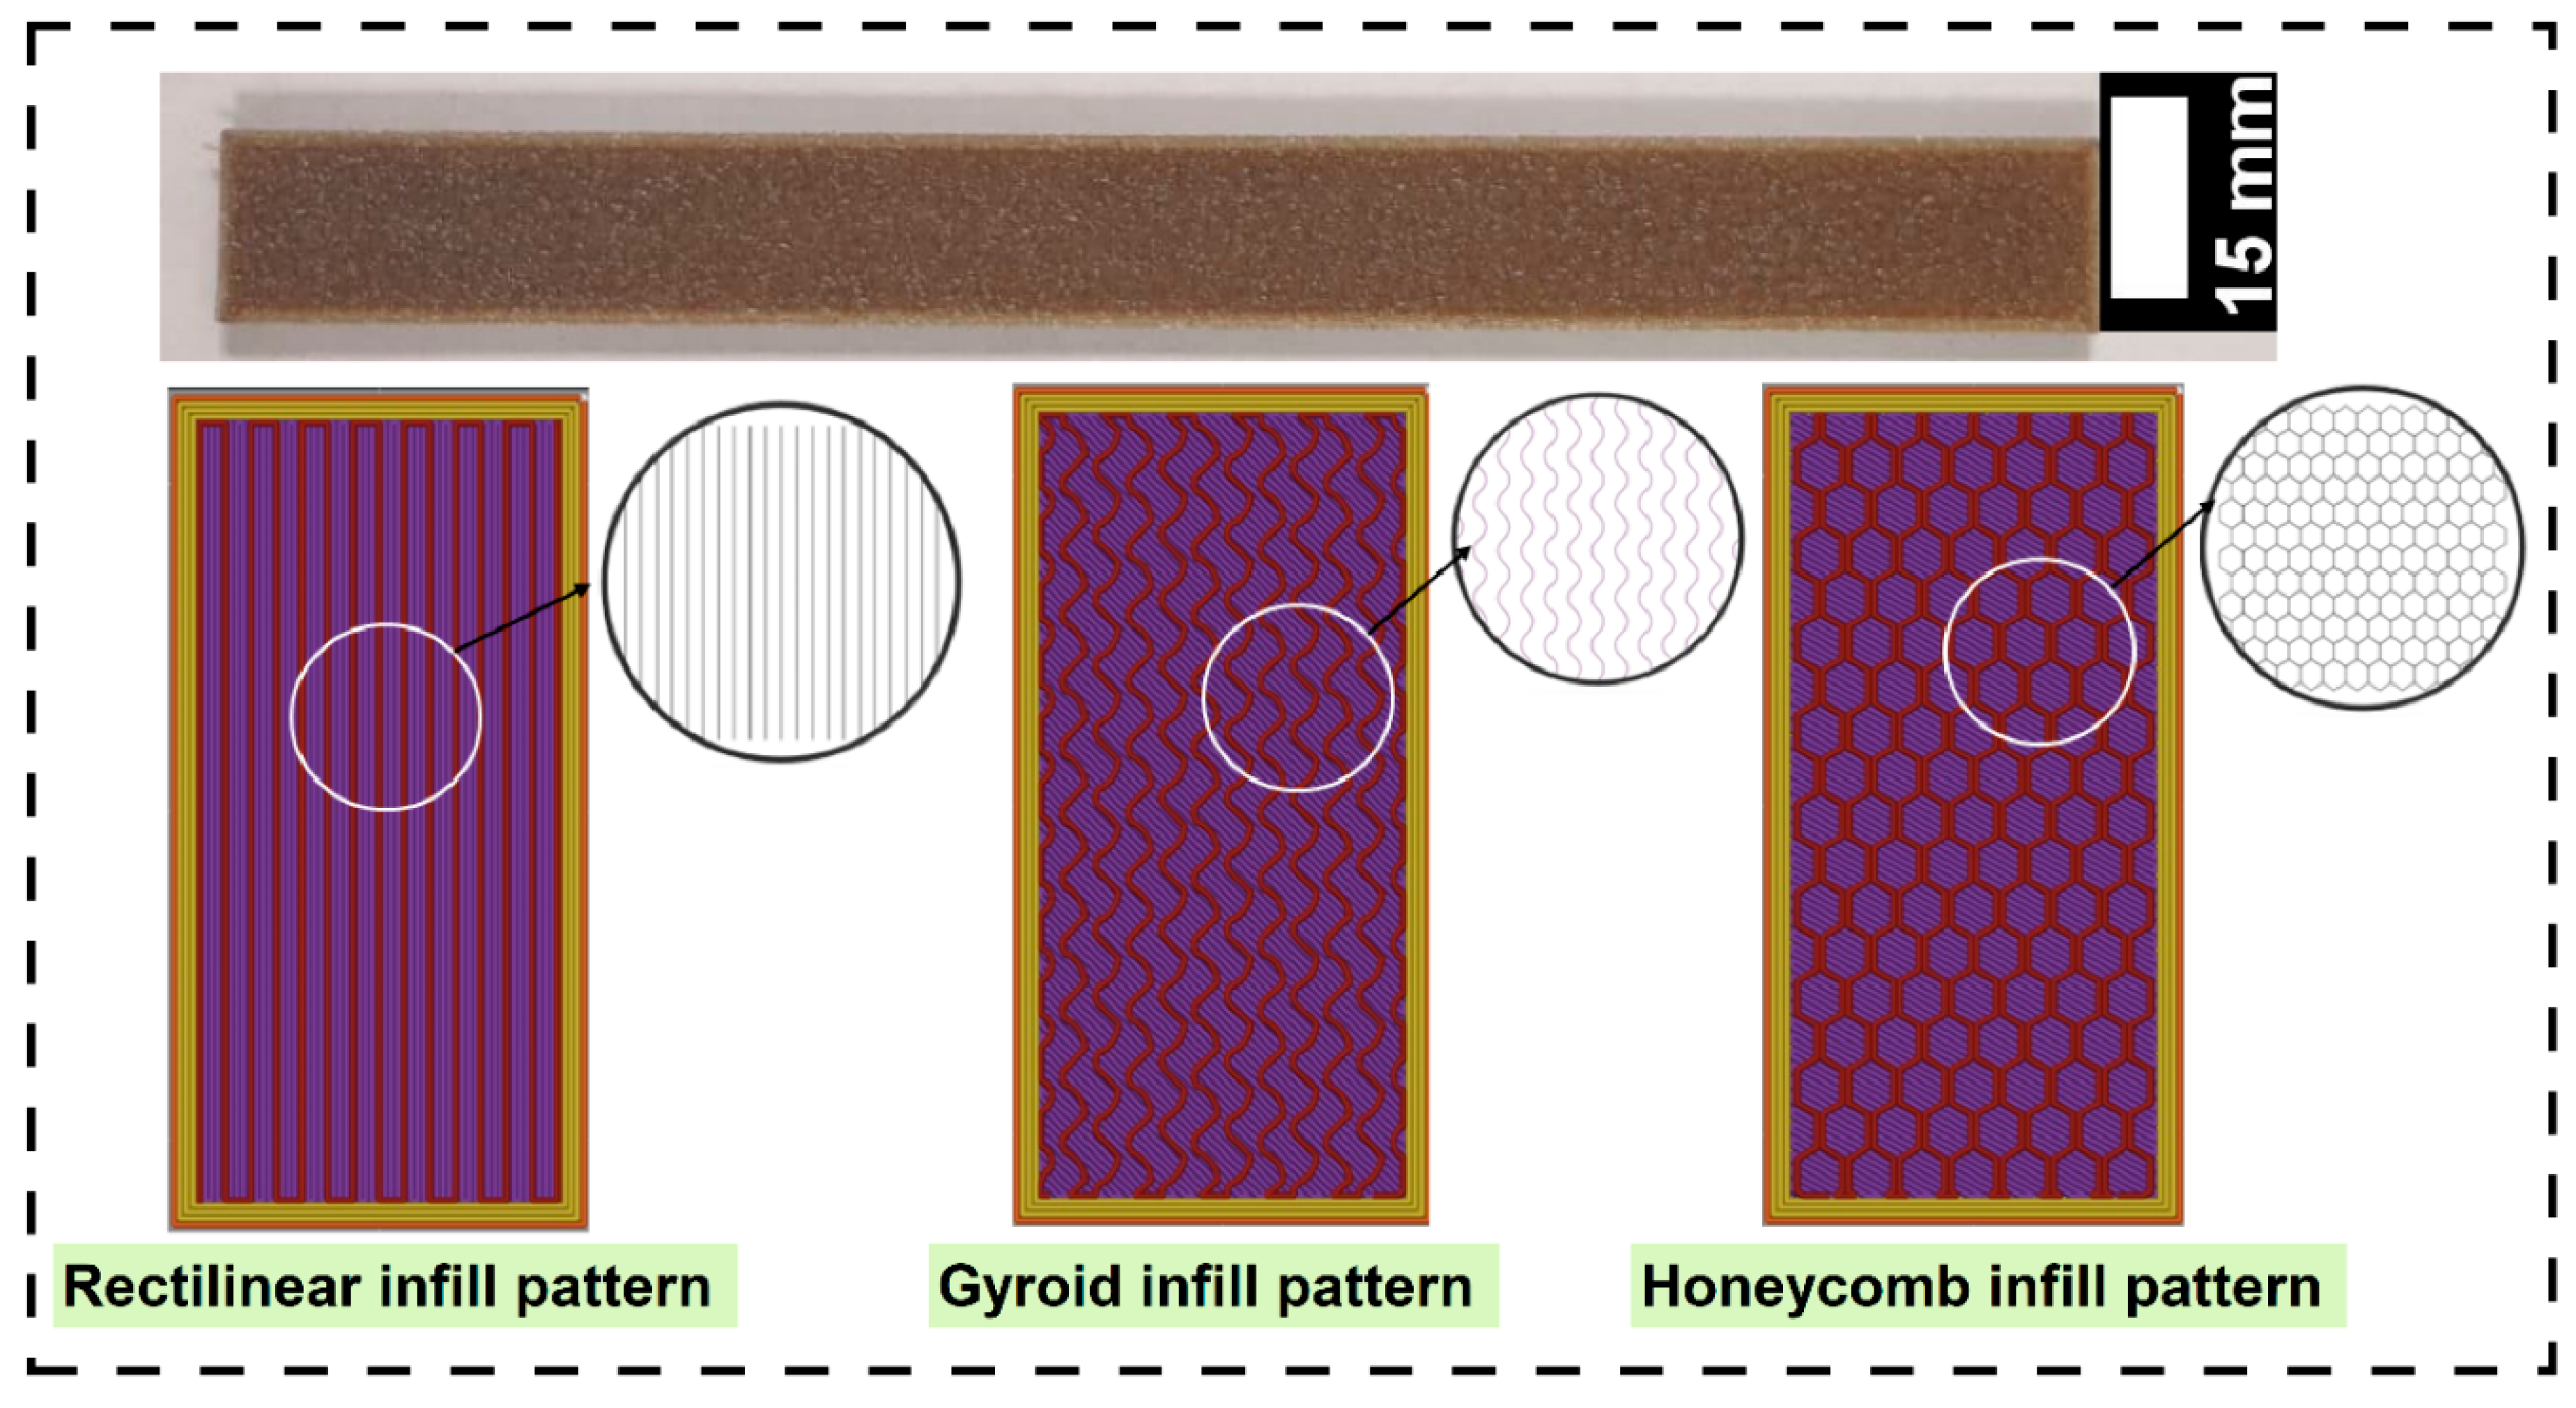
Different ASTM standard models for 3D printing were developed with Fusion 360 (student edition). These CAD models were transferred to Bambu Studio, which was used to slice models and develop G-code accordingly. Printing was carried out the developed in-house wood-PLA bio-composite filament on a Bambu Lab A1 mini 3D printer. To explore the effect of parameters like bio-inspired infill pattern, infill density, printing temperature, and printing speed on the mechanical performances of the printing part, the Taguchi L9 orthogonal array design of experiment procedure was adopted. The levels of varied parameters are presented in Table 1. The experimental design was made with the assistance of the Minitab software (student version), shown in Table 2. Compared to the full factorial method, using the Taguchi L9 method allows for a smaller number of trials while still applying orthogonal array experimentation to help find the main parameters that affect the process, also reducing both experimental effort and costs [31]. To ensure consistency of experiments, certain process parameters were set to the same values in all experiments. These parameters are the nozzle diameter, bed temperature, thickness of top and bottom layer, shell thickness, initial layer height, initial line width, raster angle, and retraction distance. Their values can be obtained from Table 3. The various infill patterns inside the 3D printed samples are presented in Figure 2.

Table 1.
Level of varied parameters.
| Printing parameter or reinforcing parameter | Level | ||
|---|---|---|---|
| 1 | 2 | 3 | |
| Infill pattern | Rectilinear | Gyroid | Honeycomb |
| Infill density (%) | 50 | 75 | 100 |
| Printing temperature (°C) | 180 | 190 | 200 |
| Printing speed (mm/sec) | 40 | 50 | 60 |
Table 2.
Taguchi L9 orthogonal array of DOE.
| Experiments | Infill pattern | Infill density (%) |
Printing temperature (°C) | Printing speed (mm/sec) |
|---|---|---|---|---|
| PRC-1 | Rectilinear | 50 | 180 | 40 |
| PRC-2 | Rectilinear | 75 | 190 | 50 |
| PRC-3 | Rectilinear | 100 | 200 | 60 |
| PRC-4 | Hexagon | 50 | 190 | 60 |
| PRC-5 | Hexagon | 75 | 200 | 40 |
| PRC-6 | Hexagon | 100 | 180 | 50 |
| PRC-7 | Gyroid | 50 | 200 | 50 |
| PRC-8 | Gyroid | 75 | 180 | 60 |
| PRC-9 | Gyroid | 100 | 190 | 40 |
Table 1.
Constant parameters for 3D printing.
| Parameters | Units | Value |
|---|---|---|
| Nozzle size | mm | 0.4 |
| Shell thickness | mm | 0.4 |
| Top/bottom layer thickness | mm | 0.6 |
| Initial layer height | mm | 0.1 |
| Layer thickness | mm | 0.12 |
| Bed temperature | °C | 55 |
| Raster angle | (°) | 0 |
2.5. Characterization of Wood Microparticles
Untreated and chemically treated wood microparticles were subjected to scanning electron microscopy (SEM), X-ray diffraction (XRD), FTIR (Fourier-Transform Infrared spectroscopy), and thermogravimetric analysis (TGA). Scanning electron microscopy (FESEM) (Carl ZEISS EVO 18-Germany) was utilized to observe changes in morphology induced by chemical treatment, and ImageJ software was employed to estimate the microparticle size (diameter) distribution of untreated and chemically treated wood particles. A BRUKER D8 Advance X-ray diffractometer (RIGAKU and MINIFLEX 6G BENCHTOP) was employed to study the effect of treatment on the crystal structure of wood microparticle with Cu-Kα radiation (wavelength 1.542 Å), 15 mA and 40 kV. XRD patterns were recorded at a scanning speed of 2°/min with a step of 0.02° in the 2θ range of 10°–60°. Crystallinity index and crystallite size were evaluated with Ruland–Vonk method (Eq. 1) and Scherrer's formula (Eq. 2), respectively. The effect of chemical treatment on functional groups present in wood particles was characterized by using a PerkinElmer (Germany) FTIR machine with a scanning speed of 2 cm-1 in the range of 4000 to 400 cm-1. The thermal stability of untreated and chemically treated wood particles was evaluated with TGA, and it was performed in a nitrogen atmosphere from room temperature (25°C) to 600°C with a constant heating rate of 10°C/min.
In these equations, %Cr is referred to as the crystallinity index, AT is the total area of the XRD curve, and AAm represents the area for amorphous part.
CS stands for crystalline size, K is Scherrer’s constant, whereas λ, β and θ denote wavelength of radiation, full-width half maximum of the peak and Bragg angle, respectively.
Figure 2.
Different bioinspired infill pattern.
2.6. Characterization of Wood-PLA Wood Filament
The microscopic, thermal and viscosity analysis of the developed composite filament was performed by using Scanning electron microscopy (FESEM) (Carl ZEISS EVO 18-Germany), a thermal analyzer Instrument (SETARAM Model: Setline) and a rheometer (MCR502 Twin Drive). Differential scanning calorimetry (DSC) of neat PLA and PLA composites with 9 wt.% wood particles was carried out with a non-isothermal heat–cool–heat program. About 8–10 mg of the samples was encapsulated in a sealed aluminium pan, while an empty pan was used as a reference. The first heating run was from room temperature to 200°C with a heating rate of 10°C/min to remove any previous thermal history. Samples were kept isothermally for 2 min at 200°C, then cooled to −70 °C at 10°C/min. The next heating cycle was then followed from −70°C to 180°C with the same heating rate. During the experiment, it was ensured that a nitrogen purge of 50 mL/min was applied to avoid oxidative degradation. From the DSC thermograms, Tg (glass transition temperature), Tc (cold crystalline temperature), and Tm (melting temperature) were measured. Crystallinity of composite and virgin PLA filaments (Xc) was computed from Eq. (3).
The enthalpy of fusion obtained from DSC analysis is represented by , the weight fraction of polymer in the blend is presented by ϕ, and the melting enthalpy of polymer at 100% crystallinity is represented by (93.7 J/g for PLA4043D).
The rheological characterization of 9% wood reinforced composite filament was performed with a strain-controlled rheometer at dynamic oscillatory mode with temperatures of 180, 190 and 200°C. In the linear viscoelastic (LVE) region of materials, a constant strain of 1% was used to perform the dynamic frequency sweep test at angular speeds from 0.1 to 100 rad/s. The storage modulus, loss modulus and complex viscosity of the filament at three different temperatures with frequency sweep have been measured, and results have been recorded.
2.7. Characterization of Wood-PLA 3D Printed Sample
The tensile, flexural, compression, natural frequency and impact tests were conducted on 3D printed composite samples. For every testing type, three different samples were tested, and average values and standard deviations were reported. The tensile and flexural properties of 3D printed composites were determined using a universal testing machine (Instron 3365, Norwood, MA, USA) with a 5000 N load cell. The tensile testing was carried out at a crosshead rate of 1 mm/min in conformity with ASTM D638 (Type IV); similarly, the flexural samples were prepared in accordance with ASTM D790. The load-displacement data were recorded from the UTM machine, and the flexural strength, flexural modulus, and flexural strain were calculated according to Equations 4, 5, and 6, respectively.
Here , and stand for flexural modulus, flexural strength, and flexural strain, respectively. is the flexural load, L is the span length, t is the thickness of the specimen, and b is the specimen width, while δ stands for deflection and for the slope of the load-deflection curve. Compressive and interlaminar shear strength testing of these 3D printed composite specimens was performed on a Kalpak Universal testing machine (KIC-2-0200-C, Pune, India) with a 20kN load cell. The dimensions of the compressive test samples were as per ASTM D1621 (lwh = 12.525.512.5 mm), whereas the short beam shear test samples were printed according to ASTM D1184. The compression testing of the sample was done up to 30% of the sample height, with a crosshead speed of 1 mm/min, and load displacement data were recorded from the machine. The compressive strength is given by dividing the applied load by the original horizontal cross-sectional area of the specimen. The compressive modulus of the samples was determined by using equation (7). For the short beam shear test, a span length of 18 mm was employed, and the crosshead speed was maintained at 1mm/min. The data of testing has been recorded as load and displacement, and interlaminar shear strength has been determined using equation (8).
is stands for compressive modulus, W, H, A, and D denote width, initial height, initial cross-sectional area and deformation of the sample in linear strain.
P stands for breaking load in N, while b and d are for the width and depth of test samples in mm. The notched Izod impact strength was measured using the Zwick/Roell HIT25P (5 J) impact tester under standard conditions of ASTM D256. The vibration testing was conducted on a 3D printed specimen (120 × 12 × 3 mm) in order to obtain the value of its first natural frequency. The input signal was generated by the waveform generator (Agilent 33220A) and amplified by the power amplifier (HBK Type 2732) and provided to the modal exciter (HBK Type 4824) for vibration purposes. The out-of-plane tip displacement was measured by a laser displacement sensor (optoNCDT 1700, Micro-Epsilon), which was mounted at the free end of the cantilever sample. The output from the sensor went to a DAQ module (NI 9239, National Instruments) for recording in real time. The data for displacement was then analyzed in MATLAB by an FFT to extract the value of the first natural frequency from the resonance peaks.
2.8. Optimization of 3D Printed Parameters Using MCDM Technique
In the current research, a multi-criteria decision-making (MCDM) technique was utilized for optimizing the 3D printing parameters to improve the mechanical output of the printed samples. Among all the different MCDM techniques, the TODIM (TOmada de Decisao Interativa Multicriterio) method was used since it allows for ranking the alternatives with respect to their closeness to the ideal solution, keeping in mind both the best and worst results [58]. A decision matrix was developed based on experimental results obtained from the Taguchi L9 design of experiments, considering various mechanical characteristics of printed samples. To negate personal bias, each criterion's weight was calculated based on the Shannon entropy method. A normalised decision matrix was developed to eliminate the effect caused by variation in the units of measurement, providing an equal comparison among parameters. This systematic method allowed the determination of the best printing parameter combination required for the optimal mechanical performance of the 3D printed composite.
2.8.1. Shannon Entropy Method
Entropy weight is calculated based on certain steps which have been established and verified by various scientists in order to calculate the weights of certain parameters. Weight ordering implies that the higher value is better than the lower value. The procedure for weight calculation adopted in this study is as follows [42]:
Step:1 Formation of decision matrix, A, as of equation (9).
where
Step:2 Normalizing the decision matrix as Gij as per equation (10) for the criteria which are beneficial and equation (11) for the criteria which are non-beneficial.
Step-3: The Entropy, Ej value, was calculated as per equation (12)
where k= Here, m is the number of alternatives
Step-4: The weightage () of different criteria has been calculated as per the equation (13)
2.8.2. TODIM Method
The TODIM (an acronym in Portuguese for "Interactive Multi-Criteria Decision Making") method is one of the famous multi-criteria decision-making (MCDM) techniques based on prospect theory and works by evaluating the degree of dominance experienced by each alternative concerning others from gains and losses, thus reflecting decision behaviour under uncertainty. Through the aggregation of these dominance values, the alternative is ranked comprehensively. Ten (10) criteria are studied here, all of which are benefit criteria. The steps of this methodology are as follows [43,44,45]:
Step-1: Relative weightage, has been determined as per equation (14)
Here, is the reference weightage criteria; is the weightage reference criteria taken to be that of the criterion with the maximum value, whereas is a relative weightage criterion.
Step-2: Term reflects the contribution of criterion C to the generalised dominance score function. According to Eq. (15), the dominance degree φj of alternative over under criterion Cj is given as follows:
here ( – ) > 0 and ( – ) < 0 respectively represent the gain and loss of ith alternative over jth alternative, and is the loss attenuation factor. Various values of can cause various shapes of the prospect theoretical value operate in the negative quadrant and c= 1, 2,..m.
Step-3: The dominance degree of alternative Ai over alternative Aj has been calculated using equation (16).
Step-4: The overall dominance degree of the alternative () has been obtained using equation (17).
Step-5: Ranking of alternatives
Later, alternatives are arranged here in descending order of the dominance score, and the option with the highest dominance score shall be considered the better choice.
Step-6: Sensitivity analysis of the process
The sensitivity analysis procedure is analyzed by varying the value of θ from 1 to 10, and the ranking of alternative materials is then compared to judge the robustness of the computation technique.
3. Result and Discussion
3.1. Characterization of Wood
The morphological analysis of untreated and treated wood particles has been done and presented in Figure 3(a) and (b), respectively. The untreated wood particles have surface impurities, different extractives and wax over their outer surface. When untreated wood particles are added to PLA for reinforcement, these impurities are the major reason for the development of weaker Van der Waals bonds with the PLA matrix. Such weaker interfacial interaction may limit load transfer from the PLA matrix to wood reinforcement in composites. The weak bonding and load transfer can result in poor mechanical properties of the composite. Chemical treatment removes these waxes and impurities from the surface of the wood particles and increases the surface roughness [46,47], leading to enhanced mechanical interlocking and interfacial adhesion between the PLA matrix and wood microparticles. This alkalization may also improve the thermo-mechanical properties of the composite. A similar observation was also reported by Saha and Kumari in their research work on the study of bamboo-epoxy composites. Figure 3 (c) and (d) present the distribution curve and average of the diameter of the treated wood particles. The average diameter of untreated and treated wood particles is observed as 68.56±19.33µm and 57.84±19.27µm, respectively. The reduction in wood particle diameter is attributed to the elimination of surface extractives, waxes, and impurities because of chemical treatment, leading to a decrease in the particle size. Along with these, partial degradation of hemicellulose and extractives causes mass loss and shrinkage, contributing to the reduction in diameter. The effect of chemical treatment on crystalline properties of the treated and untreated wood particles has been recorded as an X-ray diffractogram and presented in Figure 3(e). For both treated and untreated wood particles, three major crystalline peaks were observed at 2θ = 15.6°, 22.1°, and 35.5. These peaks correspond to the crystalline planes of (110), (002) and (004), respectively. These crystalline peaks are due to the presence of cellulose in α, β, and γ phases [48]. The crystalline size and crystallinity index were measured as 2.6±0.2nm and 48.52% for the untreated wood particle, whereas for the treated wood particle, these values are 3.2±0.11nm and 69.54%. Chemical treatment eliminated amorphous constituents like hemicellulose and extractives from wood particles, which exposed and rearranged the cellulose chains, increasing crystallinity index and crystalline size. Increased crystallinity enhances stiffness, strength, and thermal stability due to better load transfer and deformation resistance from the ordered cellulose domains [42,49]. This structural refinement eventually enhances the mechanical properties of the resultant composites. The effect of chemical treatment on different functional groups has been characterized by performing Fourier-transform infrared spectroscopy (FTIR). Figure 3 (f) presents the FTIR spectra of treated and untreated wood particles. Some major modifications in functional groups have been observed in treated wood particles compared to untreated wood particles. The broad O–H stretching band around 3433 cm⁻¹ is still present in both samples, though seemingly sharper following treatment, which shows some alteration in hydrogen bonding interactions [50]. The C–H asymmetric stretching around 2920 cm⁻¹ is unchanged, which indicates the aliphatic –CH₂– groups of cellulose are unaffected. There is a significant difference in the absence of the C=O stretching band at ~1730 cm⁻¹ for treated wood, indicating hemicellulose acetyl and carbonyl group removal. This is further confirmed by the decrease or elimination of other peaks related to hemicellulose: the C–H bending near 1375 cm⁻¹ decreases, suggesting removal of hemicellulose, and the C–O stretching at 1240 cm⁻¹ decreases, implying breaking of ether linkages in hemicellulose. Lignin-associated bands such as aromatic C=C stretching at ~1600 cm⁻¹, aromatic ring vibration at ~1510 cm⁻¹, and syringyl/guaiacyl ring vibration at ~1320 cm⁻¹ look predominantly unaltered, suggesting that lignin is not significantly affected by the treatment [51]. Likewise, the C–H bending at ~1450 cm⁻¹ and the cellulose glycosidic C–O–C asymmetric stretch at ~1160 cm⁻¹ are still present without substantial alteration. The cellulose and extractives peaks exhibit some changes: the C–O stretching at ~1030 cm⁻¹ decreases, coinciding with the removal of extractives and amorphous polysaccharides. The C–H rocking band at ~900 cm⁻¹ becomes stronger in treated wood, which reflects an increase in relative crystallinity of cellulose due to the removal of amorphous content. In general, the FTIR analysis validates the selective removal of hemicellulose and extractives during treatment while maintaining cellulose structures with a corresponding increase in cellulose crystallinity [52,53]. The thermal stability of the untreated and treated wood particles has been evaluated by observing weight loss through four temperature ranges. The thermogram of the untreated and treated wood particle is presented in Figure 3(g). Thermal degradation in different temperature data for the untreated and treated wood particles is presented in Table 4. The first phase of weight loss was observed between 25°C and 150°C, which coincided with the evaporation of naturally present moisture within the wood particle. The second stage, 151°C to 250°C, is the evaporation of extractives, waxes, and other contaminants. The third stage, 251°C to 380°C, resulted from the degradation of cellulose, hemicellulose. The fourth stage, between 381°C and 600°C, resulted from the decomposition of lignin and highly crystalline cellulose [54,55,56]. It is seen from the thermogram that the weight loss of treated wood particles is extremely minimal within the range of up to 200°C (most of the loss with treated wood particles within this range comes from the content of moisture in it). It shows that the treated wood particle can be printed with the PLA matrix between 180 to 200°C without losing its molecular structure and mechanical strength.
3.2. Characterization of Developed Wood-PLA Filament
The structural and microstructural features of wood (9%) reinforced PLA filament are shown in Figure 4. Figure 4(a) shows the as-extruded filament, which has a uniform diameter and is flexible enough for 3D printing. The digital calliper checks that the diameter is consistent (1.75±0.1mm), which is important for reliable performance. Figure 4(b) shows a scanning electron microscope image of the filament’s surface, with a measured diameter of 1.759 mm and a mostly smooth outer surface, with some small bumps from the wood. Figure 4(c) shows voids in the filament cross-section under higher magnification, in the PLA matrix. These voids usually come from weak bonding between the water-repelling PLA and the water-attracting wood particles, as well as trapped air during extrusion. Voids are common in wood-filled composites and can influence their density and strength, possibly lower tensile and flexural strength, while increasing brittleness. The void content in the current filament is within acceptable limits (less than 5%). Figure 4(d) shows how wood micro-particles are spread within the PLA matrix. The wood particles are well-distributed. Their addition gives a wood-like texture and improves mechanical properties as well as biodegradability. Overall, this figure shows how adding 9% wood to PLA filament affects its shape, internal spaces, and microstructural evenness, supporting its mechanical, thermal, and visual properties for sustainable additive manufacturing.
Glass transition temperature (Tg), cold crystalline temperature (Tcc), and melting temperature (Tm) of the developed PLA and wood-PLA composite filament were identified from the DSC plot. Figure 5 (a) is the DSC curve, and Table 5 explains the DSC curve details. The increment in the glass transition temperature of the developed filament has been observed by adding wood microparticles to PLA. In virgin PLA filament, the Tg has been found as 58.99°C, while the 9% wood particle reinforced PLA shown the glass transition temperature of 70.72°C. Wood microparticles limit the PLA polymer chain mobility by ensuring improved interfacial adhesion. Wood microparticles behave as a physical barrier, and it takes more energy (higher temperature) to begin segmental motion. A similar observation has been reported by Kumar and Saha [49] as well as Kumar et al. [57] on their study of wood microparticles reinforced epoxy matrix. This indicates enhanced stiffness and dimensional stability under elevated service temperatures. When wood particles are incorporated into PLA, the cold crystallization temperature (Tcc) decreases because the wood particles act as heterogeneous nucleating agents. Their surface provides active sites that facilitate the ordering of PLA chains, allowing crystallization to begin at a lower temperature. Essentially, the energy barrier for nucleation is reduced, so PLA does not need to be heated as high to initiate crystal growth [58].
For melting temperatures, the reverse trend has been seen to that of the glass transition temperature. The inclusion of wood microparticles lowers the melting temperature of the blend filament. The addition of microparticles interferes with the perfection of the PLA crystalline areas, resulting in less-than-perfect crystals that melt at a lower temperature [59]. This is typical for natural fiber/filler composites. Inclusion of wood microparticles into the PLA matrix resulted in an increase in crystallinity of the filament (from 10.02% for virgin PLA to 12.87% for PLA with 9% wood microparticles. As efficient nucleating agents, wood fillers encourage the formation of a higher crystalline phase on cooling. This resulting increase in crystallinity enhanced the stiffness, dimensional stability, and wear resistance of printed parts, resulting in enhanced mechanical performance and durability for functional products. The melting temperature of the blended PLA is observed at around 155°C, indicating that filament can be printed easily in the printing temperature range of 170 to 200°C.
Rheological characterization of wood/PLA blend were performed at different printing temperature (180, 190 and 200°C) to study the printability of the filament and to examine the melt flow behaviour and chain dynamics. Figure 5(b) and (c) are presenting the variation of storage modulus and loss modulus for different printing temperatures with respect to frequency sweep. With increasing frequency, the storage and loss modulus both showed an increasing trend in accordance with linear viscoelastic theory. Raising the temperature, however, resulted in a decrease in both moduli due to increased molecular mobility, reduced intermolecular interaction, and shorter relaxation times [60]. The rheological behaviour of polymer composites during extrusion printing is strongly governed by shear thinning, as reflected by the flow behaviour index “n”. A lower “n” value (< 1) indicates stronger shear thinning, which lowers viscosity inside the nozzle at high shear rates, facilitating extrusion and reducing printing pressure. As the material exits the nozzle, the viscosity increases exponentially with shear rate drop, minimizing oozing and preserving extrudate shape in the stand-off region. This balance is important to prevent dripping and maintain the shape under gravity. The viscosity data (Figure 5d) was fitted to the Carreau–modified model to determine shear thinning behaviour in this study [61]. The blend exhibited shear thinning at all tested temperatures, with flow behaviour index values of 0.36, 0.47, and 0.53 at 180, 190, and 200 °C, respectively. Increasing temperature shifted the viscosity curves toward lower ranges, while at constant temperatures, viscosity decreased with increasing frequency. Since viscosity affects the wetting of newly deposited layers on the underlying ones, better surface wetting was realised at higher temperatures due to reduced viscosity. The viscosity and rheological analysis confirm that the filament is easily printable at 180, 190, and 200°C.
3.3. Mechanical Characterization of Wood-PLA 3D Printed Composite
The effect of different printing parameters on the tensile characteristics of the printed specimens is studied. The tensile stress–strain plot, variation of tensile strength and modulus in different experiments, and tensile specimen along with testing procedure are depicted in Figure 6 (a), (b), and (c), respectively. The 3d printed samples exhibit a nearly linear increase in stress with strain up to the maximum stress point, followed by a sudden rupture at peak load. This behaviour of fracture is attributed to the brittle nature of the printed composites. The maximum tensile strength (86.33±2.83 MPa) and maximum tensile modulus (4.98±0.12 GPa) are reported with rectilinear infill pattern, 100% infill density, 200°C printing temperature and printing speed of 60 mm/sec (PRC-3), whereas the minimum tensile strength (39±2.82 MPa) and tensile modulus (3.06±0.12 GPa) are observed with gyroid infill pattern, 75% infill density, 180°C printing temperature and 60 mm/sec printing speed (PRC-8). For elongation before break value the maximum range is observed with 1.94±0.02% with gyroid infill pattern, 50% infill density, 200°C printing temperature and printing speed of 50 mm/sec (PRC-7) and minimum is observed as 1.15±0.05% with rectilinear infill pattern, 100% infill density, 200°C printing temperature and printing speed of 60 mm/sec (PRC-3) experimental condition. To understand the effect of different printing parameters like infill pattern, infill density, printing temperature and printing speed, mean effective graph has been plotted and presented in Figure 6 (d), (e), and (f) for tensile strength, modulus and elongation before break, respectively.
The three point bending test was performed on the 3d printed samples fabricated under different printing conditions to understand the variation of flexural strength and flexural modulus. Figure 7 (a) and (b) present the load-displacement curve of the tested samples and variation of flexural properties for different printing condition, respectively. The maximum flexural strength (70.12±3.06 MPa) and flexural modulus (3.56±0.06 GPa) was observed with hexagon infill pattern, 75% infill density, 200°C printing temperature and printing speed of 40 mm/sec (PRC-5). Whereas the minimum flexural strength (42.40±2.58 MPa) and flexural modulus (2.31±0.06 GPa) was observed with gyroid infill pattern, 50% infill density, 200°C printing temperature and printing speed of 50 mm/sec (PRC-7). To understand the effect of different printing parameters on flexural properties of the printed sample mean effect graphs are presented in Figure 7 (c) and (d).
The compressive load displacement curve, the changes in compressive strength, and the compressive modulus are shown in Figure 8 (a) and (b) respectively. The 3D printed sample show gradual increment in load with displacement. In the beginning of loading, the load-displacement curves were non-linear, continuing in an almost linear regime until greater loads were reached. The initial non-linear region was due to micro-gaps, additional lack of adhesion between layers, and surface roughness of the 3D printed parts, which were rearranging and compacting under compressive loading. Once the initial imperfections closed up, the material started behaving more elastically and linearly in load with respect to displacement. This kind of non-linearity is observed with rectilinear infill pattern heavily. For gyroid and honeycomb structure this nonlinearity is very small. Unlike tensile loading, compressive loading did not undergo a failure condition quickly, as the samples gradually deformed until densification or buckling was evident and indicated a constant load-bearing condition at higher displacement.
Experimental condition 5 (hexagon infill pattern, 75% infill density, 200°C printing temperature and printing speed of 40 mm/sec) has led to the maximization of both compressive strength and compressive modulus being reported as 53.00±2.66 MPa and 401.00±13.89 MPa, respectively. Correspondingly, the lowest compressive strength and compressive modulus have been reported as 31.44±2.61 MPa and 247.67±10.02 MPa, respectively, with gyroid infill pattern, 75% infill density, 180°C printing temperature and printing speed of 60 mm/sec (PRC-8) printing parametes. The mean effective plot for compressive strength and compressive modulus, which allows the effect of different printing parameters to be examined, is shown in Figure 8 (c) and (d), respectively.
Interfacial shear strength (IFSS) is a measure of the efficiency of the transfer of the stress between one printed layer to another in 3D printed composites. It is stated that almost all the mechanical properties are improved with higher IFSS due to better load sharing, less interface debonding. The result of the short beam shear test is presented in Figure 9 (a). The highest and the lowest values of interfacial shear strength are found as 7.21±0.39 MPa and 4.83±0.18 MPa, respectively, for the test conditions with printing conditions gyroid infill pattern, 100% infill density, 190°C printing temperature and printing speed of 40 mm/sec (PRC-9) and rectilinear infill pattern, 75% infill density, 190°C printing temperature and printing speed of 50 mm/sec (PRC-2). To visualize the impact of various printing parameters on IFSS, the mean effective plot is given in Figure 9 (b).
The analysis of impact strength for 3D-printed biocomposites is essential to understand their resistance to cracking under impulse loads, ensuring durability, guiding material selection, and enabling design optimization for applications requiring toughness and shock absorption. The impact strength for the printed samples with different printing conditions are presented in Figure 9(c). The maximum and maximum impact strength is observed as 24.69±0.51 kJ/m2 with gyroid infill pattern, 50% infill density, 200°C printing temperature and printing speed of 50 mm/sec (PRC-7) and minimum impact strength is observed as 14.07±0.59 kJ/m2 with rectilinear infill pattern, 100% infill density, 200°C printing temperature and printing speed of 60 mm/sec (PRC-3). To understand the effect of different printing parameters on impact strength, the mean effect plot is presented in Figure 9(d).
It is very important to Understand the natural frequency of 3D-printed composites to prevent resonance-induced failure and to optimize material design for durability, vibration control, and performance in dynamic applications. The natural frequency for different experimental conditions is presented in Figure 9(e). The maximum natural frequency (64.45±2.81 Hz) is observed with rectilinear infill pattern, 100% infill density, 200°C printing temperature and printing speed of 60 mm/sec (PRC-3), whereas the minimum natural frequences (39.81±1.32 Hz) is observed with gyroid infill pattern, 50% infill density, 200°C printing temperature and printing speed of 50 mm/sec (PRC-7). To understand the effect of different printing parameters, mean effective plot is presented in Figure 9(f).
3.3.1. Effect of Infill Pattern on Different Mechanical Properties
The mechanical behaviour of 3D-printed composites is highly influenced by the geometry of infill pattern, since the arrangement of filaments control distribution of stress, deformation mechanisms, and failure modes [62]. The rectilinear infill shows the highest tensile strength and modulus because of its continuous, highly aligned filament paths that effectively carry the load along the stress direction, enabling uniform stress distribution and minimizing the areas of stress concentration. Due to homogeneous uniform alignment of filament in the direction of load, the rectilinear infill pattern also offers higher stiffness, evidenced by its highest natural frequency. Although, the rectilinear patterns are stronger in strength, it reveals the lowest elongation at break and weaker in impact resistance, as its linear paths fail abruptly once the critical stress is reached. Its bending and compressive performance is just average since the lack of the diagonal or multidirectional support makes it vulnerable to the localized buckling as well as interlayer collapse. Moreover, its shear resistance is the lowest as linear filaments offer fewer interfacial bonds and are thus more prone to sliding under transverse loads. In the other hand, gyroid infill pattern can provide an architecture that is both isotropic and flexible [63]. This is because of the continuous curvilinear filament trajectories. This leads to the highest elongation before break and higher impact strength because crack growth is retarded by progressive deformation and energy absorption. The orientation of filaments in multi-direction also plays a major role in the achievement of the highest short-beam shear strength as it has higher interlayer bonding and load transfer. However, these curvilinear orientation of filament, provides gyroid infill pattern lowest tensile, flexural, compressive properties and natural frequency when compared to rectilinear as well as honeycomb pattern. Honeycomb infill with hexagonal cell geometry renders the best performance under bending and compression loading. The junction-rich architecture spreads compressive and bending stresses to more than one load path that makes it least susceptible to buckling and offers the maximum flexural and compressive strength as well as modulus [64]. However, on the other hand, stress concentration at junction reduces the ductility and impact load resistance of the structure and positions it between the rectilinear and gyroid in terms of energy absorbed and retained at break strain. Its resistance to shear is also moderate since angled filaments do offer some resistance to sliding, but junctions are weak points [65,66]. In summary, rectilinear outperforms tensile strength, stiffness, and natural frequency but performs poorly in ductility and impact; gyroid performs best in ductility, impact, and shear but is poor in stiffness-dominated properties; and honeycomb delivers the best flexural and compressive performance with average ductility and impact resistance [63,67,68]. Therefore, the selection of the correct infill pattern should depend on the load conditions of the application.
3.3.2. Effect of Infill Density on Different Mechanical Properties
The porosity, inter-filament contact area and cross section for load bearing is directly controlled by infill density. Due to that the strength, stiffness, ductility and dynamic response of a 3d printed part is directly affected by it [69]. At 100% infill density the filament network is nearly a continuous solid with very little voids, maximizing load-bearing area and inter-filament bonding. This provides the highest tensile, flexural and compressive strength and modulus, greatest short-beam shear strength, and highest natural frequency since stiffness and strength are maximized [70]. Nevertheless, due to the compact and highly constrained structure, filament rearrangement is minimal; hence, the values for elongation at break and impact energy absorption are the lowest, failure is mainly stiff and brittle in nature. At intermediate density (75% infill density), void volume is limited in comparison to 50% infill density but still, the discontinuities are present, which interrupt the continuous load paths. The mechanical properties and stiffness in this case are thus more than 50% infill density and less than 100%: the strength and modulus are lowered relative to the solid case (100%), the transfer of the shear is partially compromised, and the natural frequency is reduced [71]. Ductility and impact toughness are moderate (greater than 100% infill and less than 50% infill density) since some local bending/stretching of filaments and energy-dissipation mechanisms are still present but are progressively restricted by the more solid parts [72]. Low density (50% infill) introduces large voids and limited filament contacts, reducing different mechanical strength (tensile, flexural, compressive and shear strength) and stiffness as well as natural frequency. On the other hand, the least dense structure allows large local filament bending, stretching and rearrangement, slowing crack extension and enhancing ductility and impact energy absorption. Therefore, 50% infill density provides the highest elongation and toughness but poorest load-carrying capacity and stiffness. lowering infill density enhances porosity and stress concentration (reducing strength, modulus, shear capability and natural frequency) while at the same time enable higher local deformation (which enhance ductility and impact energy absorption). So, selection of higher infill density (100 or 75%) is suitable where high rigidity, load capability and fatigue/resonance resistance are needed; select lower density (50%) will be appropriate when energy absorption, weight reduction and ductility are desired.
3.3.3. Effect of Printing Temperature on Different Mechanical Properties
The temperature of composite filament extrusion during 3d printing directly controls the filament fusion, diffusion of polymer chains, and adhesion between the layers, which collectively affect the strength, ductility, stiffness, and dynamic response of 3D printed composites [73,74]. At 200°C temperature the composite filament attends optimal melt viscosity, giving a perfect filament fusion with numerous chain entanglements and tends to zero voids. Consequently, tensile, flexural, compressive, and shear strengths are maximized, and stiffness is enhanced, leading to the maximum natural frequency. Moreover, strong interlayer bonding prevents the impact load from being localized in the cracked zone, enabling effective load redistribution and delaying crack growth and increase energy absorption. However, the highly consolidated structure also reduces the likelihood of significant plastic flow, leading to stiff but tough performance. With a moderate temperature (190°C), there is partial melting, which allows fair interlayer adhesion but still retains voids and weak interfaces. In proportion, mechanical properties are moderate: tensile, flexural, compressive, and shear strengths are lesser than 200°C but greater than 180°C printed composites. Impact strength and ductility are moderate, as limited chain diffusion permits partial plastic deformation and energy absorption but leads to early crack formation at interfacial weak spots. The natural frequency exhibits a moderate increase with partially improved interlayer bonding, as it reflects the effective stiffness of the printed structure. At lower extrusion temperature (180°C), flow of the polymer melt is poor, chain diffusion between layers is limited, and bonding between the interfaces are weakest. Highest void density also serves as increment in stress concentrators, inducing premature crack initiation and brittle failure. Tensile, flexural, compressive, and shear strengths are reduced, ductility and impact resistance are minimum, and natural frequency is also at its lowest due to poor stiffness. The structures printed under this temperature suffer from premature interlayer delamination and sudden fracture. Higher extrusion temperatures enhance interlayer fusion, decrease porosity, and increase chain mobility, which enhances strength, stiffness and ductility the printed composite [61,75,76]. Maximum mechanical properties are observed with printing temperature of 200 °C. Lower temperatures (≤190 °C) should be avoided while printing of wood-PLA composites, as insufficient bonding and poor polymer diffusion causes weaker interfaces and brittle failure.
3.3.4. Effect of Printing Speed on Different Mechanical Properties
Printing speed affects deposition time, filament fusion, and interlayer bonding, all of which have direct impacts on the strength, ductility, stiffness, and dynamic response of the 3D-printed composites [77]. With a reduced printing speed (40 mm/s), filaments get adequate time to wet and bond with the existing layer, minimizing void development and optimizing interlayer adhesion. These result in the maximizing tensile, flexural, compressive, and shear strengths and increased stiffness as well as natural frequency. It also increases ductility and impact strength, as the loads can redistribute and cracks are diverted, and progressive deformation can occur before failure [78,79]. Therefore, 40 mm/s produced the printed parts that are both strong and tough. Interlayer adhesion is partly lost at moderate printing speed (50mm/s) as the deposition time reduces, so only limited polymer diffusion occurs. The printed part has moderate tensile and flexural strength, lowered shear resistance, and slightly diminished compressive performance. Elongation at break and impact energy absorption are also decreased relative to 40 mm/s but not as severely as at higher printing speeds (60mm/s). Natural frequency values behaved in a similar manner with partial bonding resulting in moderate stiffness. With high deposition speed (60 mm/s), rapid deposition does not allow for adequate filament fusion, enhances porosity, and develops weak interfacial zones. These flaws serve as crack initiation sites, producing low tensile, flexural, compressive, and shear strength, and the lowest natural frequency. Brittleness is also increased due to poor adhesion, with no elongation and poor impact resistance because the cracks can extend rapidly in unbonded areas. Lower printing velocity (40mm/s) enhance interlayer diffusion, minimize porosity, and increase structural strength, yielding stronger, stiffer, tougher, and more durable composites. Increased speeds sacrifice bonding and raise voids, developing weaker and more brittle structures. Therefore, a printing speed of ~40 mm/s is optimal when mechanical performance is the priority, whereas higher speeds may be acceptable only when faster fabrication is more critical than strength [73,80].
3.3.5. Cumulative Effect of Different Printing Parameters and Regression Analysis
In this subsection, the role of each printing parameter on the different mechanical properties of wood-PLA FDM composite is considered. The ANOVA analysis was done considering the parameters of infill pattern, infill density, printing speed, and printing temperature. Tables S1–S10 in the supplementary document showing the ANOVA results in relation to compressive strength of 3D-printed composite. For the optimization experiment, the P-value less than 0.05 was considered as statistically significant. If the P-value exceeded this threshold, the corresponding factor was deemed insignificant, indicating that the specific printing parameter had no notable effect on corresponding mechanical properties of the PLA/wood composite. Figure 10 presents the effect of different printing parameters on different mechanical properties of the printed samples. The graph depicts the effect of four main process parameters, infill pattern, infill density, printing temperature, and printing speed on the mechanical, interfacial, and dynamic properties of wood-PLA composites, such as tensile strength (TS), tensile modulus (TM), elongation before break (EBB), flexural strength (FS), flexural modulus (FM), compressive strength (CS), compressive modulus (CM), interfacial shear strength (IFSS), impact strength (IM), and natural frequency (NF). The overall results show that infill density is the most influential factor. The higher the infill density, the better the load-bearing properties such as TS, FS, CS, TM, FM, CM, and NF, due to the reduction of porosity and the better stress transfer in the printed structure. But the increase in stiffness and strength is usually accompanied by a decrease in EBB, since less porous structures limit the ductility of the material. Among different parameters, infill pattern shows minimal influence on strength-related properties, though it can affect NF and IM due to changes in mass distribution and energy absorption pathways. Moreover, printing temperature influenced significantly as an interfacial bonding factor. It has been found that the best range for the matrix flow and wood–PLA adhesion is an optimal one which consequently results in higher IFSS, impact resistance and structural integrity. Low as well as high temperatures are less efficient in the bonding process, thus leakage in performance will occur. Besides that, it should also be noted that printing speed affect layer bonding and deposition time. The moderate printing speeds allow IFSS, IM, and ductility to be improved, while the excessively high speeds cause poor fusion, thus TS, FS, and CM are reduced. The essence of the graph is to identify which parameters will most likely affect the performance of the wood-PLA composites. These parameters include the density of the infill, temperature, and speed while the role of infill pattern will be secondary. It is challenging to choose optimal printing parameters which will give a balance of different mechanical properties. Thus, TODIM, a multi attribute decision making technique is employed and optimal parameters are found in the next section. The mathematical models of wood-PLA composites for different mechanical properties are developed by performing regression method. The Minitab software was used to develop the mathematical models and the developed equations along with R2 values are presented in Table 6.
3.3.6. Surface Morphology of 3d Printed Tested Sample
3d printed samples and their fracture surfaces are observed under SEM and presented in Figure 11. The cross-sectional view in Figure 11 (a) shows the perfectly bonded 3D-printed layers of the wood-PLA biocomposite, and the print orientation (x-z axes) is clearly seen with uniformly stacked layers. Wood microparticles are observed dispersed in the PLA matrix, as denoted by the ringed areas, contributing quite homogeneous reinforcement and enhancement in interfacial interaction. Intern-layer gaps are negligible, implying uniform layer fusion during printing and good thermal management. Smoothness and continuity of the interfaces between layers infer good adhesion, which is important for mechanical integrity and load transfer among layers. Micrograph in Figure 11 (b) records the brittle failure mechanism after tensile testing. The broken layers show abrupt, clean separation with aligned cracks parallel to the print direction, indicating limited plastic deformation and matrix ductility. The delamination of layers is absent in this SEM image indicates good interfacial interaction between printed layers. Figure 11 (c) shows interlayer (interfacial) shear failure found upon interfacial shear strength (IFSS) testing. The sample separated mainly along the boundaries of layers, indicated by the dashed guidelines. Delamination that is visible suggests localized debonding resulting from week interlayer adhesion. Fractured and separated layers show that the shear load overpowered weak interfacial areas between deposited layers in rectilinear infill pattern. These results highlight the need for adjusting printing parameters (infill pattern, temperature, speed) to enhance shear strength and interlayer adhesion of biocomposites. Figure 11 (d) shows multi-layer failure after impact loading, illustrating the composite behaviour under dynamic loading. The fractographic details include rough fracture surfaces, jagged separations, and intermixtures of layer splitting and out-of-plane deformation.
4. MCDM Based Optimization of Different Printing Parameters
The nine different printing conditions resulted in distinct variations in the mechanical properties. Like experimental condition 3 (PRC-3, rectilinear infill pattern with 100% infill density, 200°C printing temperature with 60mm/sec printing speed) shows the highest values of tensile strength, tensile modulus, and natural frequency values. Whereas experimental condition 5 (PRC-5, hexagon infill pattern with 75% infill density, 200°C printing temperature with 40mm/sec printing speed) shows the maximum values of flexural, compressive and interfacial shear strength. On the other hand, experimental condition 7 (PRC-7, gyroid infill pattern with 50% infill density, 200°C printing temperature with 50mm/sec printing speed) shows the highest impact strength and elongation before break values. As it is essential to find out a single printing condition which will give comparable better results with all mechanical properties, TODIM, a MCDM technique employed. The Shannon entropy method was used to rank the different criteria (such as tensile strength, modulus etc). The decision matrix and the weightage of different criteria is presented in Table 8 and Table 9, respectively. After employing TODIM multicriteria decision making, the sensitivity of the process is performed and presented in Figure 12. The ranking remained stable across all sensitivity factors (1–10), confirming the robustness of the results. Among the nine conditions, PRC-5 (hexagon infill pattern with 75% infill density, 200°C printing temperature and 40mm/sec printing speed) consistently ranked first, indicating its superior balance of tensile, flexural, and dynamic properties. PRC-9 (gyroid infill pattern with 100% infill density, 190°C printing temperature and 40mm/sec printing speed) and PRC-3 (rectilinear infill pattern with 100% infill density, 200°C printing temperature and 60mm/sec printing speed) followed closely, showing competitive performance and ranked second and third consistently. Intermediate positions were occupied by PRC-2, PRC-6, PRC-7 and PRC-1, which exhibited moderate property distributions. PRC-6 experimental condition ranked 5 when α ≤ 2 and ranked 4 when α ≥ 3. Whereas PRC-2 shows ranking 4 when α ≤ 2 and ranked 5 when α ≥ 3. Experimental condition PRC-4 (hexagon infill pattern with 50% infill density, 190°C printing temperature and 60mm/sec printing speed) shows the lowest ranking, 9 when α ≤ 3 and ranked 8 when α ≥ 4. On the other hand, PRC-8 (gyroid infill pattern with 75% infill density, 180°C printing temperature and 60mm/sec printing speed) shows the second worst ranking, 8 when α ≤ 3 and ranked 9 when α ≥ 4. This ranking demonstrates that TODIM effectively distinguishes the best-performing printing conditions by accounting for both gains and trade-offs across multiple mechanical and dynamic criteria, providing a reliable decision-support tool for optimizing additive manufacturing parameters. A comparative study of developed bio-composites with previously reported are presented in Table 10.
5. Conclusion
This research investigated the role of major 3D printing parameters such as infill density, bioinspired infill pattern, printing temperature and printing speed on the mechanical properties of wood-PLA biocomposites. In-house customized 3D-printable filaments were developed, and test samples were printed using the Taguchi T9 design of experiment, and the TODIM multi-criteria decision-making approach was used to determine the best printing conditions. The most significant conclusions from this research are as follows:
- Alkali treatment of wood microparticles enhanced the crystallinity index by removing hemicellulose and extractive component from the wood, and thus their compatibility with the PLA matrix increased. Addition of wood microparticles to PLA raised the glass transition temperature (Tg), decrease the cold crystallization temperature (Tcc), and exhibited a declining trend in melting temperature (Tm) with respect to virgin PLA.
- Increasing the printing temperature, decrease the storage modulus, loss modulus, and complex viscosity of the composite filaments. The flow behaviour index (n) was still below 1, reaffirming shear-thinning behaviour conducive to extrusion-based 3D printing.
- Increasing infill density minimised internal porosity and enhanced load transfer, thereby enhancing tensile, flexural, and compressive strengths. But the concomitant increase in stiffness slightly decreased the impact energy absorption capability of the material.
- The gyroid infill pattern had the greatest impact resistance due to its smooth and curved shape that allowed effective energy dissipation. Honeycomb infill pattern exhibited excellent compressive strength and rectilinear patterns had better stiffness and strength but relatively lower capacity for impact absorption.
- Increasing in printing temperature, improved mechanical strength and stiffness due to enhanced interlayer bonding, better fiber–matrix wetting, and reduced voids; however, temperatures beyond the optimal range may cause polymer degradation and fiber damage, leading to property deterioration.
- Increased print speed led to reduced mechanical properties since high-speed deposition lowers polymer chain diffusion time, reduces interlayer bonding, and promotes void formation; as a result, strength and modulus reduce relative to specimens printed at reduced speeds.
- The multi-criteria decision-making using the TODIM method identified condition PRC-5 (hexagon infill pattern with 75% infill density, 200°C printing temperature and 40mm/sec printing speed) as the most promising combination for achieving balanced and improved mechanical performance.
- The use of wood micro particles, an agro/industrial waste product, minimized the total cost of the composite because PLA is still the major expense. Moreover, the hydrophilic character of the biomass favours moisture absorption, thus enhancing the biodegradation process and the environmental friendliness of wood/PLA composites.
This experimental work concludes that developed biocomposite filament using wood/PLA and its bioinspired 3D printing have a great potential for many engineering applications. Future work could explore hybrid reinforcement by combining natural and synthetic fibers with bioinspired infill patterns to optimize the strength–toughness balance of 3D-printed biocomposites. In addition, long-term durability studies under cyclic loading and environmental aging will be essential to assess their reliability for real-world applications.
Supplementary Materials
The following supporting information can be downloaded at the website of this paper posted on Preprints.org.
Funding
The present experimental work is funded through the institute's post-doctoral contingency grant and NFIG grant of IIT Madras and the Ministry of Education, Govt. of India.
Acknowledgement
The authors would like to thank Composite Technology Centre, IIT Madras for providing twin screw extrusion and mechanical testing facilities. The authors are also grateful to Centre for Sustainable Polymers, IIT Guwahati for providing R.P extruder filament maker.
References
- Montalvo Navarrete JI, Hidalgo-Salazar MA, Escobar Nunez E, Rojas Arciniegas AJ. Thermal and mechanical behavior of biocomposites using additive manufacturing. International Journal on Interactive Design and Manufacturing 2018;12:449–58. https://doi.org/10.1007/s12008-017-0411-2. [CrossRef]
- Wang Y, Sultana J, Rahman MM, Ahmed A, Azam A, Mushtaq RT, et al. A Sustainable and Biodegradable Building Block: Review on Mechanical Properties of Bamboo Fibre Reinforced PLA Polymer Composites and Their Emerging Applications. Fibers and Polymers 2022;23:3317–42. https://doi.org/10.1007/s12221-022-4871-z. [CrossRef]
- Veeman D, Sai MS, Sureshkumar P, Jagadeesha T, Natrayan L, Ravichandran M, et al. Additive Manufacturing of Biopolymers for Tissue Engineering and Regenerative Medicine: An Overview, Potential Applications, Advancements, and Trends. Int J Polym Sci 2021;2021. https://doi.org/10.1155/2021/4907027. [CrossRef]
- Leon-Becerra J, González-Estrada OA, Sánchez-Acevedo H. Comparison of Models to Predict Mechanical Properties of FR-AM Composites and a Fractographical Study. Polymers (Basel) 2022;14. https://doi.org/10.3390/polym14173546. [CrossRef]
- Ree BJ. Critical review and perspectives on recent progresses in 3D printing processes, materials, and applications. Polymer (Guildf) 2024;308. https://doi.org/10.1016/j.polymer.2024.127384. [CrossRef]
- Cheng P, Peng Y, Wang K, Le Duigou A, Ahzi S. 3D printing continuous natural fiber reinforced polymer composites: A review. Polym Adv Technol 2024;35. https://doi.org/10.1002/pat.6242. [CrossRef]
- Bi X, Huang R. 3D printing of natural fiber and composites: A state-of-the-art review. Mater Des 2022;222. https://doi.org/10.1016/j.matdes.2022.111065. [CrossRef]
- Ecker JV, Kracalik M, Hild S, Haider A. 3D - Material Extrusion - Printing with Biopolymers: A Review. Chemical and Materials Engineering 2017;5:83–96. https://doi.org/10.13189/cme.2017.050402. [CrossRef]
- Arif MF, Alhashmi H, Varadarajan KM, Koo JH, Hart AJ, Kumar S. Multifunctional performance of carbon nanotubes and graphene nanoplatelets reinforced PEEK composites enabled via FFF additive manufacturing. Compos B Eng 2020;184. https://doi.org/10.1016/j.compositesb.2019.107625. [CrossRef]
- Hanon MM, Alshammas Y, Zsidai L. Effect of print orientation and bronze existence on tribological and mechanical properties of 3D-printed bronze/PLA composite. International Journal of Advanced Manufacturing Technology 2020;108:553–70. https://doi.org/10.1007/s00170-020-05391-x. [CrossRef]
- Siddiqui MAS, Rabbi MS, Ahmed RU, Billah MM. Biodegradable natural polymers and fibers for 3D printing: A holistic perspective on processing, characterization, and advanced applications. Cleaner Materials 2024;14. https://doi.org/10.1016/j.clema.2024.100275. [CrossRef]
- Gyawali B, Haghnazar R, Akula P, Alba K, Nasir V. A review on 3D printing with clay and sawdust/natural fibers: Printability, rheology, properties, and applications. Results in Engineering 2024;24. https://doi.org/10.1016/j.rineng.2024.103024. [CrossRef]
- Balla VK, Tadimeti JGD, Sudan K, Satyavolu J, Kate KH. First report on fabrication and characterization of soybean hull fiber: polymer composite filaments for fused filament fabrication. Progress in Additive Manufacturing 2021;6:39–52. https://doi.org/10.1007/s40964-020-00138-2. [CrossRef]
- Bhagia S, Lowden RR, Erdman D, Rodriguez M, Haga BA, Solano IRM, et al. Tensile properties of 3D-printed wood-filled PLA materials using poplar trees. Appl Mater Today 2020;21. https://doi.org/10.1016/j.apmt.2020.100832. [CrossRef]
- Spinelli G, Lamberti P, Tucci V, Kotsilkova R, Ivanov E, Menseidov D, et al. Nanocarbon/poly(lactic) acid for 3D printing: Effect of fillers content on electromagnetic and thermal properties. Materials 2019;12. https://doi.org/10.3390/ma12152369. [CrossRef]
- Müller M, Šleger V, Kolář V, Hromasová M, Piš D, Mishra RK. Low-Cycle Fatigue Behavior of 3D-Printed PLA Reinforced with Natural Filler. Polymers (Basel) 2022;14. https://doi.org/10.3390/polym14071301. [CrossRef]
- Jahan I, Zhang G, Bhuiyan M, Navaratnam S. Circular Economy of Construction and Demolition Wood Waste—A Theoretical Framework Approach. Sustainability (Switzerland) 2022;14. https://doi.org/10.3390/su141710478. [CrossRef]
- David G-M, Druță R-M, Nan L-M, Bacali L. CIRCULARITY PRACTICES RELATED TO THE RECYCLING OF WOOD WASTE FROM INDUSTRIAL PROCESSES: A SYSTEMATIC REVIEW OF THE LITERATURE. vol. 22. 2023.
- Ferede E. Evaluation of mechanical and water absorption properties of alkaline-treated sawdust-reinforced polypropylene composite. Journal of Engineering (United Kingdom) 2020;2020. https://doi.org/10.1155/2020/3706176. [CrossRef]
- Gomes RM, Gonçalves Tibiriçá AC, Franco de Carvalho JM, Nalon GH, Pedroti LG, Oliveira de Paula M. Wood waste quantification from the furniture industry in Ubá (Brazil) and its reuse prospects in civil construction. Front Built Environ 2025;11. https://doi.org/10.3389/fbuil.2025.1623281. [CrossRef]
- Tümer EH, Erbil HY. Extrusion-based 3d printing applications of pla composites: A review. Coatings 2021;11. https://doi.org/10.3390/coatings11040390. [CrossRef]
- Chawla VK, Seshasayee V, Yadav R. Sustainable Development of Particle Board from Lignocellulosic Agri Waste (Corchorus capsularis-Jute). Agricultural Science Digest - A Research Journal 2023. https://doi.org/10.18805/ag.d-5585. [CrossRef]
- Vigneshwaran K, Venkateshwaran N, Shanthi R, Kannan G, Kumar BR, Shanmugam V, et al. The acoustic properties of FDM printed wood/PLA-based composites. Composites Part C: Open Access 2024;15. https://doi.org/10.1016/j.jcomc.2024.100532. [CrossRef]
- Faidallah RF, Abd-El Nabi AM, Hanon MM, Szakál Z, Oldal I. Compressive and bending properties of 3D-printed wood/PLA composites with Re-entrant honeycomb core. Results in Engineering 2024;24. https://doi.org/10.1016/j.rineng.2024.103023. [CrossRef]
- Sultana J, Rahman MM, Wang Y, Ahmed A, Xiaohu C. Influences of 3D printing parameters on the mechanical properties of wood PLA filament: an experimental analysis by Taguchi method. Progress in Additive Manufacturing 2024;9:1239–51. https://doi.org/10.1007/s40964-023-00516-6. [CrossRef]
- Krapež Tomec D, Schwarzkopf M, Repič R, Žigon J, Gospodarič B, Kariž M. Effect of thermal modification of wood particles for wood-PLA composites on properties of filaments, 3D-printed parts and injection moulded parts. European Journal of Wood and Wood Products 2024;82:403–16. https://doi.org/10.1007/s00107-023-02018-2. [CrossRef]
- Brackett J, Cauthen D, Condon J, Smith T, Gallego N, Kunc V, et al. The impact of infill percentage and layer height in small-scale material extrusion on porosity and tensile properties. Addit Manuf 2022;58. https://doi.org/10.1016/j.addma.2022.103063. [CrossRef]
- Kesavarma S, Kong CK, Samykano M, Kadirgama K, Pandey AK. Bending properties of 3D printed coconut wood-PLA composite. IOP Conf Ser Mater Sci Eng, vol. 736, Institute of Physics Publishing; 2020. https://doi.org/10.1088/1757-899X/736/5/052031. [CrossRef]
- Hikmat M, Rostam S, Ahmed YM. Investigation of tensile property-based Taguchi method of PLA parts fabricated by FDM 3D printing technology. Results in Engineering 2021;11. https://doi.org/10.1016/j.rineng.2021.100264. [CrossRef]
- Fischer D, Eßbach C, Schönherr R, Dietrich D, Nickel D. Improving inner structure and properties of additive manufactured amorphous plastic parts: The effects of extrusion nozzle diameter and layer height. Addit Manuf 2022;51. https://doi.org/10.1016/j.addma.2022.102596. [CrossRef]
- Butt J, Bhaskar R, Mohaghegh V. Analysing the effects of layer heights and line widths on FFF-printed thermoplastics. International Journal of Advanced Manufacturing Technology 2022;121:7383–411. https://doi.org/10.1007/s00170-022-09810-z. [CrossRef]
- Alsoufi MS, Elsayed AE. How Surface Roughness Performance of Printed Parts Manufactured by Desktop FDM 3D Printer with PLA+ is Influenced by Measuring Direction. American Journal of Mechanical Engineering 2017;5:211–22. https://doi.org/10.12691/ajme-5-5-4. [CrossRef]
- Frunzaverde D, Cojocaru V, Bacescu N, Ciubotariu CR, Miclosina CO, Turiac RR, et al. The Influence of the Layer Height and the Filament Color on the Dimensional Accuracy and the Tensile Strength of FDM-Printed PLA Specimens. Polymers (Basel) 2023;15. https://doi.org/10.3390/polym15102377. [CrossRef]
- Zharylkassyn B, Perveen A, Talamona D. Effect of process parameters and materials on the dimensional accuracy of FDM parts. Mater Today Proc, vol. 44, Elsevier Ltd; 2021, p. 1307–11. https://doi.org/10.1016/j.matpr.2020.11.332. [CrossRef]
- Nabavi-Kivi A, Ayatollahi MR, Rezaeian P, Razavi N. Investigating the effect of printing speed and mode mixity on the fracture behavior of FDM-ABS specimens. Theoretical and Applied Fracture Mechanics 2022;118. https://doi.org/10.1016/j.tafmec.2021.103223. [CrossRef]
- Agarwal KM, Shubham P, Bhatia D, Sharma P, Vaid H, Vajpeyi R. Analyzing the Impact of Print Parameters on Dimensional Variation of ABS specimens printed using Fused Deposition Modelling (FDM). Sensors International 2022;3. https://doi.org/10.1016/j.sintl.2021.100149. [CrossRef]
- Yang TC, Yeh CH. Morphology and mechanical properties of 3D printed wood fiber/polylactic acid composite parts using Fused Deposition Modeling (FDM): The effects of printing speed. Polymers (Basel) 2020;12:1334. https://doi.org/10.3390/POLYM12061334. [CrossRef]
- Bhayana M, Singh J, Sharma A, Gupta M. A review on optimized FDM 3D printed Wood/PLA bio composite material characteristics. Mater Today Proc 2023. https://doi.org/10.1016/j.matpr.2023.03.029. [CrossRef]
- BioRes_16_3_5467_Narlioglu_SA_3D_printed_Wood_PLA_Composite_Pine_Sawdust_18907 n.d.
- Baiamonte M, Rapisarda M, Mistretta MC, Impallomeni G, La Mantia FP, Rizzarelli P. Wood flour and hazelnut shells polylactide-based biocomposites for packaging applications: Characterization, photo-oxidation, and compost burial degradation. Polym Compos 2024;45:9802–18. https://doi.org/10.1002/pc.28439. [CrossRef]
- Guessasma S, Belhabib S, Nouri H. Microstructure and mechanical performance of 3D printed wood-PLA/PHA using fused deposition modelling: Effect of printing temperature. Polymers (Basel) 2019;11. https://doi.org/10.3390/polym11111778. [CrossRef]
- Saha A, Kulkarni ND, Kumari P. Development of Bambusa tulda-reinforced different biopolymer matrix green composites and MCDM-based sustainable material selection for automobile applications. Environ Dev Sustain 2025;27:10655–91. https://doi.org/10.1007/s10668-023-04327-1. [CrossRef]
- Zindani D, Maity SR, Bhowmik S, Chakraborty S. A material selection approach using the TODIM (TOmada de Decisao Interativa Multicriterio) method and its analysis. n.d.
- Kulkarni ND, Saha A, Kumari P. Utilizing multicriteria decision-making approach for material selection in hybrid polymer nanocomposites for energy-harvesting applications. Polym Compos 2024;45:6264–77. https://doi.org/10.1002/pc.28194. [CrossRef]
- Kumar S, Saha A, Zindani D. Agro-waste-based polymeric composite laminates for aerospace cabin interior and identification of their optimal configuration. Biomass Convers Biorefin 2024;14:31907–23. https://doi.org/10.1007/s13399-023-04914-2. [CrossRef]
- Saha A, Kumar S. Effects of graphene nanoparticles with organic wood particles: A synergistic effect on the structural, physical, thermal, and mechanical behavior of hybrid composites. Polym Adv Technol 2022;33:3201–15. https://doi.org/10.1002/pat.5772. [CrossRef]
- Bagla A, Kulkarni ND, Kumari P, Saha A. Development and Characterization of a Sustainable Bamboo-Polyvinylidene Fluoride Electro Spun Piezoelectric Nanogenerator Device for Smart Health Monitoring. ACS Appl Polym Mater 2025;7:5584–97. https://doi.org/10.1021/acsapm.5c00408. [CrossRef]
- Kulkarni ND, Saha A, Kumari P. The development of a low-cost, sustainable bamboo-based flexible bio composite for impact sensing and mechanical energy harvesting applications. J Appl Polym Sci 2023;140. https://doi.org/10.1002/app.54040. [CrossRef]
- Kumar S, Saha A. Graphene nanoplatelets/organic wood dust hybrid composites: physical, mechanical and thermal characterization. Iranian Polymer Journal (English Edition) 2021;30:935–51. https://doi.org/10.1007/s13726-021-00946-5. [CrossRef]
- Xu L, Yang W, Liu M, Wang Z, Liu X. Wood Species Identification and Property Evaluation of Archaeological Wood Excavated from J1 at Shenduntou Site, Fanchang, Anhui, China. Forests 2025;16. https://doi.org/10.3390/f16071173. [CrossRef]
- Vlata M, Rapti S, Boyatzis S, Bardet M, Lucejko JJ, Pournou A. Melamine-formaldehyde in the conservation of waterlogged archaeological wood: investigating the effect of the treatment on wood residual chemistry with FTIR, 13C NMR, Py(HMDS)-GC/MS and EGA-MS. Wood Sci Technol 2025;59. https://doi.org/10.1007/s00226-024-01610-w. [CrossRef]
- Traoré M, Martínez Cortizas A, López-Costas O, Paolino F, Łucejko JJ. Combining infrared spectroscopy (FTIR-ATR) and analytical pyrolysis for assessing chemical degradation pathways in waterlogged Neolithic wood. J Anal Appl Pyrolysis 2025;191. https://doi.org/10.1016/j.jaap.2025.107197. [CrossRef]
- Christophersen TPB, Gebremariam K, Risbøl O, Peacock EE. Identification of low-concentration tar in wood samples from archaeological contexts by ATR-FTIR. J Cult Herit 2025;75:93–103. https://doi.org/10.1016/j.culher.2025.07.010. [CrossRef]
- Saha A, Kumari P. Effect of alkaline treatment on physical, structural, mechanical and thermal properties of Bambusa tulda (Northeast Indian species) based sustainable green composites. Polym Compos 2023;44:2449–73. https://doi.org/10.1002/pc.27256. [CrossRef]
- Saha A, Kulkarni ND, Kumari P. Development of Bambusa tulda fiber-micro particle reinforced hybrid green composite: A sustainable solution for tomorrow’s challenges in construction and building engineering. Constr Build Mater 2024;441. https://doi.org/10.1016/j.conbuildmat.2024.137486. [CrossRef]
- Saha A, Kulkarni ND, Kumari P. Development of Bambusa tulda fiber-micro particle reinforced hybrid green composite: A sustainable solution for tomorrow’s challenges in construction and building engineering. Constr Build Mater 2024;441. https://doi.org/10.1016/j.conbuildmat.2024.137486. [CrossRef]
- Kumar R, Kumar K, Bhowmik S. Mechanical characterization and quantification of tensile, fracture and viscoelastic characteristics of wood filler reinforced epoxy composite. Wood Sci Technol 2018;52:677–99. https://doi.org/10.1007/s00226-018-0995-0. [CrossRef]
- Sarker R, Bari MA Al, Saad S, Akash NM, Gupta C, Mahmud CK, et al. Investigation of mechanical and physicochemical properties of additively manufactured underutilized wood-PLA biocomposites. Polym Compos 2025. https://doi.org/10.1002/pc.29989. [CrossRef]
- Ecker JV, Haider A, Burzic I, Huber A, Eder G, Hild S. Mechanical properties and water absorption behaviour of PLA and PLA/wood composites prepared by 3D printing and injection moulding. Rapid Prototyp J 2019;25:672–8. https://doi.org/10.1108/RPJ-06-2018-0149. [CrossRef]
- Das A, Gilmer EL, Biria S, Bortner MJ. Importance of Polymer Rheology on Material Extrusion Additive Manufacturing: Correlating Process Physics to Print Properties. ACS Appl Polym Mater 2021;3:1218–49. https://doi.org/10.1021/acsapm.0c01228. [CrossRef]
- Hassan M, Mohanty AK, Misra M. Additive Manufacturing of a Super Toughened Biodegradable Polymer Blend: Structure-Property-Processing Correlation and 3D Printed Prosthetic Part Development. ACS Appl Polym Mater 2024;6:3849–63. https://doi.org/10.1021/acsapm.3c03150. [CrossRef]
- Sanchaniya JV, Kannathasan KR, Vejanand SR, Joshi J, Lasenko I. Effect of Infill Pattern Design on Tensile Strength of Fused Deposition Modelled Specimens. Environment Technology Resources - Proceedings of the 16th International Scientific and Practical Conference, vol. 4, RTU PRESS; 2025, p. 375–82. https://doi.org/10.17770/etr2025vol4.8409. [CrossRef]
- Wegner I, Campbell M. Variable-Density Gyroid Infill for Increased Strength and Stiffness of 3D Printed Components, American Institute of Aeronautics and Astronautics (AIAA); 2024. https://doi.org/10.2514/6.2024-81359. [CrossRef]
- Hassan MR, Jeon HW, Kim G, Park K. The effects of infill patterns and infill percentages on energy consumption in fused filament fabrication using CFR-PEEK. Rapid Prototyp J 2021;27:1886–99. https://doi.org/10.1108/RPJ-11-2020-0288. [CrossRef]
- Dubey D, Singh SP, Behera BK. Mechanical, thermal, and microstructural analysis of 3D printed short carbon fiber-reinforced nylon composites across diverse infill patterns. Progress in Additive Manufacturing 2025;10:1671–89. https://doi.org/10.1007/s40964-024-00731-9. [CrossRef]
- Dudescu C, Racz L. Effects of Raster Orientation, Infill Rate and Infill Pattern on the Mechanical Properties of 3D Printed Materials. ACTA Universitatis Cibiniensis 2017;69:23–30. https://doi.org/10.1515/aucts-2017-0004. [CrossRef]
- Calabrese L, Marabello G, Chairi M, Di Bella G. Optimization of Deposition Temperature and Gyroid Infill to Improve Flexural Performance of PLA and PLA–Flax Fiber Composite Sandwich Structures. Journal of Manufacturing and Materials Processing 2025;9. https://doi.org/10.3390/jmmp9020031. [CrossRef]
- Kumaresan Gladys A, Damodaran A, Ezhilan J J, Raghavan M, Venkatesan N. Effect of infill patterns on carbon nylon 3D-printed composites under ballistic impact. Phys Scr 2025;100. https://doi.org/10.1088/1402-4896/add29f. [CrossRef]
- Greco A, De Luca A, Gerbino S, Lamanna G, Sepe R. Influence of infill pattern and layer height on surface characteristics and fatigue behavior of FFF-printed PEEK. Fatigue Fract Eng Mater Struct 2024;47:4741–54. https://doi.org/10.1111/ffe.14450. [CrossRef]
- Dubey D, Singh SP, Behera BK. Mechanical, thermal, and microstructural analysis of 3D printed short carbon fiber-reinforced nylon composites across diverse infill patterns. Progress in Additive Manufacturing 2025;10:1671–89. https://doi.org/10.1007/s40964-024-00731-9. [CrossRef]
- Ecker JV, Haider A, Burzic I, Huber A, Eder G, Hild S. Mechanical properties and water absorption behaviour of PLA and PLA/wood composites prepared by 3D printing and injection moulding. Rapid Prototyp J 2019;25:672–8. https://doi.org/10.1108/RPJ-06-2018-0149. [CrossRef]
- Cañero-Nieto JM, Campo-Campo RJ, Díaz-Bolaño I, Ariza-Echeverri EA, Deluque-Toro CE, Solano-Martos JF. Infill pattern strategy impact on the cross-sectional area at gauge length of material extrusion 3D printed polylactic acid parts. J Intell Manuf 2025. https://doi.org/10.1007/s10845-025-02579-4. [CrossRef]
- Hsueh MH, Lai CJ, Liu KY, Chung CF, Wang SH, Pan CY, et al. Effects of printing temperature and filling percentage on the mechanical behavior of fused deposition molding technology components for 3d printing. Polymers (Basel) 2021;13. https://doi.org/10.3390/polym13172910. [CrossRef]
- Vanaei HR, Raissi K, Deligant M, Shirinbayan M, Fitoussi J, Khelladi S, et al. Toward the understanding of temperature effect on bonding strength, dimensions and geometry of 3D-printed parts. J Mater Sci 2020;55:14677–89. https://doi.org/10.1007/s10853-020-05057-9. [CrossRef]
- Martínez-Monzó J, Cárdenas J, García-Segovia P. Effect of Temperature on 3D Printing of Commercial Potato Puree. Food Biophys 2019;14:225–34. https://doi.org/10.1007/s11483-019-09576-0. [CrossRef]
- Ulkir O, Ertugrul I, Ersoy S, Yağımlı B. The Effects of Printing Temperature on the Mechanical Properties of 3D-Printed Acrylonitrile Butadiene Styrene. Applied Sciences (Switzerland) 2024;14. https://doi.org/10.3390/app14083376. [CrossRef]
- Nazir A, Jeng JY. A high-speed additive manufacturing approach for achieving high printing speed and accuracy. Proc Inst Mech Eng C J Mech Eng Sci 2020;234:2741–9. https://doi.org/10.1177/0954406219861664. [CrossRef]
- Žarko J, Vladić G, Pál M, Dedijer S. Influence of printing speed on production of embossing tools using fdM 3d printing technology. Journal of Graphic Engineering and Design 2017;8:19–27. https://doi.org/10.24867/JGED-2017-1-019. [CrossRef]
- Khosravani MR, Berto F, Ayatollahi MR, Reinicke T. Characterization of 3D-printed PLA parts with different raster orientations and printing speeds. Sci Rep 2022;12. https://doi.org/10.1038/s41598-022-05005-4. [CrossRef]
- Khosravani MR, Berto F, Ayatollahi MR, Reinicke T. Characterization of 3D-printed PLA parts with different raster orientations and printing speeds. Sci Rep 2022;12. https://doi.org/10.1038/s41598-022-05005-4. [CrossRef]
- Krapež Tomec D, Schwarzkopf M, Repič R, Žigon J, Gospodarič B, Kariž M. Effect of thermal modification of wood particles for wood-PLA composites on properties of filaments, 3D-printed parts and injection moulded parts. European Journal of Wood and Wood Products 2024;82:403–16. https://doi.org/10.1007/s00107-023-02018-2. [CrossRef]
- Veeman D, Palaniyappan S. Process optimisation on the compressive strength property for the 3D printing of PLA/almond shell composite. Journal of Thermoplastic Composite Materials 2023;36:2435–58. https://doi.org/10.1177/08927057221092327. [CrossRef]
- Mohamed Shafeer PP, Pitchaimani J, Doddamani M. A short banana fiber—PLA filament for 3D printing: Development and characterization. Polym Compos 2025;46:4863–80. https://doi.org/10.1002/pc.28519. [CrossRef]
- Le Duigou A, Castro M, Bevan R, Martin N. 3D printing of wood fibre biocomposites: From mechanical to actuation functionality. Mater Des 2016;96:106–14. https://doi.org/10.1016/j.matdes.2016.02.018. [CrossRef]
- Awad S, Siakeng R, Khalaf EM, Mahmoud MH, Fouad H, Jawaid M, et al. Evaluation of characterisation efficiency of natural fibre-reinforced polylactic acid biocomposites for 3D printing applications. Sustainable Materials and Technologies 2023;36. https://doi.org/10.1016/j.susmat.2023.e00620. [CrossRef]
- Felix Sahayaraj A, Muthukrishnan M, Ramesh M. Experimental investigation on physical, mechanical, and thermal properties of jute and hemp fibers reinforced hybrid polylactic acid composites. Polym Compos 2022;43:2854–63. https://doi.org/10.1002/pc.26581. [CrossRef]
Figure 1.
(a) Twin-screw extruder, (b) RP filament maker used in the present experiment, (c) developed composite filament along with Bambu lab 3D printer and 3d Printed sample for different testing.
Figure 1.
(a) Twin-screw extruder, (b) RP filament maker used in the present experiment, (c) developed composite filament along with Bambu lab 3D printer and 3d Printed sample for different testing.
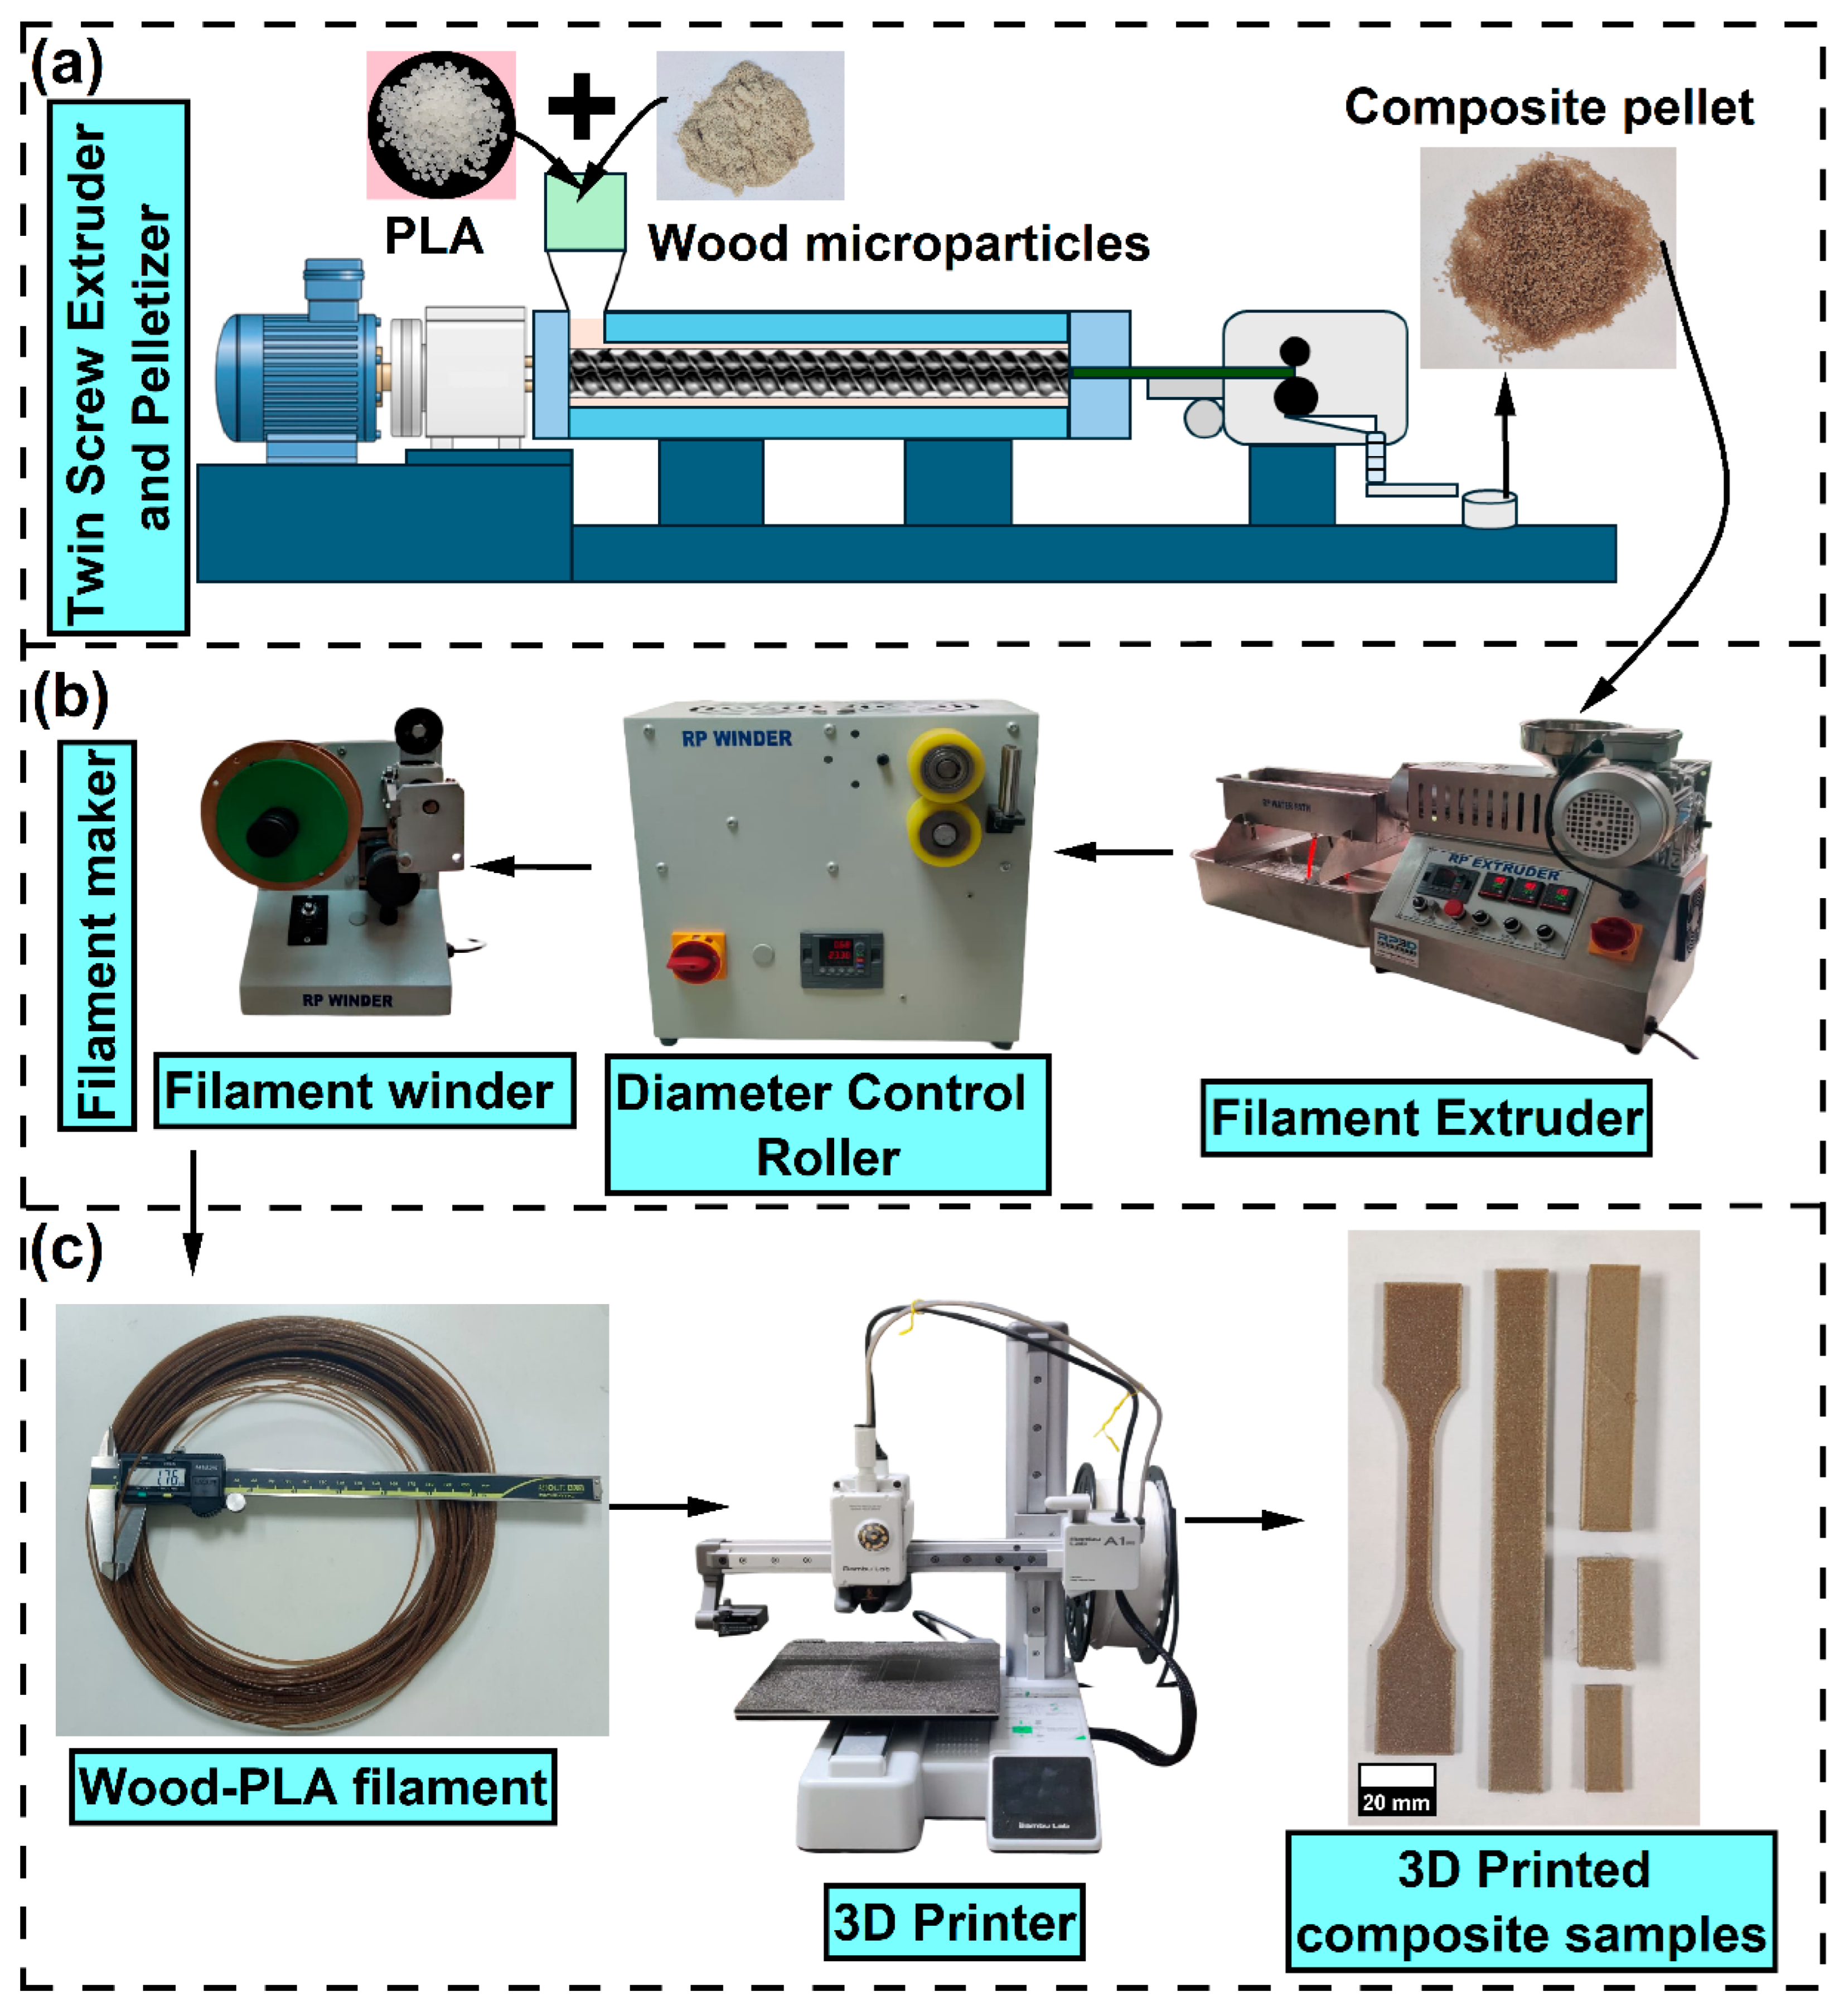
Figure 3.
SEM image of (a) untreated and (b) treated wood particles, (c) and (d) are particle distributions of untreated and treated wood particles, (e) XRD graph, (f) FTIR plot and (g) TGA graph of treated and untreated wood microparticles.
Figure 3.
SEM image of (a) untreated and (b) treated wood particles, (c) and (d) are particle distributions of untreated and treated wood particles, (e) XRD graph, (f) FTIR plot and (g) TGA graph of treated and untreated wood microparticles.
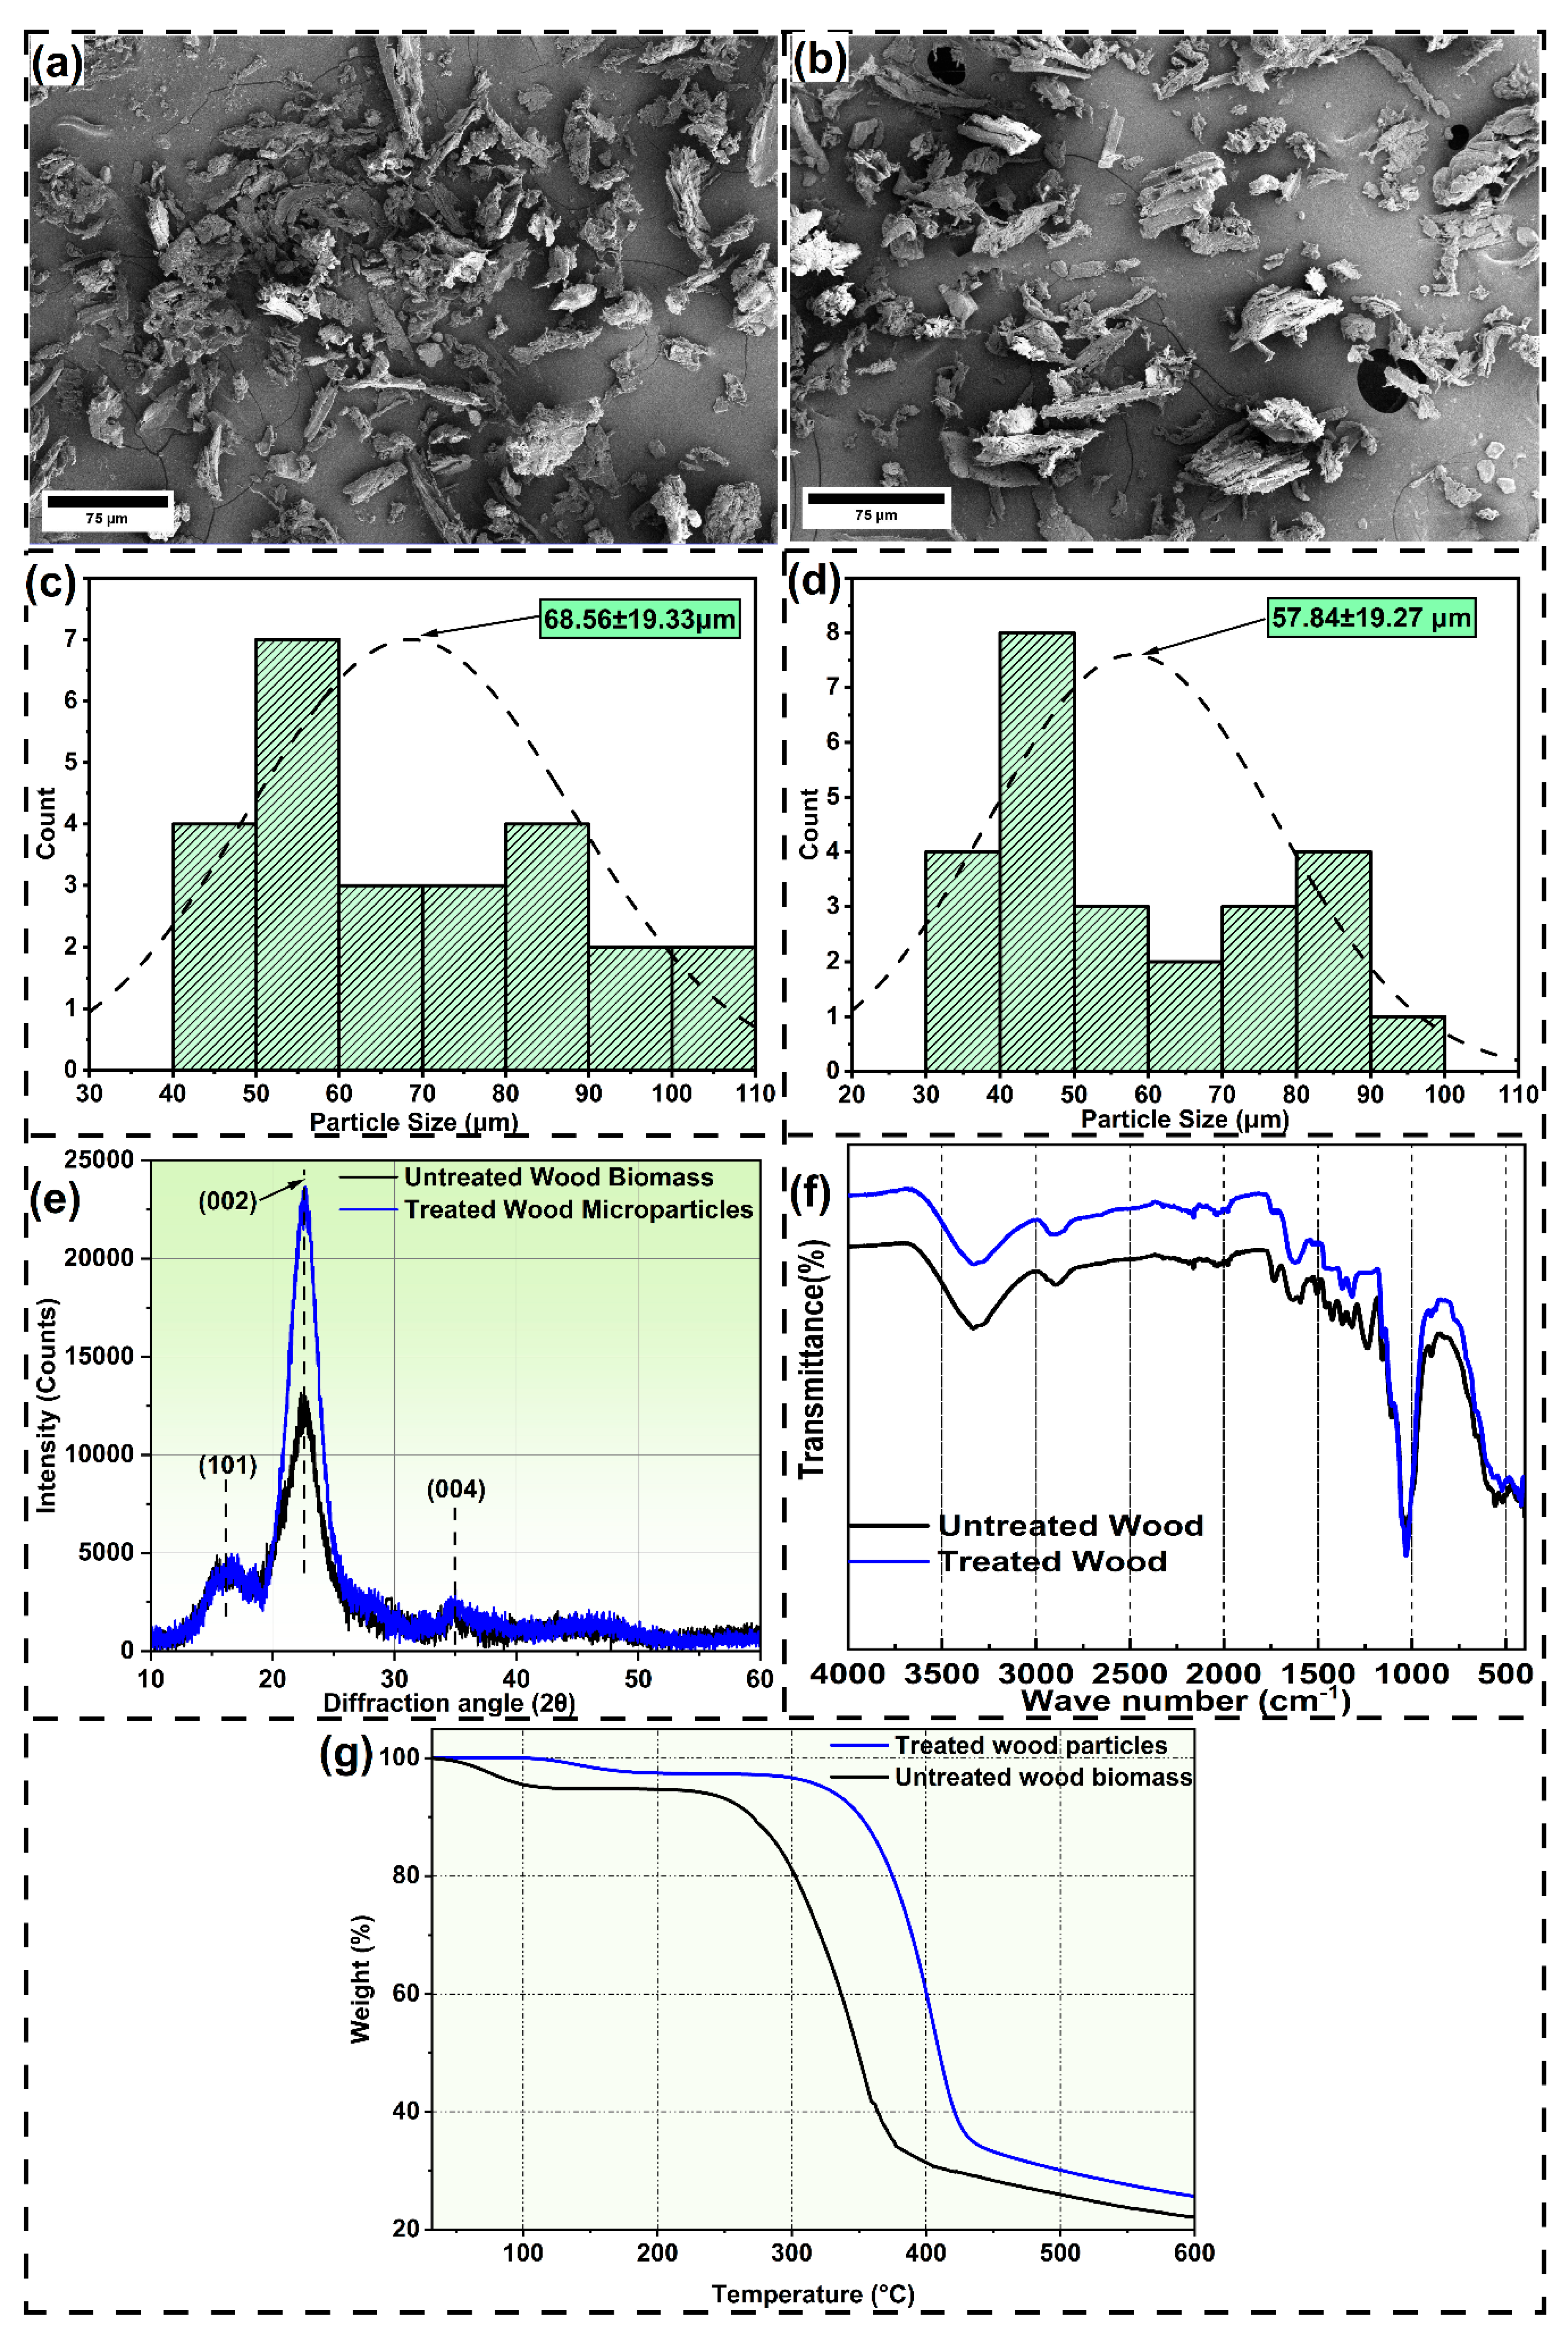
Figure 4.
(a) Developed wood-PLA filament, (b) vertical and (c) cross-sectional view of filament, (d) distribution of wood particles on PLA matrix.
Figure 4.
(a) Developed wood-PLA filament, (b) vertical and (c) cross-sectional view of filament, (d) distribution of wood particles on PLA matrix.
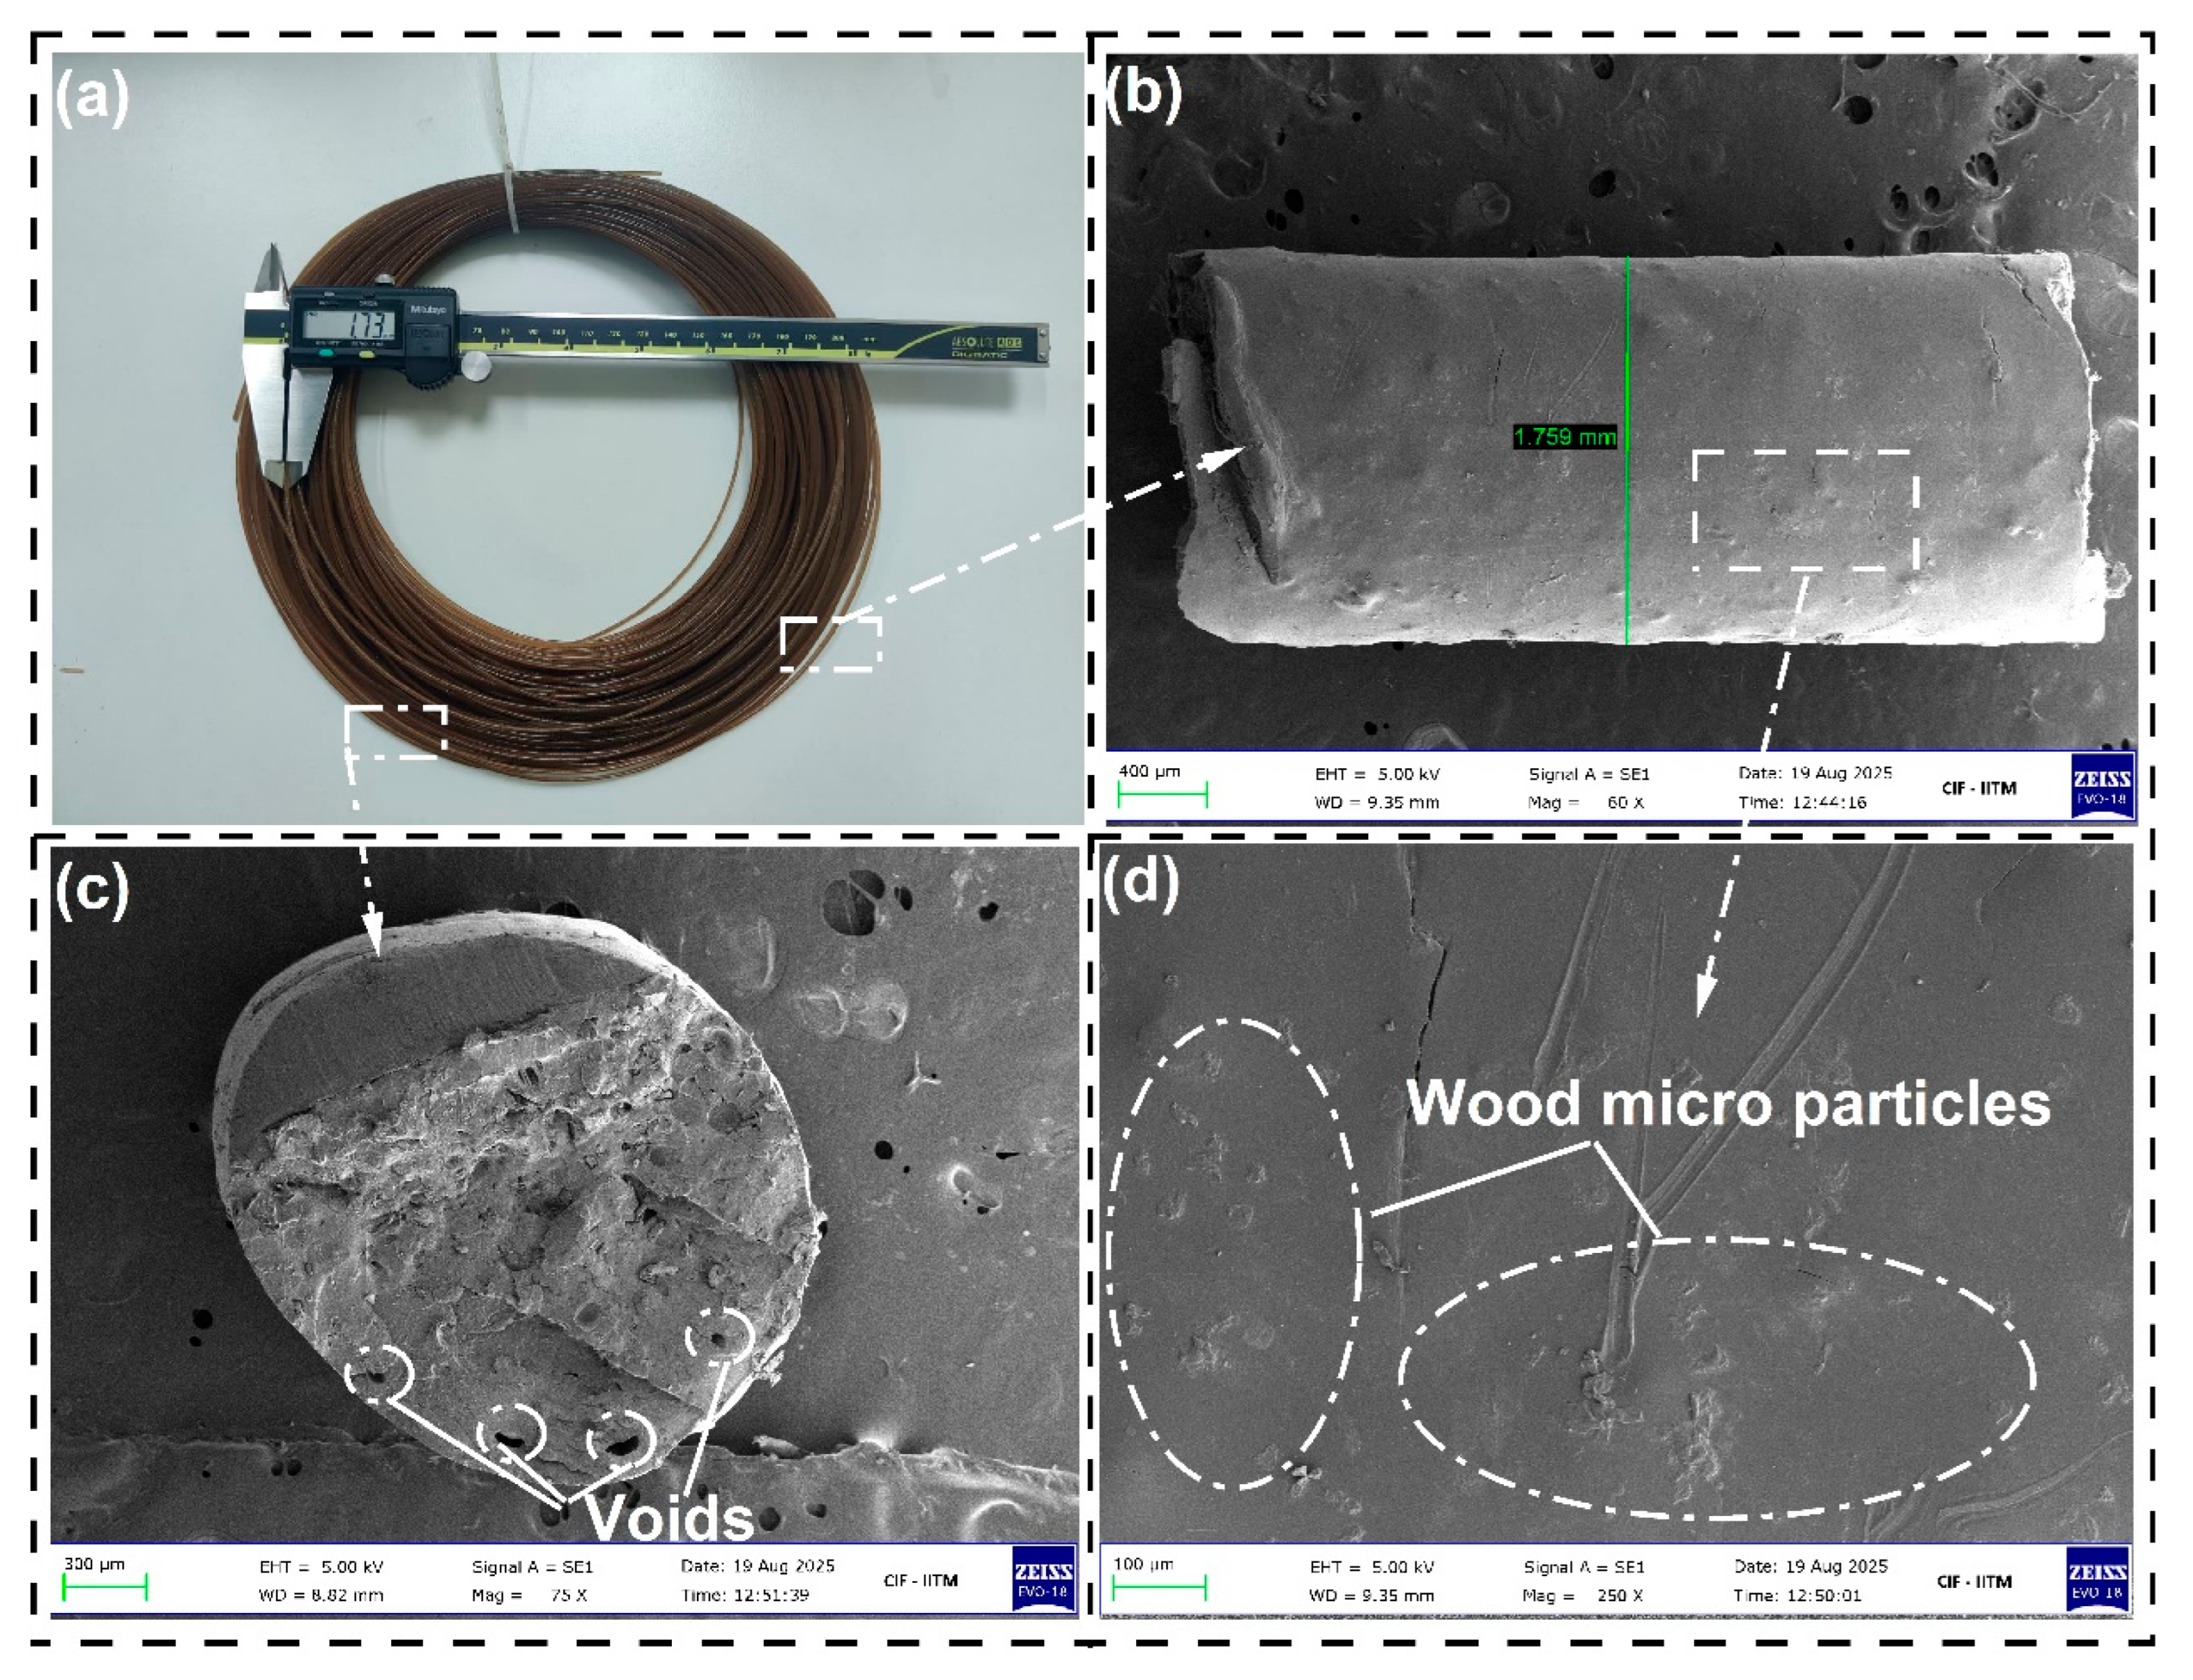
Figure 5.
(a) DSC curve, (b) storage modulus, (c) loss modulus and (d) viscosity analysis of developed filament at different printing temperature.
Figure 5.
(a) DSC curve, (b) storage modulus, (c) loss modulus and (d) viscosity analysis of developed filament at different printing temperature.
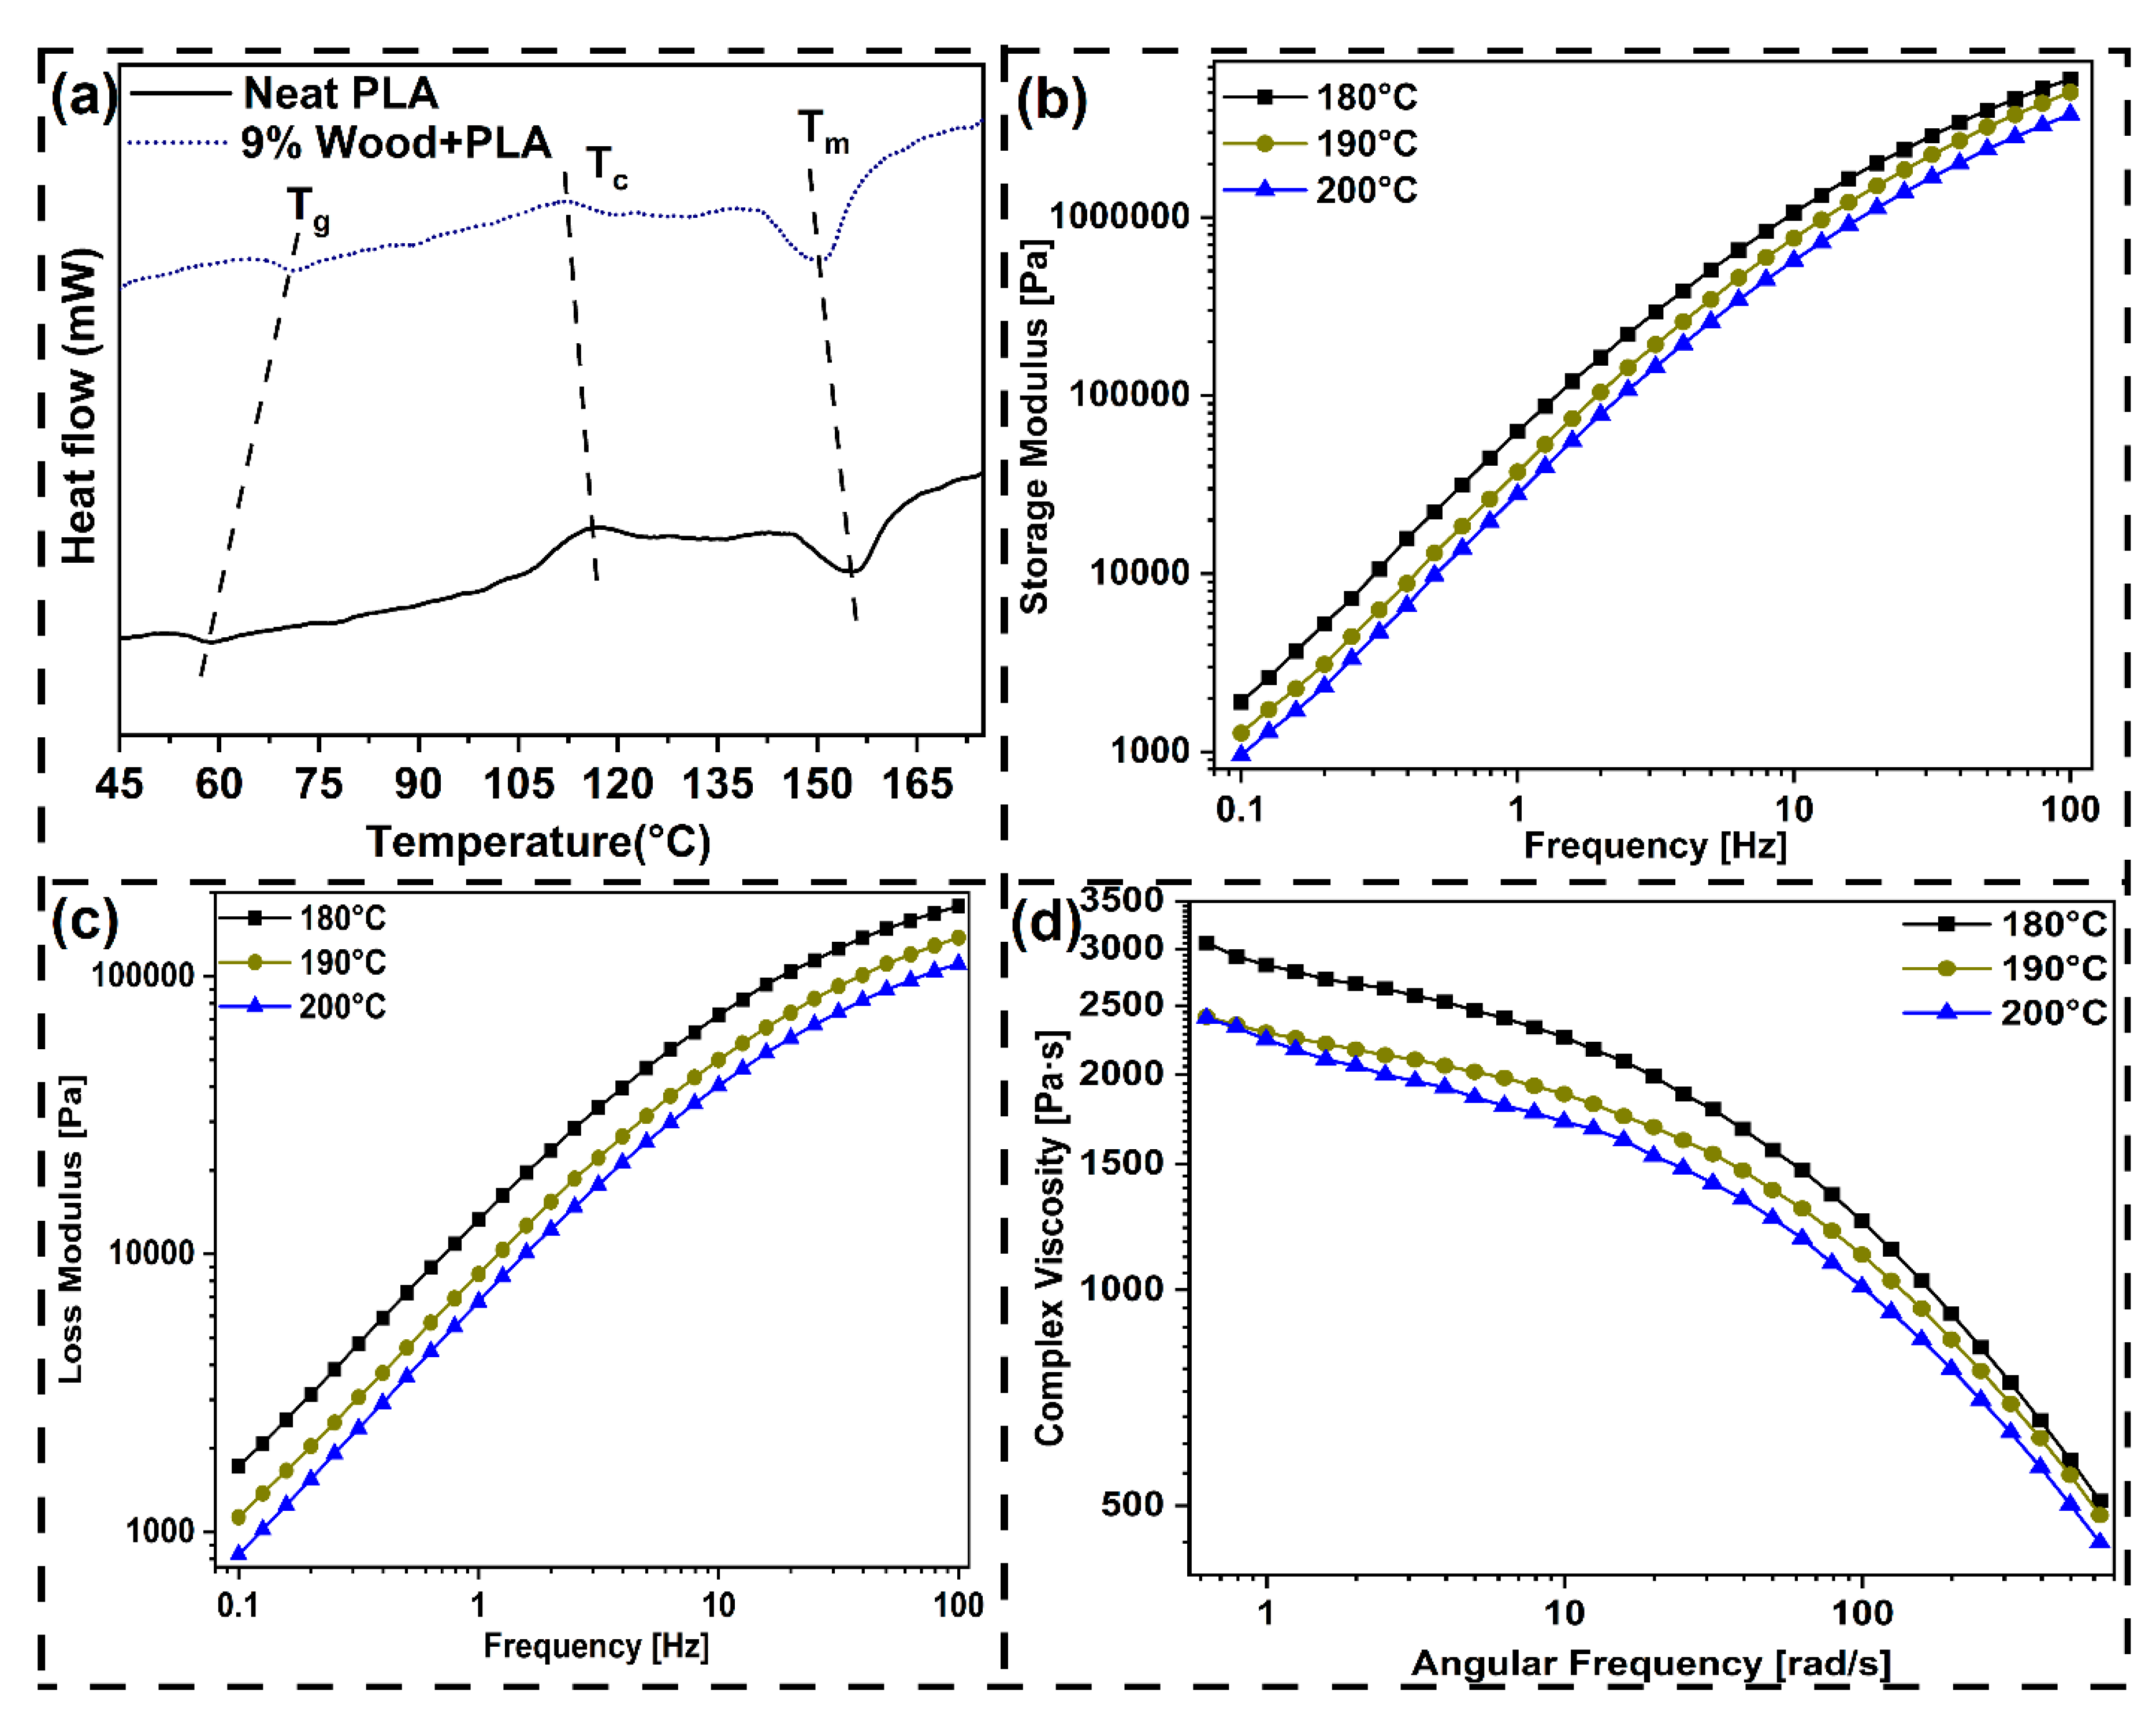
Figure 6.
(a) Tensile stress-strain plot, (b) tensile testing, (c) variation of tensile properties for different test conditions and mean effective plot for (d) tensile strength, (e) tensile modulus, and (f) elongation before break values.
Figure 6.
(a) Tensile stress-strain plot, (b) tensile testing, (c) variation of tensile properties for different test conditions and mean effective plot for (d) tensile strength, (e) tensile modulus, and (f) elongation before break values.
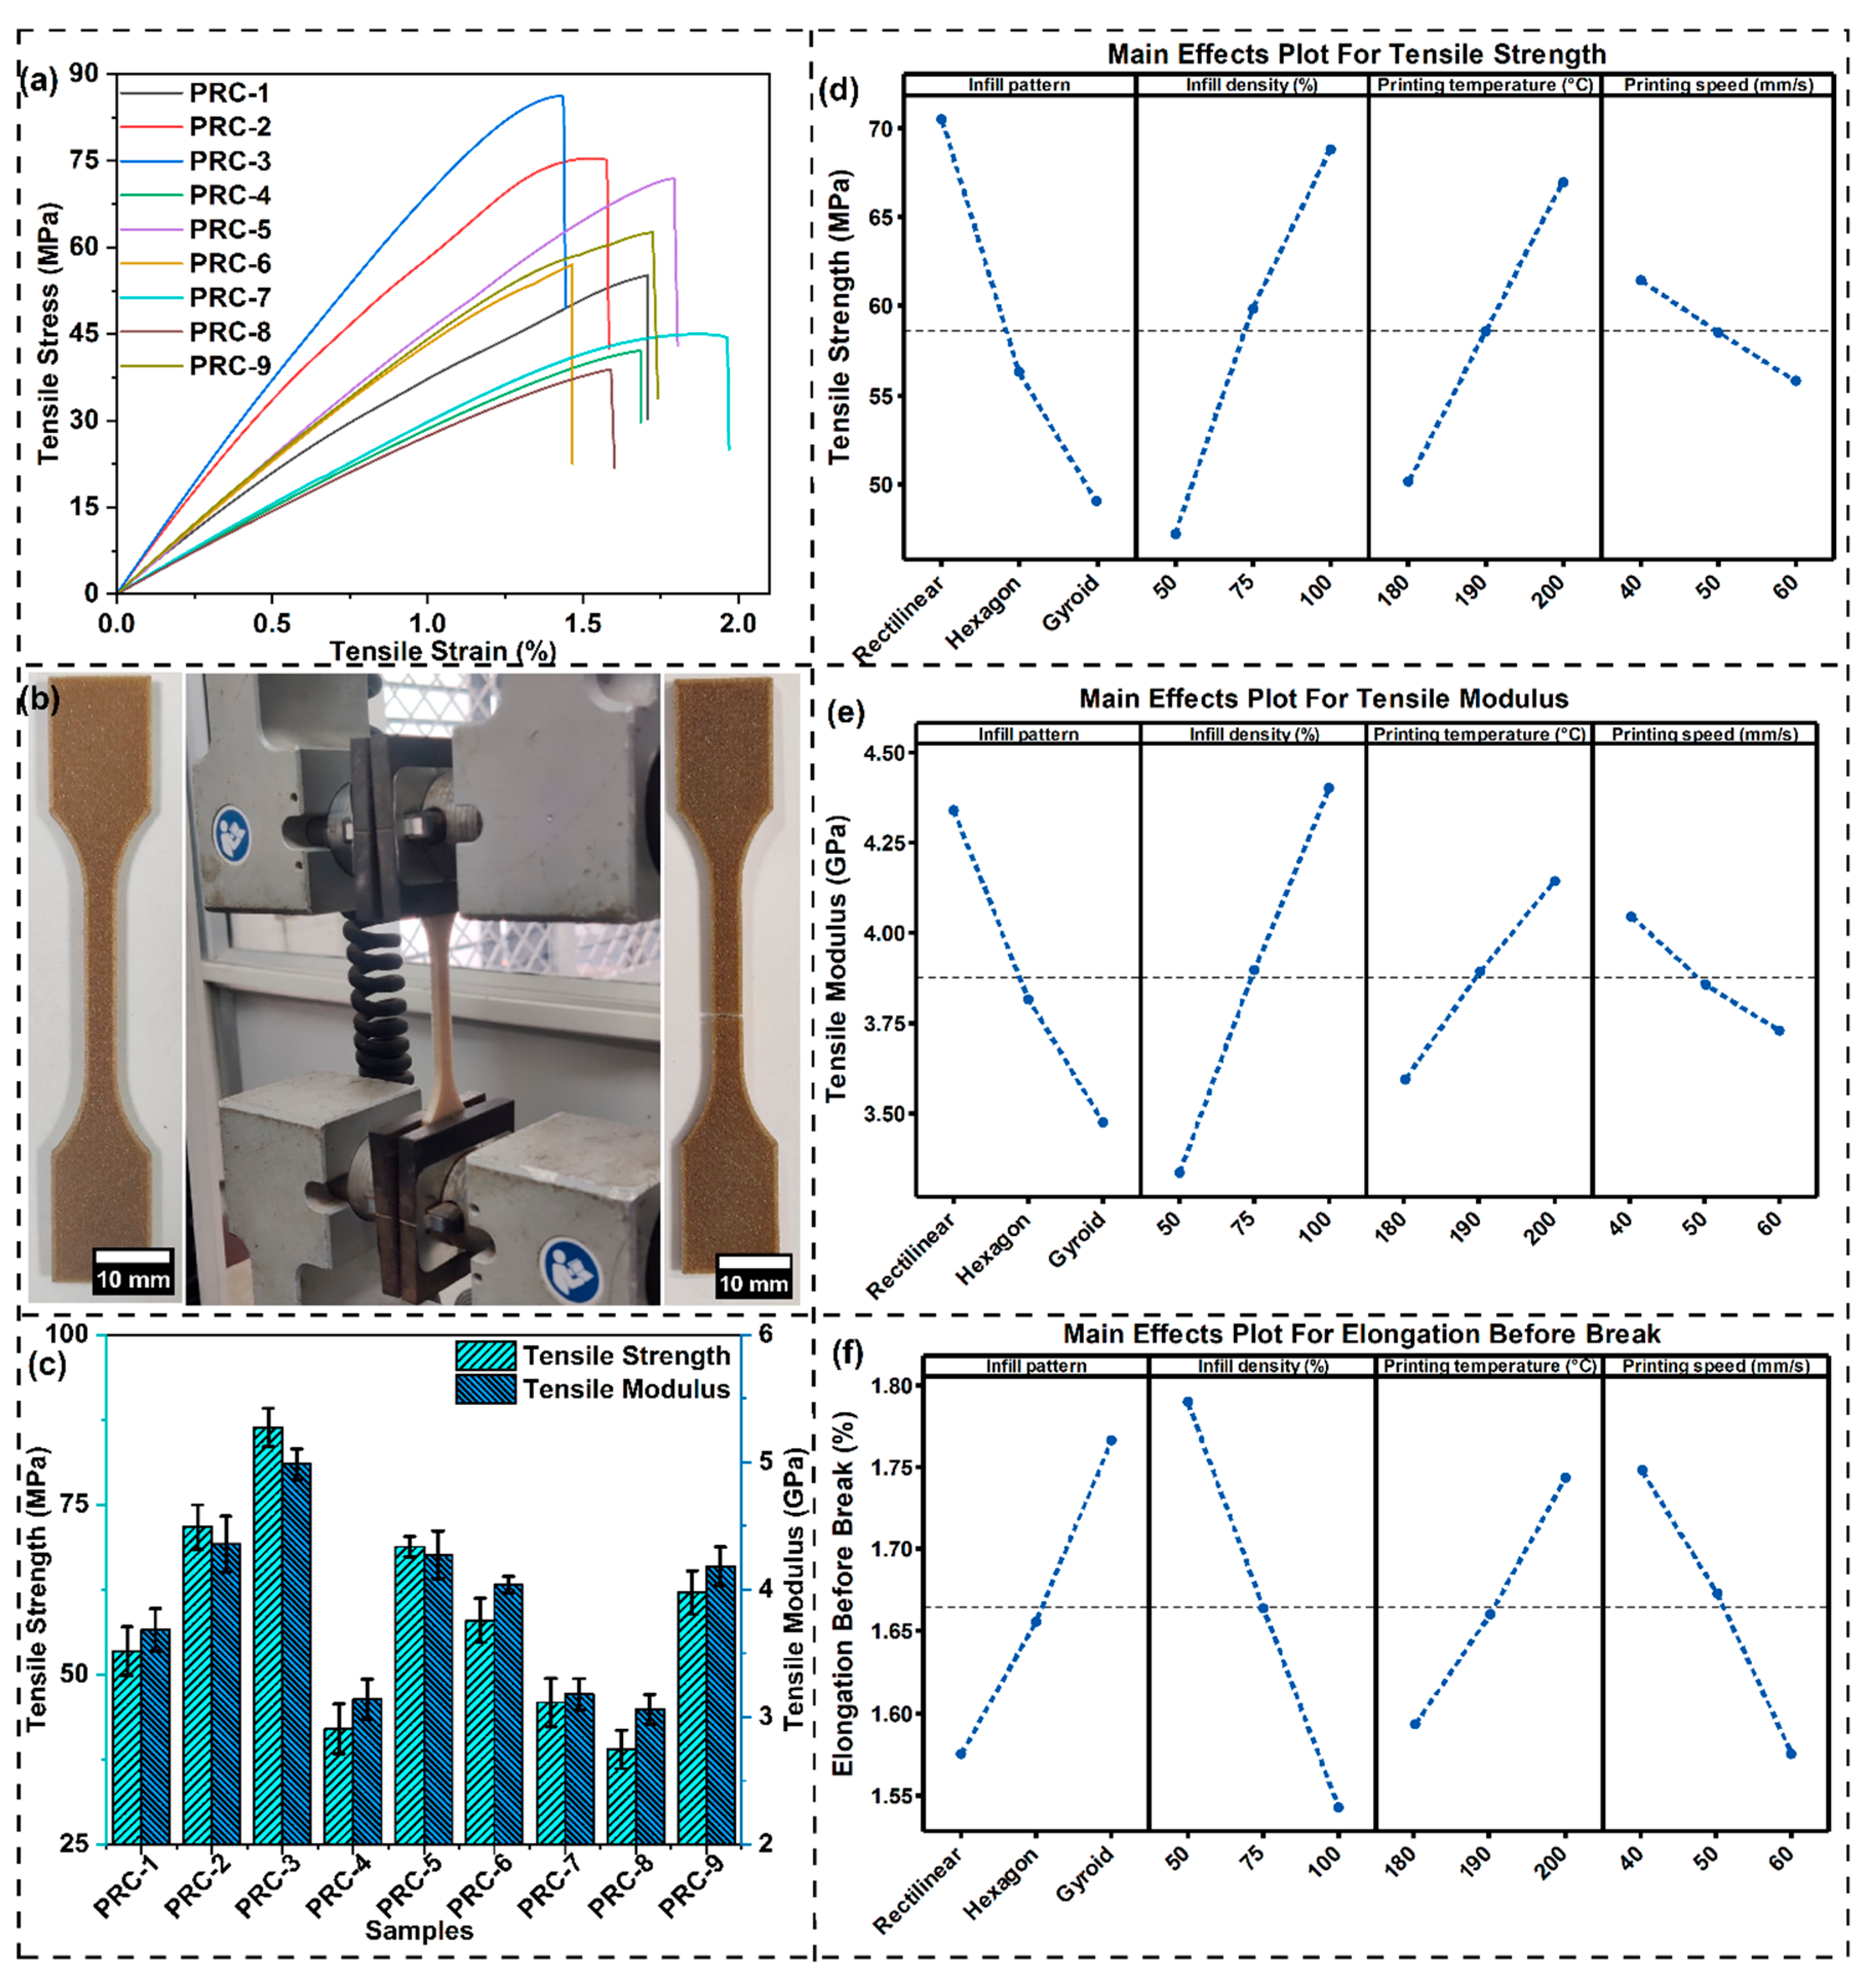
Figure 7.
(a) Flexural load-displacement curves, (b) variation of flexural properties with different experimental conditions, mean effective plot for (c) flexural strength and (d) flexural modulus.
Figure 7.
(a) Flexural load-displacement curves, (b) variation of flexural properties with different experimental conditions, mean effective plot for (c) flexural strength and (d) flexural modulus.
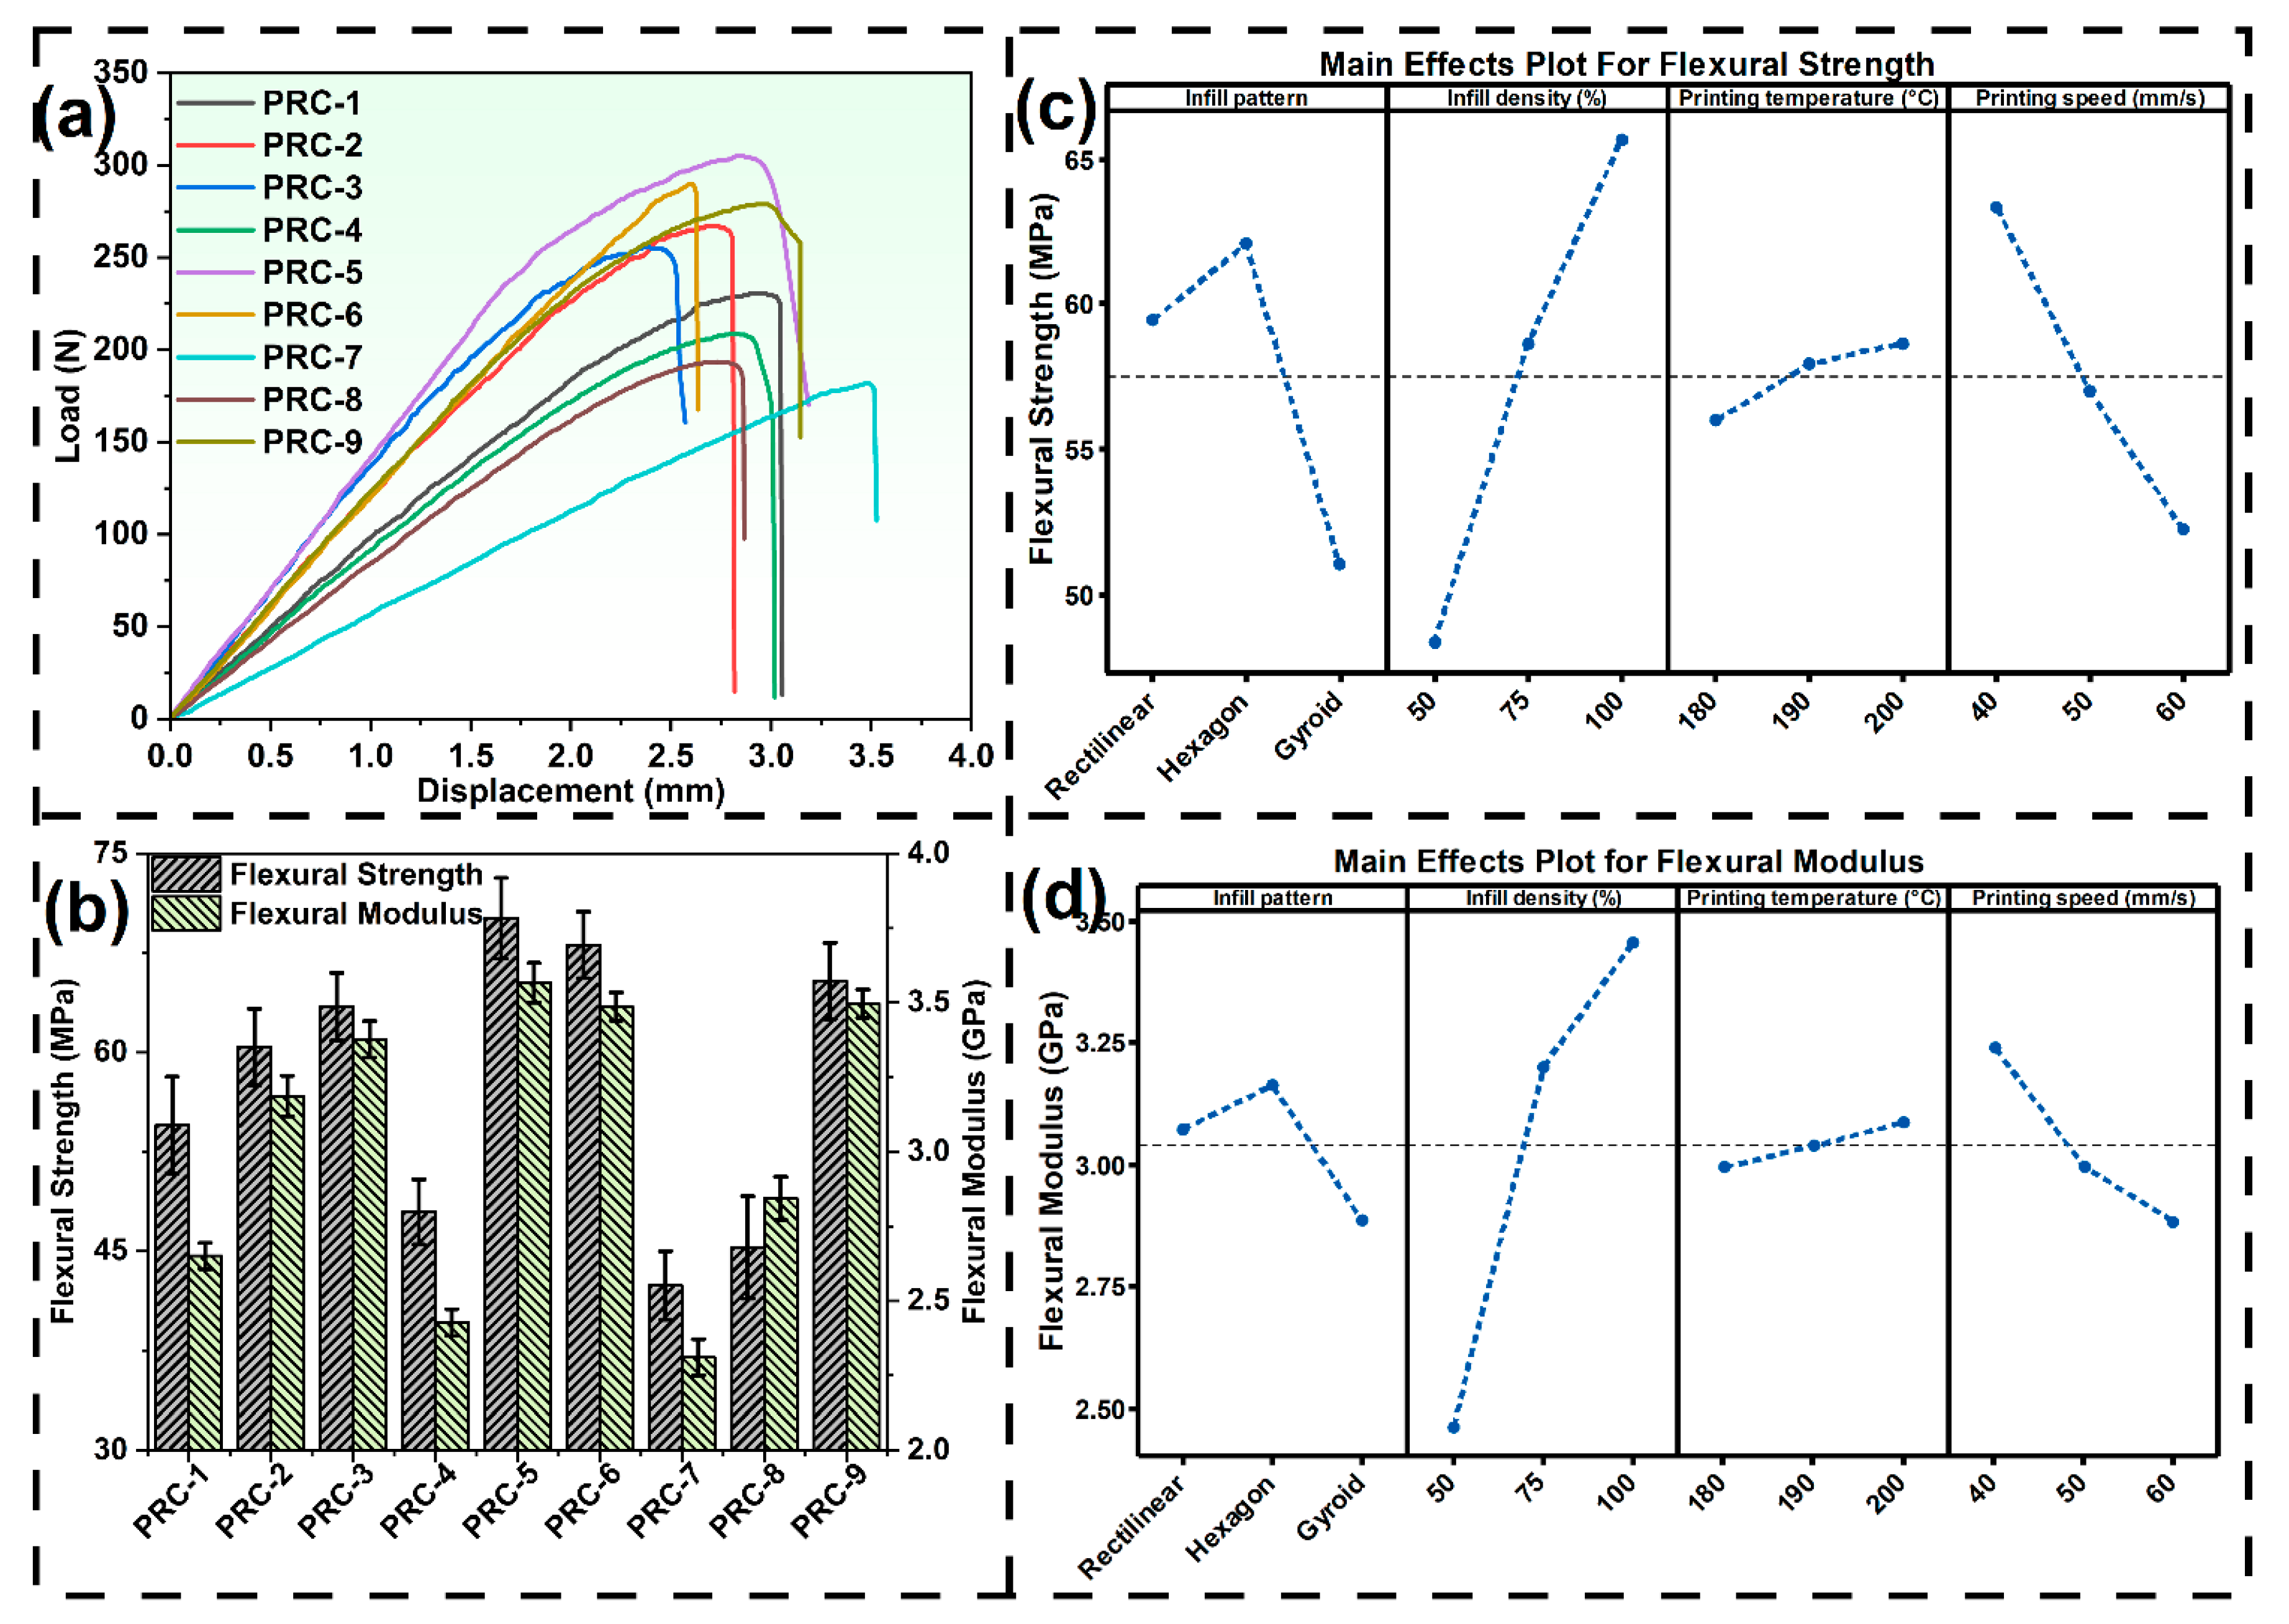
Figure 8.
(a) Compressive load-displacement plot (b) variation of compressive properties for different printing condition, mean effective plot for (c) compressive strength and (d) compressive modulus.
Figure 8.
(a) Compressive load-displacement plot (b) variation of compressive properties for different printing condition, mean effective plot for (c) compressive strength and (d) compressive modulus.
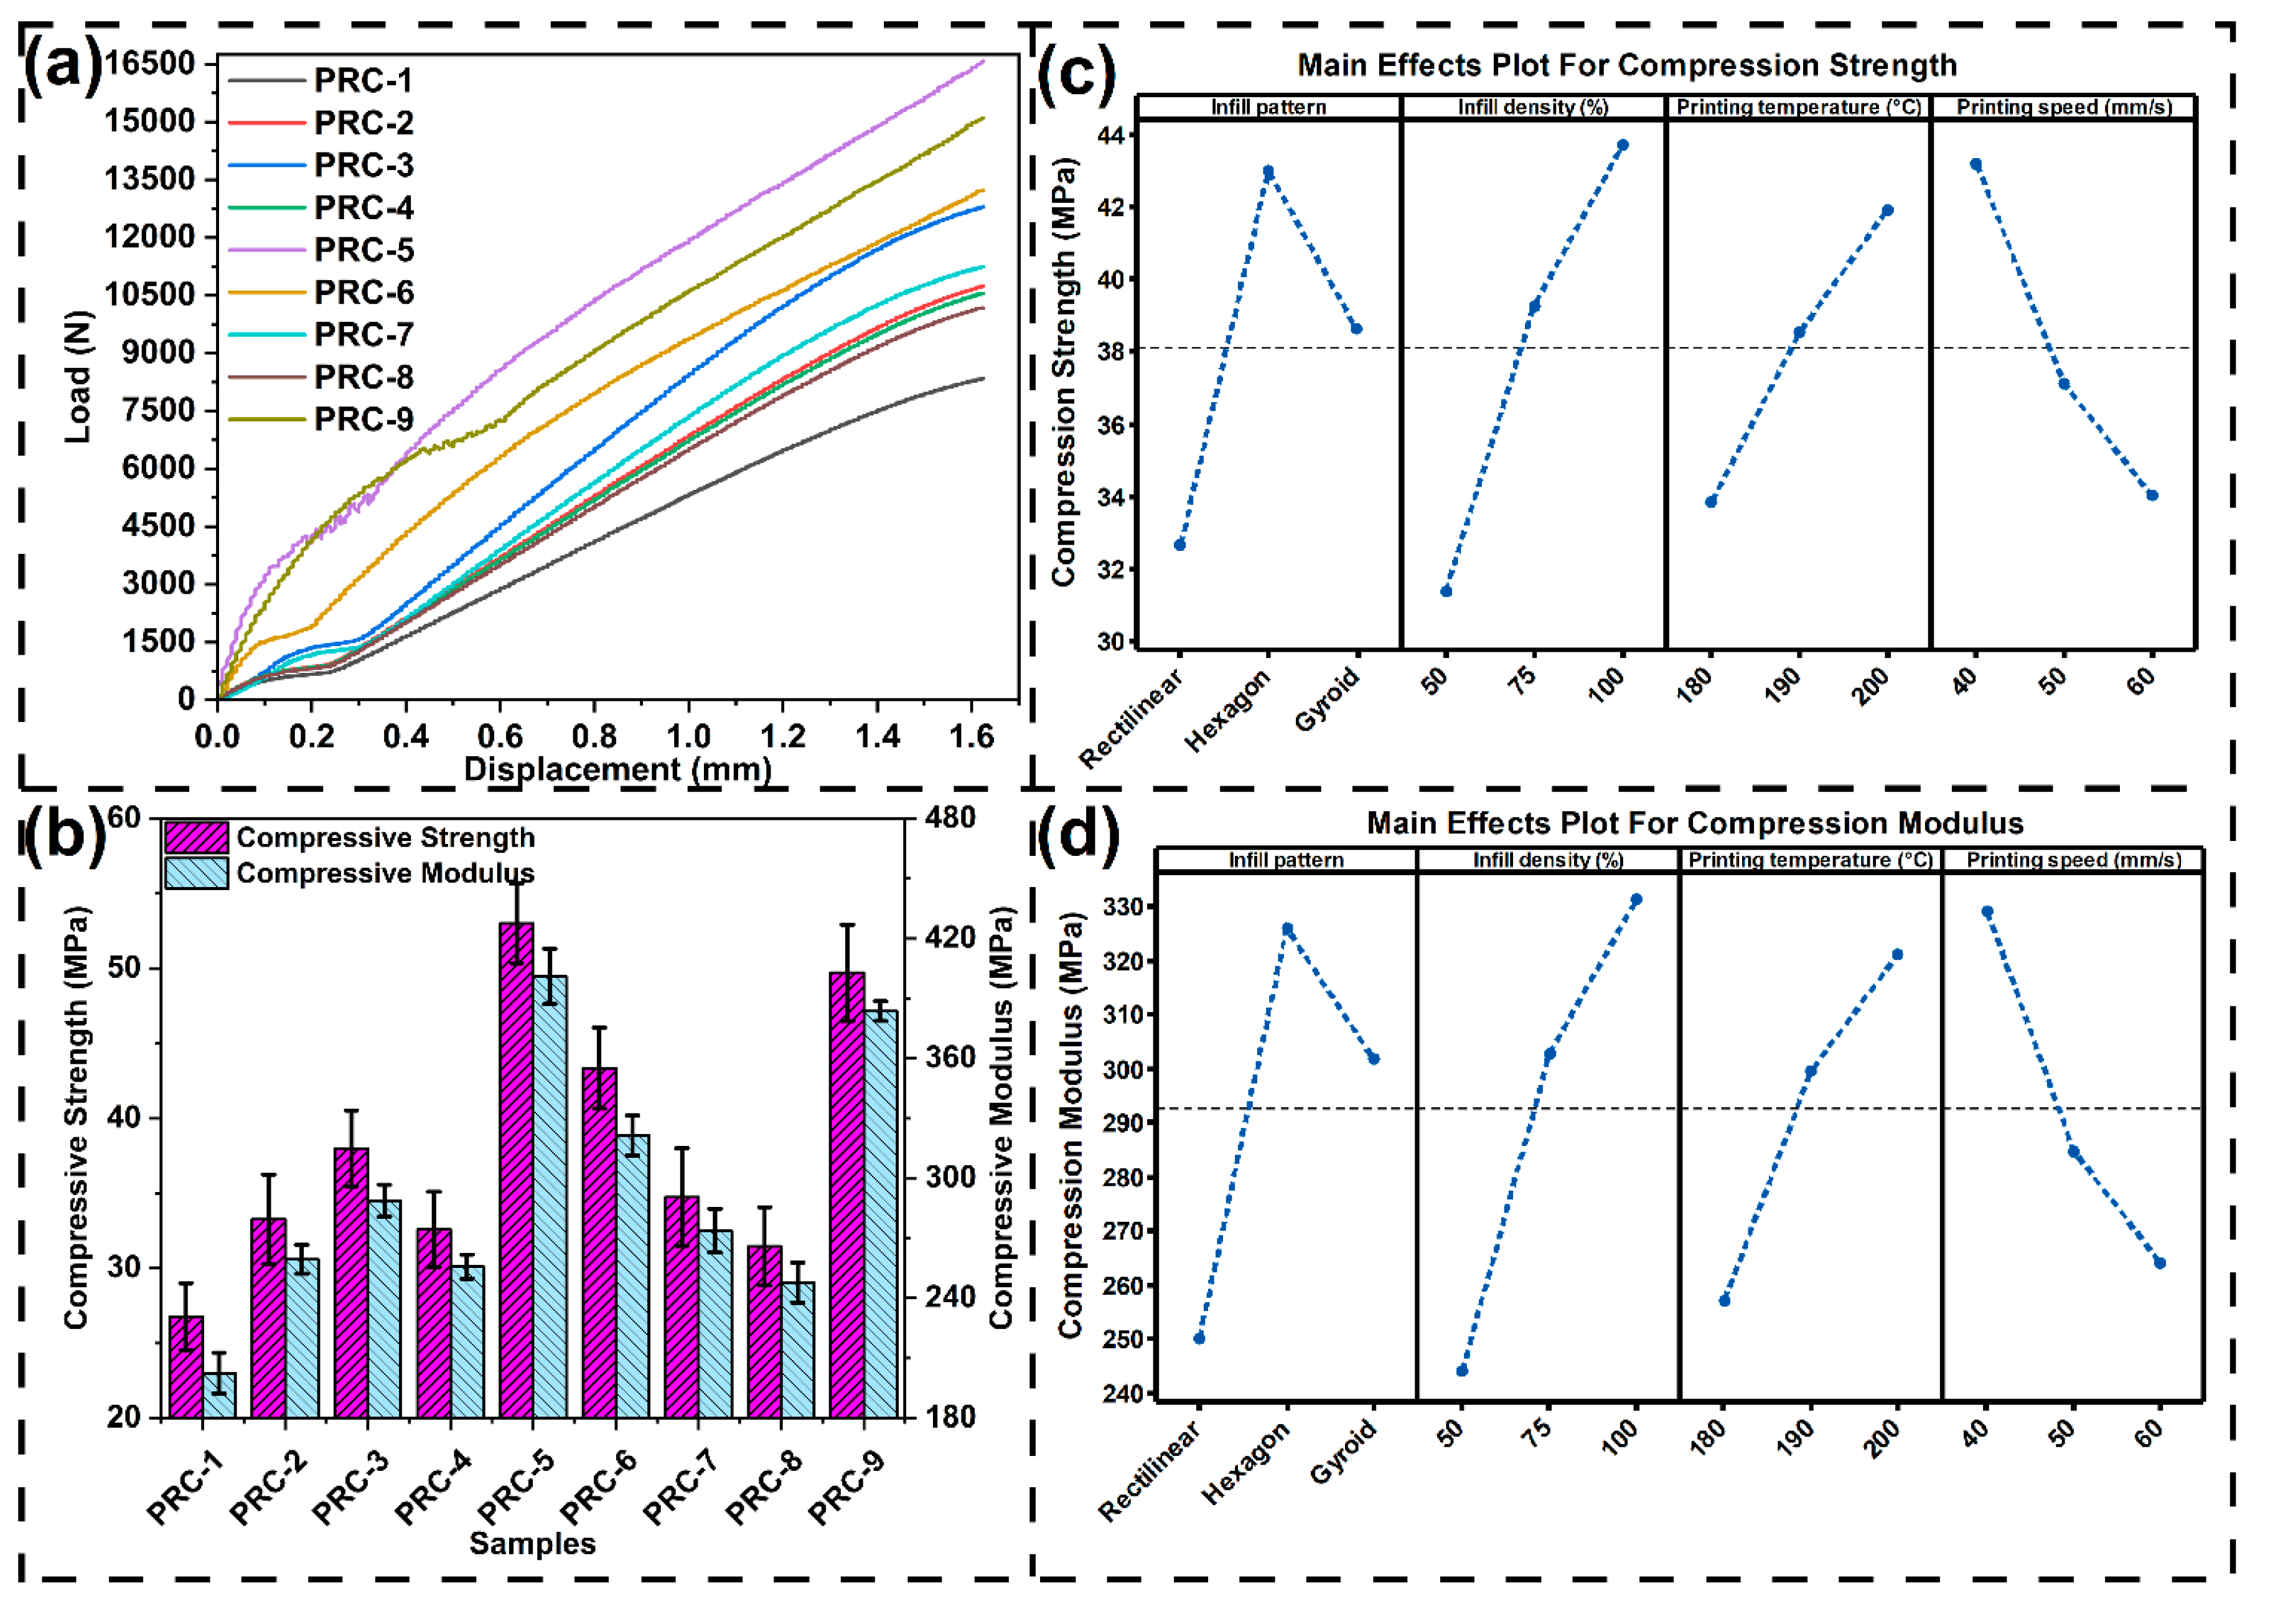
Figure 9.
(a) Variation of IFSS with difference printing conditions, (b) mean effective plot for IFSS, (c) variation of impact strength with difference printing conditions, (d) mean effective plot for impact strength, (e) variation of natural frequency with difference printing conditions, (f) mean effective plot for natural frequency.
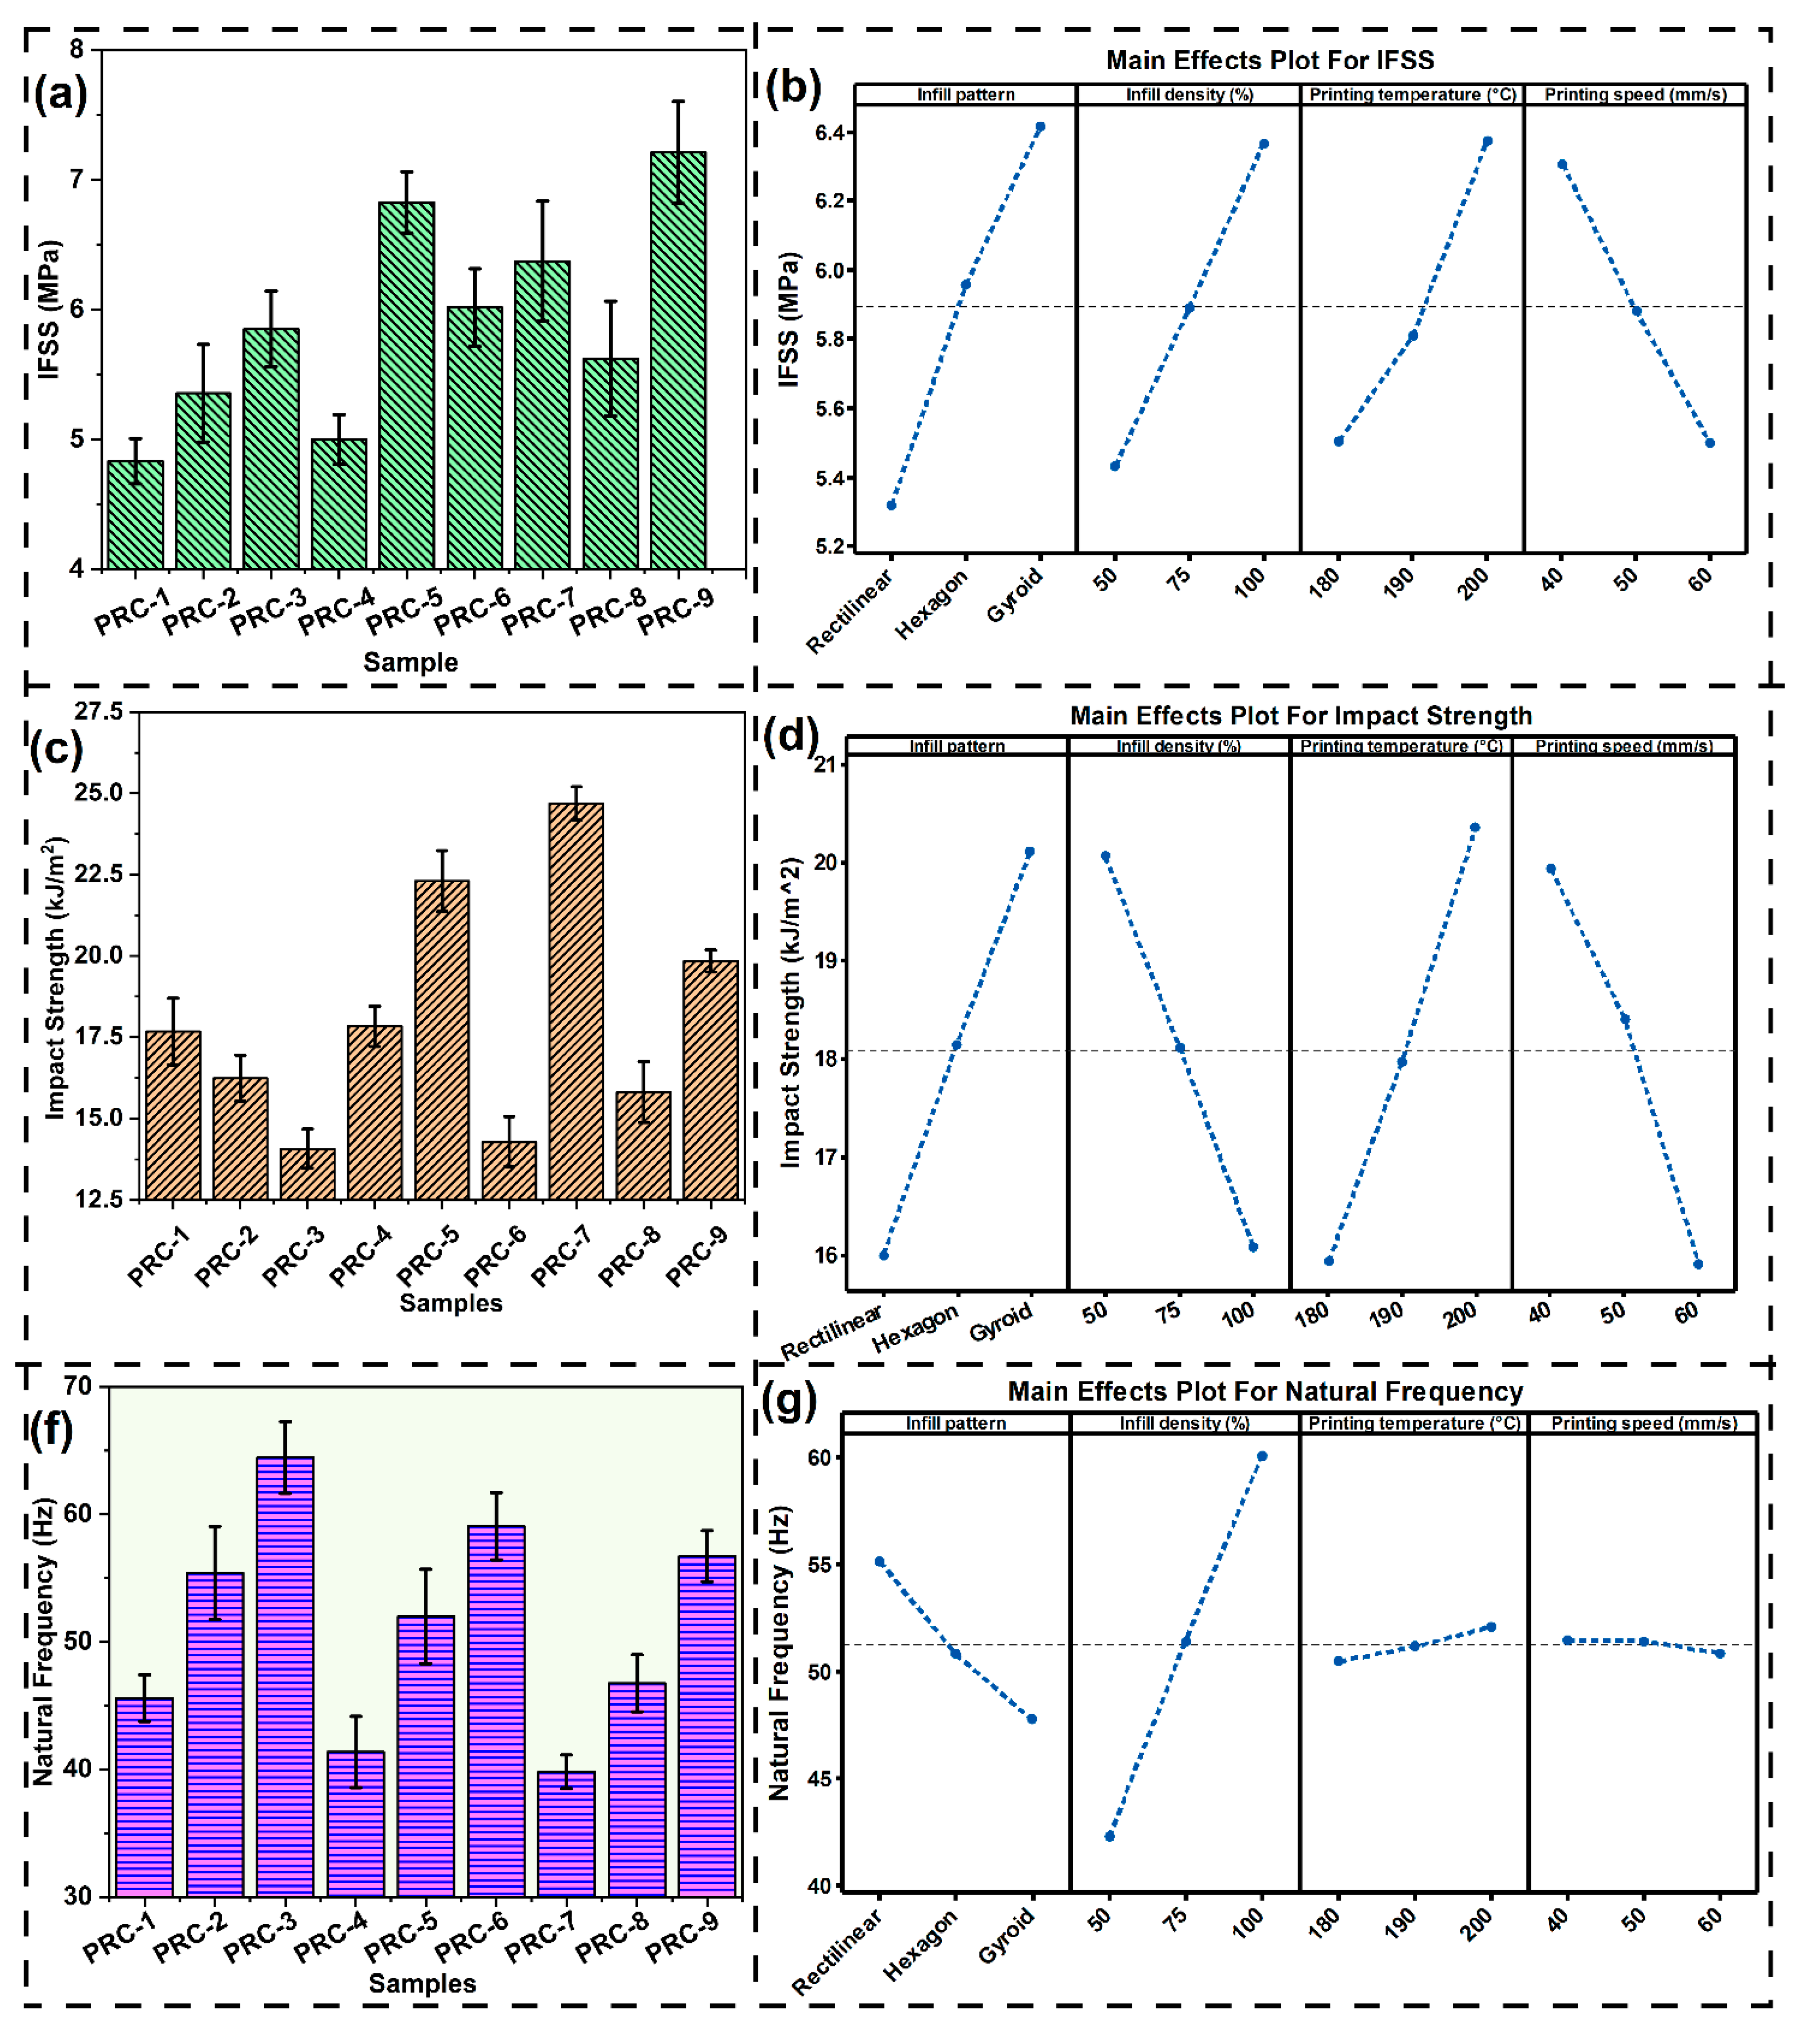
Figure 10.
Contribution of different printing parameters on different mechanical properties.

Figure 11.
(a) Perfectly bonding of 3d printed layer by wood/PLA filament, (b) fracture surface of tensile sample, (c) interlaminar shear failure in IFSS testing and, (d) failure of 3d printed sample in impact testing.
Figure 11.
(a) Perfectly bonding of 3d printed layer by wood/PLA filament, (b) fracture surface of tensile sample, (c) interlaminar shear failure in IFSS testing and, (d) failure of 3d printed sample in impact testing.
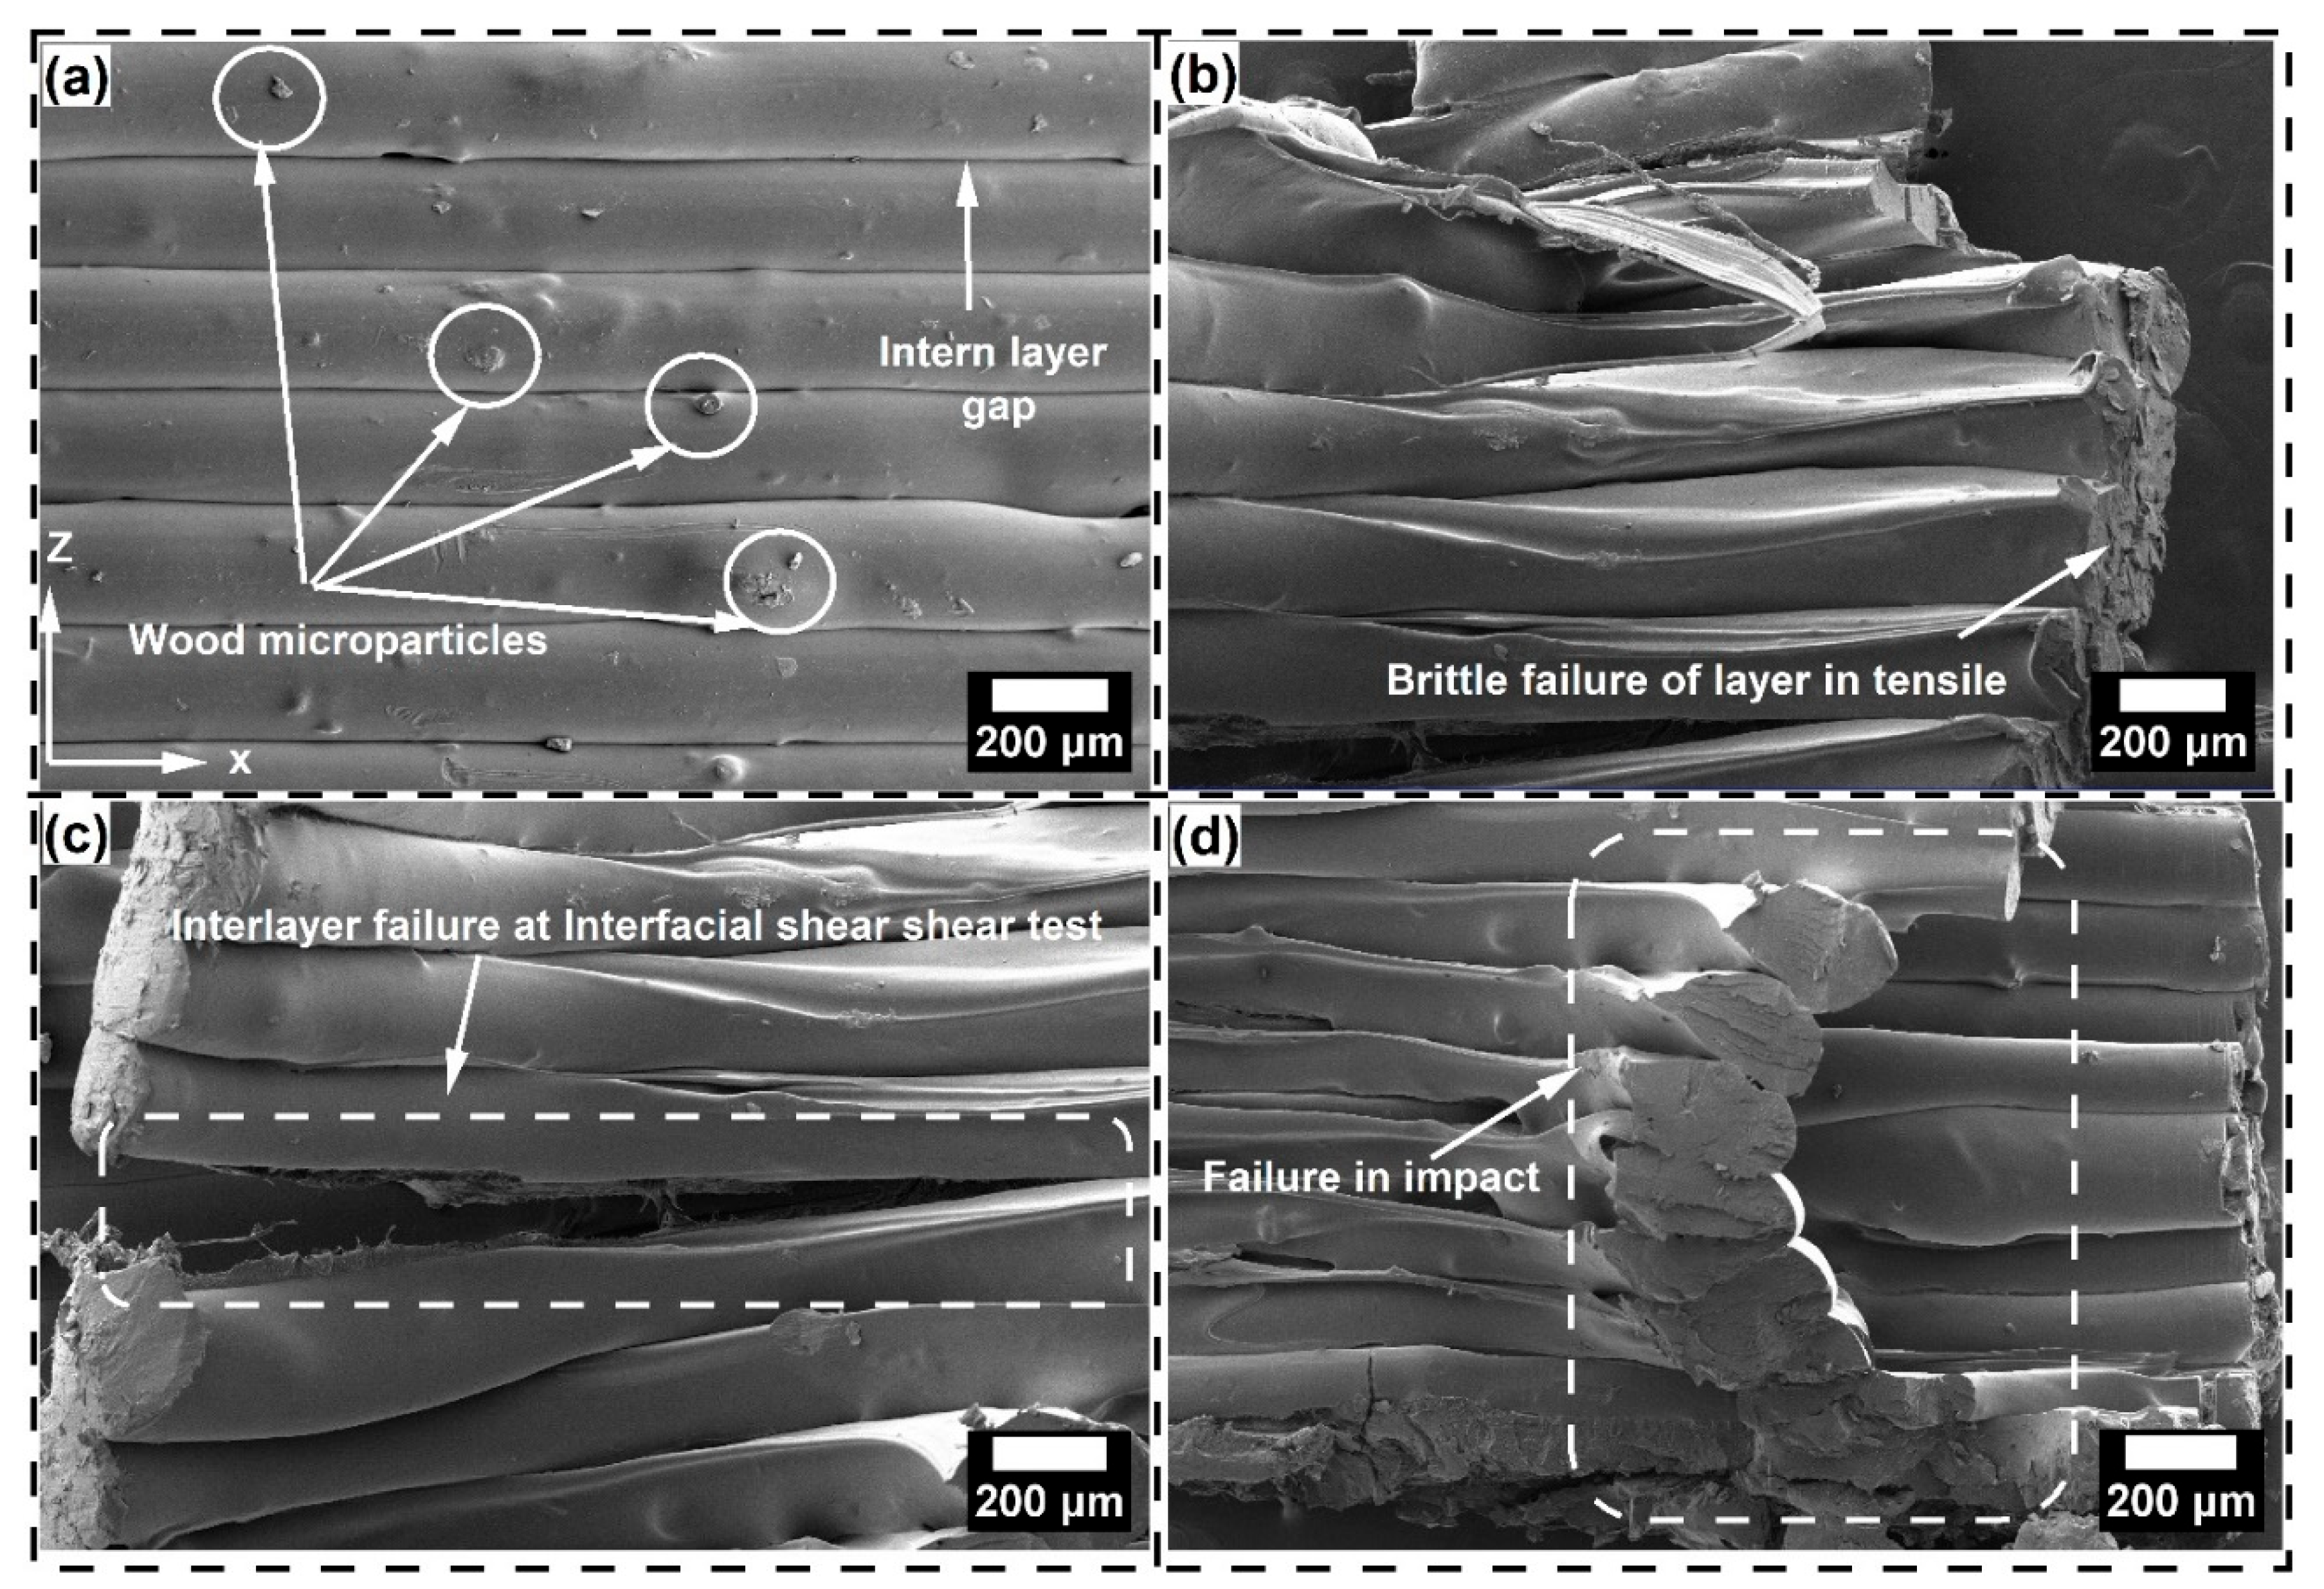
Figure 12.
Sensitivity analysis of TODIM process.
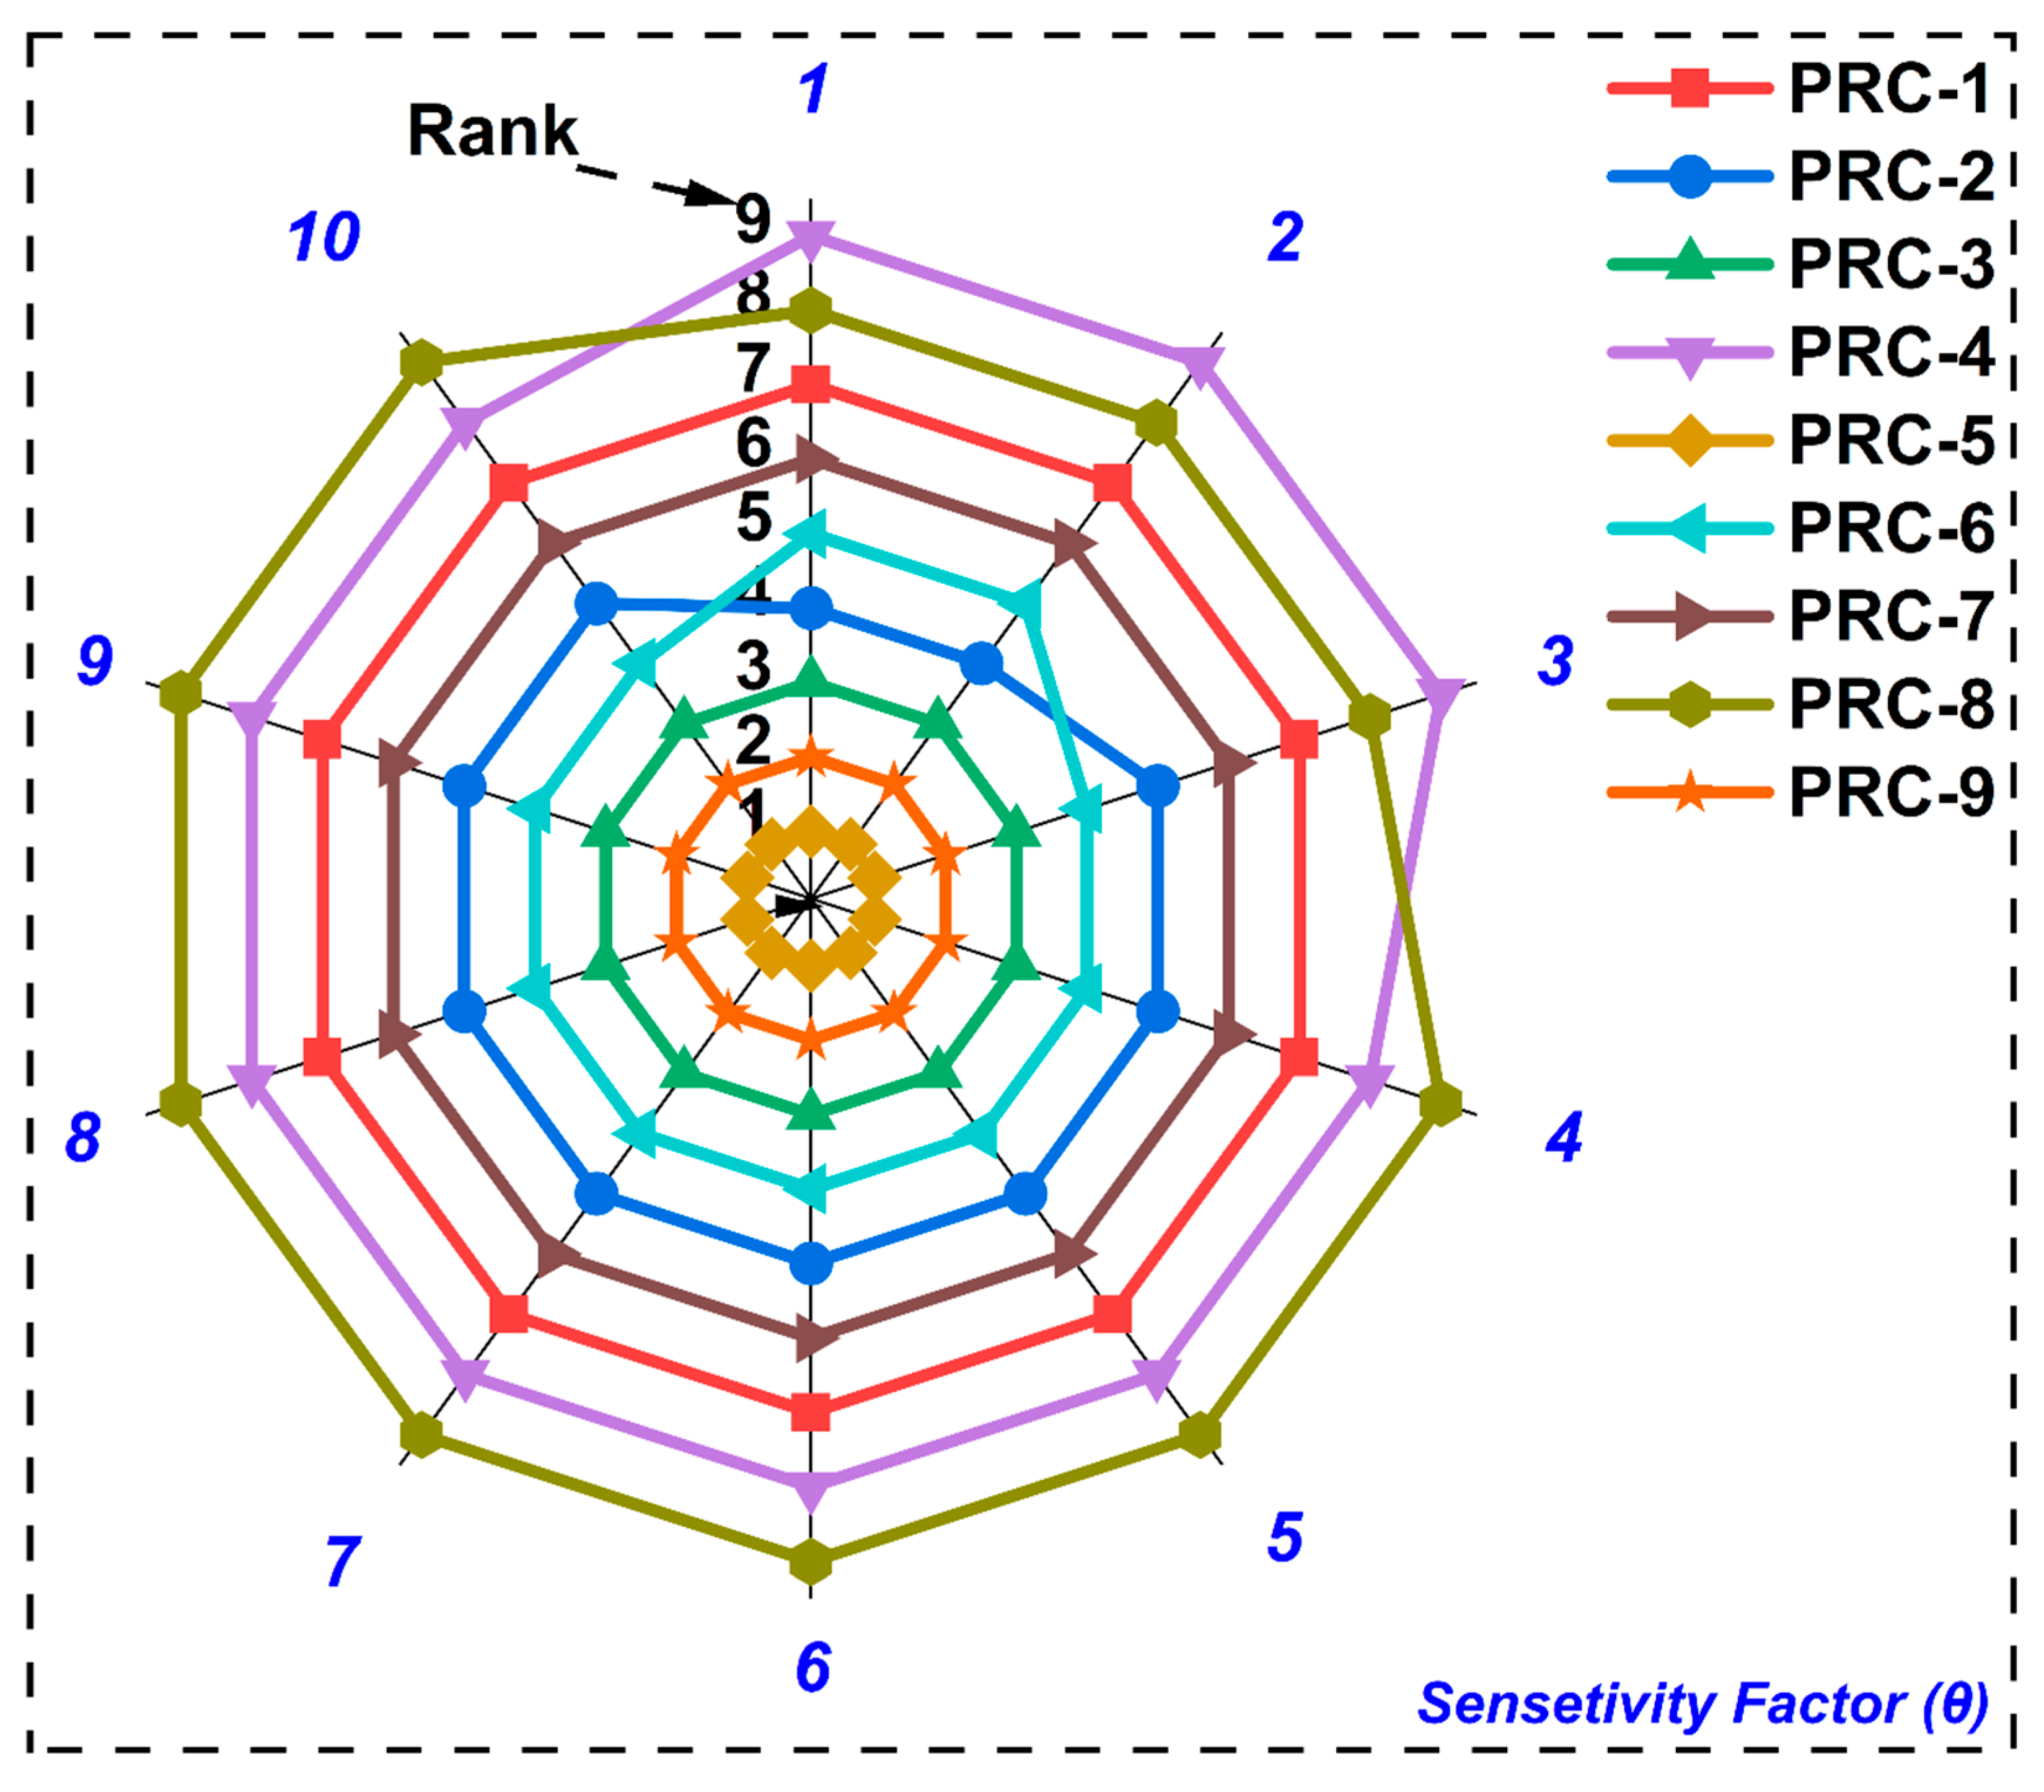
Table 4.
Mass loss properties of untreated and treated wood microparticles.
| Microparticles | Stage-I weight loss (%) | Stage-II weight loss (%) | Stage-III weight loss (%) | Stage-IV weight loss (%) | Residual mass (%) |
|---|---|---|---|---|---|
| Untreated wood | 5.19 | 1.81 | 63.77 | 34.88 | 21.96 |
| Treated wood | 1.55 | 1.14 | 21.26 | 66.50 | 25.67 |
Table 5.
Difference temperature data from DSC curve.
| Wood particle (%) |
Tg (°C) |
TCC (°C) |
Tm (°C) |
Enthalpy (J/g) |
Crystallinity (%) |
|---|---|---|---|---|---|
| 0 | 58.99 | 116.21 | 155.01 | 9.31 | 10.02 |
| 9 | 70.72 | 112.39 | 150.68 | 10.89 | 12.87 |
Table 6.
Equation of different mechanical properties from regression analysis depended on different printing parameters.
Table 6.
Equation of different mechanical properties from regression analysis depended on different printing parameters.
| Mechanical Properties | Equation | R2-value (%) |
|---|---|---|
| Tensile strength (MPa) (TS) | TS = -98.6 - 10.75 IP + 0.433 ID + 0.844 PT - 0.283 PS |
98.35 |
| Tensile modulus (GPa) (TM) | TM = -1.298 - 0.434 IP + 0.0214 ID + 0.028 PT - 0.016 PS | 99.39 |
| Elongation at break (%) (EBB) | EBB = 0.846 + 0.096 IP- 0.005 ID + 0.007 PT - 0.008 PS | 99.63 |
| Flexural strength (MPa) (FS) | FS= 42.1 - 4.21 IP + 0.347 ID + 0.135 PT - 0.556 PS | 88.25 |
| Flexural modulus (GPa) (FM) | FM = 1.96 - 0.112 IP + 0.021 ID+ 0.00189 PT - 0.012 PS |
96.01 |
| Compressive strength (MPa) (CS) | CS= -40.0 + 2.98 IP + 0.246 ID + 0.403 PT - 0.458 PS |
80.96 |
| Compressive modulus (MPa) (CM) | CM = -335 + 25.8 IP + 1.747 ID+ 3.20 PT - 3.25 PS |
82.37 |
| IFSS (MPa) | IFSS = -2.854 + 0.548 IP+ 0.018 ID + 0.043 PT - 0.040 PS |
99.47 |
| Impact strength (kJ/m2) (IS) | IS = -12.06 + 2.061 IP - 0.079 ID+ 0.222 PT- 0.202 PS |
99.04 |
| Natural Frequency (Hz) (NF) | NF= 18.03 - 3.693 IP + 0.356 ID + 0.081 PT - 0.028 PS |
99.80 |
| IP- Infill pattern, ID- Infill density, PT- Printing temperature, PS- Printing Speed | ||
Table 8.
Decision matrix.
| Criteria → | C1 | C2 | C3 | C4 | C5 | C6 | C7 | C8 | C9 | C10 |
|---|---|---|---|---|---|---|---|---|---|---|
| Condition↓ | Tensile Strength (MPa) | Tensile Modulus (GPa) | Elongation at break (%) | Flexural Strength (MPa) | Flexural Modulus (GPa) | Compressive Strength (MPa) | Compressive Modulus (MPa) | IFSS (MPa) | Impact Strength (kJ/m^2) | Natural Frequency (Hz) |
| PRC-1 | 53.45 | 3.68 | 1.708 | 54.51 | 2.65 | 26.76 | 202.33 | 4.87 | 17.67 | 45.59 |
| PRC-2 | 71.71 | 4.36 | 1.576 | 60.40 | 3.19 | 33.25 | 259.33 | 5.21 | 16.23 | 55.41 |
| PRC-3 | 86.33 | 4.98 | 1.44 | 63.44 | 3.38 | 37.98 | 288.67 | 5.87 | 14.07 | 64.45 |
| PRC-4 | 42.01 | 3.14 | 1.684 | 47.95 | 2.43 | 32.58 | 255.67 | 5.01 | 17.83 | 41.37 |
| PRC-5 | 68.80 | 4.27 | 1.814 | 70.12 | 3.57 | 53.00 | 401.00 | 6.84 | 22.30 | 52.00 |
| PRC-6 | 57.97 | 4.04 | 1.468 | 68.10 | 3.49 | 43.34 | 321.33 | 6.02 | 14.29 | 59.08 |
| PRC-7 | 45.91 | 3.18 | 1.975 | 42.40 | 2.31 | 34.73 | 273.67 | 6.41 | 24.69 | 39.81 |
| PRC-8 | 39.00 | 3.06 | 1.602 | 45.28 | 2.84 | 31.44 | 247.67 | 5.62 | 15.81 | 46.76 |
| PRC-9 | 62.07 | 4.18 | 1.72 | 65.39 | 3.50 | 49.70 | 383.67 | 7.21 | 19.84 | 56.72 |
Table 9.
Weightage of different criteria.
| Criteria → | C1 | C2 | C3 | C4 | C5 | C6 | C7 | C8 | C9 | C10 |
|---|---|---|---|---|---|---|---|---|---|---|
| Weightage→ | 0.195 | 0.082 | 0.029 | 0.094 | 0.076 | 0.148 | 0.137 | 0.054 | 0.109 | 0.077 |
Table 10.
Comparative study of present study with previously reported bio-composites.
| Sl. No. | Matrix | Reinforcement | Development Process |
Tensile Strength (MPa) |
Flexural Strength (MPa) |
Compressive Strength (MPa) |
Impact Strength | Reference |
|---|---|---|---|---|---|---|---|---|
| 1. | PLA | Wood | 3D printing | 68.80 | 70.12 | 53.00 | 22.30 kJ/m2 | Present study |
| 2. | PLA | Wood | 3D printing | 37.5 | -- | -- | -- | [81] |
| 3. | PLA | Wood | Injection moulding | 56.87 | -- | -- | -- | [81] |
| 4. | PLA | Almond shell | 3D printing | -- | -- | 28.748 | -- | [82] |
| 5. | PLA | Banana fiber | 3D printing | 16 | 29.2 | -- | -- | [83] |
| 6. | PLA | Wood | 3D printing | 65.80±1.39 | -- | -- | -- | [84] |
| 7. | PLA | Oil Palm | 3D Printing | 38.49 ± 2.63 | -- | -- | -- | [85] |
| 8. | PLA | Jute/hemp | Compression moulding | 69 | 145.40 | -- | 6.37 J | [86] |
Disclaimer/Publisher’s Note: The statements, opinions and data contained in all publications are solely those of the individual author(s) and contributor(s) and not of MDPI and/or the editor(s). MDPI and/or the editor(s) disclaim responsibility for any injury to people or property resulting from any ideas, methods, instructions or products referred to in the content. |
© 2025 by the authors. Licensee MDPI, Basel, Switzerland. This article is an open access article distributed under the terms and conditions of the Creative Commons Attribution (CC BY) license (http://creativecommons.org/licenses/by/4.0/).
Copyright: This open access article is published under a Creative Commons CC BY 4.0 license, which permit the free download, distribution, and reuse, provided that the author and preprint are cited in any reuse.


