Preprint
Article

This version is not peer-reviewed.

Sensitivity Analysis in Simple Cycles for Hydrogen Liquefaction

A peer-reviewed article of this preprint also exists.

Submitted:

21 August 2025

Posted:

22 August 2025

You are already at the latest version

Abstract

Due to the increase in global energy demand, as well as environmental concerns, hydrogen presents itself as a promising energy source. Nevertheless, a hydrogen energy chain depends on its storage and transportation. Liquid hydrogen is more suited for long-distance transportation and is a lower volume-consuming form. Hydrogen liquefaction, however, is an energy-intensive process, and many studies have been published proposing more efficient liquefaction cycles. These studies focus only on the optimum cycle’s operation conditions and do not assess fully the characteristics of the cycles. In this study, simple hydrogen liquefaction cycles were assessed, regarding the influence of the cycle’s high pressure on the energy efficiency, exergy destruction, and its distribution along the equipment. Among the main results, Claude and Precooled Linde-Hampson cycles presented a specific energy consumption (SEC) of 16.47 kWh/kgLH and 45.07 kWh/kgLH, respectively.

Keywords: 
;  ;  ;  ;  ;  

1. Introduction

The relentless populational growth, combined with the improvements in life expectancy, promotes, worldwide range, an increasingly greater energy demand. The energy system, as it is currently, is fossil fuel-based, with about 80% of the world’s primary energy supply covered by this source [1]. Fossil fuels, however, are not a renewable source, and geologists and petroleum engineers estimate that over 40% of the available petroleum reserves have already been used [2]. In this scenario, finding new ways to produce energy is a critical issue. Moreover, the increase in energy demand is not the only challenge. As the evidence of the effects of global warming and climate change is overwhelming, the quality of energy as a clean, sustainable, and renewable source will be a priority as well.
Amidst the diverse alternatives that arise for new forms of clean energy, hydrogen stands out, since it has some advantages over other fuels. Some of the advantages can be listed: (a) it is simpler chemically than other fuels; (b) hydrogen combustion in engines or its uses in fuel cells does not release CO2 as a product, only water; (c) feedstock for hydrogen production is plentiful; (d) it can be produced with zero greenhouse gas (GHG) emissions with water electrolysis; (e) in the liquid form it has high lower heating value (LHV) of 120 MJ/kg, about 2.5 greater than gasoline; and (f) it can be used as chemical storage of electrical energy [1,3].
Due to the investments in technological advances, renewable and clean power plants like hydroelectric, wind power, and solar power plants are increasingly economically competitive [4]. Nonetheless, some obstacles remain in the renewable electrical energy application. Firstly, some of the natural sources, like wind or sunlight, are not available continuously; thus, when lacking of means for clean energy production, the energy still has to be obtained from nonrenewable resources [4]. To produce and store energy as much as possible during a certain period and use the storage when in need would be a solution, but it faces the impossibility of energy storage in electrical form. Despite physical and chemical ways of energy storage being available, electrical generating plants usually do not have a storage system and are submitted to a generation matching the energy demand [5].
In this scenario, hydrogen as an energy carrier, produced by the electrolysis of water, has great prospects. Despite the initial gaseous form of the hydrogen produced, adding a hydrogen liquefaction after the electrolysis cycle would guarantee a low volume-consuming way to store energy in a high-energy content and low-weight form, considering the aforementioned liquid hydrogen LHV [6]. The liquefaction of the hydrogen also ensures a more cost-effective way to transport hydrogen, since pipelines are not efficient in long-distance transportation [7].
Nevertheless, liquid hydrogen has some economic drawbacks regarding the boil-off in storage and transportation, and liquefaction energy cost [8]. The transportation and storage of hydrogen in liquid form suffer from the constant heat absorption from the environment, causing the hydrogen to evaporate, a phenomenon called “boil off”. Compared with liquefied natural gás (LNG), hydrogen has an 18 times lower heat of vaporization [9], thus requiring special design vessels to prevent the boil-off, which can consume up to 40% of the hydrogen combustion energy [10]. Recent and active studies have approached methods to mitigate hydrogen boil-off losses, and a revision of the three main methods employed, hydrogen compression, zero boil-off, and hydrogen reliquefaction, is made by Morales-Ospino, Celzard, and Fierro (2023) [9]. Not only, hydrogen liquefaction is also a highly cost-intensive process, given that hydrogen is the second hardest gas to liquefy, with a liquefaction temperature of about 20 K at ambient pressure, and only having a greater liquefaction temperature than helium, whose boiling point is 4 K.
Furthermore, hydrogen liquefaction has another specificity regarding the hydrogen molecular property, which is the occurrence of two isomeric forms: ortho-hydrogen and para-hydrogen [8]. The isomers differ by the nuclear spin: while ortho-hydrogen presents both protons with the same direction spins, implying a higher energy state, in the para form, hydrogen has protons with opposite spins and has a lower energy state [11]. At ambient temperature, hydrogen is a mixture composed of about 75% ortho-hydrogen and 25% para-hydrogen (also known as normal hydrogen), but with a temperature decrease, the equilibrium shifts toward an increase in the para-hydrogen content. Since the ortho-para reaction heat is about 0.388 kcal/mol, overcoming the hydrogen evaporation heat of approximately 0.213 kcal/mol, the ortho-para conversion must be carried out in the cooling/liquefaction process; otherwise, the reaction heat of the posterior conversion would be enough to evaporate all the liquefied gas [12]. The liquefiers, therefore, have ortho-para conversion systems, with appropriate catalysts, usually packaged inside the heat exchangers [8], to favor the increase of para-hydrogen content and reduce storage losses [13].
Historically, hydrogen liquefaction is a relatively new process, since it was first achieved only in 1898 by J. Dewar, overruling the previous “permanent gas” status of hydrogen [14,15]. Proven that hydrogen liquefaction was a possibility, the race for creating liquefaction cycles started. The Linde-Hampson cycle (with a precooling section), developed in 1895, and the Claude (or Simple Claude) cycle, developed in 1902, were the first systems able to liquefy hydrogen [16], and since then, other cycles or variations, like Kapitza, Joule-Bryton, dual pressure Claude, pre-cooled Claude, pre-cooled mixed refrigerant cycles, among others, were designed to achieve a more efficient process. Despite those efforts, all existing and operating liquefaction plants still use versions of the pre-cooled Claude cycle and have not presented major improvements in the last 50 years [7,8].
Usually, the specific energy consumption (SEC) is the main parameter to compare cycle efficiency. While more classical cycles, such as Claude and Precooled Linde-Hampson, present an SEC of 27.8 kWh/kgLH and 72.2 kWh/kgLH [17], respectively, actual operating plants like Paxair’s, in the United States, and Linde’s, in Germany, already achieved SEC in the range of 12 to 15 kWh/kgLH [12,16], using a modification of the pre-cooled Claude cycle. Additionally, plenty of research has been published with new conceptual plants with more promising SEC. The WE-NET, a Japanese project that was proposed in 1993 to develop and establish the technology for a global hydrogen-based energy network [18], indicates three conceptual liquefaction cycles, based on Claude, Helium Brayton, and Neon Brayton cycles that would be capable of reaching an SEC of 8.5 kWh / kg LH [19]. Further, Quack (2002)[20] proposed a cycle with two refrigeration systems: a propane refrigeration system, used for inter-compression cooling, and a Helium-Neon cycle for cryogenic cooling. An SEC of 7.0 kWh/kgLH was obtained for large-scale hydrogen liquefaction with the consideration of hydrogen feed and storage pressure of 1 bar, and about 5.0 kWh / kg LH for hydrogen feed of 20 bar and storage at 3 bar [20].
Furthermore, Valenti and Macchi (2008) [21] proposed a liquefaction system with a Helium recuperative Joule-Brayton cycle and achieved an SEC of 5.04 kWh / kg LH , and found out that the majority of the exergy losses occur in the helium compression system, followed by the heat exchangers. The lower SEC for hydrogen liquefaction, 4.41 kWh / kg LH , is reported by Sadaghiani and Mehrpooya (2017), who developed a system combining two refrigeration systems. The first refrigeration cycle with a mixed refrigerant composed of methane, ethane, n-butane, hydrogen, nitrogen, propane, n-pentane, R-14, and ethylene, reduces the hydrogen temperature to -193 °C. The second refrigeration, with hydrogen, neon, and helium, achieved a hydrogen refrigeration to -253 °C [22].
It is visible from the aforementioned studies that, compared with the thermodynamical ideal SEC for the hydrogen liquefaction of 3.92 kWh / kg LH [23,24], the conceptual plants already present a performance close to the ideal limit, and, therefore, there is not much more expectation for the development of concepts on new cycles [12]. However, advances in technology for achieving the practical application of the new concepts are still needed. More about hydrogen liquefaction can be found in the review articles of Aasadnia and Mehrpooya (2018) and Krasae-in et al. (2010) [12,16].
Despite the rapid improvement in the conceptual plants, a significant amount of the studies focused on the development of new and conceptual designs and the determination of optimal conditions for achieving better efficiency to the detriment of a more complete analysis of real cycles performance in a wide range of operations conditions, which could provide a better understanding of these systems at a fundamental level. Some examples of analysis beyond the SEC value would be exergy destruction, exergy destruction distribution, the temperature profile in the heat exchangers, the influence of ortho-para conversion, and their behavior under different operating conditions. Yang et al. (2023) [25], for example, compared Claude and Brayton cycles, which are the basis for most of the operating hydrogen liquefaction plants, using sensitivity analysis to optimize operating conditions and assessed both cycles regarding their SEC, refrigerant use, and exergy efficiency. The authors reported an SEC of 5.62 kWh/kgLH and 5.87 kWh/kgLH for the Claude and Brayton cycles, respectively. With regard to exergy efficiency, in the study, Claude was also more effective, with a 6.6% lower exergy destruction.
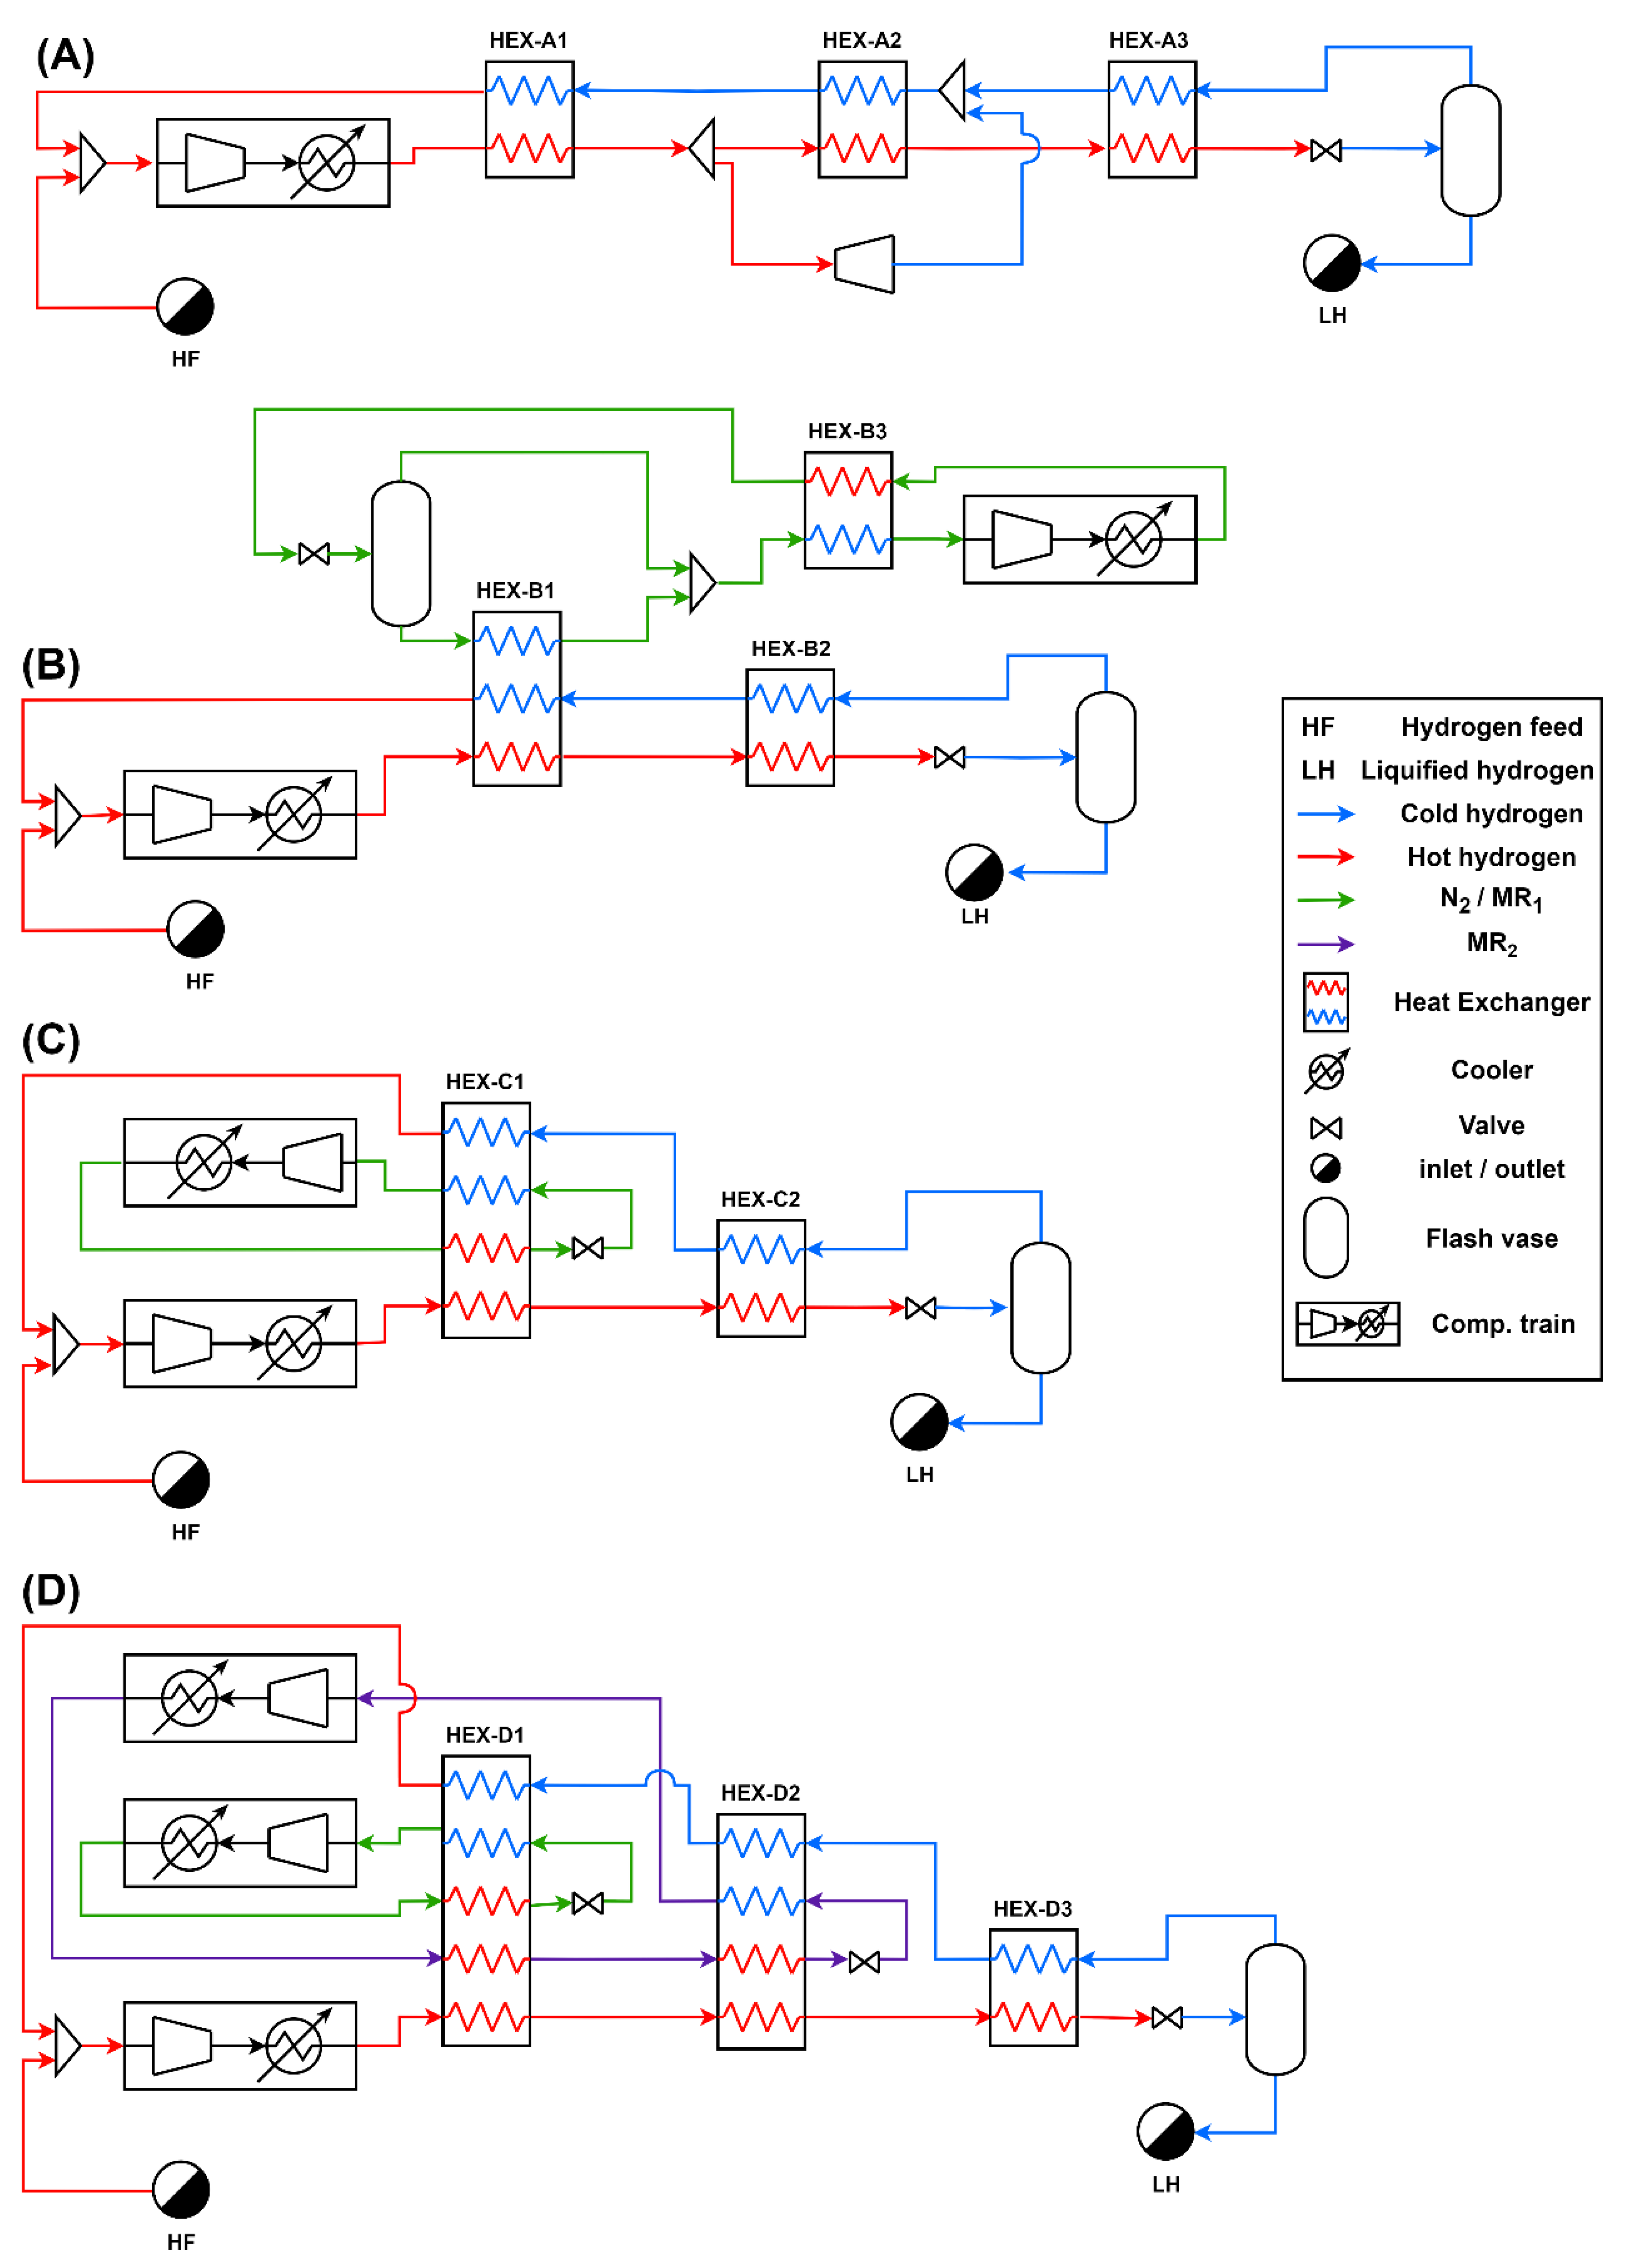
On the same path as the aforementioned study, in the present study, an analysis of other hydrogen liquefaction cycles, like Linde-Hampson, Single Mixed, and Dual Mixed refrigerants, is proposed.

2. Materials and Methods

To compare the cycles’ efficiency and their behavior under different operating conditions, all four cycles were modeled in Aspen Hysys, as described in section 2.1. The method for comparing the efficiency and analyzing the cycles from an energy and exergy point of view is based on the method previously proposed by Yang et al. (2023) [25], and reported in section 2.2.

2.1. Cycles Description and Specification

Aiming to verify how the pressure and the ortho-para conversion influence on hydrogen liquefaction cycle, four cycles were analyzed in the study: Claude Cycle, Precooled Linde-Hampson (PLH) system, single-mixed refrigerant (SMR) precooling system, and dual-mixed refrigerant (DMR) precooling system. The construction of the simulation for each liquefaction cycle is presented in Figure 1.
In the Claude cycle, as can be seen in Figure 1A, the hydrogen feed goes through the compressor train, where the pressure is elevated, and then is cooled in a series of three heat exchangers. After the first cooling stage (HEX-A1), a fraction of the hydrogen, usually between 60% and 80% [26], is sent to an expander, where the pressure reduction also reduces the gas temperature. The remaining fraction of hydrogen that was not diverted passes through HEX-A2 and HEX-A3, reaching a temperature at which the isenthalpic expansion of the gas in a Joule-Thompson valve causes a partial liquefaction. All liquefied hydrogen is removed, while the saturated gas is recycled and used as the refrigerant in the heat exchangers, from HEX-A3 to HEX-A1. Moreover, after HEX-A3, the diverted expanded hydrogen is mixed with the cold recycled hydrogen. After the recuperative cooling, the hydrogen recycled is mixed with a make-up stream and returns to the compression train.
The Linde-Hampson liquefaction is one of the simplest gas liquefaction systems, but it cannot be used to liquefy hydrogen since its maximum inversion temperature is lower than ambient temperature, i.e., if not precooled, hydrogen will not be cooled on throttling [12]. The Claude cycle, which uses only hydrogen as the working fluid, makes use of the expander to produce low temperatures and achieve a cooling effect in the isenthalpic expansion. Other cycles applied to hydrogen liquefaction, however, in the absence of expansion in an expander stage, need a precooling section. The precooled Linde Hampson, shown in Figure 1B, for example, uses liquid nitrogen as a refrigerant in the first heat exchanger (HEX-B1), and the liquid nitrogen, in turn, is produced in a simple Linde Hampson system. The precooled hydrogen, at a temperature near the nitrogen saturation temperature, passes through a last heat exchanger (HEX-B2), where it is cooled by the non-liquefied fraction of hydrogen, in the same way as the Claude cycle.
The application of nitrogen in the PLH system, however, presents a clear exergy disadvantage, since a pure component always maintains a constant temperature in its evaporation, which causes the distancing of the refrigerant and hydrogen temperature profiles in the heat exchanger, leading to exergy losses. Using mixed refrigerants, on the other hand, allows the refrigerant to undergo a temperature rise (temperature glide) between bubble and dew point, thus allowing a better fitting of the hot and cold composite curves, and a more reversible process, with less exergy losses. In that sense, in the SMR and DMR precooled cycles, mixed refrigerants are used instead of pure nitrogen. In the SMR cycle (Figure 1C), only one mixed refrigerant is used.
The refrigerant is cooled in a first heat exchanger (HEX-C1) and then expanded through a JT valve, where its temperature is reduced, and then returns to the same heat exchanger, now acting like the cold-end (along with the recycled hydrogen) to reduce hydrogen temperature. The DMR process (Figure 1D) is analogous to the SMR but with two refrigerants. The internal refrigerant cycle, also called warm mixed refrigerant (WMR) is used to reduce both, hydrogen and the external refrigerant, to an intermediate temperature in a first heat exchanger (HEX-D1), and the external refrigeration cycle, the cold mixed refrigerant (CMR), is used to cool hydrogen to the final pre-cooling temperature in a second heat exchanger (HEX-D2). Finally, as in the Claude cycle, hydrogen is then cooled to the isenthalpic expansion temperature with the non-liquefied fraction of the gas.
For the analysis of those cycles described, the Aspen HYSYS V14 interface was used to perform the simulations. In the software, hydrogen is defined as normal hydrogen, and two thermodynamic packages were used. For hydrogen, the “Hydrogen” thermodynamic package was chosen. In this package, ortho and para-hydrogen properties are accounted for, even selecting only normal-hydrogen in the component list. For the refrigerants, Peng-Robinson was selected.
While using the “Hydrogen” package, the hydrogen composition is always supposed to reach equilibrium accordingly to the stream temperature, i.e., the simulation considers ortho-para conversion (OPC) reaction heat for each equipment where hydrogen suffers a change in its temperature. The hot hydrogen, which passes through the series of heat exchangers (where a catalyst is used to enhance the conversion), has not only sensible heat being removed, but also the reaction heat from ortho to para conversion. Using this package, however, the OPC is accounted for indistinguishably in every piece of equipment. Because of this, the consideration of the catalyst being used in the cold hydrogen side of the multi-stream heat exchangers must be inherently made, as the endothermic reaction of para to ortho-hydrogen is also being considered as hydrogen temperature increases, and the conversion reaction is slow in the absence of a catalyst other than ortho-hydrogen itself [27]. Furthermore, as the valve inlet only reaches temperatures from 30-40 K, when the equilibrium fraction of ortho-hydrogen still corresponds to 10-20%, one last conversion stage is usually employed in liquefaction plants, where the p-hydrogen fraction reaches 99,8% at the saturation temperature at 1 bar. However, due to the “Hydrogen” package, in the JT valve, OPC is already accounted for, making the modeling of one last OPC stage unnecessary. Notwithstanding the OPC being considered in the compression train, the change in the equilibrium in high temperatures is not significant, and the reaction, which would not occur in real plants due to the lack of catalyst material [17], should present a minor influence on the results.
To perform the simulations, some assumptions were made to reduce the degree of freedom of the system until the pressure is the only unknown parameter in the cycle. It is important to highlight that the considerations made and the value of the parameters were arbitrarily chosen and can be further optimized if finding the optimal efficiency of the cycle is the objective. For all cycles, hydrogen feed conditions and design specifications are shown in Table 1.
Moreover, additional specifications are required in the cycles according to their design. The high and low pressures for the refrigerant, the refrigerant composition, and the number of compression stages for the refrigerant in each cycle are summarized in Table 2. The number of compressors in every compression train was defined to maintain the pressure ratio in every compressor within the optimal range of 2 and 5 [29].
Pursuing the goal of reducing the system’s degrees of freedom, additional considerations are taken. To achieve these conditions, “adjust” and “set” blocks were used. These blocks use iterative methods to converge the simulation, respecting the aforementioned conditions. These other specifications, and the respective tolerances adopted, are:
  • In the Claude cycle: split fraction of 65% for the expansion in the expander;
  • In the Precooled Linde-Hampson cycle: the fraction of liquefied hydrogen after the isenthalpic expansion is adjusted so the minimum temperature approach (MITA) in HEX-B1 is 2.0 K ( ± 0.1 K);
  • In the precooled SMR cycle: the fraction of liquefied hydrogen after the isenthalpic expansion is adjusted so the MITA in HEX-C2 is 2.0 K ( ± 0.1 K); refrigerant mass flow rate is adjusted so in HEX-C1 cold hydrogen outlet approach 293.0 K and cold MR outlet approach 296.0 K (tolerance of the summed error of both streams ± 2.0 K);
  • In the precooled DMR cycle: Equal WMR and CMR mass flow rates; the CMR flow rate is adjusted so HEX-D1 and HEX-D2 approach a MITA of 2 K (tolerance of the summed error of both MITA ± 0.2 K); HEX-D1 CMR outlet temperature is 2 K above (set) WMR cold inlet in the same HEX; the fraction of liquefied hydrogen after isenthalpic expansion is adjusted so hot hydrogen outlet temperature in HEX-C2 approaches 65.0 K ( ± 0.1 K);
It is worth highlighting that neither the composition of the mixed refrigerants for the pre-cooled cycles, shown in Table 2, nor the specifications adopted were optimized, but were arbitrarily chosen. This paves the way for future optimization studies that take these variables as decision variables in order to find the best SEC possible for each cycle.

2.2. Energy and Exergy Analysis

Aiming to compare the cycles’ energetic performance, three indicators were evaluated: the specific energy consumption (SEC), the figure of merit (FOM), and the coefficient of performance (COP).
The specific energy consumption is defined, as shown in Eq. (1), as being the net power consumption ( W ˙ ) in the cycle per mass flow rate of liquefied hydrogen ( m ˙ L H ). The net power consumption can be defined as presented in Eq. (2), in which W ˙ c o m p stands for the power consumed in the compressors and W ˙ e x p the power produced in the expanders.
S E C = W ˙ m ˙ L H
W ˙ = W ˙ c o m p W ˙ e x p
Apart from the SEC, another form of analyzing the liquefaction energy consumption is in terms of a fraction of the fuel heat (FFH). For the liquid hydrogen, the FFH can be defined as shown in Eq. (3).
F F H = S E C L H V = S E C 120   M J / kg LH
The FOM parameter assesses the approximation of the process of an ideal system and can be defined as the ratio of the ideal work theoretically required ( W ˙ i ) by the actual work, as shown in Eq. (4).
F O M = W ˙ i W ˙
In an ideal, reversible system, the amount of work for the liquefaction can be defined as presented by Eq. (5).
W ˙ i = m ˙ H L h H F h L H T 0 s H F s L H
in which T 0 is the dead state temperature (298.15 K), and h L H , h H F , s L H and s H F are the specific enthalpy and entropy of the liquefied hydrogen outlet and the hydrogen feed in the cycle, respectively.
Lastly, the COP, in turn, measures the ratio between the cooling needed for liquefaction and the net amount of work, as defined in Eq. (6).
C O P = m ˙ L H h H F h L H W ˙
Moreover, for the exergy analysis, aiming to verify the exergy destruction distribution along each piece of equipment, i.e., the equipment contribution to the irreversibility, Table 3 presents the exergy balance equation for each piece of equipment in the simulated systems. The exergy from each stream, in turn, can be obtained directly from the simulation. In Table 3, I ˙ stands for the irreversibility rate, or exergy destruction rate, E ˙ i and E ˙ j stand for the i-th inlet and j-th outlet exergy rate, while n and m represent the number of inlets and outlets in the device, respectively. Moreover, E ˙ i n is the inlet exergy rate and E ˙ o u t the outlet exergy rate for the devices with only one inlet and outlet.
For comparing and evaluating the cycles, a sensitivity analysis was made regarding the effect of the cycle’s high pressure on the energy and exergy efficiency parameters (SEC, FOM, COP); the hydrogen liquefied fraction; the FFH; exergy destruction and its distribution by device; and the ortho-para reaction heat. For the analysis, the high pressure comprehended the interval from 20 to 150 bar. Nonetheless, a comparison of the heat exchangers of PLH and SMR cycles was made to assess the implications of using a mixed refrigerant.

3. Results and Discussion

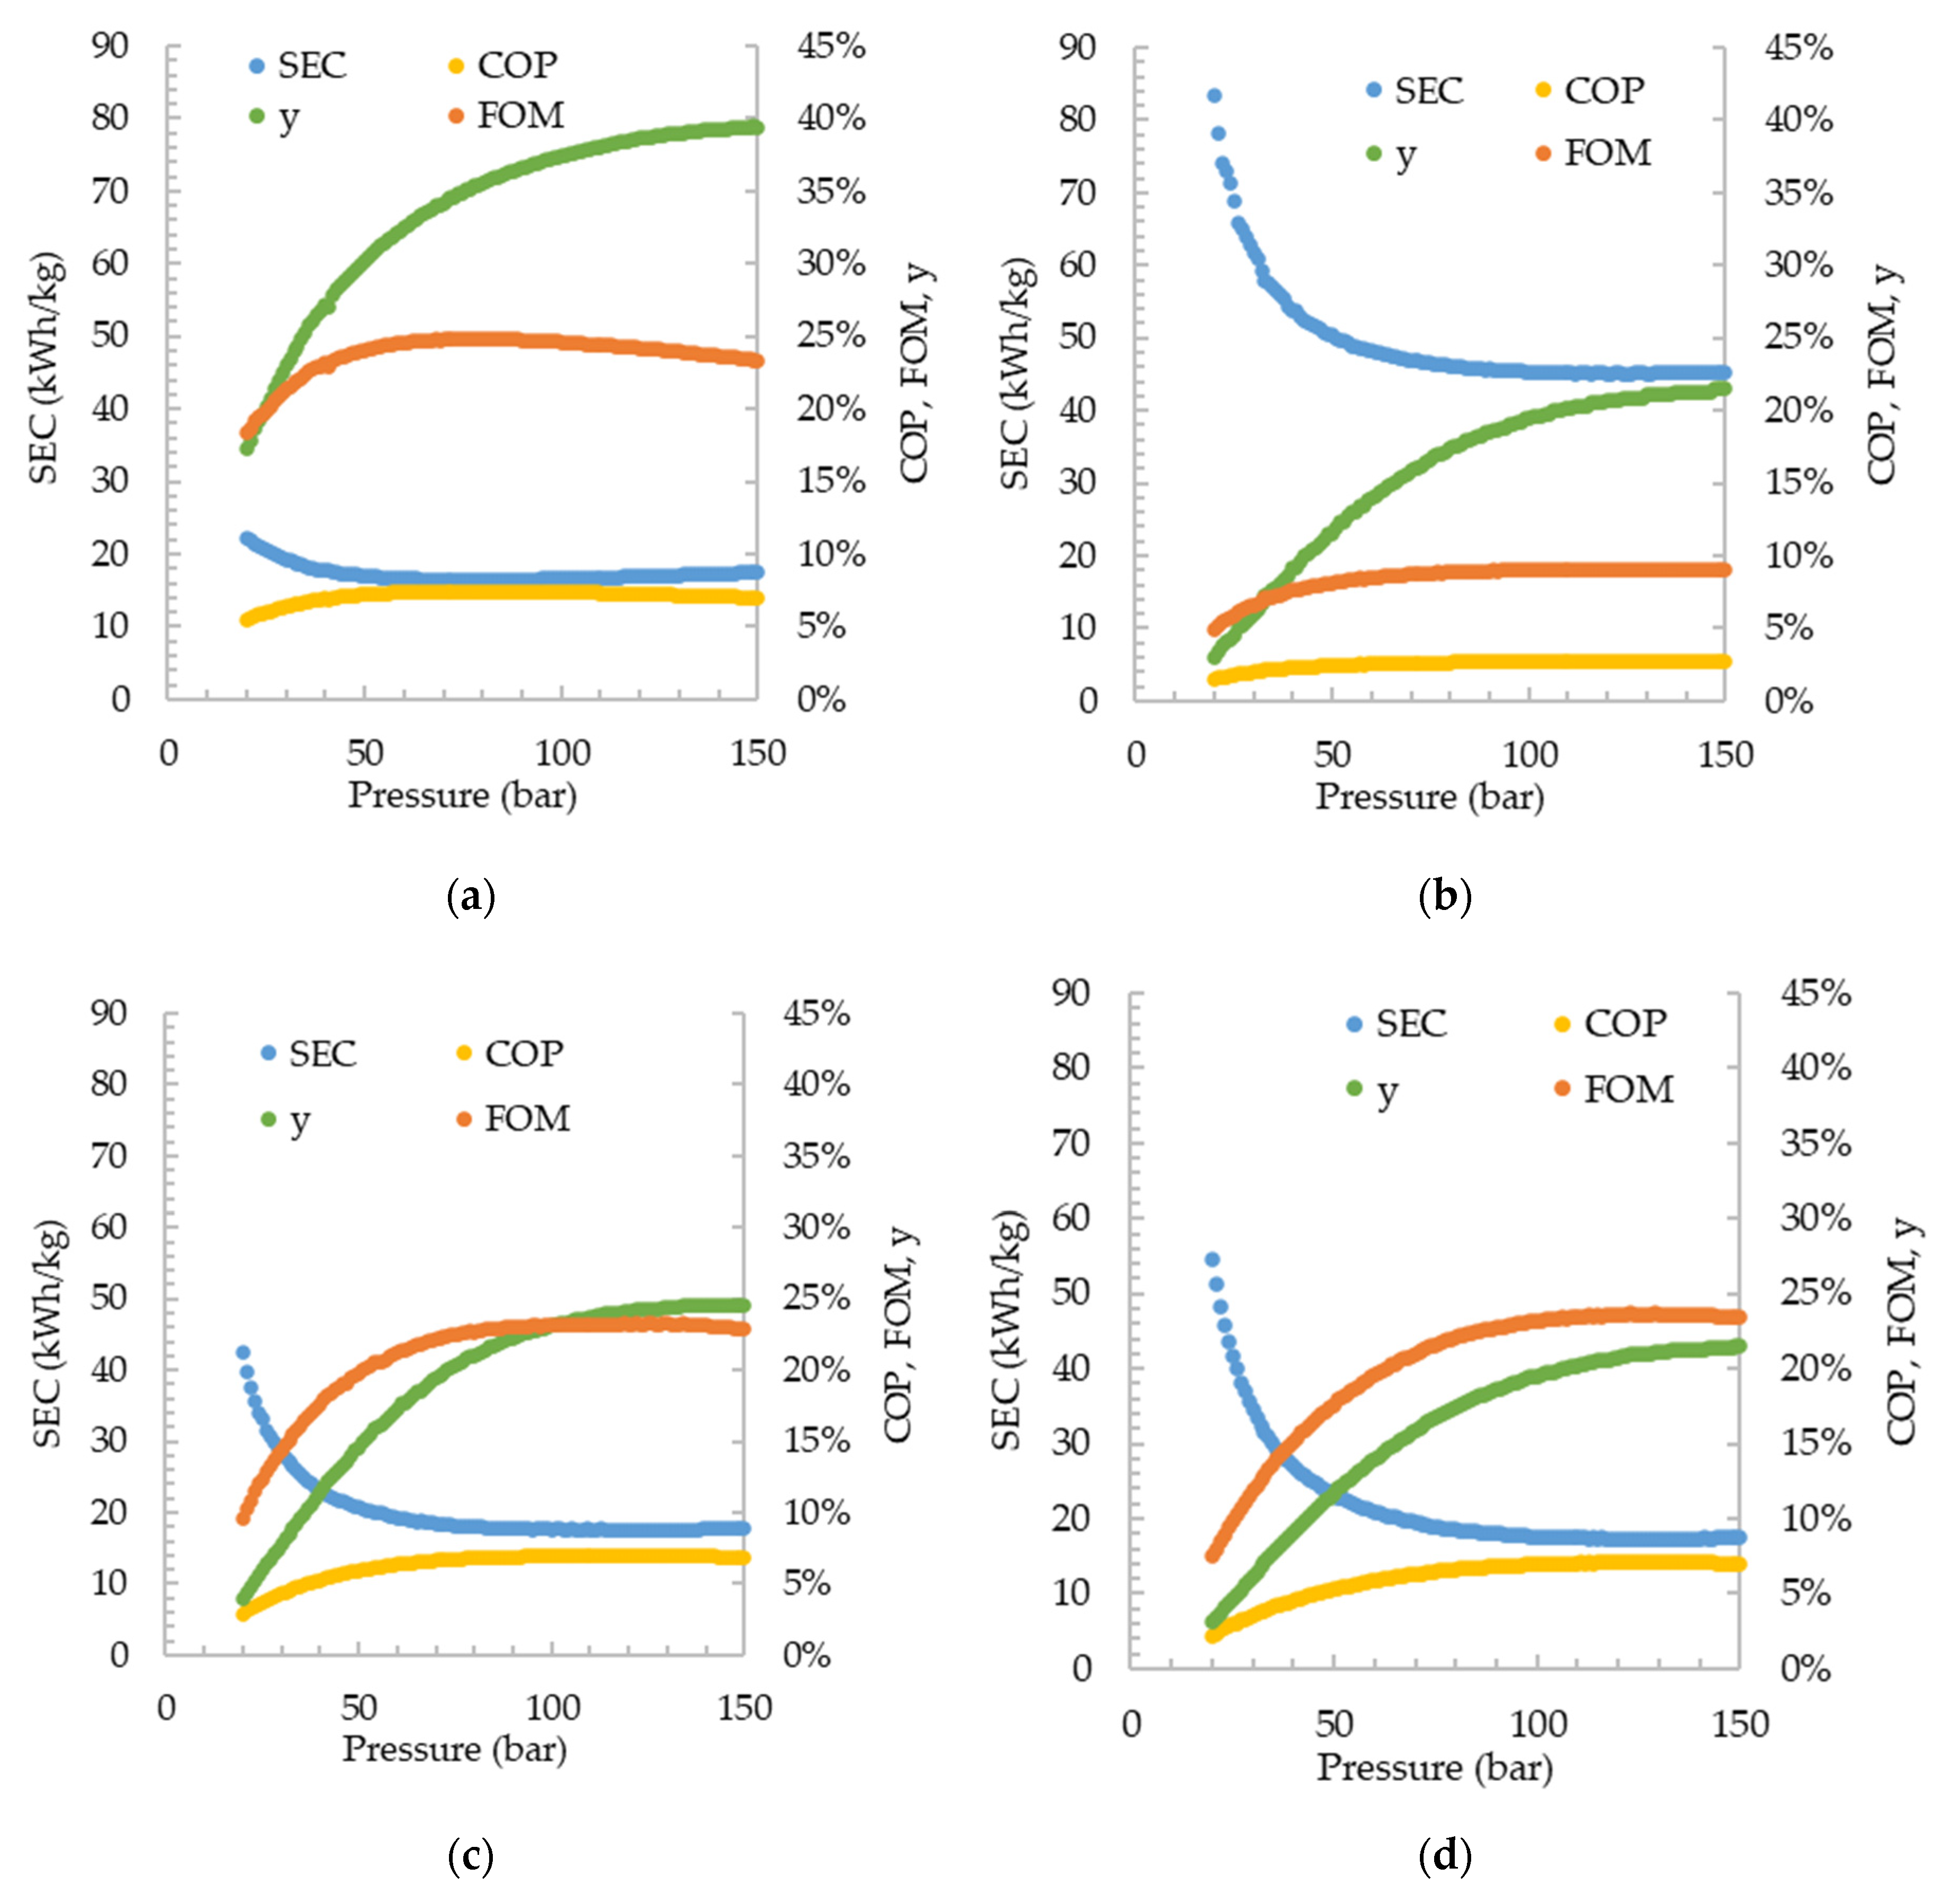
From the simulations carried out, the process efficiency indicators, SEC, COP, and FOM, as well as the fraction of liquefied hydrogen after expansion in the valve, are shown in Figure 2. The pressure range for which the results were plotted varies between 20 to 150 bar with a 1 bar interval. Among the cycles, the Claude cycle presented the best energy efficiency, with a minimum SEC of 16.47 kWh/kgLH, and a maximum FOM of 24.85%, when the high pressure of the cycle is 78 bar. Among the pre-cooled cycles, the DMR showed better results, with an SEC of 17.30 kWh/kgLH, at 123 bar, followed by the SMR cycle, with an SEC of 17.58 kWh/kgLH, at 125 bar, and finally the PLH with an SEC of 45.07 kWh/kg
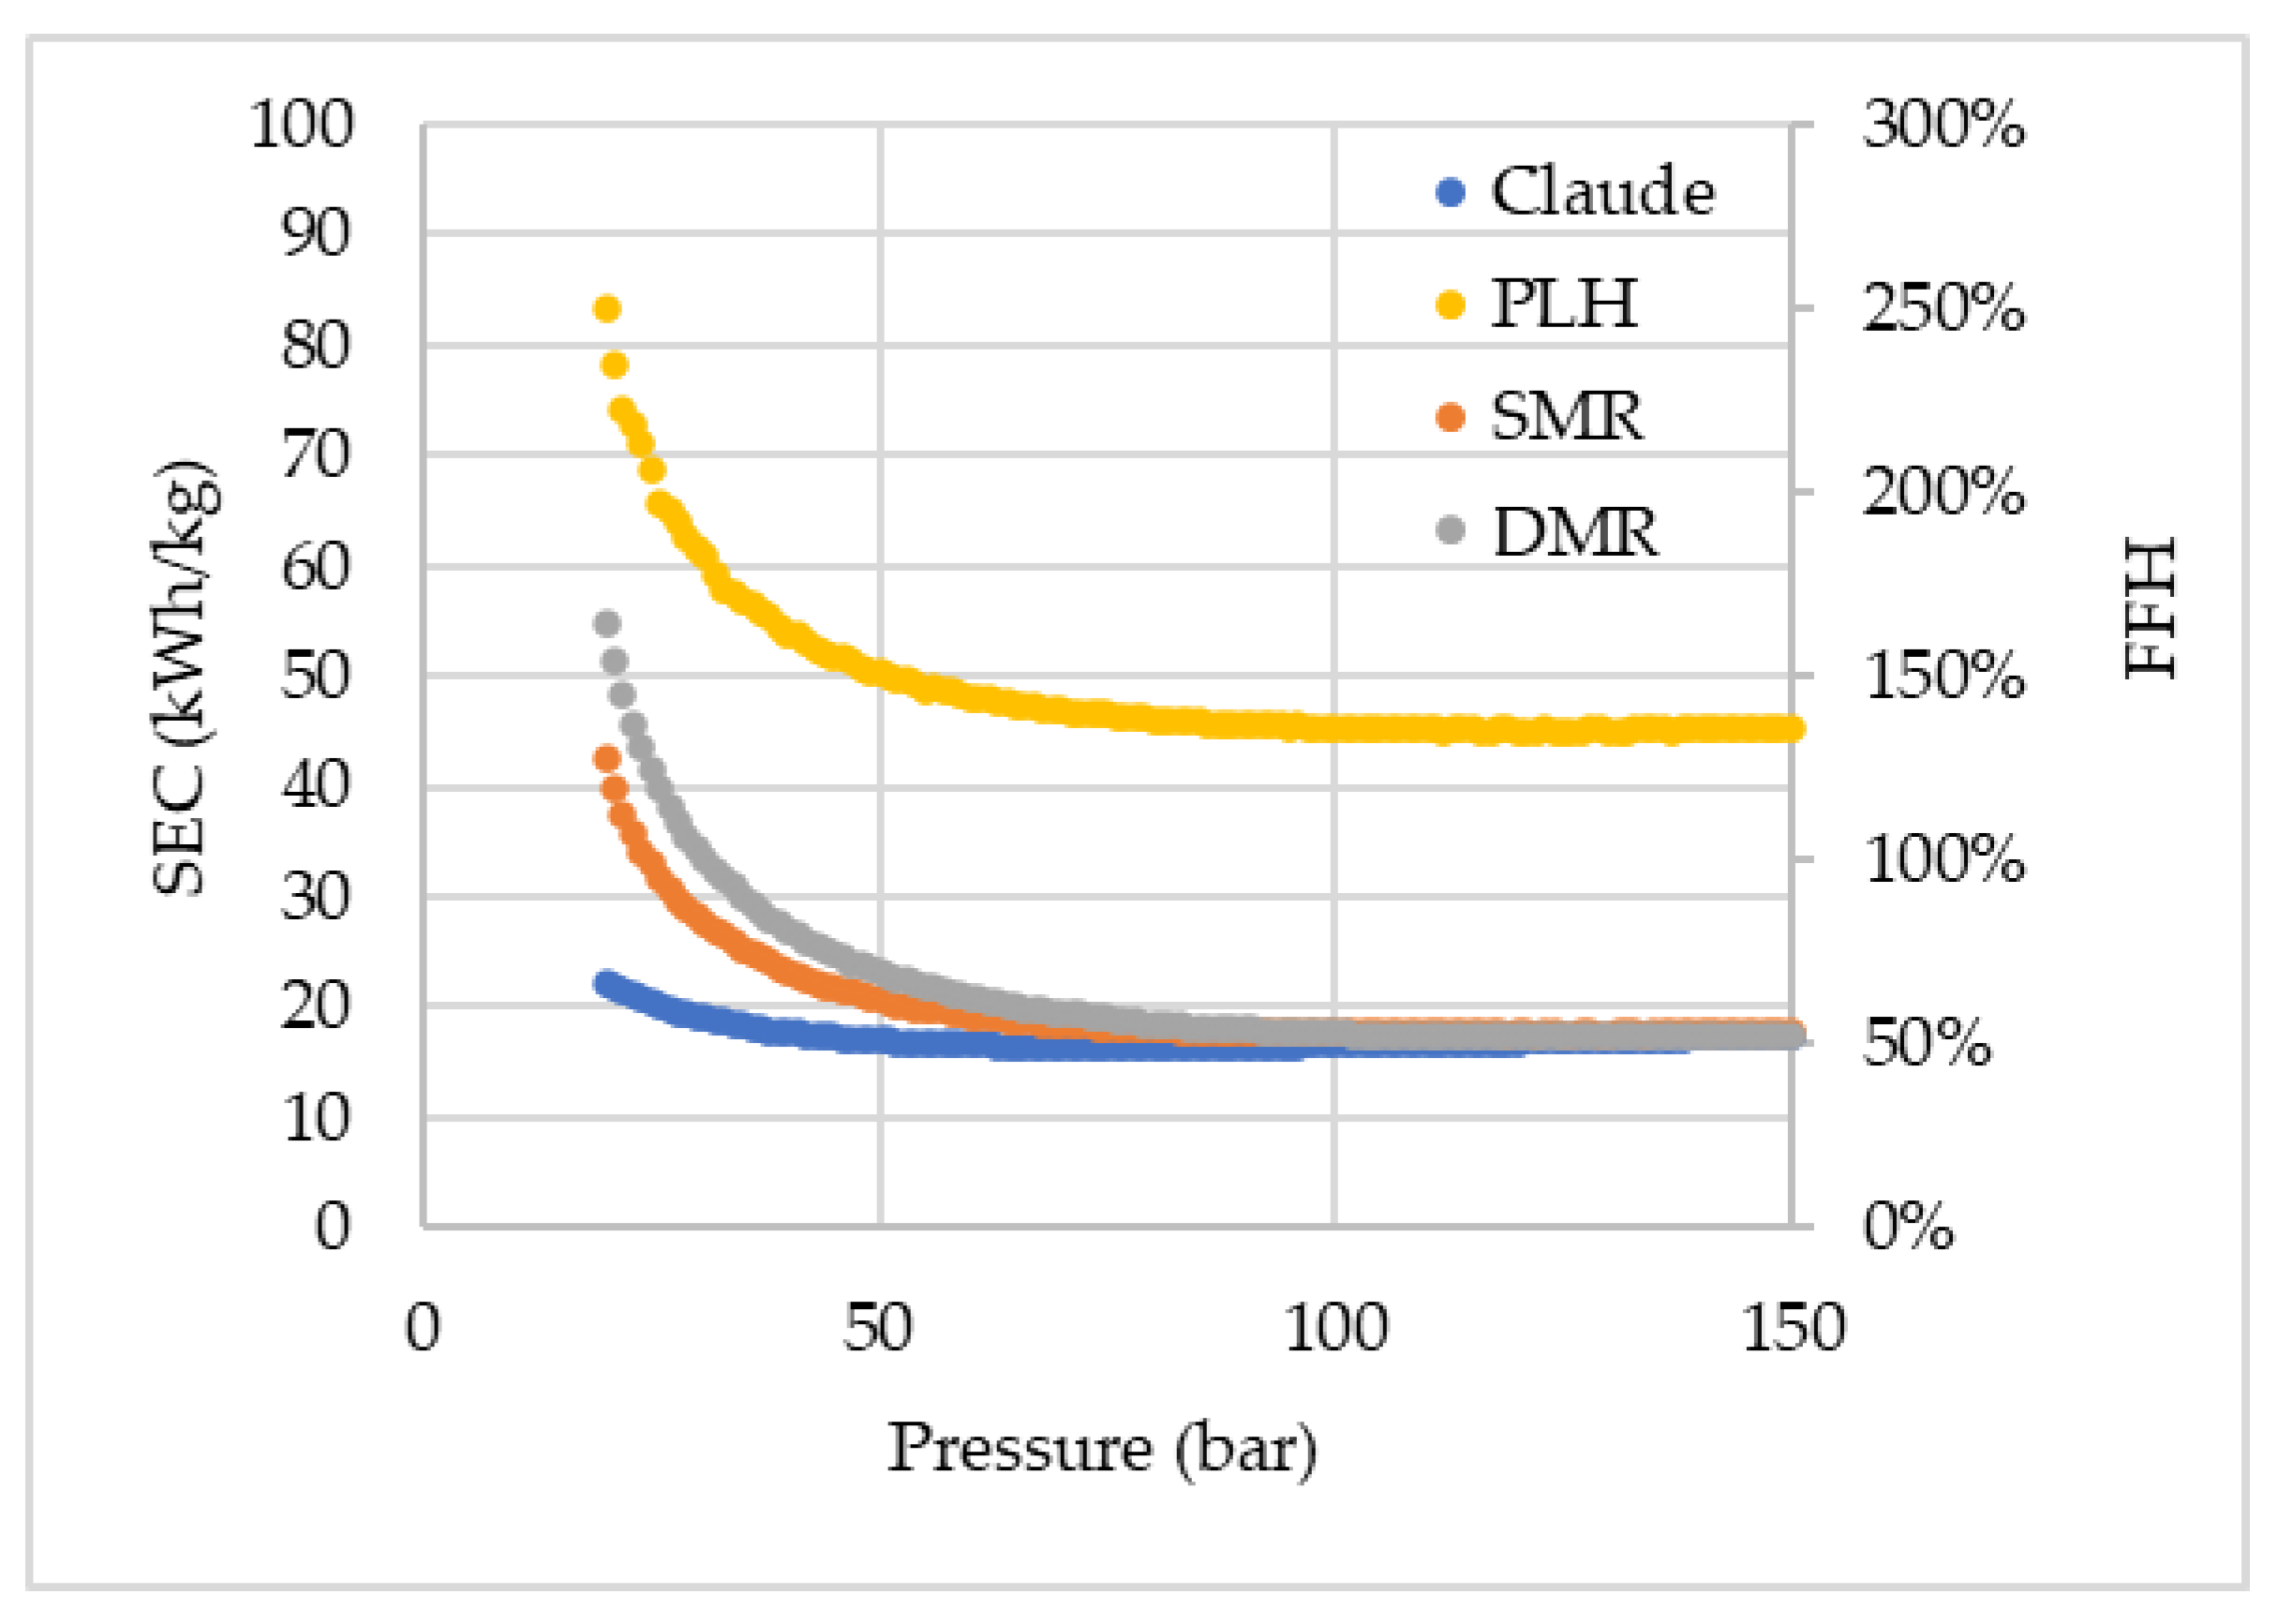
LH, operating at 124 bar. Despite the different efficiencies, all cycles presented the same behavior regarding the increase in the high pressure, improving energy consumption up to a limit beyond which the increase in irreversibility implies greater exergy losses than facilitates liquefaction. For a comparison effect, Figure 3 shows the SEC and the FFH of all simulated cycles, and only Claude, SMR (operating above 25 bar), and DMR (operating above 32 bar) cycles were found to exhibit FFH lower than 100%, i.e., presenting a lower energy cost for hydrogen liquefaction than hydrogen itself contains. Nonetheless, it is important to highlight that the FFH alone cannot provide enough information for evaluating the worthiness of the liquefaction cycle, being only a cycle efficiency indicator, as the SEC. Since liquefaction is an alternative for storing and transporting hydrogen, especially over long distances, its cost, therefore, should be compared to gas hydrogen transportation through pipelines, for example. In the graphs, no perfect tendency of the points is observed, which is caused by the recycle and adjust blocks, and even multi-current heat exchangers, which have a tolerance for the simulation’s convergence.
It can be noticed a significant superiority of the Claude cycle over the other cycles. This is essentially due to the presence of the expander, which always guarantees more effective cooling than the isenthalpic expansion in the valves. The expander makes the addition of a pre-cooling cycle unnecessary and concomitantly produces work that can be integrated and used in the process compression or other operations, and also reduces the net power consumption by the system. The SEC found (16.47 kWh/kgLH) even approaches the current SEC of operating hydrogen liquefaction plants (12-15 kWh/kgLH).
The SEC of the Claude cycle operated at a high pressure of 21 bar was 21.86 kW/kgLH, which is significantly higher than the value reported by Yang et al. (2023) [25] of 5.62 kW/kgLH. The contrast in values is due to differences in the construction of the liquefaction cycle model. While those authors considered pre-cooling external to the hydrogen liquefaction line (using nitrogen), in the present work, the Claude cycle did not consider the use of a refrigerant. Furthermore, the designs differ regarding the number of compressors and expanders applied in series, as well as the number of splits of the hydrogen stream for temperature reduction in expanders. In addition, those authors assumed that the hydrogen supplied to the cycle would be at a pressure of 21 bar, compared to the ambient pressure (1 bar) considered in this work. Considering a hydrogen feed pressure of 21 bar to the cycle, the SEC value would be 20.40 kW/kgLH, and the reduction would progress with the increase of the high pressure of the cycle, since a greater fraction of the hydrogen is liquefied, and therefore a greater quantity of high-pressure hydrogen would be fed to the cycle and not pressurized internally.
The lower SEC obtained in the mixed refrigerants cycles in comparison with PLH, is because, using a non-pure refrigerant, the saturation temperature of the refrigerant at the lower pressure level of the cycle will be lower than the lowest saturation temperature between the components of the refrigerant, that is, nitrogen saturation temperature, as is the case in PLH. Therefore, much lower refrigerant compression is required in the SMR and DMR cycles, as defined in Table 2.
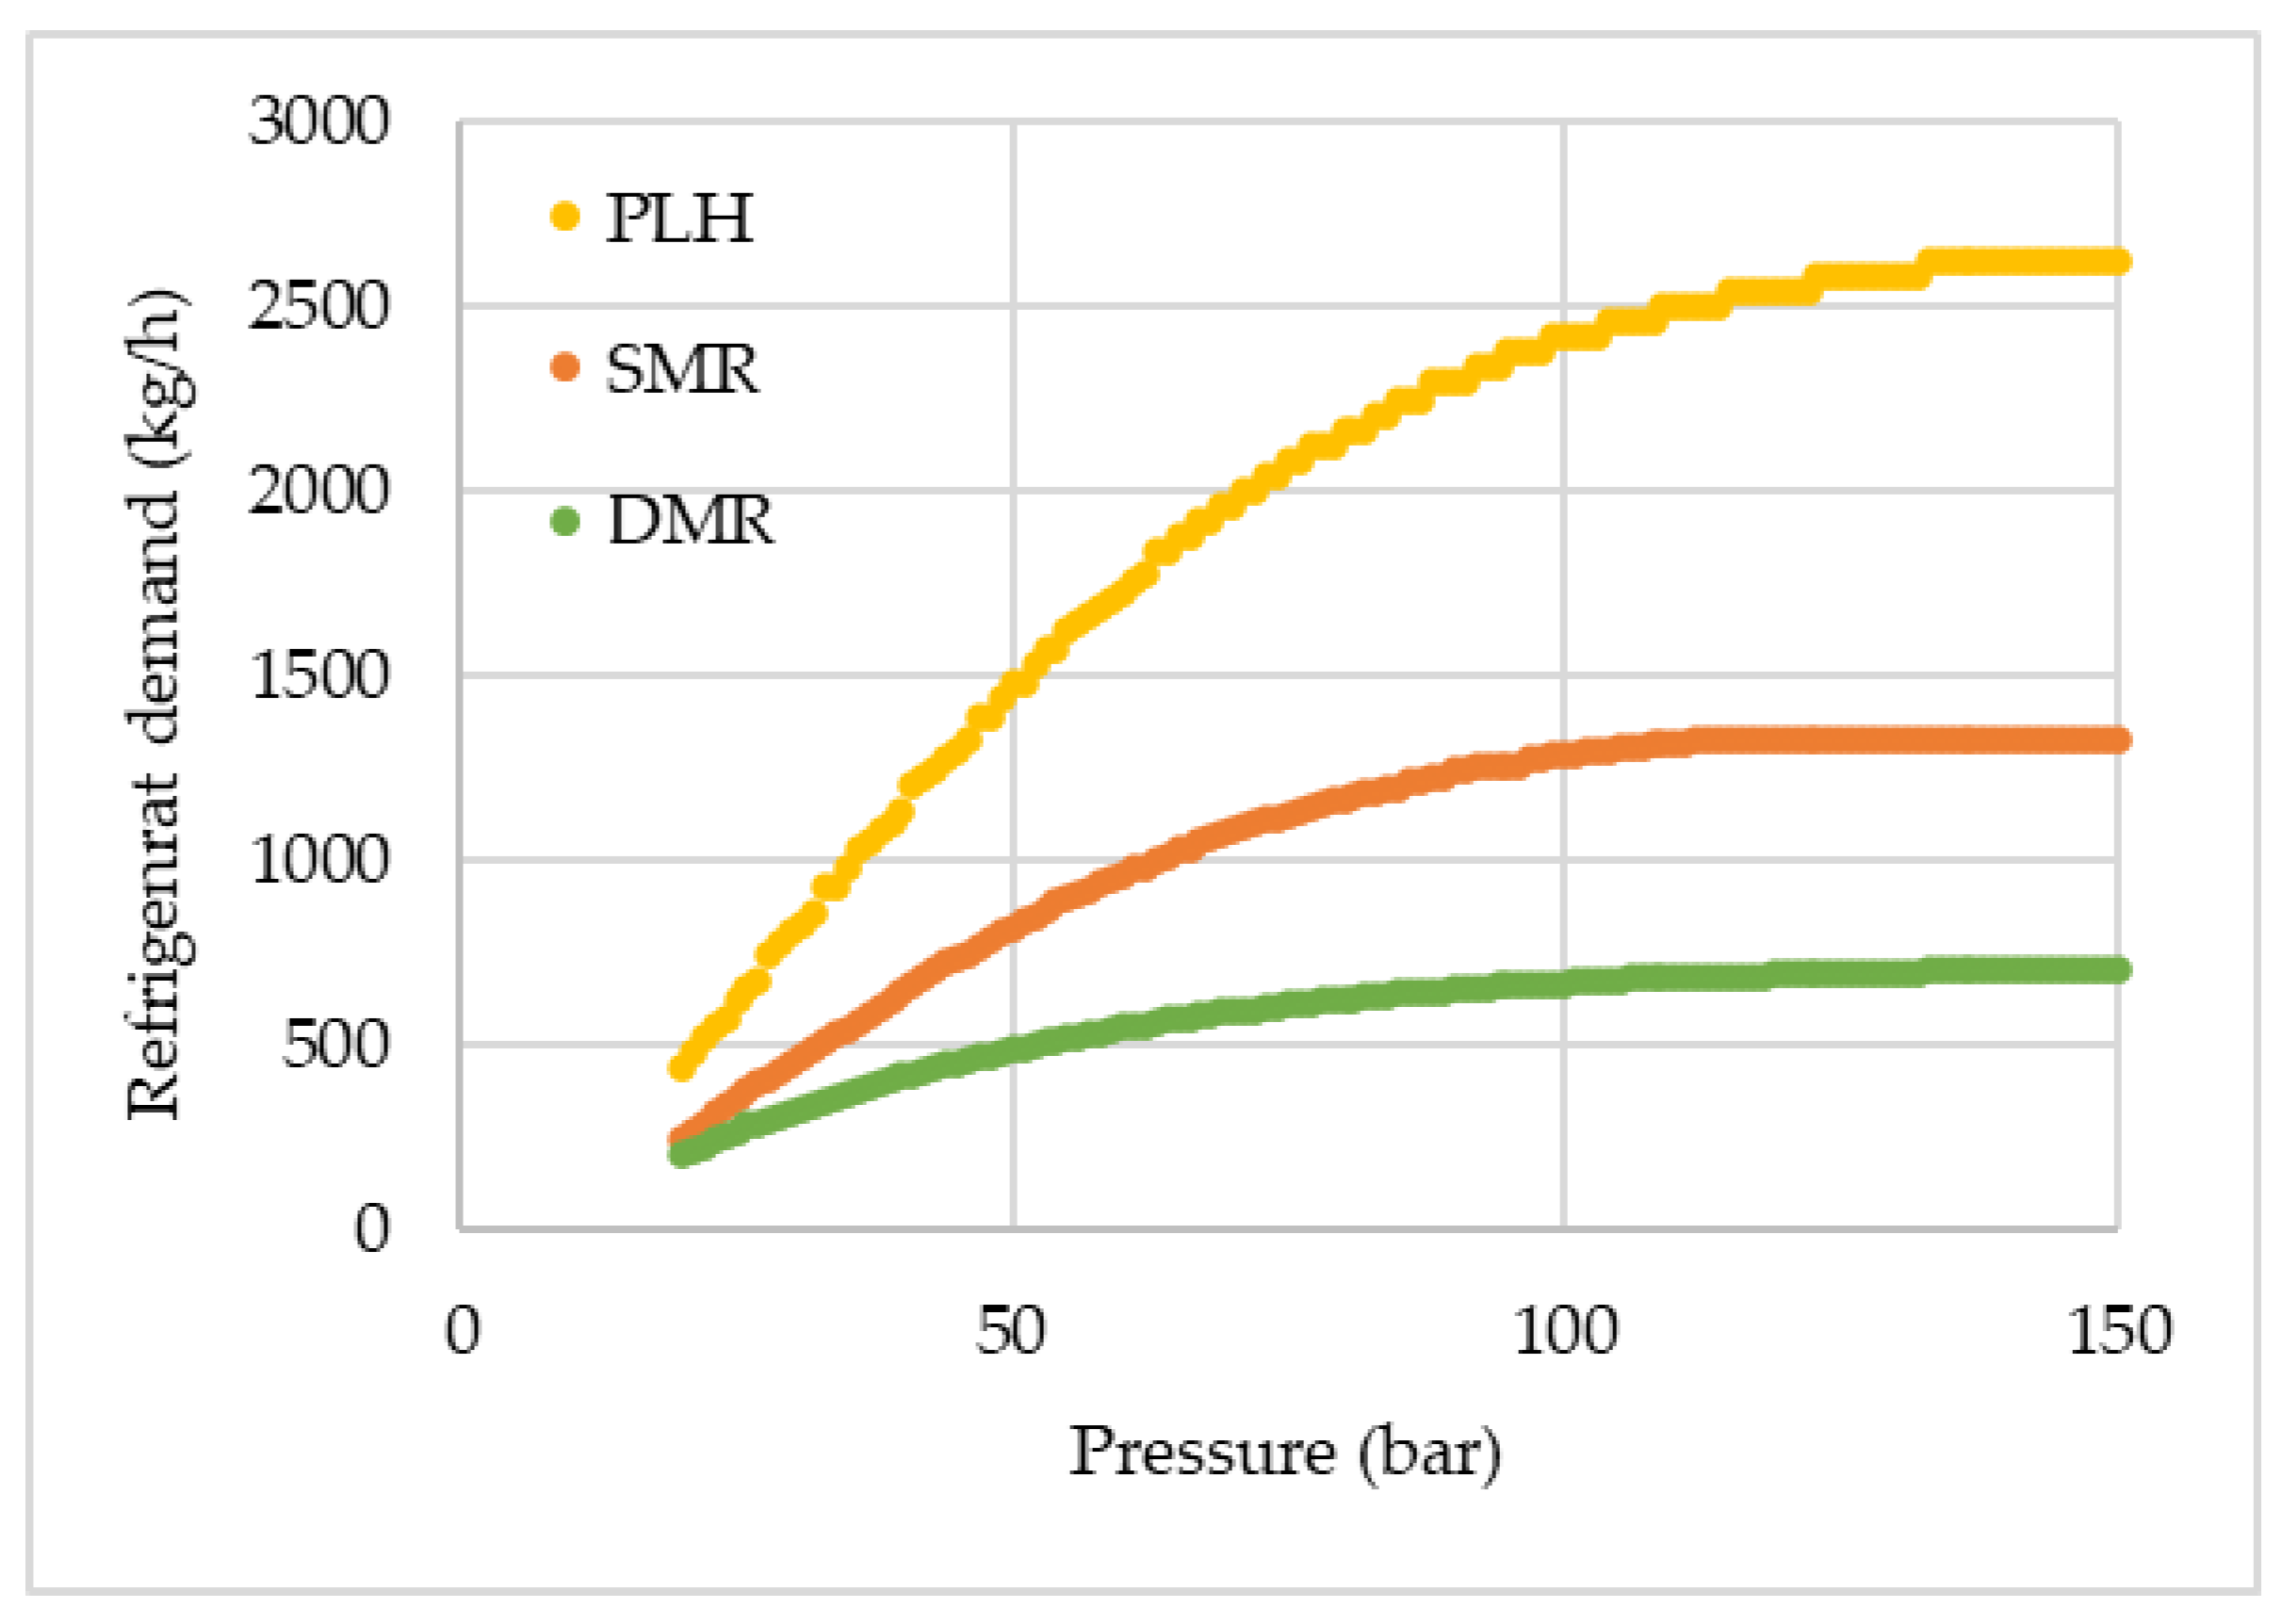
The refrigerant demands for each pre-cooled cycle are presented in Figure 4. An increase in the demand can be verified as the pressure increases, proportionally to the liquefied hydrogen fraction. With the reduction of the non-liquefied hydrogen, the amount of heat that can be removed by the recycled hydrogen also decreases, and the cooling, previously provided by the cold hydrogen, has to be supplied by the additional refrigerant. For the DMR cycle, since WMR and CMR were set to have the same mass flow rate, only one data set is shown. Considering both WMR and CMR, the total refrigerant demand in SMR and DMR is almost identical, while in PLH, the nitrogen needed for pre-cooling is close to two times the amount needed in the other two pre-cooled cycles.
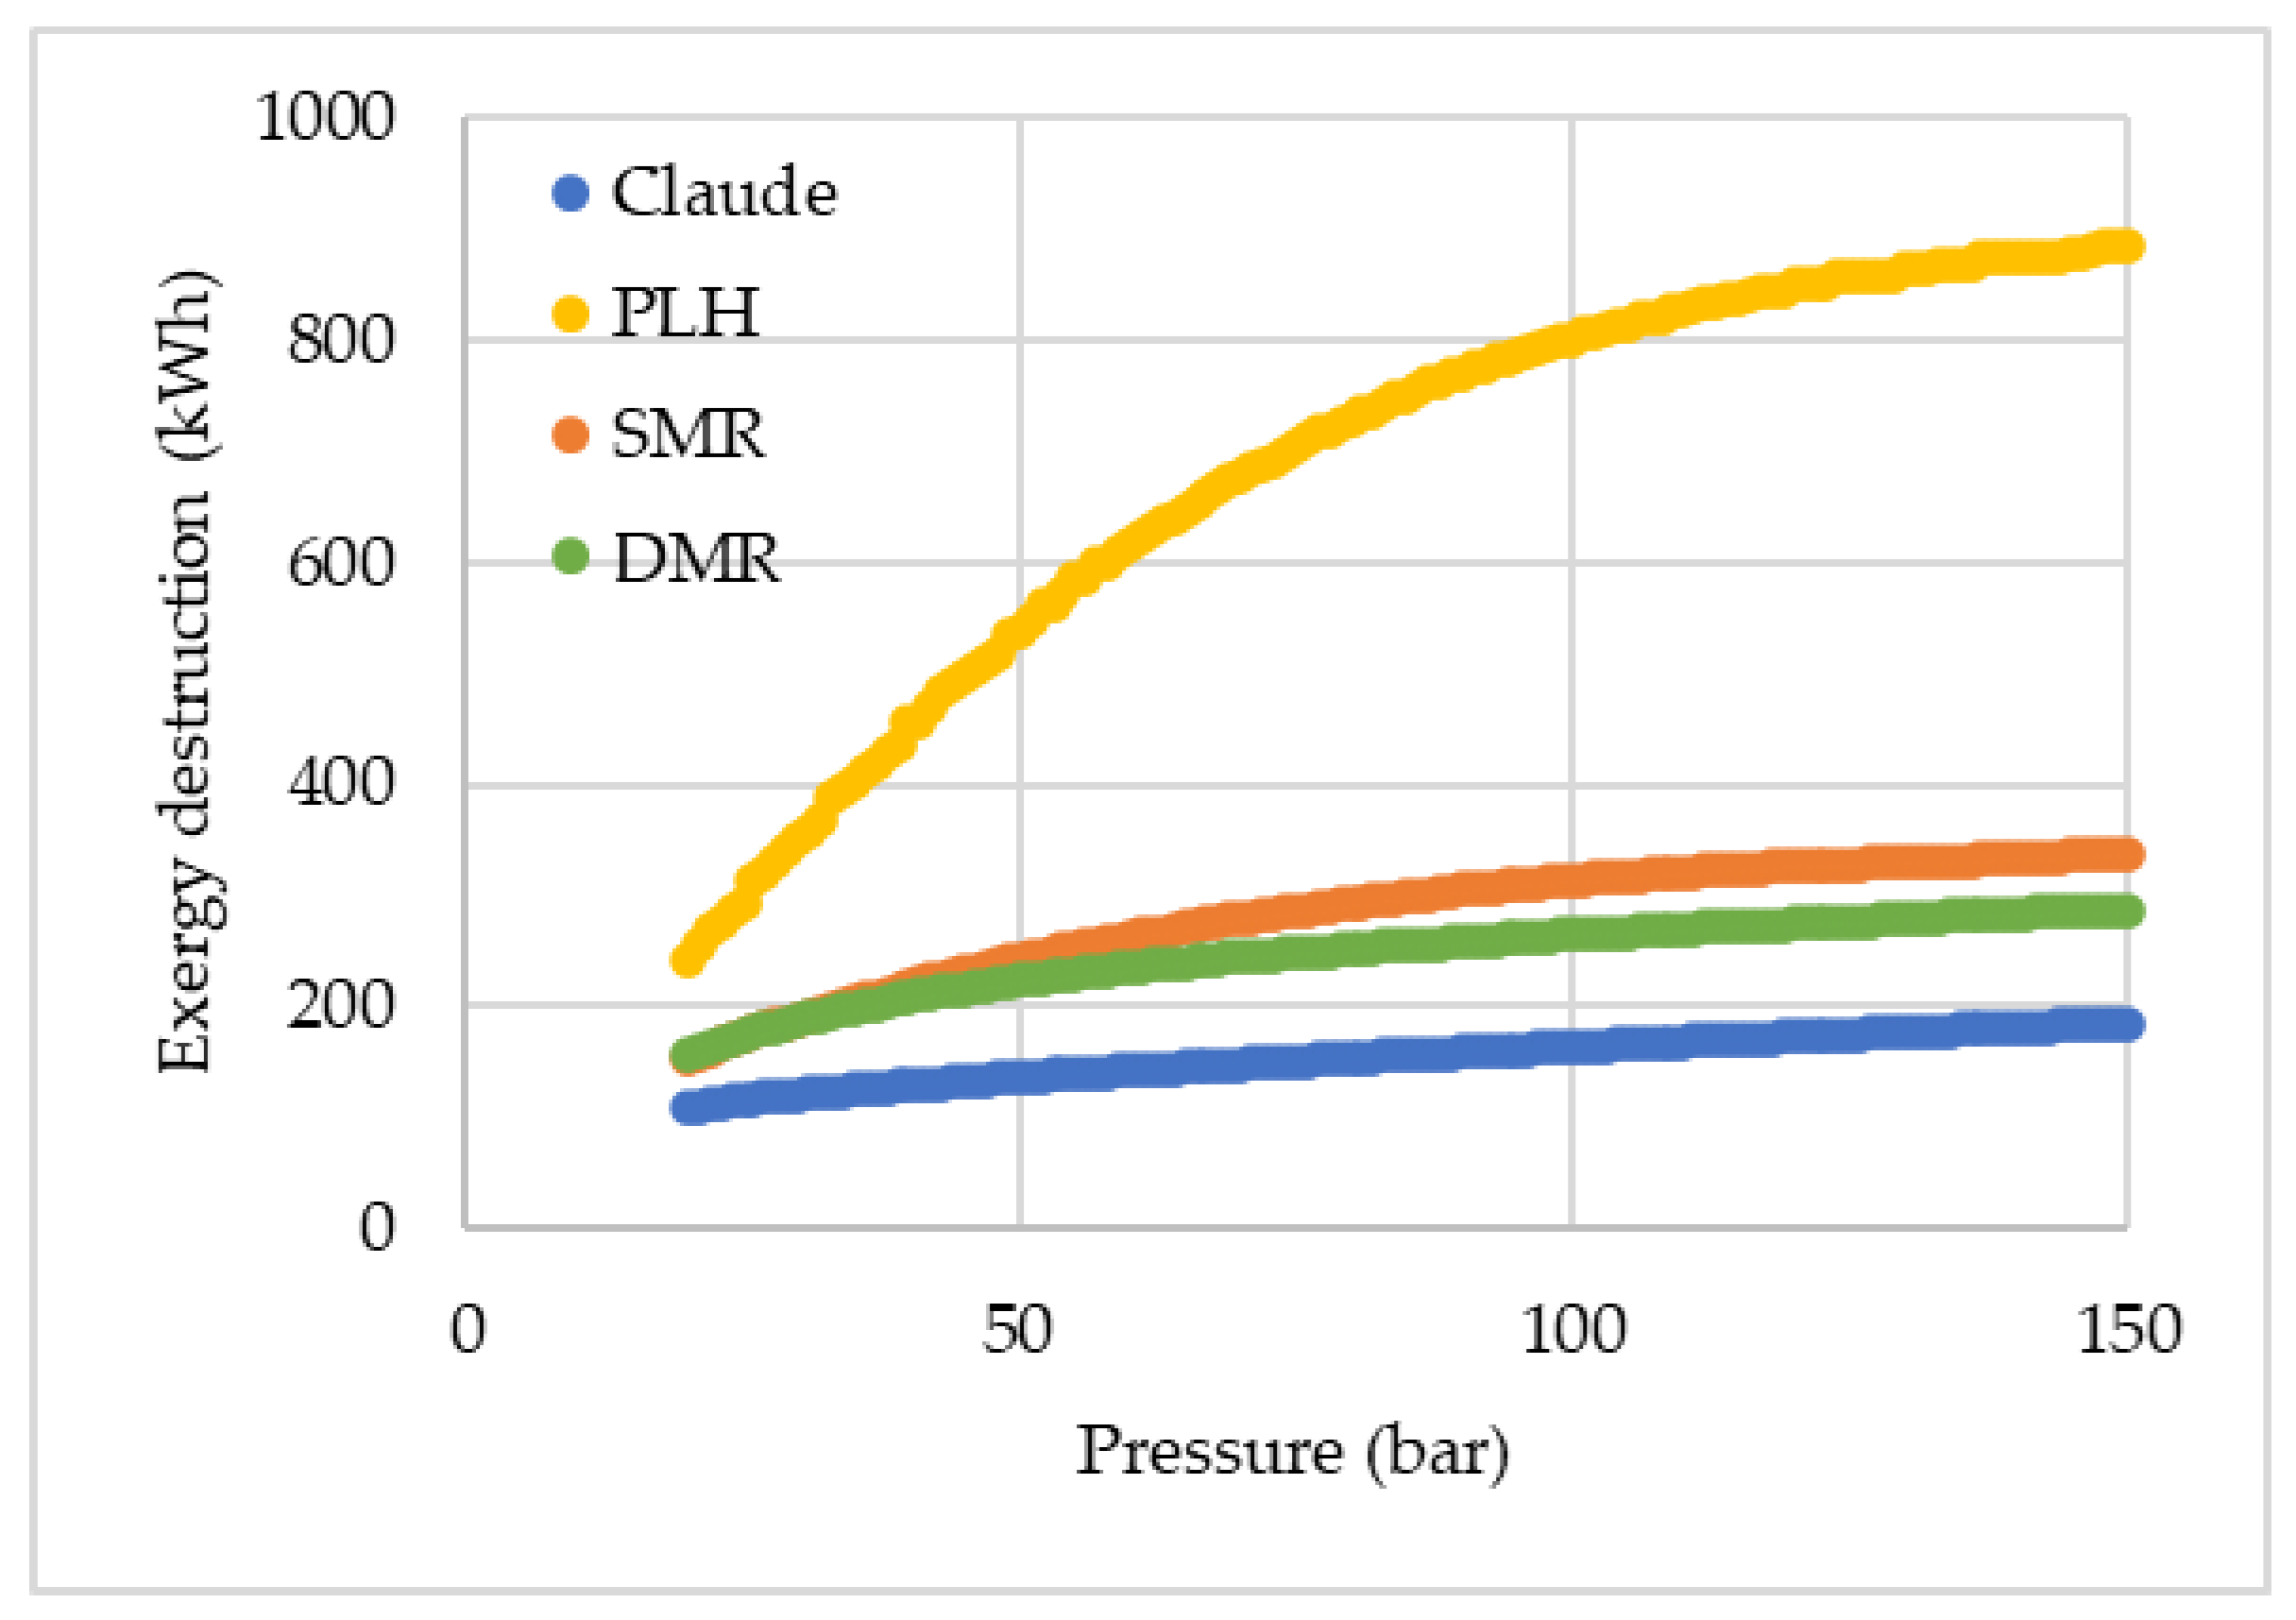
Furthermore, in terms of exergy, the SMR system has a significant advantage over the PLH. 
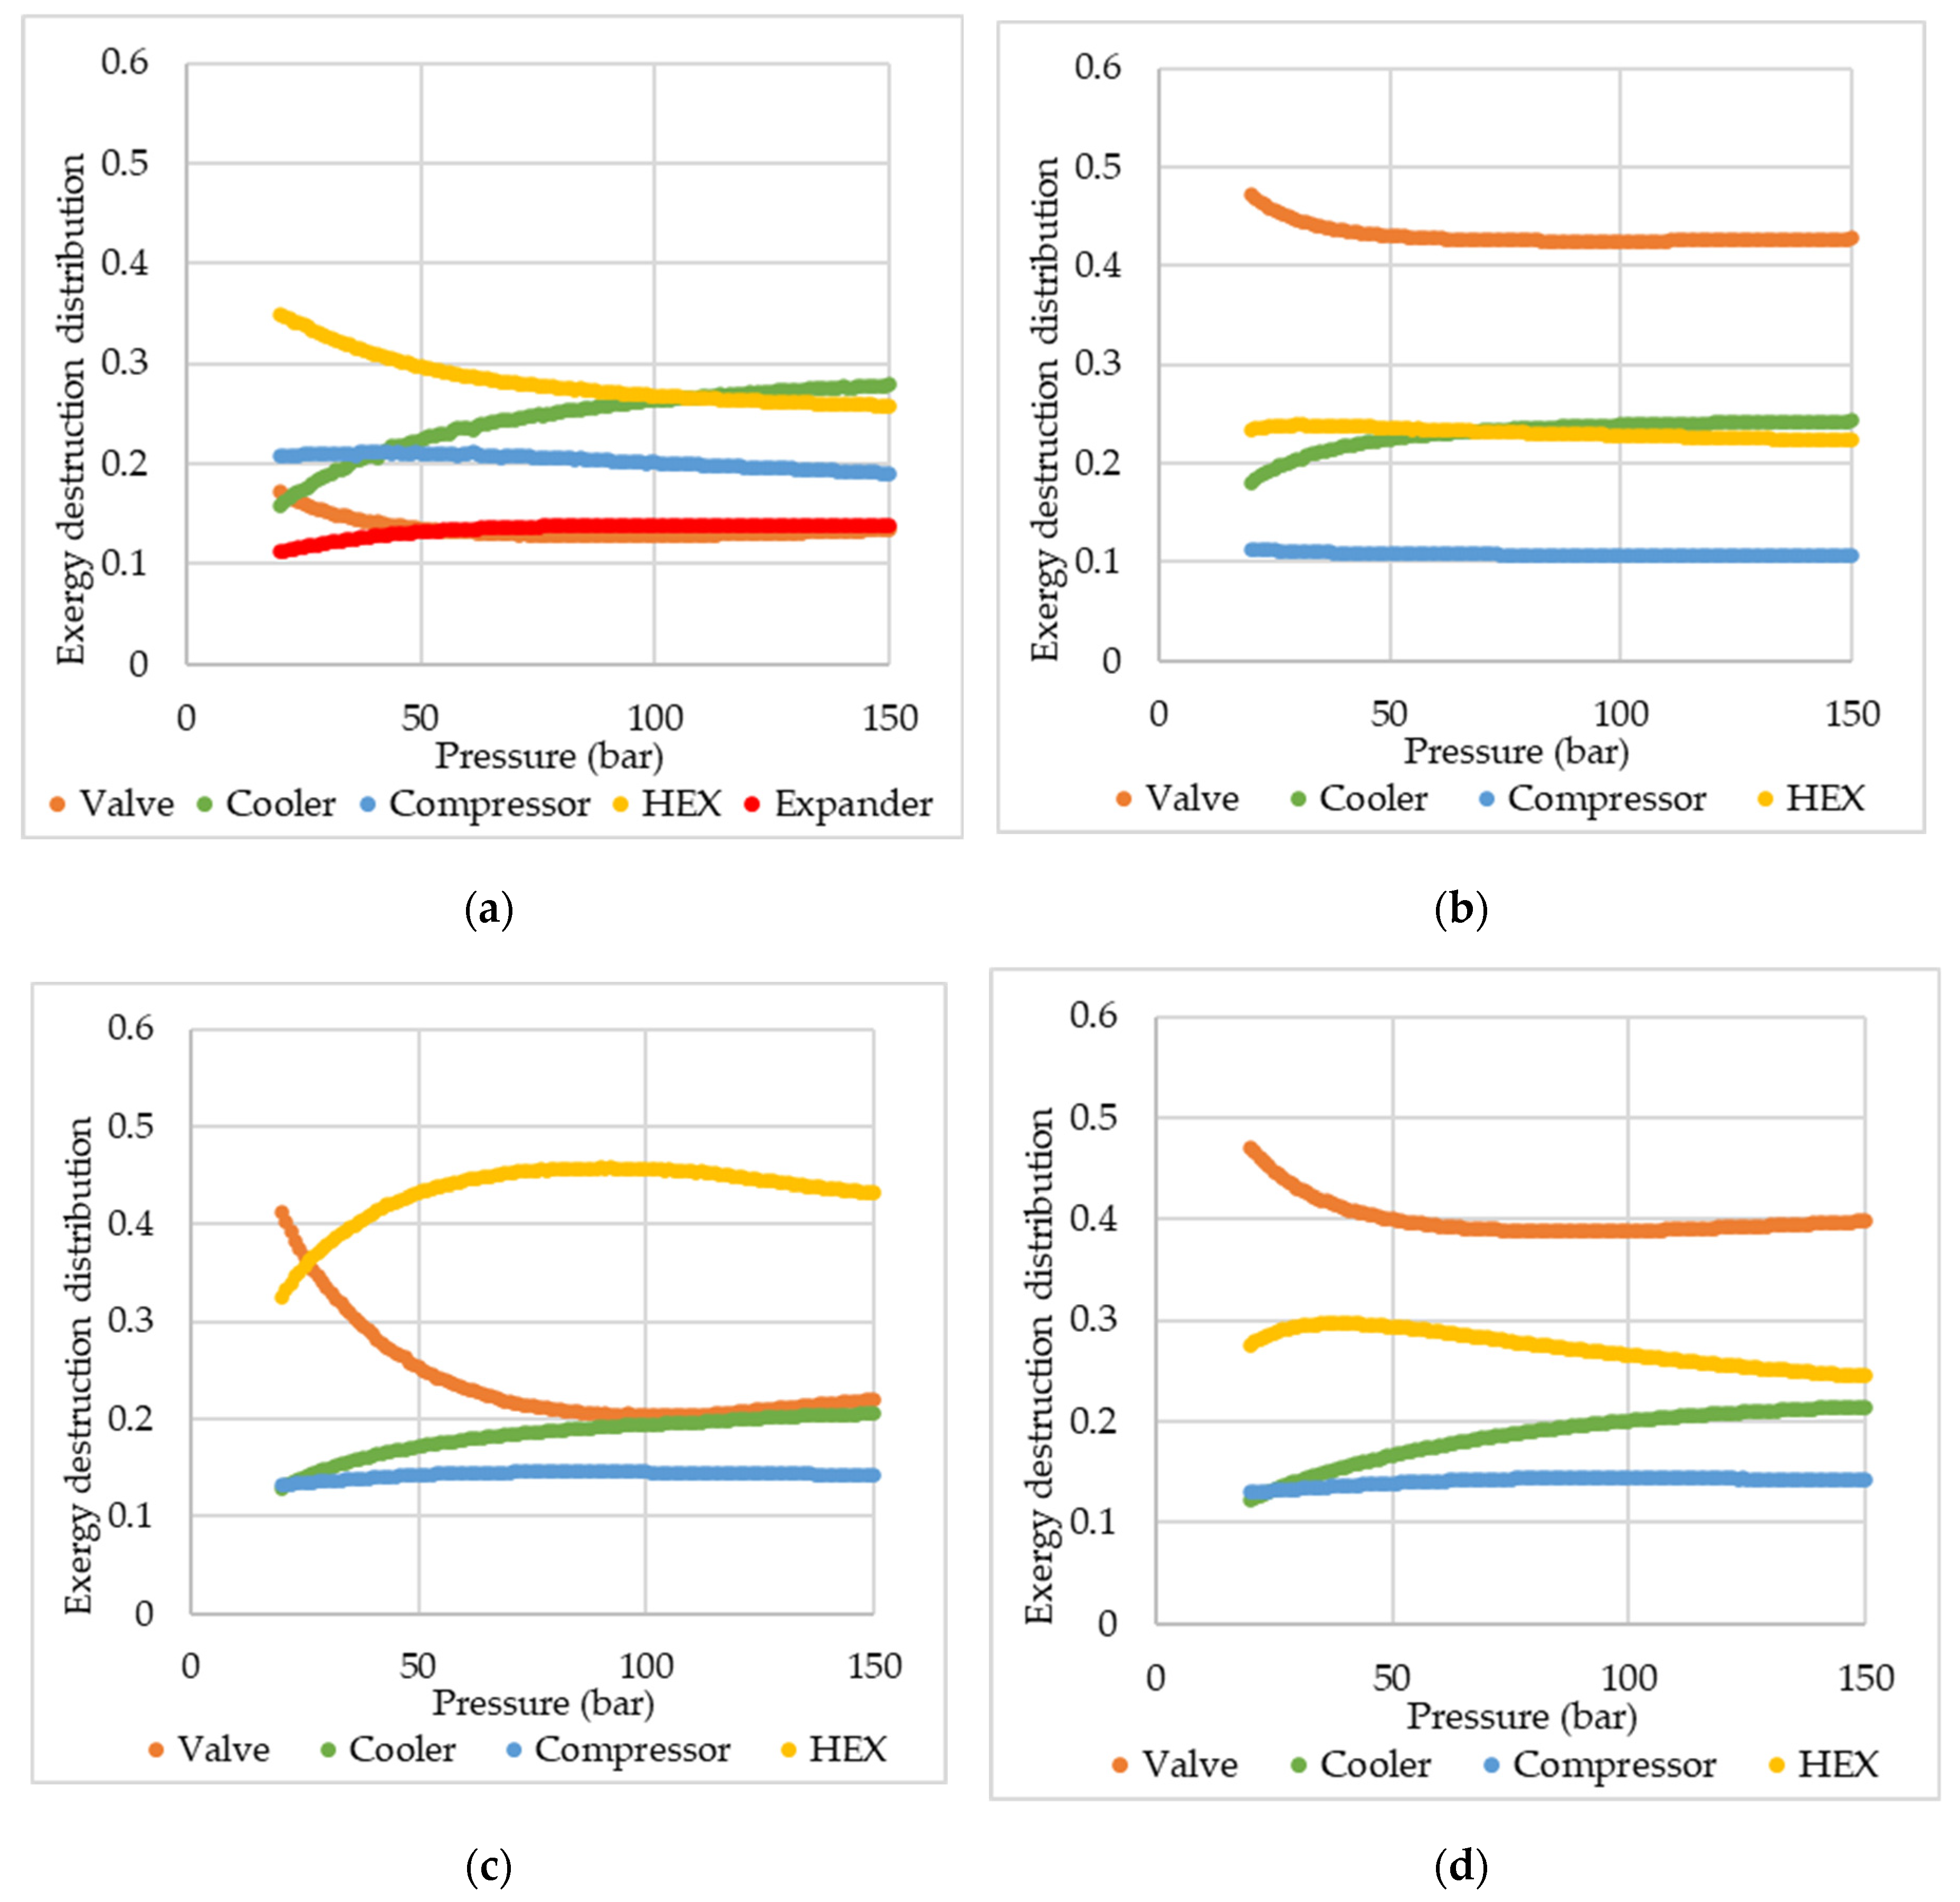
Figure 5 presents a comparison of the total exergy destruction among the cycles, while Figure 6 presents the distribution profiles of exergy destruction among the pieces of equipment. In the exergy destruction distribution, the fractions of exergy destruction in mixers, splitters, and flash vessels are negligible and therefore are not shown in Figure 6.
It is noted that in the PLH cycle, exergy destruction is more intense in the valves, while for the SMR, exergy destruction occurs more significantly in the heat exchangers. Even though heat exchangers are the device that has the greatest relative contribution to exergy destruction in the SMR, when absolute values are analyzed, the exergy destruction is slightly inferior in the mixed refrigerant cycle. With a multi-component refrigerant, the temperature glide allows the adjustment of the hot and cold composite curves more properly, considering that the refrigerant varies its temperature throughout its boiling.
Comparing SMR and DMR exergy distribution profiles (Figure 6), there is an inversion in the device with the major contribution to the exergy destruction, changing from the heater exchangers in the SMR to the valves in the DMR. In the DMR, with the addition of a new refrigeration cycle, another valve was added, increasing, therefore, the exergy destruction in this piece of equipment. The increase is not verified in the same intensity on the heat exchanger due to the fact that hydrogen is cooled equally in both cases, i.e., essentially there is no increase in the heat exchanger duty, being the suiting of the composition curve the main factor in changes of the exergy destruction in this device. Nonetheless, it is noticeable that DMR presented a lower or close total exergy destruction than SMR. This result is expected, as increasing the number of pre-cooling cycles, thus, performing the hydrogen liquefaction through a greater number of stages, the process becomes closer to a reversible process, with less exergy destruction. Despite the close SEC found for the DMR and SMR, the lower exergy destruction in DMR is a clear indication that the cycle could be more efficient than SMR, as more suitable operating conditions were considered. These more appropriate conditions could be obtained by the optimization of the cycle specifications and MR compositions.
When comparing the exergy destruction results with those reported by Yang et al. (2023) [25], it is visible that the participation of the valves in the exergy destruction was much more relevant in the present study. However, it is important to highlight that those authors conducted an optimization study to reduce SEC, which jointly reduces irreversibilities. Thus, the optimal conditions shift the cooling need to be mainly provided in heat exchangers at the detriment of valves, since isenthalpic expansion inherently has a significant irreversibility. In heat exchangers, irreversibility and exergy destruction can be more easily avoided by well-suited composite curves.
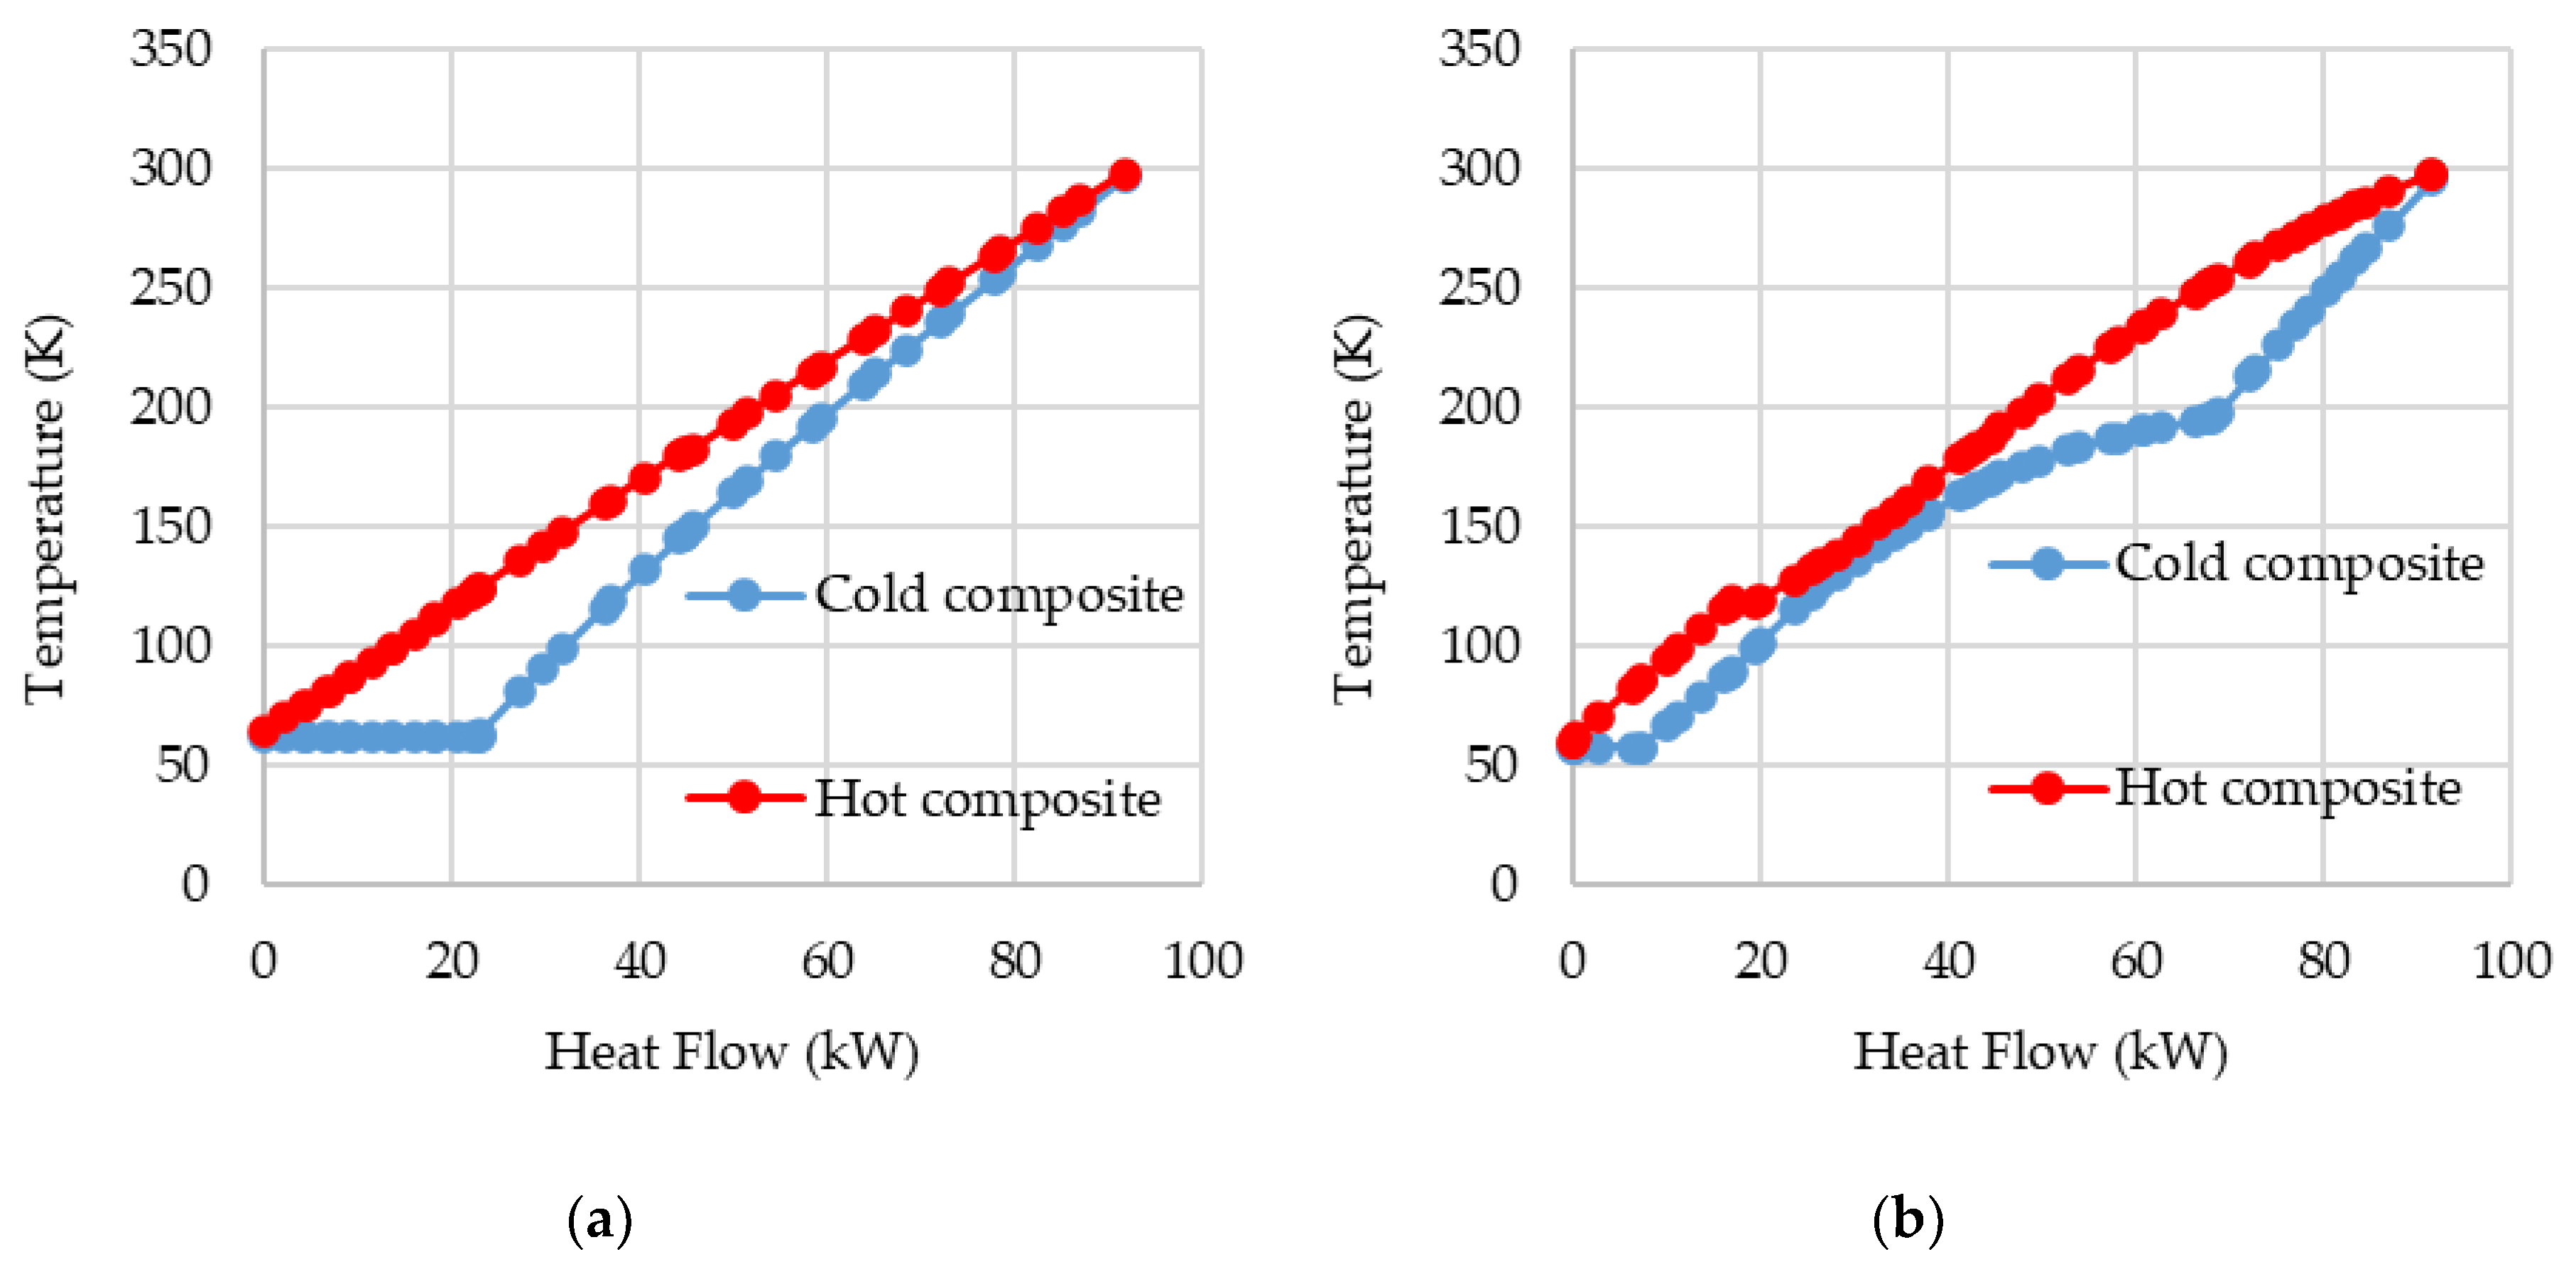
In Figure 7, the composite curves for HEX-B1 and HEX-C1 are shown when both cycles, PLH and SMR, operate with a high pressure of 94 bar. It is notable that in lower temperatures, the composite curves are closer to each other in SMR than in PLH. That is because a multi-component refrigerant allows not only the temperature glide but also the adjustment of the specific heat capacity of that refrigerant. By optimizing the refrigerant composition, its specific heat capacity can be varied, and thus it would be possible to further decrease the distance between the hot and cold composite curves. The difference in both graphs is diminished as nitrogen cooling prior to the isenthalpic expansion is performed in HEX-B3. On the other hand, the mixed refrigerant pre-cooling is done in HEX-C1, the same heat exchanger that promotes the hydrogen pre-cooling. If both cycles were constructed analogously, i.e., with nitrogen pre-cooling, which is done separately at HEX-B3, being done at HEX-B1, as it is for the SMR cycle, a greater difference, regarding SMR’s greater effectiveness, would be perceived.
Still, in Figure 7, it can be noticed that at higher temperatures, over 200 K, the mixed refrigerant in the SMR does not promote a well-suited cold composite curve, as the lightweight components of the refrigerant, despite their capacity to provide low temperatures for the cooling process, do not match the heat load needed in higher temperatures. Hence, using an external refrigeration cycle, with a refrigerant with heavier components, as in the DMR processes, would not only guarantee a well-suited curve in both temperature intervals but also a lower compression power [7].
Despite those advantages, the DMR process presented SEC and exergy destruction values higher than expected, since with the increase in the degrees of freedom, the adjustment of the variables along the cycle without an optimization method is a more difficult procedure compared to the other simpler cycles. In addition, in neither the SMR nor DMR cycles was the refrigerant composition effect in the SEC analyzed. Thus, for future research, evaluating the effect of the refrigerant’s composition and its physical properties on the cycle performance, and even optimizing the refrigerants’ composition and cycle parameters, such as intermediate temperatures and/or refrigerant mass flow ratios for a proper comparison of the mixed refrigerant cycles, could be a possibility. Additionally, it is evident that the increase in the cycle complexity, i.e., increasing compression stages and the number of refrigerants and the number of refrigerant components, can improve its performance and reduce the SEC. Thus, to fully understand the applicability of the proposed cycles, in future studies, an economic analysis must be made. Moreover, optimization could also be performed from the economic point of view.

4. Conclusions

Despite the increasing research in hydrogen liquefaction, with the proposal of theoretical cycles that even approach the ideal efficiency, few studies fully investigate the behavior of hydrogen liquefaction cycles under varied conditions, only focusing on optimal points. In this study, therefore, four simple hydrogen liquefaction cycles, Claude, PLH, SMR, and DMR, were assessed regarding the influence of the cycle’s high operating pressure on energy efficiency parameters, exergy destruction, and its distribution along the pieces of equipment, and the influence of the hydrogen ortho-para conversion.
The Claude cycle presented the best SEC among the cycles, reaching 16.42 kWh/kgLH. Amidst the pre-cooled based cycles, the SMR presented the best efficiency, as, in contrast to PLH, it uses a non-pure refrigerant, and makes use of the temperature glide to promote a hydrogen pre-cooling to lower temperatures as well as a better suit of the composite curves. Nevertheless, the PLH cycle also presented a minimum SEC lower than the usually presented in the literature. The DMR cycle, notwithstanding its advantages of a better suit of the composite curve at higher temperatures and lower power consumption in its compression, as a function of its greater degrees of freedom, depends on optimization methods to achieve satisfactory results, with an SEC significantly lower than SMR. Further work could focus on the assessment of more complex cycles and employ optimization methods for some of the variables, along with the evaluation of the high-pressure impact on the cycle efficiency parameters.

Author Contributions

Conceptualization, K.M.O., R.M.C., M.J.F.-T., J.A.C., M.A.S.S.R., L.V.P and C.B.B.C..; methodology, K.M.O.; formal analysis, K.M.O.; investigation, K.M.O.; writing—original draft preparation, K.M.O., L.V.P and C.B.B.C.; writing—review and editing, K.M.O., R.M.C., M.J.F.-T., J.A.C., M.A.S.S.R., L.V.P and C.B.B.C..; supervision, C.B.B.C..; project administration, C.B.B.C..; funding acquisition, C.B.B.C.. All authors have read and agreed to the published version of the manuscript.

Funding

This research was funded by National Council for Scientific and Technological Development – CNPq, grants number 131624/2023-7, 309026/2022-9, 406544/2023-9, and 307705/2025-0, the Coordenação de Aperfeiçoamento de Pessoal de Nível Superior – Brasil (CAPES) – Finance Code 001, and the Spanish “Ministerio de Ciencia e Innovación”, project PID2021-124139NB-C21..

Data Availability Statement

The original contributions presented in this study are included in the article. Further inquiries can be directed to the corresponding author.

Acknowledgments

The authors would like to thank Origem Energia and the National Council for Scientific and Technological Development – CNPq (processes 131624/2023-7, 309026/2022-9, 406544/2023-9, and 307705/2025-0) for the financial support. Also, this study was financed in part by the Coordenação de Aperfeiçoamento de Pessoal de Nível Superior – Brasil (CAPES) – Finance Code 001. Additionally, José A. Caballero and María J. Fernández-Torres gratefully acknowledge financial support from the Spanish “Ministerio de Ciencia e Innovación” under project PID2021-124139NB-C21.

Conflicts of Interest

The authors declare no conflicts of interest. The funders had no role in the design of the study; in the collection, analyses, or interpretation of data; in the writing of the manuscript; or in the decision to publish the results.

Abbreviations

The following abbreviations are used in this manuscript:
SEC Specific energy consumption
GHG Greenhouse gas
LHV Lower heating value
LNG Liquefied natural gas
PLH Precooled Linde-Hampson
SMR Single mixed refrigerant
DMR Dual mixed refrigerant
HEX Heat exchanger
JT Joule-Thompson
WMR Warm mixed refrigerant
CMR Cold mixed refrigerant
OPC Ortho-para conversion
MITA Minimum temperature approach
COP Coefficient of performance
FOM Figure of merit
FFH Fraction of the fuel heat

References

  1. Acar, C.; Dincer, I. Comparative Assessment of Hydrogen Production Methods from Renewable and Non-Renewable Sources. International Journal of Hydrogen Energy. January 2, 2014, pp 1–12. [CrossRef]
  2. Rand, D. A. J.; Dell, R. Hydrogen Energy: Challenges and Prospects; Royal Society of Chemistry, 2007. [CrossRef]
  3. Acar, C.; Dincer, I. Hydrogen Energy. In Comprehensive Energy Systems; Elsevier Inc., 2018; Vol. 1–5, pp 568–605. [CrossRef]
  4. Yan, F.; Geng, J.; Rong, G.; Sun, H.; Zhang, L.; Li, J. Optimization and Analysis of an Integrated Liquefaction Process for Hydrogen and Natural Gas Utilizing Mixed Refrigerant Pre-Cooling. Energies 2023, 16 (10). [CrossRef]
  5. Chen, H.; Cong, T. N.; Yang, W.; Tan, C.; Li, Y.; Ding, Y. Progress in Electrical Energy Storage System: A Critical Review. Progress in Natural Science. Science Press 2009, pp 291–312. [CrossRef]
  6. Chi, J.; Yu, H. Water Electrolysis Based on Renewable Energy for Hydrogen Production. Cuihua Xuebao/Chinese Journal of Catalysis. Science Press March 1, 2018, pp 390–394. [CrossRef]
  7. Sleiti, A. K.; Al-Ammari, W. A.; Ghani, S. Novel Dual-Mixed Refrigerant Precooling Process for High Capacity Hydrogen Liquefaction Plants with Superior Performance. J. Energy Storage 2023, 66. [CrossRef]
  8. Al Ghafri, S. Z.; Munro, S.; Cardella, U.; Funke, T.; Notardonato, W.; Trusler, J. P. M.; Leachman, J.; Span, R.; Kamiya, S.; Pearce, G.; Swanger, A.; Rodriguez, E. D.; Bajada, P.; Jiao, F.; Peng, K.; Siahvashi, A.; Johns, M. L.; May, E. F. Hydrogen Liquefaction: A Review of the Fundamental Physics, Engineering Practice and Future Opportunities. Energy and Environmental Science. Royal Society of Chemistry April 21, 2022, pp 2690–2731. [CrossRef]
  9. Morales-Ospino, R.; Celzard, A.; Fierro, V. Strategies to Recover and Minimize Boil-off Losses during Liquid Hydrogen Storage. Renew. Sustain. Energy Rev. 2023, 182, 113360. [CrossRef]
  10. Sherif, S. A.; Zeytinoglu, N.; Veziroglug, T. N. Liquid Hydrogen: Potential, Problems, and a Proposed Research Program; 1997; Vol. 22. [CrossRef]
  11. Schmauch, A. H.; Singleton, G. E. Technical Aspects of Ortho-Parahydrogen Conversion. Ind. Eng. Chem. 1964, 56 (5), 20–31. [CrossRef]
  12. Aasadnia, M.; Mehrpooya, M. Large-Scale Liquid Hydrogen Production Methods and Approaches: A Review. Applied Energy. Elsevier Ltd. February 15, 2018, pp 57–83. [CrossRef]
  13. Fradkov, A. B.; Troitskii, V. F. Liquefier with Two-Stage Conversion to Obtain 98 per Cent Parahydrogen. Cryogenics (Guildf). 1965, 5 (3). [CrossRef]
  14. Foerg, W. History of Cryogenics: The Epoch of the Pioneers from the Beginning to the Year 1911; 2002; Vol. 25. [CrossRef]
  15. Dewar J. Liquid Hydrogen. Science (80-. ). 1898, VIII (183), 3–6. [CrossRef]
  16. Krasae-in, S.; Stang, J. H.; Neksa, P. Development of Large-Scale Hydrogen Liquefaction Processes from 1898 to 2009. International Journal of Hydrogen Energy. May 2010, pp 4524–4533. [CrossRef]
  17. Nandi, T. K.; Sarangi, S. Performance and Optimization of Hydrogen Liquefaction Cycles; 1993; Vol. 18. [CrossRef]
  18. Mitsugi, C.; Harumit, A.; Kenzos, F. WE-NET: Japanese Hydrogen Program; 1998; Vol. 23. [CrossRef]
  19. Matsuda, H.; Nagami, M. Study of large hydrogen liquefaction process. Nippon Sanso Corp., Kawasaki-ku, Kawasaki-city, Kanagawa. WE-NET: summary of annual reports. https://www.enaa.or.jp/WE-NET/ronbun/1997/e5/sanso1997.html (accessed 2024-04-29).
  20. Quack, H. Conceptual Design of a High Efficiency Large Capacity Hydrogen Liquefier; AIP Publishing, 2003; pp 255–263. [CrossRef]
  21. Valenti, G.; Macchi, E. Proposal of an Innovative, High-Efficiency, Large-Scale Hydrogen Liquefier. Int. J. Hydrogen Energy 2008, 33 (12), 3116–3121. [CrossRef]
  22. Sadaghiani, M. S.; Mehrpooya, M. Introducing and Energy Analysis of a Novel Cryogenic Hydrogen Liquefaction Process Configuration. Int. J. Hydrogen Energy 2017, 42 (9), 6033–6050. [CrossRef]
  23. Peschka W. Liquid Hydrogen: Fuel of the Future; Springer-Verlag/Wien, 1992. [CrossRef]
  24. Barron, R. F. Liquefaction Cycles for Cryogens. In Advances in Cryogenic Engineering; Springer US, 1972; Vol. 17. [CrossRef]
  25. Yang, J.; Li, Y.; Tan, H. Study on Performance Comparison of Two Hydrogen Liquefaction Processes Based on the Claude Cycle and the Brayton Refrigeration Cycle. Processes 2023, 11, 932. [CrossRef]
  26. Barron, R. F. Cryogenic Systems, 2nd ed.; Oxford University Press: New York, 1985.
  27. Essler, J.; Haberstroh, C.; Quack, H.; Walnum, H. T.; Berstad, D.; Nekså, P.; Stang, J.; Börsch, M.; Holdener, F.; Decker, L.; Treite, P. Report on Technology Overview and Barriers to Energy-and Cost-Efficient Large Scale Hydrogen Liquefaction. Integr. Des. Demonstr. Effic. Liq. Hydrog. 2012.
  28. Qyyum, M. A.; Duong, P. L. T.; Minh, L. Q.; Lee, S.; Lee, M. Dual Mixed Refrigerant LNG Process: Uncertainty Quantification and Dimensional Reduction Sensitivity Analysis. Appl. Energy 2019, 250, 1446–1456. [CrossRef]
Figure 1. Flowsheet of the analyzed cycles: (A) Claude Cycle; (B) Precooled Linde-Hampson system; (C) single-mixed refrigerant precooling system; and (D) dual-mixed refrigerant precooling system.
Preprints 173393 g001
Figure 2. SEC, COP, liquefied fraction, and FOM for (A) Claude cycle, (B) PLH, (C) SMR, and (D) DMR.
Preprints 173393 g002
Figure 3. SEC and FFH for all cycles.
Preprints 173393 g003
Figure 4. Refrigerant demand for the pre-cooled cycles.
Preprints 173393 g004
Figure 5. Exergy destruction in each cycle.
Preprints 173393 g005
Figure 6. Exergy destruction distribution per piece of equipment for (A) Claude cycle, (B) PLH, (C) SMR, and (D) DMR.
Preprints 173393 g006
Figure 7. Composite curves for (a) HEX-B1 in the PLH cycle and (b) HEX-C1 in the SMR cycle for both cycles’ high pressure at 94 bar.
Preprints 173393 g007
Table 1. Feed and equipment design specification.
Parameter Value
Hydrogen feed to the compressor train [kg/h] 100
Hydrogen feed temperature [K] 298
Hydrogen feed pressure [bar] 1.0
Liquid hydrogen pressure [bar] 1.0
Number of stages in hydrogen compression train 4
Intercooler temperature [K] 298
Compressors and expanders isentropic efficiency [%] 85
Pressure drops (overall) 0
Multi-stream heat exchanger minimum approach temperature [K] 2.0
Table 2. Refrigerant cycle specifications.
Parameter PLH SMR DMR
WMR CMR
High pressure [bar] 200 30.0 10.0
Low pressure [bar] 0.1 0.1 1.0
Number of compression stages 5 3 3
Composition [%]
nitrogen 100.00 54.55 0.00
methane 0.00 9.09 20.00
ethane 0.00 9.09 20.00
propane 0.00 9.09 20.00
i-butane 0.00 9.09 20.00
n-butane 0.00 9.09 20.00
Table 2. Exergy balance equation for each piece of equipment [7,25].
Piece of equipment Exergy balance
Heat exchangers, coolers, mixers, splitters, valves, separators, and OPC I ˙ = i = 1 n E ˙ i j = 1 m E ˙ j (7)
Expanders I ˙ = E ˙ i n E ˙ o u t W ˙ e x p (8)
Compressors I ˙ = E ˙ i n E ˙ o u t + W ˙ c o m p (9)
Total I ˙ = E ˙ i n E ˙ o u t + W ˙ (10)
Disclaimer/Publisher’s Note: The statements, opinions and data contained in all publications are solely those of the individual author(s) and contributor(s) and not of MDPI and/or the editor(s). MDPI and/or the editor(s) disclaim responsibility for any injury to people or property resulting from any ideas, methods, instructions or products referred to in the content.
Copyright: This open access article is published under a Creative Commons CC BY 4.0 license, which permit the free download, distribution, and reuse, provided that the author and preprint are cited in any reuse.
Prerpints.org logo

Preprints.org is a free preprint server supported by MDPI in Basel, Switzerland.

Subscribe

Disclaimer

Terms of Use

Privacy Policy

Privacy Settings

© 2025 MDPI (Basel, Switzerland) unless otherwise stated