1. Introduction
During the initial stages of plant development, low physiological vigor can significantly compromise photosynthetic efficiency and nitrogen assimilation, processes that are essential for the growth and productivity of horticultural crops such as
Capsicum annuum L. [
1,
2]. These processes are closely related, as more than 50% of leaf nitrogen is used for proteins involved in photosynthesis, including the enzyme Rubisco, whose efficient functioning is vital for CO
2 carboxylation and RuBP regeneration [
3,
4].
In turn, the enzyme nitrate reductase (NR) is an early physiological marker of nitrogen nutritional status, participating in the reduction of NO
3− to NO
2−, a critical step for the subsequent synthesis of amino acids and functional proteins [
5,
6]. Limitations in nitrogen availability or internal metabolism lead to a drop in photosynthetic efficiency and Rubisco activity, limiting growth even under optimal irrigation and light conditions [
7].
From a global agronomic perspective, chili pepper
C. annuum L. is one of the world’s most economically and agriculturally important vegetables, not only for its wide cultivation area but also for its high commercial value and contribution to food security [
8]. Beyond its nutritional relevance,
C. annuum L. represents a major crop in both fresh consumption and industrial processing, underpinning agricultural economies in many regions worldwide [
9,
10]. Nevertheless, its productivity is frequently constrained by abiotic stresses, particularly drought and nutrient limitations, which hinder seedling establishment and crop vigor [
11,
12]. Strengthening the physiological base of seedlings is, therefore, a strategic approach to enhance field performance and ensure sustainable yields [
13].
To address these limitations, nanopriming has emerged as a promising tool. This technique consists of treating seeds with metal or metalloid NPs (such as ZnO, SiO
2, and ZnMo), which have high bioavailability and surface reactivity, thereby improving water absorption, activating antioxidant pathways, inducing the expression of functional genes, and modulating energy metabolism from early stages [
14,
15]. Nanopriming with ZnO has been effective in improving Rubisco enzyme activity, chlorophyll content, and photosynthetic efficiency under stress and normal conditions [
1,
16]. SiO
2 NPs have been shown to improve water retention capacity and nitrogen assimilation, as well as drought resistance [
17,
18]. In addition, combinations such as ZnMo have been associated with increased nitrate reductase enzyme activity and better metabolic integration between photosynthesis and nitrogen nutrition [
19]. However, most of this research has been conducted on cereals, legumes, or model species. Few studies have comprehensively evaluated these effects on jalapeño pepper seedlings, representing a gap in applied physiological knowledge.
Based on this background, the hypothesis of the present study was that nanopriming with ZnO, SiO2, and ZnMo can improve physiological indicators such as photosynthetic efficiency, chlorophyll biosynthesis, and nitrate reductase activity in jalapeño pepper seedlings, thereby enhancing seedling vigor and functional establishment compared to conventional biostimulants or untreated controls.
Therefore, the objective of this research was to evaluate the effect of nanopriming with ZnO, SiO2, and ZnMo, as well as commercial biostimulants, on key indicators of physiological performance in C. annuum L., promoting a more vigorous and functional early establishment of the crop.
2. Materials and Methods
2.1. Experimental Site and Plant Material
The experiment was carried out during January-April 2025 at the Center for Food and Development Research A.C. (CIAD) (Delicias, Chihuahua, Mexico). The commercial variety Imperial F1 of jalapeño pepper seeds (
C. annuum L.), originally from China, was used. This variety is characterized by being a hybrid seed with high vigor and uniformity, designed for intensive production systems with high fruit demand. The surface of the seeds was sterilized with a 4% sodium hypochlorite (NaClO) solution, under constant agitation for five minutes; they were then washed three times with distilled water [
20].
2.2. Characterization of Zinc Oxide, Silicon Dioxide NPs
The zinc oxide (ZnO) and silicon dioxide (SiO
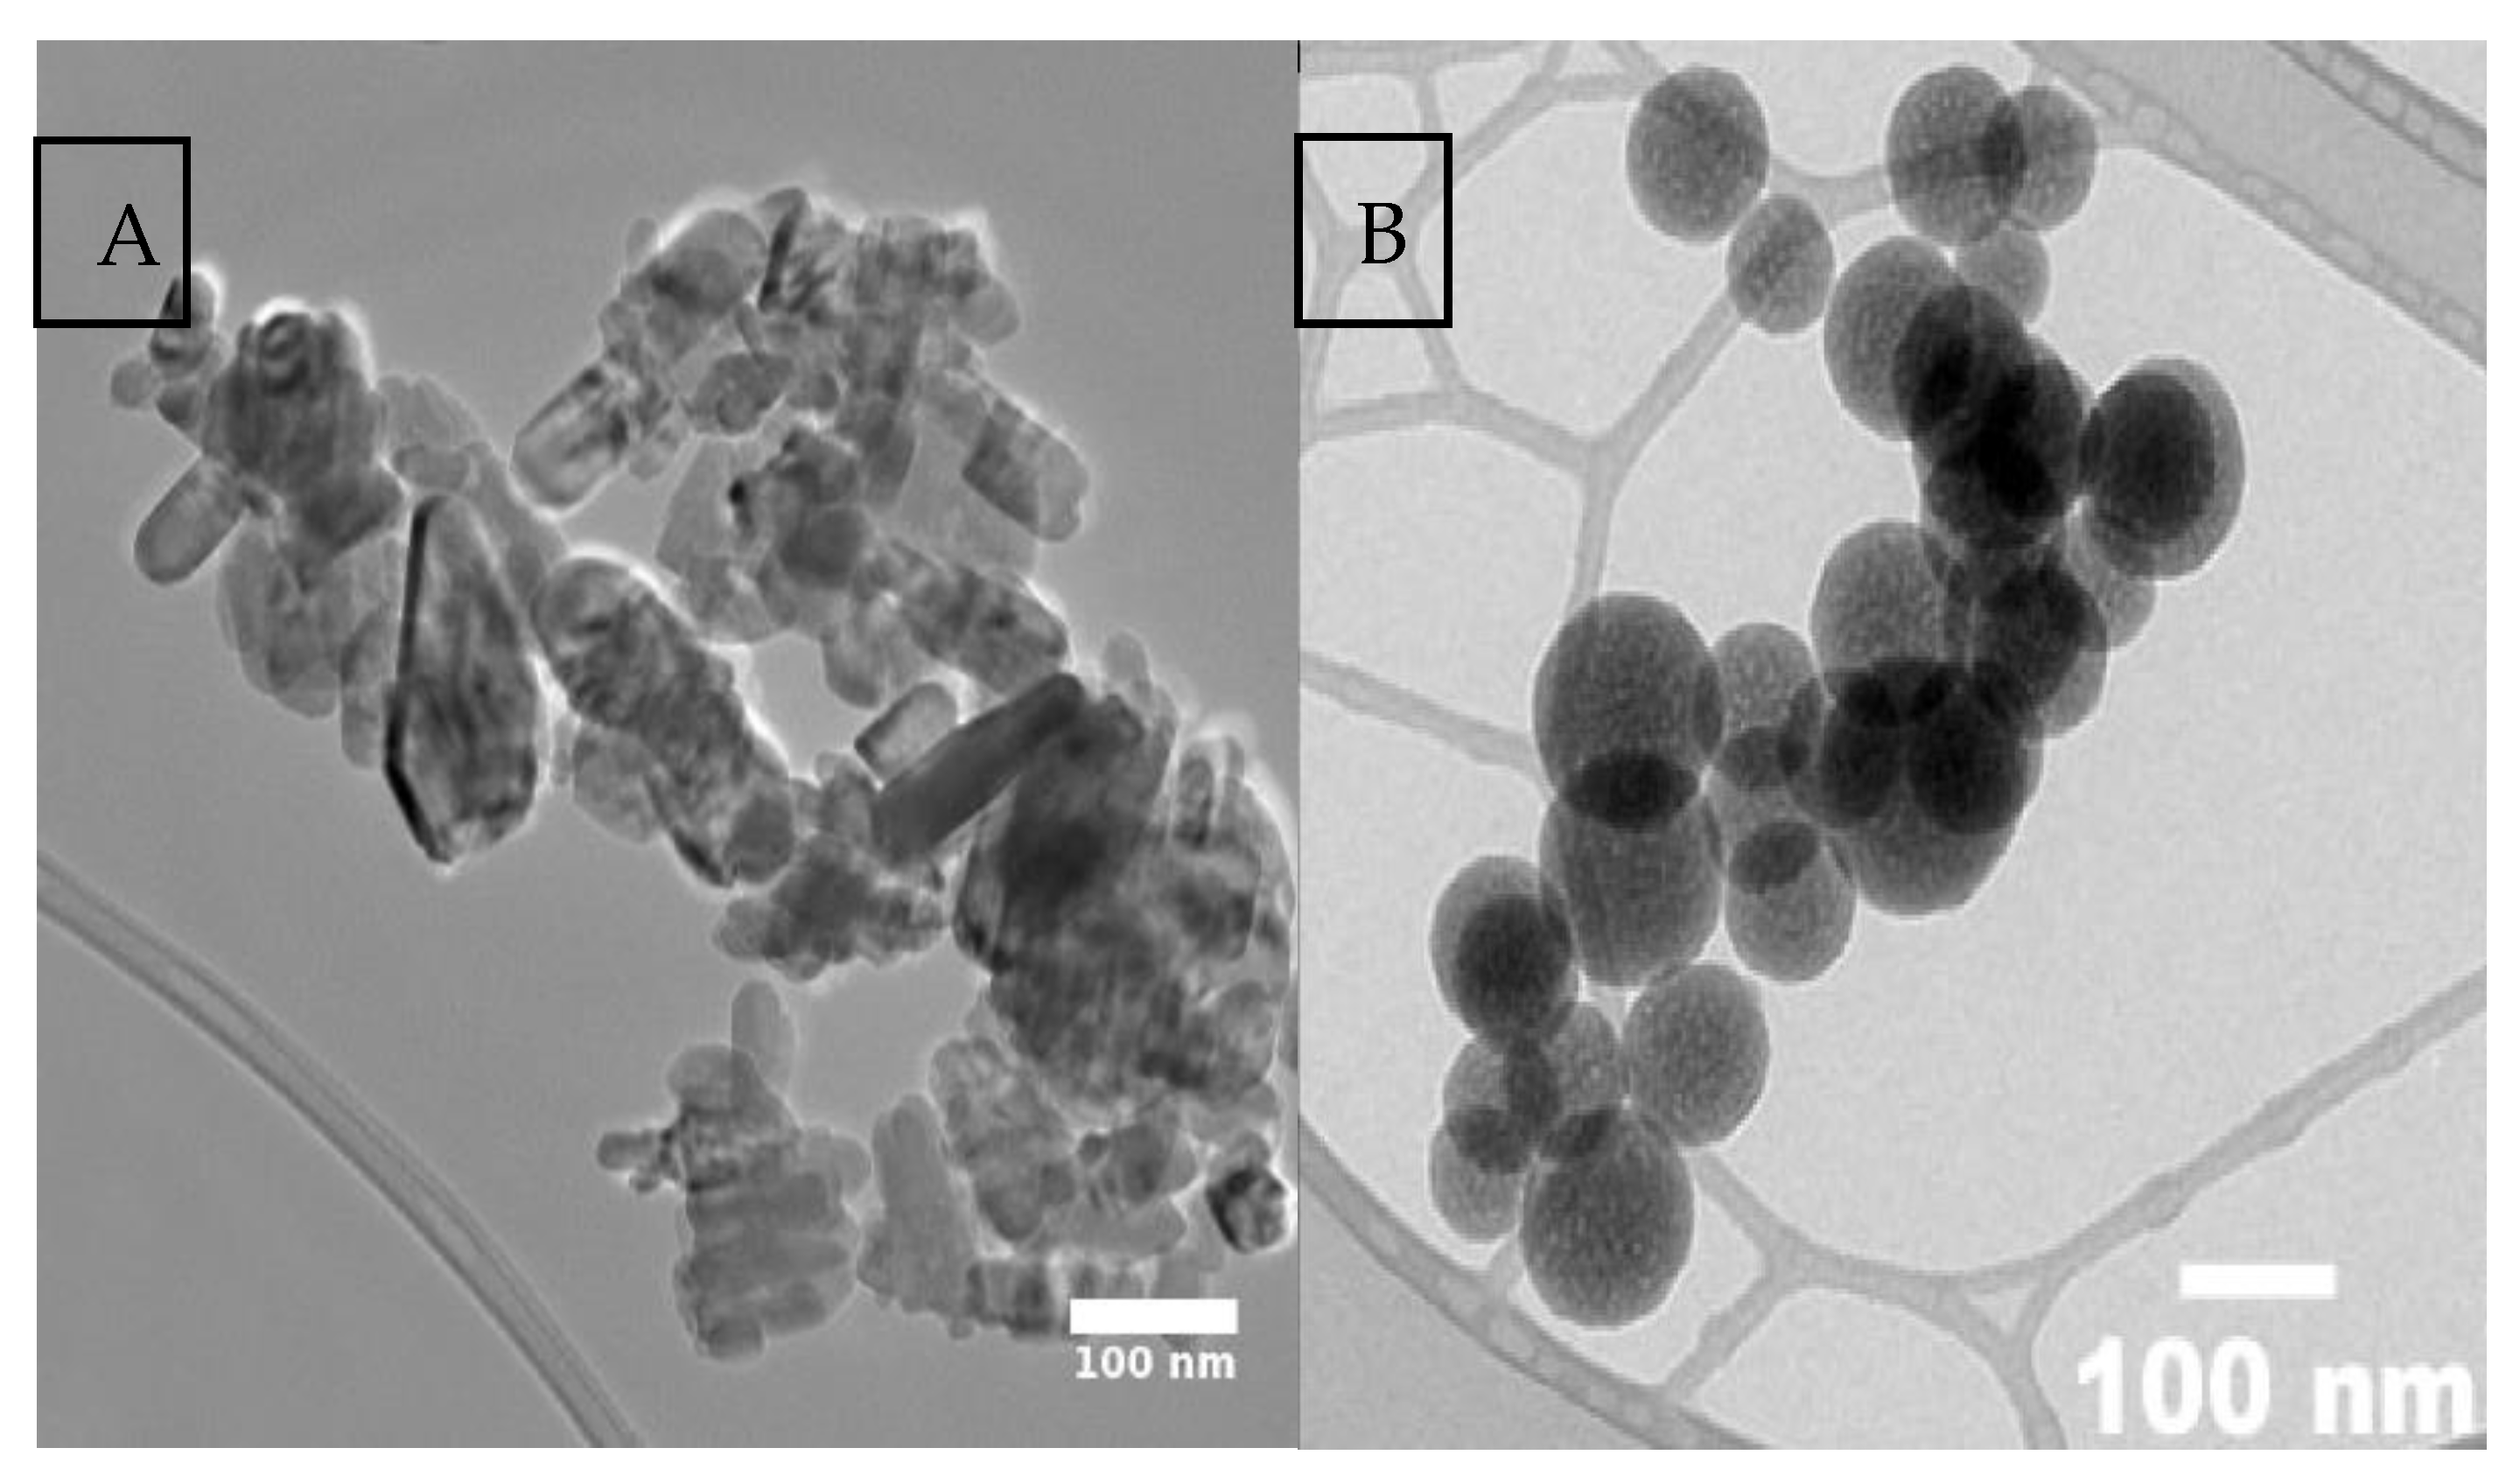
2) nanoparticles (NPs) used in this study were purchased from the company Investigación y Desarrollo de Nanomateriales S.A. de C.V., located in San Luis Potosí, Mexico. According to the supplier, ZnO NPs presented a wurtzite-type crystalline structure with 99.7% purity and an average particle size of 50 nm, while SiO
2 NPs had a purity of 99.9%, a fine light-colored powder appearance, and an average size of 80 nm. Both types of NPs were structurally and morphologically characterized by transmission electron microscopy (TEM) (
Figure 1), which confirmed their homogeneity and stability.
In addition, the commercial nanofertilizer BROADACRE® ZnMo (Agrichem Fluagri, Guadalajara, Jalisco, Mexico) was used. Its composition includes 62% Zn, 5% Mo, and 5% of a seaweed extract-based chelating agent designed to prevent precipitation of the formulation in suspension. According to manufacturer specifications, the average particle size is 200 nm.
2.3. Nanopriming Treatments
A detailed description of the treatments and concentrations used is presented in
Table 1. In all treatments, triple-distilled water was used as the solvent and chitosan (Ch) (Quitofyt
® Poly-D-glucosamine) as the stabilizing agent in the formulations with ZnO, SiO
2 and ZnO + SiO
2 (NPs), prepared in a final volume of 1 L per treatment.
To ensure adequate dispersion and homogenization of the NPs, two consecutive stages were applied. In the first stage, a premix was prepared by magnetic stirring using a VMS-C7 Advanced plate (VWR
®, Radnor, PA, USA) at 700 rpm for 20 min. In the second stage, ultrasound was applied at 40 kHz for 30 min using a Vevor
® ultrasonic cleaner (Ultrasonic Cleaner, Cleveland, OH, USA), with the aim of improving the colloidal stability of the suspensions [
21].
2.4. Experimental Design
A completely randomized design was used with eight treatments, three replicates, and 100 seeds per treatment. Seed priming was performed by imbibition, where 100 seeds were immersed in 30 mL of the respective treatment solution described in
Section 2.3, for 24 h under darkness at a temperature of 25 ± 1 °C. After the priming period, seeds were removed, gently dried, and rinsed with triple-distilled water before subsequent evaluation.
2.5. Crop Management
After drying at room temperature for 24 h, the seeds were sown in polystyrene trays with 338 cavities each, using a substrate mixture in a 1:1:1 (v/v/v) ratio of vermiculite, perlite, and sphagnum peat moss (Premier® Sphagnum Peat Moss), previously moistened with distilled water. The seeds were sown at a depth of 3 mm. The trays were then placed under controlled germination conditions for 7 days in total darkness at a temperature of 25–30°C and relative humidity of 60–80%. After this period, the seedlings were transferred to a greenhouse under controlled conditions of 12–33°C and 30–45% relative humidity.
During the leaf development phase (days 1–30), automated foliar fertilization was applied with a volume of 500 mL of nutrient solution per tray, directly onto the foliage. The formulation of this solution was designed using NutriNet
® Haifa Group software [
22] and consisted of commercial fertilizers from the Haifa brand: 6 mM total nitrogen (from Haifa Poly-Feed 17-10-27+ME), 1.6 mM phosphorus, 0.3 mM additional potassium, 4 mM calcium (Haifa Cal GG), and 1.4 mM magnesium (Haifa Mag). Chelated micronutrients were also added: 5 µM iron (Haifa Micro Fe 13%), 2 µM manganese (Haifa Micro Mn 13%), 0.25 µM copper (Haifa Micro Cu 15%), 0.3 µM molybdenum, and 0.5 µM boron. This solution was applied at three-day intervals during the first 30 days of vegetative development.
2.6. Plant Sampling
After 30 days of cultivation, 10 jalapeño pepper seedlings were randomly selected per treatment for subsequent physiological and biochemical analysis. The samples were carefully washed three times with distilled water, followed by an additional wash with a 1% solution of nonionic detergent to remove surface residues and ensure the cleanliness of the plant tissue prior to analysis [
23].
2.7. Plant Analysis
2.7.1. Morphological Parameters
Morphological variables were evaluated on day 31 after sowing. Ten seedlings were selected per treatment, and the following variables were measured: root length, stem length, number of leaves, and stem diameter, expressed in millimeters (mm). Length and thickness measurements were made using a 153 mm digital caliper (model HER-411; Steren
®, Mexico City, Mexico) [
24]. Root length was determined from the base of the hypocotyl to the apex of the radicle, while stem length was measured from the radicle-hypocotyl junction to the base of the cotyledons.
The fresh weight of the root system, the aerial part, and the entire seedling was quantified using a high-precision analytical balance (model HR-120-C; A&D Weighing®, San José, CA, USA). From these measurements, the total fresh biomass per seedling was calculated, expressed in grams per plant (g plant−1).
2.7.2. Photosynthetic Pigments
The assay was performed in triplicate, using 10 fresh leaf discs 7 mm in diameter obtained from photosynthetic tissue without physical damage or the presence of central veins. The discs were placed in glass test tubes, to which 10 mL of 99% methanol (v/v) was added as an extraction agent. The openings of the tubes were sealed with Parafilm®, and the samples were left to rest for 24 h in complete darkness at a constant temperature of 25 ± 1 °C.
The photosynthetic pigments were quantified according to the methodology described by Wellburn [
25], using a UV-VIS spectrophotometer model 10S (Thermo Fisher Scientific, Madison, WI, USA).
Absorbance (A) readings were taken at 666 nm, 653 nm, and 470 nm, corresponding to the specific wavelengths for chlorophyll a (chl a), chlorophyll b (chl b), and carotenoids, respectively. The results were expressed in milligrams per gram of fresh weight (mg g
−1 FW). Pigment concentrations were calculated using the following equations:
2.7.3. Chlorophyll Index
The relative chlorophyll content was determined using the SPAD (Soil Plant Analysis Development) index, using a portable SPAD-502 chlorophyll meter (Konica Minolta Sensing, Inc., Osaka, Japan). This instrument allows non-destructive measurements of leaf greenness, which is considered an indirect indicator of chlorophyll content [
26,
27]. For each experimental unit, five fully expanded leaves per plant were selected, without physical damage or the presence of midribs, and five random readings were taken per plant during hours of high light radiation in order to standardize the evaluation conditions.
The results were expressed in SPAD units. The measurement was carried out 31 days after sowing, specifically on April 2, 2025.
2.7.4. Nitrate Reductase Activity “In Vivo”
The “in vivo” activity of the nitrate reductase enzyme (NR, EC 1.7.1.1) was quantified following the methodology described by Sánchez [
28]. Leaf segments (0.5 g) of 7 mm in length, free from physical damage and central veins, were placed in test tubes containing 10 mL of incubation solution composed of 100 mM potassium phosphate buffer (pH 7.5) and 1% (v/v) propanol as a permeabilizing agent. To differentiate between endogenous and induced NR activity, two types of incubation media were used: for the induced activity, the solution was supplemented with 50 mM potassium nitrate (KNO
3); for the endogenous activity, no nitrate was added. Both sets of samples were infiltrated at a controlled pressure of 0.8 bar and incubated at 30°C in complete darkness for 1 h to promote nitrite accumulation mediated by enzymatic activity.
To stop the reaction, the tubes were placed in a water bath at 100°C for 20 min. Subsequently, 1 mL of the reaction medium was extracted and sequentially mixed with 2 mL of a 1% (w/v) solution of sulfanilamide in 1 M HCl and 2 mL of a 0.02% (w/v) solution of N-naphthylethylenediamine dihydrochloride (NED) in 0.2 M HCl. The formation of the colored azoic complex allowed the quantification of the accumulated nitrite (NO2−) by spectrophotometry at 540 nm, using a standard nitrite curve as a reference.
2.8. Pearson Correlation Heatmap
To evaluate the relationships between physiological and biochemical variables, a Pearson correlation matrix was developed using the averages per treatment. The results were represented graphically using a heatmap generated in Python (v 3.11), where the intensity and direction of the correlations were expressed using a color scale. Correlation values close to +1 indicate a strong positive association, while values close to -1 reflect a strong negative correlation. Correlations close to 0 are interpreted as weak or non-existent, allowing the identification of functional or independent relationships between the variables evaluated [
29].
2.9. Principal Component Analysis (PCA)
To identify multivariate variation patterns and reduce the dimensionality of the dataset, Principal Component Analysis (PCA) was applied. This analysis allowed the original variables to be transformed into a new set of orthogonal variables (principal components) that capture as much variance as possible from the system [
30]. The results were visualized using a two-dimensional scatter plot, where the samples were projected onto the first two principal components, facilitating the identification of clusters and trends inherent to the treatments evaluated. This procedure was implemented using the Python programming language (v 3.11).
2.10. Radar Chart: Multivariate Comparison by Priming Treatment
To compare multiple physiological and biochemical variables simultaneously between the treatments evaluated, a Radar Chart (also known as a spider chart or star chart) was used. This type of visualization allows multivariate data to be represented in a two-dimensional space, where each radial axis corresponds to a different variable. The magnitudes of the variables are projected from a central point toward the periphery and connecting the points corresponding to a treatment forms a polygon that facilitates visual comparison between treatments.
The Radar Chart was implemented using the Python programming language (v 3.11), which allowed for a clear and effective representation of the differences and similarities between treatments based on the measured variables [
31].
2.11. Statistical Analysis
Statistical analysis was performed using analysis of variance (ANOVA), followed by Fisher’s LSD test for comparison of means (p ≤ 0.05), using SAS
® statistical software version 9.0 to validate significant differences between treatments [
32]. In addition, multivariate analysis tools were applied, such as Principal Component Analysis (PCA), Pearson correlation matrices, and Radar Charts, whose detailed methodological description is presented in the previous sections.
3. Results and Disscusion
3.1. Morphological Parameters
3.1.1. Stem Length
Stem elongation is a critical morphological parameter, as it determines the initial architecture of the seedling, its light interception capacity, and stability during transplanting. An excessively long stem can result in weak and etiolated plants, while moderate development favors mechanical resistance and acclimatization under field conditions [
33].
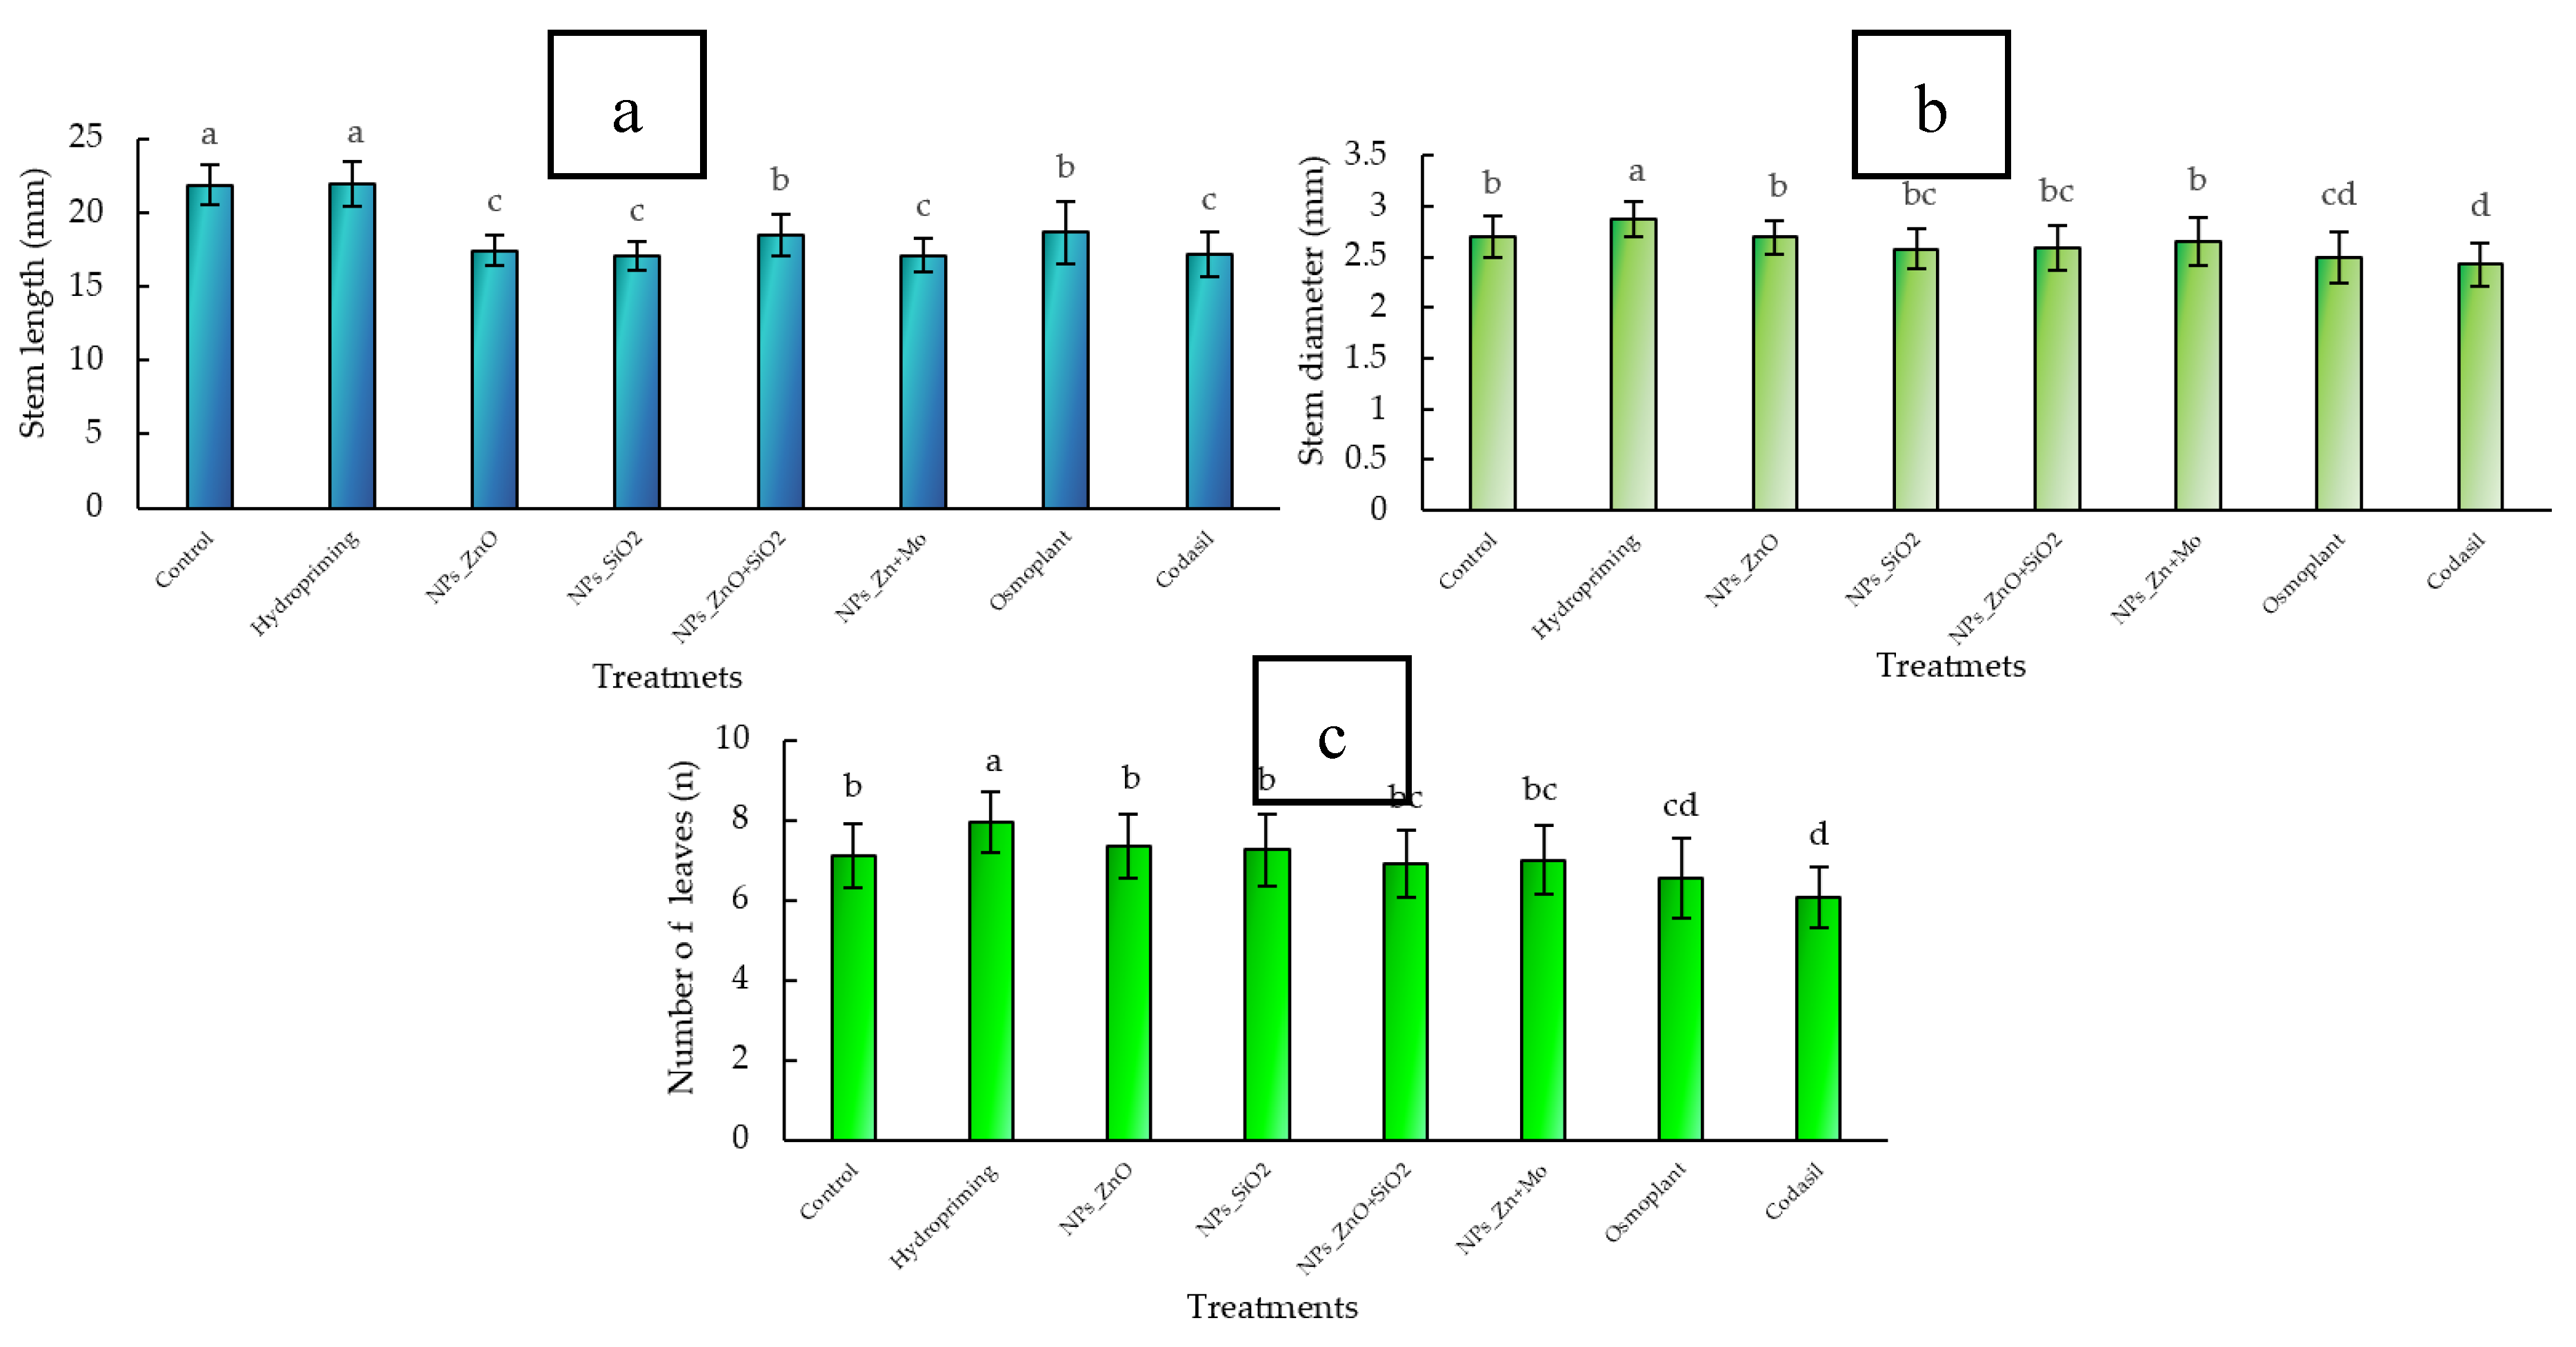
In this study, significant differences (
p ≤ 0.05) were observed between treatments. The control showed the longest stem length (22.4 ± 1.2 mm), closely followed by hydropriming (21.8 ± 1.0 mm), with a reduction of 2.7%. The treatments with ZnO+SiO
2 NPs (19.1 ± 0.9 mm), ZnMo (18.5 ± 1.1 mm), and Osmoplant (19.3 ± 0.8 mm) showed reductions of 14.7%, 17.4%, and 13.8%, respectively. ZnO NPs (17.1 ± 0.7 mm), SiO
2 NPs (16.8 ± 0.8 mm) and Codasil (17.0 ± 0.6 mm) recorded the shortest lengths, with decreases of 23.7%, 25.0% and 24.1% (
Figure 2 a).
Hydropriming maintains stem elongation similar to the control; in contrast, treatments with nanoparticles promote more compact seedlings, a characteristic associated with higher survival during acclimatization and lower post-transplant mortality [
34].
In agreement, Gallegos-Cedillo et al. [
35] reported that morphological parameters such as height are part of predictive indices of plant quality (such as the Dickson Quality Index), and that a balanced architecture is key to field performance. Similarly, Tatari et al. [
34] demonstrated that more compact seedlings with balanced aerial and root structure ratios improve tolerance under drought conditions. These findings are consistent with our findings in
C. annuum L.
Our study provides evidence that the use of ZnO, SiO2, and ZnMo in nanopriming favorably modulates the architecture of C. annuum L. seedlings, promoting a more compact morphological design that can improve structural robustness without compromising initial growth.
3.1.2. Stem Diameter
Stem diameter is a fundamental morphological parameter, as it reflects the seedling’s support capacity, water and nutrient conduction potential, and biomass allocation to support structures. It is also linked to survival and field performance after transplanting [
36,
37].
In our study, significant differences (
p ≤ 0.05) were observed between treatments. Hydropriming had the largest diameter (3.1 ± 0.1 mm). Compared to this value, Control and ZnO NPs reached 2.9 ± 0.1 mm (−6.5%), SiO
2 NPs 2.7 ± 0.1 mm (−12.9%), ZnO+SiO
2 NPs 2.8 ± 0.1 mm (−9.7%), ZnMo 2.9 ± 0.1 mm (−6.5 %), while the bioproducts Osmoplant (2.6 ± 0.1 mm; −16.1 %) and Codasil (2.5 ± 0.1 mm; −19.4 %) showed the lowest values (
Figure 2 b).
These results show that hydropriming favors radial stem expansion, while treatments with nanoparticles maintain adequate diameters within a more compact profile. Although there are moderate reductions compared to the maximum, this behavior does not compromise structural integrity and is complemented by advantages in other physiological parameters.
The literature confirms that stem diameter, together with height and biomass, are robust predictors of seedling quality and field performance. In woody species, a larger initial diameter has been shown to translate into higher survival and growth after transplanting [
35,
36,
37], and recent analyses highlight the value of these agronomic attributes as performance indicators [
33].
Our study demonstrates that in C. annuum L, hydropriming optimizes stem diameter, while nanopriming allows for the maintenance of functionally robust stems within a more compact design, offering alternatives for adjusting seedling production according to the objective: maximum thickening or greater structural resilience.
3.1.3. Number of Leaves
The number of leaves is a decisive morphological trait because it determines the available photosynthetic surface area, regulates light and CO
2 capture, and defines the capacity for biomass accumulation in early stages of development. In addition, it has been documented that a higher number of functional leaves is related to better establishment after transplanting and greater physiological efficiency in the field [
38].
In this study, significant differences (
p ≤ 0.05) were observed between treatments. The highest value was recorded in Hydropriming (9.1 ± 0.4 leaves). In comparison, the Control, ZnO NPs, and SiO
2 NPs had values of 8.3 ± 0.3, 8.5 ± 0.3, and 8.0 ± 0.3 leaves, respectively, with reductions of 8.8%, 6.6%, and 12.1%. Treatment with ZnO+SiO
2 NPs and ZnMo showed an average of 7.9 ± 0.3 leaves (−13.2%). Finally, Osmoplant (7.5 ± 0.3) and Codasil (7.0 ± 0.3) showed the lowest values, with reductions of 17.6% and 23.1% compared to Hydropriming (
Figure 2 c).
Our results demonstrate that Hydropriming optimizes leaf production, while treatments with nanoparticles maintain a functional leaf number comparable to the control, albeit with moderate reductions. This is relevant because it ensures an adequate photosynthetic surface area without compromising the compact architecture provided by nanoparticles.
The literature supports these findings. Chen et al. [
38] demonstrated that leaf number and quality in strawberry seedlings can be improved through physiological adjustments that increase photosynthetic capacity and survival after transplanting. Similarly, Leskovar and Othman [
39] found that leaf development influences root dynamics, yield, and quality of the transplanted crop in artichokes. Furthermore, previous studies highlight that a higher number of functional leaves in combination with a robust stem predicts better adaptation and productivity in the field [
40].
Our study provides evidence that hydropriming promotes a greater number of leaves, while nanopriming offers more compact seedlings but with sufficient leaf area, establishing a balance between structural compactness and photosynthetic capacity in C. annuum L.
3.2. Biomass
3.2.1. Total Fresh Weight
Total fresh biomass is a comprehensive indicator of seedling vitality and physiological quality, as it reflects photosynthetic efficiency, water storage capacity, and balanced biomass distribution between aerial and root organs. This parameter has been widely used as a predictor of field performance, as it correlates with establishment capacity and subsequent agricultural yield [
33].
In our study, significant differences (
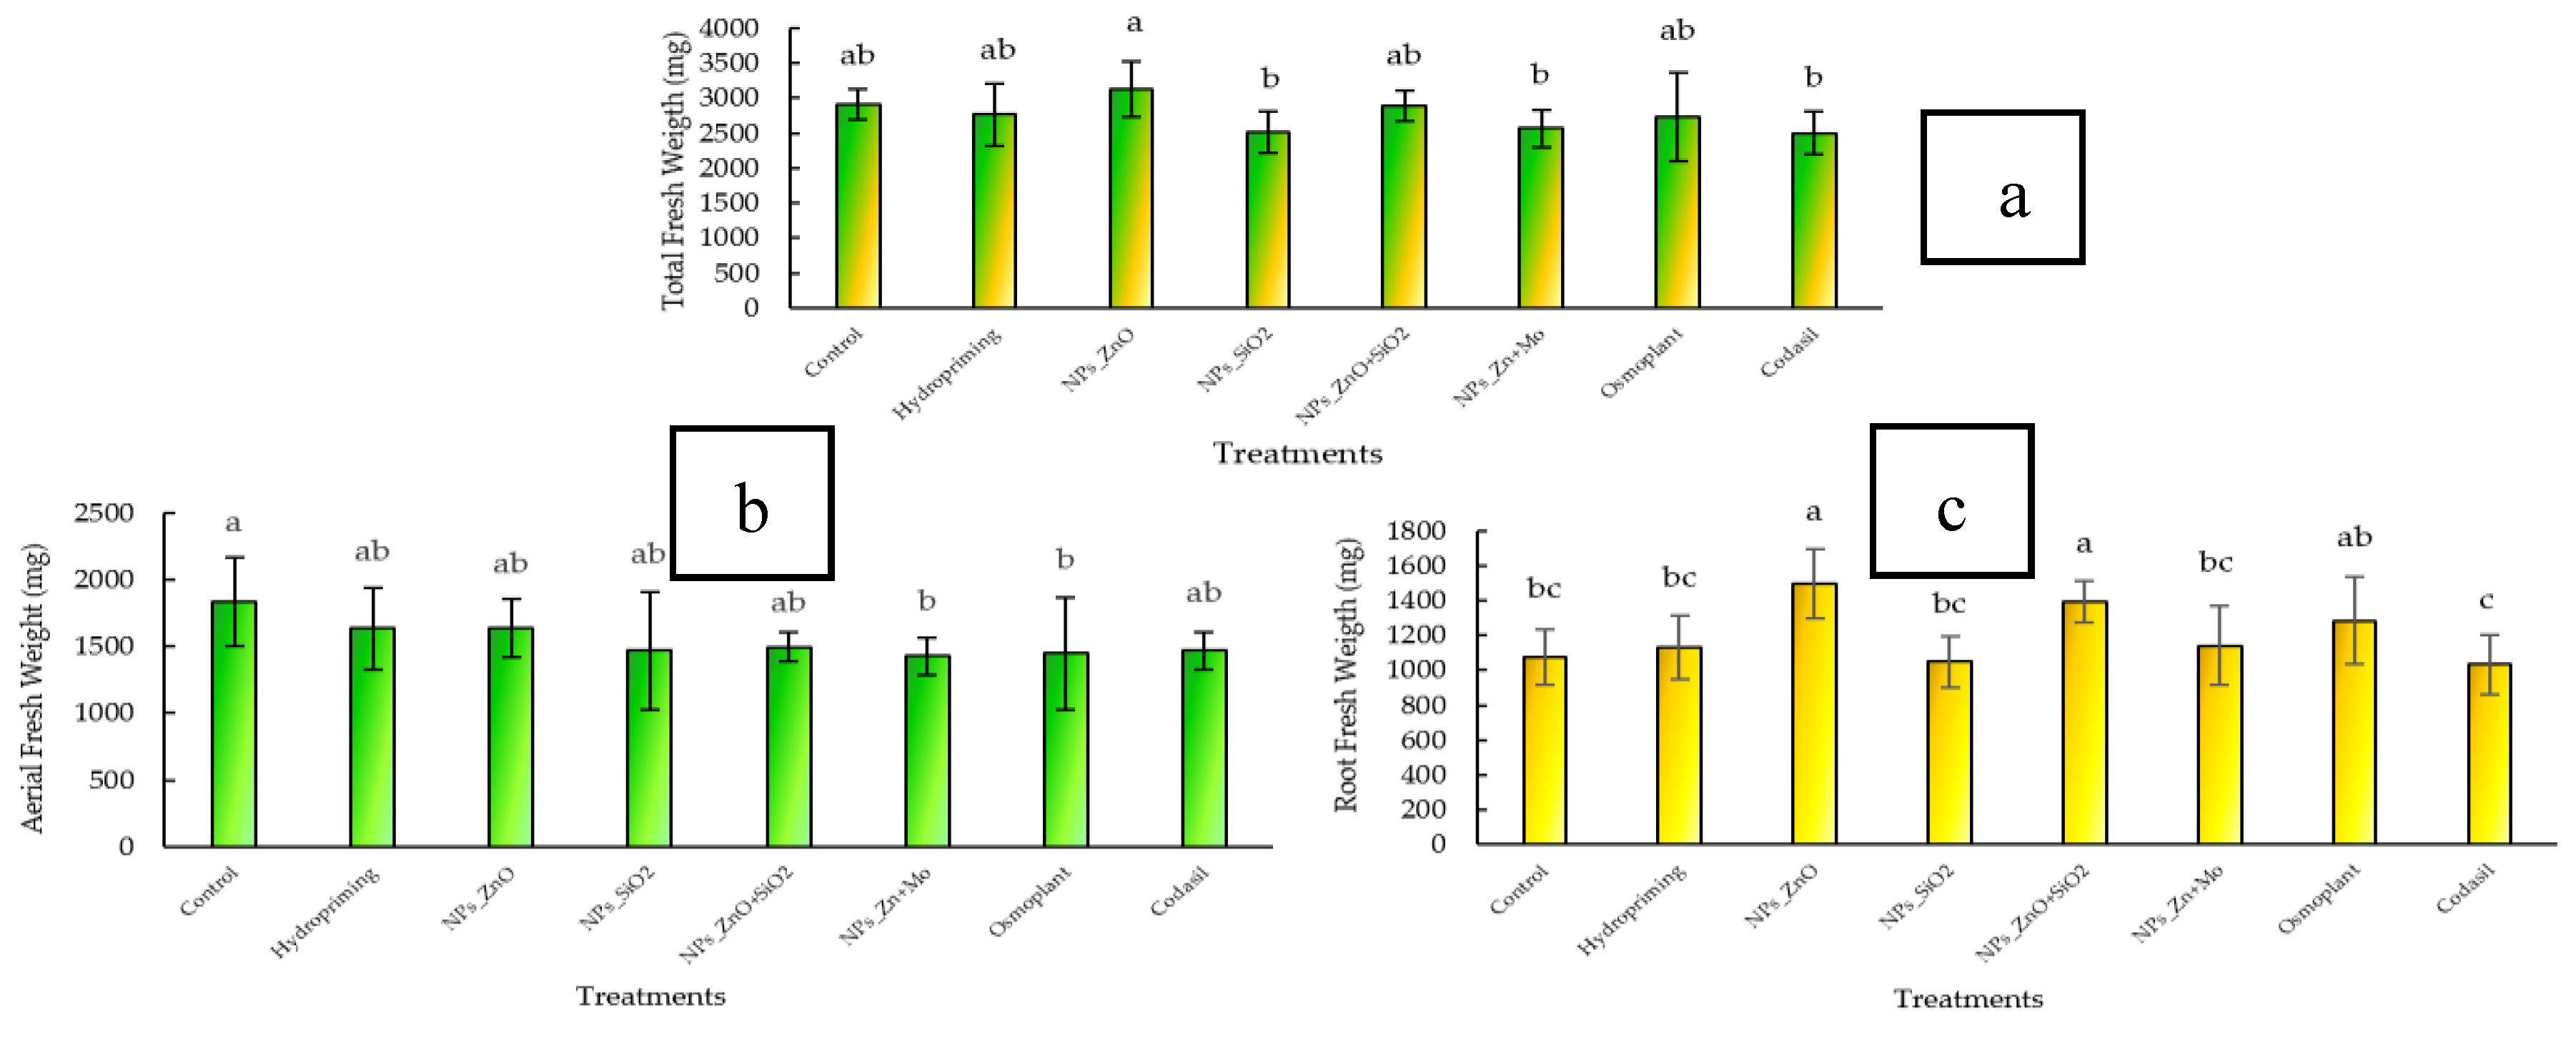
p ≤ 0.05) were observed between treatments. The highest value was recorded in ZnO NPs (3450 ± 95 mg), with an increase of 10.3% compared to the control (3126 ± 88 mg). This was followed by ZnO+SiO
2 NPs (3310 ± 84 mg; +5.9%) and ZnMo (3258 ± 80 mg; +4.2%). Treatment with Hydropriming (3189 ± 86 mg) showed a similar value to the control (+2.0%). In contrast, the lowest values corresponded to Osmoplant (2982 ± 81 mg; −4.6%) and Codasil (2894 ± 79 mg; −7.4%) (
Figure 3 a).
These results demonstrate that treatments with nanoparticles, especially ZnO, promoted greater accumulation of total fresh biomass, suggesting a positive effect on photosynthetic efficiency and water absorption. The biostimulants Osmoplant and Codasil, on the other hand, showed less favorable effects on total biomass accumulation.
Previous studies have indicated that fresh and dry biomass are robust variables for predicting field establishment potential. Karwat et al. [
41] highlighted that biomass accumulation is directly related to the enzymatic activity associated with nitrogen metabolism, while Oliveira Ferreira [
42] reported that enzymes such as nitrate reductase and glutamine synthetase are reliable indicators of nutritional status and vigor in forest seedlings. In addition, it has been documented that an increase in total biomass allows for better acclimatization under saline or nutritional stress conditions, reinforcing its usefulness as a physiological quality parameter [
43,
44,
45].
Our study provides evidence that nanopriming, particularly with ZnO and ZnO+SiO2, improves total fresh biomass accumulation in C. annuum L seedlings, suggesting greater physiological and agronomic potential for successful transplanting and field productivity.
3.2.2. Aerial Fresh Weight
Fresh above-ground biomass is a key indicator of photosynthetic potential and reserve accumulation in the upper organs of the seedling. Higher above-ground biomass reflects better leaf and stem development, which increases light capture and photoassimilate production, essential for initial growth and survival after transplanting [
46].
In this study, significant differences (
p ≤ 0.05) were observed between treatments. The control recorded the highest fresh aboveground biomass value (1980 ± 70 mg), followed by Hydropriming (1896 ± 66 mg; −4.2 % compared to the control). The treatments with ZnO NPs, SiO
2 NPs, and ZnO+SiO
2 NPs reached intermediate values (1850 ± 64, 1822 ± 61, and 1810 ± 63 mg), with reductions of 6.6%, 8.0%, and 8.6%, respectively. ZnMo showed a more marked decrease (1745 ± 59 mg; −11.8%), while the lowest values corresponded to Osmoplant (1688 ± 55 mg; −14.8%) and Codasil (1604 ± 53 mg; −19.0%) (
Figure 3 b).
These results reflect that, although control and hydropriming promoted greater accumulation of above-ground biomass, treatments with nanoparticles favored more compact growth, with a relatively lower allocation to above-ground organs and higher to roots (as observed in the previous section). This indicates a balance in biomass distribution, which may represent an advantage under field conditions, since a more compact architecture with vigorous roots increases survival in stressful environments [
35,
47].
The literature reinforces this approach. Nile et al. [
46] highlighted that nanopriming can modulate biomass distribution between organs, favoring physiological efficiency and stress resistance. Similarly, Mahakham et al. [
47] demonstrated that nanopriming with silver nanoparticles in aged rice stimulated the balanced accumulation of aerial and root biomass, improving germination rate and vigor. These findings are consistent with our results, suggesting that nanoparticle-induced biomass redistribution can improve the quality of
C. annuum L. seedlings. Our study provides evidence that, although fresh aboveground biomass was higher in the control and hydropriming treatments, nanoparticle treatments contributed to a more balanced growth pattern, reinforcing their usefulness in the production of robust and resilient seedlings.
3.2.3. Fresh Root Weight
Fresh root biomass is an essential parameter because it reflects soil exploration capacity, water and nutrient absorption, and reserve storage, which are determining factors for seedling establishment under field conditions [
48]. A robust root system ensures higher post-transplant survival and confers tolerance to abiotic stresses such as salinity, drought, or nutritional deficiencies.
In this study, significant differences (
p ≤ 0.05) were observed between treatments (
Figure 3c). The highest value was recorded in ZnO NPs (1450 ± 48 mg), with an increase of 28.2% compared to the control (1131 ± 42 mg). The treatments with ZnO+SiO
2 NPs (1372 ± 46 mg; +21.3%) and ZnMo (1325 ± 44 mg; +17.2%) also showed significant increases. Hydropriming reached 1248 ± 43 mg (+10.3%). In contrast, Osmoplant (1195 ± 41 mg; +5.7%) and Codasil (1074 ± 40 mg; −5.0%) recorded the lowest values.
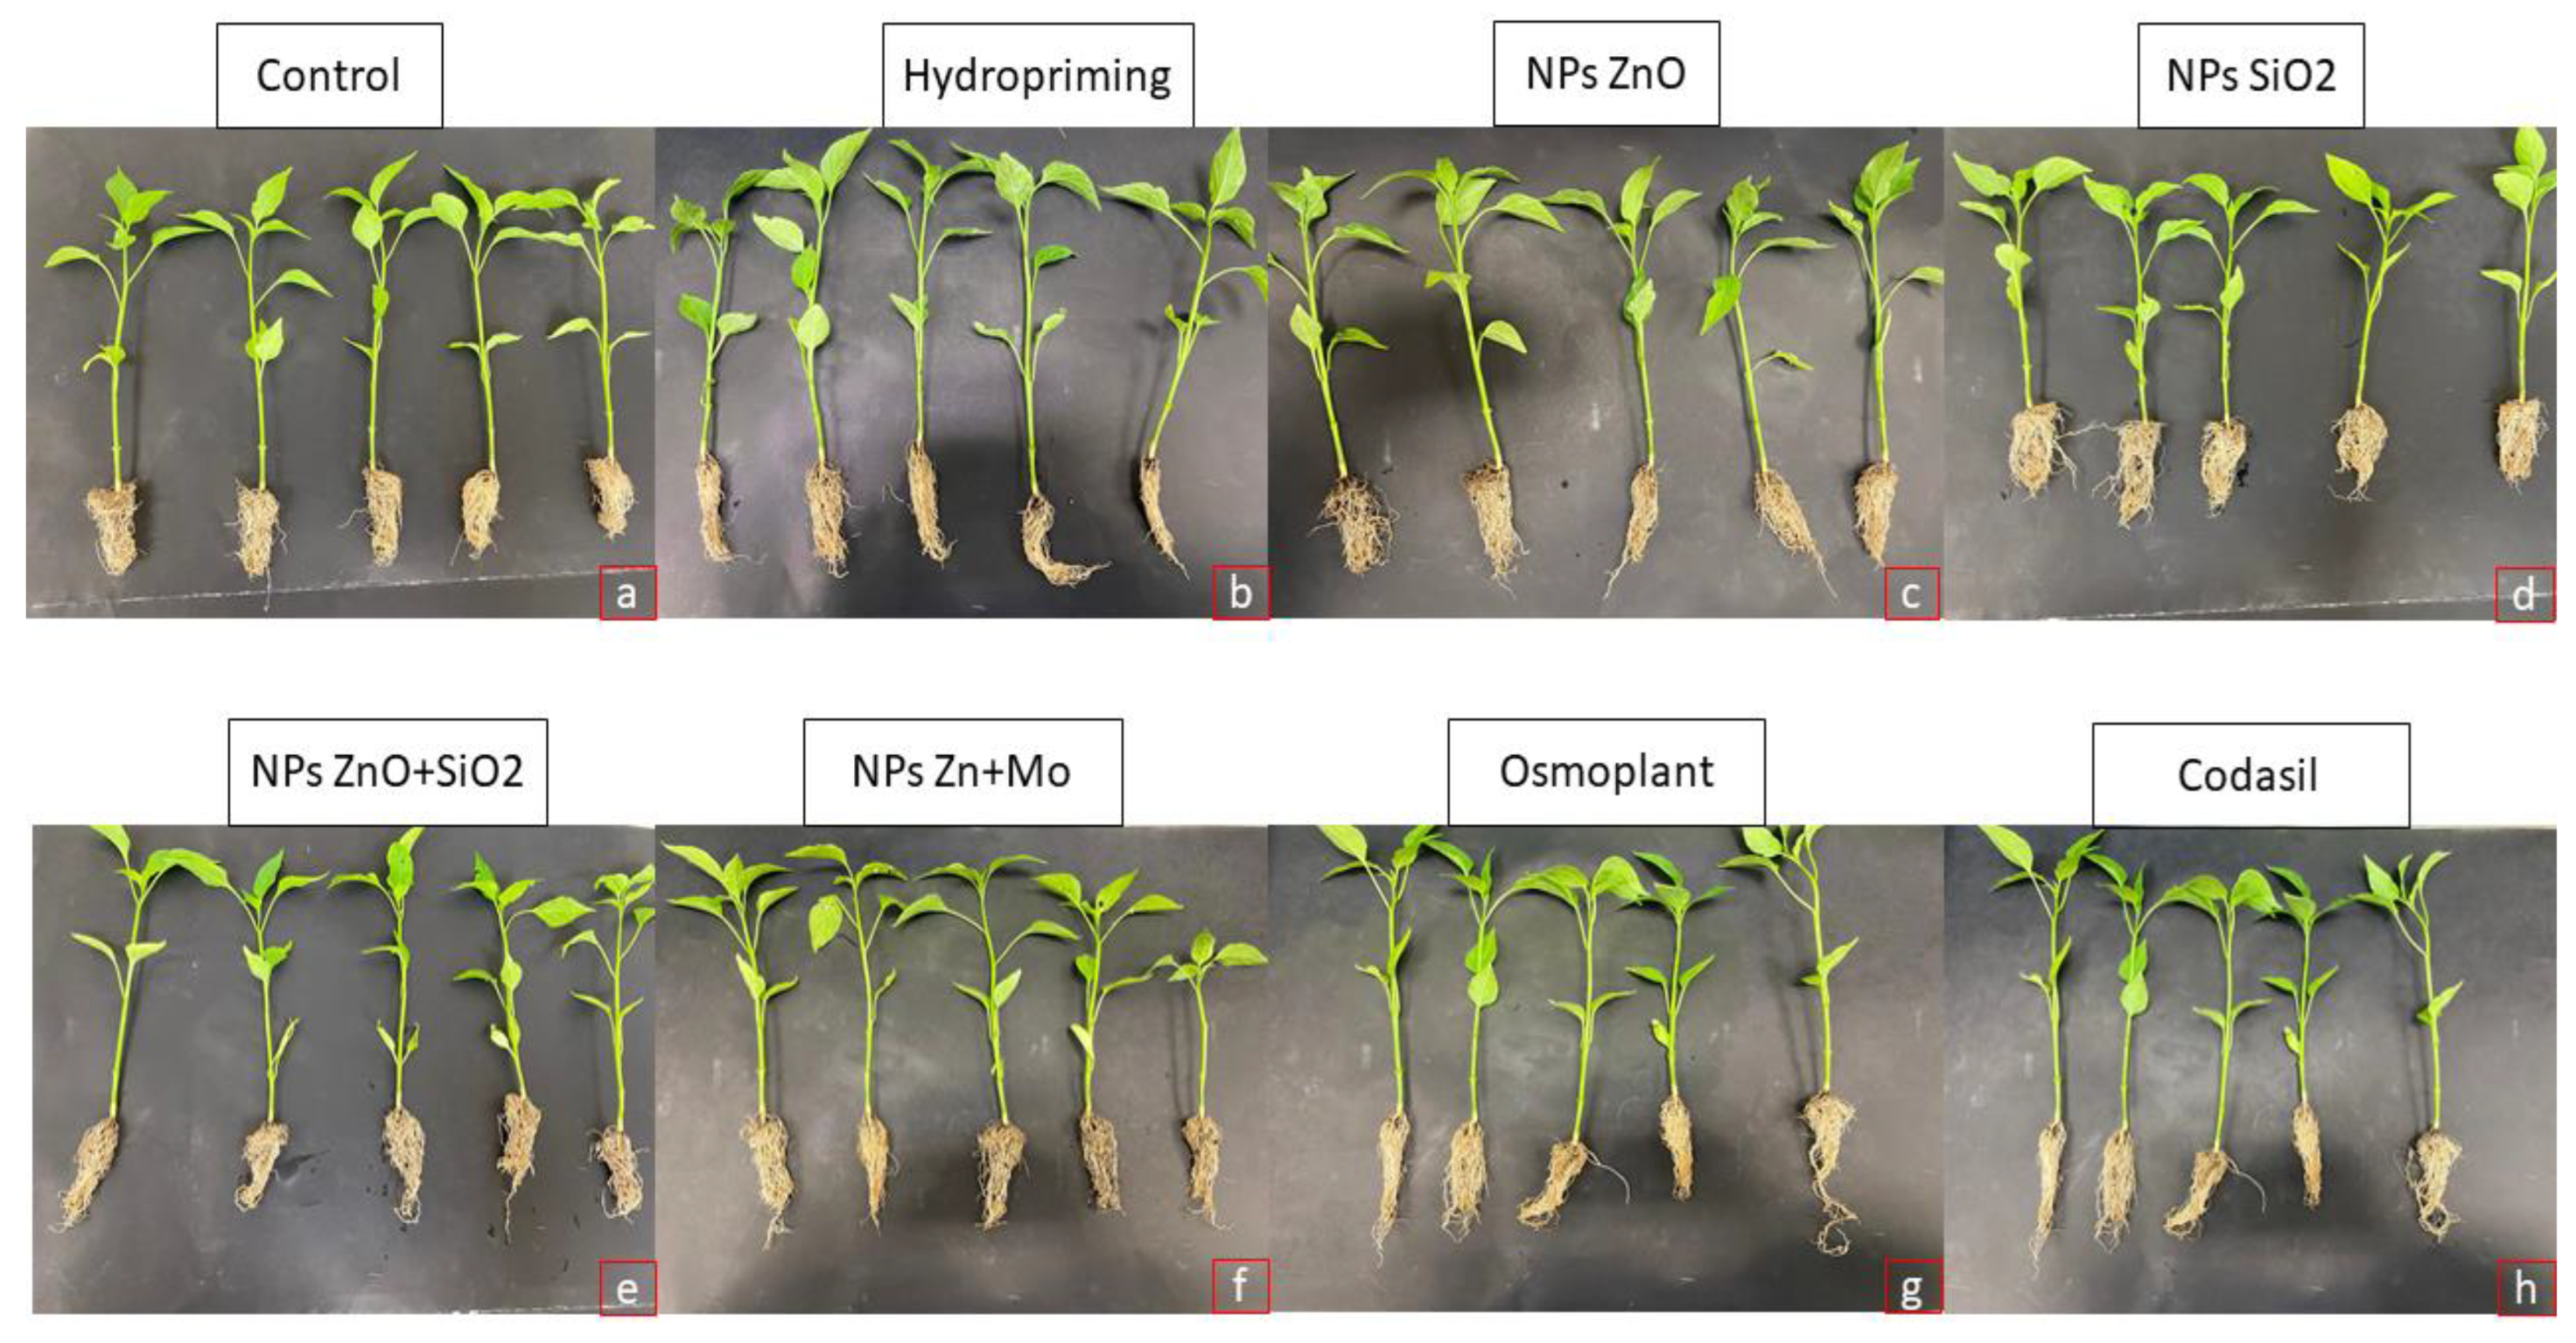
In addition to the numerical values,
Figure 4 provides a visual representation of the development of
C. annuum L. seedlings under different priming treatments. It can be seen that treatments with nanoparticles (particularly ZnO and ZnO+SiO
2) favored seedlings with longer and more robust roots, while Codasil showed shorter and less vigorous roots. These images support the quantitative data, clearly illustrating how nanopriming influences root architecture and overall seedling vigor.
These results indicate that nanoparticle treatments, particularly ZnO-NPs, promoted more vigorous root development, which could explain the differential allocation pattern previously observed in aboveground biomass.
The promotion of root growth through nanopriming has been linked to increased photosynthetic efficiency and stress tolerance by improving both nutrient uptake and water conductance [
46,
49]. Previous studies support this trend.
Wang et al. [
48] demonstrated that root biomass accumulation in salt-stressed potatoes was directly related to physiological attributes such as photosynthetic pigmentation and antioxidant enzymes. Similarly, Boonupara et al. [
49] noted that root development is sensitive to nutrient and contaminant availability, and that its response can predict the physiological potential of the plant under field conditions.
Together, both quantitative and visual evidence show that nanopriming, especially with ZnO, favors resource allocation to the roots, promoting more resistant seedlings with greater agronomic adaptability, which is an advantage for sustainable vegetable production.
3.3. Photosynthetic Pigments
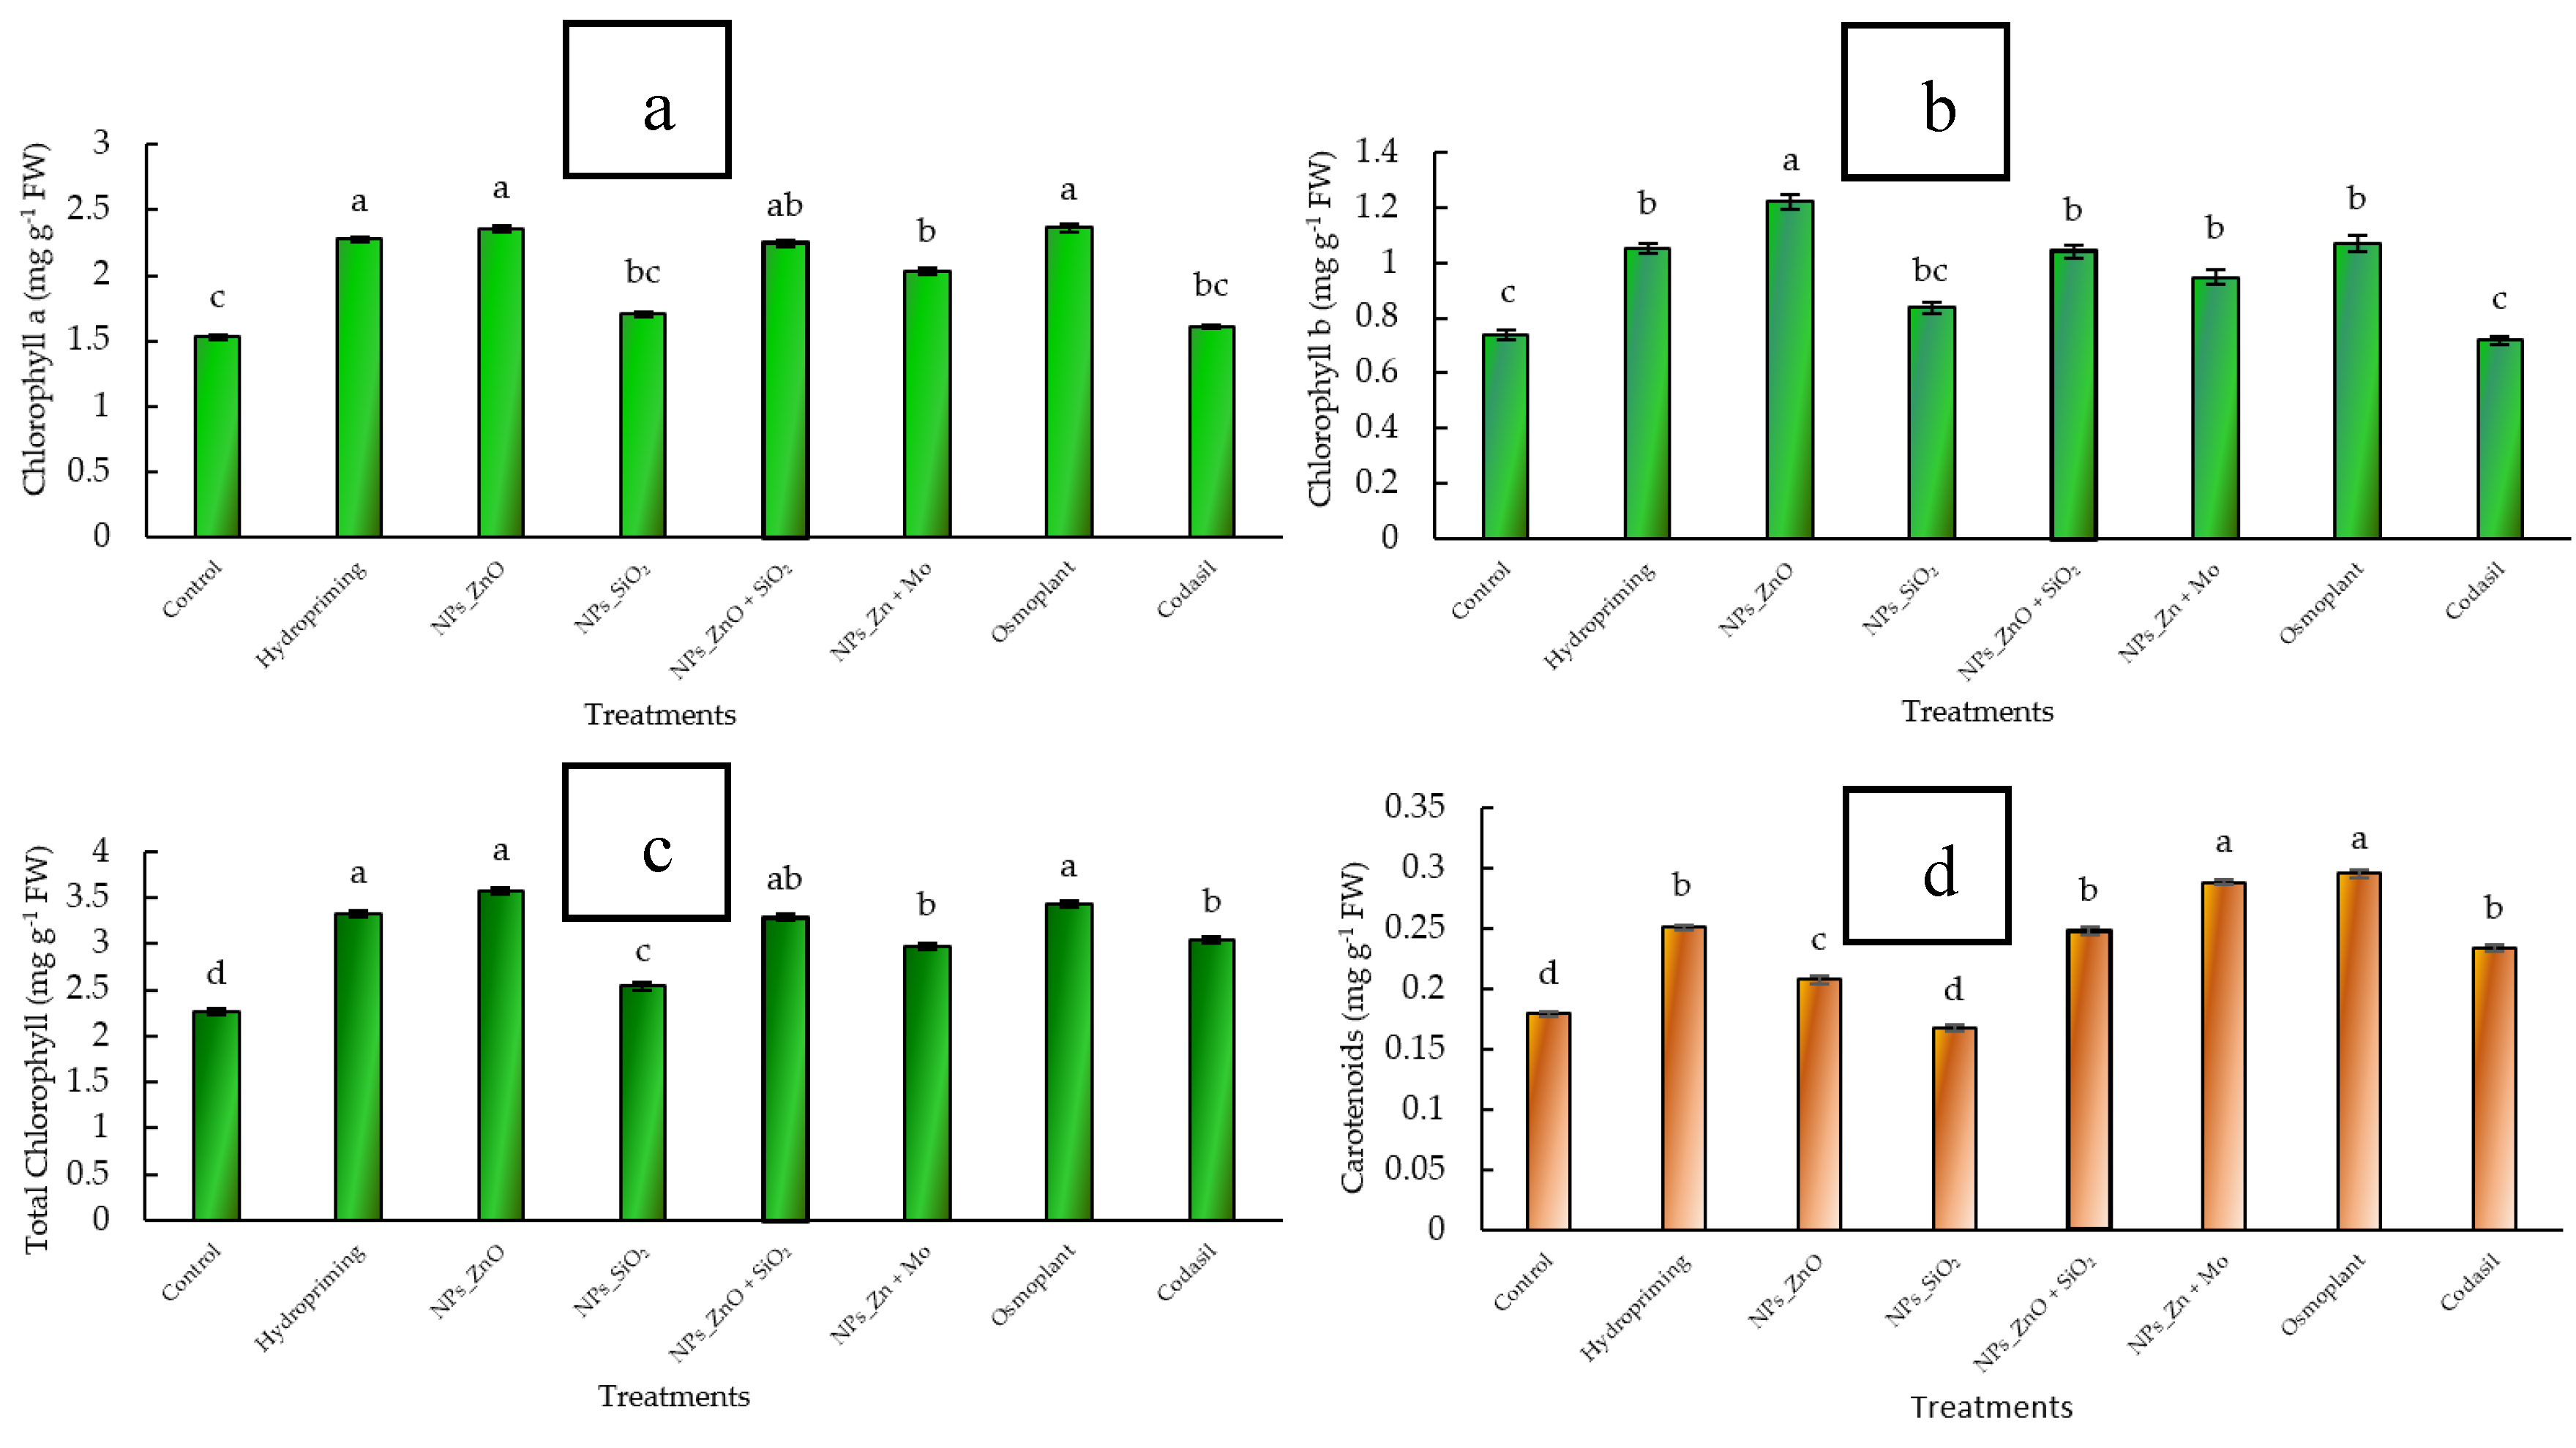
3.3.1. Chlorophylls
The accumulation of chlorophylls is a key indicator of photosynthetic efficiency and the ability of seedlings to sustain initial growth. Chlorophyll a is the primary pigment of photosystems, while chlorophyll b acts as an auxiliary pigment, broadening the absorption spectrum; the sum of both (total chlorophyll) reflects the overall potential for carbon fixation and plant productivity [
25].
In this study, significant differences (
p ≤ 0.05) were observed between treatments. The control had chlorophyll a values of 1.55 ± 0.04 mg g
−1 FW, while ZnO NPs reached 2.15 ± 0.05 mg g
−1 FW, representing an increase of 38.7% (
Figure 5 a). Chlorophyll b was also higher in ZnO NPs (1.12 ± 0.03 mg g
−1 FW) compared to the control (0.75 ± 0.02 mg g
−1 FW), with an increase of 49.3% (
Figure 5 b). As a result, total chlorophyll in ZnO NPs reached 3.27 ± 0.07 mg g
−1 FW compared to 2.30 ± 0.06 mg g
−1 FW in the control (+42.2%). The treatments with ZnO+SiO
2 NPs (3.05 ± 0.06 mg g
−1 FW; +32.6%) and ZnMo (3.10 ± 0.06 mg g
−1 FW; +34.8%) also showed significant increases compared to the control. In contrast, Codasil and SiO
2 NPs did not differ statistically from the control (
Figure 5 c).
These results indicate that nanopriming, especially with ZnO NPs, enhances chlorophyll biosynthesis and, consequently, the photosynthetic capacity of C. annuum L. seedlings.
The literature supports this interpretation. Wellburn [
25] established the basis for spectrophotometric quantification of chlorophyll, highlighting its value as a physiological marker. Shah et al. [
43] showed that chlorophyll content responds to salinity and nutrition conditions, making it a reliable predictor of vigor in wheat. Carreño-Siqueira et al. [
44] confirmed that chlorophyll and SPAD indices are useful in selecting genotypes under different fertilization regimes in beans, while Lai et al. [
45] showed that total chlorophyll correlates with growth and development potential in tree species.
Together, our results confirm that treatments with nanoparticles, particularly ZnO and ZnMo, promote a more efficient photosynthetic state, which can translate into more vigorous and resilient establishment in the field.
3.2.2. Carotenoids
Carotenoids play a fundamental role in the photoprotection of chloroplasts, as they dissipate excess light energy and protect against reactive oxygen species. In addition, they participate in the stability of antenna complexes and in the efficiency of electron transport, acting as an indispensable complement to chlorophylls in the photosynthetic machinery [
39].
In our study, significant differences (
p ≤ 0.05) were detected between treatments. The carotenoid content in the control was 0.21 ± 0.01 mg g
−1 FW, while the highest values were recorded in ZnMo (0.31 ± 0.01 mg g
−1 FW) and Osmoplant (0.30 ± 0.01 mg g
−1 FW), representing increases of 47.6% and 42.8%, respectively. Treatment with ZnO NPs also showed a significant increase (0.27 ± 0.01 mg g
−1 FW; +28.6%), while SiO
2 NPs and Codasil did not differ from the control (
Figure 5 d).
These results suggest that the application of metal nanoparticles and specific bioproducts enhances carotenoid accumulation, which reinforces the antioxidant capacity of seedlings and contributes to tolerance to environmental stress conditions.
In the literature, Karwat et al. [
40] reported that photosynthetic activity and accessory pigments such as carotenoids are sensitive indicators of the ability of plants to modulate metabolism in response to nitrification and stress processes. Similarly, Oliveira Ferreira [
41] indicated that biochemical parameters such as NR and GS, together with photosynthetic pigments, reflect the nutritional status and metabolic efficiency of forest species, highlighting their value as physiological indicators.
Our study confirms that nanopriming with ZnMo and ZnO increases carotenoid levels in C. annuum L., a trait that can be exploited to improve the photo-oxidative tolerance and physiological robustness of seedlings in early stages of establishment.
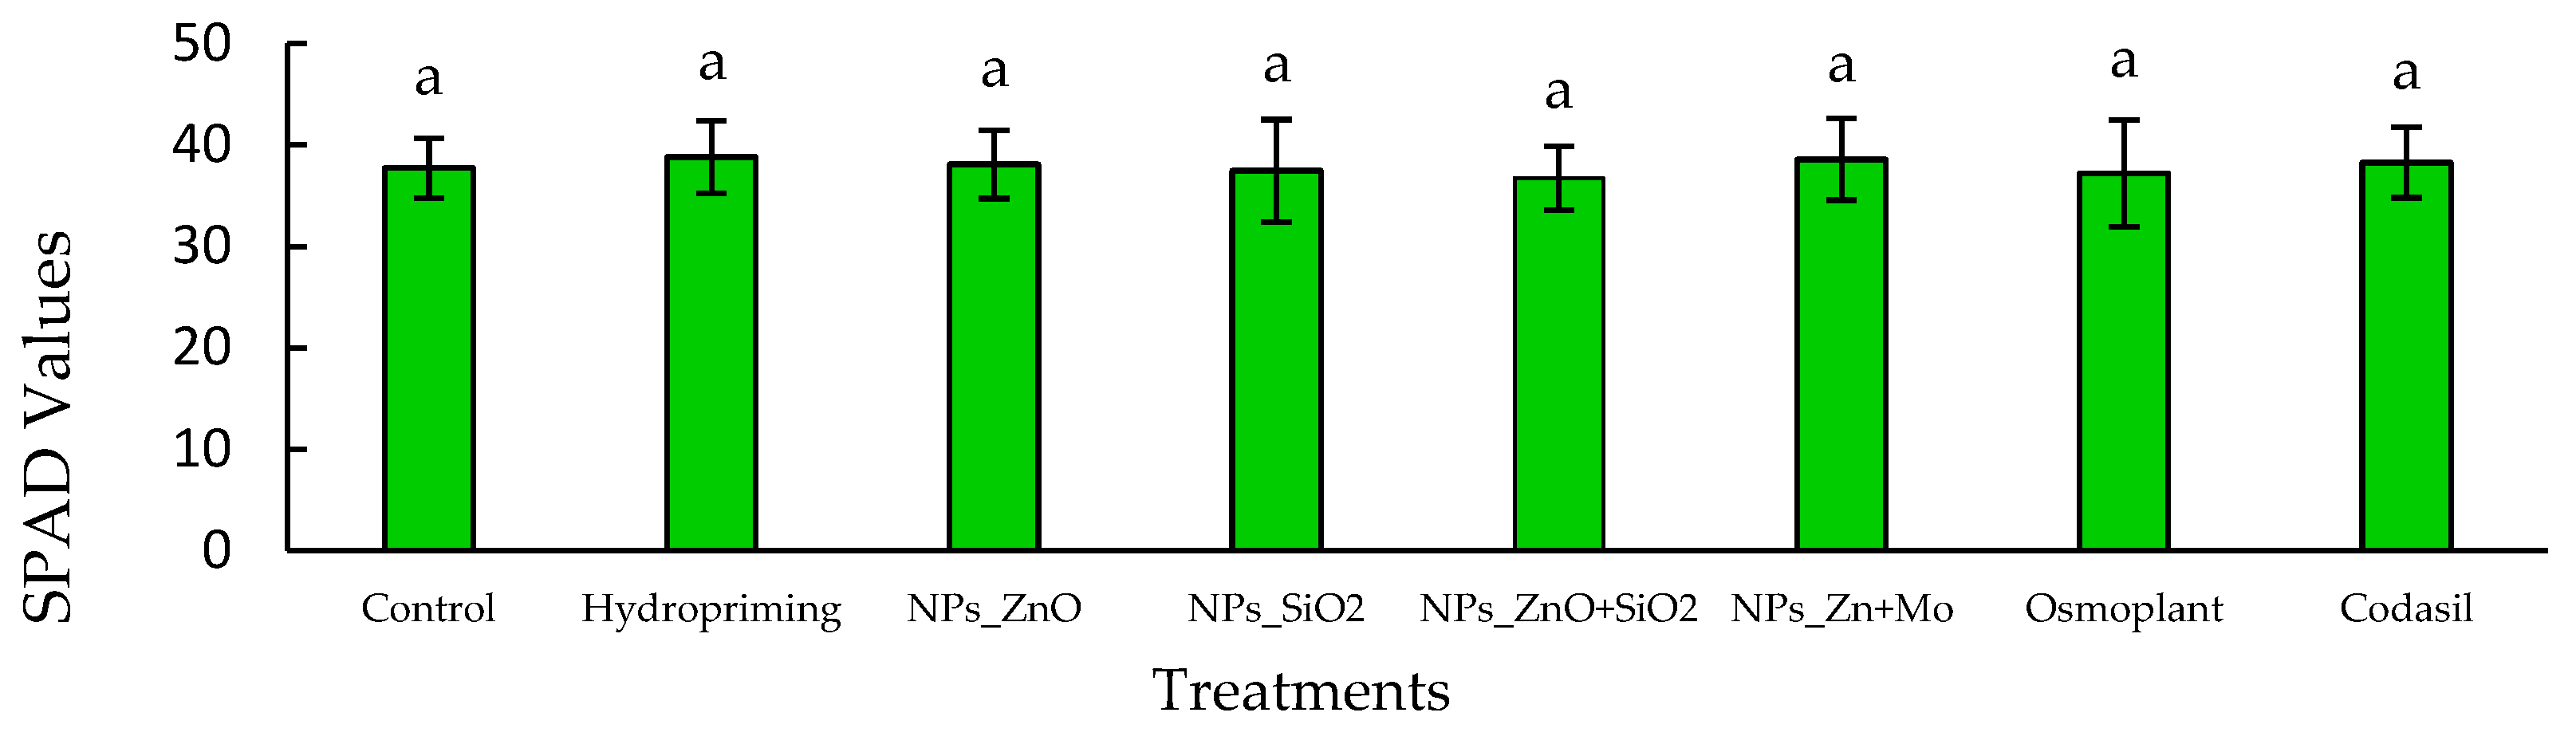
3.4. Chlorophyll Index
The SPAD index is a practical and non-destructive tool for estimating the relative chlorophyll content in leaves, providing indirect information on the nitrogen nutritional status and photosynthetic capacity of plants. Higher values are associated with greater light capture efficiency and a more robust photosynthetic metabolism [
46].
In our study, no significant differences (
p > 0.05) were observed between treatments. SPAD values ranged from 37.2 ± 1.0 to 39.8 ± 1.2, with hydropriming and ZnO NPs reaching the highest values, while SiO
2 NPs and Codasil showed the lowest values, although without statistical differences compared to the control (
Figure 6).
These results suggest that, despite the variation in total chlorophyll quantified by chemical methods, the SPAD index remained relatively stable, indicating that nanopriming and bioproduct treatments did not significantly affect leaf chlorophyll density.
In previous studies, Shah et al. [
46] demonstrated that the SPAD index responds to salt and nutritional stress conditions in wheat, evidencing its sensitivity as a physiological biomarker. Likewise, Carreño Siqueira et al. [
44] confirmed that SPAD can be used in the selection of bean genotypes under different fertilization conditions, reinforcing its agronomic utility. Finally, Lai et al. [
45] concluded that SPAD values can be strongly correlated with chlorophyll and carotenoid concentrations, as well as predicting growth potential in young trees.
In this context, our work on C. annuum L provides evidence that, although the treatments modified the absolute levels of photosynthetic pigments, the stability of SPAD values reflects a physiological balance that could be useful as a selection criterion in nurseries and transplants.
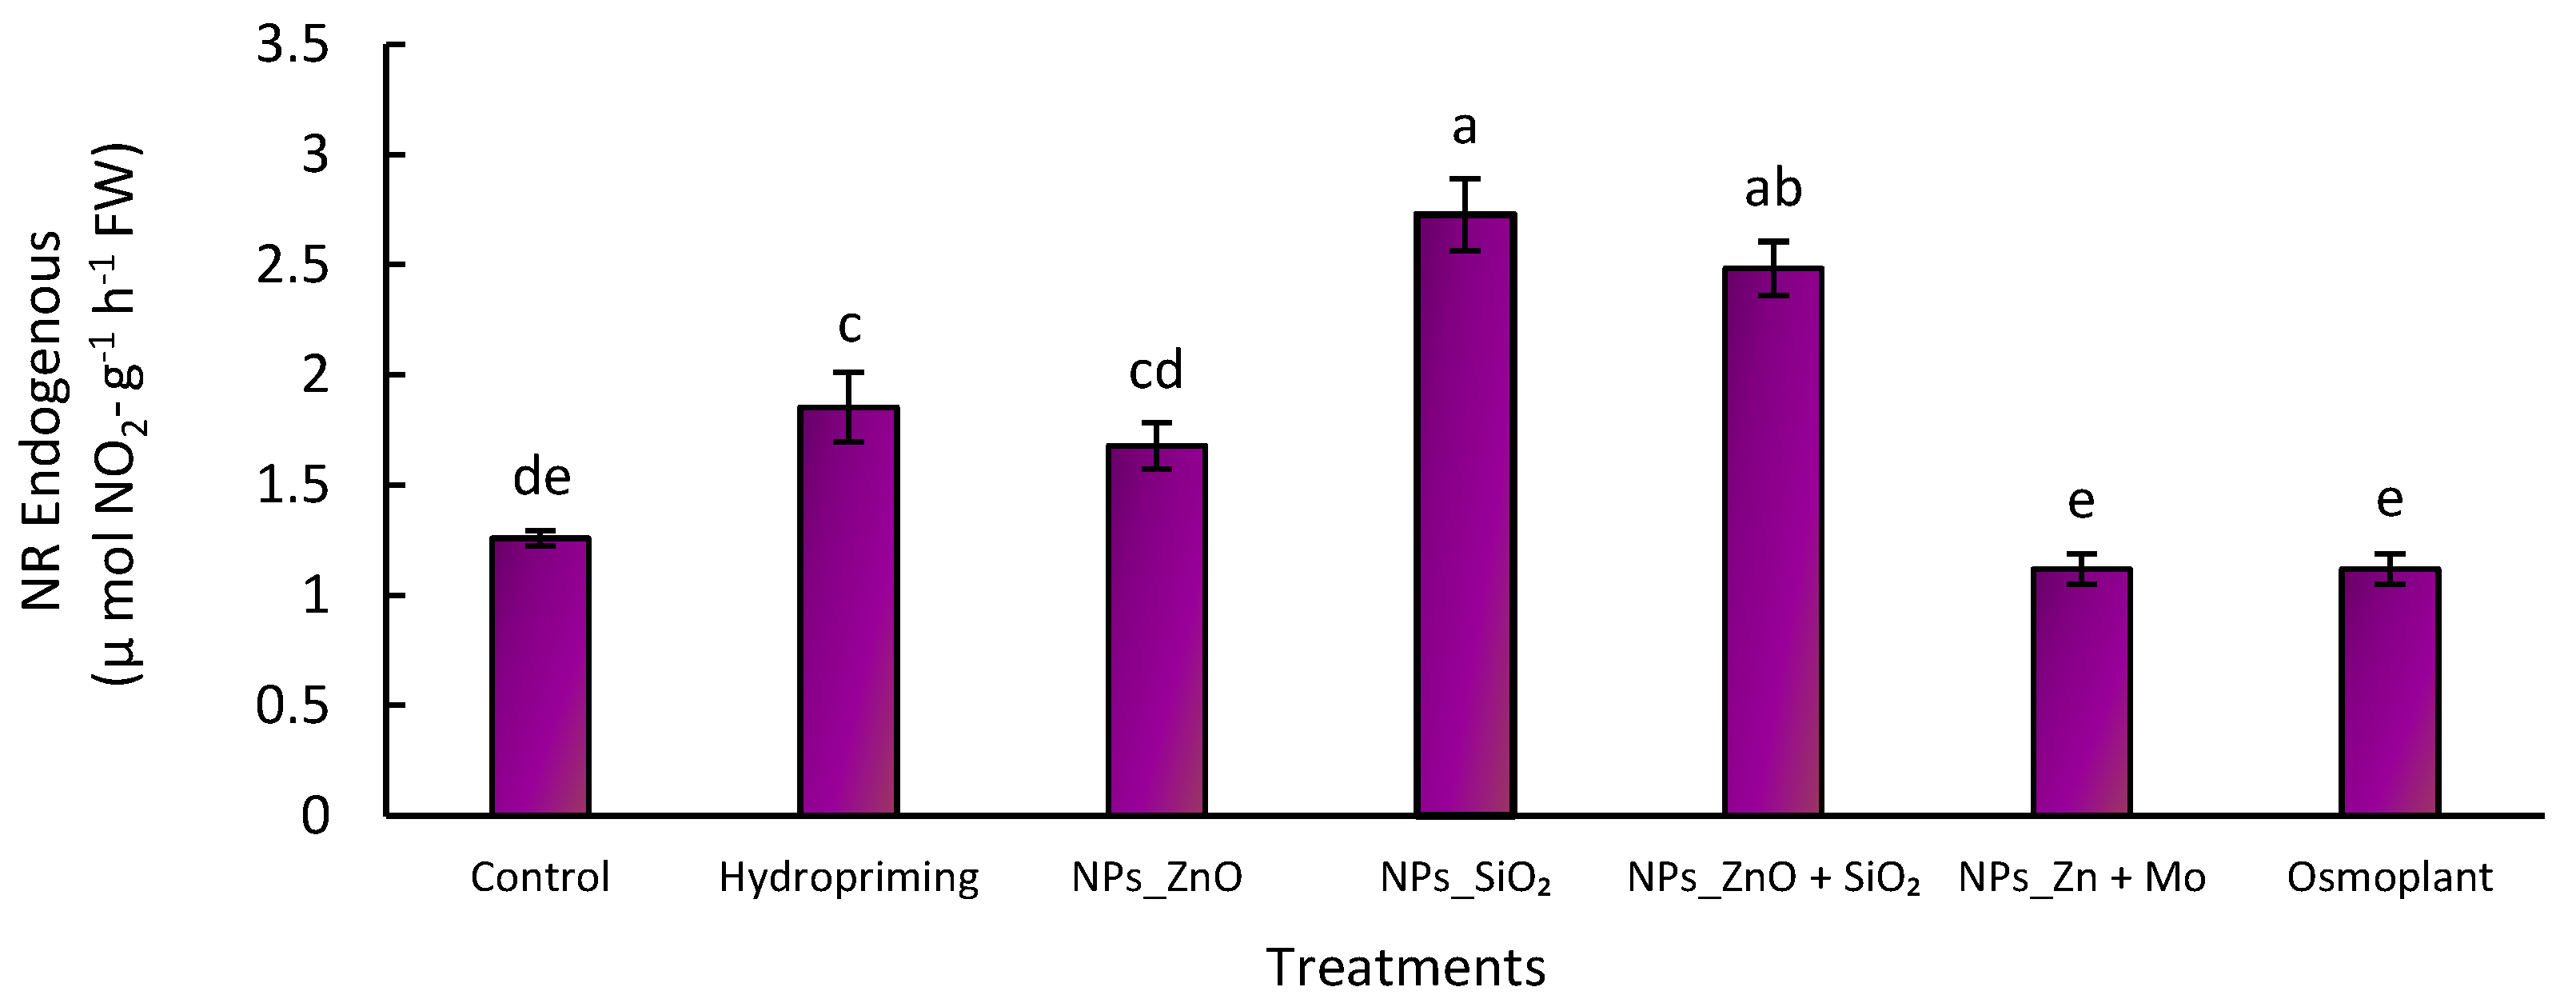
3.5. Nitrate Reductase Activity “In Vivo”
3.5.1. Endogenous Nitrate Reductase
Nitrate reductase (NR) activity is a key indicator of nitrogen assimilation in plants, as it catalyzes the reduction of nitrate (NO
3−) to nitrite (NO
2−), the first step in the incorporation of this essential nutrient into organic compounds. Higher enzyme activity is associated with more efficient nitrogen use and, consequently, with higher growth and productivity [
44,
45].
In our study, significant differences (
p ≤ 0.05) were observed between treatments. For endogenous NR, the highest values were obtained with SiO
2 NPs (2.8 ± 0.1 µmol NO
2− g
−1 h
−1 FW) and ZnO+SiO
2 NPs (2.5 ± 0.1 µmol NO
2− g
−1 h
−1 FW), representing increases of 133% and 108% compared to the control (1.2 ± 0.1 µmol NO
2− g
−1 h
−1 FW). Hydropriming and ZnO NPs showed intermediate increases (1.9 and 1.7 µmol NO
2− g
−1 h
−1 FW), while the lowest values corresponded to Osmoplant and ZnMo (1.1–1.3 µmol NO
2− g
−1 h
−1 FW) (
Figure 7).
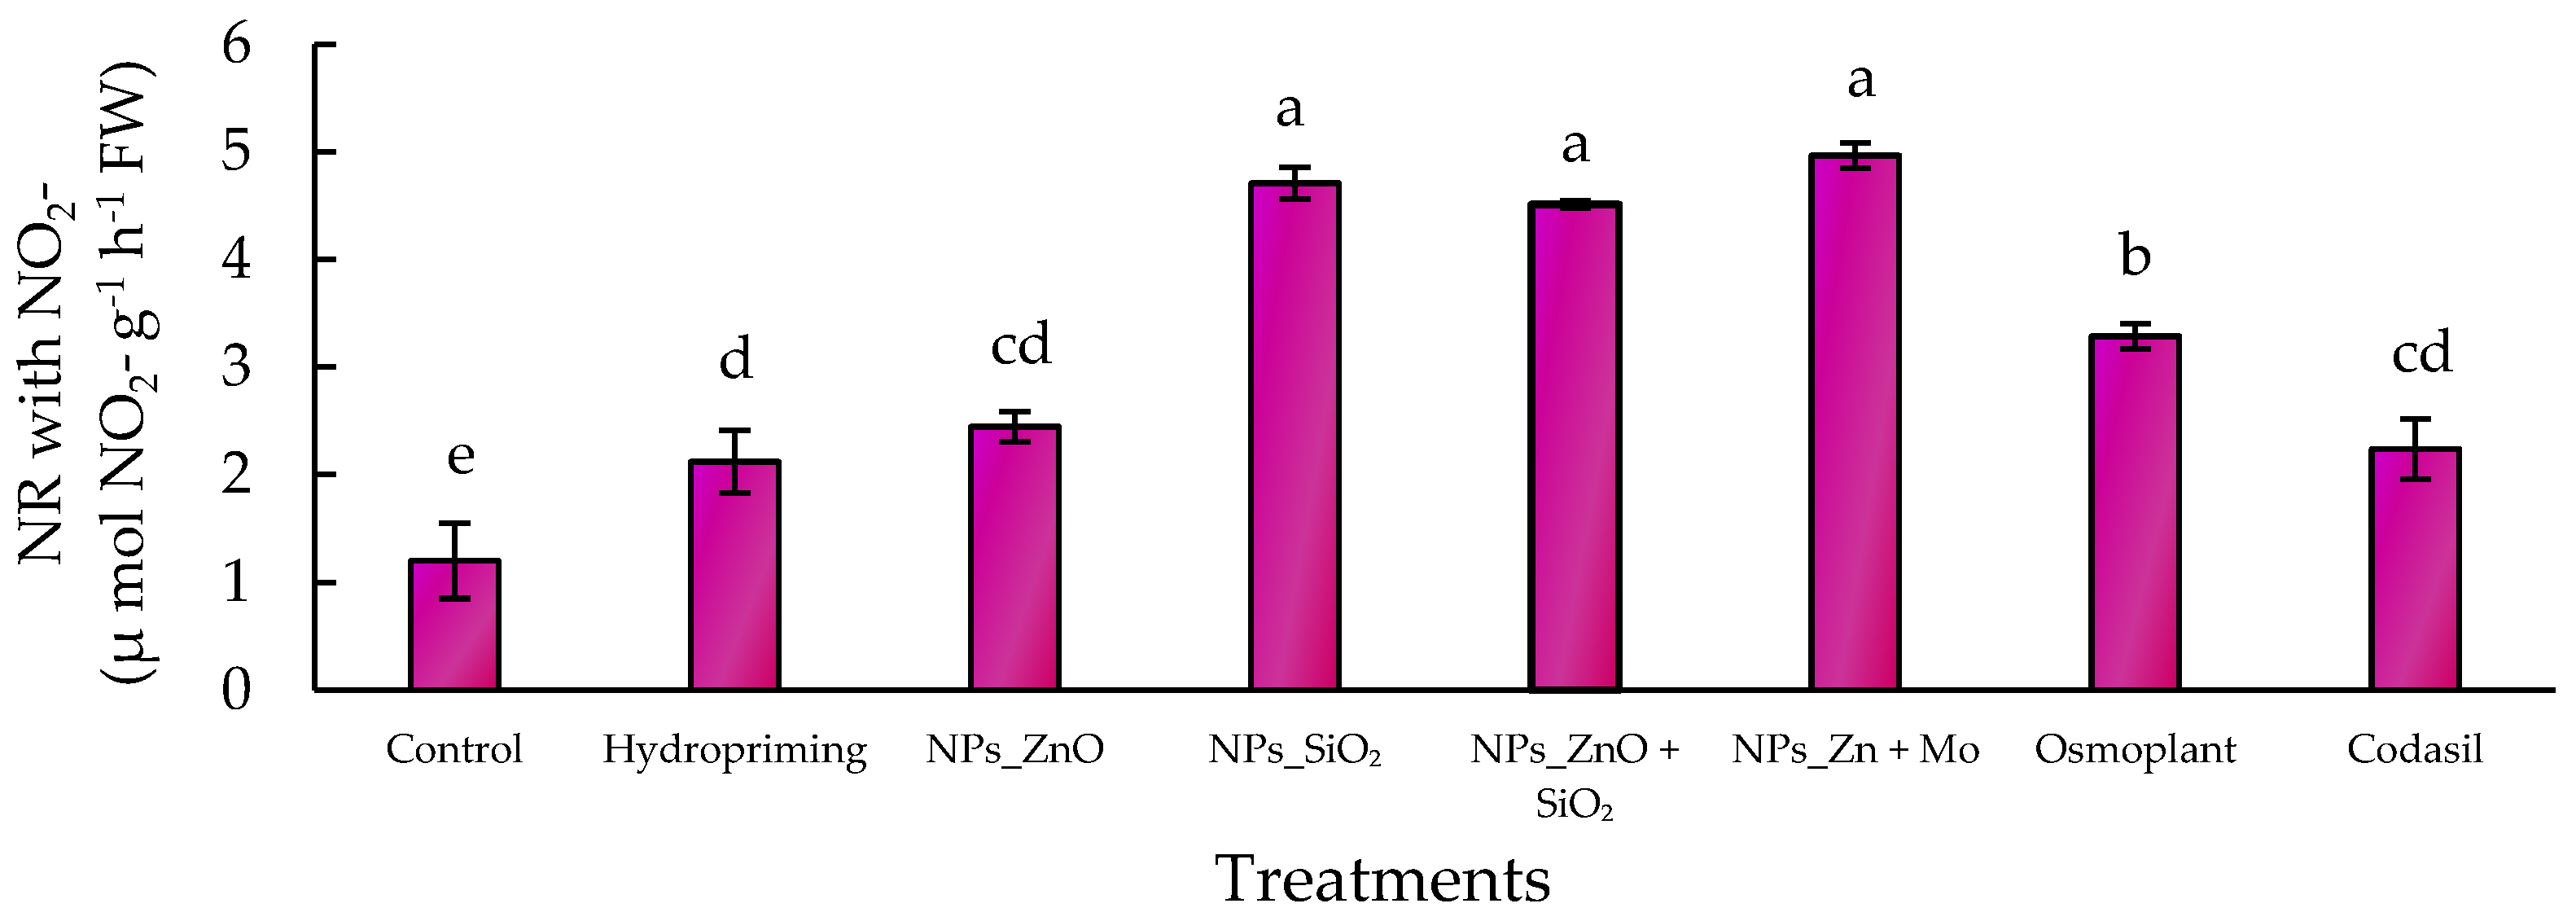
3.5.2. NO3- Induced Nitrate Reductase
In the case of NR with NO
3−, the highest levels were recorded in SiO
2 NPs (4.8 ± 0.2 µmol NO
2− g
−1 h
−1 FW), ZnMo (5.0 ± 0.2 µmol NO
2− g
−1 h
−1 FW) and ZnO+SiO
2 (4.6 ± 0.2 µmol NO
2− g
−1 h
−1 FW), representing an increase of more than 300% compared to the control (1.2 ± 0.1 µmol NO
2− g
−1 h
−1 FW). Osmoplant and Codasil showed moderate values, while hydropriming maintained significantly higher activity than the control, but lower than the NP treatments (
Figure 8).
These results suggest that nanoparticles, particularly SiO
2 and the combinations ZnMo and ZnO+SiO
2, enhance the nitrate reduction capacity in
C. annuum L, which translates into greater efficiency in nitrogen assimilation. This is consistent with the findings of Karwat et al. [
40], who showed that NR activity can be considered a reliable physiological marker of nitrogen metabolism in forage grasses. Similarly, Oliveira Ferreira [
41] demonstrated that NR and GS are enzymes that indicate nitrogen status in woody species, reinforcing the idea that stimulation of this enzymatic pathway improves physiological performance.
Our study provides evidence that nanopriming with SiO2, ZnMo, and ZnO+SiO2 not only impacts morphological development but also modulates critical biochemical processes, consolidating its role as a strategy to improve nitrogen use efficiency in C. annuum L. seedlings.
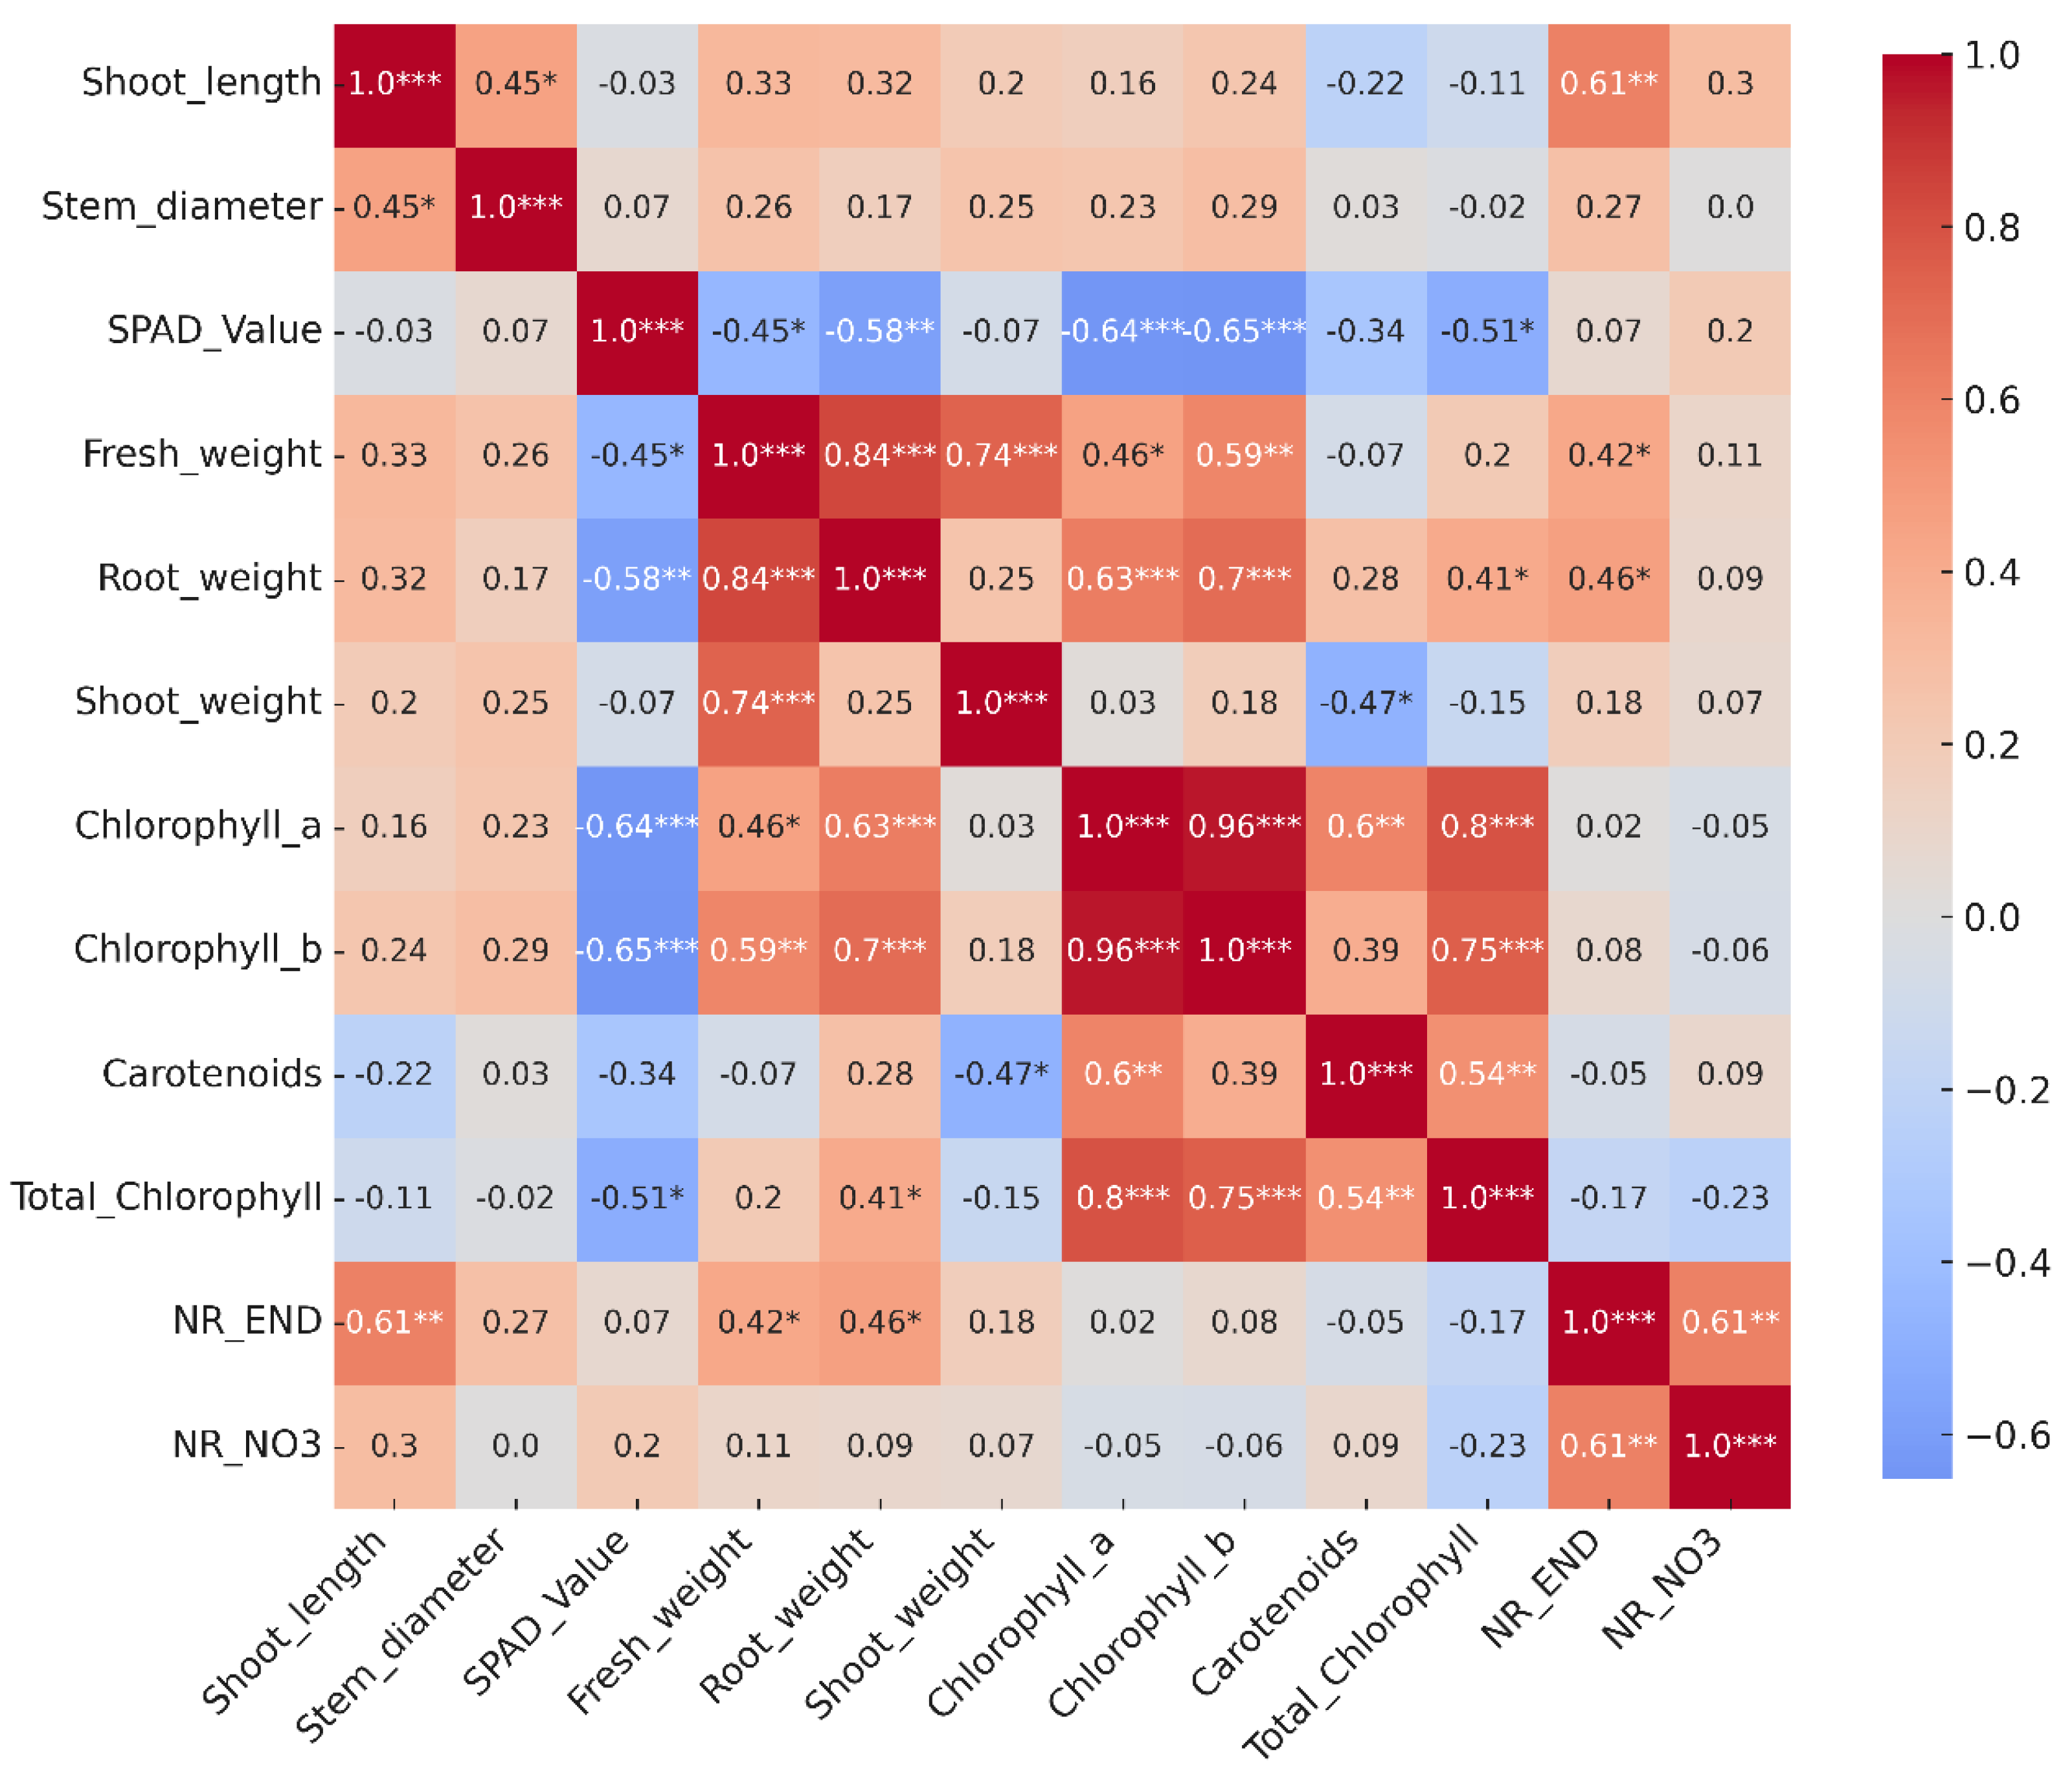
3.6. Pearson Correlation Heatmap
Pearson’s correlation analysis is a fundamental tool for interpreting the interrelationship between morphological, physiological, and biochemical parameters in seedlings, as it allows the identification of association patterns that explain the integrated response of the plant system [
29,
30].
In this study, the correlation matrix revealed highly significant associations between photosynthetic pigments. Very strong positive correlations (r > 0.95,
p ≤ 0.001) were observed between chlorophyll a, chlorophyll b, and total chlorophyll, confirming the joint nature of the biosynthesis of these compounds under contrasting experimental conditions. Carotenoids, in turn, showed moderate positive correlations with chlorophyll a (r = 0.60,
p ≤ 0.05) and chlorophyll b (r = 0.54,
p ≤ 0.05), suggesting a pigment co-regulation mechanism, probably linked to photoprotection and stability of photosynthetic antenna complexes [
36,
37] (
Figure 9).
On the other hand, NO
3−-dependent nitrate reductase activity (NR NO
3−) showed significant negative correlations with chlorophyll a (r = -0.77,
p ≤ 0.001) and total chlorophyll (r = -0.78,
p ≤ 0.001), indicating possible metabolic competition between nitrogen assimilation and pigment accumulation. This behavior has been previously described in studies linking nitrogen nutritional status with variation in photosynthetic pigment content [
39,
40]. Likewise, endogenous nitrate reductase (NR END) activity was positively associated with fresh root weight (r = 0.46,
p ≤ 0.05) and fresh stem weight (r = 0.42,
p ≤ 0.05), suggesting that greater vegetative vigor is accompanied by greater enzymatic capacity to reduce nitrates.
Among the growth variables, stem diameter showed a significant correlation with the number of leaves (r = 0.65,
p ≤ 0.01), while stem length did not show any relevant associations. The SPAD index did not show significant correlations with the biochemical contents of chlorophyll, confirming that under these experimental conditions this index does not accurately reflect the actual pigment content, in agreement with studies that have questioned its reliability in different genotypes and environments [
43,
49].
Taken together, these results show a close positive relationship between photosynthetic pigments, as well as an inverse interaction between chlorophyll accumulation and nitrate reductase activity, reflecting the integration of nitrogen metabolism with photosynthetic regulation in seedlings of C. annuum L.
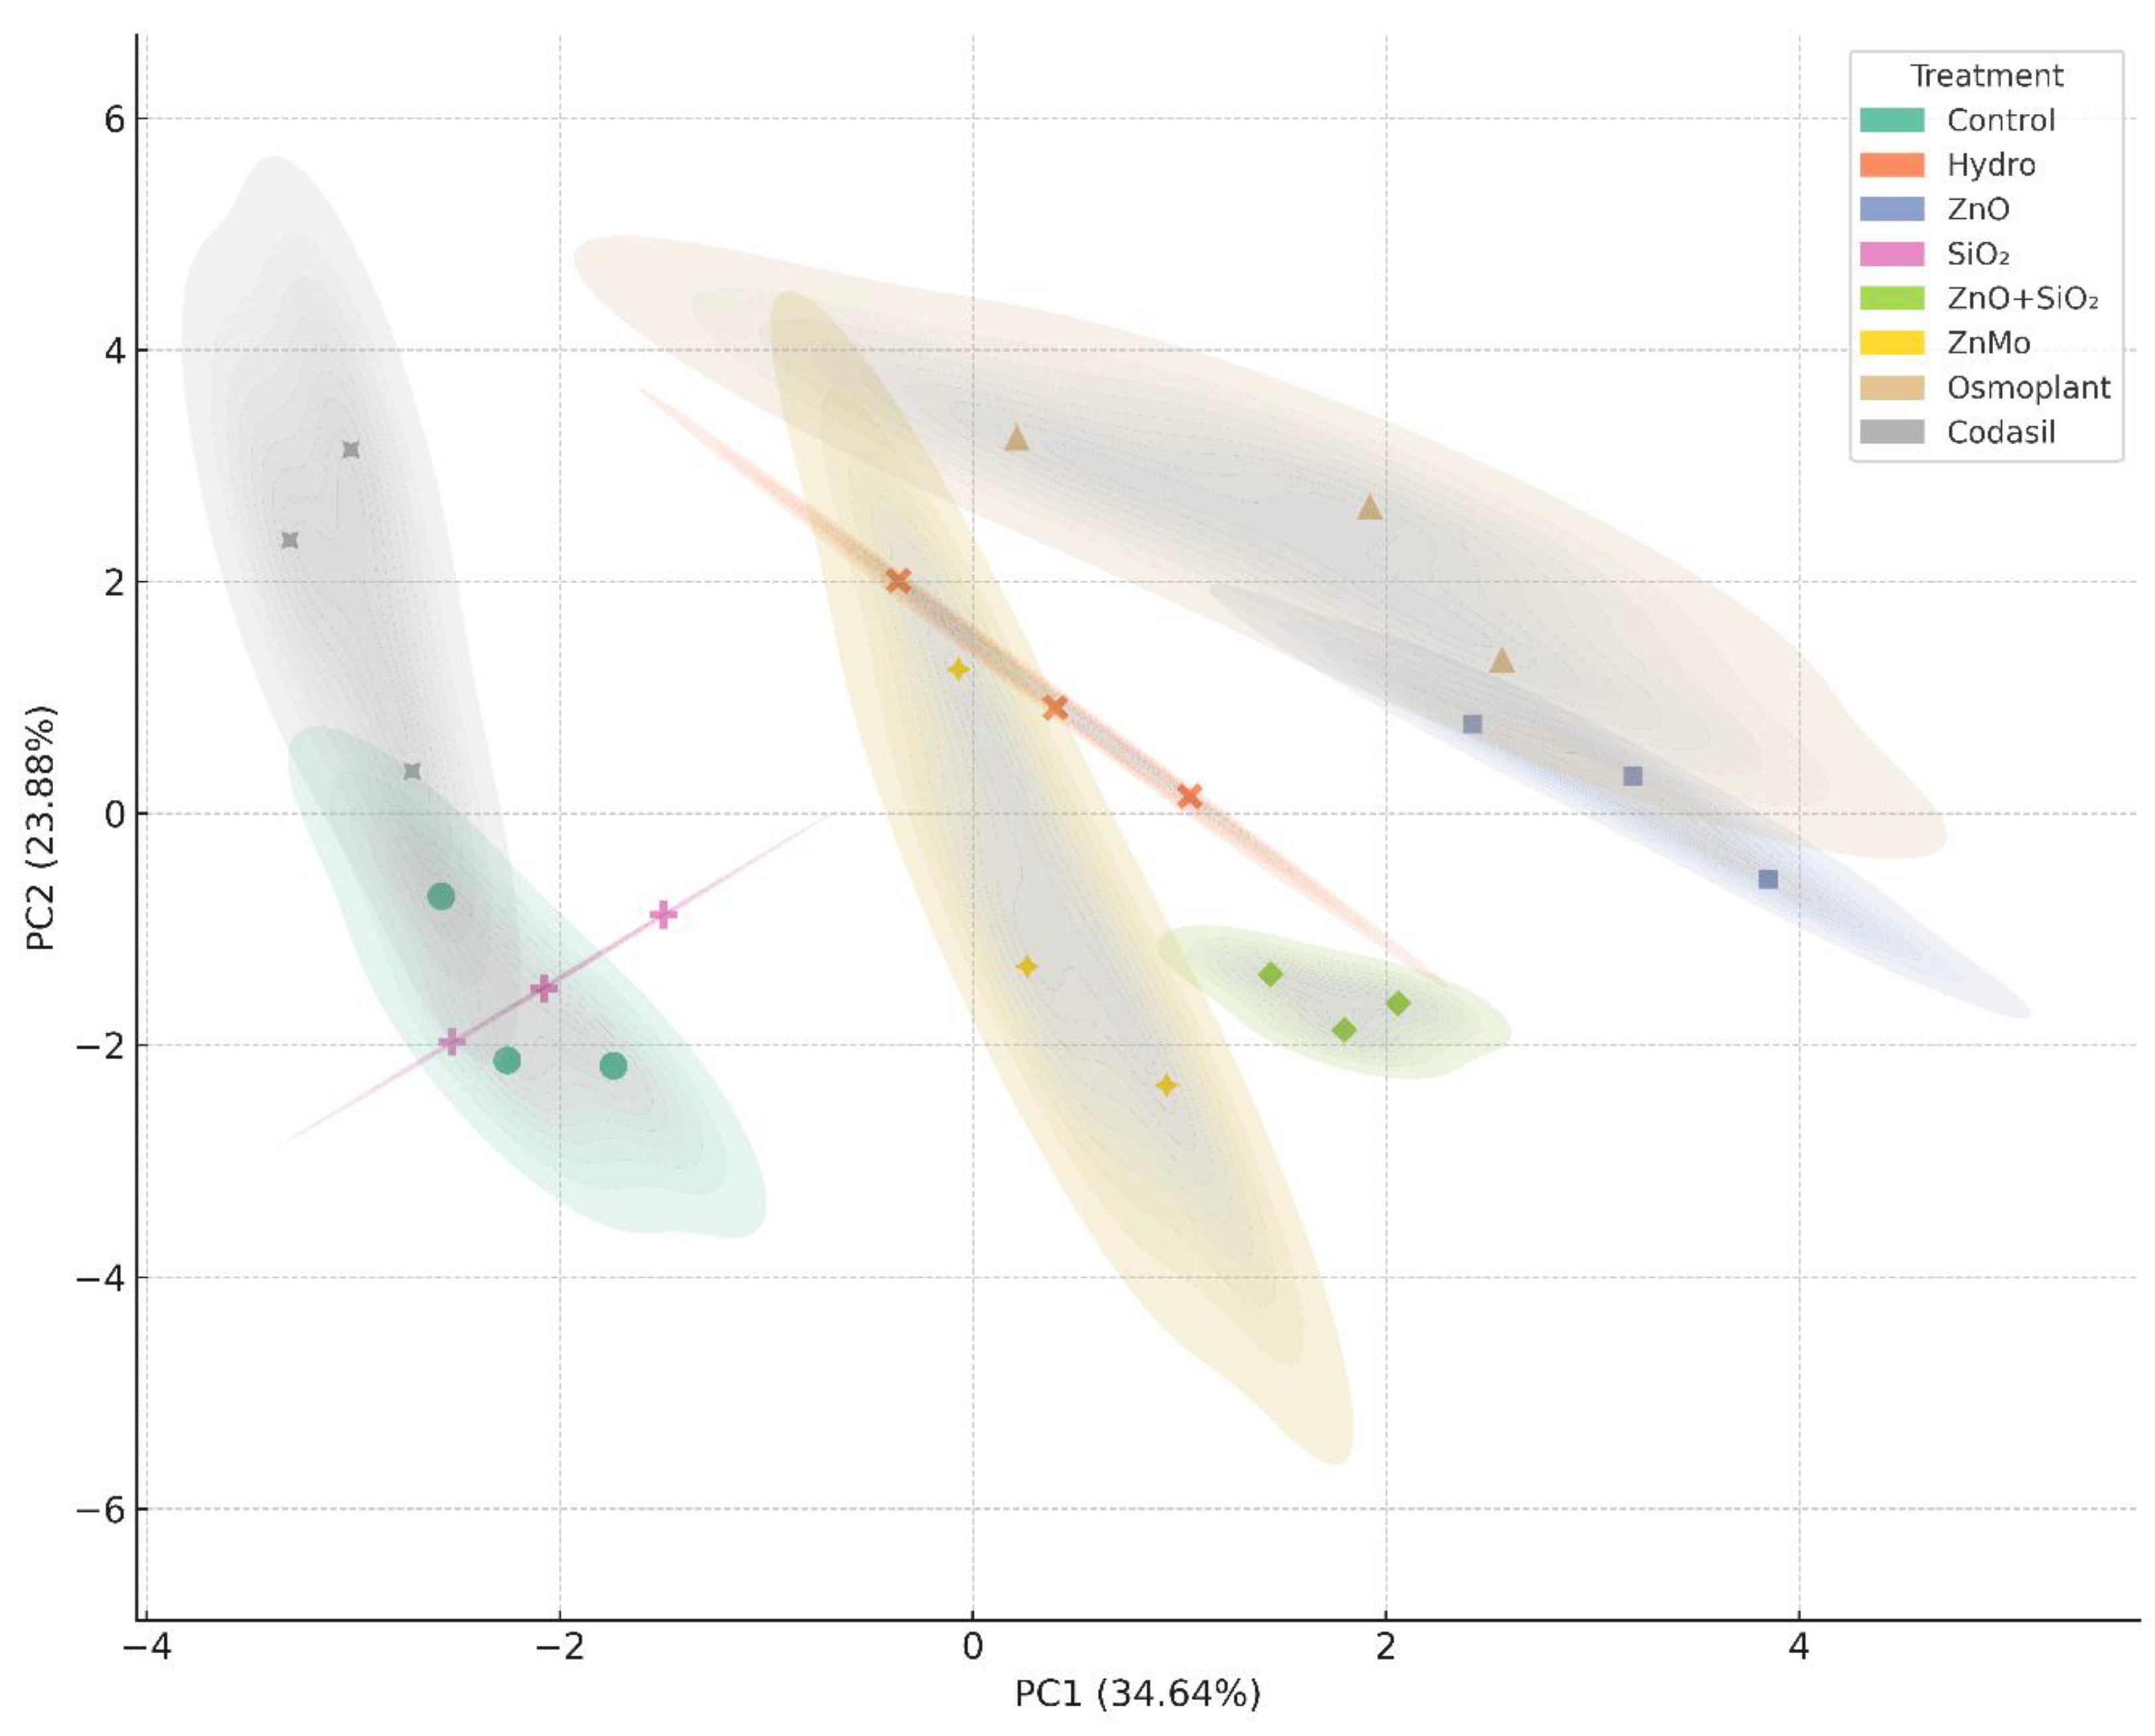
3.7. Principal Component Analysis (PCA)
Principal component analysis (PCA) is a robust statistical tool for exploring and visualizing the multivariate structure of complex data, allowing the identification of clusters of physiological and biochemical responses in seedlings subjected to different treatments [
50]. In addition, this method helps to detect which variables contribute most to the total variability and how they relate to each other.
In our study, PCA explained 34.64% of the total variation in the first component (PC1) and 23.88% in the second (PC2), accounting for 58.52% of the observed variability (
Figure 10). PC1 was dominated by variables such as total biomass (fresh, aerial, root) and photosynthetic pigments, while PC2 mainly reflected nitrate reductase activity and aerial growth variables, indicating that the treatments impact both biomass production and photosynthetic efficiency and nitrogen assimilation.
The treatments with ZnO NPs, ZnO+SiO2 NPs, and ZnMo were located in the upper right quadrant, associated with superior responses in photosynthetic efficiency, root vigor, and biomass accumulation. In contrast, the control, hydropriming, and SiO2 NPs were grouped in the central and lower left part of the graph, reflecting less vigorous behavior. Osmoplant and Codasil showed intermediate positions, suggesting partial or mixed responses.
The use of PCA to discriminate tolerant from sensitive responses has been widely documented in salinity studies in tomatoes, where this method allowed genotypes to be classified according to their ability to survive and develop under stress [
51]. Furthermore, PCA is particularly effective for grouping variables such as chlorophyll, growth, and enzyme activity, revealing the underlying physiological relationships in a quantitative manner [
52].
In summary, PCA in this study not only clearly distinguishes the effects of the treatments but also identifies the key variables (biomass, pigmentation, enzyme activity) that define the adaptive behavior of the seedlings. This confirms that treatments with zinc nanoparticles and their combinations configure an advantageous morphophysiological profile in C. annuum L, validating their potential as efficient strategies in nurseries.
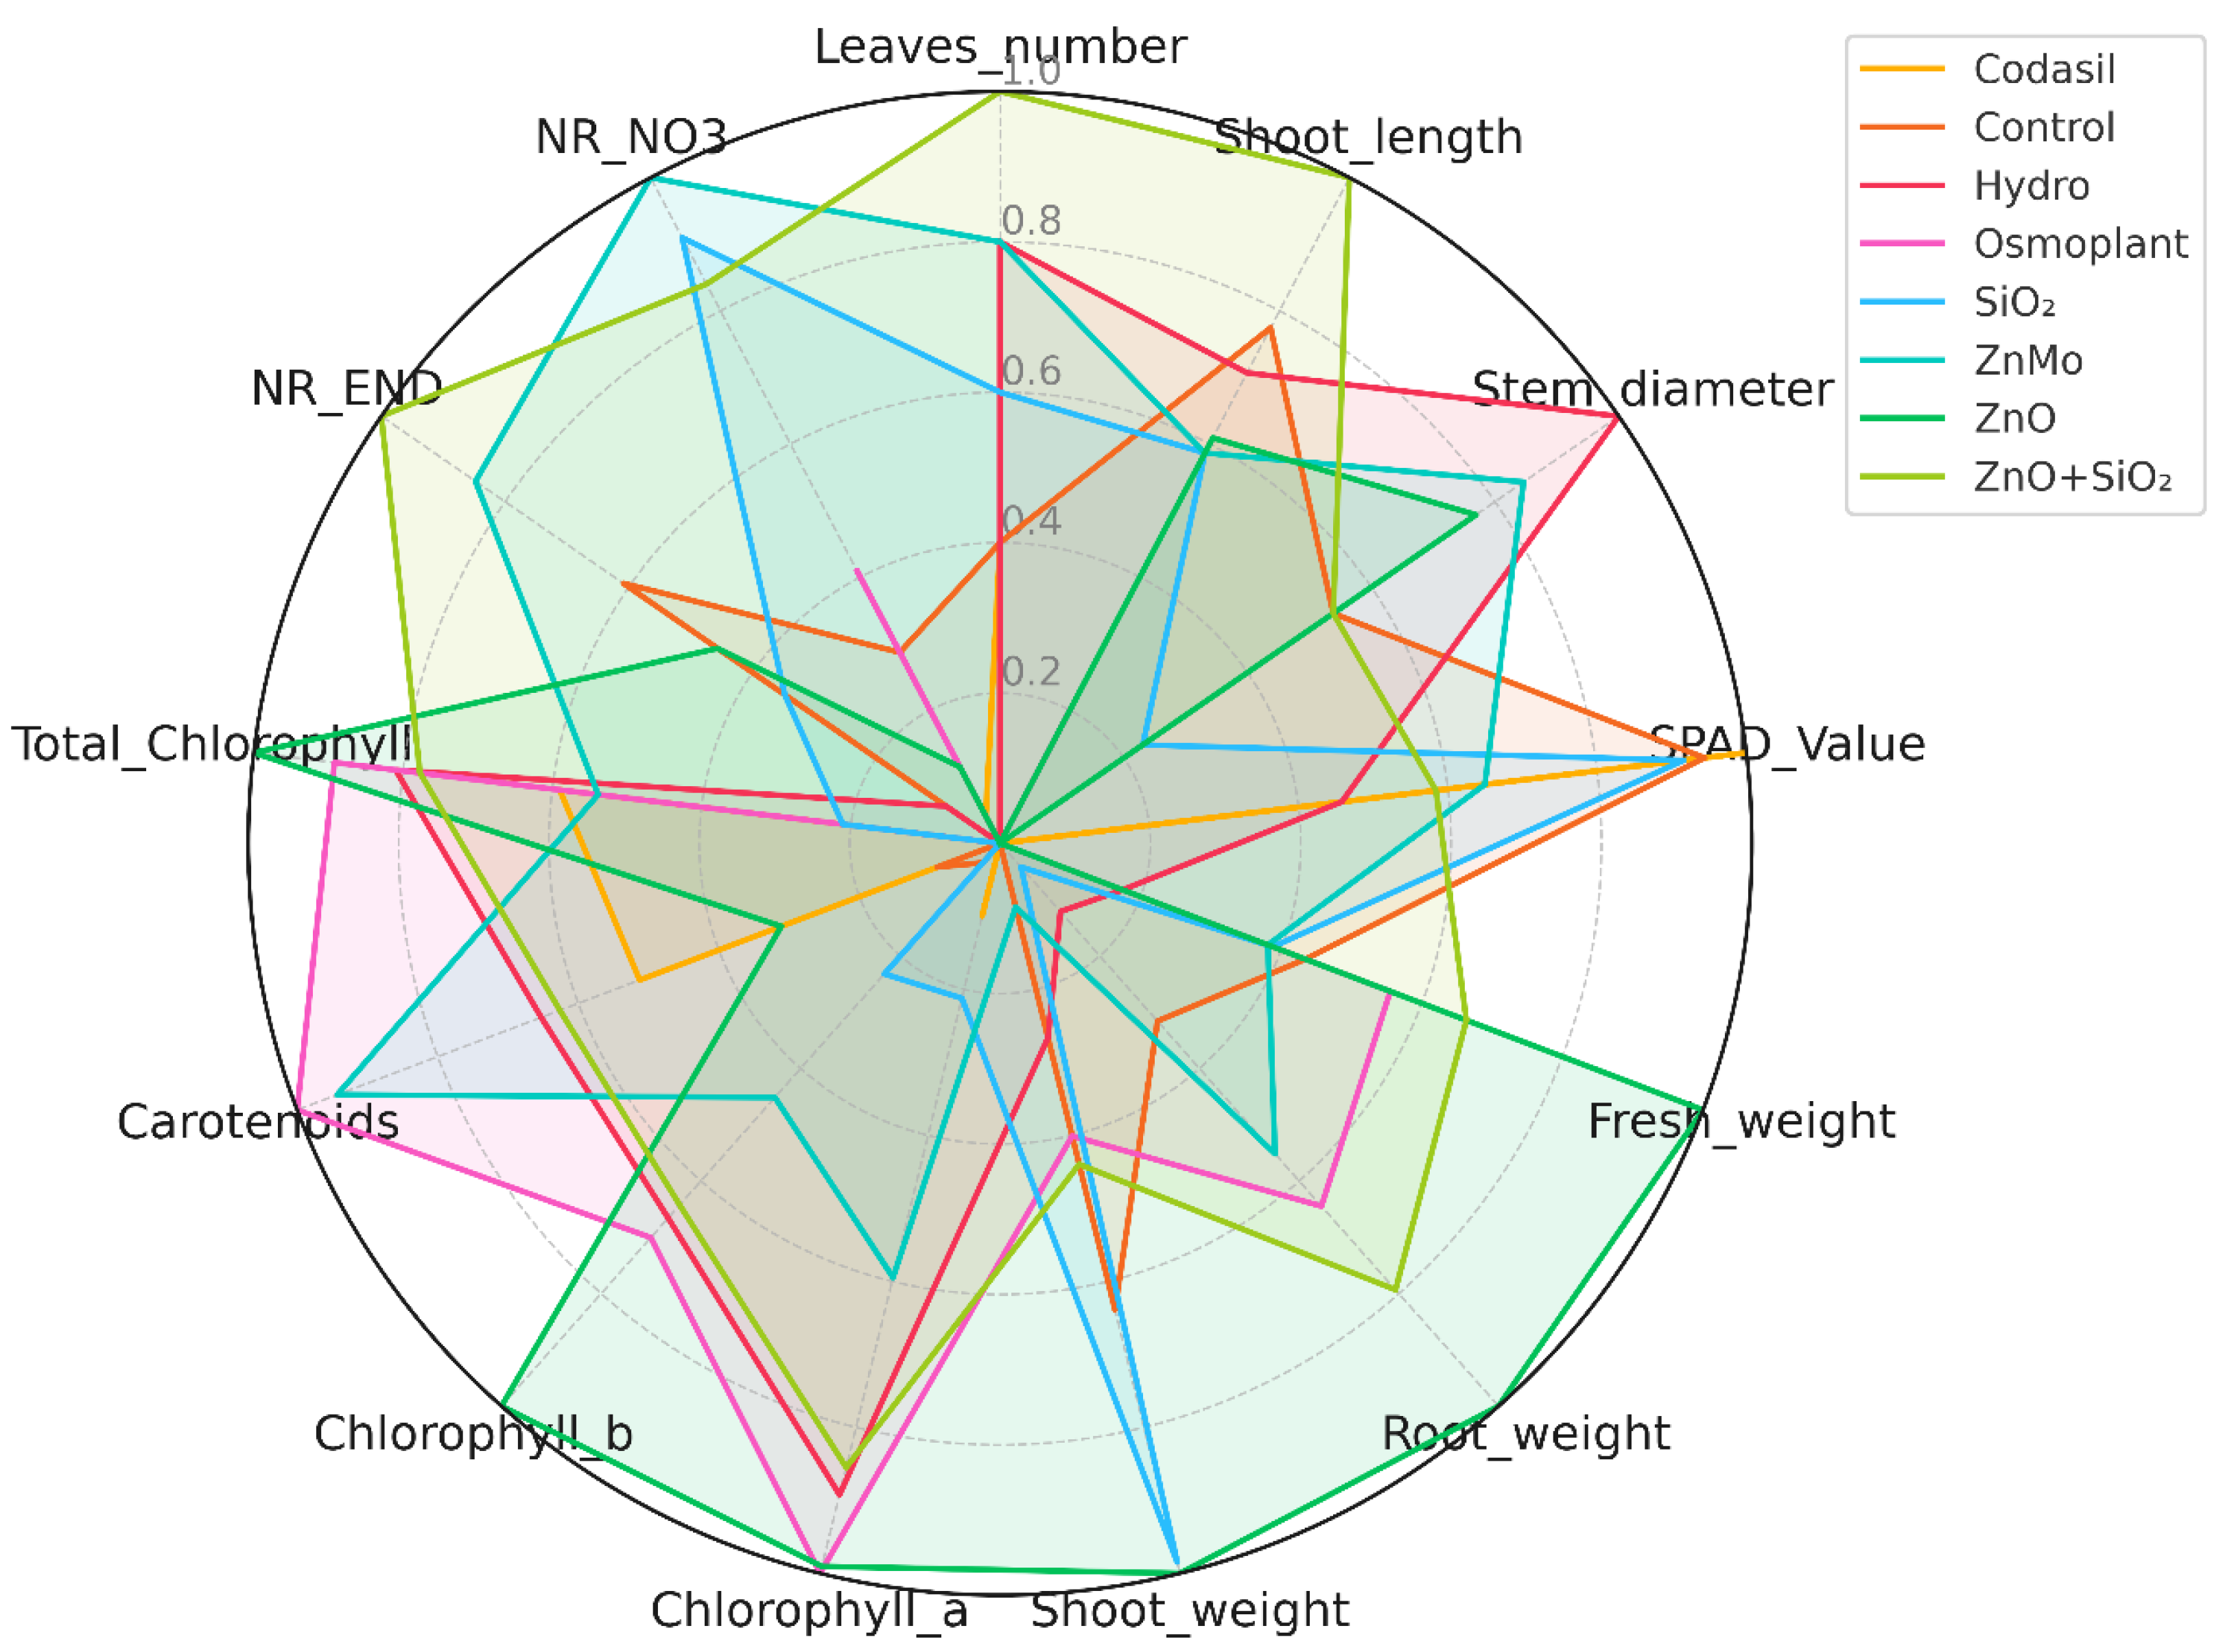
3.8. Radar Chart: Multivariate Comparison by Priming Treatment
Radar chart analysis allows multiple physiological and biochemical variables to be integrated into a single visualization, facilitating comparison between treatments and the identification of complex patterns [
53]. This method is particularly useful for quickly seeing which treatments offer the most balanced or outstanding responses across several parameters.
In our experiment, variables were normalized to allow proportional comparisons between treatments in
C. annuum L. (
Figure 11). The treatments with ZnO, ZnO+SiO
2 and ZnMo showed high values in fresh biomass (stem and root) and photosynthetic pigmentation (chlorophyll a, b and total), reflecting their positive effect on development and photosynthetic activity. Codasil and SiO
2 NPs, on the other hand, exhibited smaller areas on the radar, indicating less robust physiological responses.
Likewise, some treatments, such as SiO
2 NPs and Codasil, showed higher relative values in nitrate reductase activity (NR END and NR NO
3-), suggesting a metabolic orientation toward nitrogen assimilation rather than structural growth. A similar approach has been used in studies of wheat under drought conditions, where radar charts were useful in demonstrating differences between genotypes in response to stress [
53].
In summary, the radar chart complements PCA, providing a clear and intuitive visual view of the multivariate profiles of the treatments, and supports that treatments with zinc nanoparticles promote a more comprehensive response in seedlings of C. annuum L.
4. Conclusions
This study demonstrates that nanopriming with ZnO and ZnO+SiO2 significantly enhances the physiological quality of C. annuum L. seedlings. These treatments promoted vigorous root development, balanced biomass allocation, and increased chlorophyll and carotenoid contents, while also improving nitrate reductase activity, thus generating a compact but functionally robust seedling profile.
Multivariate analyses (PCA, correlation heatmap, and radar chart) confirmed that ZnO and ZnO+SiO2 treatments consistently outperformed hydropriming, commercial biostimulants, and the control by integrating morphological, photosynthetic, and biochemical responses into a more resilient physiological framework.
Overall, our findings provide novel insights into the potential of nanoparticle-based priming as a biotechnological strategy to strengthen seedling vigor, facilitate successful transplantation, and enhance the resilience of jalapeño pepper production systems under high physiological demand. These results open opportunities for sustainable horticultural practices by integrating nanotechnology into early crop management.
Author Contributions
The authors confirm their contribution to the paper as follows: study conception and design: E.H.O.-C. and E.S.; data collection: J.J.P.-C. and C.L.F.-L.; analysis and interpretation of results: J.C.A.-P. and A.A.M.; draft manuscript preparation: E.H.O.-C. and E.S. All authors have read and agreed to the published version of the manuscript.
Funding
This research received no external funding.
Institutional Review Board Statement
Not applicable.
Informed Consent Statement
Not applicable.
Data Availability Statement
The authors declare that all data discussed in this study are available in the manuscript.
Acknowledgments
We would like to thank the Center for Research on Food and Development and the Technological University of Camargo Meoqui Unit for their support in granting us permission to use their laboratories and equipment.
Conflicts of Interest
The authors declare no conflicts of interest.
Abbreviations
| The following abbreviations are used in this manuscript |
. |
| ANOVA |
Analysis of variance |
| Ch |
Chitosan |
| Chl a |
Chlorophyll a |
| Chl b |
Chlorophyll b |
| Chl total |
Chlorophyll total |
| FW |
Fresh weight |
| NPs |
Nanoparticles |
| NR |
Nitrate reductase |
| PCA |
Principal component analysis |
| PC1 |
Principal component 1 |
| PC2 |
Principal component 2 |
| SiO2
|
Silicon dioxide |
| ZnMo |
Zinc-Molybdenum nano |
| ZnO |
Zinc oxide |
References
- Verma, K.K.; Song, X.P.; Joshi, A.; Tian, D.D.; Rajput, V.D.; Singh, M.; Li, Y.R. Recent trends in nano-fertilizers for sustainable agriculture under climate change for global food security. Nanomaterials 2022, 12, 173. [Google Scholar] [CrossRef]
- Gu, Z.; Hu, C.; Gan, Y.; Zhou, J.; Tian, G.; Gao, L. Role of microbes in alleviating crop drought stress: A review. Plants 2024, 13, 384. [Google Scholar] [CrossRef]
- Xu, G.; Fan, X.; Miller, A.J. Plant nitrogen assimilation and use efficiency. Annu. Rev. Plant Biol. 2012, 63, 153–182. [Google Scholar] [CrossRef]
- Kaur, B.; Kaur, G.; Asthir, B. Biochemical aspects of nitrogen use efficiency: An overview. J. Plant Nutr. 2017, 40, 506–523. [Google Scholar] [CrossRef]
- Shah, A.N.; Javed, T.; Singhal, R.K.; Shabbir, R.; Wang, D.; Hussain, S.; Jaremko, M. Nitrogen use efficiency in cotton: Challenges and opportunities against environmental constraints. Front. Plant Sci. 2022, 13, 970339. [Google Scholar] [CrossRef] [PubMed]
- Elhefnawy, S.M.; Elsheery, N.I. Use of nanoparticles in improving photosynthesis in crop plants under stress. In Photosynthesis; Academic Press: Cambridge, MA, USA, 2023; pp. 105–135. [Google Scholar]
- Aliniaeifard, S.; Esmaeili, S.; Eskandarzade, P.; Sharifani, M.; Lastochkina, O. Nanotechnology in regulation of growth and stress tolerance in vegetable crops. In Growth Regulation and Quality Improvement of Vegetable Crops: Physiological and Molecular Features; Springer: Singapore, 2025; pp. 653–690. [Google Scholar]
- Tang, R.; Supit, I.; Hutjes, R.; Zhang, F.; Wang, X.; Chen, X.; Chen, X. Modelling Growth of Chili Pepper (Capsicum annuum L.) with the WOFOST Model. Agricultural Systems 2023, 209, 103688. [Google Scholar] [CrossRef]
- Dobón-Suárez, A.; Zapata, P.J.; García-Pastor, M.E. A Comprehensive Review on Characterization of Pepper Seeds: Unveiling Potential Value and Sustainable Agrifood Applications. Foods 2025, 14, 1969. [Google Scholar] [CrossRef] [PubMed]
- Baenas, N.; Belović, M.; Ilic, N.; Moreno, D.A.; García-Viguera, C. Industrial Use of Pepper (Capsicum annuum L.) Derived Products: Technological Benefits and Biological Advantages. Food Chem. 2019, 274, 872–885. [Google Scholar] [CrossRef]
- Ntanasi, T.; Karavidas, I.; Savvas, D.; Spyrou, G.P.; Giannothanasis, E.; Consentino, B.B.; Ntatsi, G. Physiological and Yield Responses of Pepper (Capsicum annuum L.) Genotypes to Drought Stress. Plants 2025, 14, 1934. [Google Scholar] [CrossRef]
- Cañizares, E.; Giovannini, L.; Gumus, B.O.; Fotopoulos, V.; Balestrini, R.; González-Guzmán, M.; Arbona, V. Seeds of Change: Exploring the Transformative Effects of Seed Priming in Sustainable Agriculture. Physiol. Plant. 2025, 177, e70226. [Google Scholar] [CrossRef]
- Costa, C.J.; Meneghello, G.E.; Jorge, M.H.A.; Costa, E. The Importance of Physiological Quality of Seeds for Agriculture. Colloq. Agrar. 2021, 17, 102–119. [Google Scholar] [CrossRef]
- Azimi, R. Influence of nanoparticles on photosynthesis. In Nanotechnology Applications in Plant Physiology; Taylor & Francis: London, UK, 2024. [Google Scholar]
- Khan, A.A.H. Plant physiological responses to engineered nanoparticles. In Plant-Microbes-Engineered Nanoparticles (PM-ENPs) Nexus in Agro-Ecosystems; Rakshit, M., Singh, S.K., Rakshit, A.R., Eds.; Springer: Cham, Switzerland, 2021; pp. 85–99. [Google Scholar]
- Singh, N.; Bhuker, A.; Jeevanadam, J. Effects of metal nanoparticle-mediated treatment on seed quality parameters of different crops. Naunyn-Schmiedeberg’s Arch. Pharmacol. 2021, 394, 1067–1089. [Google Scholar] [CrossRef]
- Nitnavare, R.; Bhattacharya, J.; Ghosh, S. Nanoparticles for effective management of salinity stress in plants. In Agricultural Nanobiotechnology; Woodhead Publishing: Duxford, UK, 2022; pp. 189–216. [Google Scholar]
- Suriyaprabha, R.; Karunakaran, G.; Yuvakkumar, R.; Prabu, P.; Rajendran, V.; Kannan, N. Growth and Physiological Responses of Maize (Zea mays L.) to Porous Silica Nanoparticles in Soil. Journal of Nanoparticle Research 2012, 14, 1294. [Google Scholar] [CrossRef]
- Tripathi, D.K.; Singh, S.; Singh, V.P.; Prasad, S.M.; Chauhan, D.K.; Dubey, N.K. Silicon Nanoparticles More Efficiently Alleviate Arsenate Toxicity than Silicon in Maize Cultivar and Hybrid Differing in Arsenate Tolerance. Frontiers in Environmental Science 2016, 4, 46. [Google Scholar] [CrossRef]
- Pandya, P.; Kumar, S.; Sakure, A.A.; Rafaliya, R.; Patil, G.B. Zinc oxide nanopriming elevates wheat drought tolerance by inducing stress-responsive genes and physio-biochemical changes. Curr. Plant Biol. 2023, 35, 100292. [Google Scholar] [CrossRef]
- Mazhar, M.W.; Ishtiaq, M.; Hussain, I.; Parveen, A.; Bhatti, K.H.; Azeem, M.; et al. Seed nano-priming with zinc oxide nanoparticles in rice mitigates drought and enhances agronomic profile. PLoS ONE 2022, 17, e0264967. [Google Scholar]
- Haifa Group. NutriNet®: Precision fertigation recommendation software. Haifa-Group.com 2024. https://nutrinet.haifa-group.com/.
- Pasternak, T.; Tietz, O.; Rapp, K.; Begheldo, M.; Nitschke, R.; Ruperti, B.; Palme, K. Protocol: an improved and universal procedure for whole mount immunolocalization in plants. Plant Methods 2015, 11, 50. [Google Scholar] [CrossRef]
- Ochoa-Chaparro, E.H.; Ramírez-Estrada, C.A.; Anchondo-Páez, J.C.; Sánchez, E.; Pérez-Álvarez, S.; Castruita-Esparza, L.U.; Muñoz-Márquez, E.; Chávez-Mendoza, C.; Patiño-Cruz, J.J.; Franco-Lagos, C.L. Nanopriming with zinc–molybdenum in jalapeño pepper on imbibition, germination, and early growth. Agronomy 2024, 14, 1609. [Google Scholar] [CrossRef]
- Wellburn, A.R. The spectral determination of chlorophylls a and b, as well as total carotenoids, using various solvents with spectrophotometers of different resolution. J. Plant Physiol. 1994, 144, 307–313. [Google Scholar] [CrossRef]
- Shrestha, S.; Brueck, H.; Asch, F. Chlorophyll index, photochemical reflectance index and chlorophyll fluorescence measurements of rice leaves supplied with different N levels. J. Photochem. Photobiol. B 2012, 113, 7–13. [Google Scholar] [CrossRef]
- Cunha, A.; Katz, L.; Sousa, A.; Martinez, R.A. Índice SPAD en el crecimiento y desarrollo de plantas de lisianthus en función de diferentes dosis de nitrógeno en ambiente protegido. Idesia (Arica) 2015, 33, 97–105. [Google Scholar] [CrossRef]
- Sánchez, E.; Ruiz, J.M.; Romero, L. Compuestos nitrogenados indicadores de estrés en respuesta a las dosis tóxicas y deficientes de nitrógeno en frijol ejotero. Nova Sci. 2016, 8, 228–244. [Google Scholar] [CrossRef]
- Dudáš, A. Graphical representation of data prediction potential: Correlation graphs and correlation chains. Vis. Comput. 2024, 40, 6969–6982. [Google Scholar] [CrossRef]
- Nokeri, T.C. Principal component analysis with Scikit-Learn, PySpark, and H2O. In Data Science Solutions with Python; Apress: Berkeley, CA, USA, 2022; pp. 101–110. [Google Scholar]
- Sujata; Goyal, V. ; Baliyan, V.; Avtar, R.; Mehrotra, S. Alleviating Drought Stress in Brassica juncea (L.) Czern & Coss. by Foliar Application of Biostimulants—Orthosilicic Acid and Seaweed Extract. Appl. Biochem. Biotechnol. 2023, 195, 693–721. [Google Scholar]
- SAS Institute Inc. SAS/STAT® 15.3 User’s Guide; SAS Institute Inc.: Cary, NC, USA, 2023. [Google Scholar]
- Gallegos-Cedillo, V.M.; Diánez, F.; Nájer, C.; Santos, M. Plant agronomic features can predict quality and field performance: A bibliometric analysis. Agronomy 2021, 11, 2305. [Google Scholar] [CrossRef]
- Tatari, M.; Jafari, A.; Shirmardi, M.; Mohamadi, M. Using Morphological and Physiological Traits to Evaluate Drought Tolerance of Pear Populations (Pyrus spp.). Int. J. Fruit Sci. 2020, 20, 837–854. [Google Scholar] [CrossRef]
- Gazal, R.M.; Blanche, C.A.; Carandang, W.M. Root Growth Potential and Seedling Morphological Attributes of Narra (Pterocarpus indicus Willd.) Transplants. For. Ecol. Manag. 2004, 195, 259–266. [Google Scholar] [CrossRef]
- Dey, D.C.; Parker, W.C. Morphological Indicators of Stock Quality and Field Performance of Red Oak (Quercus rubra L.) Seedlings Underplanted in a Central Ontario Shelterwood. New For. 1997, 14, 145–156. [Google Scholar] [CrossRef]
- Tsakaldimi, M.; Zagas, T.; Tsitsoni, T.; Ganatsas, P. Root Morphology, Stem Growth and Field Performance of Seedlings of Two Mediterranean Evergreen Oak Species Raised in Different Container Types. Plant Soil 2005, 278, 85–93. [Google Scholar] [CrossRef]
- Chen, J.; Ji, F.; Gao, R.; He, D. Enhancing Transplant Quality by Optimizing LED Light Spectrum to Advance Post-Transplant Runner Plant Propagation in Strawberry. Int. J. Agric. Biol. Eng. 2025, 18, 55–62. [Google Scholar] [CrossRef]
- Leskovar, D.I.; Othman, Y.A. Direct Seeding and Transplanting Influence Root Dynamics, Morpho-Physiology, Yield, and Head Quality of Globe Artichoke. Plants 2021, 10, 899. [Google Scholar] [CrossRef] [PubMed]
- Karwat, H.; Sparke, M.-A.; Rasche, F.; Arango, J.; Nuñez, J.; Rao, I.; Moreta, D.; Cadisch, G. Nitrate Reductase Activity in Leaves as a Plant Physiological Indicator of In Vivo Biological Nitrification Inhibition by Brachiaria humidicola. Plant Physiol. Biochem. 2019, 135, 113–120. [Google Scholar] [CrossRef]
- Oliveira Ferreira, E.V. Nitrate Reductase (NR) and Glutamine Synthetase (GS) Can Be Used as Indicators of Nitrogen Status in Eucalyptus Clones. Crop J. 2015, 9, 561–569. [Google Scholar]
- Cao, X.; Shen, Q.; Shang, C.; Yang, H.; Liu, L.; Cheng, J. Determinants of Shoot Biomass Production in Mulberry: Combined Selection with Leaf Morphological and Physiological Traits. Plants 2019, 8, 118. [Google Scholar] [CrossRef]
- Shah, S.H.; Houborg, R.; McCabe, M.F. Response of Chlorophyll, Carotenoid and SPAD-502 Measurement to Salinity and Nutrient Stress in Wheat (Triticum aestivum L.). Agronomy 2017, 7, 61. [Google Scholar] [CrossRef]
- Carreño Siqueira, J.A.; Marques, D.J.; Silva, M.C.G. The Use of Photosynthetic Pigments and SPAD Can Help in the Selection of Bean Genotypes under Fertilization Organic and Mineral. Sci. Rep. 2023, 13, 49582. [Google Scholar] [CrossRef]
- Lai, W.; Lu, L.; Shang, Y.; Ran, X.; Liu, Y.; Fang, Y. Can SPAD Values and CIE L a b* Scales Predict Chlorophyll and Carotenoid Concentrations in Leaves and Diagnose the Growth Potential of Trees? J. Plant Nutr. 2024, 47, 113–123. [Google Scholar]
- Nile, S.H.; Thiruvengadam, M.; Wang, Y.; Samynathan, R.; Shariati, M.A.; Rebezov, M.; Liu, X.; Rebezov, M.B.; Kai, G. Nano-Priming as Emerging Seed Priming Technology for Sustainable Agriculture—Recent Developments and Future Perspectives. J. Nanobiotechnol. 2022, 20, 254. [Google Scholar] [CrossRef]
- Mahakham, W.; Sarmah, A.K.; Maensiri, S.; Theerakulpisut, P. Nanopriming Technology for Enhancing Germination and Starch Metabolism of Aged Rice Seeds Using Phytosynthesized Silver Nanoparticles. Sci. Rep. 2017, 7, 8263. [Google Scholar] [CrossRef] [PubMed]
- Wang, H.; Li, J.; Liu, H.; Chen, S.; Zaman, Q.U. Variability in Morpho-Biochemical, Photosynthetic Pigmentation, Enzymatic and Quality Attributes of Potato for Salinity Stress Tolerance. Sci. Hortic. 2023, 316, 111236. [Google Scholar] [CrossRef] [PubMed]
- Boonupara, T.; Udomkun, P.; Kajitvichyanukul, P. Quantitative Analysis of Atrazine Impact on UAV-Derived Multispectral Indices and Correlated Plant Pigment Alterations: A Heatmap Approach. Agronomy 2024, 14, 814. [Google Scholar] [CrossRef]
- Gewers, F.L.; Ferreira, G.R.; de Arruda, H.F.; Silva, F.N.; Comin, C.H.; Amancio, D.R.; da, F. Costa, L. Principal Component Analysis: A Natural Approach to Data Exploration. arXiv 2018, arXiv:1804.02502. [Google Scholar]
- Sivakumar, J.; Sharma, L.; Thiruppathi, S.; Manikandan, R.; Subramanian, K.S. Principal Component Analysis Approach for Comprehensive Assessment of Salt Tolerance among Tomato Germplasm at the Seedling Stage. J. Biosci. 2020, 45, 144. [Google Scholar] [CrossRef]
- Shlens, J. A Tutorial on Principal Component Analysis. arXiv 2014, arXiv:1404.1100. [Google Scholar] [CrossRef]
- Ahmed, H.G.M.D.; Ullah, A.; Bhutta, M.A.; Bibi, A.; Farooq, U. Radar Analysis of Spring Wheat Genotypes at Seedling Stage against Limited Water Conditions. Agronomy 2022, 12, 1307. [Google Scholar] [CrossRef]
Figure 1.
Morphology of the sample by Transmission Electron Microscopy (TEM), (A) ZnO, (B) SiO2.
Figure 1.
Morphology of the sample by Transmission Electron Microscopy (TEM), (A) ZnO, (B) SiO2.
Figure 2.
Effect of different priming treatments on the growth parameters of C. annuum L. seedlings: (a) stem length, (b) stem diameter, and (c) number of leaves. Bars represent the mean ± standard error. Different letters above the bars indicate statistically significant differences among treatments according to Fisher’s LSD test (p ≤ 0.05).
Figure 3.
Effect of different priming treatments on biomass accumulation in C. annuum L. seedlings: (a) total fresh weight, (b) aerial fresh weight, and (c) root fresh weight. Bars represent the mean ± standard error. Different letters above the bars indicate statistically significant differences among treatments according to Fisher’s LSD test (p ≤ 0.05).
Figure 4.
Representative view of the development of jalapeño pepper seedlings (C. annuum L.) under different priming treatments. Each box shows five seedlings obtained after the germination and early growth period. From left to right and top to bottom, the treatments are: (a) Control: seeds without prior treatment. (b) Hydropriming: seeds soaked in water for the established time (primed with water). (c) ZnO NPs: seeds treated with zinc oxide NPs. (d) SiO2 NPs: seeds treated with silicon dioxide NPs. (e) ZnO+SiO2 NPs: seeds treated with a mixture of ZnO and SiO2 NPs. (f) Zn+Mo NPs: seeds treated with zinc and molybdenum NPs. (g) Osmoplant: seeds treated with the commercial biostimulant Osmoplant. (h) Codasil: seeds treated with the commercial product Codasil. The roots and aerial parts of the seedlings are shown to illustrate the differences in vigor and root development associated with each treatment.
Figure 5.
Effect of different priming treatments on photosynthetic pigments in C. annuum L. seedlings: (a) chlorophyll a, (b) chlorophyll b, (c) total chlorophyll, and (d) carotenoids. Bars represent the mean ± standard error. Different letters above the bars indicate statistically significant differences among treatments according to Fisher’s LSD test (p ≤ 0.05).
Figure 6.
The chlorophyll index (SPAD values) of C. annuum L. seedlings. The bars represent the mean ± standard error. Different letters indicate statistically significant differences (p ≤ 0.05) according to Fisher’s LSD test.
Figure 6.
The chlorophyll index (SPAD values) of C. annuum L. seedlings. The bars represent the mean ± standard error. Different letters indicate statistically significant differences (p ≤ 0.05) according to Fisher’s LSD test.
Figure 7.
Effect of different priming treatments on endogenous nitrate reductase activity (µmol NO2- g−1 h−1 FW) in C. annuum L. seedlings. Bars represent the mean ± standard error. Different letters indicate statistically significant differences (p ≤ 0.05) according to Fisher’s LSD test.
Figure 7.
Effect of different priming treatments on endogenous nitrate reductase activity (µmol NO2- g−1 h−1 FW) in C. annuum L. seedlings. Bars represent the mean ± standard error. Different letters indicate statistically significant differences (p ≤ 0.05) according to Fisher’s LSD test.
Figure 8.
Effect of different priming treatments on nitrate-induced nitrate reductase activity (µ mol NO2- g−1 h−1 FW) in seedlings of C. annuum L. Bars represent the mean ± standard error. Different letters indicate statistically significant differences (p ≤ 0.05) according to Fisher’s LSD test.
Figure 8.
Effect of different priming treatments on nitrate-induced nitrate reductase activity (µ mol NO2- g−1 h−1 FW) in seedlings of C. annuum L. Bars represent the mean ± standard error. Different letters indicate statistically significant differences (p ≤ 0.05) according to Fisher’s LSD test.
Figure 9.
Heat map of the Pearson correlation matrix between physiological and biochemical variables in seedlings of C. annuum L. The numerical values correspond to Pearson’s correlation coefficients (r), which range from –1 to +1, where values close to +1 indicate a perfect positive correlation, values close to –1 indicate a perfect negative correlation, and values close to 0 indicate no linear relationship. The asterisks indicate the level of statistical significance determined by the Student’s t-test (*p ≤ 0.05; **p ≤ 0.01; ***p ≤ 0.001). The colors represent the direction and magnitude of the correlations: red tones for positive correlations and blue tones for negative correlations.
Figure 10.
Principal component analysis (PCA) performed on standardized data using Pearson’s correlation method. The PC1 and PC2 axes represent the first two principal components and explain the largest proportion of the total variance in the data set. The colored ellipses correspond to 95% confidence intervals for each group, generated using kernel density estimation (KDE) applied to the PC1 and PC2 coordinates. The visualization allows the distribution, trend, and dispersion of the multivariate data in the space of the first two principal components to be identified. The analysis and construction of the ellipses were performed using the Seaborn (kdeplot) package in Python, which estimates probability regions from the bivariate distribution of the points.
Figure 11.
Radar chart of the average physiological and biochemical responses of C. annuum L. seedlings according to the treatment applied. The variables were normalized using min-max scaling for proportional representation in a range from 0 to 1. The colored lines represent the profiles of each treatment. The chart provides an integrated view of the magnitude and distribution of the responses in the data set.
Table 1.
Treatment, chemical composition of priming’s and doses applied on C. annuum L. seeds.
Table 1.
Treatment, chemical composition of priming’s and doses applied on C. annuum L. seeds.
| Treatment |
Chemical Composition |
Doses |
| Control |
Not applicable |
Not applicable |
| Hydropriming |
Tridistilled water |
Not applicable |
| NPs ZnO + Ch |
<50 nm, 99.9% and Poli-D-glucosamine |
(100 and 100 mg L−1) |
| NPs SiO2 + Ch |
<80 nm, 99.9% and Poli-D-glucosamine |
(10 and 100 mg L−1) |
| NPs ZnO + SiO2 + Ch |
<50 nm, 99.9%, <80 nm, 99.9% and Poli-D-glucosamine |
(100, 10 and 100 mg L−1) |
| NPs Zn + Mo |
Liquid solution composed of 62% Zn, 5% Mo, and 5% of an algae extract-based chelating agent. |
(124 and 10 mg L−1) |
| Osmoplant® |
Liquid solution composed of 6% free amino acids, 2.4% nitrogen and 3.3% potassium. |
(2000 mL L−1) |
| Codasil® |
Liquid solution with a high concentration of soluble silicon composed of 20% silicon, 4% free amino acids and 11.20% potassium. |
(2000 mL L−1) |
|
Disclaimer/Publisher’s Note: The statements, opinions and data contained in all publications are solely those of the individual author(s) and contributor(s) and not of MDPI and/or the editor(s). MDPI and/or the editor(s) disclaim responsibility for any injury to people or property resulting from any ideas, methods, instructions or products referred to in the content. |
© 2025 by the authors. Licensee MDPI, Basel, Switzerland. This article is an open access article distributed under the terms and conditions of the Creative Commons Attribution (CC BY) license (http://creativecommons.org/licenses/by/4.0/).