
Submitted:
19 August 2025
Posted:
20 August 2025
You are already at the latest version
Abstract
Purpose: Cross-country (XC) skiing imposes high physiological demands under hypoxic conditions at altitude. Lactate thresholds such as Onset Blood Lactate Accumulation at 4 mmol/L (OBLA4) and lactate plus 1 mmol/L above baseline (Bsln+1.0) are crucial for tracking performance. This study investigates physiological responses in junior XC skiers under normoxic and hypoxic conditions before (PreCs) and after (PosCs) the competitive season. Material and Methods: 9 national-level XC skiers performed a Graded Exercise Test (GXT) on a treadmill using roller skis in both normoxic and hypoxic conditions in PreCS and PosCS. Heart rate, slope (treadmill inclination), and lactate thresholds (Bsln+1.0 and OBLA4) were measured. Results: Significant differences were found between PreCs and PosCs in hypoxia for maximum and heart rate (p< 0.05). Estimated slopes at Bsln+1.0 and OBLA4 were lower in hypoxia compared to normoxia in PreCs (p= 0.005, d = -1.29 for Bsln+1.0 and p= 0.013, d = -1.06 for OBLA4). In PosCs, lower impairment effect of hypoxia exposure under slope at OBLA4 was found (p= 0.02, d = -0.95). Positive correlations were found between heart rate and slope for Bsln+1.0 and OBLA4 in PreCs in normoxia and hypoxia, becoming stronger at PosCs, especially under hypoxia. Delta values showed: the higher the slope at Bsln+1.0 and OBLA 4 in normoxia was, the greater the decrease between normoxia and hypoxia was. Conclusion: Physiological changes in junior XC skiers after training and competition in normoxic and hypoxic conditions highlight the importance of hypoxic environments for assessing and monitoring performance throughout the season.
Keywords:
altitude
; anaerobic threshold
; cross-country skiing
; hypoxia
; lactate
1. Introduction
Cross-country skiing (XC) is recognised as one of the principal endurance sports globally, with energy production and movement efficiency being critical determinants of performance. In XC, athletes must sustain energy production throughout competitions to execute technical movements at high intensity levels. The demands of XC competitions centre on skiers' ability to generate energy, enabling them to traverse snow-covered terrain with skis, tackle uphill sections and recover on downhill areas (1), while completing laps over the race distance (Sandbakk & Holmberg, 2017; Shang et al., 2022). XC competitions range from 1.3-1.8 km sprint races to 10-50 km time trials and mass start races, lasting between approximately 3 minutes and 2 hours, often conducted at altitudes between sea level and 1800 meters above sea level (m.a.s.l) (Sandbakk & Holmberg, 2017).
To achieve optimal performance, athletes require high values of maximum oxygen consumption (VO2max) (Carlsson et al., 2012), peak oxygen consumption (VO2peak) (Ingjer, 1991; Larsson et al., 2002; Sandbakk & Holmberg, 2017), anaerobic capacity (Larsson et al., 2002; Sandbakk & Holmberg, 2017), Gross Efficiency (GE) (Sandbakk et al., 2010), and the ability to sustain efforts at high VO2 values relative to VO2peak (Larsson et al., 2002; Sandbakk & Holmberg, 2017). The relative importance of these factors varies with race type. For instance, higher VO2 values at Onset Blood Lactate Accumulation of 4 mmol /L (OBLA4) correlate with performance in elite male skiers over race distances from 5 to 30 km (r =-0.829 to -0.964) and in elite female skiers over race distances from 2.5 to 15 km (r =-0.715 to 0.810) (Larsson et al., 2002). Additionally, the relative work intensity at OBLA4 shows significant correlations with the International Federation competition ranking (CINR) (Carlsson et al., 2012) and the 15 km skiing time at the National Swedish Championships (15kmSwedNat) (Carlsson et al., 2012). External load increases at 1 mmol/L above the lowest lactate value (Bsln+1.0) during the graded exercise test (GXT) also correlates with CINR (r=-0.699), 15kmSwedNat (r=-0.718) and 30 km skiing times for the Swedish National championships (r=-0.682) (Carlsson et al., 2012).
However, specific physiological tests present challenges in linking laboratory test variables to real-world performance in junior race distances. Junior skiers (aged 14 to15) compete in shorter sprints of 1.0-2.5 km and longer races of 5.0-7.5 km which differ from elite formats. Aerobic power, measured as VO2peak, is associated with muscle mass increases and maturation status, key determinant of performance in youth XC skiing (Stöggl et al., 2023). VO2peak significantly contributes to performance in 3-minute time trials for junior male and female XC skiers (Sollie & Losnegard, 2022).
Despite well-established physiological factors influencing performance in elite XC skiers, there is a lack of comprehensive evidence explaining performance in junior skiers. Specifically, the role of external and internal variables, measured before and after the competitive season, remains insufficiently explored, leaving gaps in our understanding of how these variables contribute to performance changes across a competitive season in junior XC skiers.
Additionally, considering the impact of altitude exposure, the effects of acclimatisation for competing at moderate altitudes (Chapman et al., 2013) could be interesting to know how enhancements in performance in XC ski are developed. Investigating how altitude interacts with these external and internal variables before and after the competitive season may provide valuable insights into the multifaceted physiological factors affecting performance in junior XC skiers.
Based on these physiological mechanisms, this study aims to: 1) Compare performance variables in junior XC skiers between normoxic and hypoxic conditions before and after the competitive season; 2) Analyse the differences in performance variables between normoxia and hypoxia tests after the competitive season; and 3) Examine the relationship between physiological variables measured in normoxia and hypoxia, before and after the training and competitive season.
2. Material and Methods
2.1. Participants
Eight male and two female XC skiers participated in the study (age 16.1 ± 3.0 years, body mass 62.16 ± 11.1 kg). All participants were part of the technical training group of the Navarre Sky Federation (Spain), had a minimum of 2 years of experience in the XC skiing competitions, and participated in national-level races. All participants and their parents gave written consent after being informed of the study procedures. Due to an injury during the study, one male participant was excluded, resulting in a final sample of nine participants.
2.2. Procedure
Participants attended the laboratory at two points in the season. The first tests (September 2023) were conducted prior to the competitive period (PreCs), (October 2023), during which training routines included ski roller sessions on the road, running, and strength and conditioning sessions. The second tests (March 2024) were conducted at the end of the competitive period, one week after the last competition (i.e. the National Championships race) (PosCs). On each occasion, participants completed two laboratory tests on separate days, one under normoxic and the other under hypoxic conditions, with a 48-hour rest period between tests to ensure adequate recovery and consistent testing conditions. Participants were instructed to refrain from vigorous exercise and alcohol ingestion for 48 hours prior to testing (Fabre et al., 2012).
The tests were conducted on a motorised treadmill measuring 3 x 4 m. Each session consisted of a Graded Exercise Test (GXT) with 3-minute exercise bouts separated by 30-second pauses at the end of each step for capillary blood sample collection for subsequent lactate analysis. The treadmill speed was kept constant at 9 km/h for women and 10 km/h for men, with the slope starting at 1% and increasing by 1% every 3 minutes (Fabre et al., 2010). Participants used the classical diagonal stride technique (Sandbakk & Holmberg, 2017) throughout all test stages. Familiarisation was achieved with a 5-minute warm-up at 8 km/h for both men and women.
Exposure to hypoxic or normoxic conditions was randomised across PreCs and PosCs. Participants wore a non-return breathing mask (Hypoxico Biolaster, Biolaster®, Andoain, Spain) connected to a normobaric altitude generator (Hypoxico, Hypoxico, Inc.®, New York, USA). The normoxic test session was conducted at an equivalent Fraction of Inspired Oxygen (FiO2) of 0.209 at 450 m.a.s.l., while the hypoxic conditions simulated an altitude of 2300 m.a.s.l. with a corresponding FiO2 = 0.16. Participants were blinded to the experimental condition, helping to eliminate biases and ensure that any differences in their performance were not influenced by their knowledge of the environment.
HR was continuously recorded using a Polar H10 monitor (Polar Electro Oy®, Kempele, Finland) and averaged over the final 30 seconds of each step. Blood lactate accumulation was measured by collecting capillary blood samples from the earlobe during the 30-second rest period between steps and analysed using a Lactate Pro 2 analyser (Lactate Pro, Arkray, KDK Corporation®, Kyoto, Japan) (Raa et al., 2020).
2.3. Data Analysis
Heart rate is presented as beats per minute (bpm) and slope is presented as the percentage of treadmill inclination (%). Both parameters were calculated at a lactate concentration of Baseline lactate plus an increment of 1 mmol/L (Bsln+1.0) (Pfitzinger & Freedson, 1998) and at a fixed concentration of 4 mmol/L (OBLA4) (Carlsson et al., 2012; Jakobsson & Malm, 2019). A third-order polynomial curve was used to calculate these points. Bsln+1.0 and OBLA4 were calculated using the “Lactater” package (Mattioni Maturana F (2023). Lactater: Tools for Analyzing Lactate Thresholds. R package version 0.2.0.)
2.4. Statistical Analysis
Values are expressed as mean ± standard deviation (SD). Normality was assessed using the Shapiro-Wilk test and subsequently re-evaluated with a Quantile-Quantile plot. Differences between normoxia and hypoxia test conditions within PreCs or PosCs were examined using a paired T-test. Differences between PreCs and PosCs tests in normoxia or hypoxia were initially considered for analysis of variance (ANOVA), but due to the small sample size and normality of results, Wilcoxon’s test was used. Correlation analysis was performed using Pearson´s coefficient of correlation (r).
The probability values from the statistical tests performed (p), the mean difference expressed as a percentage (difference), and the effect sizes (d) are provided, with the latter classified assmall (d = 0.2), medium (d = 0.5) and large (d ≥ 0.8) (Cohen, 1988). Confidence intervals (CI) at 95% were provided where applicable.
Based on previous studies, the main effect of altitude exposure on performance variables at 2000 m.a.s.l is approximately a 15-15.6 % decrease from sea level values (Clark et al., 2007; Fulco et al., 1998). Following this, an effect size of 1.1 (Cohen´s d) (Cohen, 1988) was set as a minimum detectable. The statistical power of the study was set at 80%, with alpha levels at 0.05. Considering the same group intervention in both hypoxia and normoxia tests, the mean fixed value was 0, with the means and standard deviations of Group 1 and Group 2 being considered equal. Using the group characteristics and statistical requirements mentioned earlier, the estimated sample size was 9 participants, with a non-centrality parameter of 3.3, a Type I error rate of 0.05, and a Type II error rate of 0.2.
All statistical analyses were performed using R Studio (RStudio Team, 2020. RStudio: Integrated Development for R. RStudio, PBC, Boston, MA. URL http://www.rstudio.com/). The statistical significance threshold was set at p ≤ 0.05.
3. Results
The maximum values of lactate, heart rate, and slope reached during the GXT in normoxia and hypoxia for PreCs and PosCs are presented in Table 1. There were not significant differences between normoxia and hypoxia in PreCs or PosCs for maximum lactate, heart rate and slope. Conversely, significant differences were observed in maximum lactate and heart rate in hypoxia between PreCs and PosCs, as well as in maximum lactate in normoxia between PreCs and PosCs.
Results of lactate, heart rate, and slope estimated at Bsln+1.0 and OBLA4 in normoxia and hypoxia at PreCs and PosCs are presented in Table 2. The slope estimated in hypoxia at Bsln+1.0 and OBLA4 was statistically different from normoxia values at PreCs. At PosCs, the mean slope at OBLA4 was significantly different between conditions, but for Bsln+1.0 no significant effects were found. The Wilcoxon’s test results did not show significant changes between PreCs and PosCs variables in both hypoxia and normoxia. Lactate at Bsln+1.0 showed no differences between conditions or timepoints, as well as HR at both Bsln+1.0 and OBLA4.
Correlation analysis during GXT under normoxia and hypoxia in PreCs and PosCs is shown in Figure 1. Significant correlations were found in hypoxia at PreCs between heart rate at OBLA4 and heart rate at Bsln+1.0, with a very large effect (r = 0.88, 95% CI [0.51, 0.97], p = 0.002), and a very strong correlation between slope at OBLA4 and slope at Bsln+1.0 (r =0.86, 95% CI [0.44, 0.97], p = 0.003). In normoxia, similar correlations were present, with very strong correlations between heart rate at OBLA4 and heart rate at Bsln+1.0, and between slope at OBLA4 and slope at Bsln+1.0 (r = 0.97, 95% CI [0.85, 0.99], p < .001 and r = 0.97, 95% CI [0.85, 0.99], p < .001, respectively).
In Hypoxia at PosCs, a negative, statistically significant, and very large correlation was found between heart rate at OBLA4 and lactate at Bsln+1.0 (r =-0.72, 95% CI [-0.94, -0.11], p =0.028). Additionally, correlations between heart rate at OBLA4 and heart rate at Bsln+1.0, as well as between slope at OBLA4 and slope at Bsln+1.0, were identified in PosCs with a very large effect (r = 0.93, 95% CI [0.71, 0.99], p < .001 and r =0.86, 95% CI [0.44, 0.97], p = 0.003, respectively). In normoxia, a very large correlation between heart rate at OBLA4 and Bsln+1.0 was still present (r = 0.98, 95% CI [0.91, 1.00], p < .001) along with a very large effect between slope at OBLA4 and Bsln+1.0 (r = 0.97, 95% CI [0.88, 0.99], p < .001). Moreover, Slope at Bsln+1.0 was very largely and positively correlated with heart rate at Bsln+1.0 (r = 0.68, 95% CI [0.03, 0.93], p = 0.043) and slope at OBLA4 was also very largely and positively correlated with heart rate at Bsln+1.0 (r = 0.68, 95% CI [0.02, 0.92], p = 0.046).
Delta of slope at Bsln+1.0 and OBLA4, calculated as the difference in absolute values between hypoxia and normoxia within PreCs or PosCs, are presented in Table 3. Analysing differences in Delta values between PreCs and PosCs, a significant statistic difference was found in Slope at Bsln+1.0
At PreCs, neither Delta in slope at Bsln+1.0 with slope at Bsln+1.0 at normoxia nor Delta values in slope at OBLA4 with slope at OBLA4 at normoxia were significantly correlated, (p=0.819, 95 CI -0.71,0.61, r=-0.089, p=0.593, 95 CI -0.76,0.53, r=-0.206, respectively),
At PosCs, Delta values at Bsln+1.0 were correlated significantly with slope at Bsln+1.0 at normoxia (p=0.048, 95 CI -0.92, -0.00, r=-0.668) and Delta values between hypoxia and normoxia slope estimated at OBLA4 and OBLA4 at normoxia (p=0.031, 95 CI -0.93, -0.09, r=-0.712).
Regression Analysis
At PosCs, Slope at Bsln+1.0 in normoxia explains 37% of variance in Delta of slope at Bsln+1.0 between normoxia and hypoxia (p = 0.049, R2 = 0.45, adjusted R2 = 0.37). In addition,78% of variance of Delta in slope at OBLA4 between normoxia and hypoxia was explained by slope reached at OBLA4 in normoxia (p < .001, R2 =0.51, adjusted R2 = 0.78).
4. Discussion
4.1. Maximal Values During GXT
The findings from this study reveal no significant differences between hypoxia and normoxia at either PreCs or PosCs regarding maximum values of lactate, heart rate, and slope. The absence of differences in maximal external load aligns with previous findings, which indicate that while the fractional utilisation of oxygen consumption for achieving an external load in runners is influenced by hypoxia (FiO2=0.18), the external load achieved by athletes (i.e., race pace) is not modified in a maximal test (Sharma et al., 2019). There was no significant difference in maximal heart rate between hypoxia and normoxia in PreCs and PosCs, contradicting previous findings that acute exposure to hypoxic exercise limits maximum heart rate by 1.3-1.6 beats per minute for every 1000 meters of altitude (Mourot, 2018; Wehrlin & Hallén, 2006). Lactate values were not significantly altered, indicating a comparable physiological response in lactate values measured during a maximal test under normoxic and hypoxic conditions (Mourot, 2018; Wehrlin & Hallén, 2006).
Comparing assessed variables before and after training and competitive season in normoxia or hypoxia, no significant differences were found between the maximal values in heart rate and slope reached in a GXT under normoxic conditions. However, significant changes in maximum lactate in normoxia were observed between PreCs and PosCs. Additionally, under hypoxic conditions, significant changes were found between PreCs and PosCs in values of maximum lactate and heart rate.
A possible explanation for the lack of performance differences in slope estimated at Bsln+1.0 and OBLA4 between PreCs and PosCs within hypoxia or normoxia may arise from potential fatigue effects after the competitive season (Urhausen & Kindermann, 2002). This condition could be attributable to a reduced capacity to reach maximum heart rate as a limited central factor and a shifted metabolic contribution during exercise, as indicated by maximum lactate values (Meeusen et al., 2013). Both variables showed significant reductions after the training and competitive periods in both normoxia and hypoxia conditions. Given this potential detrimental effect, the concept of the fitness-fatigue state in athletes must be acknowledged as a possible confounding factor in assessing performance changes throughout the season in cross-country skiers (Losnegard & Hallén, 2014).
4.2. Slope Values at Bsln+1.0 and OBLA4
Differences in the slope reached at Bsln+1.0 and OBLA4 between hypoxia and normoxia at PreCs suggest a reduction in the submaximal ability to perform under hypoxic conditions at the first and second lactate thresholds detected during a GXT. These changes could be attributed to the altered metabolic demands imposed by hypoxic conditions during exercise (Schüttler et al., 2021; Wehrlin & Hallén, 2006). Specifically, the significant difference in slope at OBLA4 may indicate a modification in the aerobic-anaerobic balance mediated by hypoxic exposure and the close relationship between the external load of OBLA4 and the Maximum Lactate Steady State (MLSS) in XC skiing (Jakobsson & Malm, 2019).
Interestingly, at PosCs, comparing hypoxia and normoxia slope values at Bsln+1.0, results were not statistically different, showing a comparable external load achieved at Bsln+1.0 in tboth conditions, possibly due the effect of training and competitive periods, which allowed to perform under specific hypoxic conditions without an “impaired effect” of hypoxia on low-intensity external load performance. In addition, despite slope values between normoxia and hypoxia at PosCs for OBLA4 were statistically lower in the latter, the mean difference and Cohen´s d value between normoxia and hypoxia at PreCs and PosCs differed, showing a “less impairment effect” in slope decrease during hypoxia GXT tests compared to normoxia at PosCs: from mean difference = -0.85 in PreCs to d = -0.44 in PosCs. These changes could be explained by an “acclimatisation” effect to hypoxia, as athletes trained and competed at altitude between PreCs and PosCs. In fact, an increase of 0.9 km/h (7%) in external load at first ventilatory threshold generated under hypoxic conditions after a training period in hypoxia has been shown before in cycling and running athletes (Dufour et al., 2006; Roels et al., 2007).
Similar PreCs and PosCs values of slope at Bsln+1.0 and OBLA4 within normoxia or hypoxia align with non-significant improvements in VO2 at second ventilatory threshold in Nordic-skiers after training and competitive season (Urhausen & Kindermann, 2002). This could explain the lack of enhancement between PreCs and PosCs slope variables in this study, especially for OBLA4 values of slope, which are strictly related to aerobic-anaerobic contribution during exercise and the possible fatiguing state after the training and competitive periods. Considering this possible detrimental effect of fatigue, the concept of a fitness-fatigue state in athletes must be recognized as a potential confounding factor in evaluating performance changes over the course of the season in cross-country skiers (Losnegard & Hallén, 2014).
4.3. Correlations Between External and Internal Variables
At PreCs in normoxia, correlations between heart rate at Bsln+1.0 and heart rate at OBLA4 and slope at Bsln+1.0 and slope at OBLA4 were found, all with an r value of 0.97. In case of hypoxia, a decreased relationship effect was found, with a r = 0.88 between heart rate at Bsln+1.0 and heart rate at OBLA4, and r = 0.86 between slope at Bsln+1.0 and slope at OBLA4. These results suggest that relationships between GXT variables in normoxia are stronger compared to hypoxia at PreCs.
After the training and competitive periods, Pearson’s r coefficient between heart rate and slope at Bsln+1.0 and OBLA4 in normoxia remained close to 0.98. Interestingly, the r value in hypoxia between heart rate at Bsln+1.0 and heart rate at OBLA4 increased to 0.93, while the correlation between slope at Bsln+1.0 and slope at OBLA4 remained stable at PreCs values (i.e. r=0.86).
Comparing the degree of relationships between variables in hypoxia, an increase in Pearson’s correlation coefficient between heart rate at Bsln+1.0 and heart rate at OBLA4 was detected from PreCs to PosCs. This suggests that the relationship between this internal load variable before a training and competitive period in XC during a GXT has a certain degree of correlation, but after the training and competitive periods, the strength of this correlation is higher. Correlation of threshold´s variables results has been found before under hypoxic or normoxic conditions (Faiss et al., 2014), but following these results, the strength of relationships between GXT variables in hypoxia increases after a training and competitive period, showing a more stable determination of internal load variables from lactate thresholds of Bsln+1.0 and OBLA4.
4.4. Effect of Hypoxia Under External Load Thresholds Variables
Delta values in the variables of slope at Bsln+1.0 and OBLA4 suggest a considerable impairment effect of hypoxic exposure during a GXT. The values, ranging from -0.43 to -1.25, represent a relative percentage value of the absolute load to be developed, corresponding to a range from 3.5 to 10% performance loss in external load. These findings are consistent with a 6.3% decrease in performance for every 1,000 meters of altitude, as previously observed in endurance (Wehrlin & Hallén, 2006). Despite the impairment effect of hypoxia, Delta changes between hypoxia and normoxia in slope at Bsln+1.0 showed a decrease after training and competitive periods, switching from -1.25 to -0.44. Similarly, OBLA4 values shifted too from -0.85 to -0.43. Both changes could be considered as a possible adaptation effect attributed to training and competing in specific environments. Although this potential adaptation must be considered with caution and needs confirmation by future studies, correlation analysis using Delta changes in slope estimated at different thresholds between hypoxia and normoxia at PosCS reinforces the statistical relationship between the level of performance of skiers reached in a GXT in normoxia and the impairment effect of hypoxia under performance. This finding is consistent with previous studies that have examined the relationship between skier performance levels and performance loss (VO₂max) under hypoxic conditions (Faiss et al., 2014). In addition, significant correlations found after the training and competitive periods could help explain the specific enhancement of performance related to environmental conditions in training and competitions in XC skiing.
Finally, a comprehensive regression analysis of the Delta change in external load performance at various thresholds, with external load estimated at these points, provides a novel approach to understanding XC ski performance and the possible related factors of success within the sport and the intrinsic environmental conditions. This analysis highlights how performance is influenced by environmental conditions and is further explained by the skill level of the skiers.
5. Conclusions
This study investigated the physiological responses of cross-country skiers before and after the competitive season, as well as the potential impact of normoxic and hypoxic conditions on their performance capacity.
The results revealed comparable maximum lactate, heart rate, and slope values between normoxia and hypoxia measured in a GXT before and after the training and competitive period, suggesting a consistent physiological response during maximal exertion under both conditions. Despite this, some differences between hypoxia and normoxia in slope reached at different thresholds were found in PreCS. However, after training and competitive period, slope at Bsln+1.0 was not statistically different, showing a possible acclimatization effect of training and competitive period on this variable. Correlation analysis between internal (heart rate) and external (slope) load at estimated thresholds showed stronger correlations after the competitive season, particularly in hypoxic conditions.
Considering the relationship between skiers' ability to develop external load (slope reached at different thresholds under normoxic conditions) and the impairment effects (Delta) observed between hypoxic and normoxic conditions, regression analysis indicated a potential causal relationshipThis indicates that the level of external load achieved by skiers at different thresholds in normoxia can predict the impairment effects in hypoxia compared to normoxia in a GXT.
Environmental factors, training, and competition affect XC junior skiers' performance, emphasizing the need to better understand hypoxia's role. Replicating hypoxic GXT could help evaluate seasonal performance changes across skier categories. However, individual variability and training specifics may influence results, requiring further research to validate and expand these findings.
Author Contributions
Conceptualization: T-P.J; Methodology: T-P.J; Formal analysis and investigation: T-P.J; Writing - original draft preparation: T-P.J; Writing-review and editing T-P.J, P-J.A, F-P.E, C.A; Supervision: P-J.A, F-P.E.
Funding
The authors declare that there are no competing interests to declare.
Institutional Review Board Statement
This study was performed in line with the principles of the Declaration of Helsinki. Approval was granted by the Ethics Committee of University of Basque Country with number reference: M10/2023/390.
Informed Consent Statement
Informed consent was obtained from all individual participants included in the study.
Conflicts of Interest
The authors declare that there are no competing interests to declare
Abbreviations
| ANOVA: analysis of variance |
| bpm: beats per minute |
| Bsln+1.0: 1 mmol/L above the lowest lactate value |
| CI: confidence intervals |
| CINR: international federation competition ranking |
| d: Cohen’s d effect size |
| FiO₂: fraction of Inspired Oxygen |
| GE: gross efficiency |
| GXT: the graded exercise test |
| m.a.s.l.: meters above sea level |
| OBLA4: Onset Blood Lactate Accumulation of 4 mmol/L |
| p: probabilistic values |
| PosCS: after competitive period |
| PreCs: prior competitive period |
| SD: standard deviation |
| VO₂: oxygen consumption |
| VO₂max: maximum oxygen consumption |
| VO₂peak: peak oxygen |
| XC: cross-country skiing |
| 15kmSwedNat: national swedish championships |
References
- Carlsson, M., Carlsson, T., Hammarström, D., Tiivel, T., Malm, C., & Tonkonogi, M. (2012). Validation of physiological tests in relation to competitive performances in elite male distance cross-country skiing. J Strength Cond Res, 26(6), 1496–1504. [CrossRef]
- Chapman, R. F., Laymon, A. S., & Levine, B. D. (2013). Timing of arrival and pre-acclimatization strategies for the endurance athlete competing at moderate to high altitudes. High Altitude Medicine and Biology, 14(4). [CrossRef]
- Clark, S. A., Bourdon, P. C., Schmidt, W., Singh, B., Cable, G., Onus, K. J., Woolford, S. M., Stanef, T., Gore, C. J., & Aughey, R. J. (2007). The effect of acute simulated moderate altitude on power, performance and pacing strategies in well-trained cyclists. Eur J Appl Physiol, 102(1), 45–55. [CrossRef]
- Cohen, J. (1988). Statistical power analysis for the behavioural sciences. Hillside. In NJ: Lawrence Earlbaum Associates. Lawrence Erlbaum Associates, Publishers.
- Dufour, S. P., Ponsot, E., Zoll, J., Doutreleau, S., Lonsdorfer-Wolf, E., Geny, B., Lampert, E., Flück, M., Hoppeler, H., Billat, V., Mettauer, B., Richard, R., & Lonsdorfer, J. (2006). Exercise training in normobaric hypoxia in endurance runners. I. Improvement in aerobic performance capacity. Journal of Applied Physiology, 100(4). [CrossRef]
- Fabre, N., Balestreri, F., Pellegrini, B., & Schena, F. (2010). The modified DMax method is reliable to predict the second ventilatory threshold in elite cross-country skiers. J Strength Cond Res., 24(6), 1546–1552. [CrossRef]
- Fabre, N., Bortolan, L., Pellegrini, B., Zerbini, L., Mourot, L., & Schena, F. (2012). Anaerobic threshold assessment through the ventilatory method during roller-ski skating testing: Right or wrong? Journal of Strength and Conditioning Research, 26(2). [CrossRef]
- Faiss, R., Von Orelli, C., Dériaz, O., & Millet, G. P. (2014). Responses to exercise in normobaric hypoxia: Comparison of elite and recreational ski mountaineers. International Journal of Sports Physiology and Performance, 9(6), 978–984. [CrossRef]
- Fulco, C. S., Rock, P. B., & Cymerman, A. (1998). Maximal and submaximal exercise performance at altitude. In Aviation Space and Environmental Medicine (Vol. 69, Issue 8).
- Ingjer, F. (1991). Maximal oxygen uptake as a predictor of performance ability in women and men elite cross-country skiers. Scand J Med Sci Sports., 1(1), 25–30. [CrossRef]
- Jakobsson, J., & Malm, C. (2019). Maximal Lactate Steady State and Lactate Thresholds in the Cross-Country Skiing Sub-Technique Double Poling. Int J Exerc Sci., 12(2), 57–68.
- Larsson, P., Olofsson, P., Jakobsson, E., Burlin, L., & Henriksson-Larsén, K. (2002). Physiological predictors of performance in cross-country skiing from treadmill tests in male and female subjects. Scand J Med Sci Sports., 12(6), 347–353. [CrossRef]
- Losnegard, T., & Hallén, J. (2014). Elite cross-country skiers do not reach their running VO2max during roller ski skating. Journal of Sports Medicine and Physical Fitness, 54(4).
- Meeusen, R., Duclos, M., Foster, C., Fry, A., Gleeson, M., Nieman, D., Raglin, J., Rietjens, G., Steinacker, J., & Urhausen, A. (2013). Prevention, diagnosis, and treatment of the overtraining syndrome: Joint consensus statement of the european college of sport science and the American College of Sports Medicine. Medicine and Science in Sports and Exercise, 45(1). [CrossRef]
- Mourot, L. (2018). Limitation of Maximal Heart Rate in Hypoxia: Mechanisms and Clinical Importance. Frontiers in Physiology, 9(JUL). [CrossRef]
- Pfitzinger, P., & Freedson, P. S. (1998). The reliability of lactate measurements during exercise. Int J Sports Med, 19(5), 349–357. [CrossRef]
- Raa, A., Sunde, G. A., Bolann, B., Kvåle, R., Bjerkvig, C., Eliassen, H. S., Wentzel-Larsen, T., & Heltne, J. K. (2020). Validation of a point-of-care capillary lactate measuring device (Lactate Pro 2). Scand J Trauma Resusc Emerg Med., 28(1), 83. [CrossRef]
- Roels, B., Bentley, D. J., Coste, O., Mercier, J., & Millet, G. P. (2007). Effects of intermittent hypoxic training on cycling performance in well-trained athletes. European Journal of Applied Physiology, 101(3). [CrossRef]
- Sandbakk, Ø., & Holmberg, H. C. (2017). Physiological capacity and training routines of elite cross-country skiers: Approaching the upper limits of human endurance. In Int J Sports Physiol Perform. (Vol. 12, Issue 8, pp. 1003–1011). [CrossRef]
- Sandbakk, Ø., Holmberg, H. C., Leirdal, S., & Ettema, G. (2010). Metabolic rate and gross efficiency at high work rates in world class and national level sprint skiers. Eur J Appl Physiol., 109(3), 473–481. [CrossRef]
- Schüttler, D., Weckbach, L. T., Hamm, W., Maier, F., Kassem, S., Schier, J., Lackermair, K., & Brunner, S. (2021). Effect of acute altitude exposure on ventilatory thresholds in recreational athletes. Respir Physiol Neurobiol., 293:103723(.). [CrossRef]
- Shang, L., Sandbakk, Ø., Shi, R., Chen, X., & Talsnes, R. K. (2022). Analysis of a Skating Time-Trial Competition and Associated Performance-Determinants in Cross-Country Skiers. Int J Environ Res Public Health., 19(18), 11580. [CrossRef]
- Sharma, A. P., Saunders, P. U., Garvican-Lewis, L. A., Clark, B., Gore, C. J., Thompson, K. G., & Périard, J. D. (2019). Normobaric Hypoxia Reduces VO2 at Different Intensities in Highly Trained Runners. Med Sci Sports Exerc., 51(1), 174–182. [CrossRef]
- Sollie, O., & Losnegard, T. (2022). Anthropometrical and Physiological Determinants of Laboratory and on-Snow Performance in Competitive Adolescent Cross-Country Skiers. Front Physiol., 13:819979. [CrossRef]
- Stöggl, R., Müller, E., & Stöggl, T. (2023). Technique and maximal skiing speed for youth cross-country skiing performance. Front Sports Act Living., 5:1133777. [CrossRef]
- Urhausen, A., & Kindermann, W. (2002). Diagnosis of overtraining: What tools do we have? In Sports Medicine (Vol. 32, Issue 2). [CrossRef]
- Wehrlin, J. P., & Hallén, J. (2006). Linear decrease in VO2max and performance with increasing altitude in endurance athletes. Eur J Appl Physiol., 96(4), 404–412. [CrossRef]
Figure 1.
Correlation Plots between variables of Lactate, Heart Rate and Slope in normoxia and hypoxia at PreCs and PosCs. Note: Lactate Bsln+1.0: lactate estimated at value of baseline lactate plus 1 mmol/L during GXT. Heart Rate Bsln+1.0: hear rate estimated at value of baseline lactate plus 1 mmol/L during GXT. Heart Rate OBLA4: hear rate estimated at lactate value of 4 mmol/L during GXT. Slope Bsln+1.0: slope estimated at value of baseline lactate plus 1 mmol/L during GXT. Slope OBLA4: slope estimated at lactate value of 4 mmol/L during GXT. *p<0.05, **p<0.01, ***p<0.001.
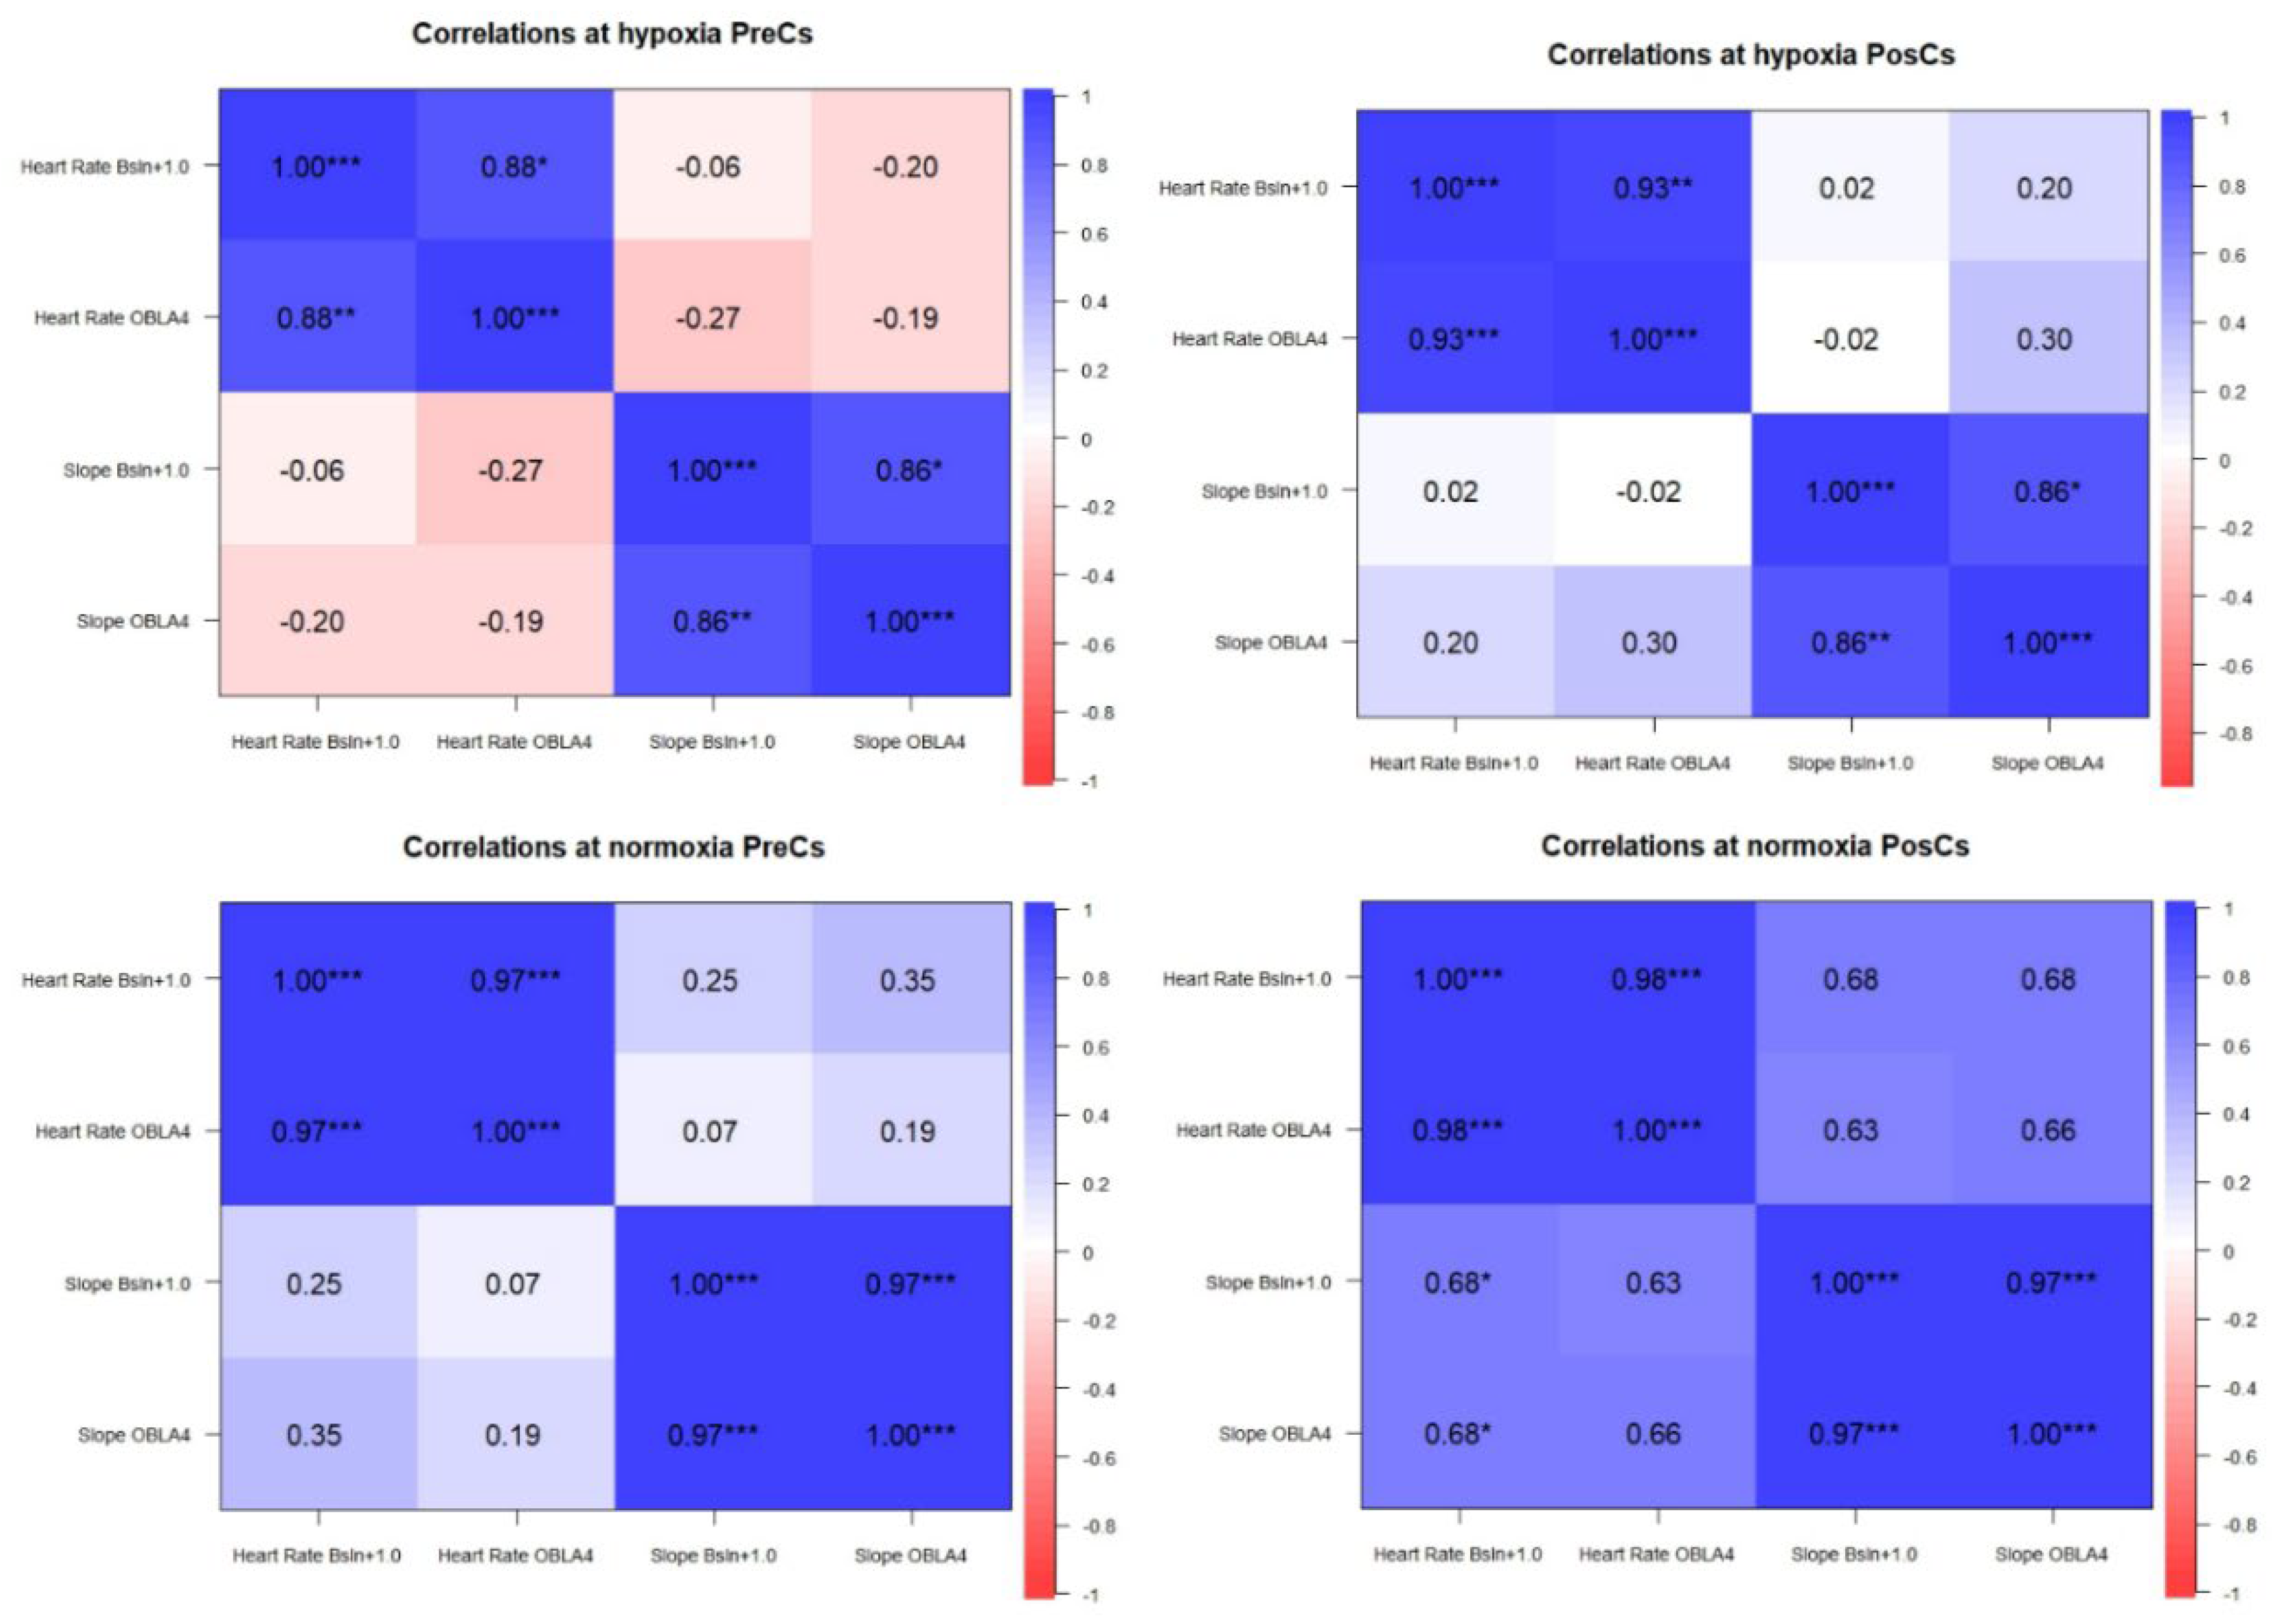

Table 1.
Maximum results of Lactate, Heart Rate and Slope at GXT in hypoxia and normoxia before and after competitive season.
Table 1.
Maximum results of Lactate, Heart Rate and Slope at GXT in hypoxia and normoxia before and after competitive season.
| Variable | PreCS | PosCs | Result between PreCs and PosCs |
Normoxia Vs. Hypoxia in PreCs |
Normoxia Vs. Hypoxia in PosCs |
|
|---|---|---|---|---|---|---|
| Mean ± Standard Deviation |
Mean ± Standard Deviation |
Wilcoxon´s test values | p d |
p d |
||
| HYPOXIA |
Maximum Lactate (mmol/L) |
8.6 ± 2.7 |
7.1 ± 2.2 # |
p= 0.011,difference = 1.48, 95% CI [0.61, 2.35], d = 1.11, 95% CI [-0.51, 2.84], large |
p = 0.144, difference = 0.88, 95% CI [-0.37, 2.13], d = 0.54, 95% CI [-0.18, 1.23], medium |
p = 0.803, difference = 0.20, 95% CI [-1.59, 1.99], d = 0.09, 95% CI [-0.57, 0.74], small |
|
Maximum Heart Rate (bpm) |
195 ± 8.1 | 191 ± 9.1 # |
p= 0.012,difference = 4.11, 95% CI [2.08, 6.13], d = 1.32, 95% CI [-0.73, 2.86], large |
p = 0.657, difference = 0.56, 95% CI [-2.22, 3.33], d = 0.15, 95% CI [-0.51, 0.81], small |
p = 0.427, difference = -1.11, 95% CI [-4.17, 1.95], d = -0.28, 95% CI [-0.94, 0.40], small | |
|
Maximum Slope (%) |
10 ± 2.0 | 9.2 ± 1.3 |
p= 0.057,difference = 0.91, 95% CI [0.29, 1.52], d = 0.96, 95% CI [-0.48, 1.96], large |
p = 0.896, difference = 0.04, 95% CI [-0.72, 0.80], d = 0.04, 95% CI [-0.61, 0.70], small |
p > .999, difference = 0.00, 95% CI [-0.70, 0.70], d = 0.00, 95% CI [-0.65, 0.65], small |
|
| NORMOXIA |
Maximum Lactate (mmol/L) |
7.7 ± 2.2 |
6.9 ± 3.4 # |
p= 0.028,difference = 0.81, 95% CI [-0.47, 2.09], d = 0.41, 95% CI [-0.20, 1.57], small |
||
|
Maximum Heart Rate (bpm) |
195 ± 9.3 | 192 ± 9.4 |
p= 0.105,difference = 2.44, 95% CI [0.06, 4.82], d = 0.67, 95% CI [-0.12, 1.51], medium |
|||
|
Maximum Slope (%) |
10 ± 1.8 | 9.2 ± 1.7 |
p= 0.091,difference = 0.86, 95% CI [0.24, 1.49], d = 0.90, 95% CI [-0.19, 2.92], large |
|||
bpm: beats per minute. CI: confidence interval. d: Effect size (Cohen´s d). p: probabilistic values of statistic test performed. %: percentaje of slope.*: significative difference between hypoxia and normoxia test within same time of measurement. #: significative difference between same test condition (hypoxia or normoxia) between PreCs and PosCs.
Table 2.
Results of Lactate, Heart Rate and Slope, at estimated values of Bsln+1.0 and OBLA 4 mmol from GXT in hypoxia and normoxia before and after competitive season.
Table 2.
Results of Lactate, Heart Rate and Slope, at estimated values of Bsln+1.0 and OBLA 4 mmol from GXT in hypoxia and normoxia before and after competitive season.
| Variable | PreCS | PosCs | Result between PreCs and PosCs | Normoxia Vs. Hypoxia in PreCs |
Normoxia Vs. Hypoxia in PosCs |
|
|---|---|---|---|---|---|---|
| Mean ± Standard Deviation |
Mean ± Standard Deviation |
Wilcoxon´s test values | P d |
P d |
||
|
HYPOXIA Bsln+1.0 |
Lactate (mmol/L) |
2.5 ± 0.24 | 2.5 ± 0.25 |
p= 0.550, difference =0.03, 95% CI [-0.06,0.13], d =0.21, 95% CI [-1.05,0.84] small |
p = 0.053, difference = 0.10, 95% CI [-1.69e-03, 0.20], d = 0.76, 95% CI [-9.59e-03, 1.49], medium |
p = 0.111, difference = 0.13, 95% CI [-0.04, 0.31], d = 0.60, 95% CI [-0.13, 1.29], medium |
|
Heart Rate (bpm) |
159 ± 15 | 164 ± 10 |
p= 0.406, difference =4.66, 95% CI [-3.64,12.97], d =0.36, 95% CI [-0.30,1.16] small |
p = 0.197, difference = -5.67, 95% CI [-14.95, 3.62], d = -0.47, 95% CI [-1.15, 0.24], small |
p = 0.325, difference = -3.11, 95% CI [-9.96, 3.74], d = -0.35, 95% CI [-1.01, 0.34], small |
|
|
Slope (%) |
4.5 ± 2.0 * |
5.1 ± 1.2 |
p= 0.250, difference =0.63, 95% CI [-1.04,2.31], d =0.24, 95% CI [-0.32,1.41] small |
p = 0.005, difference = -1.26, 95% CI [-2.00, -0.51], d = -1.29, 95% CI [-2.17, -0.3], large |
p = 0.165, difference = -0.44, 95% CI [-1.11, 0.22], d = -0.51, 95% CI [-1.19, 0.20], medium |
|
|
HYPOXIA OBLA4 |
Heart Rate (bpm) |
178 ± 16 | 179 ± 12 | p= 0.440, difference =0.66, 95% CI [-4.85,6.19], d =0.07, 95% CI [-0.47,1.60] |
p = 0.111, difference = -4.44, 95% CI [-10.17, 1.28], d = -0.60, 95% CI [-1.29, 0.13], medium |
p = 0.056, difference = -4.11, 95% CI [-8.36, 0.14], d = -0.74, 95% CI [-1.47, 0.02], medium |
|
Slope (%) |
6.7 ± 1.8 * |
6.9 ± 1.3 * |
p= 0.496, difference =0.13, 95% CI [-0.29,1.56], d =0.06, 95% CI [-0.46,1.29] |
p = 0.013, difference = -0.85, 95% CI [-1.47, -0.24], d = -1.06, 95% Cl [-1.87, -0.21], large |
p= 0.02, difference = -0.44, 95% CI [-0.79, -0.08], d= -0.95, 95% CI [-1.73, -0.13], large |
|
|
NORMOXIA Bsln+1.0 |
Lactate (mmol/L) |
2.4 ± 0.19 | 2.4 ± 0.19 |
p= 0.714, difference =0, 95% CI [-0.11,0.11], d =-2.73, 95% CI [-1.16,0.54] small |
||
|
Heart Rate (bpm) |
165 ± 16 | 167 ± 17 |
p= 0.341, difference =2.11, 95% CI [-5.93,10.15], d =0.17, 95% CI [-0.42,1.98] |
|||
|
Slope (%) |
5.7 ±1.8 | 5.5 ± 1.6 |
p= 0.652, difference =-0.17, 95% CI [-1.76,1.40], d =-0.07, 95% CI [-0.56,1.24] |
|||
|
NORMOXIA OBLA4 |
Heart Rate (bpm) |
183 ± 19 | 183 ± 16 | p= 0.635, difference =-0.33, 95% CI [-5.36,6.02], d =-0.03, 95% CI [-0.62,1.03] small |
||
|
Slope (%) |
7.6 ± 1.7 | 7.3 ± 1.6 | p= 0.734, difference =-0.27, 95% CI [-1.68,1.13], d =-0.12, 95% CI [-0.59,0.98] |
|||
bpm: beats per minute. CI: confidence interval. d: Effect size of Cohen´s d. p: probabilistic values of statistic test performed. %: percentaje of slope.*: significative difference between hypoxia and normoxia test within same time of measurement. #: significative difference between same test condition (hypoxia or normoxia) between PreCs and PosCs.
Table 3.
Results of Delta values between hypoxia and normoxia before and after competitive season at estimated Slope of Bsln+1.0 and OBLA 4 mmol from GXT.
Table 3.
Results of Delta values between hypoxia and normoxia before and after competitive season at estimated Slope of Bsln+1.0 and OBLA 4 mmol from GXT.
| Variable | ∆ between Hypoxia Vs. Normoxia PreCs |
∆ between Hypoxia Vs. Normoxia PosCs |
Wilcoxon test results between ∆ PreCs vs PosCs |
|---|---|---|---|
| Slope at Bsln+1.0 (%) |
-1.25±0.97* | -0.44 ± 0.86 | p = 0.020; 95% CI [-0.97, -0.53] |
| Slope at OBLA 4 (%) |
-0.85 ± 0.80 | -0.43 ± 0.46 | p = 0.098; 95% CI [-0.91, -0.03] |
∆: Delta value. p: p values. *: significative difference between PreCS Vs PosCs within condition: hypoxia or normoxia.
Author’s Biography
Jesús Torres is a PhD student at the University of the Basque Country (UPV/EHU). His research focuses on performance and exercise physiology, particularly the effects of altitude exposure and hypoxic training in endurance sports such as cycling and cross-country skiing. His goal is to investigate how altitude can act as an optimizing factor for performance, exploring the underlying physiological mechanisms involved in this process.
Disclaimer/Publisher’s Note: The statements, opinions and data contained in all publications are solely those of the individual author(s) and contributor(s) and not of MDPI and/or the editor(s). MDPI and/or the editor(s) disclaim responsibility for any injury to people or property resulting from any ideas, methods, instructions or products referred to in the content. |
© 2025 by the authors. Licensee MDPI, Basel, Switzerland. This article is an open access article distributed under the terms and conditions of the Creative Commons Attribution (CC BY) license (http://creativecommons.org/licenses/by/4.0/).
Copyright: This open access article is published under a Creative Commons CC BY 4.0 license, which permit the free download, distribution, and reuse, provided that the author and preprint are cited in any reuse.


