
Submitted:
28 July 2025
Posted:
30 July 2025
You are already at the latest version
Abstract
Trail running involves constant changes in terrain and slope, complicating the accu-rate assessment of energy expenditure during performance. This study aimed to ex-amine the relationship between running power output (RPO), oxygen consumption (VO₂), carbon dioxide production (VCO₂) and energy expenditure per minute (EEmin) across positive and negative slopes in trained trail runners under standardized labor-atory conditions. Fifteen male trail runners performed five randomized 5-minute treadmill runs at 70% of VO₂ maximal speed on −7%, −5%, 0%, +5%, and +7% slopes. VO₂, VCO₂, EEmin, respiratory exchange ratio (RQ), heart rate (HR), and RPO were rec-orded. Statistical analysis included Shapiro-Wilk tests for normality, repeat-ed-measures ANOVA to compare variables across slopes and Spearman or Pearson correlations between RPO and physiological variables. Moderate to strong positive correlations were found between RPO and VO₂ (Rho = 0.67–0.75, p < 0.01) and between RPO and EEmin (Rho= 0.69–0.84, p < 0.001) across all conditions. These findings suggest that RPO measured via a wearable device may reflect changes in energy expenditure and supports the integration of wearable power metrics into training and nutritional strategies for trail running. However, further studies in female athletes, outdoor set-tings, extreme slopes and altitude conditions are needed to confirm the generalizability of these results.
Keywords:
trail running
; energy expenditure
; running power
; metabolic cost
; athletic performance
; nutritional strategies
; races
1. Introduction
Trail Running races have significantly grown in popularity among runners driven by its unique environmental challenges, including altitude changes, uneven terrain, constant elevation shifts, and steep slopes, covering a wide range of distance, from shorter uphill vertical kilometer to long-distance ultra races [1]. Factors that have generate interest within the scientific community, as these races push human physiology to its limits [2]. The variations in terrain and distance characteristic of trail running races demand a comprehensive understanding of the physiological responses for optimizing both performance and health [3,4].
In mountain running, for better performance runners often alternate strategically between walking and running based on gradient and terrain type [5]. This challenge makes it difficult to accurately monitor physical demands using metrics like average pace (time per kilometer) or speed variables commonly employed in road races [6] that fail to account for the complexities of terrain in mountain running. As a result, coaches, nutritionists, athletes, and researchers often lack reliable data for quantifying performance and energetic demand, limiting their ability to optimize training, recovery, and race preparation strategies [7]. This mechanical effort to accelerate, maintain speed or brake is supported by the body’s energy expenditure (EE) obtained through the different metabolic pathways. EE is a key factor in endurance sports, as maintaining an appropriate energy balance is crucial for performance optimization and athlete health [8]. Negative energy balance, where energy output exceeds intake, can lead to adverse outcomes such as muscle mass loss, increased fatigue, and a decline in overall performance [9].
Currently, scientific evidence suggests that EE can be monitored in real time through various methods. Most popular monitoring method for estimating EE is cardiac activity, due to its strong correlation with oxygen consumption [10]. In endurance sports, heart rate (HR) is often used as an indicator due to its linear relationship with oxygen uptake (VO2) [11]. However, this relationship breaks down at extreme intensities, during intermittent efforts, or under the influence of factors like emotions, posture, and environmental conditions [12]. Alternatively indirect calorimetry, is considered the gold standard for accurately measuring EE and physiological responses [13]. Despite its precision, this method is impractical for field applications, as the bulky equipment required limits mobility and feasibility, particularly during prolonged mountain running activities. For these reasons, other systems have been highlighted in the scientific literature as possible ways for solving the issue and try to estimate this data. One of them is the possibility to use Global Navigation Satellite Systems watches, very frequently used by mountain runners. This method provides speed and distance, two variables proposed for estimating EE, however, their accuracy in assessing EE is often questioned [14]. Thus, accelerometers have been proposed as a potentially reliable alternative [15]. Although early models, limited to single-axis measurements, presented notable challenges in reliability [16], recent advancements including three-dimensional axis capabilities. The triaxial accelerometer, with its metrics of mechanical power, stride length, and ground contact time, can detect changes in running technique [17], attributable to terrain characteristics. Also, this sensor enhances its ability to capture kinematic data if they are combined with other sensors such as gyroscopes and magnetometers [18]. This new and accurate approach brings to practitioners a novel method for monitoring training load in trail running population, especially if we take into account the complexities of this discipline characterized by varying terrain, steep gradients, and alternating movement strategies [19]. In this context, the ability to obtain real-time data through wearable technology represents a significant advancement in training load monitoring [20]. Despite the well-established understanding theoretical models of metabolic cost and mechanical work during level and uphill running [21,22], the relationship between mechanical running power and energy expenditure across different inclines remains unexplored. While previous studies have demonstrated relation between power mechanical and metabolic parameters [23], none have directly analyzed whether instantaneous mechanical power can reliably predict energy expenditure across a full range of inclinations, including negative slopes. Understanding this relationship is essential for optimizing training load management and nutritional strategies in endurance athletes, particularly in mountain and trail running disciplines.
The aim of this study was to explore the relationship between oxygen uptake, carbon dioxide, and mechanical running power at different slopes.
Additionally, the study sought to determine the relationship between EE per minute (EEmin) and instantaneous running power output (RPO) readings at varying slopes, both positive and negative.
2. Materials and Methods
2.1. Participants
A convenience [24] sample of 15 high endurance-trained [25] mountain runners males (n = 15), participated in this trial (age 37,27 ± 6,55 years; body weight 70,89 ± 7,05 kg; height 176,06 ± 5,96 cm; body mass index 22,85 ± 1,63 kg/m2). The sample size was consistent with that of previous studies involving trail runners [26]. The inclusion criteria were to train at least 10 hours per week, all participants had at least three years of mountain running experience and were injury-free for at least the preceding three months. Intentions, procedures, as well as potential risks and benefits were communicated to the participants and were confirmed by signing an informed consent form according to the Declaration of Helsinki. The study was approved by the Committee for Clinical Investigations of the Sports Administration of Catalonia (020-CEICGC-2022).
Participants’s height (Holtain® stadiometer, Holtain Limited©, Crosswell, United Kingdom) and body mass were measured (Seca 220® scale, Seca Corp©, Hamburg, Germany) before starting running protocols. The first running test was aimed to obtain maximal peak values of physiological variables of interest by performing an incremental maximal protocol on a motorized treadmill (Cosmos HP, Nussdorf-Traunstein, Germany). Among these, the maximal oxygen consumption (VO2max) (Cosmed K5®, Cosmed SRL, Rome, Italy), maximal speed at VO2max (vVO2max) and maximal heart rate (HRmax) Polar H10® (Polar Electro Oy, Kempele, Finland; firmware v3.2.0, software v7.15) were determined. Also, participants were equipped with an inertial movement unit, Stryd Footpod (Stryd, Boulder, CO, USA; firmware v2.1.15, software v7.8), which incorporates a triaxial accelerometer, a gyroscope, and a barometer into a compact shoe-mounted chip, allowing to the researchers to obtain the mechanical power, expressed as running power output RPO applied on the treadmill during the test [27]. Specifically, the test started an initial five-minute warm-up at 2.22 m/s, the intensity was increased to the first incremental level at 2.77 m/s, with subsequent increases of 0.27 m/s every minute until exhaustion [28].
A week later, all participants were called to the laboratory again to do the experimental protocol, a running test with different slopes [29,30]. This protocol consisted of running five series of five minutes at 70% of the speed associated with each participant’s maximal oxygen uptake and selected as the standardized speed for all subsequent trials. This standardized speed and slopes were selected to elicit measurable physiological responses across slope conditions while ensuring submaximal intensity below the second ventilatory threshold [31], thus preserving the metabolic validity of the protocol. Slope conditions (-7%, -5%, 0%, +5%, and +7%), were administered in a randomized order to minimize any sequence effects (Figure 1). Following each 5-minute running slope, subjects had a 5-minute rest period while sitting in a chair next to the treadmill. During each set of the test, VO2, carbon dioxide output (VCO2), and respiratory exchange ratio (RQ) were monitored using the Cosmed K5® portable system for recording breath-by-breath gas exchange measurements (Cosmed SRL, Rome, Italy). From gas exchange data, energy EEmin was calculated using Weir’s equation [32]. HR was assessed by Polar H10® (Polar Electro Oy, Kempele, Finland). Rating of perceived exertion (RPE) was assessed at the end of each set using the Borg CR10 scale following standardized procedures [33].
RPO was assessed using the Stryd Footpod (Stryd, Boulder, CO, USA) and managed via the Stryd mobile application (firmware v2.1.15, software v7.8), with manual input of slope, prior to each effort. Data were uploaded to the Stryd PowerCenter platform (http://www.stryd.com/powercenter) exported in FIT format, and converted to .csv files using Golden Cheetah (version 3.4), a free-license software, for further analysis in Microsoft Excel® (2016; Microsoft Corp., Redmond, WA, USA).
While all these data were monitored during the total duration of each set, mean values from minutes two to four of each set were analyzed to better reflect steady-state physiological responses. All running tests were performed under the same ambient laboratory’s conditions (temperature 21,7 ± 1,2 °C, humidity 78,0 ± 7,4%).

Table 1.
Anthropometrics and physiological characteristics of the participants.
| Characteristic | Mean ± SD |
|---|---|
| Age (years) | 37,27 ± 6,55 |
| ITRA (points) | 676 ± 101 |
| Weight (kg) | 70,89 ± 7,05 |
| Height (m) | 176,06 ± 5,96 |
| BMI (kg·m−2) | 22,85 ± 1,63 |
| vV̇O2max (m·s−1) | 4,85 ± 0,44 |
| 70% vV̇O2max (m·s−1) | 3,33 ± 0,31 |
| HRmax (bpm) | 171,47 ± 10,31 |
| V̇O2max (mL·min¯1) | 4314,87 ± 476,46 |
| V̇O2max (mL·kg¯1·min¯1) | 61,16 ± 6,89 |
| RPOmax (W) | 368,07 ± 38,04 |
| RPOmax (W·kg¯1) | 5,20 ± 0,32 |
Age (years); ITRA: International trail running association ranking; Weight (kg); Height (m) ; BMI (kg·m−2): body mass index; vV̇O2max (m·s−1): maximal speed at V̇O2max ; Fᵣ (70%) vV̇Oₘₐₓ (m·s−1): running speed set at 70% of the velocity associated with V̇O2max; V̇O2max (mL·kg¯1·min¯1): maximal relative to weight oxigen uptake; V̇O2max (mL·min¯1): maximal oxigen uptake RPOₘₐₓ: Maximal running power output; RPOₘₐₓ (W·kg¯1): Maximal relative to weight running power output.
2.2. Statistical Analysis
Descriptive (mean ± standard deviation) and normality tests (Shapiro–Wilk) were initially performed for all variables by two levels, all participants and clustered by slopes, to determine the data distribution. From this moment, parametric and non-parametric tests were performed in each case. Correlation analyses were conducted to examine the relationships between VO2 and VCO2 with PO and EEmin across multiple slope conditions (+7%, +5%, 0%, -5%, -7%) adapting to the distribution of the data, using Pearson’s (r) or Spearman’s test (Rho), respectively. The strength of the correlation coefficients was interpreted as small (0–0.3), moderate (0.31–0.49), large (0.5–0.69), very large (0.7–0.89), and near perfect (0.91) following Cohen’s scale [34]. Additionally, difference analyses were conducted to compare differences across the five slope conditions (+7%, +5%, 0%, -5%, -7%) using one-way analysis of variance and Kruskal–Wallis in non-normal distribution cases [35]. For normal distribution variables, Levene’s test was performed to check the previous homogeneity of variances, using Fisher’s and Welch’s analysis for homogeneous and non-homogeneous variances, respectively [35], and post hoc analyses were performed to identify among which groups differences were detected, using Tukey’s test for equal variances and the Games–Howell test for different variances [35]. For the variables for which differences among groups were observed using the Kruskal–Wallis test, post hoc Dwass–Steel–Critchlow–Fligner pairwise comparison analyses were performed [35]. Statistical significance was set at p < 0.05. Data organization was performed using Microsoft Excel and all statistical analyses were conducted using Jamovi (version 2.3; The Jamovi Project, 2023) [35].
Most metabolic variables (VO2, RPO, and EEmin) exhibited a non-normal distribution (p < 0.05), necessitating the use of Spearman’s rank correlation (Rho). However, RPO showed near normality in some conditions, allowing Pearson’s correlation (r) to be used when applicable. The Kruskal-Wallis test was conducted to compare differences across the five slope conditions (+7%, +5%, 0%, -5%, -7%). The results of the Kruskal-Wallis test indicated that there were significant differences in the variables across the different slopes (p < 0.001), confirming the need for nonparametric analysis. Following this, Games-Howell post-hoc tests were applied to examine specific differences between the slope conditions. These tests revealed significant differences between several pairwise comparisons (e.g., between +7% and -7%, between -% and 0%, and between 0% and +7% all with p < 0.05), highlighting the impact of different slopes on metabolic variables.
3. Results
The descriptive analysis of each variable according to the different slopes was summarized in Table 2, while the differences were shown in Figure 2.
3.1. Descriptive and Difference Analysis
The mean of all analyzed parameters showed an increasing trend from the series with the steepest negative slope (-7%) to those with the steepest positive slope (+7%), excepting for RQ and RPE which showed higher values for -7% slope to -5% slope. This phenomenon was also observed when evaluating the differences among the various variables and slopes, identifying statistically significant differences across all groups except for RQ and RPE. In the case of RQ, differences were identified only between −7% vs. 5%, −7% vs. 7%, and −5% vs. 0%. On the other hand, RPE did not show a difference between -7% vs -5% groups. Lastly, while all differences were significant with a p-value < 0.001, the analysis of RQ between +5% and +7% was p = 0.008, HR showed p = 0.023 between -7% and -5%, and RPE between -7% and 0% groups.
3.2. Correlation Analysis
Significant positive correlations were found among VO2, VCO2 and RPO, both when analyzing all slopes collectively and in the subgroup analyses (Table 3). In the full dataset analysis, the highest correlation was observed between VO2 and EEmin (Rho = 0.997, p < 0.001). This same pattern was evident in the subgroup analyses (Rho = 0.968–0.994, p < 0.001), with the strongest value recorded for the 7% slope. Additional near perfect correlations were also identified. Specifically, for the full dataset, near-perfect correlations were noted for VCO2 and EEmin (Rho = 0.953, p < 0.001), VO2 and VCO2 (Rho = 0.929, p < 0.001), RPO and EEmin (Rho = 0.916, p < 0.001), VCO2 and RPO (Rho = 0.910, p < 0.001), and VO2 and RPO (Rho = 0.904, p < 0.001). However, this level of correlation was not observed when each slope was analyzed separately, where the correlations ranged from large to very large.
Regarding the correlations between VO2 and VCO2, the lowest values were observed at the −7% slope (Rho = 0.625, p < 0.001). These correlations increased as slope values rose, reaching their highest at 5% (Rho = 0.778, p < 0.001). However, the 7% slope analysis showed a lower correlation than at 5% (Rho = 0.741, p < 0.001). VO2 demonstrated a correlation with RPO in all subgroup analyses, with the highest value at −5% (Rho = 0.758, p < 0.001) and the lowest at −7% (Rho = 0.679, p < 0.001). Correlations between VCO2 and RPO were comparatively lower, although all were classified as large. The lowest value was recorded at +7% (Rho = 0.538, p < 0.001), while slightly higher correlations were found for the +5%, −7%, 0%, and −5% slopes (Rho = 0.598, 0.598, 0.614, and 0.621, respectively; p < 0.001). Finally, the correlation between RPO and EEmin varied depending on the dataset under analysis: it was near perfect when all data were considered together (Rho = 0.916, p < 0.001), very large for the −7%, −5%, 0%, and +5% groups (Rho = 0.702, 0.776, 0.727, and 0.715, respectively; p < 0.001), and large for the +7% slope (Rho = 0.693, p < 0.001)
4. Discussion
This study aimed to investigate the relationship between mechanical running power and energy expenditure in trained trail runners across a range of positive and negative slopes. A dual analytical approach was adopted combining all data to assess general trends and analyzing each slope individually to better understand both, the global mechanical, metabolic relationship and slope specific athlete responses. The results of this analysis revealed a progressive increase in all primary metabolic and mechanical variables, including VO2, VCO2, EEmin, HR, and RPO, from –7% to +7%, while running speed was held constant. These findings are consistent with prior research showing that oxygen consumption increases with mechanical demand as slope increases [36]. When data were pooled across all participants and gradients, nearly perfect associations emerged between mechanical running power and key metabolic variables, aligning with previous studies which reported a strong association between power output measured by Stryd wearable devices and oxygen consumption during running a different slope [23]. Conversely, when the data were examined separately by slope condition, the strength of the correlation between mechanical running power and metabolic demand was reduced from large to very large. These findings are discussed in detail below and contextualized of existing scientific literature.
While speed has been widely recognized in the scientific literature as the predominant intensity variable for training prescription and performance evaluation [6], in trail running understanding the demands of intensity requires its consideration alongside other parameters, with slope being a fundamental factor [22]. The findings of this study suggest that, at a constant running speed, trail runners progressively increase their metabolic demand as slope increases. VO2 was lowest at the –7% gradient (2,498.9 ± 414.8 ml·min-1) and highest at the 7% gradient (4,390.2 ± 694.2 ml·min-1), necessarily accompanied by a rise in VCO2 (from 1,919.1 ± 290.4 ml· min-1 to 3,772 ± 569.9 ml·min-1). The relationship between these parameters, reflected by the RQ, increased from 77± 0.08 to 87 ± 0.10, corresponding to an approximate 80.1% rise in EE. This pattern was statistically significant across nearly all slope comparisons. This supports the premise that as the slope became steeper the corresponding metabolic cost increased [37]. The increase in VO2 during uphill running can be attributed to the elevated metabolic demand required to vertically displace the body’s mass against gravity [37], as well as the additional muscular effort needed to propel the limbs and maintain postural stability throughout the ascent [38]. When transitioning from level to uphill running, the mechanical challenge imposed by gravity necessitates a substantial increase concentric contractions [39], particularly through flexor and extensor muscles, as slope increased [36]. At a constant speed, Saito A. et al. [40] reported significantly higher activation in the vastus medialis (p = 0.003), vastus intermedius (p = 0.004), biceps femoris (p = 0.004), and medial gastrocnemius (p = 0.017) when running at a 10% incline compared to level ground. Similarly, Wall-Scheffler et al. [38] observed a progressive increase in the activation of the biceps femoris, vastus lateralis, gluteus maximus, and gluteus medius as slope increased from 0% to 20%, particularly during the stance and propulsive phases. These neuromuscular adaptations support the elevated mechanical and metabolic demands observed under steeper gradient conditions, as reflected by a significant rise in the RQ, as reported in the present study.
Results that are physiologically coherent when considering VCO2 during exercise, since during the uphill conditions, VCO2 increased by approximately 52.2% from 0% to +7%. Notably, within the upper gradient segment (from +5% to +7%) VCO2 showed a further progressive rise of 12.1%, which was nearly twice the increase observed for VO2 (6.9%) in the same slope range. This disproportionate rise may reflect not only elevated oxidative metabolism but also a greater contribution of acid–base regulation mechanisms under steeper conditions. VCO2 not only reflects metabolic load under aerobic conditions but also captures the systemic response to acid–base pH homeostasis regulation by elevated exercise intensity [41]. A significant portion of the VCO2 increase under high-intensity conditions from bicarbonate buffering of lactate-derived hydrogen ions [42]. Although participant variability could partially influence individual responses, the consistent pattern of VCO2 increase may reflect a shift in substrate use and acid–base regulation, particularly in runners nearing their second ventilatory threshold [31].
All these findings underscore that even minor variations in slope, when running speed is held constant, generate a substantial change in metabolic demand. This phenomenon is particularly relevant for pacing and intensity management in prolonged mountain races, where slope specific strategies may help preserve energy stores, influence substrate utilization [43], and optimize performance during sustained uphill efforts.
In this context, RPO showed a strong parallelism with physiological parameters, increasing from 175.9 ± 18.9 W at –7% to 335.1 ± 35.7 W at +7%. All slope to slope differences were statistically significant, with higher magnitude between 0% and +5% (+63.4 W) and between –5% and 0% (+50.3 W).
A significant positive correlation (Rho = 0.679–0.758, p < 0.01) was observed between RPO and VO2 across all slope conditions examined. At ground level, the correlation between VO2 and RPO was large (Rho = 0.714, p < 0.001). This alignment reflects the fundamental principle [44] that, in level locomotion, VO2 is directly proportional to the amount of mechanical work performed [44]. Notably, the strength of the relationship between RPO and VO2 declined at the steepest gradients, with correlation coefficients of Rho = 0.679 at –7% and Rho = 0.692 at +7% (p < 0.01). Accelerometry represent a direct indicator of running load [20] but RPO alone may not reflect important aspects of internal load, such as the neuromuscular demands associated with muscle contractions, which contribute significantly to energy demand but are not necessarily reflected in power output values. This progressive decoupling between metabolic demand and mechanical power data could reflect the increasing complexity of muscular recruitment and energy pathways activated during steep uphill running [29]. This heightened mechanical demand activates bioenergetic pathways within muscle cells, accelerating substrate oxidation and electron flux through the mitochondrial respiratory chain to sustain the elevated adenosine triphosfate requirements [45]. It is plausible that, as the slope steepens, this recruitment gradually extends from predominantly oxidative type I fibers to a broader pool that includes type II fibers, which are characterized by higher strength production but lower efficiency [46] and anaerobic characteristics.
When comparing 0% slope to the steepest downhill condition (–7%) at same speed VO2 decreased by 22.5%, reflecting an energy saving effects of downhill running, a phenomenon described previously in the literature [29,30,31,32,33,34,35,36,37,38,39,40,41,42,43,44,45,46,47]. Negative slopes are generally associated with lower physiological and mechanical demands compared to level running, primarily due to the gravitational assistance that reduces the need to generate force for active propulsion, therefore a lower internal demand [3]. However, the lower correlation values may reflect the biomechanical and muscular adjustments that occur during descent, an effect previously described by Snyder and colleagues [48]. This could indicate an elevated VCO2 production, potentially due to greater eccentric muscle activation [49]. Specifically, downhill running often relies more on eccentric muscle contractions and less on concentric strength production, which can slightly attenuate the rate at which VO2 increases relative to mechanical power [47]. Additionally, individual muscle activation patterns during downhill running may be influenced not only by metabolic and mechanical demands, also by neuromuscular skill and terrain-specific experience [41] and could be an additional reason why the relationship between mechanical power and metabolic parameters appears to weaken at steeper negative slopes. This physiological mechanism may help explain also the progressive uncoupling observed in our study between VCO2 and RPO at higher intensities negative slope (Rho = 0.598, p < 0.01). Complementing this finding, internal load indicators [50] assessed in this study such as RQ and RPE demonstrate deviation from linearity under moderate downhill conditions.
Although no statistically significant differences were observed between the –7% and –5% slope conditions, both RQ (0.77 ± 0.08 vs. 0.76 ± 0.06) and RPE (3.03 ± 1.78 vs. 2.60 ± 1.39) showed higher values at the steeper negative gradient suggesting increased internal load. While total metabolic demand, as indicated by VO2 and VCO2, decreases during downhill running, the neuromuscular system may require to activate stabilizing musculature such as the gluteal, hamstrings, and core muscles to control acceleration and maintain postural balance [48]. Braking forces are known to become dominant at gradients steeper than approximately –10% [22], the metabolic shift observed at –7% may reflect a transitional phase rather than a condition of fully eccentric-dominant muscle activity. All these differences appear to reflect intraindividual variations in efficiency when confronting different inclines. In other words, each mountain runner seems to respond uniquely to the mechanical and physiological demands of each gradient, which in turn modulates the strength of the coupling between external load and metabolic cost.
An additional objective of this study was to evaluate the relationship between mechanical running power and energy expenditure across the different slopes. For this purpose, the Weir’s formula was used to estimate EEmin across a variety of inclines [32]. This equation combines two fundamental components VO2 and carbon dioxide VCO2 weighted by their respective caloric contributions to energy metabolism and his ratio provides insight into which energy substrates are being oxidized to sustain movement [32]. By incorporating both variables, the formula provides a comprehensive estimate of energetic exercise demand [51], expressed in kilocalories per minute. This may explain why, across all slope conditions, the associations between RPO and EEmin were stronger than those observed between RPO and isolated metabolic variables such as VO2 or VCO2. The results demonstrated a very large relationship (Rho = 0.776 at –5%, Rho = 0.727 at 0%, Rho = 0.715 at +5%) between RPO and EEmin at level and moderate slopes, however, as the incline increased, this correlation apparently diminished from very large to large (Rho = 0.702 at –7%, Rho = 0.693 at 7%) at maximal slope. As widely reported in the scientific literature, the energy required for movement represents only a fraction of the total EE [37] and RPO could represent this part. Riddick and Kuo [52] in their model-based approach confirm that mechanical workload is a principal component of energy expenditure representing between 60–76% of the total net energy cost of running calculating active muscle work needed to support body weight and generate forward propulsion, taking into account vertical and horizontal oscillations of the center of mass. This conceptual alignment may help explain the very large correlations observed in our study between Stryd derived RPO and EEmin across varying slope conditions. Recent evidence [42] indicates that inertial sensors positioned on the foot, such as Stryd, are capable of reliably measuring spatiotemporal gait parameters such as step frequency, ground contact time, and vertical oscillation. Considering that VO2 is proportional to the strength exerted by active muscles, and that inertial sensors are capable of measuring movement across three spatial axes [53], it is reasonable to assume that, during cyclic activities such as running, in submaximal conditions, continuous acceleration data [54] can be used to understand external load. The estimation of mechanical power in running integrates multiple biomechanical [55] and kinematic parameters, including ground contact time, cadence, stride length, vertical oscillation, limb stiffness, and horizontal velocity [56]. As these variables are closely linked to the mechanical demands of running their continuous monitoring may help explain the very large correlations observed in our study between Stryd derived RPO and EEmin across varying slope conditions. Importantly, three-quarters of total energy expenditure is destinate to essential physiological processes, including vital cellular functions, thermogenesis, and internal work and not to produce movement [37]. Moreover, the efficiency with which an individual transforms metabolic energy into mechanical work is influenced by multiple factors, such as muscle fiber composition, biomechanical strategies, and neuromuscular coordination [22]. The integration of RPO with metabolic parameters may offer valuable insight into running efficiency across different slopes, as it reflects the relationship between external mechanical load and the associated metabolic cost under varying gradient conditions. Additionally, energy expenditure is influenced by terrain characteristics, duration of effort, and environmental conditions such as temperature, altitude, and cold [5]. These factors, which are particularly prevalent in mountain races, add complexity to the accurate assessment of energy expenditure. In uphill running, for exemple, induces specific biomechanical adaptations in spatiotemporal gait metrics, with increased step frequency and reduced step length, which reflect a strategy to maintain propulsion [36] accompanied by a reduced tendon capacity for elastic energy storage [48]. In response to these changes, individual specific adaptations may emerge, influencing the efficiency of energy transfer and potentially modificate total energy expenditure.
The findings of this study demonstrate that, although a relationship exists between energy expenditure and absolute power values, power alone cannot fully account for the amount of energy expended during exercise. Nevertheless, the significant relationship observed confirm that accelerometry could be used as a proxy for estimating energy expenditure at different moderate inclines in trail runners.
4.1. Limitations
This study presents several limitations that should be acknowledged. First, the restricted range of slopes tested, from –7% to +7%, may limit the generalizability of the findings, particularly regarding the relationship between mechanical power output and metabolic responses at steeper inclines or declines. A broader spectrum of gradients could have provided deeper insights into the strength and consistency of the relationship between mechanical power output and energy expenditure, particularly at more extreme inclines or declines where this coupling may change
Second, the sample consisted of a relatively small and heterogeneous group of 15 experienced male trail runners, which, although relevant to the population of interest, introduces variability in age, sex and physical characteristics, that may affect the consistency of the results. Finally, mechanical power was assessed using a single commercially available inertial sensor (Stryd), and while its use has been validated in previous research, reliance on a single device limits the extrapolation of the results to other technologies or measurement systems.
4.2. Practical Considerations
To optimize the performance (training, nutrition and recovery periodization) in trail running events, practitioners should consider the terrain-specific demands by examining the course profile in detail, identifying the distribution of inclines and declines, the distance and duration of each segment, and the athlete’s pace within those contexts. This approach allows for a more accurate estimation of energy requirements and facilitates the development of personalized nutritional strategies tailored to the unique energetic demands of each phase of the race. Therefore, it is crucial that nutrition professionals thoroughly understand the specific device utilized by the athlete when estimating energy expenditure. Accurate knowledge of the tool is essential for developing effective pre-race, during-race, and post-race nutritional strategies, as different devices may yield varying estimates of energy expenditure. This multi-variable approach may contribute to a closer alignment between power measurements and energetic demand.
5. Conclusions
The data observed in this study correlations between mechanical power output and energy expenditure confirm that running power data measured by a wearable inertial device could be serve as a useful proxy for assessing external load and caloric needs during exercise. However, the variability observed across different slopes and the influence of individual efficiency and biomechanical adaptations highlight the limitations of relying solely on power measurements.
These findings emphasize the need for an integrative approach that combines running power data with metabolic and biomechanical information, especially when addressing the complexities of trail running. Future research should aim to validate these methods in real-world conditions and explore how terrain variability, environmental factors, sex and individual physiological responses affect the accuracy of energy expenditure estimations.
Author Contributions
Conceptualization, X.I., S.P. and F.G.C.; methodology, X.I, D.C, J.M., and F.G.C.; software, X.I., D.C and J.M.; validation, X.I. and D.C.; formal analysis, A.P., J.E.; investigation, S.P., J.M., F.G.C., and M.C.; resources, S.P,M.C.; data curation, A.P., J.E.; writing—original draft preparation, F.G.C., J.E.; writing—review and editing, F.G.C and J.E.; visualization, X.I.; supervision, X.I., M.C. and J.E.; project administration, X.I.; All authors have read and agreed to the published version of the manuscript.
Funding
This research received no external funding.
Institutional Review Board Statement
The study was conducted in accordance with the Declaration of Helsinki, and approved by the Committee for Clinical Investigations of the Sports Administration of Catalonia (020-CEICGC-2022).
Informed Consent Statement
Informed consent was obtained from all subjects involved in the study.
Data Availability Statement
The data supporting the findings of this study are available from the corresponding author upon reasonable request, due to the sensitive nature of the individual level performance metrics and the need to protect participant confidentiality.
Conflicts of Interest
The authors declare no conflicts of interest.
Abbreviations
The following abbreviations are used in this manuscript:
| VO2 | Oxygen uptake |
| VCO2 | Carbon dioxide output |
| RQ | Respiratory quotient |
| HR | Heart rate |
| EE | Energy expenditure |
| EEmin | Energy expenditure per minute |
| RPO | Running power output |
| RPE | Rating of perceived exertion |
| BMI | Body mass index |
| vVO2max | Velocity at maximal oxygen uptake |
| VO2max | Maximal oxygen uptake |
| ITRA | International Trail Running Association |
References
- Scheer, V. Participation Trends of Ultra Endurance Events. Sports Med. Arthrosc. 2019, 27(1), 3–7. [Google Scholar] [CrossRef]
- Waal, Simon J. ; Gomez-Ezeiza, Josu ; Venter, R. Physiological Indicators of Trail Running Performance: A Systematic Review. Int. J. Sports Physiol. Perform. 2024, 16 (3), 325–332. [CrossRef]
- Vernillo, G.; Giandolini, M.; Edwards, W. B.; Morin, J. B.; Samozino, P.; Horvais, N.; Millet, G. Y. Biomechanics and Physiology of Uphill and Downhill Running. Sport. Med. 2017, 47(4), 615–629. [Google Scholar] [CrossRef]
- Boshielo, P. M.; Jansen van Rensburg, A.; Viljoen, C.; Botha, T.; de Villiers, C. E.; Ramagole, D.; Seyani, L.; Janse van Rensburg, D. C. Illness Is More Prevalent than Injury in Trail Runners Participating in a Mountainous Ultra Trail Race. Phys. Sportsmed. 2024, 00(00), 1–9. [Google Scholar] [CrossRef]
- Vernillo, G.; Savoldelli, A.; Zignoli, A.; Skafidas, S.; Fornasiero, A.; Torre, A. La; Bortolan, L.; Pellegrini, B.; Schena, F. Energy Cost and Kinematics of Level, Uphill and Downhill Running: Fatigue-Induced Changes after a Mountain Ultramarathon. J. Sports Sci. 2015, 33(19), 1998–2005. [Google Scholar] [CrossRef]
- Abbiss, C. R.; Laursen, P. Describing and Understanding Pacing Strategies. Sport. Med. 2008, 38(3), 239–252.
- Zimmermann, P.; Müller, N.; Schöffl, V.; Ehrlich, B.; Moser, O.; Schöffl, I. The Energetic Costs of Uphill Locomotion in Trail Running: Physiological Consequences Due to Uphill Locomotion Pattern—A Feasibility Study. Life 2022, 12(12), 3–6. [Google Scholar] [CrossRef] [PubMed]
- Burke, L. M.; Jones, A. M.; Jeukendrup, A. E.; Mooses, M. Contemporary Nutrition Strategies to Optimize Performance in Distance Runners and Race Walkers. Int. J. Sport Nutr. Exerc. Metab. 2019, 29(2), 117–129. [Google Scholar] [CrossRef]
- Clemente-Suárez, V. J. Psychophysiological Response and Energy Balance during a 14-h Ultraendurance Mountain Running Event. Appl. Physiol. Nutr. Metab. 2015, 40(3), 269–273. [Google Scholar] [CrossRef]
- Spurr, G. B.; Prentice, A. M.; Murgatroyd, P. R.; Goldberg, G. R.; Reina, J. C.; Christman, N. T. Energy Expenditure from Minute-by-Minute Heart-Rate Recording: Comparison with Indirect Calorimetry. Am. J. Clin. Nutr. 1988, 48(3), 552–559. [Google Scholar] [CrossRef]
- Booyens, J.; Hervey, G. R. The Pulse Rate As a Means of Measuring Metabolic Rate in Man. Can. J. Biochem. Physiol. 1960, 38(1), 1301–1309. [Google Scholar] [CrossRef]
- Achten, J.; Jeukendrup, A. E. Heart Rate Monitoring: Applications and Limitations. Sport. Med. 2003, 33(7), 517–538. [Google Scholar] [CrossRef]
- Leonard, W. R. Laboratory and Field Methods for Measuring Human Energy Expenditure. Am. J. Hum. Biol. 2012, 24(3), 372–384. [Google Scholar] [CrossRef]
- Nobuco, Hongu, Barron J. Orr, Denise J Roe, Rebecca G. Reed, S. B. G. Global Positioning System Watches for Estimating Energy Expenditure. J. strength Cond. Res. 2013, 1, 3216–3220.
- Mejer, G.; Westerterp, K. R.; Koper, H. Assessment of Energy Expenditure by Recording Heart Rate and Body Acceleration. Med. Sci. Sports Exerc. 1989, 21(3), 343–347. [Google Scholar] [CrossRef]
- Murakami, H.; Kawakami, R.; Nakae, S.; Nakata, Y.; Ishikawa-Takata, K.; Tanaka, S.; Miyachi, M. Accuracy of Wearable Devices for Estimating Total Energy Expenditure: Comparisonwith Metabolic Chamber and Doubly Labeledwater Method. JAMA Intern. Med. 2016, 176(5), 702–703. [Google Scholar] [CrossRef] [PubMed]
- García-Pinillos, F.; Roche-Seruendo, L. E.; Marcén-Cinca, N.; Marco-Contreras, L. A.; Latorre-Román, P. A. Absolute Reliability and Concurrent Validity of the Stryd System for the Assessment of Running Stride Kinematics at Different Velocities. J. Strength Cond. Res. 2018, No. May, 1. [Google Scholar] [CrossRef]
- Perrotin, N.; Gardan, N.; Lesprillier, A.; Le Goff, C.; Seigneur, J. M.; Abdi, E.; Sanudo, B.; Taiar, R. Biomechanics of Trail Running Performance: Quantification of Spatio-Temporal Parameters by Using Low Cost Sensors in Ecological Conditions. Appl. Sci. 2021, 11(5), 1–14. [Google Scholar] [CrossRef]
- Navalta, J. W.; Montes, J.; Bodell, N. G.; Aguilar, C. D.; Radzak, K.; Manning, J. W.; Debeliso, M. Reliability of Trail Walking and Running Tasks Using the Stryd Power Meter. Int. J. Sports Med. 2019, 40(8), 498–502. [Google Scholar] [CrossRef] [PubMed]
- Van Hooren, B.; Goudsmit, J.; Restrepo, J.; Vos, S. Real-Time Feedback by Wearables in Running: Current Approaches, Challenges and Suggestions for Improvements. J. Sports Sci. 2020, 38(2), 214–230. [Google Scholar] [CrossRef]
- Margaria, R.; Cerretelli, P.; Aghemo, P.; Sassi, G. Energy Cost of Running. J. Appl. Physiol. 1963, 18(2), 367–370. [Google Scholar] [CrossRef]
- Minetti, A. E.; Moia, C.; Roi, G. S.; Susta, D.; Ferretti, G. Energy Cost of Walking and Running at Extreme Uphill and Downhill Slopes. J. Appl. Physiol. 2002, 93(3), 1039–1046. [Google Scholar] [CrossRef] [PubMed]
- Cerezuela-Espejo, V.; Hernández-Belmonte, A.; Courel-Ibáñez, J.; Conesa-Ros, E.; Mora-Rodríguez, R.; Pallarés, J. G. Are We Ready to Measure Running Power? Eur. J. Sport Sci. 2021, 21(3), 341–350. [Google Scholar] [CrossRef] [PubMed]
- Barnes, K. R.; Kilding, A. E. Running Economy: Measurement, Norms, and Determining Factors. Sport. Med. - Open 2015, 1 (8), 1–15. [CrossRef]
- McKay, A. K. A.; Stellingwerff, T.; Smith, E. S.; Martin, D. T.; Mujika, I.; Goosey-Tolfrey, V. L.; Sheppard, J.; Burke, L. M. Defining Training and Performance Caliber: A Participant Classification Framework. Int. J. Sports Physiol. Perform. 2022, 17(2), 317–331. [Google Scholar] [CrossRef] [PubMed]
- Björklund, G.; Swarén, M.; Born, D. P.; Stöggl, T. Biomechanical Adaptations and Performance Indicators in Short Trail Running. Front. Physiol. 2019, 10(506), 1–10. [Google Scholar] [CrossRef]
- Imbach, F.; Candau, R.; Chailan, R.; Perrey, S. Validity of the Stryd Power Meter in Measuring Running Parameters at Submaximal Speeds. Sports 2020, 8(7), 1–19. [Google Scholar] [CrossRef] [PubMed]
- Noakes, T. D.; Myburgh, K. H.; Schall, R. Peak Treadmill Running Velocity during the Vo2 Max Test Predicts Running Performance. J. Sports Sci. 1990, 8(1), 35–45. [Google Scholar] [CrossRef]
- Padulo, J.; Powell, D.; Milia, R.; Ardigò, L. P. A Paradigm of Uphill Running. PLoS One 2013, 8(7), 1–9. [Google Scholar] [CrossRef]
- Billat, L. V; Koralsztein, J. P. Significance of the Velocity at VO2max and Time to Exhaustion at This Velocity. Sports Med. 1996, 22(2), 90–108. [Google Scholar] [CrossRef]
- Beaver, W. L.; Wasserman, K.; Whipp, B. J. A New Method for Detecting Anaerobic Threshold by Gas Exchange. J Appl Physiol 1986, 60(6), 2020–2027. [Google Scholar] [CrossRef]
- Weir, J. B. d. V. New Methods for Calculating Metabolic Rate with Special Reference to Protein Metabolism. J. Physiol. 1949, 109 (1–2), 1–9. [CrossRef]
- Foster, C.; Florhaug, J. A.; Franklin, J.; Gottschall, L.; Hrovatina, L. A.; Suzanne, P.; Doleshal, P.; Dodge, C. A New Approach to Monitoring Exercise Training. J. Strength Cond. Res. 2001, 15(1), 109–115. [Google Scholar]
- Cohen, J. Statistical Power Analysis for the Behavioral Sciences, 2nd ed.; Lawrence Erlbaum Associates, P; 1988.
- Lalanne, C.; Mesbah, M. Measures of Association, Comparisons of Means and Proportions for Two Samples or More. In Biostatistics and Computer-based Analysis of Health Data using Stata; 2016; pp 25–57. [CrossRef]
- Padulo, J.; Annino, G.; Smith, L.; Migliaccio, G. M.; Camino, R.; Tihanyi, J.; Dottavio, S. Uphill Running at Iso-Efficiency Speed. Int. J. Sports Med. 2012, 33(10), 819–823. [Google Scholar] [CrossRef]
- Margaria, R. Positive and Negative Work Performances and Their Efficiencies in Human Locomotion. Int. Zeitschrift für Angew. Physiol. Einschließlich Arbeitsphysiologie 1968, 25 (4), 339–351. [CrossRef]
- Wall-Scheffler, C. M.; Chumanov, E.; Steudel-Numbers, K.; Heiderscheit, B. Electromyography Activity across Gait and Incline: The Impact of Muscular Activity on Human Morphology. Am. J. Phys. Anthropol. 2010, 143(4), 601–611. [Google Scholar] [CrossRef] [PubMed]
- Olesen, H. L. Accumulated Oxygen Deficit Increases with Inclination of Uphill Running. J. Appl. Physiol. 1992, 73(3), 1130–1134. [Google Scholar] [CrossRef]
- Saito, A.; Tomita, A.; Ando, R.; Watanabe, K.; Akima, H. Muscle Synergies Are Consistent across Level and Uphill Treadmill Running. Sci. Rep. 2018, 8(1), 1–10. [Google Scholar] [CrossRef] [PubMed]
- Breiner, T. J.; Ortiz, A. L. R.; Kram, R. Level, Uphill and Downhill Running Economy Values Are Strongly Inter-Correlated. Eur. J. Appl. Physiol. 2019, 119(1), 257–264. [Google Scholar] [CrossRef]
- Jaén-Carrillo, D.; Roche-Seruendo, L. E.; Cartón-Llorente, A.; Ramírez-Campillo, R.; García-Pinillos, F. Mechanical Power in Endurance Running: A Scoping Review on Sensors for Power Output Estimation during Running. Sensors (Switzerland) 2020, 20(22), 1–20. [Google Scholar] [CrossRef] [PubMed]
- Brooks, G. A.; Mercier, J. Balance of Carbohydrate and Lipid Utilization during Exercise: The “crossover” Concept. J. Appl. Physiol. 1994, 76(6), 2253–2261. [Google Scholar] [CrossRef]
- G. A. Cavagna, M. K. Mechanical Work and Efficiency in Level Walkink and Running. J.Physiol. 1977, 268, 467–481.
- Murphy, M. P. How Mitochondria Produce Reactive Oxygen Species. Biochem. J. 2009, 417(1), 1–13. [Google Scholar] [CrossRef]
- Plotkin, D. L.; Roberts, M. D.; Haun, C. T.; Schoenfeld, B. J. Muscle Fiber Type Transitions with Exercise Training: Shifting Perspectives. Sports 2021, 9(9), 1–11. [Google Scholar] [CrossRef]
- Bontemps, B.; Vercruyssen, F.; Gruet, M.; Louis, J. Downhill Running: What Are The Effects and How Can We Adapt? Sport. Med. 2020, 50(12), 2083–2110. [Google Scholar] [CrossRef]
- Snyder, K. L.; Kram, R.; Gottschall, J. S. The Role of Elastic Energy Storage and Recovery in Downhill and Uphill Running. J. Exp. Biol. 2012, 215(13), 2283–2287. [Google Scholar] [CrossRef]
- Chen, T. C.; Nosaka, K.; Tu, J. H. Changes in Running Economy Following Downhill Running. J. Sports Sci. 2007, 25(1), 55–63. [Google Scholar] [CrossRef] [PubMed]
- Halson, S. L. Monitoring Training Load to Understand Fatigue in Athletes. Sport. Med. 2014, 44, 139–147. [Google Scholar] [CrossRef]
- Hills, A. P.; Mokhtar, N.; Byrne, N. M. Assessment of Physical Activity and Energy Expenditure: An Overview of Objective Measures. Front. Nutr. 2014, 1 (June), 1–16. [Google Scholar] [CrossRef] [PubMed]
- Riddick, R. C.; Kuo, A. D. Mechanical Work Accounts for Most of the Energetic Cost in Human Running. Sci. Rep. 2022, 12(1), 1–11. [Google Scholar] [CrossRef] [PubMed]
- Wilson, R. P.; Börger, L.; Holton, M. D.; Scantlebury, D. M.; Gómez-Laich, A.; Quintana, F.; Rosell, F.; Graf, P. M.; Williams, H.; Gunner, R.; Hopkins, L.; Marks, N.; Geraldi, N. R.; Duarte, C. M.; Scott, R.; Strano, M. S.; Robotka, H.; Eizaguirre, C.; Fahlman, A.; Shepard, E. L. C. Estimates for Energy Expenditure in Free-Living Animals Using Acceleration Proxies: A Reappraisal. J. Anim. Ecol. 2020, 89(1), 161–172. [Google Scholar] [CrossRef]
- Sutton, G. J.; Botha, J. A.; Speakman, J. R.; Arnould, J. P. Y. Validating Accelerometry-Derived Proxies of Energy Expenditure Using the Doubly Labelled Water Method in the Smallest Penguin Species. Biol. Open 2021, 10(4), 1–10. [Google Scholar] [CrossRef]
- Berzosa, C.; Comeras-Chueca, C.; Bascuas, P. J.; Gutiérrez, H.; Bataller-Cervero, A. V. Assessing Trail Running Biomechanics: A Comparative Analysis of the Reliability of StrydTM and GARMINRP Wearable Devices. Sensors 2024, 24(11), 1–18. [Google Scholar] [CrossRef]
- García-Pinillos, F.; Roche-Seruendo, L. E.; Marcén-Cinca, N.; Marco-Contreras, L. A.; Latorre-Román, P. A. Absolute Reliability and Concurrent Validity of the Stryd System for the Assessment of Running Stride Kinematics at Different Velocities. J. Strength Cond. Res. 2018, No. May, 1. [Google Scholar] [CrossRef]
Figure 1.
Example of temporal diagram of the effort protocol carried out in the present study.
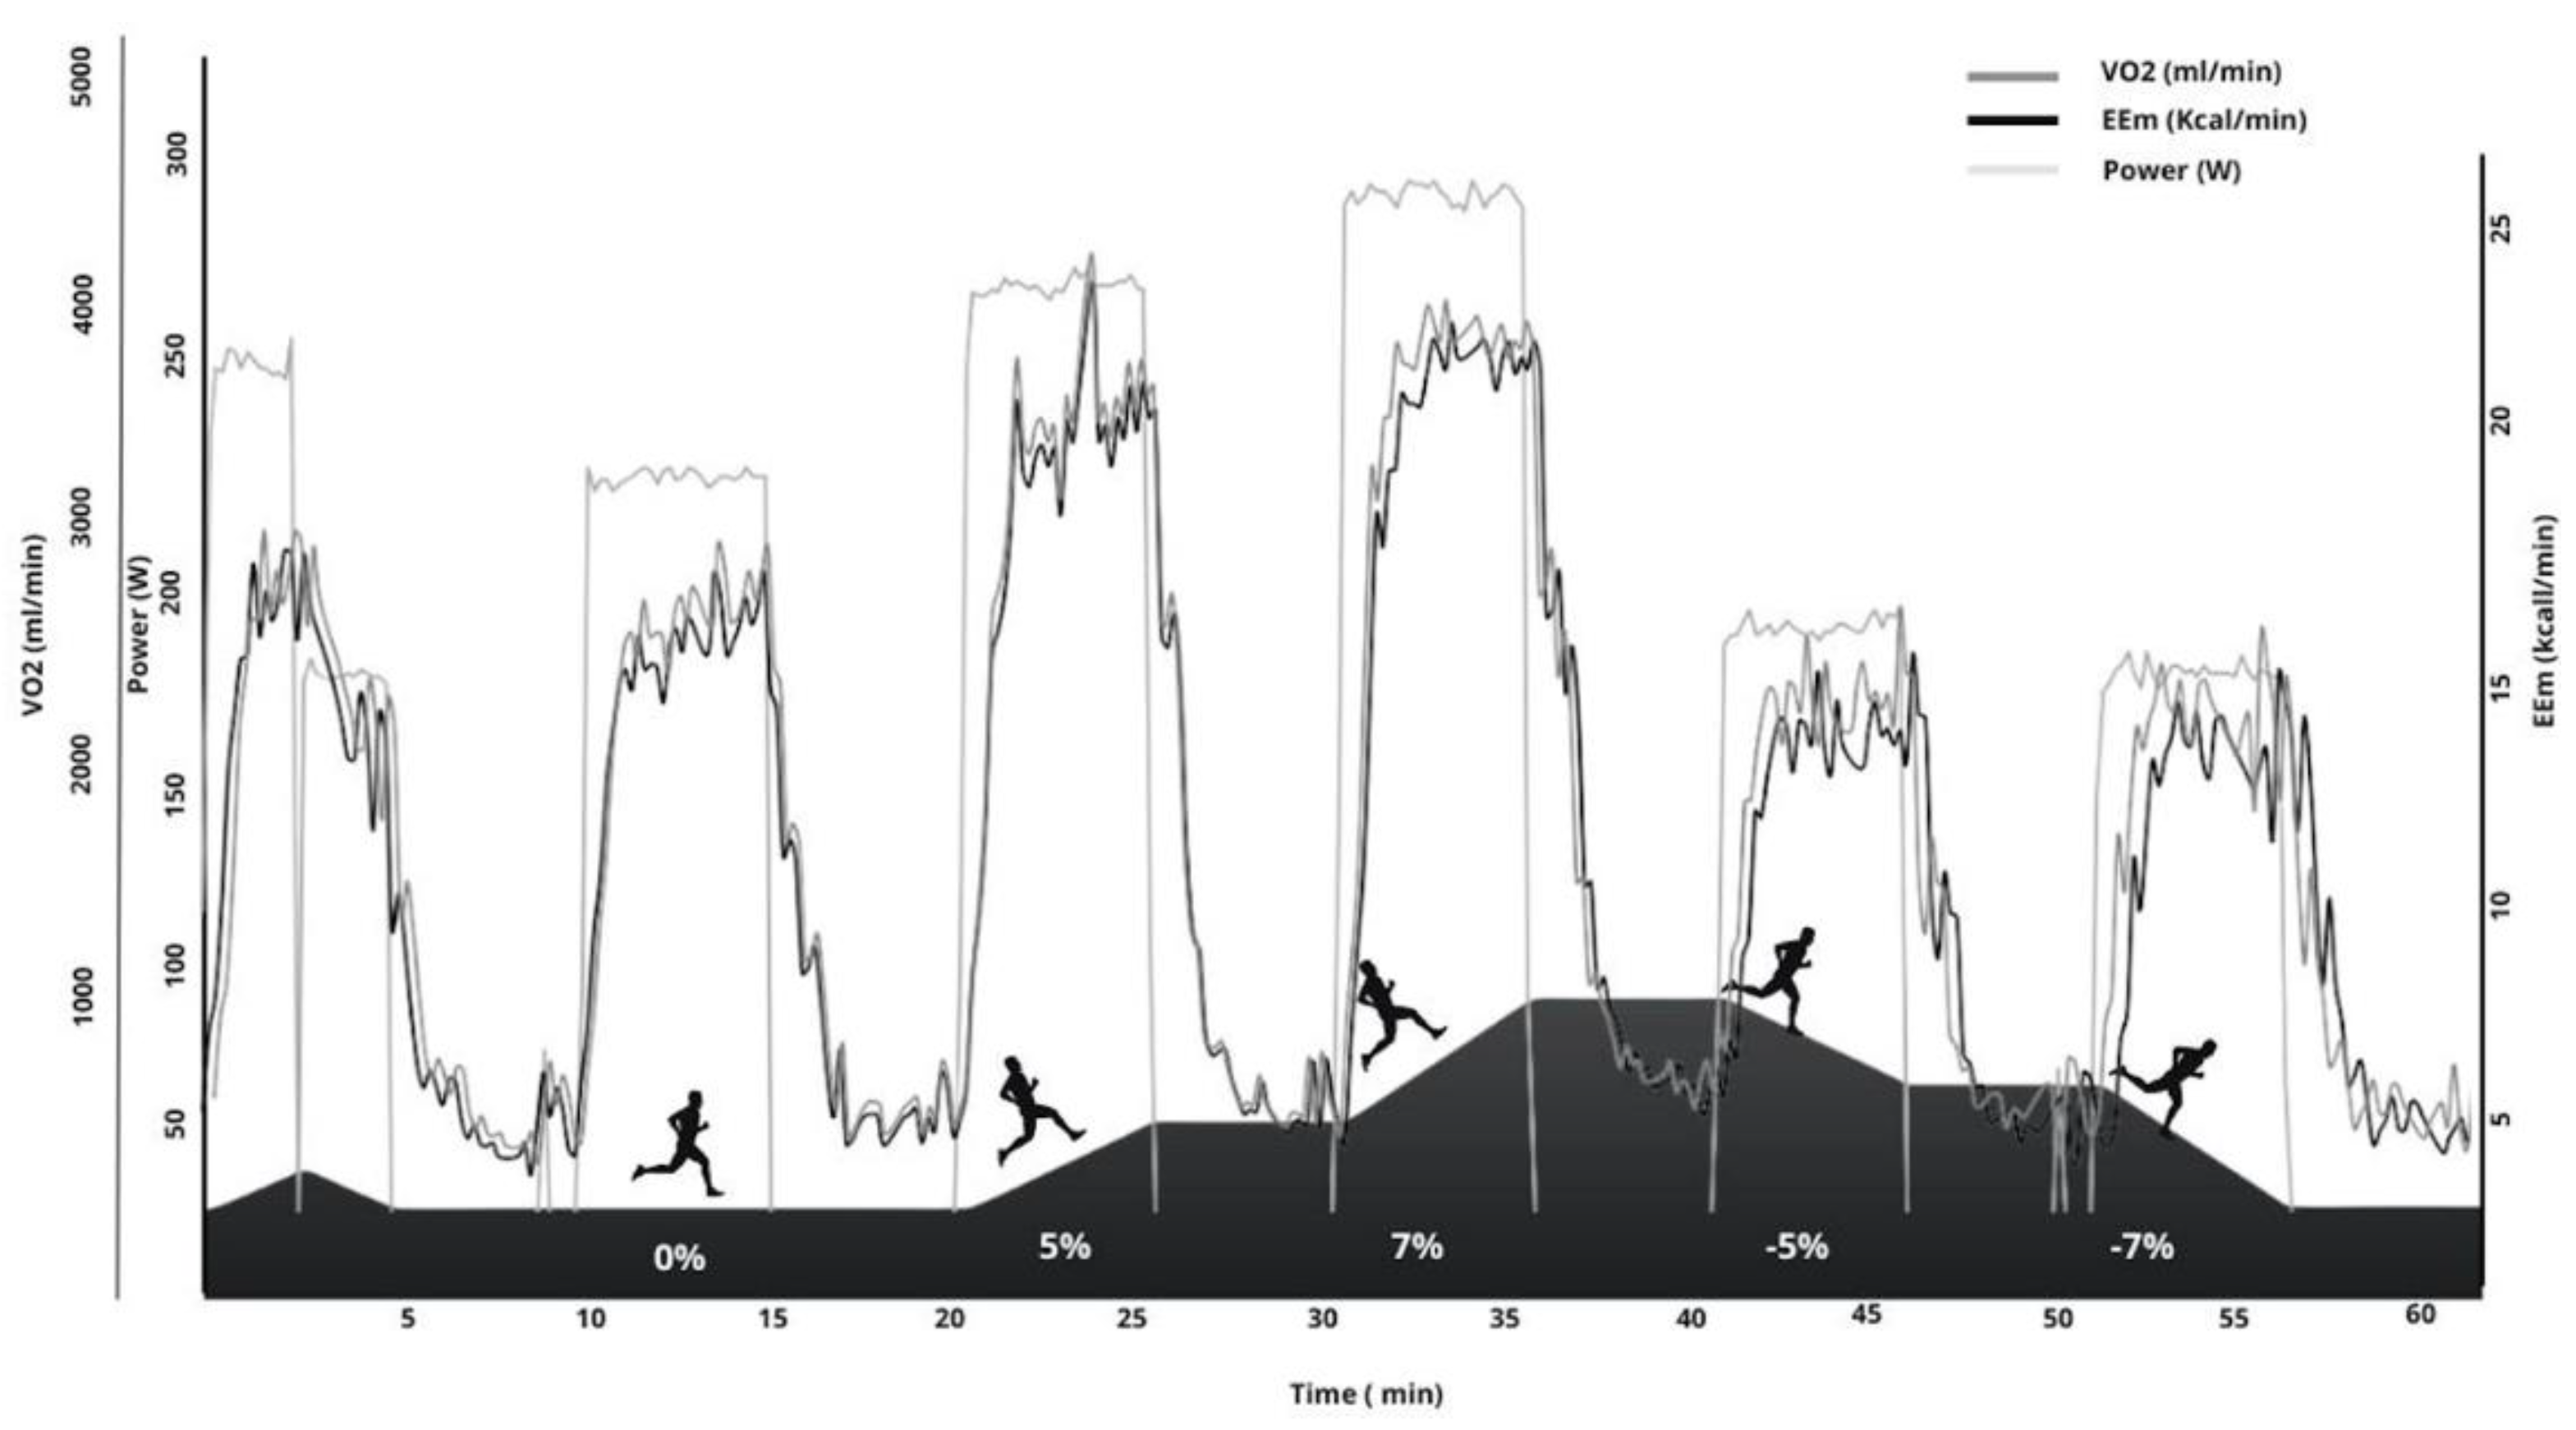
Figure 2.
Difference analysis of the 3-minutes mean values by slopes. 1: significant difference between -7% and -5% of slope; 2: significant differences between -7% and 0% of slope; 3: significant differences between -7% and 5% of slope; 4: significant difference between -7% and 7% of slope; 5: significant difference between -5% and 0% of slope; 6: significant difference between -5% and 5% of slope; 7: significant difference between -5% and 7% of slope; 8: significant difference between 0% and 5% of slope; 9: significant difference between 0% and 7% of slope; 10: significant difference between 5% and 7% of slope. a.u.: arbitrary units; VO2: oxygen uptake; VCO2: carbon dioxide; RQ: respiratory quotient; HR: heart rate; EEmin: energy expenditure minute; RPO (W) : running power output; RPE: rate of perceived exertion.
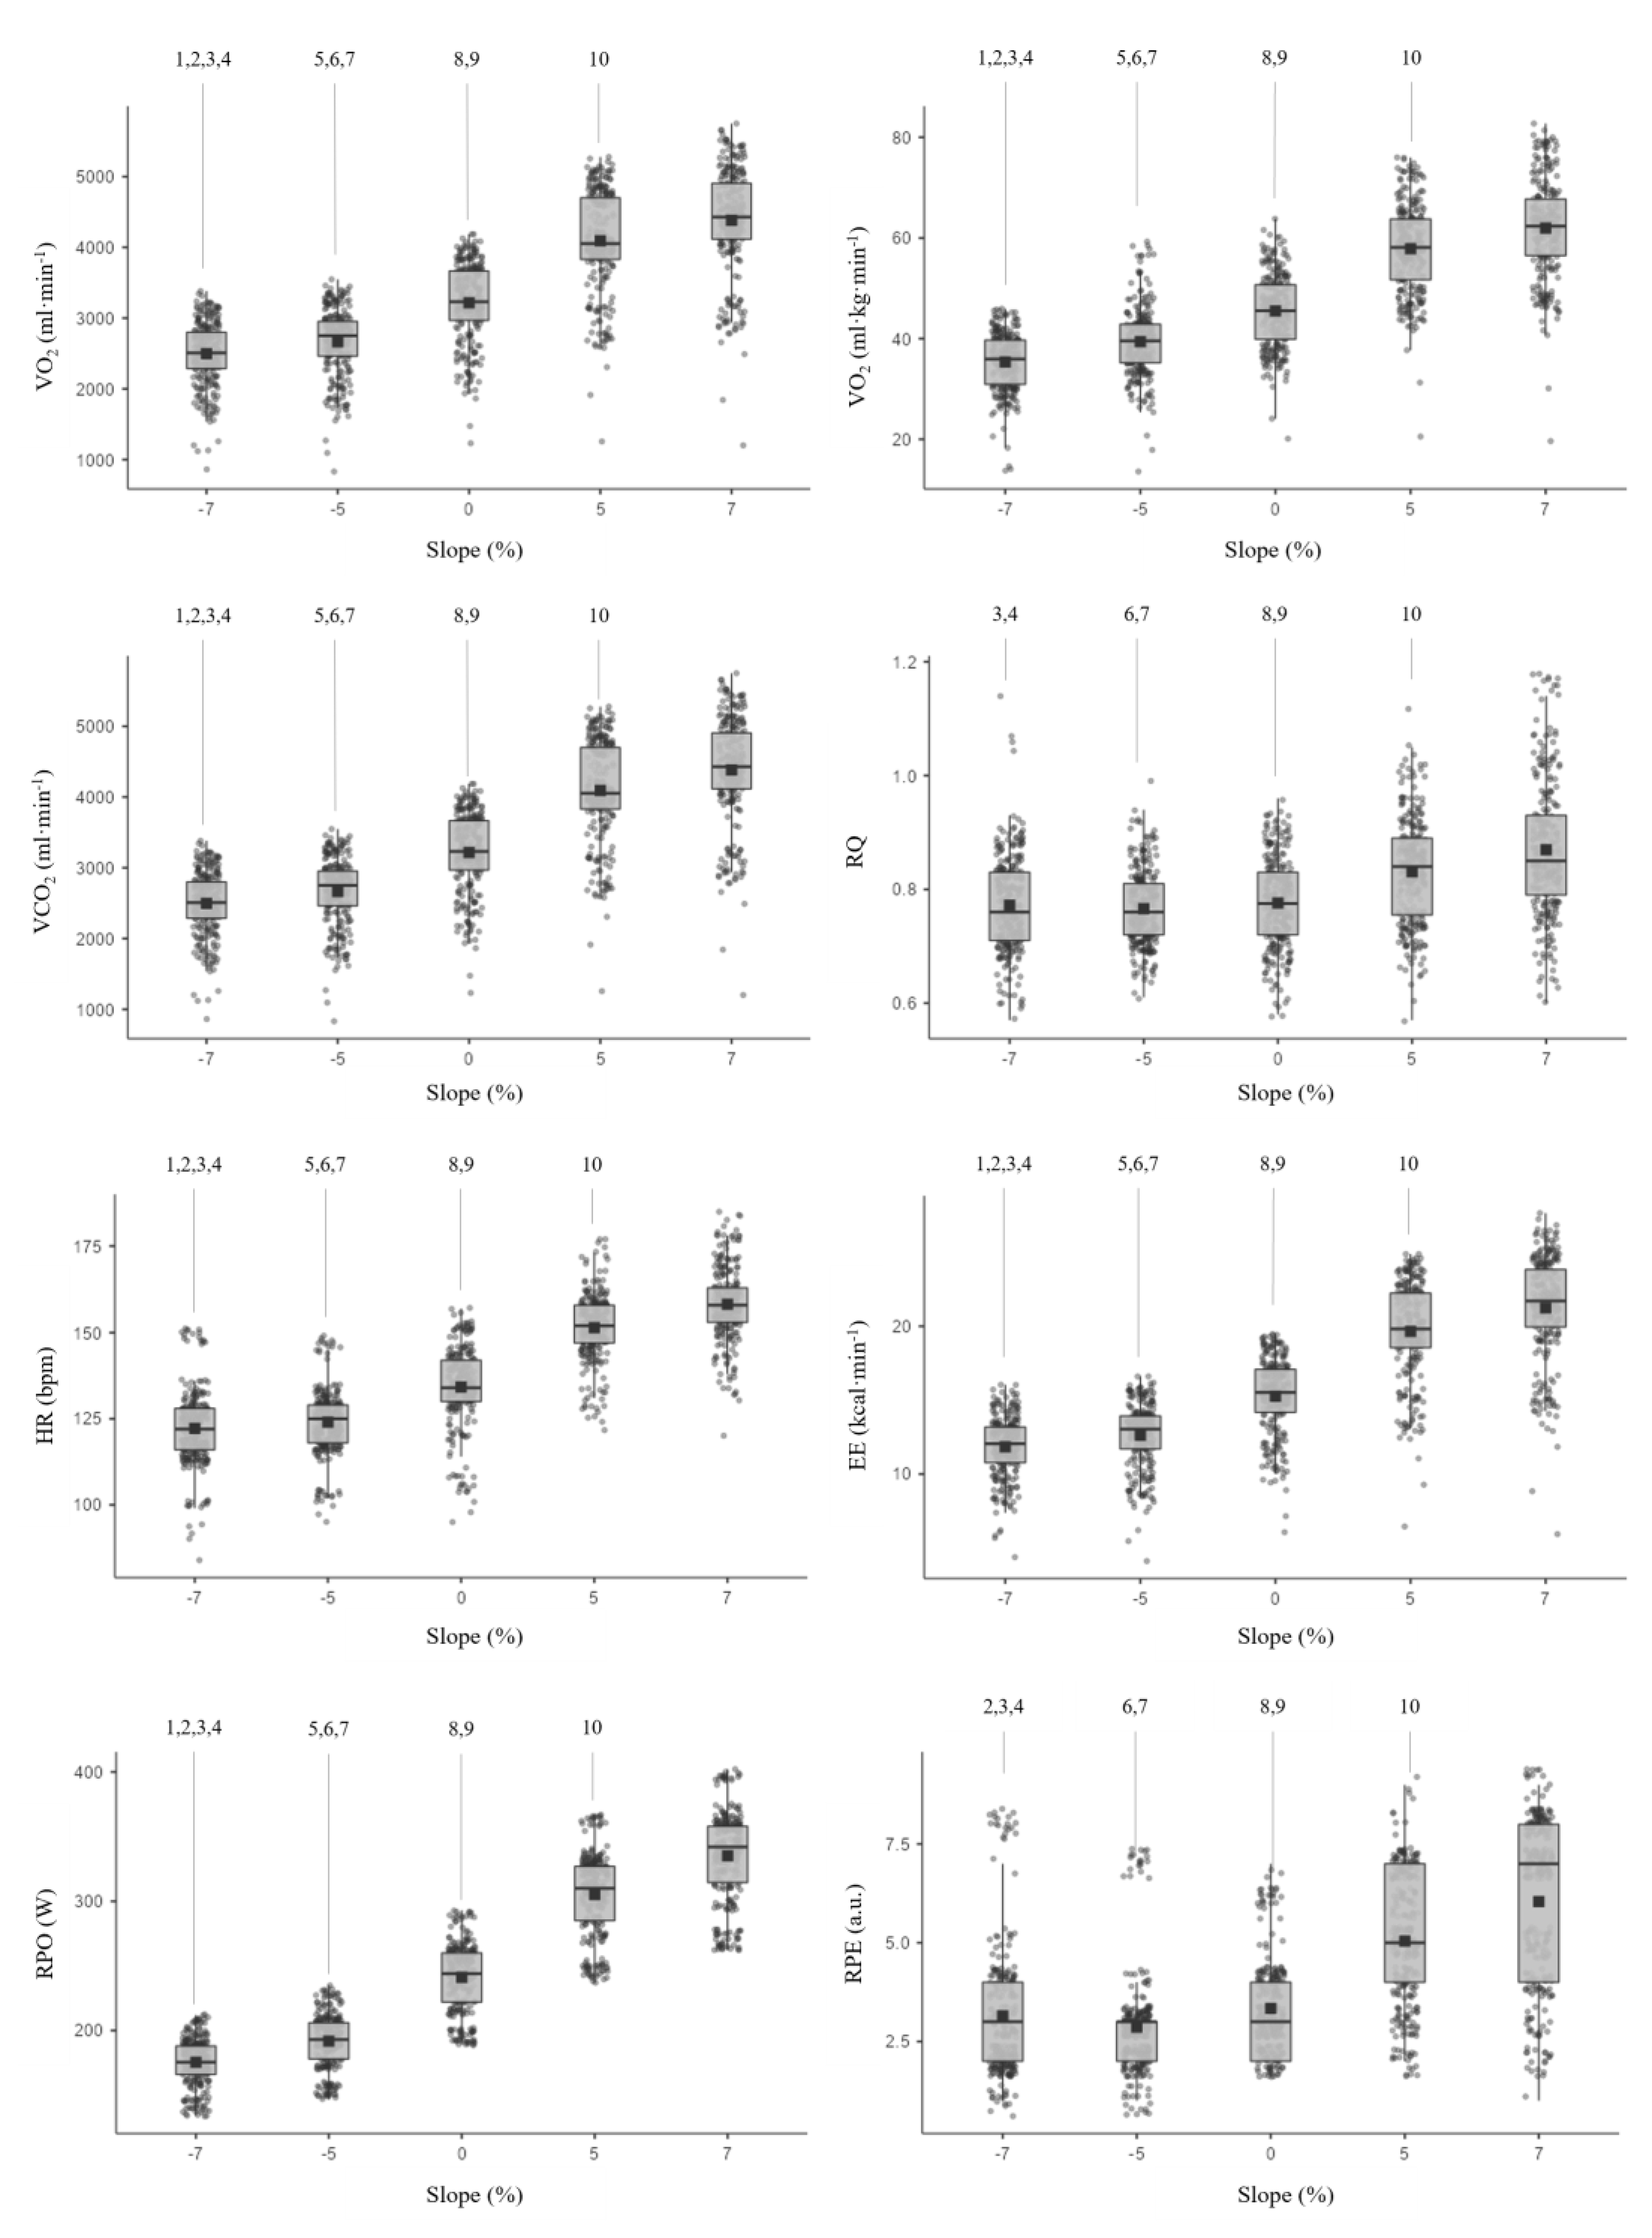
Table 2.
Descriptive (mean and desviation) results of the 3-minutes mean values by slopes.
| Slope | |||||
|---|---|---|---|---|---|
| -7% | -5% | 0% | 5% | 7% | |
| VO2 (mL·min−1) | 2521,4 ± 397,3 | 2682,8 ± 425,4 | 3233,7 ± 525,4 | 4111,6 ± 662,4 | 4390,2 ± 694,2 |
| VO2 (mL·min−1·kg−1) | 35,66 ± 4,89 | 37,91 ± 5,15 | 45,75 ± 6,85 | 58,12 ± 8,15 | 62,09 ± 8,87 |
| VCO2 (mL·min−1) | 1919,1 ± 290,9 | 2031,9 ± 283,6 | 2478,0 ± 372,9 | 3360,6 ± 470,8 | 3772,2 ± 569,9 |
| RQ | 0,77 ± 0,08 | 0,76 ± 0,06 | 0,77 ± 0,08 | 0,82 ± 0,09 | 0,87 ± 0,11 |
| HR (bpm) | 122,5 ± 11,0 | 124,3 ± 9,7 | 134,3 ± 11,7 | 151,6 ± 8,8 | 158,5 ± 9,4 |
| EE (kcal·min−1) | 11,9 ± 1,8 | 12,7 ± 1,9 | 15,3 ± 2,4 | 19,7 ± 3,0 | 21,3 ± 3,1 |
| RPO (W) | 175,9 ± 18,9 | 192,0 ± 21,3 | 242,3 ± 26,9 | 305,7 ± 32,5 | 335,1 ± 35,7 |
| a.u.: arbitrary units; VO2 (mL·min−1): oxygen uptake; VO2 (mL·min−1·kg−1): relative oxygen uptake; VCO2 (mL·min−1): carbon dioxide; RQ: respiratory quotient; HR (bpm): heart rate; EE(kcal·min−1): energy expenditure minute; RPO (W): running power output; RPE: rate of perceived exertion. | |||||
Table 3.
Correlation analysis.
| Data Analysis | VO2(ml/min) | VCO2 (ml/min) | PO (W) | EE (kcal/min) | |
|---|---|---|---|---|---|
| All data included | VO2 (mL·min−1) | - | |||
| VCO2 (mL·min−1) | 0.929*** | - | |||
| PO (W) | 0.904*** | 0.910*** | - | ||
| EE (kcal·min−1) | 0.997*** | 0.953*** | 0.916*** | - | |
| -7% slope | VO2 (mL·min−1) | - | |||
| VCO2 (mL·min−1) | 0.625*** | - | |||
| RPO (W) | 0.679*** | 0.598*** | - | ||
| EE (kcal·min−1) | 0.968*** | 0.774*** | 0.702*** | - | |
| -5% slope | VO2 (mL·min−1) | - | |||
| VCO2 (mL·min−1) | 0.659*** | - | |||
| RPO (W) | 0.758*** | 0.621*** | - | ||
| EE (kcal·min−1) | 0.985*** | 0.751*** | 0.776*** | - | |
| 0% slope | VO2 (mL·min−1) | - | |||
| VCO2 (mL·min−1) | 0.721*** | - | |||
| RPO (W) | 0.714*** | 0.614*** | - | ||
| EE (kcal·min−1) | 0.991*** | 0.788*** | 0.727*** | - | |
| 5% slope | VO2 (mL·min−1) | - | |||
| VCO2 (mL·min−1) | 0.778*** | - | |||
| RPO (W) | 0.719*** | 0.598*** | - | ||
| EE (kcal·min−1) | 0.994*** | 0.832*** | 0.715*** | - | |
| 7% slope | VO2 (mL·min−1) | - | |||
| VCO2 (mL·min−1) | 0.741*** | - | |||
| RPO (W) | 0.692*** | 0.538*** | - | ||
| EE (kcal·min−1) | 0.994*** | 0.795*** | 0.693*** | - |
* p < .05; ** p < .01; *** p < .001***;VO2 (mL·min−1): oxygen uptake; VCO2 (mL·min−1): carbon dioxide; EE (kcal·min−1): energy expenditure minute; RPO (W): running power output.
Disclaimer/Publisher’s Note: The statements, opinions and data contained in all publications are solely those of the individual author(s) and contributor(s) and not of MDPI and/or the editor(s). MDPI and/or the editor(s) disclaim responsibility for any injury to people or property resulting from any ideas, methods, instructions or products referred to in the content. |
© 2025 by the authors. Licensee MDPI, Basel, Switzerland. This article is an open access article distributed under the terms and conditions of the Creative Commons Attribution (CC BY) license (http://creativecommons.org/licenses/by/4.0/).
Copyright: This open access article is published under a Creative Commons CC BY 4.0 license, which permit the free download, distribution, and reuse, provided that the author and preprint are cited in any reuse.


