
Submitted:
17 February 2025
Posted:
18 February 2025
You are already at the latest version
Abstract
Running-induced fatigue affects several biomechanical parameters, yet few studies are focused on the acceleration spikes asymmetries. This study aims to evaluate the effects of a 30-minute run on lower limbs spikes’ asymmetries. Eighteen recreational runners per-formed the test at a moderate speed and acceleration spikes asymmetries and kinematic (temporal) parameters were measured via accelerometers -on tibias and sacrum- and 2D photogrammetry. Acceleration spikes parameters were continuously measured and aver-aged per minute to assess the relationship between fatigue and acceleration spike asym-metries via a linear regression model. Right tibial acceleration spikes increased over time (r = 0.9; p < 0.001) and left tibia spikes decreased (r = 0.78; p < 0.001), with a rise in tibial load asymmetry index from 9% at the start of the test to a 25% at the end (r = 0.98; P < 0.001). The study suggest that fatigue affects acceleration spike of both limbs differently, with increasingly greater acceleration spikes in the right-dominant leg. The findings should be considered, as greater asymmetries are related to overuse injuries and lower ef-ficiency. Also, in studies focusing on running mechanics with fatigue, it is recommended to collect data from both limbs, and not only from the right-dominant.
Keywords:
articular damage
; biomechanical loading
; disbalances
; exertion
; laterality
; locomotion
; musculoskeletal injuries
; overuse injury
; runners
; shock attenuation
1. Introduction
The human body exhibits asymmetry due to both genetic and environmental factors [1]. These asymmetries can manifest at both functional [2] and structural levels [3]. In locomotion, a functional asymmetry exists between the two legs, with the dominant limb contributing more to propulsion, while the non-dominant limb plays a greater role in stabilization or braking [2]. However, excessive kinetic and kinematic asymmetries in running have been associated with an increased risk of injury [4,5] and lower metabolic efficiency [6]. Furthermore, fatigue generally impairs running technique, both in kinematics and kinetic terms. For instance, fatigue induces alterations in spatiotemporal variables such as contact time, flight times and cadence [7,8,9,10,11] or kinetic variables such as ground reaction forces [12,13,14].
Although previous researchers have theorized that fatigue would increase the occurrence of asymmetry [4] recent research have yielded contradictory results [15,16]. Regarding the parameters used to evaluate biomechanical asymmetries, almost all of them measure kinetic and kinematic variables combining 3D motion capture systems and force platforms, based on a force-instrumented treadmill. Axial accelerations measured with accelerometers are positively correlated with the ground reaction forces generated by foot impacts during running and allow the mechanical loading to be measured [17,18,19,20], which has been associated with joint and cartilage degeneration [21,22,23]. According to our literature review, no study to date has analyzed the impact of fatigue on asymmetries of the acceleration spikes measured with accelerometers. From a technical perspective, accelerometers enable the continuous measurement of acceleration spike asymmetries during the test, even at high sampling rates, accounting for acceleration spikes at each step. Furthermore, accelerometers show a good reliability for measuring shank acceleration spikes across short- and long-term running time periods [20]. Additionally, when placed at different caudocranial locations, accelerometers allow for the estimation of acceleration spike attenuation during running. To this respect, the accelerations spikes are higher in the lower limbs than in the spine and head and that this variable could be related to injuries due to overuse [18,20].
Hence, the main aim of this study was to determine if the fatigue induced by a running test at constant speed is related with the lower limbs asymmetries of the acceleration spikes measured via accelerations, representing a novel approach. A secondary objective was to analyze the effects of fatigue on the acceleration spikes itself (i.e., magnitude and attenuation) and temporal variables (flight, contact times and cadence). It is hypothesized that fatigue would impair running technique generating an increase on the asymmetries, and an increase on the acceleration spikes and contact times. The finding of this study could be relevant to improve the understanding of how fatigue affects kinematics, acceleration spike and asymmetries, variables related to metabolic efficiency and risk of overuse injury. On the other hand, if fatigue is found to influence asymmetries, this would reinforce the importance of assessing both lower limbs in studies in which fatigue is generated and not only the dominant limb as is frequently done.
2. Materials and Methods
2.1. Sample
18 runners (35.6 ± 7.5 years; 7 woman) participated, who volunteered in response to an advertisement about the study, after being duly informed about it. Their mean time in a 10-kilometer test was 43.21 ± 20.68 min. The dominant lower limb was determined from the runners' verbal response on which limb they would use to kick a soccer ball [3]. All runners reported right-leg dominance. Anthropometric and cardiovascular data of the subjects are shown in Table 1. Runners were instructed to abstain from any strenuous physical activity and consuming stimulant (e.g., coffee) 48 hours before the test.
Data were processed in accordance with national data protection protocols related to personal details. The study was conducted in accordance with ethical principles for medical research involving human subjects and ethical standards of the Declaration of Helsinki. It also received a favorable evaluation from the Bioethics Committee of the University XXXXXXXX.
2.3. Procedures and Instruments
Runners were asked to perform two running tests on different days (with a minimum and a maximum of 7-15 days difference): an incremental test to determine the so-called fatigue speed and a 30-minute fatigue test, performed at the fatigue speed pace.
On both days, runner height (SECA tallimeter), weight/body composition (Inbody InnerScanV) and blood pressure (Omron M6 Comfort) were measured. The room temperature was set at 20 degrees using an air conditioner (Mitsubishi electric MSZ-AY35VGKP R-32) and temperature and humidity were also measured (via a Extech 445814 hygrometer-thermometer). The slope of the treadmill incline was set at 1%, as this slope has been shown to accurately reflect the energy cost of outdoors running [24].
The first day, runners performed the incremental test. The test began with an 8-minute warm-up at a self-selected speed between 8 and 9 km/h. Following the warm-up, the test was started at 8 km/h and every minute the speed was increased by 0.5 km/h until the maximum speed was reached [25]. The test was stopped when the subjects could not maintain the imposed pace or showed clear signs of exhaustion.
The second day the runners completed a 30-minute fatigue test, designed to address the primary aim of the research. The test begins with an 8-minute warm-up at the same self-selected speed (8–9 km/h) used in the incremental test. After the warm-up, the 30-minute fatigue test was started, at a speed corresponding to 80% of the speed of the last completed sector in the incremental test (fatigue speed). This approach has been adapted from Strohrmann et al. [26]
During both test, heart rate was continuously monitored and averaged per minute to quantify the fatigue, using a pulsometer Polar H10.
Acceleration Spikes Asymmetries Analysis
Acceleration spikes was measured based on the magnitude of the acceleration signal recorded by inertial sensors [18]. Three Axivity AX6 inertial sensors with a measurement range of ± 16 Gs and with a sampling frequency of 400 Hz were used. Two of them were placed under the medial epicondyle of the right and left tibiae, with the longitudinal axis aligned to the tibia, to analyze acceleration spike on the knees (Figure 1). The third sensor was placed over the L5 vertebra with the longitudinal axis aligned with the vertical, to analyze acceleration spike on the sacral region. A 3M adhesive tape which wrapped and adhered directly to the skin and an external neoprene elastic belt (Xsens) were used to secure the sensors. The Axivity sensor data were imported into OriginLab and the negative spikes on the x-axis of the sensor (the highest spikes) were selected without applying any filter, in the attempt to obtain a more accurate representation of the variability within the system than if a filter was applied [27]. This was done using the specific tool “Find Peaks”, of Originlab [18]. Based on pilot trials, the tool was configured for the selection of local maxima in windows of 75 samples in the case of the sensor placed in the sacral region and 150 samples in the sensors placed in the tibias. Subsequently, a visual check of the selection of the spikes was carried out, to ensure that no spikes were missed or that no unwanted spikes were selected.
In order to compute the attenuation between the tibia and sacrum acceleration spike magnitude, the sacral acceleration spike corresponding to each right and left step was chosen. This was achieved using a custom-built Excel template designed to select the adjacent sacral acceleration spike nearest to each tibial acceleration spike [18]. The Excel template with a real example is provided within the supplementary material. Then, attenuation of the acceleration spikes between the tibia and the sacrum region was calculated subtracting the magnitude of the acceleration spikes of the tibia to the magnitude of the adjacent acceleration spike on the sacrum region, dividing the result by the mean of these two variables and multiplying it by 100 [18,19]. A positive value denotes higher acceleration spike in the tibia than in the sacrum region and vice versa.
The time in milliseconds between the tibia and sacrum accelerations spikes (tibia-to-sacrum spike delay) was taken into account to ensure that they were close in time and therefore generated at the same step (right or left) [18]. Additionally, the time interval between consecutive acceleration spikes of the right and left tibiae (i.e., tibia-to-tibia spike delay) was computed. This served as a verification step to confirm that the values were consistent with expected step times and that no anomalies were present, which would indicate errors in spike selection
Kinematic-Temporal Analysis
A ground-level, rear-view high-speed camera (Mars, 800 fps) was used for photogrammetric analysis to determine flight and contact times (Figure 1). The software used for recording was iCentral (Contrastech). To determine the contact and flight times, the videos were analyzed in the Kinovea software, where the moments of landing and take-off of the foot on the ground were manually determined (obtaining a total of 20 steps per sector). The events were exported to an Excel template that allows calculating the flight and contact times of each foot (this template is provided as supplementary material). Cadence was calculated based on the acceleration data, determining the number of sacral spikes per minute [28]. For descriptive purposes, to compare with the accelerometer variable, step time was computed for each runner by summing contact and flight times.
2.4. Data and Statistical Analysis
For the statistical analysis, acceleration spikes magnitude and attenuation were averaged for each minute of the 30-minute fatigue running test. To calculate the symmetry index in percentage, the difference between the value of the right leg and the left leg step was calculated per minute, then it was divided by the mean between both values and the result was multiplied by 100 [12]. This calculation was applied to acceleration spike magnitude and attenuation and for the contact time. A positive value indicates a higher value in the right tibia and vice versa.
The statistical analysis was done with OriginLab software, setting the significant p value at p = 0.05. Descriptive data are presented as mean ± standard deviation. Cardiovascular and body composition parameters were compared between both days via a paired t-test, to ensure that there were no changes. As a control measure, the relationship between the step time computed via photogrammetry and the time between consecutive tibias spikes (which is supposed to be near the step time) was studied using a linear regression.
To study the relationship between fatigue, asymmetries and acceleration spike variables, data from all runners were averaged per minute throughout the fatigue test and a linear regression model was computed, considering the minute of the running test as the independent variable. To evaluate the effect size of the correlations the scale of Evans [29] was used. It stablishes five qualitative levels: (1) 0.00-0.19, very weak; (2) 0.20-0.39, weak; (3) 0.40-0.59, moderate; (4) 0.60-0.79, strong and, (5) 0.80-1.0 very strong.
To compare the differences between sectors in the kinematic-temporal variables (contact, flight times and cadence) a repeated measures ANOVA test was performed. Sphericity was considered and if the Mauchly test yielded a p value less than 0.05, the Greenhouse-Geisser correction was applied.
3. Results
Temperature and humidity ranged between 22-25 Celsius degrees and 30-40%. The paired t-test showed no significant differences in any body composition or cardiovascular variables between the two days (p > 0.05 in all cases). In the incremental test, the minimum and maximum speeds reached were 13 and 20 km/h (16.4 ± 1.5 km/h). In the fatigue test the minimum speed selected based on the incremental test was 10.4 km/h and the maximum speed was 16 km/h (13.1 ± 1.2 km/h), and heart rate increased following an approximately logarithmic trend (r = 0.99; P < 0.001) (Figure 2).
Tibia-to-sacrum spike delay (msec) showed a mean difference of approximately 65 msec for both right and left steps, which was increased throughout the test (r = 0.96; p < 0.001). However, the rate of increase was less than 0.7 msec per minute for both legs. The tibia-to-tibia spike delay (msec) had a mean value of 323 ± 37 msec. There was a strong relationship between the step time measured with the photogrammetry and the time between consecutive tibias spikes (Figure 2), computed with the accelerometers, being this is a measure of the internal validity of the accelerometer data.
3.1. Asymmetries and Acceleration Spikes Trend in the Fatigue Test
During the running test, there was a significant increase in the acceleration spikes magnitude of the right tibia (r = 0.9; p < 0.001) and a significant decrease in the acceleration spikes magnitude of the left tibia (r = - 0.79; p < 0.001) (Figure 4). Linear regression model indicated that, for each minute of the fatigue test, acceleration spikes in the right tibia increased by approximately 0.25 m/s2, whereas those in the left tibia decreased by 0.10 m/s2 (Figure 4). In the sacral region, the magnitude of acceleration spikes decreased for both right (r = -0.73; p < 0.001) and left steps (r = -0.84; p < 0.001), with reductions of approximately 0.13 m/s2 and 0.20 m/s2 per minute, respectively (Figure 4). In addition, with fatigue, the attenuation of acceleration spikes in the right tibia steps increased significantly (r = 0.89; p < 0.001), but this was not the case for the left tibia steps (r = -0.26; p = 0.173).
There were no significant changes in the asymmetries of sacral acceleration spike asymmetries or attenuation (Table 2). However, a significant increase was detected in the asymmetry of acceleration spike magnitude, which rose by 0.5% per minute, ranging from approximately 9% at the beginning of the test to 25% at the end (Table 2; Figure 5).
3.2. Kinematics Differences Between Sectors in the Fatigue Test
4. Discussion
The aim of this study was to analyze the effects of fatigue generated by a 30-minute continuous running test at moderate speed on the lower limb acceleration spike asymmetries, on the acceleration spikes themselves, and on kinematic-temporal variables. The fatigue test induces significative differences between sectors in acceleration spike asymmetries between sectors but did not affect kinematic-temporal variables. Specifically, there was an increase in the right tibia acceleration spikes, a decrease in the acceleration spikes of the left tibia and consequently an increase in the acceleration spikes asymmetries (Figure 3). These results suggest that fatigue induces a deterioration in running mechanics, as evidenced by greater asymmetries due to higher acceleration spikes on the right-dominant limb. This isn’t consistent with previous literature findings and needs to be further studied.
The magnitude of acceleration spikes tended to increase, similar to the findings by other authors [10,20]. However, this trend was only observed in right steps, suggesting that the ability to absorb acceleration spikes in the right limb decreases with fatigue [7,8,9,30]. One possible explanation is that ankle joint stiffness diminishes over time, reducing its capacity to absorb impact peaks. Sanno et al. [31] stated that this loss of ankle stiffness would increase the acceleration spikes in the tibial area. Additionally, fatigue may alter movement patterns and muscle activation, for example by challenging agonist-antagonist coactivation mechanisms in the load response phase or increasing the load on the passive elements (joints and bones) [10,32]. In contrast, acceleration spikes in the left tibia decreased over time, possibly due to a compensatory technical modification to protect the weaker, non-dominant leg. The present study also found a positive trend in the attenuation index for right steps, supporting the hypothesis that running technique is adjusted with fatigue to minimize high-impact forces reaching the upper body [33]. This trend was not observed in left steps, possibly because the lower acceleration magnitude did not require a similar movement pattern adjustment. Some authors report a deterioration of attenuation as fatigue increases [21], while others find an increase in the attenuation [33]. Moreover, these apparent contradictions may have been the result of methodological differences between studies such as running surface, fatigue protocol [19] or running mechanics between subjects [34,35]. Related to this latter point, each runner may change their motor pattern differently to mitigate the negative effects of fatigue, depending on their anatomy, morphology, physiology or level of training [34].
Regarding kinematic-temporal variables our hypothesis that fatigue would induce changes was not fulfilled. However, there is conflicting data in the scientific literature. For example, Möhler et al. [8] in a study on middle-distance racing or Garcia-Pinillos et al. [7] during a 60-minute treadmill run, found an increase in contact time and a decrease in flight time with fatigue, reflecting neuromuscular deterioration associated with fatigue, but no changes in step length or cadence. Otherwise, Mizrahi et al. [10] in a 30-minute run reported a decrease in cadence, which would be indicative of a less metabolically efficient run. Hunter & Smith [11] suggested that cadence changes in a 60-minute run were subject specific with some runners exhibiting little to no change. Additionally, others authors do not find changes with fatigue in most kinematic-spatiotemporal parameter including contact times [36]. Hanley & Tucker [36] found differences in flight time, but only after the fifth kilometer of the running test. Therefore, the absence of significant differences in temporal variables in the present study is not unexpected, as several studies have also failed to find them. Nevertheless, the kinematics and the acceleration data are supposed to be interrelated; hence it is reasonable to assume that reported acceleration spike changes would translate into changes in flight, contact times or cadence. It is possible that the kinematic alterations in a continuous 30-minute test at the selected speed are practically negligible and that very sensitive biomechanical measurement systems are required to detect them. In our study, an 800-fps camera was used to determine contact and flight times, which we considered to be quite sensitive. However, it may not have been precise enough to capture subtle variations. Additionally, the magnitude of kinetic changes in recreational runners with an adequate level of training may not be large enough to produce detectable kinematic alterations.
Studies analyzing the effect of fatigue on kinetic or kinematic asymmetries are relatively recent, and their conclusions remain inconsistent. While most reports that fatigue does not modify asymmetries [3,12,14,15,36,37,38,39,40,41,42], others conclude that it increases asymmetries, mainly in kinematics variables [13,16,43]. Some research even states that fatigue decreases asymmetries, which may indicate a protective strategy in which loads are more evenly distributed between limbs as fatigue progresses [35]. Buxton et al. [37] observed that while no significant differences were found at the cohort level, individual analyses revealed variations, with some subjects exhibiting increased asymmetries as fatigue progressed. The main finding of our study is that fatigue, generated by moderate-speed running, increased asymmetries in the acceleration spikes between the right and left leg. This finding is different from most previous studies that find no change in kinetics asymmetries with running fatigue. Our results are consistent, however, with the finding of Gao et al. [43], who found that under fatigue, the knee maximum extension velocity was greater in the dominant limb, which may be due to the greater propelling contribution of this leg on the locomotion [2]. A higher knee extension velocity would imply a more aggressive impact of the foot against the ground and thus a higher acceleration spike. Additionally, Radzack et al. [13] found that the decrease in stiffness was less apparent in the right limb, which would also generate higher acceleration spikes (greater stiffness implies less deformation of the ankle which would result in a higher impact, by Newton's third law). This is contrary to the thesis of Sanno et al. [31], who speculate that stiffness and acceleration spikes are positively related.
The increase in acceleration spike asymmetries with fatigue could be attributed to a combination of two well-documented factors: (1) fatigue-induced impairments in running mechanics and (2) inherent structural and functional differences between the lower limbs. Concerning the first point, fatigue is supposed to cause impairments in neuromechanical factors, such as a reduction in mechanical energy transfer during the stretch–shortening cycle and a decrease in muscle reaction times [10]. As for the second factor, structural and functional differences between the limbs are well established [1]. The dominant leg (typically the right), exhibits greater propulsive capacity [2] and an increased ability to develop force in the extensor muscles [44], while the non-dominant leg may be a little larger [1], with a better stabilization or braking capacity [2] and an increased ability to develop force in the flexor muscles. Given these disparities, it is unlikely that fatigue affects both legs equally. One plausible explanation is that the right leg, being more engaged in propulsion, experiences greater fatigue-induced deterioration in its impact attenuation mechanisms. This would result in an increased mechanical load, as evidenced by the rise in acceleration spikes in the right tibia. Concomitantly, the mechanical loading of the non-dominant leg may decrease due to a reduction of its involvement in the braking phase of the stance, induced by fatigue (the acceleration spike on the left leg have decreased significantly with time). However, these hypotheses cannot be answered with the methodology employed as no force plates and/or electromyography were used. Consequently, it is not possible to determine the precise contribution of each leg during different phases of the running cycle. Maybe the differences with other studies that find no asymmetries changes with fatigue could be due to the instrumentation and the variables measured, i.e., methodological issues. The present study has measured the acceleration spikes in every single step during the whole run and not only in a few cycles.
This study has several limitations that should be considered when interpreting the findings. Firstly, physiological thresholds were not measured, not allowing the nature of the test (aerobic vs. anaerobic) to be fully determined. Nevertheless, the heart rate increased progressively, indicating that pace was close to the anaerobic threshold (otherwise the heart rate would have maintained a quasi-steady state). Secondly, the level of the runners included was not considered for the statistical analysis and the sample was somewhat heterogeneous. In this regard, Strohrmann et al. [26] indicated that beginner and intermediate runners attenuated less shock with fatigue and that they have a greater increase in acceleration spikes with fatigue. This suggests that future research should include larger sample sizes and categorize participants based on their running experience to better understand how expertise influences fatigue-related asymmetries. Finally, ground reaction forces, joint stiffness, muscular electrical activity (or other local measurements of fatigue) and acceleration signal evaluated in the frequency domain were not measured. These measures could provide deeper insight into the observed increase in mechanical load and asymmetries. Despite these limitations, the work should be taken into account, considering that it is one of the scarce studies that find an increase in asymmetries in acceleration spike variables with fatigue and that these variables are proposed to be associated with overuse injury and running efficiency. Future studies should aim to measure these variables continuously and integrate acceleration data (both in the time and frequency domains) with force plate assessments, kinematic parameters, and muscle activity measurements (e.g., electromyography and joint stiffness). Additionally, the results highlight the importance of measuring the kinematics and kinetics of both lower limbs and not just of the right-dominant, especially when running fatigated, even at moderate speeds.
5. Conclusions
Few studies analyze the effects of fatigue on asymmetries, despite their potential implications for running efficiency and injury risk. The results of this research point out that, in a 30-minute continuous test at moderate speed, asymmetries in acceleration spikes undergo notable changes. Specifically, there was an increase in tibial acceleration spikes in the right leg and a decrease in the left leg, leading to greater asymmetries between limbs. These findings suggest that fatigue alters the biomechanics of the right-dominant and left non-dominant leg differently, probably due to local neuromechanical or physiological factors that should be investigated in depth. Future research should combine continuous data collection methods such as accelerometers with force platforms and parameters related with local muscular fatigue. Also, it is suggested that fatigue focused studies should collect data from both lower limbs and not just the right-dominant one.
Supplementary Materials
The following supporting information can be downloaded at: www.mdpi.com/xxx/s1, Supplementary file-Template to compute contact times and flight times.xlsx, Supplementary file-Template to select adjacent peaks.xlsx.
Author Contributions
Conceptualization, G.D.-G., F.S.-M and S.B.-G.; data curation, G.D.-C.; formal analysis, G.D.-G. and S.B.-G.; funding acquisition, G.D.-G. and F.S.-M., S.B.-G.; investigation, G.D.-C., I.M.-L., F.S.-M., A.Q.-M and S.B.-G.; methodology, G.D.-C. and S. B.-G.; project administration, G.D.-G., F.S.-M. and S.B.-G.; resources, G.D.-G. and S.B.-G; software, G.D.-C.; supervision, G.D.-C., I.M.-L., F.S.-M., A.Q.-M and S.B.-G; validation, G.D.-C.; writing – original draft, G.D.-C., I.M.-L., F.S.-M., A.Q.-M and S.B.-G.; writing – review and editing, G.D.-C., I.M.-L., F.S.-M., A.Q.-M and S.B.-G. All authors have read and agreed to the published version of the manuscript.
Funding
This work was supported by the University College Alberta Giménez (CESAG), affiliated to Comillas Pontifical University (UP Comillas) (Precompetitive Project: PRO2023-002). This work has also been sustained by the project “SensorSportLab III”, (Sports Science Re-search Networks 2024) funded by the Higher Sport Council (Ministry of Culture and Sport).
Institutional Review Board Statement
This study was conducted in accordance with the Declaration of Helsinki and approved by the Ethics Committee of the University Pontifical Comillas (approved the 26th April 2024) for studies involving humans.
Informed Consent Statement
Informed consent was obtained from all subjects involved in this study.
Data Availability Statement
Data are unavailable due to privacy or ethical restrictions. If any researcher is interested in the raw data of this study, please contact the corresponding author by mail.
Acknowledgments
The authors would like to thank all those subjects who participated in this research.
Conflicts of Interest
The authors declare no conflicts of interest.
References
- Krishan, K.; Kanchan, T.; DiMaggio, J.A. A Study of Limb Asymmetry and Its Effect on Estimation of Stature in Forensic Case Work. Forensic Science International 2010, 200, 181.e1–181.e5. [Google Scholar] [CrossRef] [PubMed]
- Sadeghi, H.; Allard, P.; Prince, F.; Labelle, H. Symmetry and Limb Dominance in Able-Bodied Gait: A Review. Gait & Posture 2000, 12, 34–45. [Google Scholar] [CrossRef]
- Brown, A.M.; Zifchock, R.A.; Hillstrom, H.J. The Effects of Limb Dominance and Fatigue on Running Biomechanics. Gait & Posture 2014, 39, 915–919. [Google Scholar] [CrossRef]
- Zifchock, R.A.; Davis, I.; Higginson, J.; McCaw, S.; Royer, T. Side-to-Side Differences in Overuse Running Injury Susceptibility: A Retrospective Study. Human movement science 2008, 27, 888–902. [Google Scholar] [CrossRef] [PubMed]
- Zifchock, R.A.; Davis, I.; Hamill, J. Kinetic Asymmetry in Female Runners with and without Retrospective Tibial Stress Fractures. Journal of Biomechanics 2006, 39, 2792–2797. [Google Scholar] [CrossRef] [PubMed]
- Beck, O.N.; Azua, E.N.; Grabowski, A.M. Step Time Asymmetry Increases Metabolic Energy Expenditure during Running. Eur J Appl Physiol 2018, 118, 2147–2154. [Google Scholar] [CrossRef]
- García-Pinillos, F.; Cartón-Llorente, A.; Jaén-Carrillo, D.; Delgado-Floody, P.; Carrasco-Alarcón, V.; Martínez, C.; Roche-Seruendo, L.E. Does Fatigue Alter Step Characteristics and Stiffness during Running? Gait & Posture 2020, 76, 259–263. [Google Scholar] [CrossRef]
- Möhler, F.; Fadillioglu, C.; Stein, T. Fatigue-Related Changes in Spatiotemporal Parameters, Joint Kinematics and Leg Stiffness in Expert Runners During a Middle-Distance Run. Front. Sports Act. Living 2021, 3, 634258. [Google Scholar] [CrossRef]
- Möhler, F.; Stetter, B.; Müller, H.; Stein, T. Stride-to-Stride Variability of the Center of Mass in Male Trained Runners After an Exhaustive Run: A Three Dimensional Movement Variability Analysis With a Subject-Specific Anthropometric Model. Frontiers in Sports and Active Living 2021, 3. [Google Scholar] [CrossRef]
- Mizrahi, J.; Verbitsky, O.; Isakov, E.; Daily, D. Effect of Fatigue on Leg Kinematics and Impact Acceleration in Long Distance Running. Human Movement Science 2000, 19, 139–151. [Google Scholar] [CrossRef]
- Hunter, I.; Smith, G.A. Preferred and Optimal Stride Frequency, Stiffness and Economy: Changes with Fatigue during a 1-h High-Intensity Run. Eur J Appl Physiol 2007, 100, 653–661. [Google Scholar] [CrossRef] [PubMed]
- Bell, D.R.; Pennuto, A.P.; Trigsted, S.M. The Effect of Exertion and Sex on Vertical Ground Reaction Force Variables and Landing Mechanics. Journal of Strength and Conditioning Research 2016, 30, 1661–1669. [Google Scholar] [CrossRef]
- Radzak, K.N.; Putnam, A.M.; Tamura, K.; Hetzler, R.K.; Stickley, C.D. Asymmetry between Lower Limbs during Rested and Fatigued State Running Gait in Healthy Individuals. Gait & Posture 2017, 51, 268–274. [Google Scholar] [CrossRef]
- Ryu, J.-S. Vertical Ground Reaction Force Asymmetry in Prolonged Running. Korean Journal of Applied Biomechanics 2018, 28, 29–35. [Google Scholar] [CrossRef]
- Mtibaa, K.; Zarrouk, N.; Ryu, J.H.; Racinais, S.; Girard, O. Mechanical Asymmetries Remain Low-to-Moderate during 30 Min of Self-Paced Treadmill Running. Front. Physiol. 2023, 14, 1289172. [Google Scholar] [CrossRef]
- Gao, Z.; Fekete, G.; Baker, J.S.; Liang, M.; Xuan, R.; Gu, Y. Effects of Running Fatigue on Lower Extremity Symmetry among Amateur Runners: From a Biomechanical Perspective. Front. Physiol. 2022, 13, 899818. [Google Scholar] [CrossRef] [PubMed]
- Andrews, D.M.; Dowling, J.J. Mechanical Modeling of Tibial Axial Accelerations Following Impulsive Heel Impact. Journal of Applied Biomechanics 2000, 16, 276–288. [Google Scholar] [CrossRef]
- Delgado-García, G.; Vanrenterghem, J.; Molina-Molina, A.; Soto-Hermoso, V.M. Acceleration Spikes and Attenuation Response in the Trunk in Amateur Tennis Players during Real Game Actions. Proceedings of the Institution of Mechanical Engineers, Part P: Journal of Sports Engineering and Technology, 7543. [Google Scholar]
- García-Pérez, J.A.; Pérez-Soriano, P.; Llana Belloch, S.; Lucas-Cuevas, Á.G.; Sánchez-Zuriaga, D. Effects of Treadmill Running and Fatigue on Impact Acceleration in Distance Running. Sports Biomechanics 2014, 13, 259–266. [Google Scholar] [CrossRef]
- Burke, A.; Dillon, S.; O’Connor, S.; Whyte, E.F.; Gore, S.; Moran, K.A. Relative and Absolute Reliability of Shank and Sacral Running Impact Accelerations over a Short- and Long-Term Time Frame. Sports Biomechanics 2024, 23, 3074–3089. [Google Scholar] [CrossRef]
- Mercer, J.; Bates, B.; Dufek, J.; Hreljac, A. Characteristics of Shock Attenuation during Fatigued Running. Journal of Sports Sciences 2003, 21, 911–919. [Google Scholar] [CrossRef]
- Verbitsky, O.; Mizrahi, J.; Voloshin, A.; Treiger, J.; Isakov, E. Shock Transmission and Fatigue in Human Running. Journal of Applied Biomechanics 1998, 14, 300–311. [Google Scholar] [CrossRef] [PubMed]
- Voloshin, A.S.; Mizrahi, J.; Verbitsky, O.; Isakov, E. Dynamic Loading on the Human Musculoskeletal System —Effect of Fatigue. Clinical Biomechanics 1998, 13, 515–520. [Google Scholar] [CrossRef] [PubMed]
- Jones, M., Jonathan H. Doust, A. A 1% Treadmill Grade Most Accurately Reflects the Energetic Cost of Outdoor Running. Journal of Sports Sciences 1996, 14, 321–327. [CrossRef]
- Karatzanos, E.; Paradisis, G.; Zacharogiannis, E.; Tziortzis, S.; Nanas, S. Assessment of Ventilatory Threshold Using Near-Infrared Spectroscopy on the Gastrocnemius Muscle during Treadmill Running. International Journal of Industrial Ergonomics 2010, 40, 206–211. [Google Scholar] [CrossRef]
- Strohrmann, C.; Harms, H.; Kappeler-Setz, C.; Troster, G. Monitoring Kinematic Changes With Fatigue in Running Using Body-Worn Sensors. IEEE Trans. Inform. Technol. Biomed. 2012, 16, 983–990. [Google Scholar] [CrossRef] [PubMed]
- Buzzi, U.H.; Stergiou, N.; Kurz, M.J.; Hageman, P.A.; Heidel, J. Nonlinear Dynamics Indicates Aging Affects Variability during Gait. Clinical Biomechanics 2003, 18, 435–443. [Google Scholar] [CrossRef]
- Williams, K.R.; Snow, R.; Agruss, C. Changes in Distance Running Kinematics with Fatigue. Journal of Applied Biomechanics 1991, 7, 138–162. [Google Scholar] [CrossRef]
- Evans, J.D. Straightforward Statistics for the Behavioral Sciences; Brooks/Cole Pub. Co: Pacific Grove, 1996; ISBN 978-0-534-23100-2. [Google Scholar]
- Rabita, G.; Couturier, A.; Dorel, S.; Hausswirth, C.; Le Meur, Y. Changes in Spring-Mass Behavior and Muscle Activity during an Exhaustive Run at V ̇ O2max. Journal of Biomechanics 2013, 46, 2011–2017. [Google Scholar] [CrossRef]
- Sanno, M.; Willwacher, S.; Epro, G.; Brüggemann, G.-P. Positive Work Contribution Shifts from Distal to Proximal Joints during a Prolonged Run. Medicine & Science in Sports & Exercise 2018, 50, 2507–2517. [Google Scholar] [CrossRef]
- Kellis, E.; Zafeiridis, A.; Amiridis, I.G. Muscle Coactivation Before and After the Impact Phase of Running Following Isokinetic Fatigue. Journal of Athletic Training 2011, 46, 11–19. [Google Scholar] [CrossRef]
- Derrick, T.R.; Dereu, D.; Mclean, S.P. Impacts and Kinematic Adjustments during an Exhaustive Run. Medicine & Science in Sports & Exercise 2002, 34, 998–1002. [Google Scholar] [CrossRef]
- Chalitsios, C.; Nikodelis, T.; Mavrommatis, G.; Kollias, I. Subject-Specific Sensitivity of Several Biomechanical Features to Fatigue during an Exhaustive Treadmill Run. Sci Rep 2024, 14, 1004. [Google Scholar] [CrossRef] [PubMed]
- Vial, S.; Cochrane Wilkie, J.; Anthony, M.; Turner, M.; Blazevich, J. Fatigue Does Not Increase Limb Asymmetry or Induce Proximal Joint Power Shift during Sprinting in Habitual, Multi-Speed Runners 2021.
- Hanley, B.; Tucker, C.B. Gait Variability and Symmetry Remain Consistent during High-Intensity 10,000 m Treadmill Running. Journal of Biomechanics 2018, 79, 129–134. [Google Scholar] [CrossRef]
- Buxton, J.; Shields, K.J.; Nhean, H.; Ramsey, J.; Adams, C.; Richards, G.A. Fatigue Effects on Peak Plantar Pressure and Bilateral Symmetry during Gait at Various Speeds. Biomechanics 2023, 3, 310–321. [Google Scholar] [CrossRef]
- Girard, O.; Brocherie, F.; Morin, J.-B.; Millet, G.P. Lower Limb Mechanical Asymmetry during Repeated Treadmill Sprints. Human Movement Science 2017, 52, 203–214. [Google Scholar] [CrossRef]
- Girard, O.; Li, S.N.; Hobbins, L.; Ryu, J.H.; Peeling, P. Gait Asymmetries during Perceptually-Regulated Interval Running in Hypoxia and Normoxia. Sports Biomechanics 2024, 23, 918–934. [Google Scholar] [CrossRef]
- Girard, O.; Millet, G.P.; Micallef, J.-P. Constant Low-to-Moderate Mechanical Asymmetries during 800-m Track Running. Front. Sports Act. Living 2024, 6, 1278454. [Google Scholar] [CrossRef]
- Girard, O.; Racinais, S.; Couderc, A.; Morin, J.-B.; Ryu, J.H.; Piscione, J.; Brocherie, F. Asymmetries during Repeated Treadmill Sprints in Elite Female Rugby Sevens Players. Sports Biomechanics 2023, 22, 863–873. [Google Scholar] [CrossRef]
- Jacques, T.; Bini, R.; Arndt, A. Running after Cycling Induces Inter-Limb Differences in Muscle Activation but Not in Kinetics or Kinematics. Journal of Sports Sciences 2021, 39, 154–160. [Google Scholar] [CrossRef]
- Gao, Z.; Mei, Q.; Fekete, G.; Baker, J.S.; Gu, Y. The Effect of Prolonged Running on the Symmetry of Biomechanical Variables of the Lower Limb Joints. Symmetry 2020, 12, 720. [Google Scholar] [CrossRef]
- Lanshammar, K.; Ribom, E.L. Differences in Muscle Strength in Dominant and Non-Dominant Leg in Females Aged 20–39 Years – A Population-Based Study. Physical Therapy in Sport 2011, 12, 76–79. [Google Scholar] [CrossRef] [PubMed]
Figure 1.
Experimental setup. (2) High-speed camera to determine contact and flight times; (2) Placement of the inertial sensors on the tibias (the elastic band has not been placed on top to show the exact location); (3) Oxygen saturation sensor.
Figure 1.
Experimental setup. (2) High-speed camera to determine contact and flight times; (2) Placement of the inertial sensors on the tibias (the elastic band has not been placed on top to show the exact location); (3) Oxygen saturation sensor.
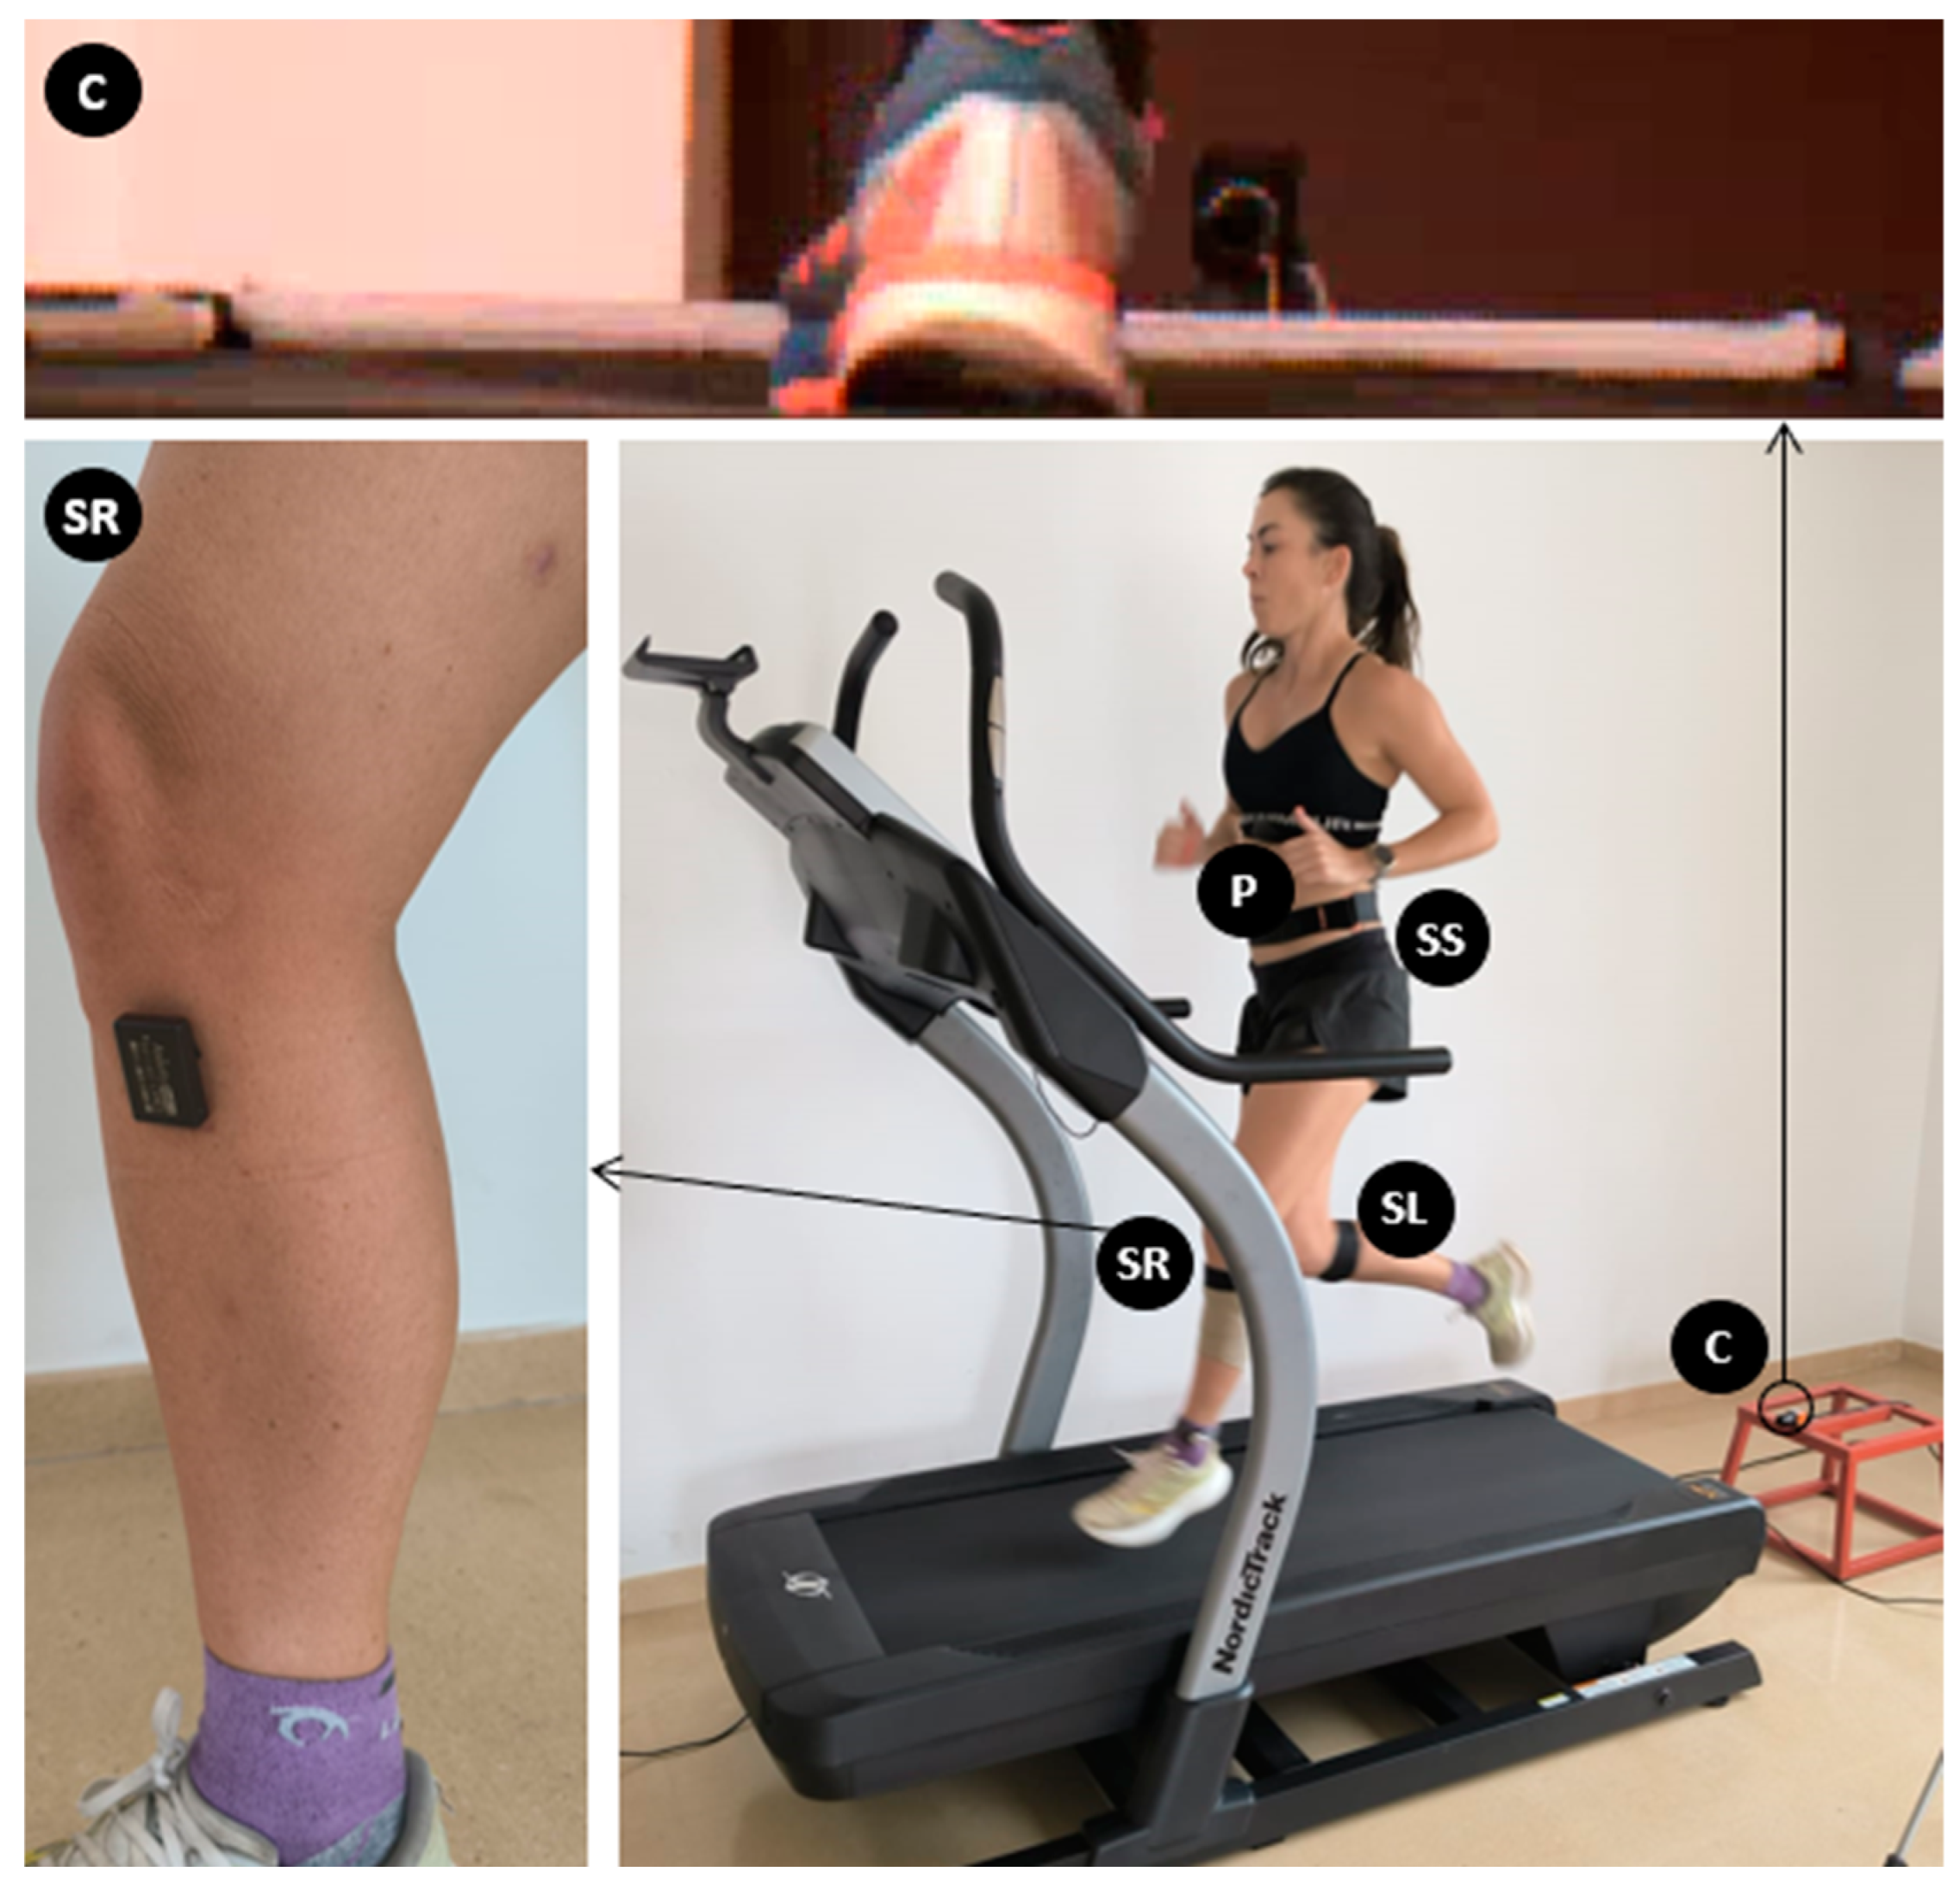
Figure 2.
Heart rate trend in the 30-minute constant-speed fatigue test (average of all runners).
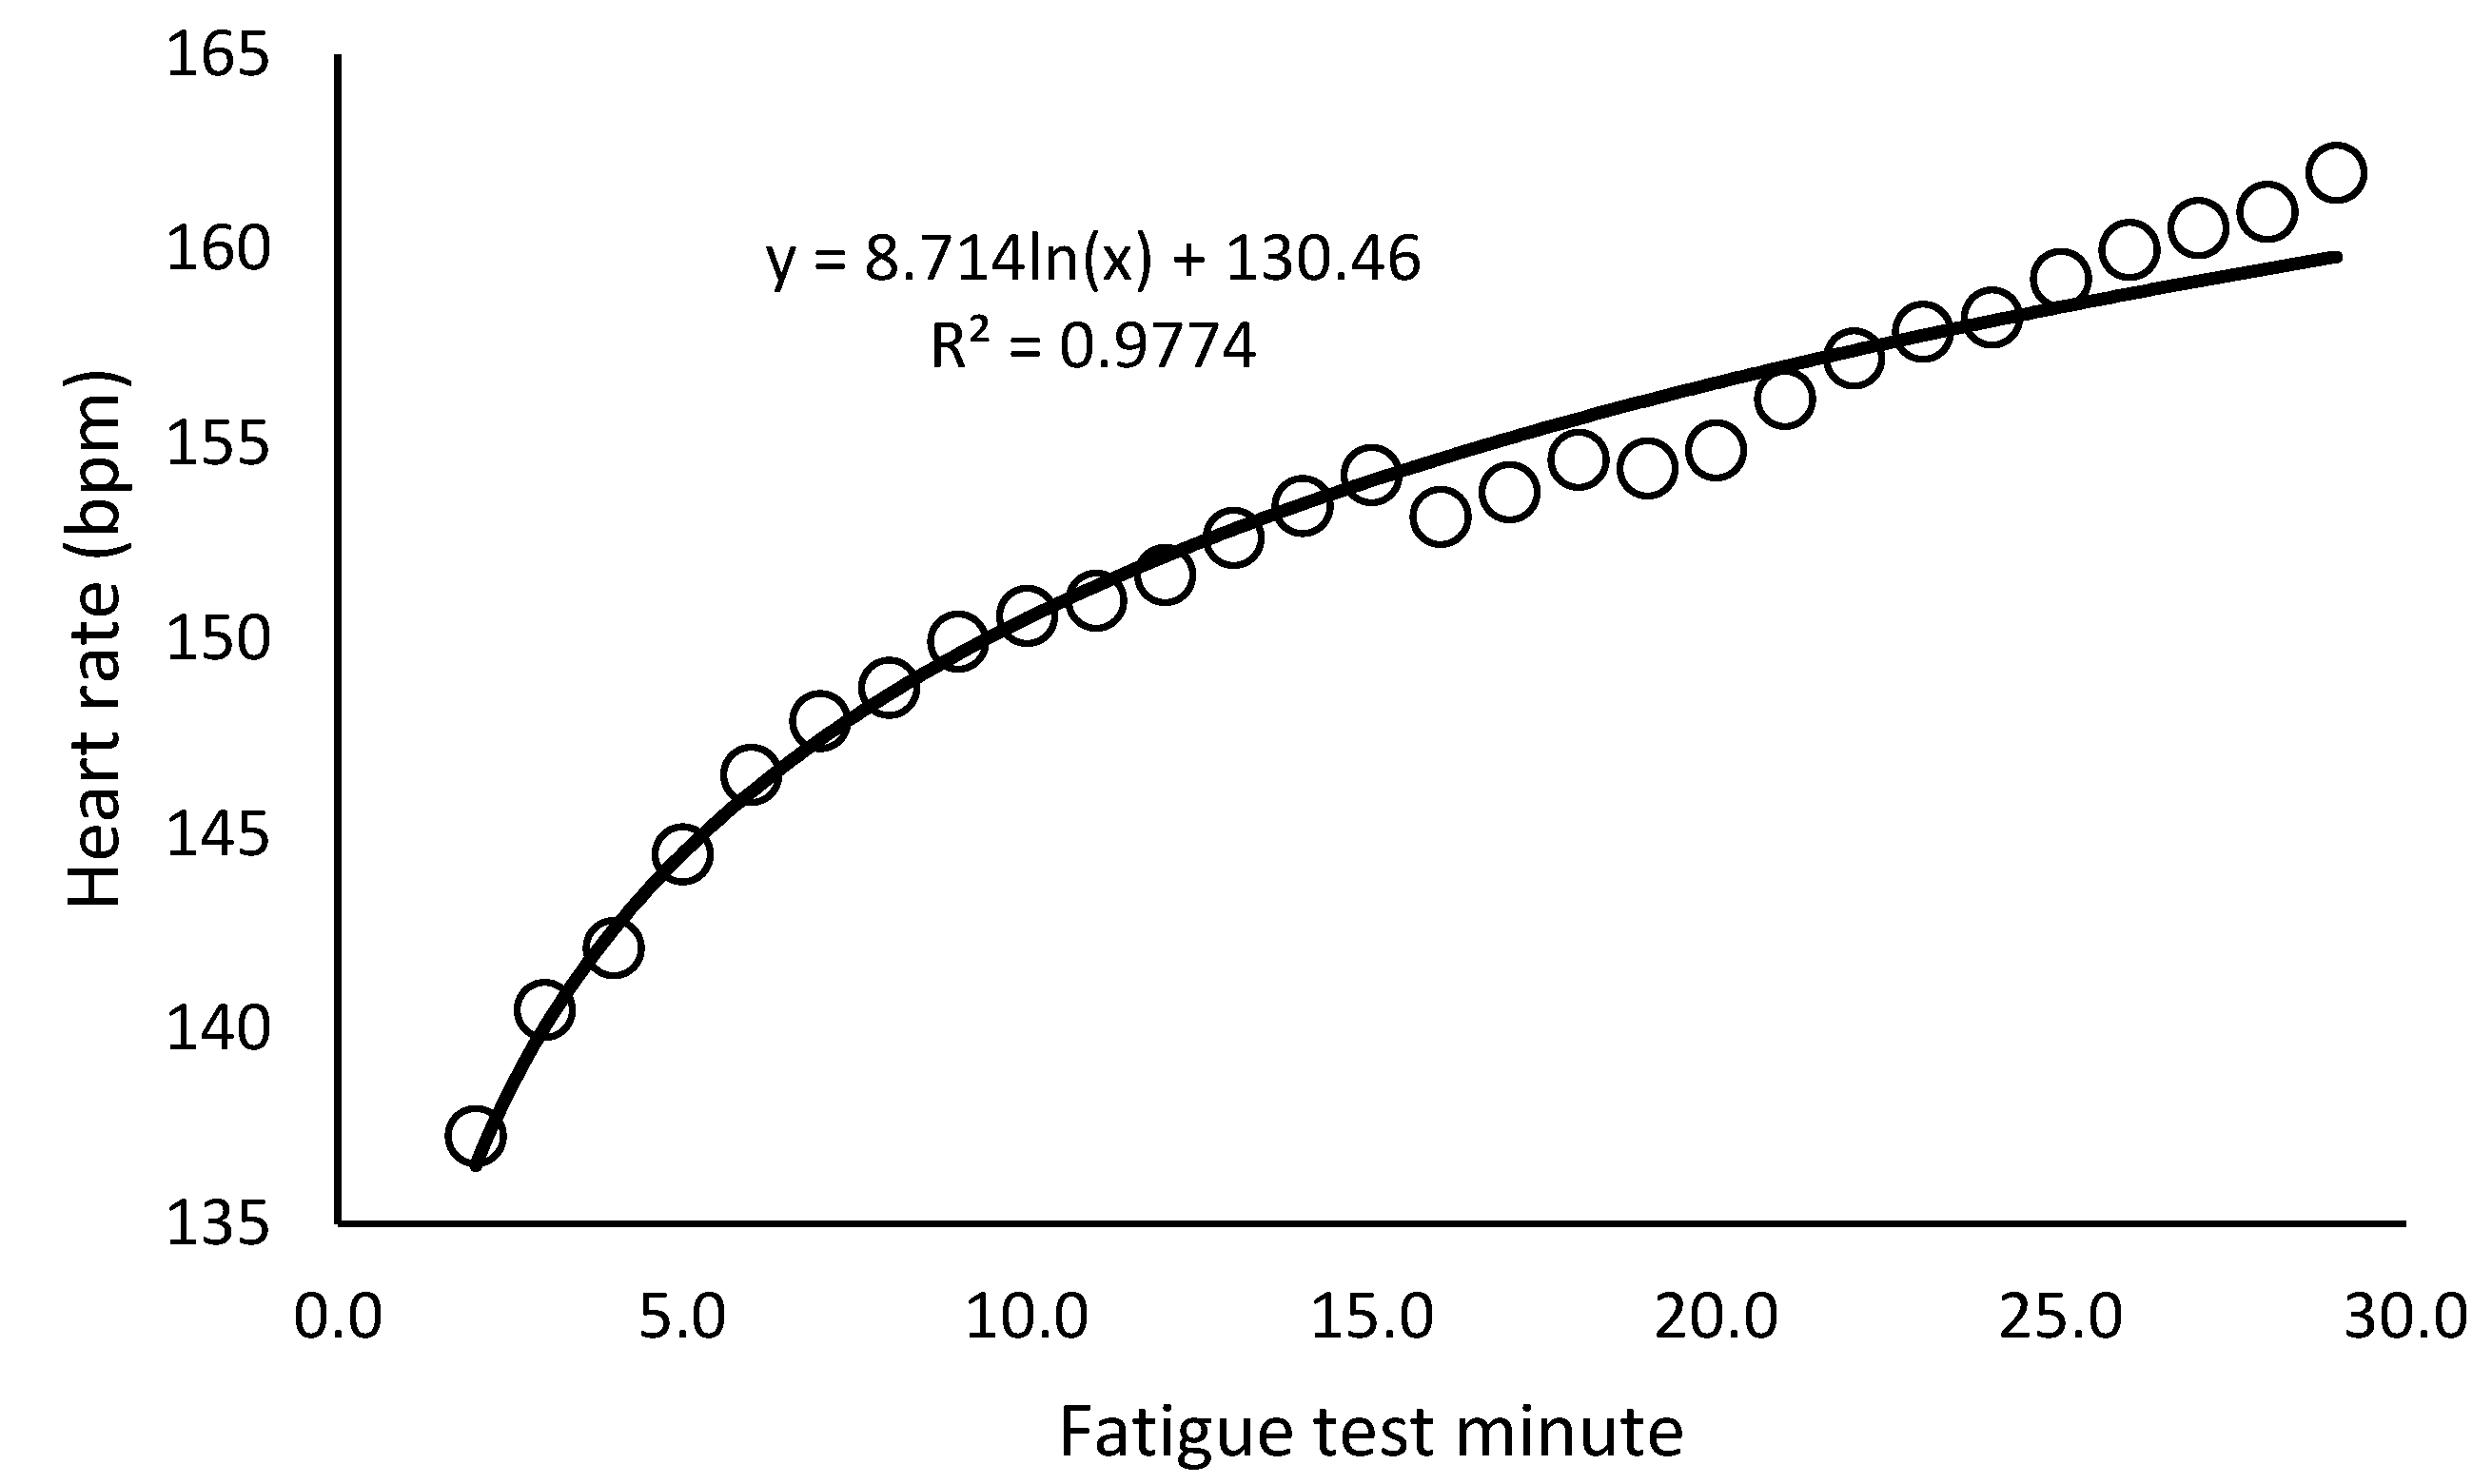
Figure 3.
Linear regression line and equation of the relationship between the Step time measured with photogrammetry and the Time between consecutive tibias spikes.
Figure 3.
Linear regression line and equation of the relationship between the Step time measured with photogrammetry and the Time between consecutive tibias spikes.
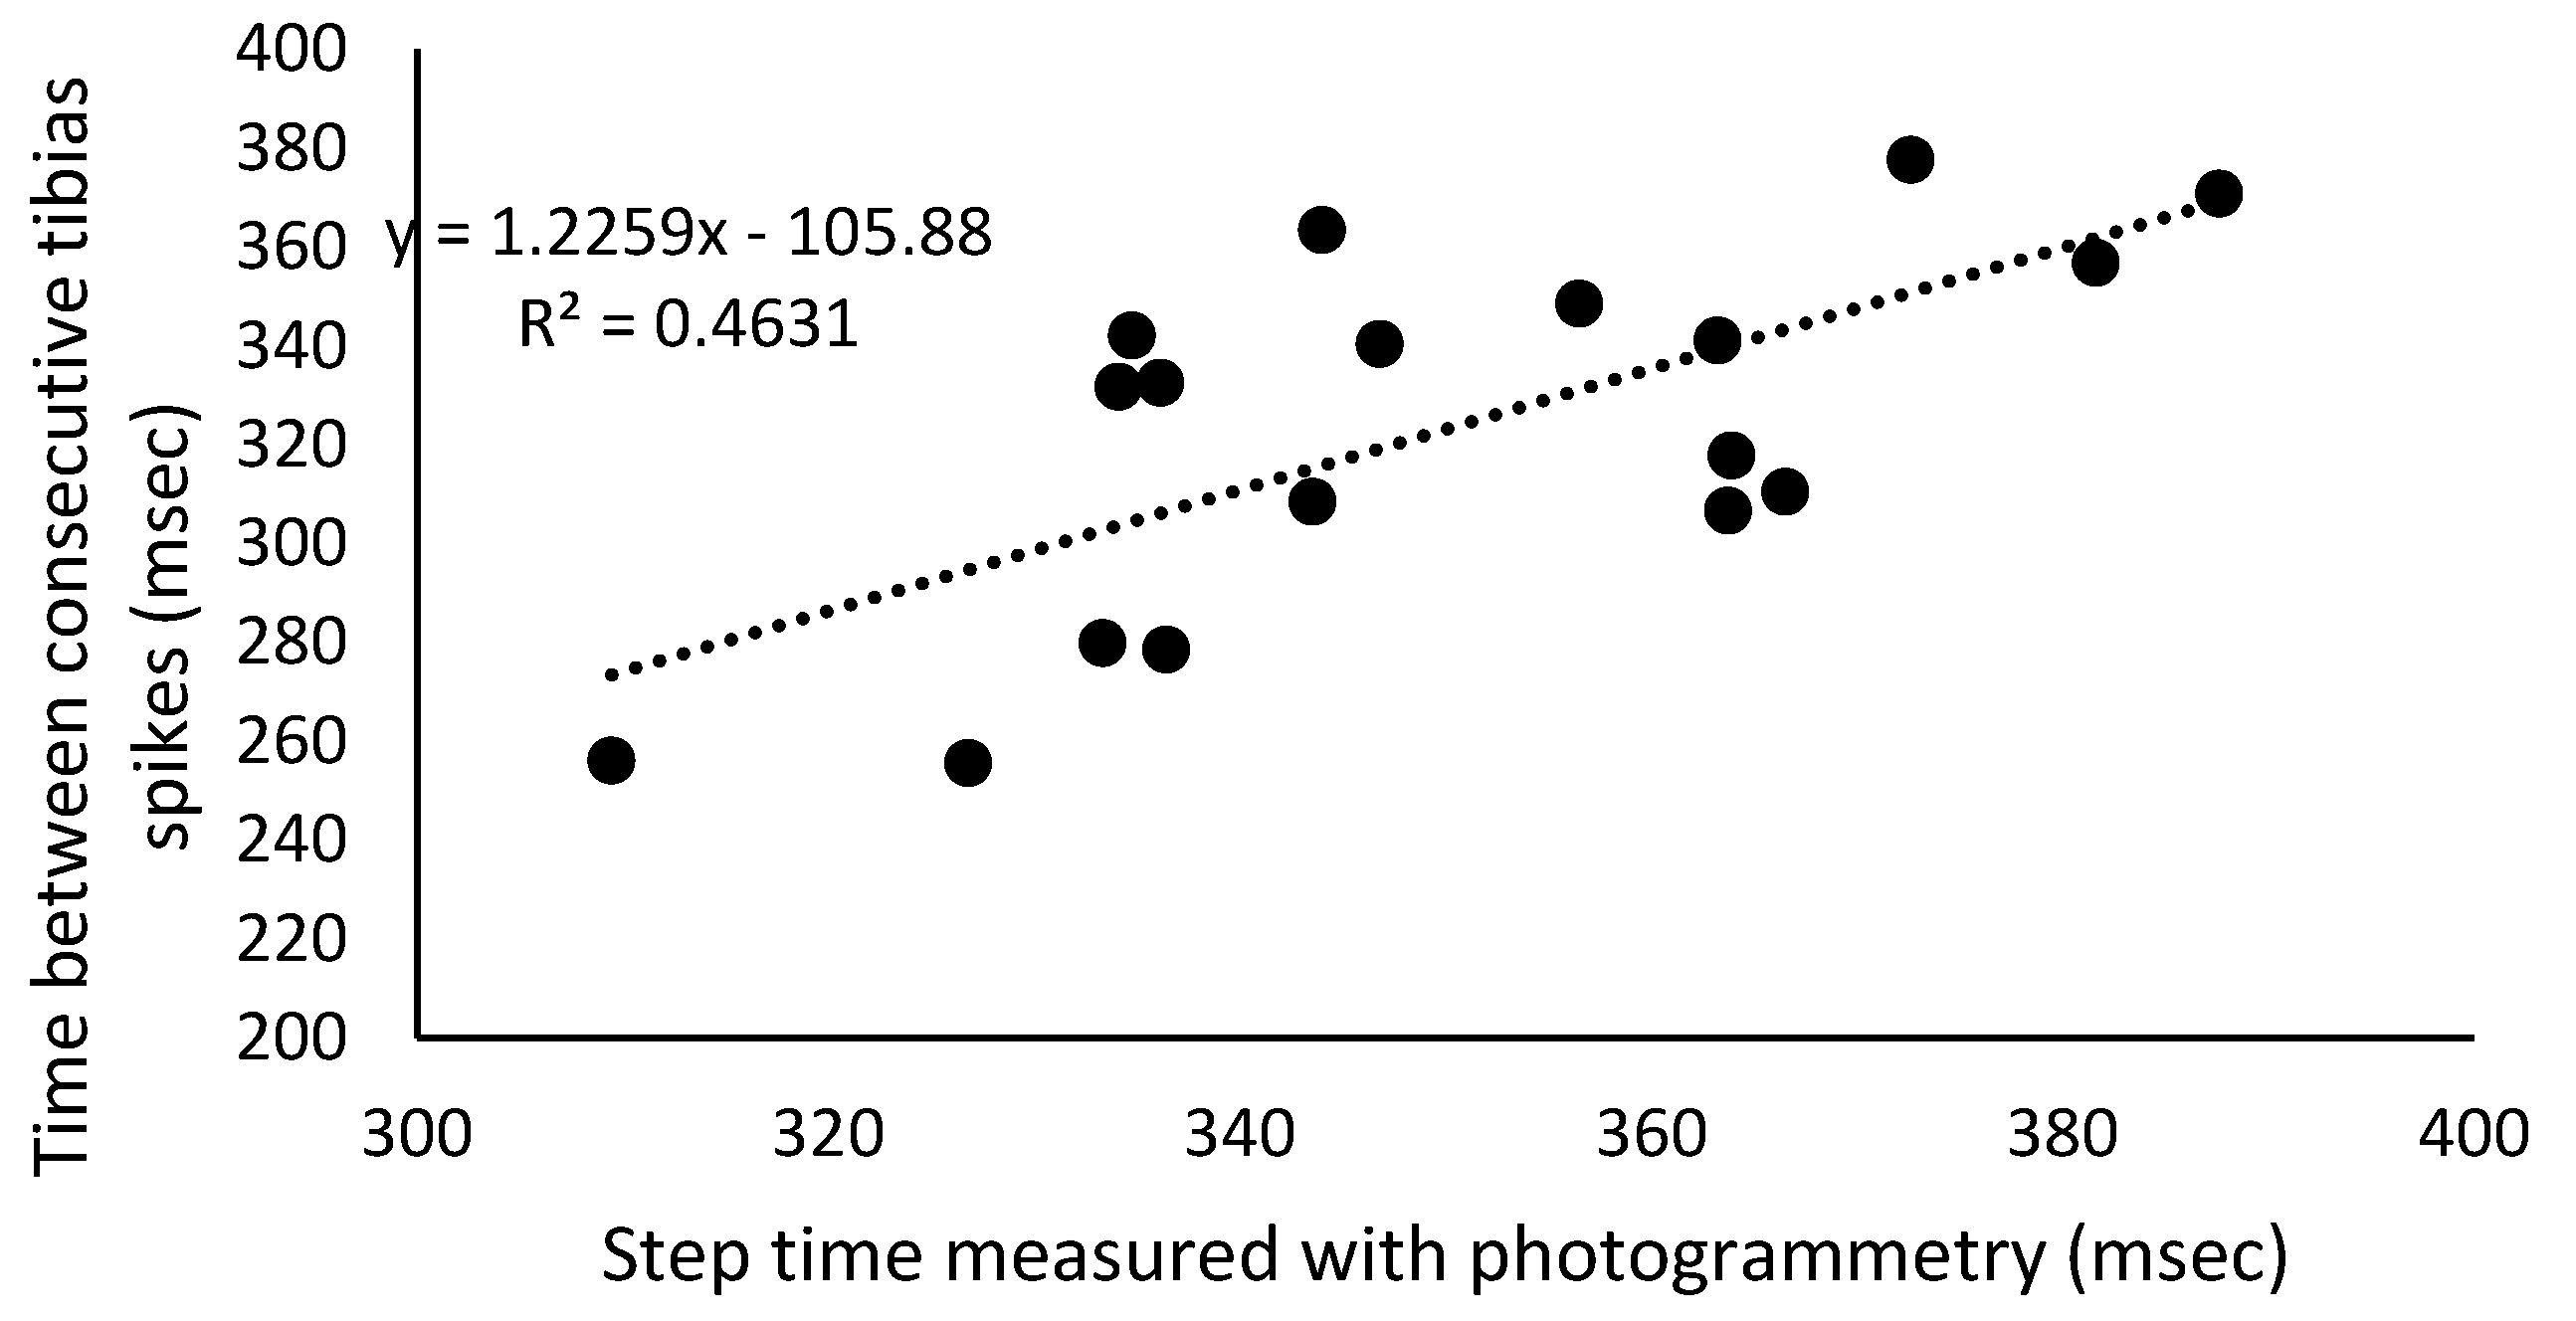
Figure 4.
Acceleration spikes in tibias and sacrum region (m/s2) in the 30-minute fatigue test.
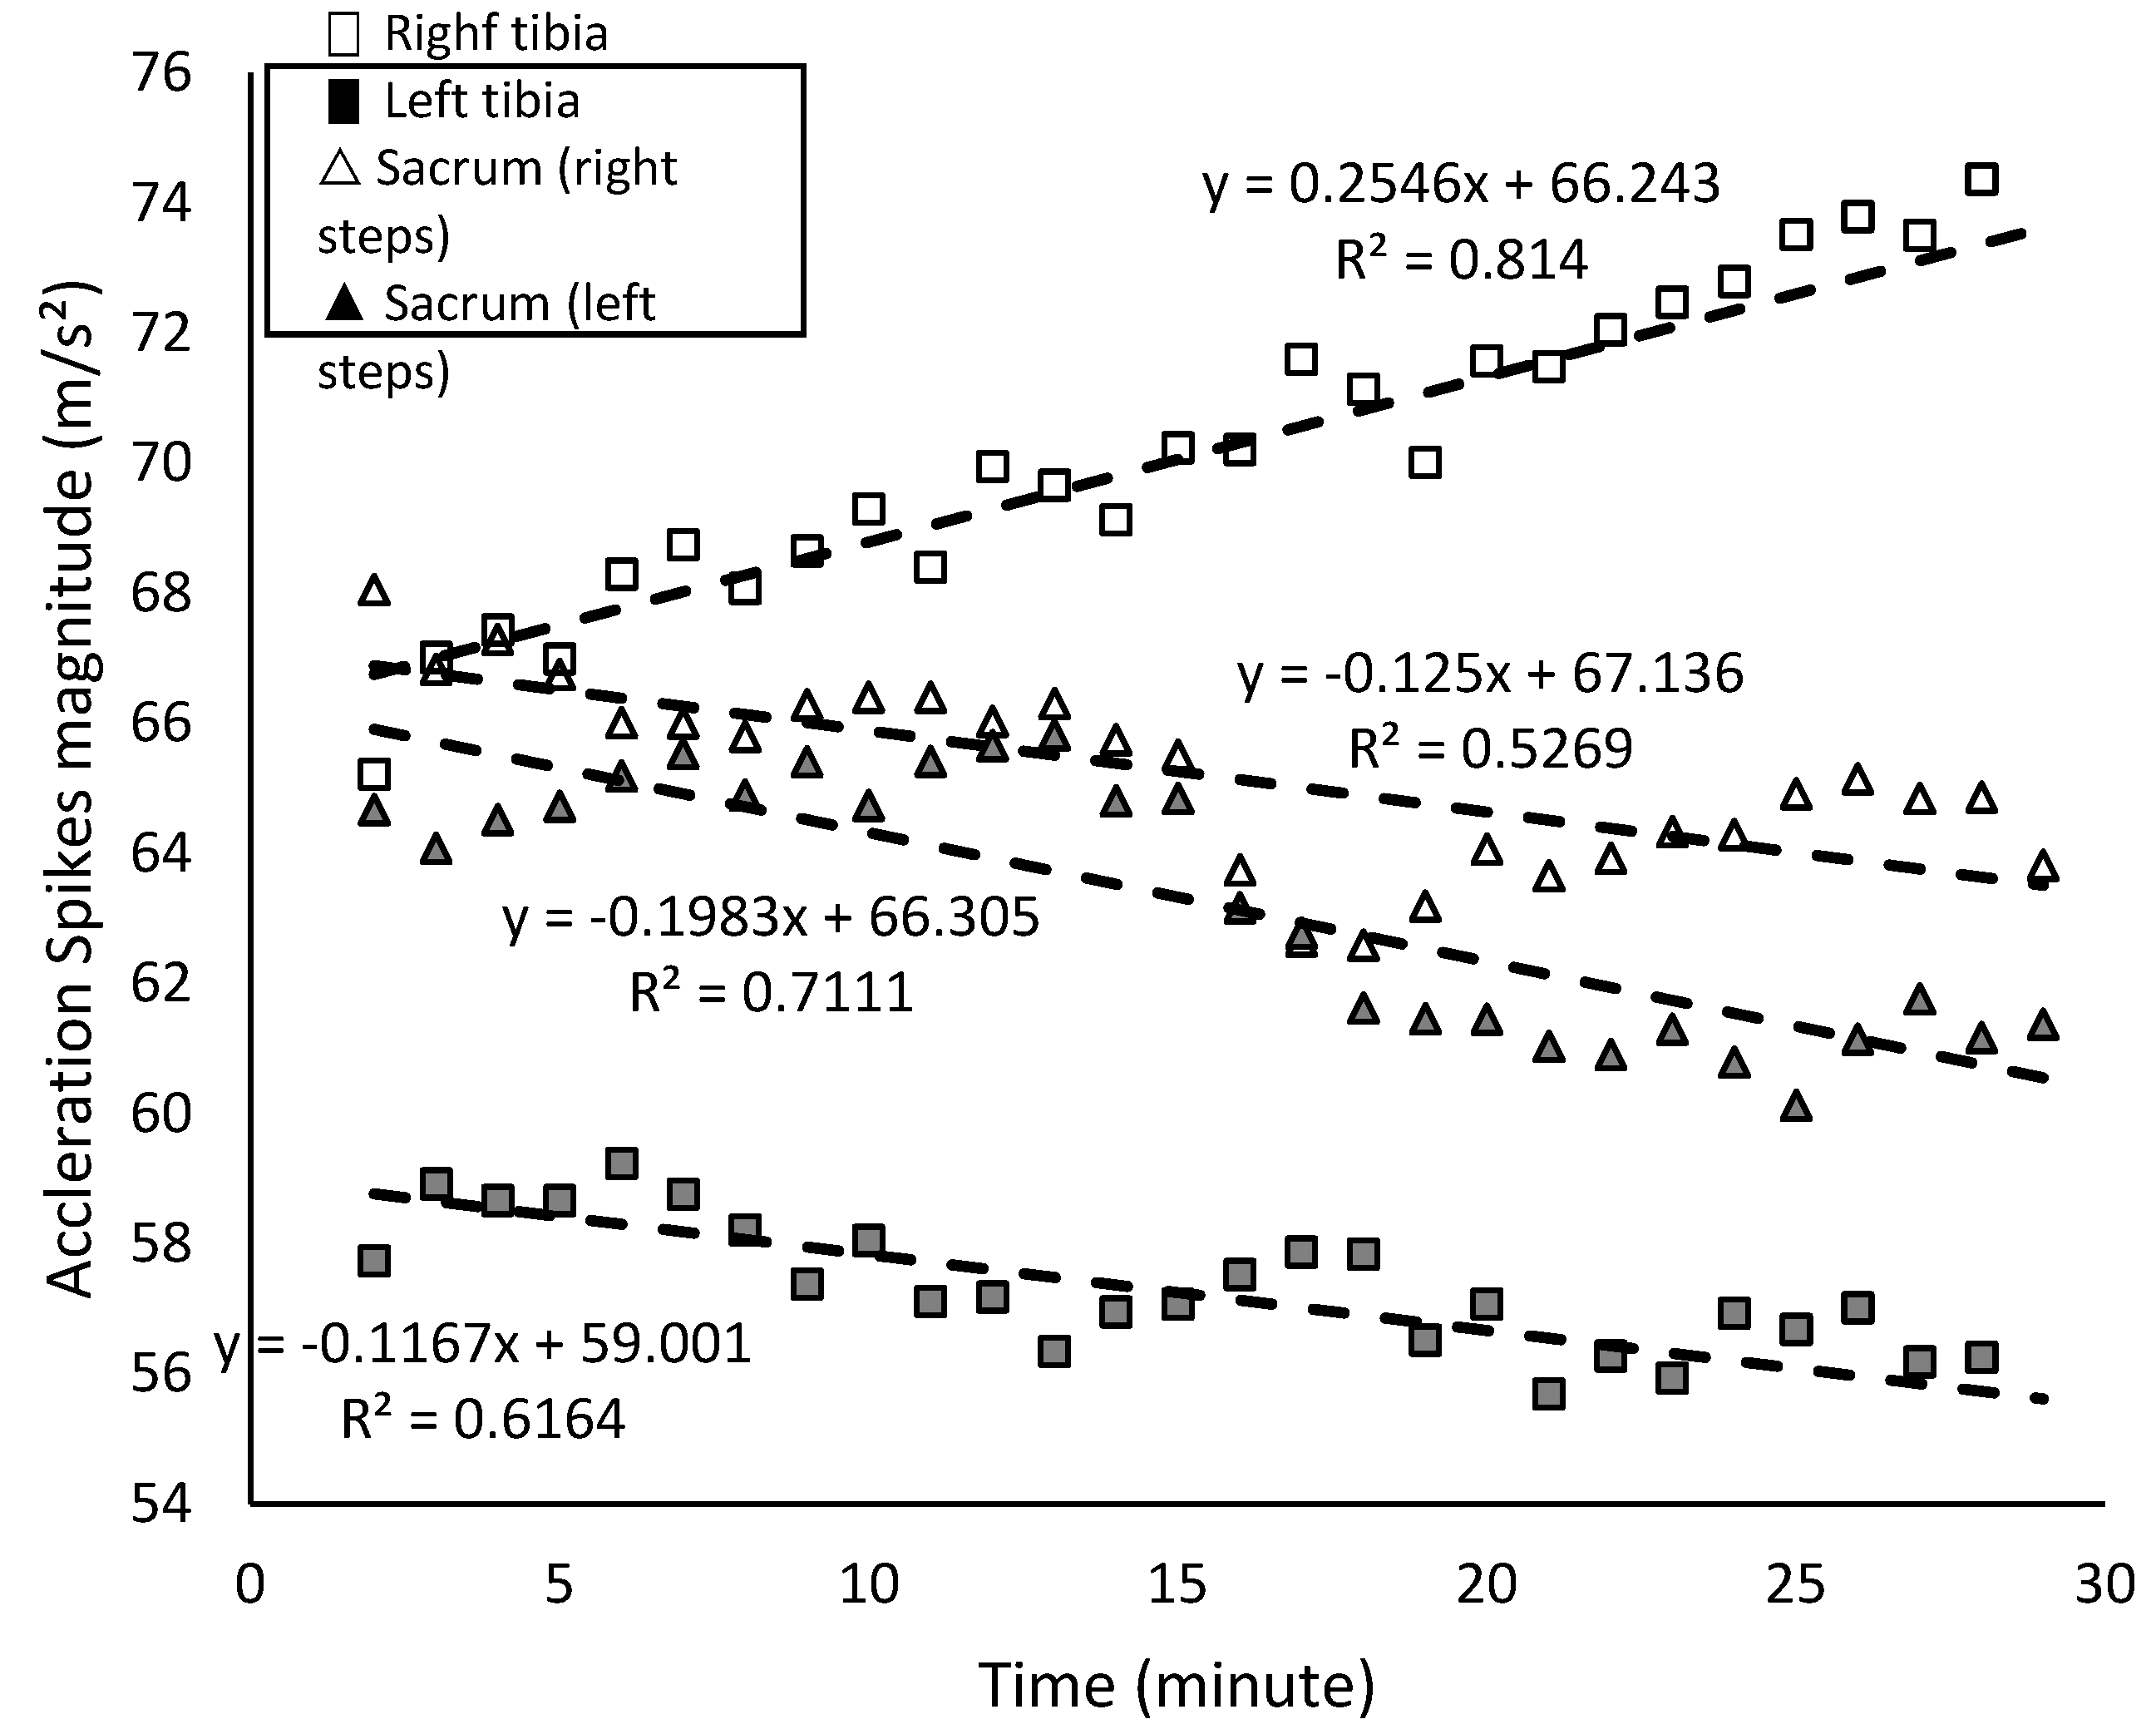
Figure 5.
Acceleration spikes asymmetries in the tibias and sacrum region in the 30-minute fatigue test.
Figure 5.
Acceleration spikes asymmetries in the tibias and sacrum region in the 30-minute fatigue test.
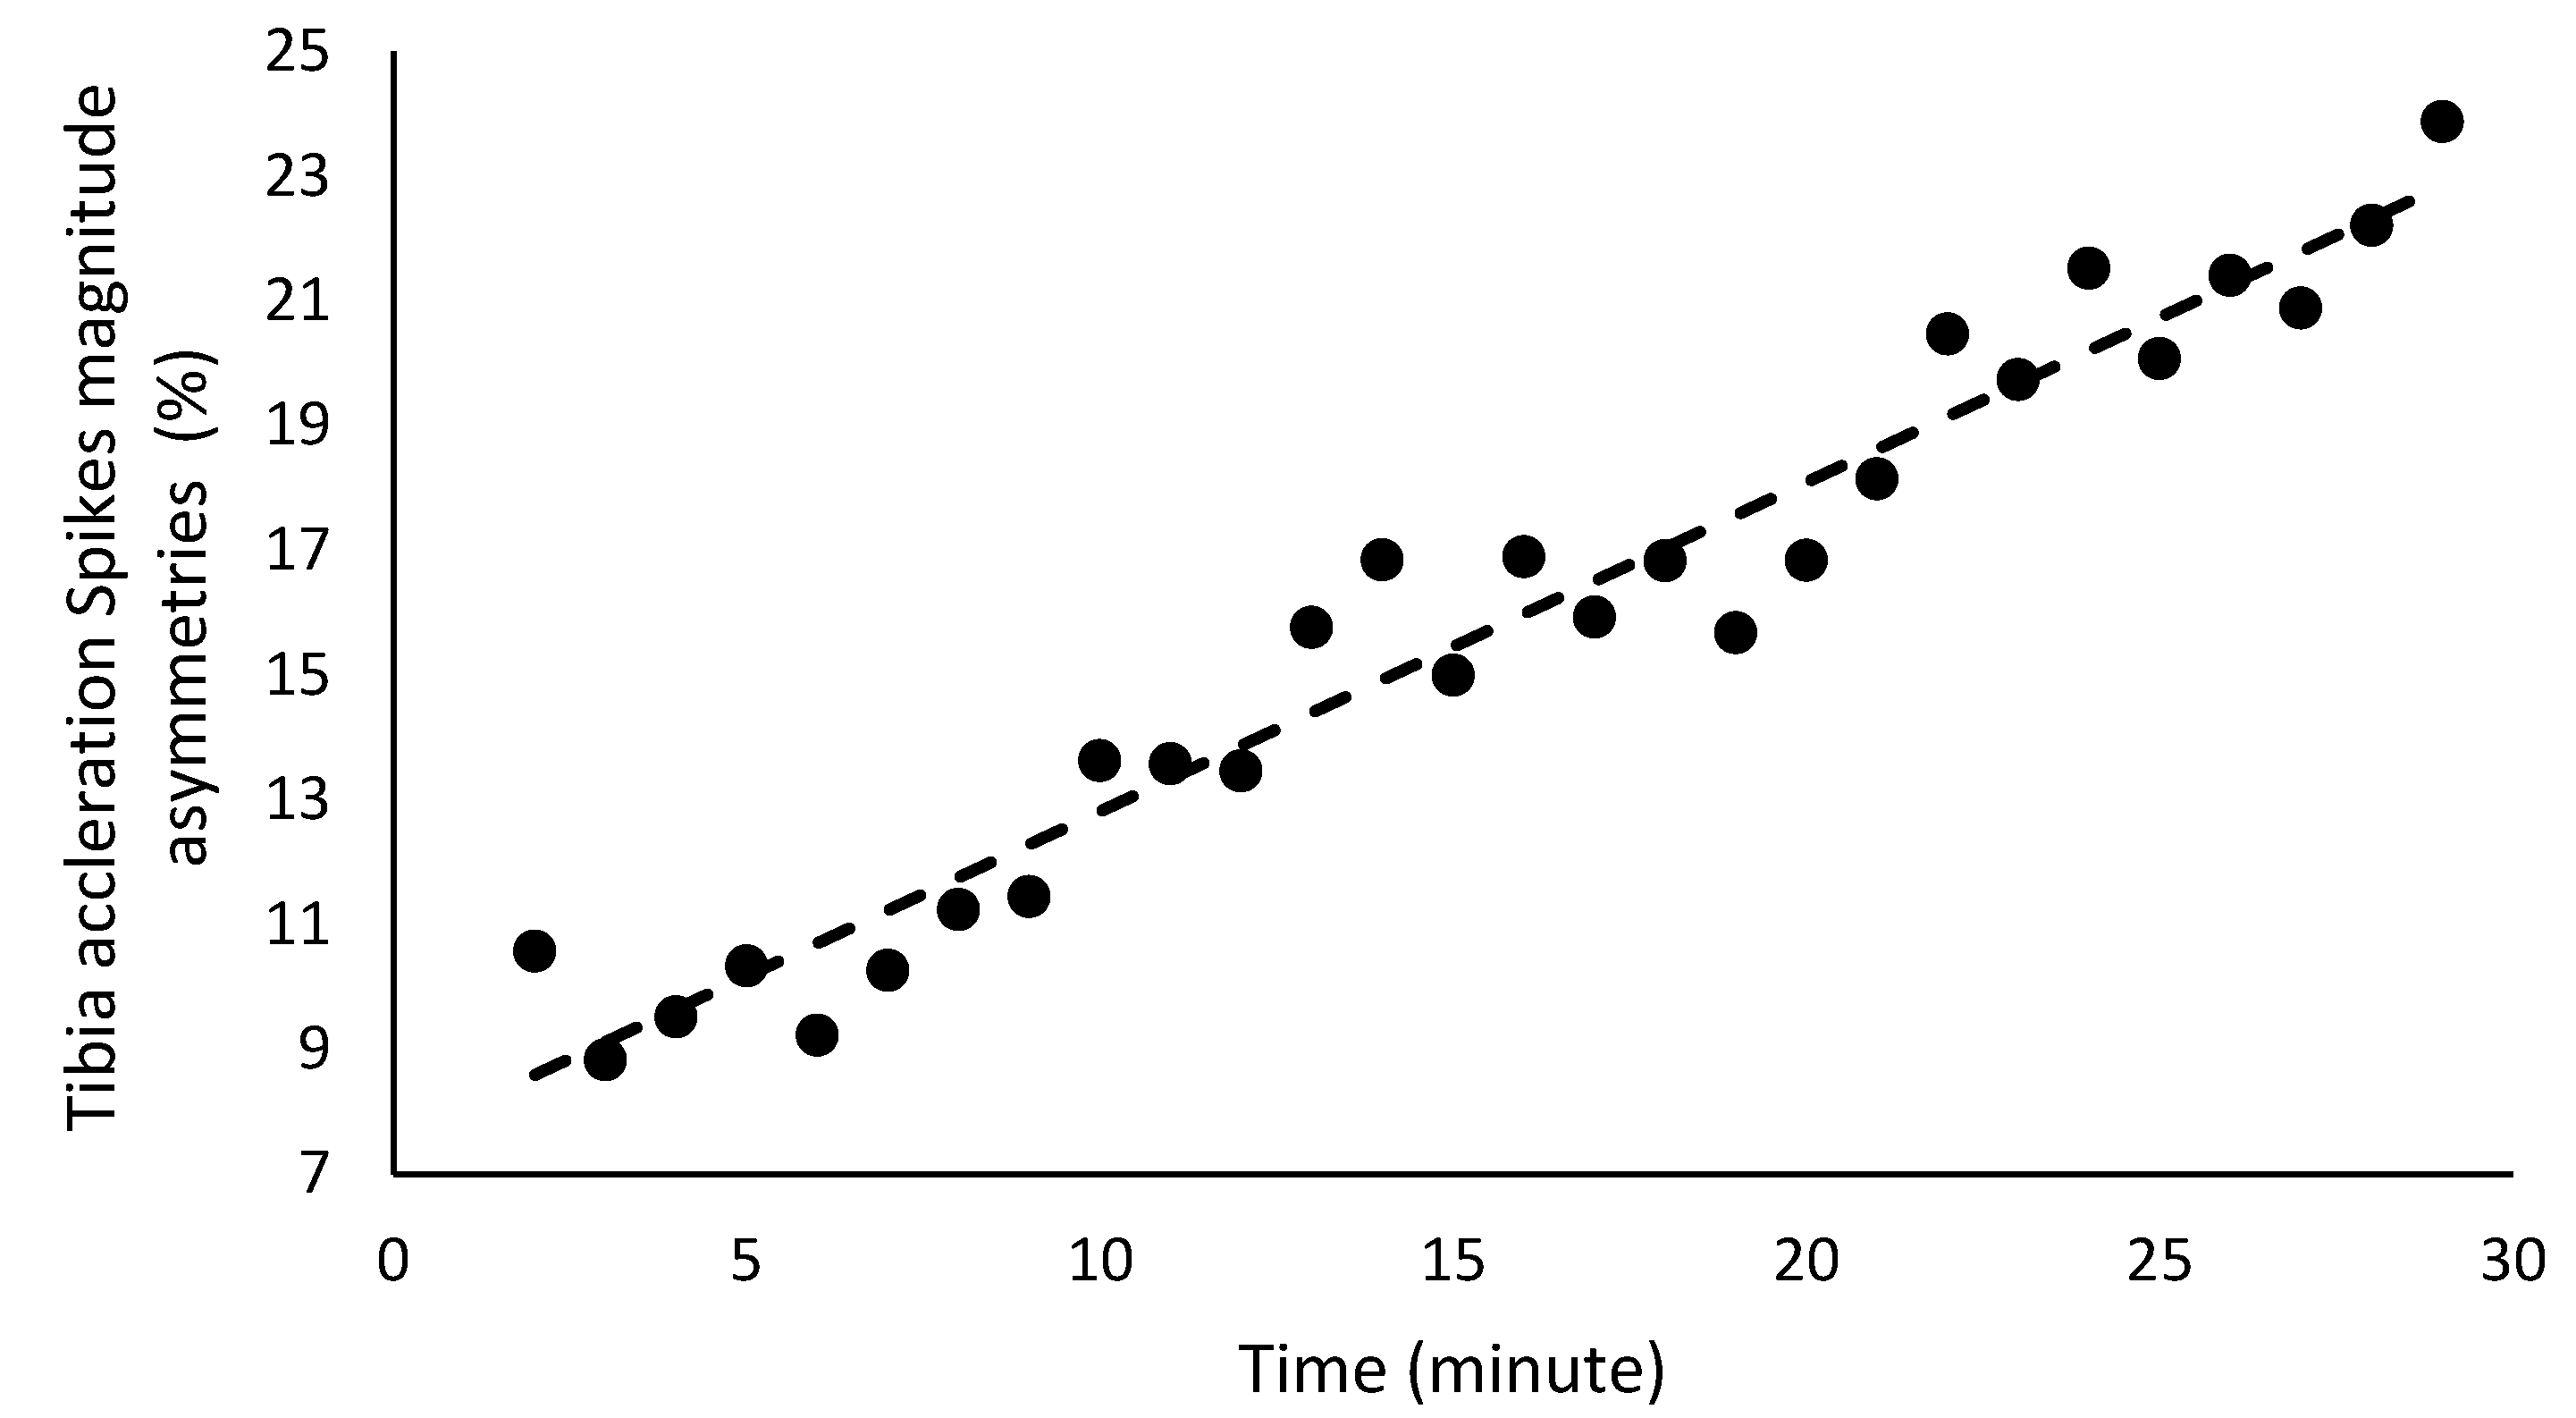
Figure 6.
Kinematic-temporal data from each 5-minute sector of the 30-minute fatigue test: (a) contact and flight times and (b) cadence.
Figure 6.
Kinematic-temporal data from each 5-minute sector of the 30-minute fatigue test: (a) contact and flight times and (b) cadence.
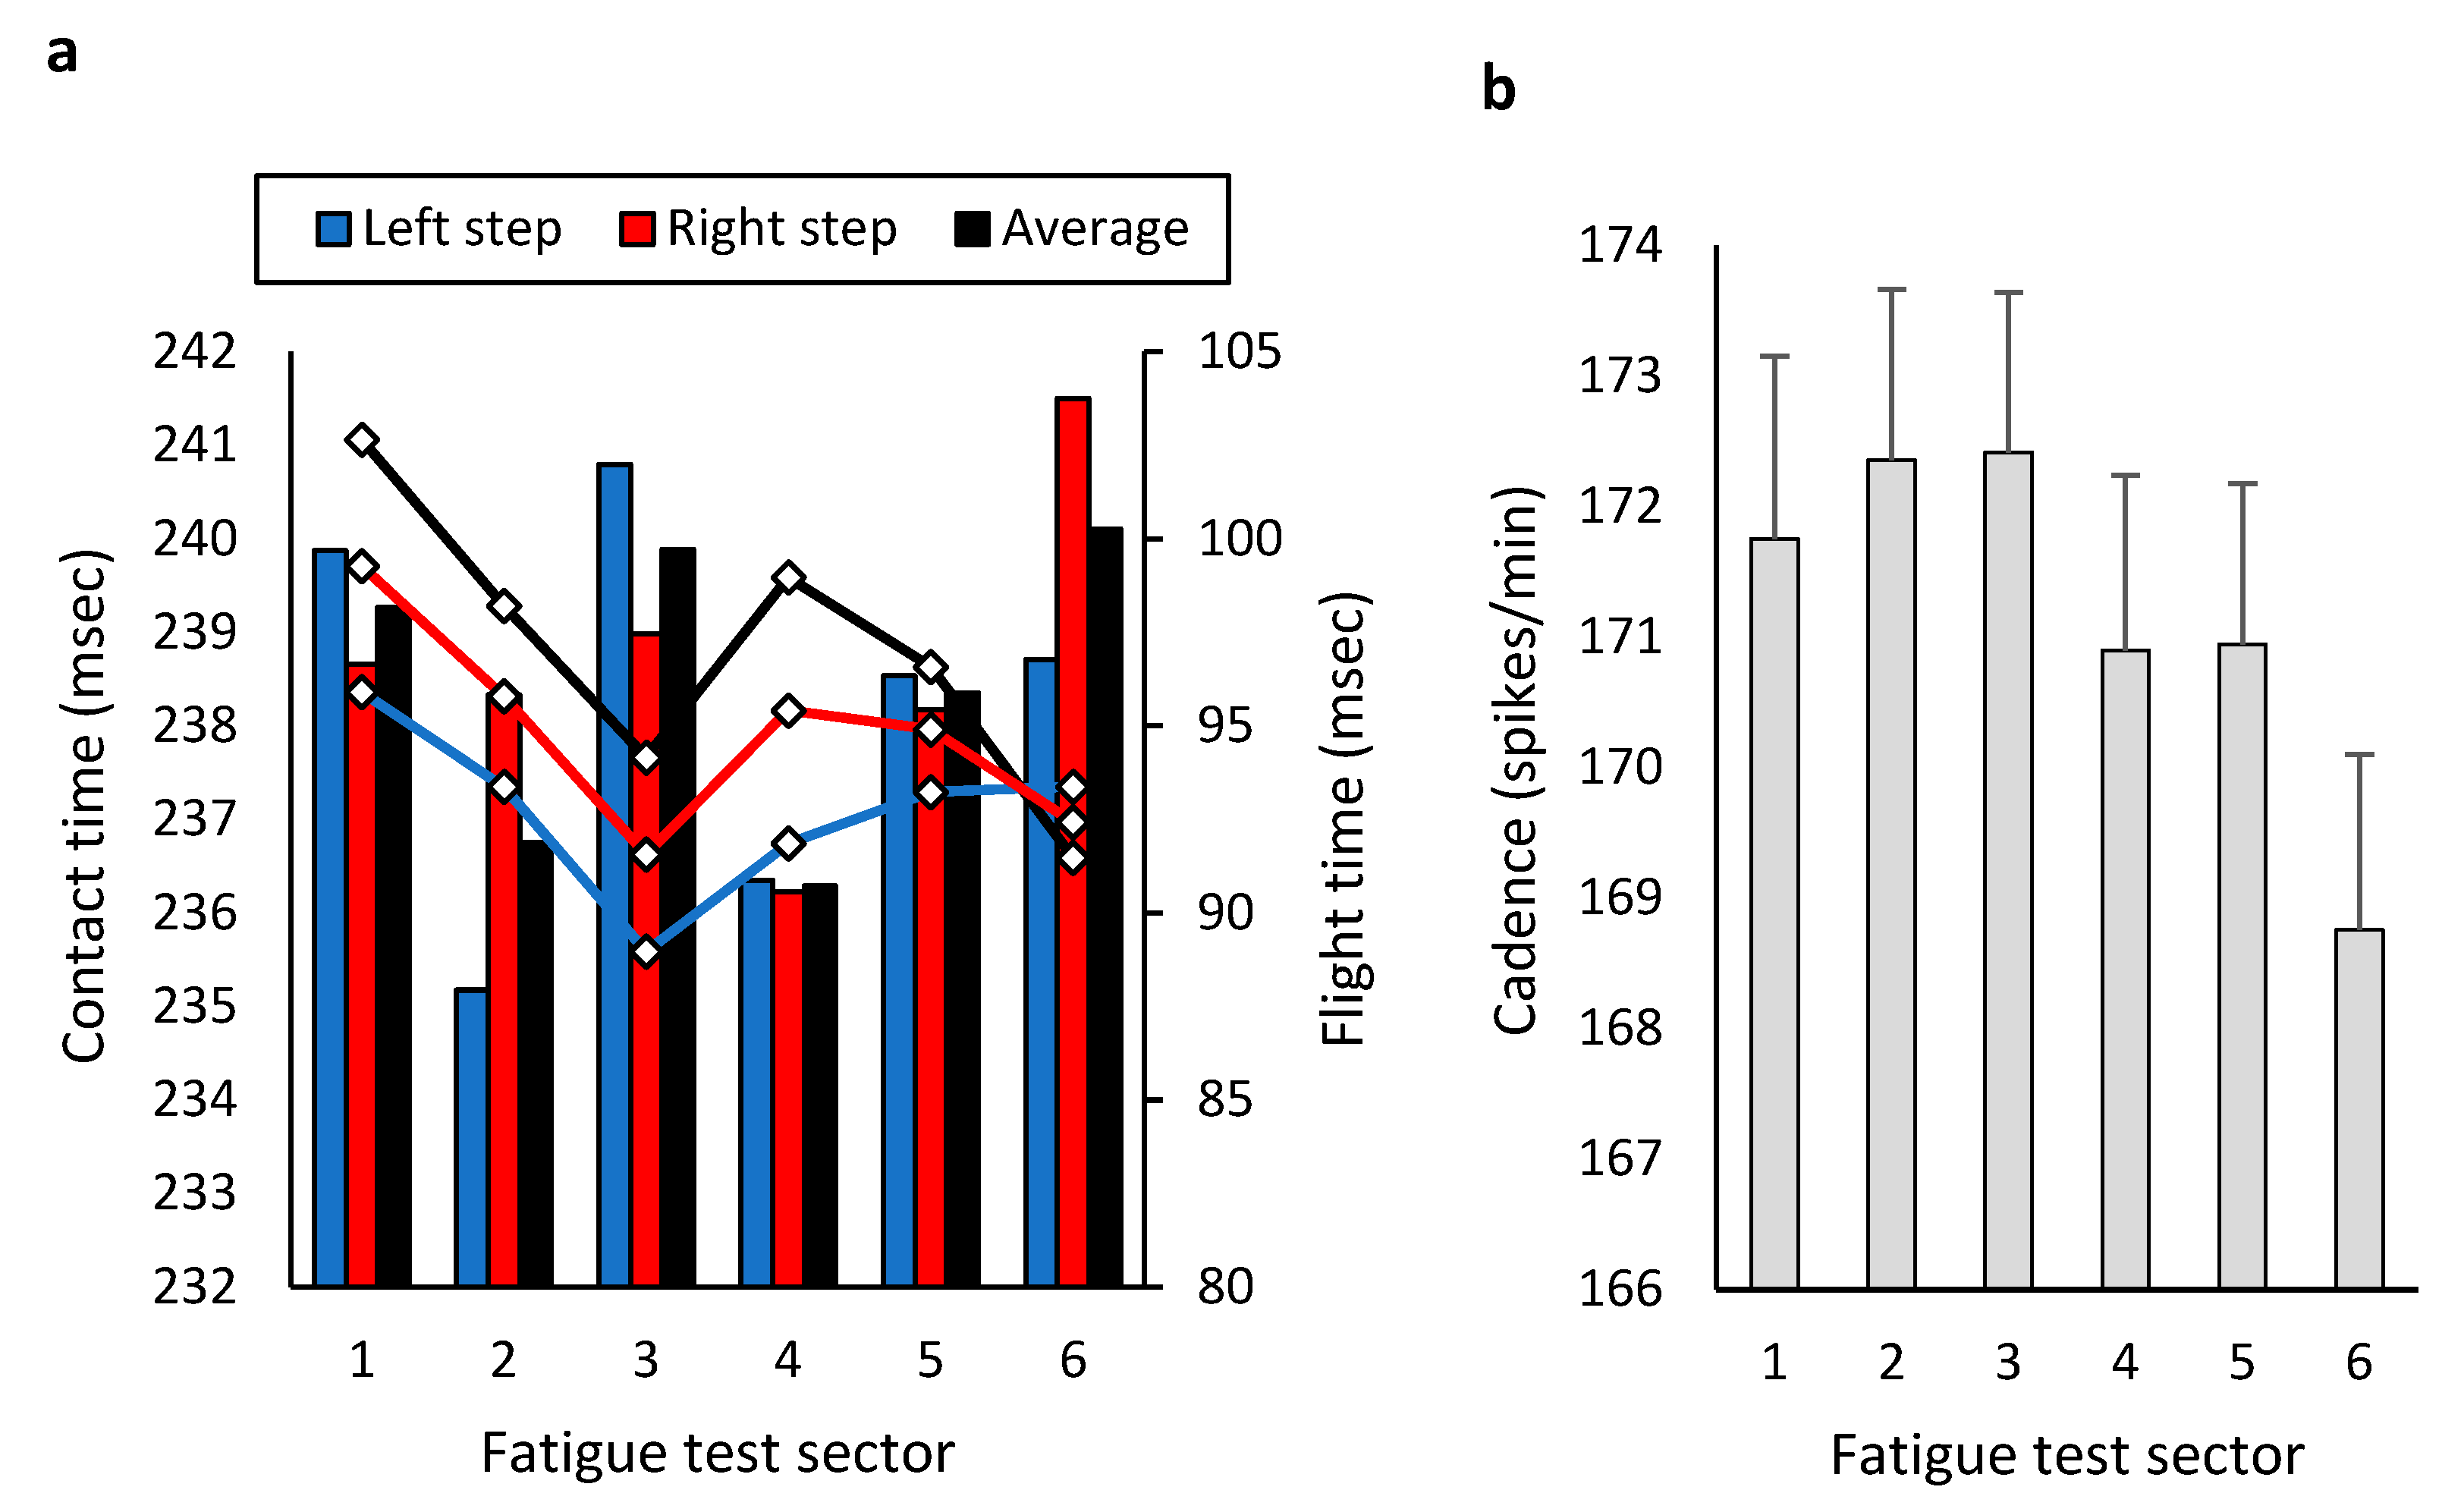

Table 1.
Anthropometric and cardiovascular data of the subjects.
| Parameter | Minimum | Maximum | Mean | Std |
|---|---|---|---|---|
| Height [cm] | 153 | 190 | 172.8 | 9.0 |
| Weight [kg] | 47.3 | 88.6 | 68.9 | 11.2 |
| BMI [kg/m2] | 20.2 | 27.6 | 22.9 | 2.1 |
| FM [%] | 8.3 | 22.8 | 14.7 | 4.1 |
| FFM [kg] | 36.6 | 72.8 | 55.9 | 9.5 |
| Body water [%] | 55.6 | 67.2 | 62.0 | 3.4 |
| Resting heart rate [lpm] | 53 | 84 | 63.2 | 8.5 |
| Systolic blood pressure [mmHg] | 91 | 170 | 119.9 | 16.4 |
| Diastolic blood pressure [mmHg] | 61 | 92 | 71.7 | 8.8 |
| BMI: Body mass index; FM: Fat mass; FFM: Free Fat Mass | ||||
Table 2.
Regression lines equations for the variables used to measure acceleration spike asymmetries (independent variable: minute during the 30-minute fatigue test).
Table 2.
Regression lines equations for the variables used to measure acceleration spike asymmetries (independent variable: minute during the 30-minute fatigue test).
| Asymmetries (%) | Mean ± SD | Pearson r | Slope | Intercept | t | p Value |
|---|---|---|---|---|---|---|
| Tibia acceleration spikes (%) | 16 ± 5 | 0.98 | 0.55 | 7.7 | 25.59 | <0.001 |
| Sacrum acceleration spikes (%) | 4 ± 2 | 0.34 | 0.07 | 2.9 | 1.88 | 0.0714 |
| Attenuation (%) | -15 ± 281 | -0.02 | -0.81 | -2.1 | -0.1 | 0.7291 |
| SD: Standard Deviation | ||||||
Disclaimer/Publisher’s Note: The statements, opinions and data contained in all publications are solely those of the individual author(s) and contributor(s) and not of MDPI and/or the editor(s). MDPI and/or the editor(s) disclaim responsibility for any injury to people or property resulting from any ideas, methods, instructions or products referred to in the content. |
© 2025 by the authors. Licensee MDPI, Basel, Switzerland. This article is an open access article distributed under the terms and conditions of the Creative Commons Attribution (CC BY) license (https://creativecommons.org/licenses/by/4.0/).
Copyright: This open access article is published under a Creative Commons CC BY 4.0 license, which permit the free download, distribution, and reuse, provided that the author and preprint are cited in any reuse.


