
Submitted:
15 August 2025
Posted:
18 August 2025
You are already at the latest version
Abstract
In Uganda, rain-fed crops frequently encounter cycles of drought stress followed by rewatering. Thus, with escalating fluctuations in water supply, drought recovery has become a critical focus for future sorghum drought phenotyping, genetics, and breeding research. However, there is currently a low level of inquiry into the drought recovery potential of prospective genotypes in Uganda’s National Sorghum Improvement Program. The present study aimed to assess the response of selected genotypes to rewatering after drought. Sixteen sorghum genotypes and two check lines were evaluated under two contrasting moisture regimes: well-watered and drought stress-rewatering in a split-plot layout embedded within a randomized complete block design (RCBD). Watering regimes were assigned to whole plots, while sorghum genotypes were assigned to subplots, with three replications. Results showed highly significant effects (P<0.05) of drought stress on key agronomic traits, decreasing dry weight, grain weight, and biomass yield by 39%, 43% and 37%, respectively, while delaying flowering by an average of 11 days. Key genotype-specific traits associated with drought recovery included rapid rehydration, compensatory growth, and maintenance of high chlorophyll content, all of which were essential for optimizing yields after stress. Leveraging stress tolerance indices, genotypes were classified into four distinct groups (A-D) based on their yield performance and stability under the two watering regimes. Genotypes in category A demonstrated high yield stability and strong recovery potential. Conversely, genotypes in category D exhibited the poorest recovery response. Overall, the information generated from this study will support local sorghum breeding efforts for drought tolerance.
Keywords:
Drought
; recovery
; indices
; sorghum
; watering
; regime
; stress
1. Introduction
Climate models predict increasingly frequent and severe rainfall fluctuations, prompting growing interest in exploring crop recovery potential as a strategy to maintain stable agricultural productivity amid changing climatic conditions [1,2,3]. These unpredictable patterns of alternating drought and rainfall events create significant risks for crop productivity, especially in areas vulnerable to water scarcity [4]. In Uganda, where rain-fed agriculture predominates [5], this vulnerability is especially acute. Staple crops such as sorghum (Sorghum bicolor), essential for both food and income security, face considerable challenges [6,7].
Sorghum’s inherent drought tolerance has made it a resilient crop in arid and semi-arid regions of Uganda [8,9]. However, its long-term productivity under fluctuating water conditions depends not only on its drought resistance but also on its ability to recover once water becomes available. While extensive research has focused on drought tolerance, avoidance, and escape mechanisms [10,11,12], the physiological and growth responses of sorghum to rehydration and their implications for productivity remain comparatively understudied [13,14]. Recovery from drought involves processes such as water uptake, leaf re-expansion, photosynthetic restoration, and biomass accumulation, all of which play a crucial role in maintaining yield stability [14,15]
In Uganda, the National Sorghum Improvement Program has largely prioritized resistance mechanisms (namely, tolerance, avoidance, and escape), assessing genotype performance under random drought scenarios typical of Target Production Environments (TPEs), such as the Karamoja region. Although this approach has yielded valuable insights into drought resistance, limited attention has been given to how sorghum genotypes recover once water availability is restored [14]. Yet, understanding recovery-related traits is essential for developing more resilient sorghum varieties, particularly in the context of climate change. Evaluating genotypic variation in drought recovery responses presents a promising opportunity to enhance breeding programs. By identifying genotypes with superior recovery potential, researchers can equip breeders with reliable indicators for selecting drought-resilient crops. Traits related to post-drought growth, physiological resilience, and yield recovery can serve as critical selection criteria for developing varieties suited to variable water conditions [16].
This study aimed to evaluate the recovery responses of selected sorghum genotypes following drought stress, focusing on growth, physiological traits, and yield parameters after rehydration. We hypothesized that significant variation would exist among genotypes in these traits, providing valuable insights into genetic adaptation mechanisms. The findings will contribute to the development of sorghum varieties with enhanced drought resilience, supporting food security in vulnerable regions.
2. Materials and Methods
2.1. Description of the Study Area
The study was conducted at the National Semi-Arid Resources Research Institute (NaSARRI)-Serere. Serere is located at 1o39’N and 33o27’E and has an elevation of 1038m above sea level. The native soils are sandy, with low water holding capacity and limited organic matter content, typical of a semi-arid environment. The area experiences a bimodal type of rainfall, with an annual mean of 1427 mm and wide inter-annual fluctuations. The mean annual temperature is 24°C, with a minimum of 17.9°C and a maximum of 34.4°C. The relative humidity ranges between 72% and 84% [17].
2.2. Planting Materials
This study evaluated a diverse set of sorghum genotypes selected from the breeding program based on their prior performance under random drought conditions. A total of 16 genotypes and 2 checks were used to assess their drought recovery potential. The checks were chosen based on farmer preference and documented performance. NAROSORGH 4, known for its strong drought resistance traits [18], served as the positive check, while ETEREMA, a more susceptible local landrace, was the negative check. The selected genotypes represented a spectrum of resistance levels, ranging from highly resistant to moderately resistant and susceptible (Table 1).
2.3. Experimental Setup and Management
The experiment was conducted in a screen house at NaSARRI, following a split-plot arrangement within a completely randomized block design (RCBD). The two main treatments (whole plots) were well-watered and drought stress-rewatering treatments. Each whole plot was subdivided into 18 subplots (sorghum genotypes), with each genotype replicated three times.
The soil used in the pots was sourced from the experimental station’s fields and enriched with fully decomposed organic manure. Sowing was carried out on April 13, 2024, by placing three pairs of seeds equidistantly in 5-litre pots. Two weeks later, at the 3-leaf stage, thinning was performed to retain the three most vigorous seedlings in each pot, which were maintained up to physiological maturity.
Manual weeding was performed, and irrigation was managed according to the specified watering regimes. For the well-watered regime, pots were irrigated every two days (at a rate of 1 litre per pot) until the plants reached physiological maturity. Under the drought stress-rewatering regime, plants received regular irrigation until May 23, 2024; 36 days after emergence (at the panicle development stage), after which irrigation was withheld for 10 consecutive days to impose drought stress. This duration was chosen to induce substantial drought stress in the pots without causing plant death. After this drought period, plants were fully irrigated again until they grew and reached physiological maturity (Figure 1).
2.4. Data Collection
Data were collected at four-day intervals during both the drought stress period and the recovery phase, which extended up to 15 days after rewatering. Key parameters measured included: leaf length, leaf width and internode length assessed using a 30cm ruler on all three plants within each pot. Plant height was measured using a 2.5 m wooden ruler, while leaf angle was determined as the angle between the stem and the second fully expanded leaf using a geometry protractor. Meanwhile, chlorophyll content and stem diameter were measured using a SPAD chlorophyll meter and a Digital Vernier Caliper 0-150mm, respectively. Leaf rolling (1–5), wax density (1–3), and drought recovery (1–5) were assessed, with lower scores indicating more favourable traits. The drought recovery scores were assigned at two time points: 12 hours and 15 days after rewatering. This study further employed the Drought Recovery Index (DRI) [19,20] to assess agro-physiological traits, including plant height, stem diameter, internode length, and chlorophyll content. The DRI was computed using the formula DRI = log (A) + 2 log (B) [20], where A denotes the relative trait value measured at the end of the drought period, and B represents the relative trait value measured two weeks after rewatering. The relative trait values were computed as follows:
where i represents either measurement point A or B. At physiological maturity, panicle length, panicle width and panicle exertion were also measured using a 30cm ruler. Yield traits, including grain yield harvested from the pot, grain weight after threshing and 100-seed weight, were measured after drying using a kitchen weighing scale SF-400. To obtain the above-ground biomass yield, all three plants were cut at the soil level after harvesting the panicles, dried at 700C in an oven for 3 days, and then weighed using the same weighing scale. The harvest index was calculated as the ratio of grain yield to total aboveground biomass, expressed as a percentage (%).
2.5. Statistical Analyses
Statistical analyses were performed following the procedure described by [21]. The collected data were entered into Microsoft Excel spreadsheets, summarised, and saved as comma-delimited (CSV) files, then imported into R software (version 4.3.1) [22] for all the statistical analyses. Homogeneity of variances and normality of the residuals were tested using the Shapiro–Wilk test. The collected data were then analysed through a general analysis of variance (ANOVA) using a generalized linear model, implemented with the lmerTest package [23], to assess statistical differences among genotypes and their interactions with the watering regime. Principal component analysis (PCA) based on the correlation matrix was performed using the prcomp () function from R’s base stats package. The eigenvectors derived from the PCA were used to identify the variables that had a strong relationship with a specific principal component. The PC biplot was then generated using the ggbiplot package in R [24] to describe and group sorghum genotypes based on their response to drought and rewatering. Yield improvement and stability are the ultimate goals of any breeding program. Tolerance/Resistance indices were calculated following the methodology outlined by [25] and analysed using the Hmisc package [26] to assess their correlations with each other and with grain yield under both stress-recovery and well-watered conditions. Indices showing strong correlations with grain yield in both conditions were considered key predictors of genotypic drought recovery responses.
3. Results
3.1. Effect of Drought Stress and Rewatering on Biomass Yield and Yield-Related Traits
Drought stress caused notable reduction in key yield traits, with dry weight dropping by 39% and grain weight by 43% relative to well-watered plants. Additionally, biomass yield decreased by 37%, and time to reach 50% flowering was delayed by an average of 11 days (Figure 2).
3.2. Variation in Drought Recovery Responses Among Sorghum Genotypes Based on Plant Height (PLH), Chlorophyll Content (CHL), Stem Diameter (SD) and Internode Length (INTL)
Figure 3 illustrates the variation in sorghum genotypes’ responses during drought stress and recovery phases. Drought stress caused reductions in chlorophyll content and stem diameter during stages 1-4 of treatment (T), and declines in plant height and internode length during stages 1-3 (T). However, following rewatering beyond these stages, these traits exhibited greater variability among genotypes during the recovery phase compared to the stress period.
Summary of curve parameters in Figure 3
- I.
- PLH ------- MAZDA105 Enyankore, ----- NAROSORGH1 x NAROSORGH3 -1-1-1-1/22B
- II.
- CHL------- ICSX152005-SB-5-3-2-1, ------ NAROSORGH1 x NAROSORGH3-1-1-1-1/22B, ------MAZDA105 Enyankore
- III.
- SD ------- NAROSORGH1 x NAROSORGH1-1-1-1-1/22B, ------ASARECA13-1 x NAROSORGH3-1-1-5-1/22B
- IV.
- INTL------- SSGA/RAP/349
The Genotypes NAROSORGH1xNAROSORGH3-1-1-1-1/22B and MAZDA105 Enyankore, from the susceptible and moderately resistant groups, respectively, consistently maintained high chlorophyll content (Figure 3 ii) throughout both the stress and recovery phases, indicating strong potential to sustain photosynthetic activity. A similar trend was observed in plant height (Figure 3i) for these genotypes. In contrast, ICSX152005-SB-5-3-2-1 exhibited a rapid decline in chlorophyll content during the stress phase, with minimal recovery after rewatering. SSGA/RAP/349 exhibited strong performance under both stress and well-watered conditions, particularly in maintaining stem diameter, but demonstrated limited internode length (Figure 3 iv) during the recovery, indicating a unique response in structural growth. Meanwhile, NAROSORGH1xNAROSORGH1-1-1-1-1/22B and ASARECA13-1x NAROSORGH3-1-1-5-1/22B showed rapid increases in stem diameter (Figure 3 iii) upon rewatering. Overall, the genotypes displayed diverse recovery mechanisms, with some genotypes like NAROSORGH1 x NAROSORGH3 -1-1-1-1/22B excelling in tissue rehydration and quickly resuming growth, while others, such as ICSX 152005-SB-5-3-2-1, showed more limited recovery capacity.
3.3. Evaluation of Drought Recovery Indices
The results of the Drought Recovery Index (DRI) for the evaluated genotypes are presented in Table 2. Genotypes with lower DRI values exhibited poor recovery potential across the assessed traits.
Generally, the genotypes displayed strong recovery for chlorophyll content (CHL) and stem diameter (SD), while exhibiting relatively poor recovery for internode length and plant height. Chlorophyll content recovery was most pronounced in the genotypes NAROSORGH1 x FRAMIDA-1-1-5-1/22B (0.13), IESV16 143-1-3-1 (0.11), ICSX 162719-1-4-1-1-1 (0.09), and ASARECA13-1 x FRAMIDA-1-1-3-1/22B (0.09). Conversely, ICSX 152005-SB-5-3-2-1 and ASARECA13-1 x NAROSORGH3-1-1-1-1/22B displayed the poorest recovery, with DRIs of -0.40 and -0.09, respectively. For plant height, genotypes IESV214006DL (-0.11), ICSX152666-B-2-7-3-1-1-1 (-0.17), NAROSORGH1 x FRAMIDA-1-1-5-1/22B (-0.18), and IESV16 143-1-3-1 (-0.20) exhibited relatively good recovery. However, SSGA/RAP/349 (-0.60) and ASARECA13-1 x NAROSORGH3-1-1-1-1/22B (-0.50) demonstrated the weakest recovery. Stem diameter is an indication of the potential to rehydrate the tissues after drought stress. Genotypes ASARECA13-1 x NAROSORGH3-1-1-5-1/22B (0.28) and ASARECA13-1 x FRAMIDA-1-1-3-1/22B (0.20) exhibited good rehydration capacity, while GE16/2/20B x IESV92041SH (SSEA 18B#6) (-0.31) and ASARECA13-1 x NAROSORGH3-1-1-1-1/22B (-0.30) had the poorest.
3.4. Clustering of Genotypes and Traits Under Well-Watered and Drought Stress-Rewatering Conditions
Figure 4 presents biplots that cluster genotypes according to their responses under both well-watered and drought stress-rewatering treatments. The two principal components explained 48% of the total variation in the drought stress-rewatering treatment and 42% under well-watered conditions.
In the drought stress-rewatering regime, the genotypes were categorized into four distinct clusters (Figure 4A). Genotypes ASARECA13-1xNAROSORGH3-1-1-1-1/22B (2), NAROSORGH1 x FRAMIDA-1-1-5-1/22B (13), and NAROSORGH1 x NAROSORGH3-1-1-5-1/22B (16) exhibited the highest values for key yield traits such as dry weight, grain weight, harvest index, panicle length, and panicle width, and were grouped in Cluster 1. These genotypes also demonstrated a rapid rewatering response, achieving the lowest average recovery scores (2.00) within just 12 hours after rehydration. Cluster 2 included genotypes ASARECA13-1 x NAROSORGH3-1-1-5-1/22B (3), ICSV 142001 (6), ICSX 162719-1-4-1-1-1 (8), ICSX152666-B-2-7-3-1-1-1 (9), and IESV16 143-1-3-1 (11). These genotypes were characterized by high biomass yield, 100-seed weight, and generally greater leaf numbers, but they exhibited a lower harvest index. Cluster 4, represented solely by genotype ICSX 152005-SB-5-3-2-1, exhibited distinct and unfavourable traits. It recorded the lowest grain yield, harvest index, 100-seed weight, and biomass yield, along with the poorest recovery 12 hours post-rewatering. Additionally, this genotype had the highest degree of leaf rolling, a manifestation of drought susceptibility, the lowest chlorophyll content, and the smallest number of green leaves. ICSX 152005-SB-5-3-2-1, therefore, stood out as the most susceptible genotype, displaying the weakest recovery potential.
In the well-watered scenario, there was a limited tendency for traits to cluster (Figure 4B). However, genotypes IESV 214006DL (10) and NAROSORGH1 x NAROSORGH3-1-1-1-1/22B (16) were grouped in Cluster 1, showing generally high values for panicle length, grain yield, and dry weight. Notably, genotype MAZDA105 Enyankore (12) exhibited a unique response, forming a distinct Cluster 2. This genotype demonstrated the highest values for chlorophyll content, plant height, biomass yield, and panicle exertion, standing out from all other genotypes.
3.5. Screening Genotypes with Strong Drought Recovery Based on Resistance/Tolerance Indices
The recovery levels of the different genotypes were assessed by calculating drought selection indices, following the methodology outlined by [25].
Correlation of Drought Tolerance Indices and Genotype Ranking
The tolerance or resistance indices calculated were analysed to explore their inter-correlations as well as with grain yield under both drought stress-rewatering and well-watered treatments [25,27] (Table 3).
As indicated in Table 3, yield under stress-rewatering (Ys) was strongly and positively associated with yield under well-watered conditions (Yp), with a correlation coefficient of 0.58. Several indices, including Geometric Mean (GM), Mean Productivity Index (MPI), Harmonic Mean (HM), Stress Tolerance Index (STI), and Yield Index (YI), showed strong positive correlations with grain yield in both watering regimes. In contrast, the Stress Susceptibility Index (SSI) and Yield Stability Index (YSI) were significantly linked only to yield under stress, with correlation values of -0.68 and 0.68, respectively. While biomass-related indices such as Mean Biomass (MB), Geometric Mean Biomass (GMB), Biomass Index (BI), and Biomass Stability Index (BSI) did not have statistical significance, they tended to correlate positively with yield under stress and negatively with grain yield in well-watered conditions. Each genotype was ranked according to its performance across the different drought tolerance indices. The mean rank, standard deviation of ranks, and rank sum (RS) were calculated for all indices to identify the most desirable genotypes with the lowest rank sum as described by [29]. Using this approach, genotypes were ranked from the most tolerant, showing the best recovery, to the least tolerant, with the poorest recovery. The initial ranking considered only grain yield-related indices (Table 4), followed by a final ranking that included both grain yield and biomass-related indices (Table 5)
3.6. Grouping of Genotypes Based on Their Suitable Growth Conditions
Based on the classification approach outlined by [29] and later applied by [28], the genotypes were grouped into four categories according to their yield performance under drought stress-rewatering (hereafter referred to as stress) and well-watered (non-stress) conditions (Table 6). Group A comprised genotypes with high yields in both stress and non-stress conditions. Group B included those producing high yields only under non-stress conditions. Group C consisted of genotypes maintaining good yields under stress, while Group D encompassed those genotypes with poor performance in both stress and non-stress conditions.
4. Discussion of Results
This current study aimed to evaluate the drought recovery potential of diverse sorghum genotypes following drought stress, with the aim of identifying key traits and genotypes that contribute to resilience under fluctuating water availability. Understanding recovery capacity is critical for breeding sorghum varieties capable of maintaining productivity under the increasingly variable rainfall patterns associated with climate change.
Our findings revealed significant genotypic variation in drought recovery potential, with important implications for breeding programs. Although portable and field-applicable wet-lab diagnostics, such as those used for pathogen detection [30] and seed-based genotyping [31], are advancing rapidly, effective and precise approaches for evaluating physiological recovery from abiotic stresses, such as drought, remain underdeveloped. This study addresses this gap by applying a practical, multi-trait-based screening method to assess drought recovery potential in sorghum. Drought stress diminished critical yield traits, including dry weight, grain weight and 100-seed weight. These reductions, observed in genotypes ICSX152005-SB-5-3-2-1, ICSX 162719-1-4-1-1-1 and ETEREMA, may be ascribed to poor panicle emergence, panicle blasting, ovary abortion and decreases in panicle size and grain number, traits that directly impact grain yield [32,33]. Despite post-stress growth recovery, biomass yield remained lower in drought-stressed plants compared to the control plants, consistent with the responses observed in many plant species subjected to drought stress [34,35,36]. As noted by [37], this discrepancy reflects pre-drought limitations that constrain the capacity for full recovery. Notably, drought stress delayed flowering by an average of 11 days, contrasting with previous reports of accelerated flowering under drought stress in other plant species [32,38].
Plant growth slowed under drought stress but recovered across all genotypes during the rewatering phase, reflecting the high plasticity of sorghum’s growth. Growth reduction during stress was mainly attributed to a decrease in cell expansion and elongation [39,40]. Typically, this growth retardation reflects a shift in the energy budget, where maintenance processes take priority, leaving less energy available for growth. The genotypes NAROSORGH1 x NAROSORGH3-1-1-1-1/22B and MAZDA105 Enyankore were particularly notable for sustaining relatively high chlorophyll content during both the stress and recovery periods, underscoring their drought tolerance characteristics. This observation is supported by prior studies showing that drought-tolerant genotypes tend to maintain higher chlorophyll levels under stress compared to susceptible ones [41,42,43]. The rapid drought-induced reduction in chlorophyll content across genotypes suggests a significant loss in photosynthetic functionality at PSI and PSII reaction centres [34]. However, the rapid recovery of plants after rewatering, especially genotypes NAROSORGH1 x NAROSORGH3-1-1-1-1/22B, ASARECA13-1 x Framida -1-1-3-1/22B, NAROSORGH1 x FRAMIDA-1-1-5-1/22B and IESV16 143-1-3-1, indicates that this loss may serve a regulatory rather than a purely damaging function [34,44].
Dehydration is a reversible process [44], consistent with our findings that stem diameter decreased significantly during drought stress but increased across all genotypes during the recovery phase. The heightened variability in responses during the recovery phase, compared to the stress period, highlights the diverse recovery patterns and capacities across the different genotypes.
4.1. Shifts in Traits’ Significance as Adaptive Responses to Drought Stress and Recovery
Plants activate a suite of adaptive mechanisms in response to drought stress and rewatering, encompassing molecular and biochemical changes as well as complex physiological and morphological adjustments [37,45]. However, the extent of plant growth recovery following rewatering may depend on the intensity and duration of the preceding drought [37]. Grain weight, dry weight, harvest index, and panicle size-key yield-contributing traits were the main contributors to Cluster 1, which comprised genotypes ASARECA13-1 x NAROSORGH3-1-1-1-1/22B, NAROSORGH1xFRAMIDA-1-1-5-1/22B and NAROSORGH1x NAROSORGH3-1-1-5-1/22B. The rapid rehydration response observed in these genotypes, likely reflecting faster recovery of the photosynthetic apparatus and thus higher photosynthetic rates, may explain their higher yields post-rewatering. While leaf rolling is known to reduce transpiration and protect the photosynthetic machinery from photodamage [39,46], our findings indicated that a high degree of leaf rolling was linked to the high susceptibility of genotype ICSX152005-SB-5-3-2-1. As leaf rolling reduces the effective leaf area for photosynthesis[10,46], this susceptibility may be linked to reduced carbon dioxide assimilation, a tradeoff for water conservation in plants [47,48,49]. Biomass yield, on the other hand, showed stronger correlations with leaf number, leaf area, chlorophyll content, 100-seed weight, and days to 50% flowering. These traits were associated with genotypes ASARECA13-1 x NAROSORGH3-1-1-5-1/22, ICSV142001, ICSX162719-1-4-1-1-1, ICSX152666-B-2-7-3-1-1-1, and IESV16 143-1-3-1, which were grouped in Cluster 2. 100-seed weight is a key yield component that reflects the source-sink relationship of photo-assimilates during the grain filling stage [50]. The strong positive correlation between 100-seed weight and biomass yield was similarly observed by [51]. Previous studies have reported a strong positive correlation between 100-seed weight and other yield components, such as dry weight, grain weight, and harvest index [52,53,54]. However, no such correlation was observed in this study. Despite the lower productivity of genotypes MAZDA105 Enyankore and ICSX162719-1-4-1-1-1, their ability to maintain high biomass yield and chlorophyll content under both stress and well-watered conditions makes them particularly promising for forage breeding. Therefore, the grouping of traits under drought stress into distinct drought recovery patterns, as shown in the biplots, highlights the varying capacities of genotypes to recover after a drought event.
4.2. Strategy for Selecting Desirable Genotypes Using Drought Tolerance/Resistance Indices
Genotypes exhibit varied responses to drought stress [27,55]. Given this, various selection criteria have been proposed to identify genotypes based on their performance in both stress and non-stress conditions [25,27,28,32]. Tolerant genotypes are characterized by low SSI and TOL values, along with high MP, HM, GMP, STI, YI, and YSI values [25,28,55]. Considering the rank sum, genotypes GE16/2/20B x IESV92041SH (SSEA 18B#6), NAROSORGH1 x NAROSORGH3-1-1-1-1/22B, ICSX152666-B-2-7-3-1-1-1, NAROSORGH1 x FRAMIDA-1-1-5-1/22B, ASARECA13-1 x NAROSORGH3-1-1-1-1/22B, ASARECA13-1 x Framida-1-1-3-1/22B, ICSV142001 and NAROSORGH1 x NAROSORGH3-1-1-5-1/22B demonstrated the best recovery potential, outperforming the positive check NAROSORGH 4. This was further supported by the biplot analysis, highlighting their high grain yield under stress and non-stress conditions. Conversely, genotype ICSX152005-SB-5-3-2-1 emerged as the most susceptible, exhibiting the poorest recovery potential and performing below ETEREMA, the negative check. Based on both grain and biomass indices, the genotypes assumed new ranks. Two additional genotypes, ASARECA13-1 x NAROSORGH3-1-1-5-1/22B and IESV16 143-1-3-1, emerged among the previously high-performing genotypes, surpassing the positive check. Meanwhile, genotype IESV214006DL, alongside ICSX152005-SB-5-3-2-1, ranked below ETEREMA. Comparable to the findings of [56], we observed a highly significant positive correlation between grain yield under both stress and non-stress conditions. This suggests that during recovery, grain yield performance in optimal conditions serves as a reliable predictor for yield under stress, as also supported by [28] [57].
An effective selection index should have a significant relationship with grain yield in both stress and non-stress conditions [58,59]. The correlation matrix indicated a strong positive association between grain yield in stress conditions (Ys) and in non-stress conditions (Yp), along with indices such as the Geometric Mean (GM), Mean Productivity Index (MPI), Harmonic Mean (HM), Stress Tolerance Index (STI), and Yield Index (YI). This indicates that these criteria were effective in distinguishing drought-tolerant genotypes that maintained high grain yield across both watering regimes. Consequently, these indices were deemed suitable for selecting genotypes with strong recovery potential. Conversely, biomass indices appeared to have limited relevance to grain yield performance.
5. Conclusions
This study evaluated the responses of 18 sorghum genotypes to drought stress and subsequent rewatering to determine their drought recovery potential. Our findings confirmed genotype-specific recovery patterns and the traits that are key to achieving high yields under intermittent water supply. Genotypes such as NAROSORGH1 x NAROSORGH3-1-1-5-1/22B, ASARECA13-1x NAROSORGH3-1-1-1-1/22B, and NAROSORGH1 x FRAMIDA-1-1-5-1/22B demonstrated rapid rehydration and compensatory growth, to recover from drought stress and maximize yield. Such a good plasticity suggests that these genotypes are particularly well-suited for agroecologies like North-eastern Uganda, which experience intense drought stress followed by short periods of heavy rainfall. Conversely, genotypes such as NAROSORGH1 x NAROSORGH3-1-1-1-1/22B, GE16/2/20B x IESV92041SH (SSEA 18B#6), and ICSX152666-B-2-7-3-1-1-1 achieved higher yields by maintaining higher chlorophyll content, which extended their photosynthetic activity during stress and recovery. Based on stress tolerance indices, genotypes suitable for various moisture conditions were identified, with those in category A proving particularly valuable under fluctuating water conditions due to their yield stability and adaptability. These genotypes show strong potential as parents for drought resilience breeding efforts. In contrast, genotype ICSX152005-SB-5-3-2-1 exhibited the poorest recovery response, while IESV214006DL experienced drastic reductions in performance during drought stress. These two genotypes could serve as reliable negative drought checks in the breeding program. Going forward, understanding the genetic control of the observed recovery responses in selected genotypes will be essential in facilitating the precise introgression of desirable recovery traits in elite breeding materials.
Author Contributions
Conceptualization, S.S., E.N., R.K., M.B., S.A.; methodology, S.S., E.N., R.K., E.O.; software, S.S., R.K.; validation, S.S., E.N., R.K., E.O., S.A., E.E.; formal analysis, S.S., E.N., R.K .; investigation, S.S., R.K., E.E.; resources, S.S., E.N., R.K., S.A., M.B., E.O.; data curation, S.S., R.K.; writing-original draft preparation, S.S.; writing-review and editing, S.S., E.N., R.K., S.A., E.O.; visualization, S.S., E.N., R.K., H.O.A., L.M.; supervision, E.N., R.K., E.O; project administration, S.A., M.B.; funding acquisition, S.A., M.B. All authors have read and agreed to the published version of the manuscript.
Funding
The author(s) declare financial support was received for the research, authorship, and/or publication of this article. This publication is made possible by the generous support of the American people through the United States Agency for International Development (USAID). The contents are the authors’ responsibility and do not necessarily reflect the views of USAID or the United States Government. Program activities of the Centre of Innovation for Finger Millet and Sorghum (CIFMS) under the Innovation Lab for Crop Improvement (ILCI) are funded by the United States Agency for International Development (USAID) under Cooperative Agreement No. 7200AA-19LE-00005. Additional research funds were sourced from the government of Uganda through the National Agricultural Research Organization (NARO), Uganda.
Institutional Review Board Statement
Not applicable.
Informed Consent Statement
Not applicable.
Data Availability Statement
The original contributions presented in this study are included in the article/supplementary material. Further inquiries can be directed to the corresponding author(s).
Acknowledgments
The National Agricultural Research Organization (NARO) is acknowledged for its support to the Centre of Innovation for Finger Millet and Sorghum (CIFMS) in East Africa project hosted at the National Semi-Arid Resources Research Institute (NaSARRI). Special thanks to NaSARRI management for supporting the research team and providing logistical items and human resources during data collection. Special gratitude goes to Dr. Geoffrey Tusiime of Makerere University and Mr. Faizo Kasule, a Graduate Research Assistant at Iowa State University, for their technical support and insightful ideas during the set-up of the experiment.
Conflicts of Interest
The authors declare no conflict of interest.
References
- Weng, T.Y.; Nakashima, T.; Villanueva-Morales, A.; Ryan, S.J.; Sacks, E.J.; Yamada, T. Assessment of drought tolerance of miscanthus genotypes through dry-down treatment and fixed-soil-moisture-content techniques. Agric 2022, 12, 6. [Google Scholar] [CrossRef]
- Martínez-Goñi, X.S.; Robredo, A.; Pérez-López, U.; Muñoz-Rueda, A.; Mena-Petite, A. Sorghum bicolor prioritizes the recovery of its photosynthetic activity, while manages to preserve it under elevated CO2 and drought. J. Agron. Crop Sci. 2023, 209, 217–227. [Google Scholar] [CrossRef]
- Perrone, I.; Pagliarani, C.; Lovisolo, C.; Chitarra, W.; Roman, F.; Schubert, A. Recovery from drought stress affects grape leaf petiole transcriptome. Planta. 2012, 235, 1383–1396. [Google Scholar] [CrossRef] [PubMed]
- Zegada-Lizarazu, W.; Monti, A. Photosynthetic response of sweet sorghum to drought and re-watering. Physiol. Plant. 2013, 149, 56–66. [Google Scholar] [CrossRef]
- Magunda, M. Situational analysis study for the agriculture sector in Uganda. CCAFS Report. 2020. [Google Scholar]
- Nakalembe, C. Characterizing agricultural drought in the Karamoja sub-region of Uganda with meteorological and satellite-based indices. Nat. Hazards. 2018, 91, 37–62. [Google Scholar] [CrossRef]
- Mugerwa, S. The Potential of Well-Designed Early Warning Systems and Disaster Insurance Schemes in Cushioning Farmers Against Drought-induced Agricultural Losses in the Karamoja Sub-region of Uganda. Sci. Agric. 2013, 3, 19–25. [Google Scholar]
- Tenywa, M.M.; Nyamwaro, S.O.; Kalibwani, R.; Mogabo, J.; Buruchara, R.; Oluwole, F. Innovation Opportunities in Sorghum Production in Uganda. FARA Res. 2018, 2, 2018. [Google Scholar]
- Lubadde, G.; Ebiyau, J.; Aru, J.C.; Andiku, C.; Wandulu, J.A. and Ugen, M.A. Sorghum production handbook for Uganda. National Semi-Arid Resources Research Institute of the National Agricultural Research Organisation (NaSARRI-NARO), Uganda. 2013, p.37.
- Badigannavar, A.; Teme, N.; de Oliveira, A.C.; Li, G.; Vaksmann, M.; Viana, V.E. ; Physiological, genetic and molecular basis of drought resilience in sorghum [Sorghum bicolor (L) Moench]. Indian J Plant Physiol, 2018, 23, 670–688. [Google Scholar] [CrossRef]
- Krupa, K.N.; Dalawai, N.; Shashidhar, H.E.; Harinikumar, K.M.; Manojkumar, H.B.; Bharani, S. and Turaidar, V. Mechanisms of Drought Tolerance in Sorghum : A Review. Int. J. Pure Appl. Biosci. 2017, 5, 221–237. [Google Scholar] [CrossRef]
- Verma, R.; Kumar, R.; and Nath, A. Drought Resistance Mechanism and Adaptation to Drought stress in Sorghum [Sorghum bicolor (L.) Moench]. Int J Bio-resource Stress Manag. 2018, 9, 167–172. [Google Scholar] [CrossRef]
- Devnarain, N.; Crampton, B.G.; Chikwamba, R.; Becker, J.V.W. and O’Kennedy, M.M. Physiological responses of selected African sorghum landraces to progressive drought stress and rewatering. South African J Bot. 2016, 103, 61–69. [Google Scholar] [CrossRef]
- Chen, D.; Wang, S.; Cao, B.; Cao, D.; Leng, G.; Li, H.; Yin, L.; Shan, L. and Deng, X. Genotypic variation in growth and physiological response to drought stress and rewatering reveals the critical role of recovery in drought adaptation in maize seedlings. Front Plant Sci. 2016, 6, 1241. [Google Scholar] [CrossRef] [PubMed]
- Hasanuzzaman, M.; Shabala, L.; Brodribb, T.J.; Zhou, M. and Shabala, S. Understanding the Role of Physiological and Agronomical Traits during Drought Recovery as a Determinant of Differential Drought Stress Tolerance in Barley. Agron. 2022, 12, 2136. [Google Scholar] [CrossRef]
- Perrier, L.; Rouan, L.; Jaffuel, S.; Clément-Vidal, A.; Roques, S.; Soutiras, A. and Luquet, D. Plasticity of sorghum stem biomass accumulation in response to water deficit: A multiscale analysis from internode tissue to plant level. Front Plant Sci. 2017, 8, 15. [Google Scholar] [CrossRef] [PubMed]
- Onziga, D.I. Characterizing the genetic diversity of finger millet in Uganda. Master’s Degree thesis, Makerere University, P.O.Box.7062, Kampala-Uganda, 15. 20 August.
- Aru, J.C.; Adikini, S.; Omaria, S.; Okiasi, F.; Esuma, W.; Kakeeto, R. and Manyaza, E. Accelerating Breeding for Drought Tolerance in Sorghum (Sorghum bicolor): An Integrated Approach. In Case Studies of Breeding Strategies in Major Plant Species. IntechOpen, 2023. www.intechopen.
- Strauss, A.J.; Krüger, G.H.J.; Strasser, R.J. and Van Heerden, P.D.R. Ranking of dark chilling tolerance in soybean genotypes probed by the chlorophyll a fluorescence transient OJIP. Environ Exp Bot. 2006, 56, 147–157. [Google Scholar] [CrossRef]
- Gano, B.; Dembele, J.S.B.; Tovignan, T.K.; Sine, B.; Vadez, V.; Diouf, D. and Audebert, A. Adaptation responses to early drought stress of West African sorghum varieties. Agron. 2021, 11, pg.443. 11. [CrossRef]
- Ssengo, J.; Zebosi, B. and Karungi, J. Efficiency of Botanical and Chemical Pesticides on the Control of Field Insect Pests under Cowpea Production. Am J Plant Sci. 2024, 15, 203–221. [Google Scholar] [CrossRef]
- Team, R.D.C. A Language and Environment for Statistical Computing. 2024. https://www.r-project.
- Kuznetsova, A.; Brockhoff, P.B.; Christensen, R.H. lmerTest Package: Tests in Linear Mixed Effects Models. J Stat Softw. 2017, 82, 1–26. [Google Scholar] [CrossRef]
- Wickham, H. and Sievert, C. Elegant Graphics for Data Analysis. Springer. 2016, 10, 978. [Google Scholar]
- Gitore, S.A.; Danga, B.; Henga, S. and Gurmu, F. Evaluating Drought tolerance indices for selection of drought tolerant Orange Fleshed Sweet Potato (OFSP) genotypes in Ethiopia. Int J Agric Sci Food Technol. 2021, 7, 249–254. [Google Scholar] [CrossRef]
- Harrell Jr, F.E. Package ‘hmisc’. CRAN 2018, 2019.2019, 235-236.https://cran.r-project.
- Farshadfar, E. and Sutka, J. Multivariate analysis of drought tolerance in wheat substitution lines. Cereal Res. Commun. 2003, 31, 33–40. [Google Scholar] [CrossRef]
- Fernandez, G.C.J. Effective Selection Criteria for Assessing Plant Stress Tolerance. In Proceedings of the International Symposium on Adaptation of Vegetables and other Food Crops in Temperature and Drought stress, Taipei, Taiwan, 13-18 August 1992. [Google Scholar]
- Abd El-Mohsen, A.A.; Abd El-Shafi, M.A.; Gheith, E.M.S. and Suleiman, H.S. Using Different Statistical Procedures for Evaluating Drought Tolerance Indices of Bread Wheat Genotypes. Adv Agric Biol. 2015, 4, 19–30. [Google Scholar] [CrossRef]
- Ssengo, J.; Wasswa, P.; Mukasa, S.B.; Okiror, A. and Kyamanywa, S. Portable PCR field-based detection of sweet potato viruses. African Crop Sci J. 2020, 28, 363–374. [Google Scholar] [CrossRef]
- Zebosi, B.; Ssengo, J.; Geadelmann, L.F.; Unger-Wallace, E. and Vollbrecht, E. An Effective and Safe Maize Seed Chipping Protocol Using Clipping Pliers With Applications in Small-Scale Genotyping and Marker-Assisted Breeding. Bio-protocol. 2025, 15, 1–9. [Google Scholar] [CrossRef]
- de Souza, A.A.; de Carvalho, A.J.; Bastos, E.A.; Cardoso, M.J.; Júlio, M.P.M.; Batista, P.S.C.; Julio, B.H.M.; Campolina, C.V.; Portugal, A.F.; de Menezes, C.B.; de Oliveira, S.M. Grain sorghum under pre- and post-flowering drought stress in a semiarid environment. Aust J Crop Sci. 2021, 15, 1139–1145. [Google Scholar] [CrossRef]
- Kapanigowda, M.H.; Perumal, R.; Djanaguiraman, M.; Aiken, R.M.; Tesso, T.; Prasad, P.V. and Little, C.R. Genotypic variation in sorghum [Sorghum bicolor (L.) Moench] exotic germplasm collections for drought and disease tolerance. Springerplus. 2013, 2, 1–13. [Google Scholar] [CrossRef]
- Wach, D. and Skowron, P. An overview of plant responses to drought stress at morphological, physiological and biochemical levels. Pol. J. Agron. 2022, 50, 25–34. [Google Scholar]
- Eziz, A.; Yan, Z.; Tian, D.; Han, W.; Tang, Z. and Fang, J. Drought effect on plant biomass allocation: A meta-analysis. Ecol. Evol. 2017, 7, 11002–11010. [Google Scholar] [CrossRef]
- Fenta, B.A.; Beebe, S.E.; Kunert, K.J.; Burridge, J.D.; Barlow, K.M.; Lynch, J.P. and Foyer, C.H. Field phenotyping of soybean roots for drought stress tolerance. Agron. 2014, 4, 418–435. [Google Scholar] [CrossRef]
- Abid, M.; Tian, Z.; Ata-Ul-Karim, S.T.; Wang, F.; Liu, Y.; Zahoor, R.; Jiang, D. and Dai, T. Adaptation to and recovery from drought stress at vegetative stages in wheat (Triticum aestivum) cultivars. Funct. Plant Biol. 2016, 43, 1159–1169. [Google Scholar] [CrossRef]
- Srivastava, R. and Sahoo, L. Balancing yield trade-off in legumes during multiple stress tolerance via strategic crosstalk by native NAC transcription factors. J. Plant Biochem Biotechnol 2021, 30, 708–729. [Google Scholar] [CrossRef]
- Anjum, S.A.; Ashraf, U.; Zohaib, A.; Tanveer, M.; Naeem, M.; Ali, I.; Tabassum, T. and Nazir, U. Growth and development responses of crop plants under drought stress: A review. Zemdirbyste. 2017, 104, 267–276. [Google Scholar] [CrossRef]
- Jaleel, C.A.; Manivannan, P.; Wahid, A.; Farooq, M.; Al-Juburi, H.J.; Somasundaram, R. and Panneerselvam, R. Drought stress in plants: A review on morphological characteristics and pigment composition. Int J Agric Biol. 2009, 11, 100–105. [Google Scholar]
- Patil, J.V.; Rakshit, S. and Khot, K.B. Genetics of post-flowering drought tolerance traits in post-rainy sorghum [Sorghum bicolor (L.) Moench]. Indian J Genet Plant Breed. 2013, 73, 44–50. [Google Scholar] [CrossRef]
- Hadebe, S.T. Water use of selected sorghum (Sorghum bicolor L. Moench) genotypes. Doctoral dissertation, University of KwaZulu-Natal, Pietermaritzburg, 15. 20 November.
- Ali, F.; Ahsan, M.; Ali, Q. and Kanwal, N. Phenotypic stability of Zea mays grain yield and its attributing traits under drought stress. Front Plant Sci. 2017, 8, 13971. [Google Scholar] [CrossRef]
- Efeoǧlu, B.; Ekmekçi, Y. and Çiçek, N. Physiological responses of three maize cultivars to drought stress and recovery. South African J Bot. 2009, 75, 34–42. [Google Scholar] [CrossRef]
- Xu, Z.; Zhou, G. and Shimizu, H. Plant responses to drought and rewatering. Plant Signal Behav. 2010, 5, 649–654. [Google Scholar] [CrossRef]
- Saglam, A.; Kadioglu, A.; Demiralay, M. and Terzi, R. Leaf rolling reduces photosynthetic loss in maize under severe drought. Acta Bot Croat. 2014, 73, 315–332. [Google Scholar] [CrossRef]
- Allen Jr, L.H. Evapotranspiration responses of plants and crops to carbon dioxide and temperature. J Crop Prod. 2000, 2, 37–70. [Google Scholar] [CrossRef]
- Taiz, L. and Zeiger, E. Plant Physiology, 5th ed.; Sinauer Associates Inc: Sunderland, Massachusetts, U.S.A, 2002; pp. 566–567. [Google Scholar]
- Zhang, D.; Jiao, X.; Du, Q.; Song, X. and Li, J. Reducing the excessive evaporative demand improved photosynthesis capacity at low costs of irrigation via regulating water driving force and moderating plant drought stress of two tomato cultivars. Agric Water Manag. 2018, 199, 22–33. [Google Scholar] [CrossRef]
- Jabereldar, A.A.; El Naim, A.M.; Abdalla, A.A. and Dagash, Y.M. Effect of Drought Stress on Yield and Water Use Efficiency of Sorghum (Sorghum bicolor L. Moench) in Semi-Arid Environment. Int. J. Agric. 2017, 7, 1–6. [Google Scholar]
- Thant, S.; Kumari, P.; Pahuja, S.K.; Tokas, J. and Yashveer, S. Identification of dual-type sorghum genotypes based on correlation and path coefficient studies. Forage Res. 2021, 46, 302–307. [Google Scholar]
- Taheri, S.; Saba, J.; Shekari, F. and Abdullah, T.L. Effects of drought stress conditions on the yield of spring wheat (Triticum aestivum) lines. African J Biotechnol. 2011, 10, 18339–18348. [Google Scholar] [CrossRef]
- Wasaya, A.; Manzoor, S.; Yasir, T.A.; Sarwar, N.; Mubeen, K.; Ismail, I.A.; Raza, A.; Rehman, A.; Hossain, A. and El Sabagh, A. Evaluation of fourteen bread wheat (Triticum aestivum L.) genotypes by observing gas exchange parameters, relative water and chlorophyll content, and yield attributes under drought stress. Sustain. 2021, 13, 4799. [Google Scholar] [CrossRef]
- Ayalew, K.; Adugna, A.; Fetene, M. and Sintayehu, S. Evaluation of bio-physiological and yield responses of stay green QTL introgression sorghum lines to post-flowering drought stress. African Crop Sci J. 2018, 26, 447–462. [Google Scholar] [CrossRef]
- Jafari, A.; Paknejad, F. and AL-Ahmadi, M.J. Evaluation of selection indices for drought tolerance of corn (Zea mays L.) hybrids. Int. J. Plant Prod. 2009, 3, 33–38. [Google Scholar]
- Yahaya, M.A.; Shimelis, H.; Nebié, B.; Mashilo, J. and Pop, G. Response of African Sorghum Genotypes for Drought Tolerance under Variable Environments. Agron. 2023, 13, 557. [Google Scholar] [CrossRef]
- Emendack, Y.; Burke, J.; Sanchez, J.; Laza, H.E. and Hayes, C. Agro-morphological characterization of diverse sorghum lines for pre- and post-flowering drought tolerance. Aust J Crop Sci. 2018, 12, 135–150. [Google Scholar] [CrossRef]
- Rashidi, F.; Majidi, M.M. and Pirboveiry, M. Response of different species of Brassica to water deficit. Int. J. Plant Prod. 2017, 11, 1–16. [Google Scholar]
- Lestari, A.P.; Sopandie, D. and Aswidinnoor, H. Estimation for Stress Tolerance Indices of Rice Genotypes in Low Nitrogen Condition. Agric Sci Soc Thail. 2019, 52, 180–190. [Google Scholar]
Figure 1.
Visual comparison of sorghum plants under different watering treatments: (A) 7 days during drought stress; (B) 25 days after rewatering. Plants exposed to drought stress are shown alongside well-watered controls.
Figure 1.
Visual comparison of sorghum plants under different watering treatments: (A) 7 days during drought stress; (B) 25 days after rewatering. Plants exposed to drought stress are shown alongside well-watered controls.
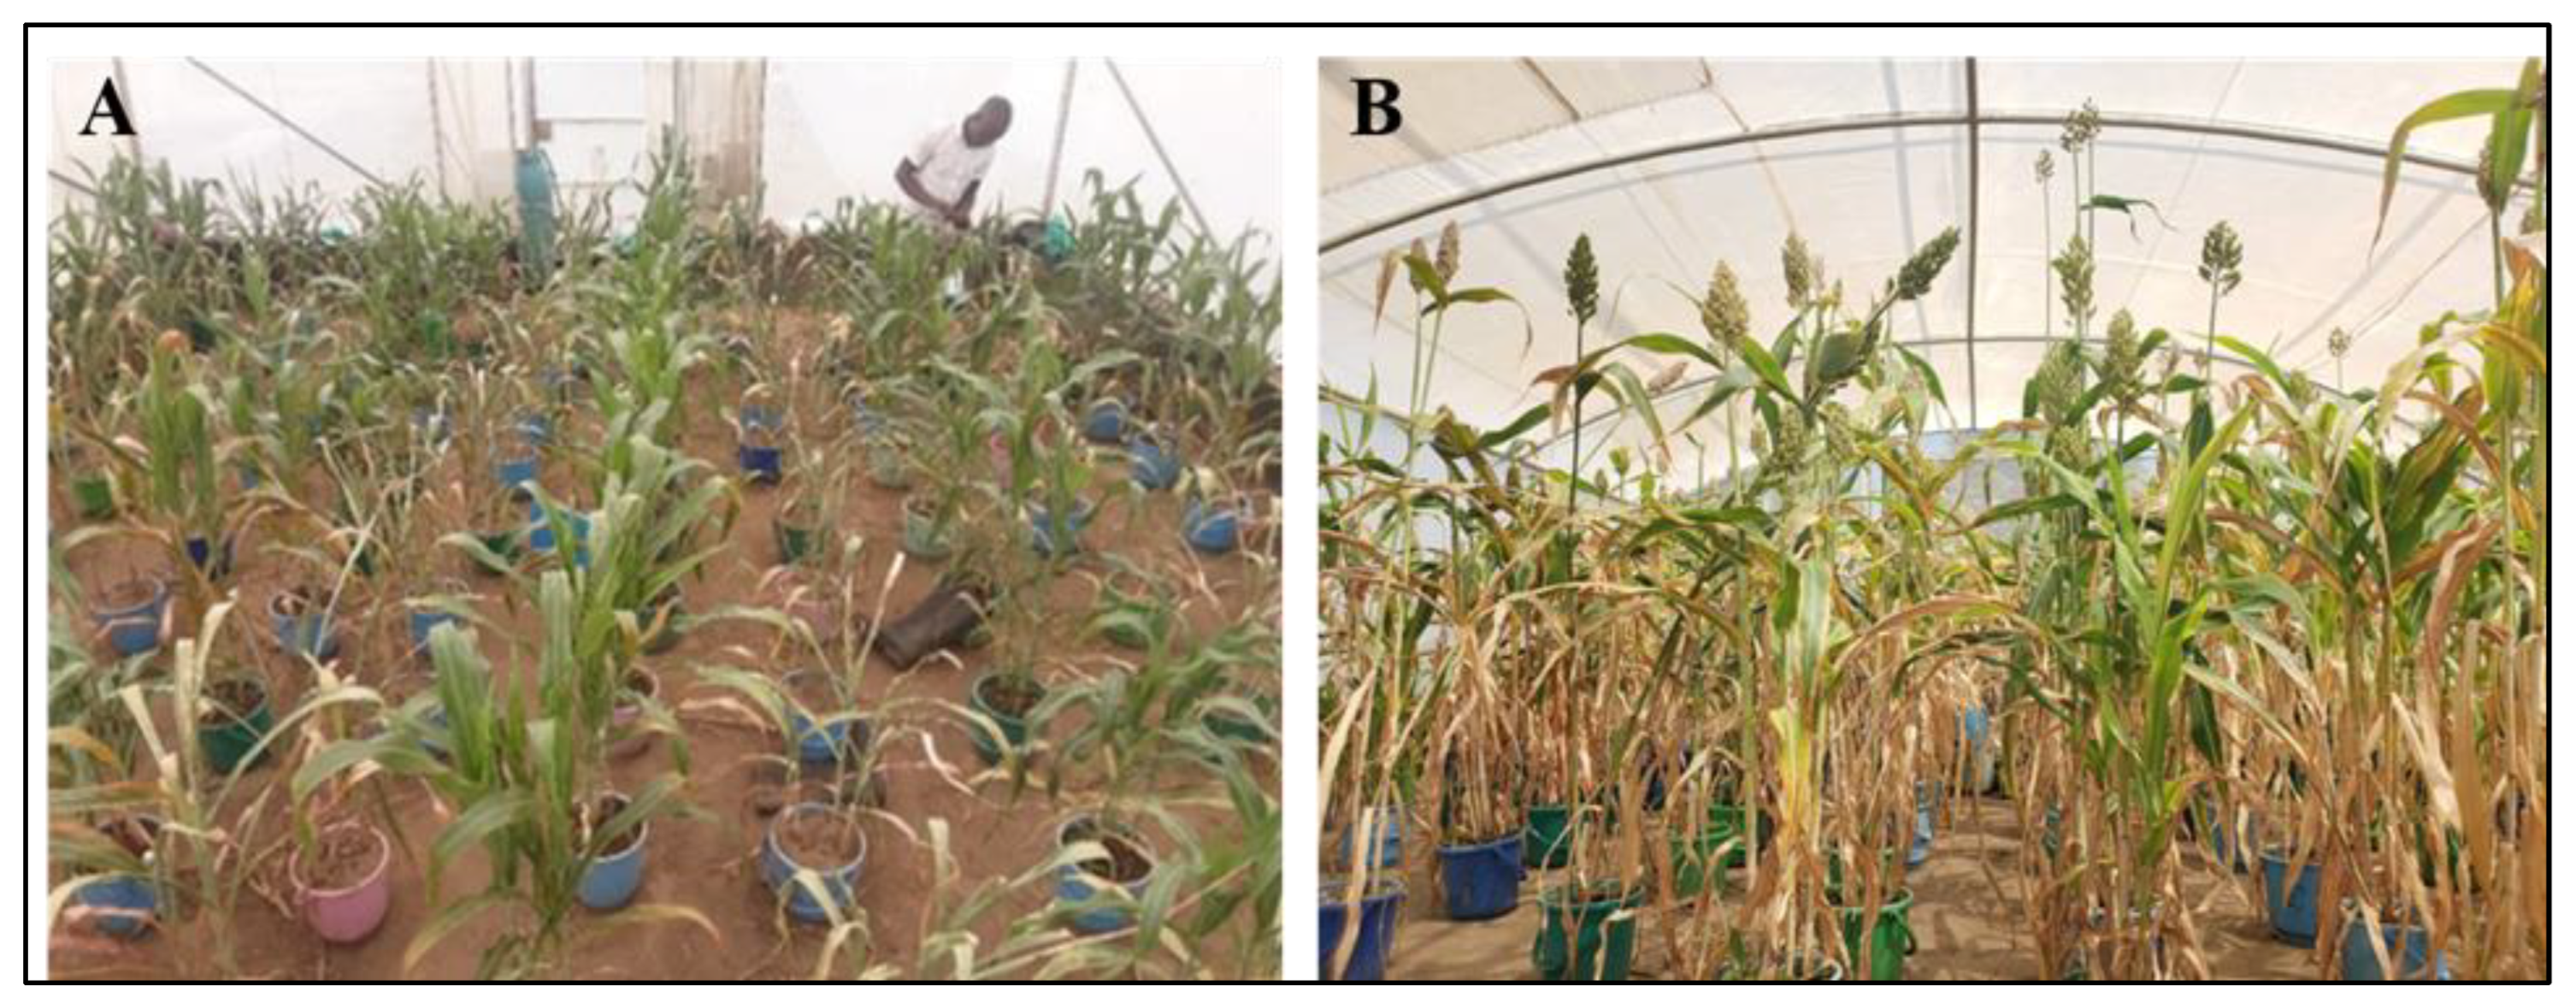
Figure 2.
Average performance of selected phenological, physiological and yield traits under drought stress-rewatering and well-watered conditions. Mean values are shown for each treatment. PLWt: Dry weight harvested from a pot, FLWD: Days to 50% flowering, GRWt: Grain weight after threshing, LA: Leaf angle.
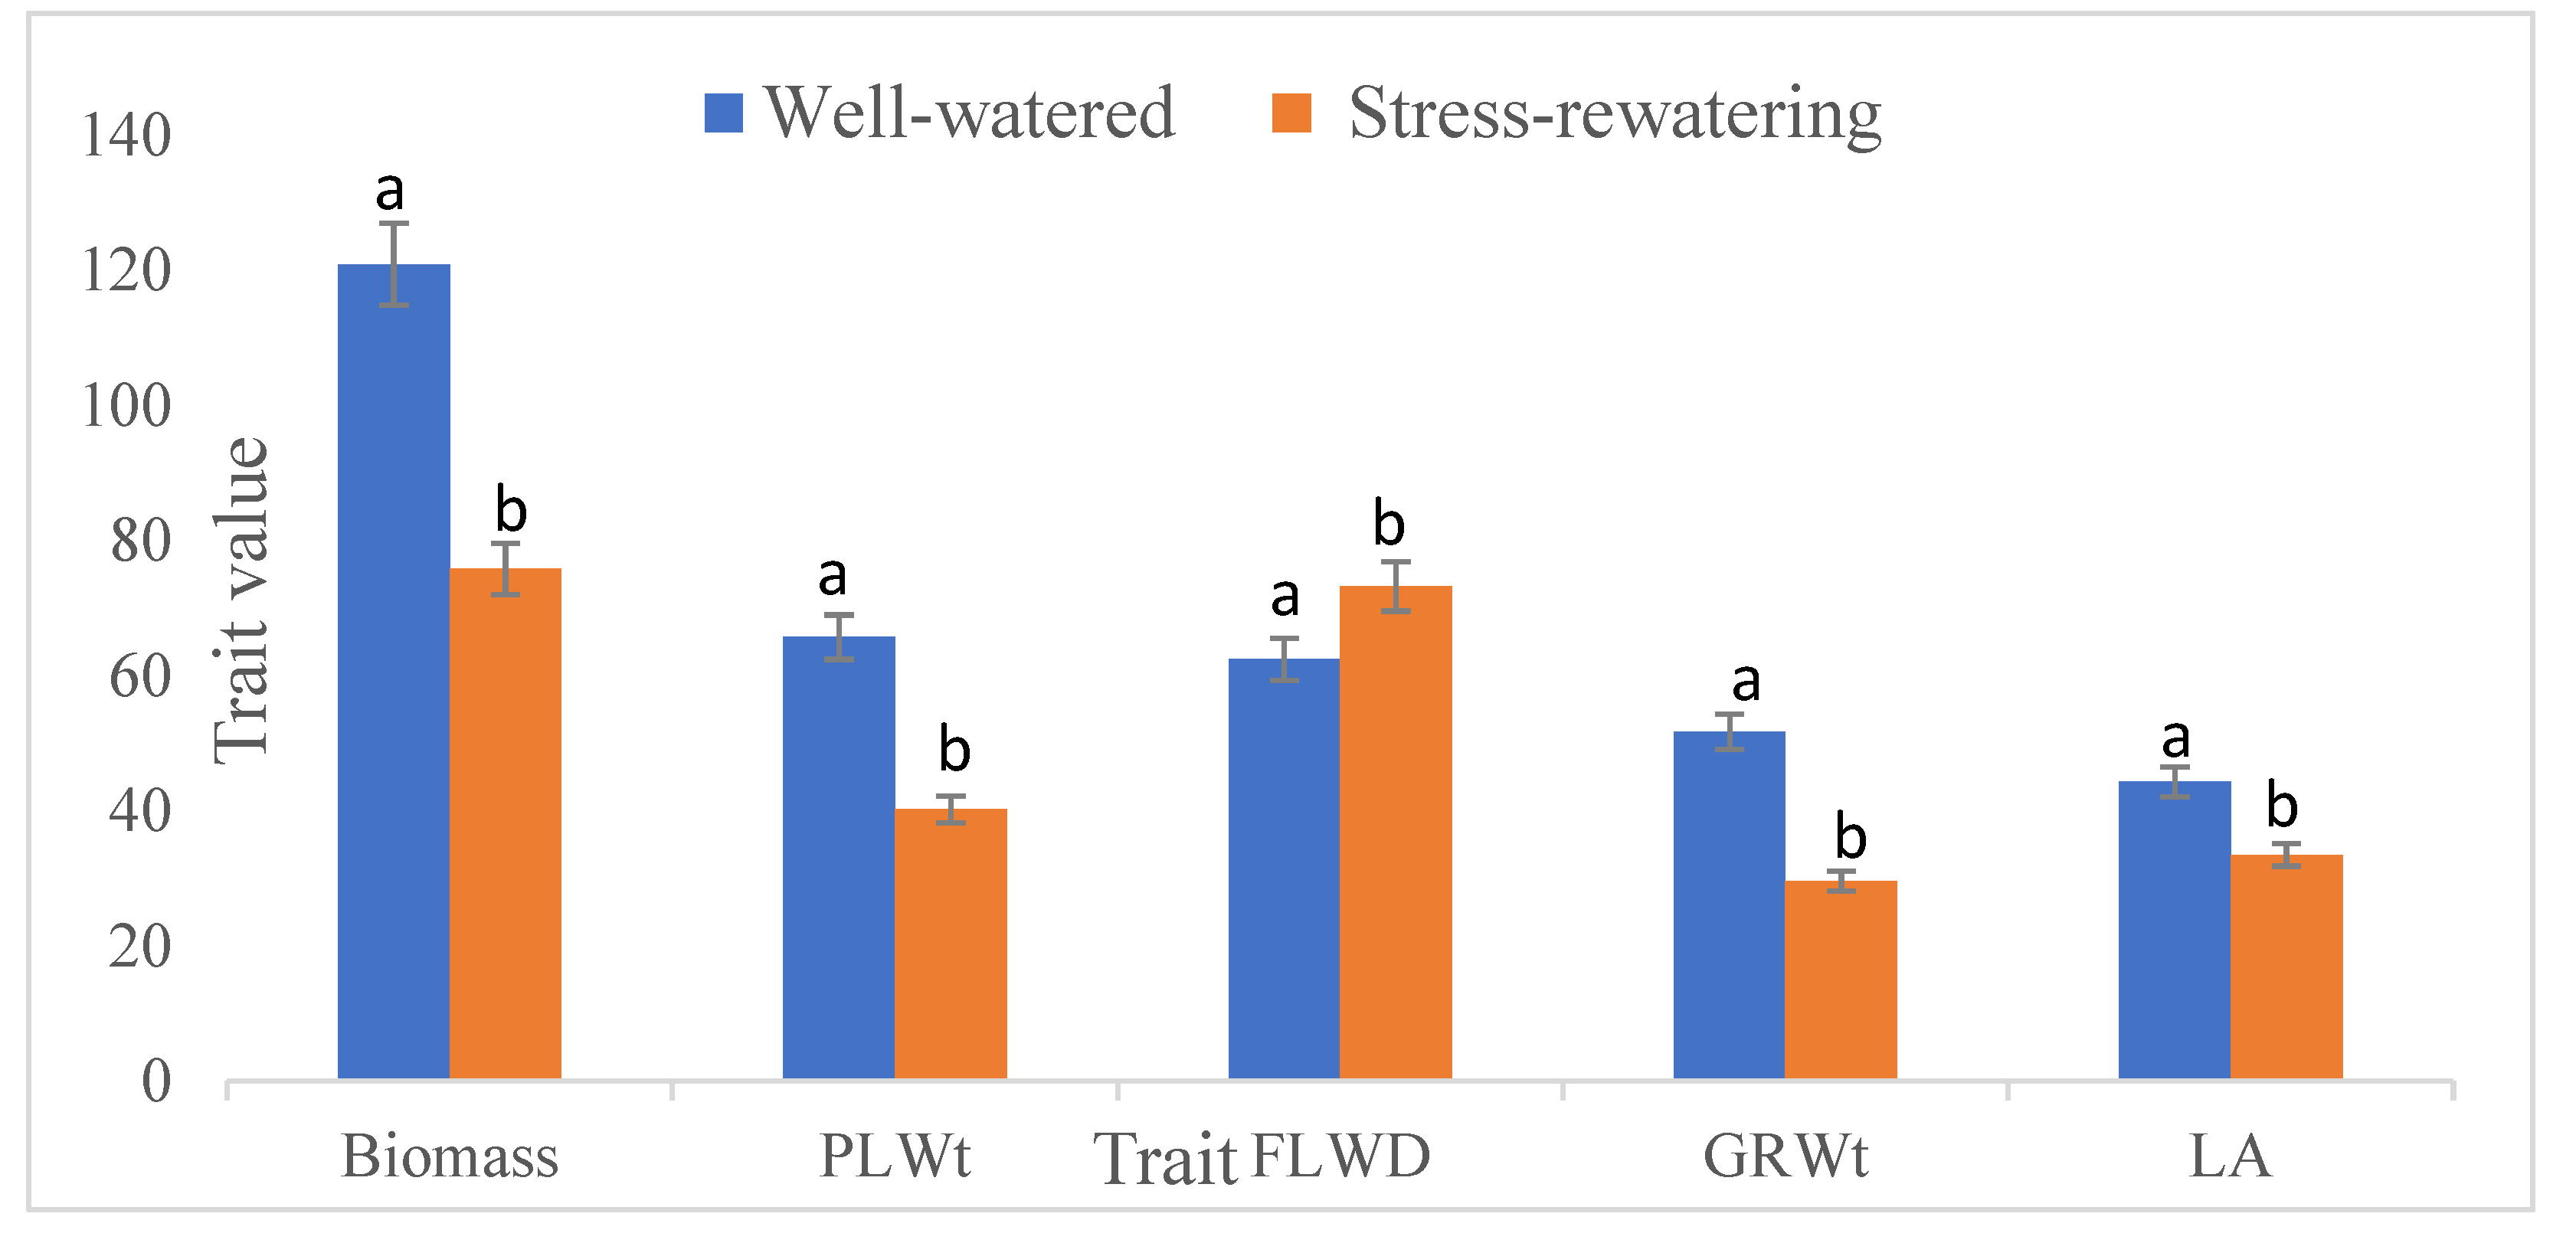
Figure 3.
Performance of selected sorghum genotypes across sequential stages during drought stress and recovery phases, compared to the overall mean performance ( ). C = control (well-watered); T = drought stress–rewatering treatment.
). C = control (well-watered); T = drought stress–rewatering treatment.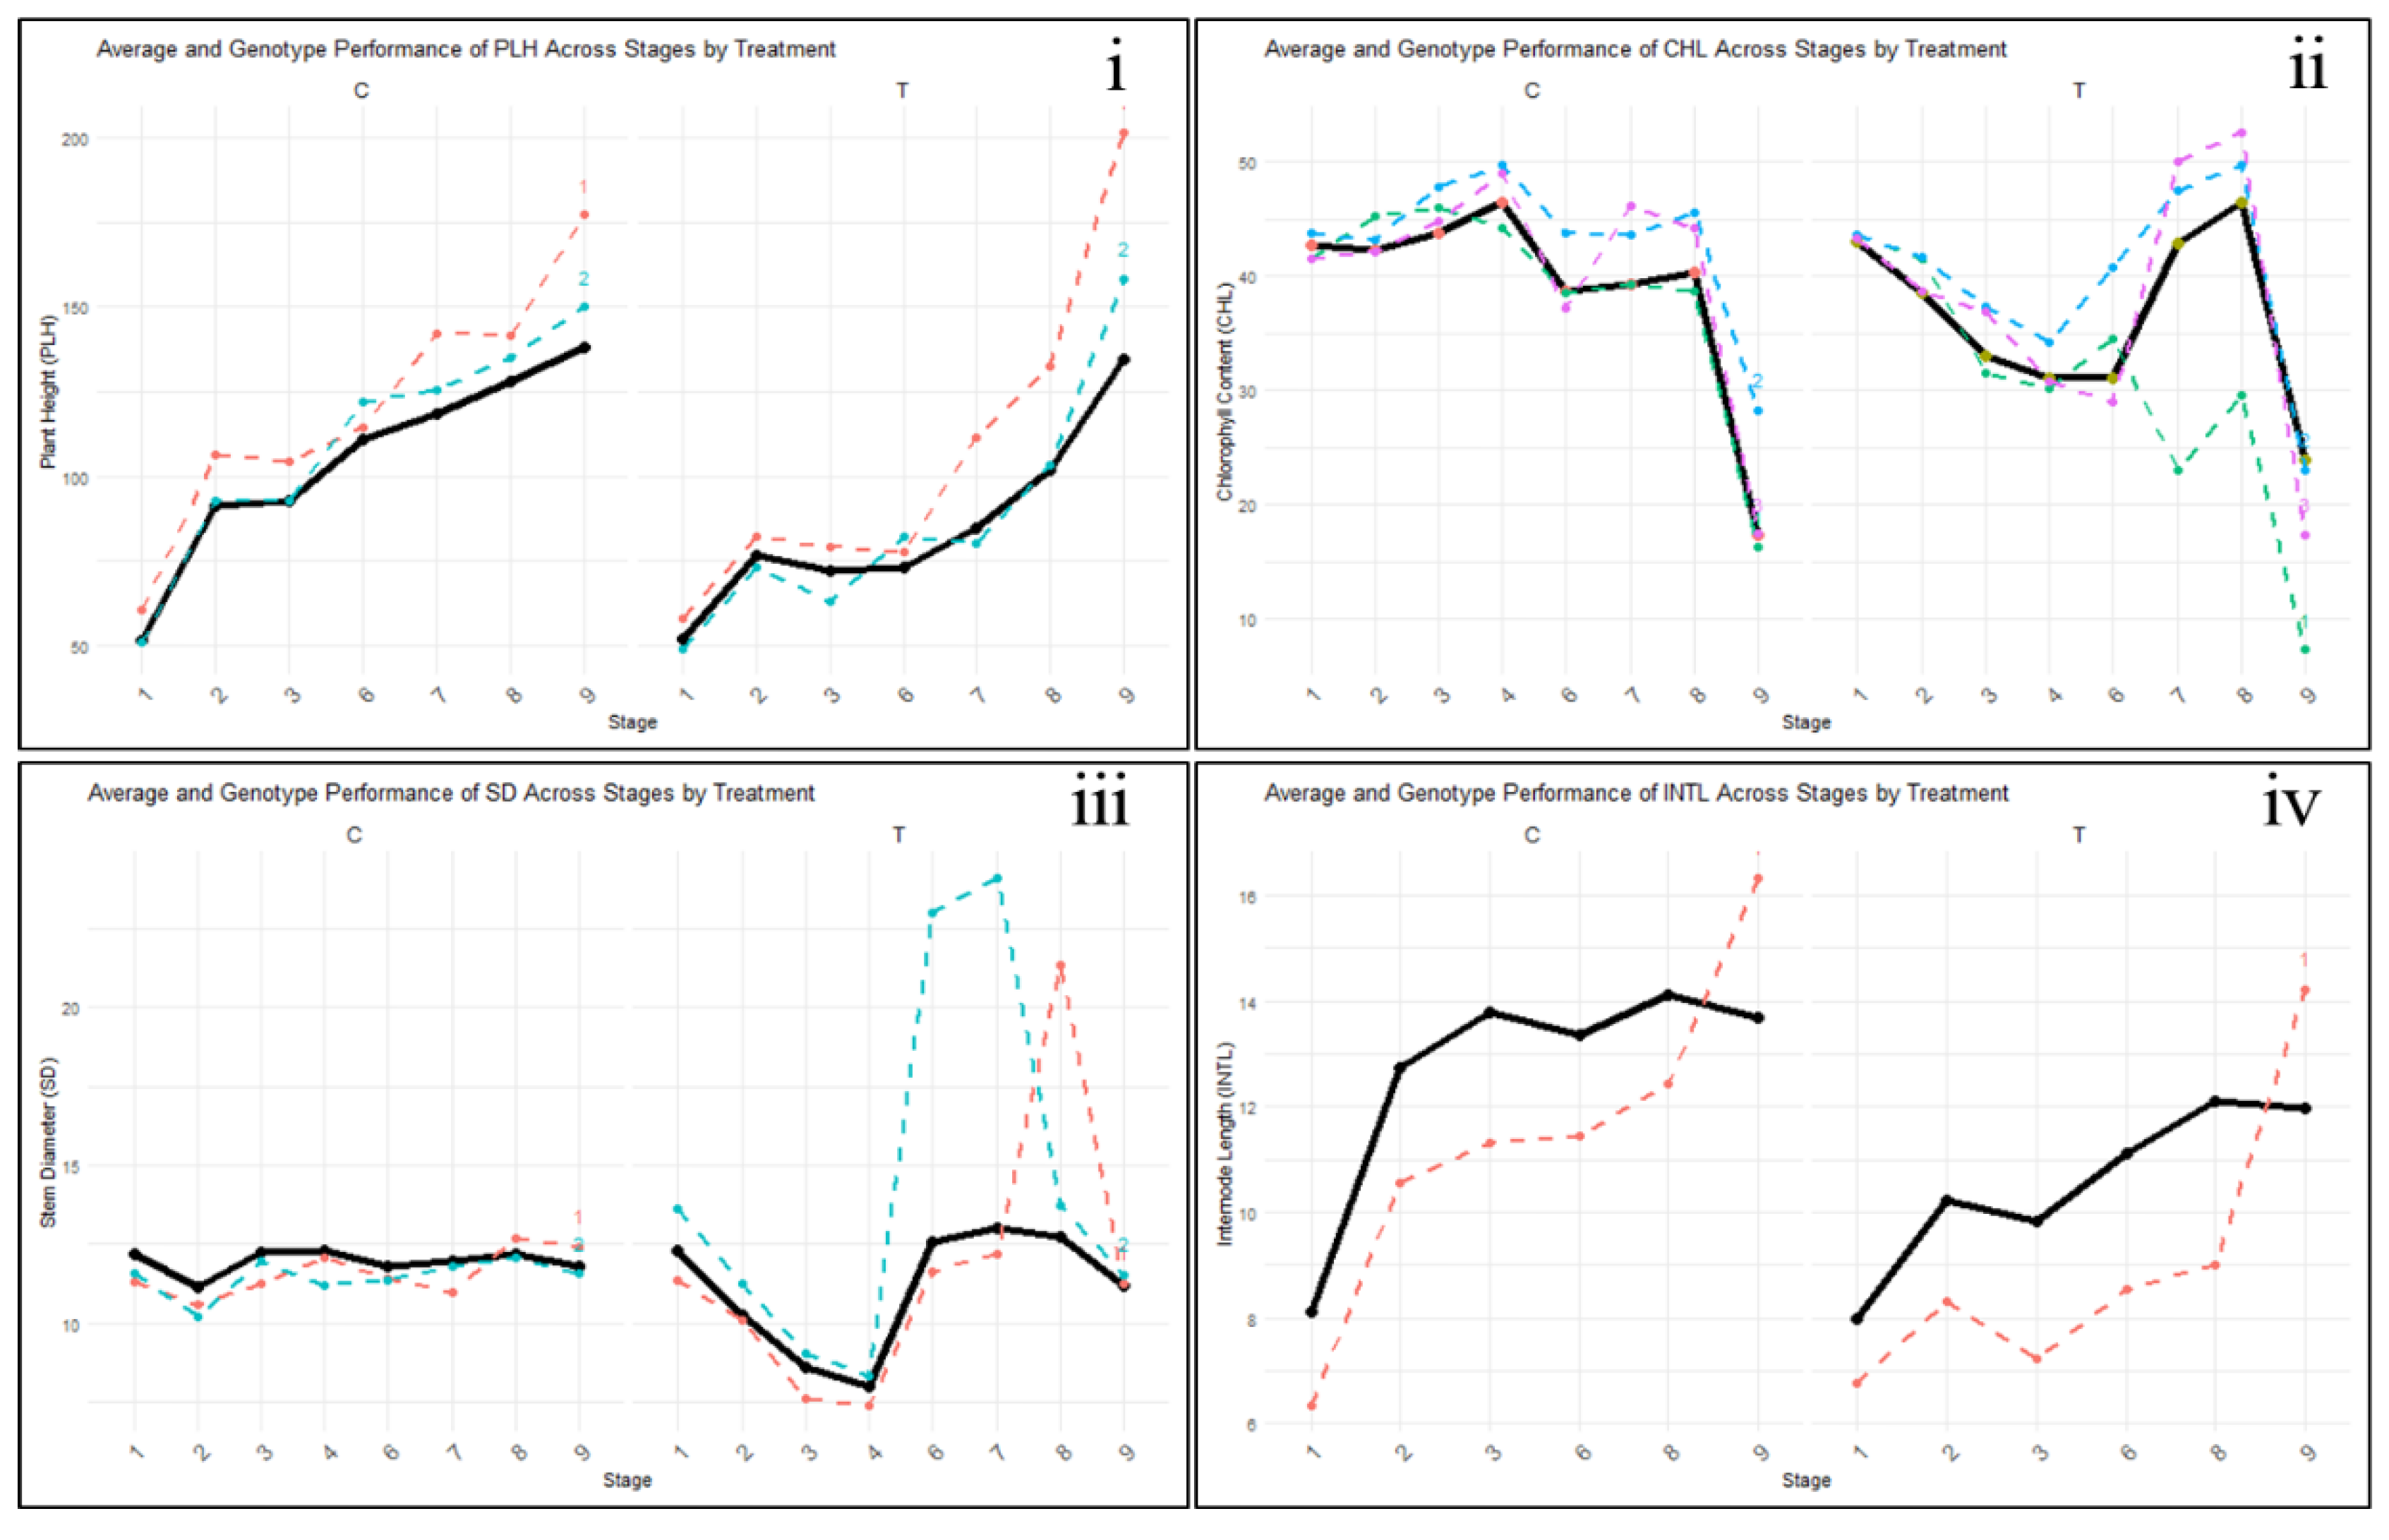
Figure 4.
Clustered biplots illustrating the grouping of traits and sorghum genotypes in A: stress-rewatering conditions and B: well-watered conditions. GRWt: Grain weight after threshing, PLWt: Dry weight of harvest from a pot, HSW: 100-seed weight, SD: Stem diameter, LAR: Leaf Area, LN: Leaf numbers, INTL: Internode length, CHL: Chlorophyll content, PLH: Plant height, FLWD: Days to 50% flowering, EX: Panicle Exertion, PL: Panicle length, PW: Panicle Width, HI: Harvest index.
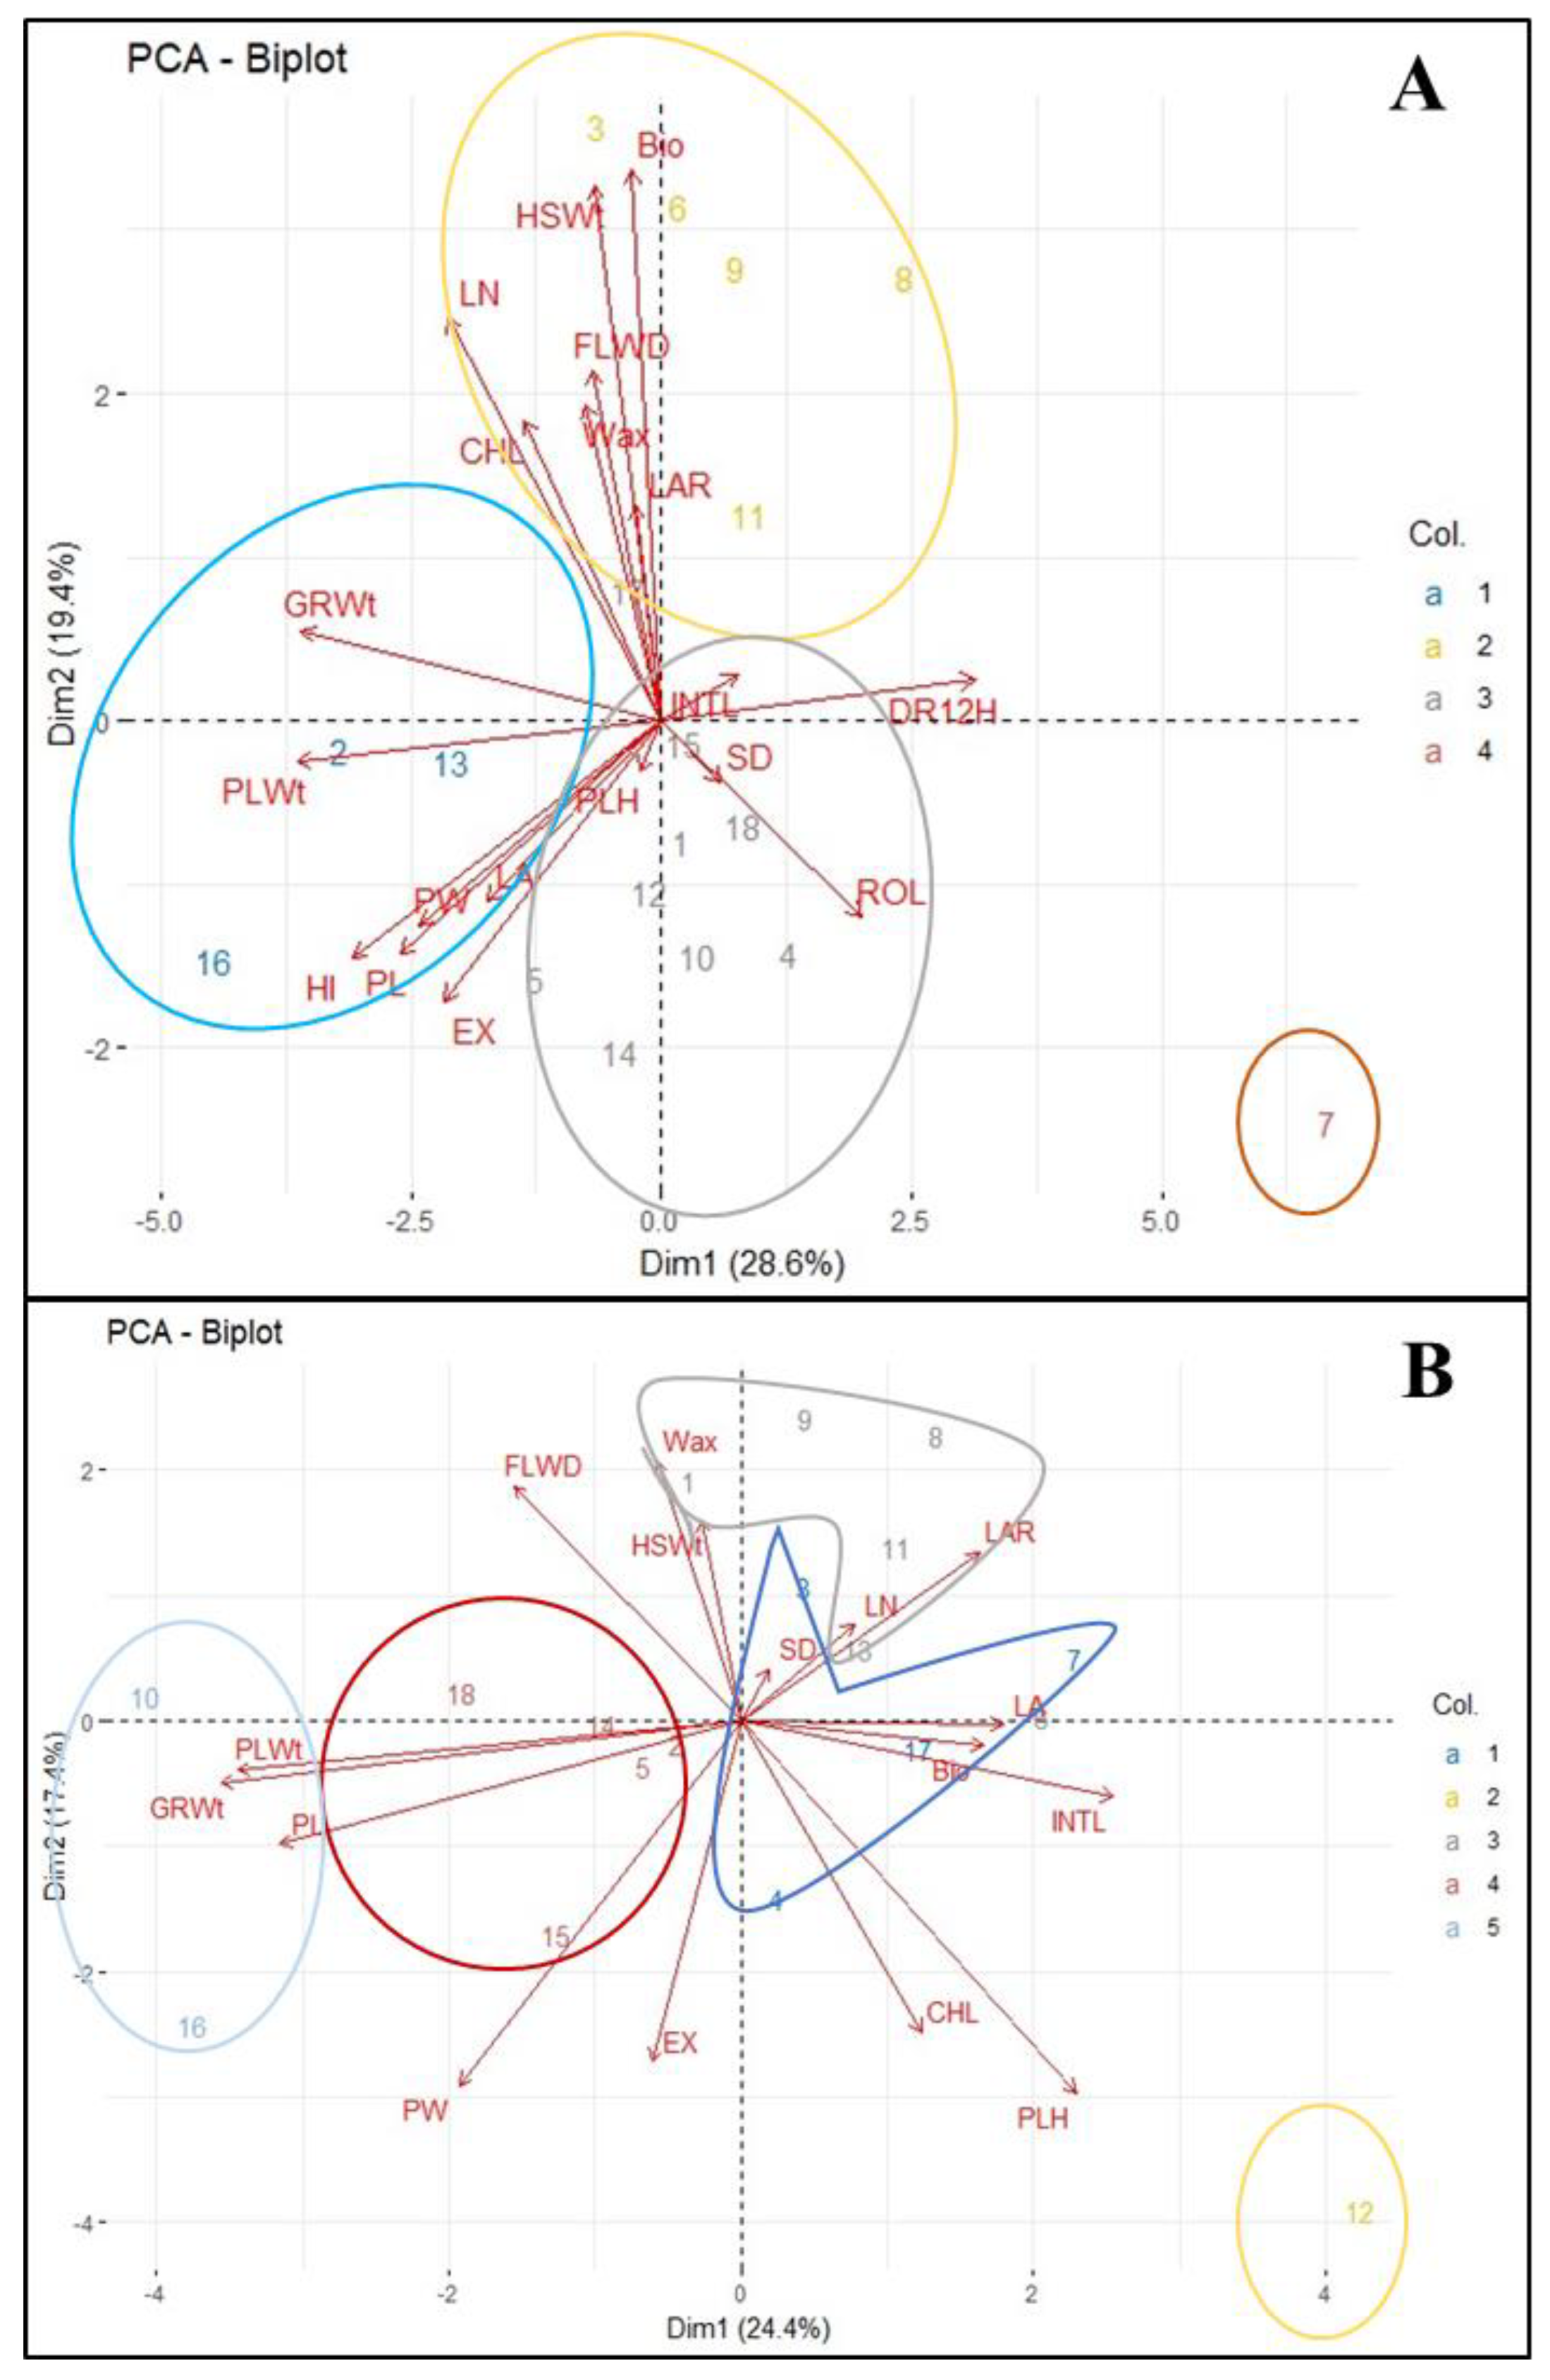

Table 1.
The 18 sorghum genotypes used in the study.
| Genotype | Source & Origin | Resistance level |
FLWD | |
|---|---|---|---|---|
| 1 | ICSX162719-1-4-1-1-1 | ICRISAT-Kenya | Resistant | 64 |
| 2 | ICSX152666-B-2-7-3-1-1-1 | ICRISAT- Kenya | Resistant | 66 |
| 3 | SSGA/RAP/349 | L.V (Karamoja)-Ug | Resistant | 64 |
| 4 | ASARECA13-1 x Framida -1-1-3-1/22B | B.L (NaSARRI)-Ug | Resistant | 69 |
| 5 | NAROSORGH1x NAROSORGH3-1-1-5-1/22B | B.L (NaSARRI)-Ug | Resistant | 60 |
| 6 | ASARECA13-1 x NAROSORGH3-1-1-1-1/22B | B.L (NaSARRI)-Ug | Resistant | 63 |
| 7 | ASARECA13-1x NAROSORGH3-1-1-5-1/22B | B.L (NaSARRI)-Ug | Resistant | 60 |
| 8 | NAROSORGH4 (positive check) | Variety-Ug | Resistant | 62 |
| 9 | MAZDA 105 Enyankore | L.V (Masindi)-Ug | Mod. Resistant | 60 |
| 10 | NAROSORGH1x FRAMIDA-1-1-5-1/22B | B.L (NaSARRI)-Ug | Mod. Resistant | 61 |
| 11 | NAROSORGH1xNAROSORGH1-1-1-1-1 /22B | B.L (NaSARRI)-Ug | Mod. Resistant | 60 |
| 12 | ICSX 152005-SB-5-3-2-1 | ICRISAT- Kenya | Mod. Resistant | 63 |
| 13 | ETEREMA (negative check) | L.V (Teso)-Ug | Susceptible | 61 |
| 14 | NAROSORGH1x NAROSORGH3-1-1-1-1/22B | B.L (NaSARRI)-Ug | Susceptible | 62 |
| 15 | IESV 214006DL | ICRISAT- Ethiopia | Susceptible | 66 |
| 16 | ICSV 142001 | ICRISAT- India | Susceptible | 59 |
| 17 | GE16/2/20B x IESV92041SH (SSEA 18B#6) | B.L (NaSARRI)-Ug | Susceptible | 64 |
| 18 | IESV16 143-1-3-1 | Ethiopia | Susceptible | 60 |
FLWD: Days to 50% flowering, Mod: Moderately, L.V: Land race variety, B.L: Breeding line, Ug: Uganda.
Table 2.
Drought recovery indices for internode length, chlorophyll content, stem diameter and plant height across the different genotypes.
Table 2.
Drought recovery indices for internode length, chlorophyll content, stem diameter and plant height across the different genotypes.
| Drought Recovery Index (DRI) | ||||
|---|---|---|---|---|
| Genotypes | INTL | CHL | SD | PLH |
| ASARECA 13-1 x Framida -1-1-3-1/22B | -0.35 | 0.09 | 0.20 | -0.46 |
| ASARECA 13-1 x NAROSORGH3-1-1-1-1/22B | -0.31 | -0.09 | -0.30 | -0.50 |
| ASARECA13-1 x NAROSORGH3-1-1-5-1/22B | -0.37 | 0.01 | 0.28 | -0.30 |
| ETEREMA | -0.11 | -0.08 | -0.22 | -0.37 |
| GE16/2/20B x IESV92041SH (SSEA 18B#6) | -0.30 | 0.03 | -0.31 | -0.35 |
| ICSV 142001 | -0.39 | 0.02 | -0.07 | -0.27 |
| ICSX 152005-SB-5-3-2-1 | -0.10 | -0.40 | -0.13 | -0.28 |
| ICSX 162719-1-4-1-1-1 | -0.25 | 0.09 | -0.26 | -0.33 |
| ICSX152666-B-2-7-3-1-1-1 | -0.32 | 0.04 | -0.21 | -0.17 |
| IESV 214006DL | -0.35 | -0.05 | -0.05 | -0.11 |
| IESV16 143-1-3-1 | -0.22 | 0.11 | -0.25 | -0.20 |
| MAZDA 105 Enyankore | -0.32 | -0.03 | -0.02 | -0.47 |
| NAROSORGH 1 x FRAMIDA-1-1-5-1/22B | -0.27 | 0.13 | -0.22 | -0.18 |
| NAROSORGH 4 | -0.25 | 0.00 | -0.15 | -0.33 |
| NAROSORGH1 x NAROSORGH1-1-1-1-1 /22B | -0.15 | -0.02 | -0.01 | -0.27 |
| NAROSORGH1 x NAROSORGH3-1-1-5-1/22B | -0.28 | 0.07 | -0.16 | -0.43 |
| NAROSORGH1 x NAROSORGH3 -1-1-1-1/22B | -0.29 | 0.07 | -0.19 | -0.40 |
| SSGA/RAP/349 | -0.48 | -0.04 | -0.12 | -0.60 |
INTL: Internode length, CHL: Chlorophyll content, SD: Stem diameter, PLH: Plant height.
Table 3.
Correlation coefficients between the different drought tolerance and susceptibility indices.
Table 3.
Correlation coefficients between the different drought tolerance and susceptibility indices.
| Ys | Yp | SSI | GM | TOL | MP1 | YSI | HM | STI | YI | MB | GMB | BI | BSI | |
|---|---|---|---|---|---|---|---|---|---|---|---|---|---|---|
| Ys | 1 | |||||||||||||
| Yp | 0.58* | 1 | ||||||||||||
| SSI | -0.68** | 0.16 | 1 | |||||||||||
| GM | 0.92*** | 0.85*** | -0.37 | 1 | ||||||||||
| TOL | -0.12 | 0.74*** | 0.75*** | 0.28 | 1 | |||||||||
| MP1 | 0.84*** | 0.93*** | -0.2 | 0.98*** | 0.44 | 1 | ||||||||
| YSI | 0.68** | -0.16 | -1*** | 0.37 | -0.75*** | 0.2 | 1 | |||||||
| HM | 0.96*** | 0.77*** | -0.48* | 0.99*** | 0.14 | 0.95*** | 0.48* | 1 | ||||||
| STI | 0.96*** | 0.77*** | -0.48* | 0.99*** | 0.14 | 0.95*** | 0.48* | 1*** | 1 | |||||
| YI | 1*** | 0.58* | -0.68** | 0.92*** | -0.12 | 0.84*** | 0.68** | 0.96*** | 0.96*** | 1 | ||||
| MB | 0.29 | -0.23 | -0.6** | 0.1 | -0.53* | -0.02 | 0.6** | 0.18 | 0.18 | 0.29 | 1 | |||
| GMB | 0.27 | -0.24 | -0.58* | 0.08 | -0.52* | -0.04 | 0.58* | 0.15 | 0.15 | 0.27 | 0.98*** | 1 | ||
| BI | 0.18 | -0.2 | -0.42 | 0.04 | -0.39 | -0.05 | 0.42 | 0.1 | 0.1 | 0.18 | 0.79*** | 0.88*** | 1 | |
| BSI | 0.08 | -0.08 | -0.16 | 0.02 | -0.16 | -0.02 | 0.16 | 0.05 | 0.05 | 0.08 | 0.4 | 0.53* | 0.87*** | 1 |
Ys: Grain yield under stress, Yp: Grain yield under well watering, GM: Geometric mean, SSI: Stress Susceptibility index, TOL: Tolerance, MPI: Mean productivity Index, YSI: Yield Stability Index, HM: Harmonic Mean, STI: Stress tolerance Index, YI: Yield Index, MB: Mean biomass, GMB: Geometric mean biomass, BI: Biomass index, BSI: Biomass stability index.
Table 4.
Ranking of sorghum genotypes based on grain yield-related indices.
| Genotype’s rank (R) for each index | ||||||||||||
|---|---|---|---|---|---|---|---|---|---|---|---|---|
| DESIGNATION | GM | SSI | TOL | TOL | YSI | HM | STI | YI | Ṝ | σ R | Σ R | F.R |
| GE16/2/20B X IESV92041SH (SSEA 18B#6) | 3 | 5 | 9 | 5 | 5 | 3 | 3 | 3 | 4.50 | 2.07 | 6.57 | 1 |
| NAROSORGH1 X NAROSORGH3 -1-1-1-1/22B | 6 | 7 | 7 | 6 | 7 | 5 | 5 | 5 | 6.00 | 0.93 | 6.93 | 2 |
| ICSX152666-B-2-7-3-1-1-1 | 8 | 6 | 6 | 8 | 6 | 7 | 7 | 6 | 6.75 | 0.89 | 7.64 | 3 |
| NAROSORGH 1 X FRAMIDA-1-1-5-1/22B | 7 | 2 | 2 | 11 | 2 | 6 | 6 | 4 | 5.00 | 3.16 | 8.16 | 4 |
| ASARECA 13-1 X NAROSORGH3-1-1-1-1/22B | 2 | 8 | 12 | 3 | 8 | 2 | 2 | 2 | 4.88 | 3.91 | 8.78 | 5 |
| ASARECA 13-1 X Framida -1-1-3-1/22B | 10 | 10 | 10 | 9.5 | 10 | 8 | 8 | 9 | 9.31 | 0.88 | 10.20 | 6 |
| ICSV 142001 | 11 | 9 | 8 | 12 | 9 | 11 | 11 | 10.5 | 10.19 | 1.36 | 11.55 | 7 |
| NAROSORGH1 X NAROSORGH3-1-1-5-1/22B | 1 | 11 | 16 | 1 | 11 | 1 | 1 | 1 | 5.38 | 6.23 | 11.61 | 8 |
| NAROSORGH 4 ( Resistant check) | 9 | 12 | 13 | 7 | 12 | 9 | 9 | 10.5 | 10.19 | 2.03 | 12.22 | 9 |
| ASARECA13-1 X NAROSORGH3-1-1-5-1/22B | 13 | 4 | 4 | 13 | 4 | 12 | 12 | 8 | 8.75 | 4.23 | 12.98 | 10 |
| IESV16 143-1-3-1 | 14 | 3 | 3 | 14 | 3 | 13 | 13 | 7 | 8.75 | 5.26 | 14.01 | 11 |
| SSGA/RAP/349 | 12 | 15 | 15 | 9.5 | 15 | 14 | 14 | 15 | 13.69 | 1.98 | 15.67 | 12 |
| IESV 214006DL | 4 | 16 | 18 | 2 | 16 | 4 | 4 | 12 | 9.50 | 6.65 | 16.15 | 13 |
| ICSX 162719-1-4-1-1-1 | 16 | 14 | 11 | 15 | 14 | 16 | 16 | 17 | 14.88 | 1.89 | 16.76 | 14 |
| MAZDA 105 Enyankore | 15 | 1 | 1 | 16 | 1 | 15 | 15 | 13 | 9.63 | 7.19 | 16.82 | 15 |
| NAROSORGH1 X NAROSORGH1-1-1-1-1 /22B | 5 | 17 | 17 | 4 | 17 | 10 | 10 | 14 | 11.75 | 5.34 | 17.09 | 16 |
| ETEREMA ( Susceptible Check) | 17 | 13 | 5 | 17 | 13 | 17 | 17 | 16 | 14.38 | 4.17 | 18.55 | 17 |
| ICSX 152005-SB-5-3-2-1 | 18 | 18 | 14 | 18 | 18 | 18 | 18 | 18 | 17.50 | 1.41 | 18.91 | 18 |
GM: Geometric mean, SSI: Stress Susceptibility index, TOL: Tolerance, MPI: Mean productivity Index, YSI: Yield Stability Index, HM: Harmonic Mean, STI: Stress Tolerance Index, YI: Yield Index, Ṝ: Mean Rank, σ R: Standard deviation of Rank, Σ R: Rank sum, F.R: Final /overall ranking of the genotype.
Table 5.
Ranking of sorghum genotypes based on both grain and biomass yield-related indices.
| Genotype’s rank (R) for each index | |||||||||||||||||
|---|---|---|---|---|---|---|---|---|---|---|---|---|---|---|---|---|---|
| DESIGNATION | GM | SSI | TOL | MPI | YSI | HM | STI | YI | MB | GMB | BI | BSI | Ṝ | σ R | Σ R | F.R |
|
| ICSX152666-B-2-7-3-1-1-1 | 8 | 6 | 6 | 8 | 6 | 7 | 7 | 6 | 3 | 3 | 3 | 3 | 5.50 | 1.98 | 7.48 | 1 | |
| NAROSORGH1X NAROSORGH3 -1-1-1-1/22B | 6 | 7 | 7 | 6 | 7 | 5 | 5 | 5 | 10 | 10 | 11 | 16 | 7.92 | 3.29 | 11.20 | 2 | |
| ASARECA13-1 X NAROSORGH3-1-1-5-1/22B | 13 | 4 | 4 | 13 | 4 | 12 | 12 | 8 | 1 | 1 | 1 | 1 | 6.17 | 5.10 | 11.26 | 3 | |
| NAROSORGH 1 X FRAMIDA-1-1-5-1/22B | 7 | 2 | 2 | 11 | 2 | 6 | 6 | 4 | 7 | 9 | 10 | 17 | 6.92 | 4.42 | 11.34 | 4 | |
| ASARECA 13-1 X Framida -1-1-3-1/22B | 10 | 10 | 10 | 9.5 | 10 | 8 | 8 | 9 | 11 | 11 | 9 | 14 | 9.96 | 1.60 | 11.56 | 5 | |
| ICSV 142001 | 11 | 9 | 8 | 12 | 9 | 11 | 11 | 10.5 | 6 | 4 | 2 | 2 | 7.96 | 3.61 | 11.57 | 6 | |
| GE16/2/20B X IESV92041SH (SSEA 18B#6) | 3 | 5 | 9 | 5 | 5 | 3 | 3 | 3 | 15 | 15 | 13 | 9 | 7.33 | 4.74 | 12.07 | 7 | |
| ASARECA 13-1 X NAROSORGH3-1-1-1-1/22B | 2 | 8 | 12 | 3 | 8 | 2 | 2 | 2 | 5 | 6 | 14 | 18 | 6.83 | 5.37 | 12.21 | 8 | |
| NAROSORGH1 X NAROSORGH3-1-1-5-1/22B | 1 | 11 | 16 | 1 | 11 | 1 | 1 | 1 | 13 | 12 | 7 | 5 | 6.67 | 5.69 | 12.36 | 9 | |
| IESV16 143-1-3-1 | 14 | 3 | 3 | 14 | 3 | 13 | 13 | 7 | 9 | 7 | 6 | 4 | 8.00 | 4.47 | 12.47 | 10 | |
| NAROSORGH 4 ( Resistant check) | 9 | 12 | 13 | 7 | 12 | 9 | 9 | 10.5 | 14 | 14 | 15 | 12 | 11.38 | 2.48 | 13.85 | 11 | |
| MAZDA 105 Enyankore | 15 | 1 | 1 | 16 | 1 | 15 | 15 | 13 | 4 | 5 | 5 | 11 | 8.50 | 6.20 | 14.70 | 12 | |
| NAROSORGH1X NAROSORGH1-1-1-1-1 /22B | 5 | 17 | 17 | 4 | 17 | 10 | 10 | 14 | 8 | 8 | 8 | 10 | 10.67 | 4.58 | 15.25 | 13 | |
| SSGA/RAP/349 | 12 | 15 | 15 | 9.5 | 15 | 14 | 14 | 15 | 16 | 16 | 16 | 8 | 13.79 | 2.62 | 16.42 | 14 | |
| ICSX 162719-1-4-1-1-1 | 16 | 14 | 11 | 15 | 14 | 16 | 16 | 17 | 2 | 2 | 4 | 6 | 11.08 | 5.88 | 16.97 | 15 | |
| ETEREMA (Susceptible check) | 17 | 13 | 5 | 17 | 13 | 17 | 17 | 16 | 12 | 13 | 12 | 13 | 13.75 | 3.47 | 17.22 | 16 | |
| IESV 214006DL | 4 | 16 | 18 | 2 | 16 | 4 | 4 | 12 | 17 | 17 | 17 | 7 | 11.17 | 6.41 | 17.57 | 17 | |
| ICSX 152005-SB-5-3-2-1 | 18 | 18 | 14 | 18 | 18 | 18 | 18 | 18 | 18 | 18 | 18 | 15 | 17.42 | 1.38 | 18.80 | 18 | |
GM: Geometric mean, SSI: Stress Susceptibility index, TOL: Tolerance, MPI: Mean productivity Index, YSI: Yield Stability Index, HM: Harmonic Mean, STI: Stress tolerance Index, YI: Yield Index, MB: Mean biomass, GMB: Geometric mean biomass, BI: Biomass index, BSI: Biomass stability index, Ṝ: Mean Rank, σ R: Standard deviation of Rank, Σ R: Rank sum, F.R: Final/overall ranking of the genotype.
Table 6.
Best-performing genotypes for each category.
| GROUP | GENOTYPE |
|---|---|
| Stress and non-stress (A) | GE16/2/20B x IESV92041SH (SSEA 18B#6) |
| NAROSORGH1 xNAROSORGH3 -1-1-1-1/22B | |
| ICSX152666-B-2-7-3-1-1-1 | |
| NAROSORGH 1 x FRAMIDA-1-1-5-1/22B | |
| ASARECA 13-1 x NAROSORGH3-1-1-1-1/22B | |
| ASARECA 13-1 x Framida -1-1-3-1/22B | |
| Non-stress conditions (B) | NAROSORGH1 x NAROSORGH3-1-1-5-1/22B |
| IESV 214006DL | |
| NAROSORGH1 x NAROSORGH1-1-1-1-1 /22B | |
| ASARECA 13-1 x NAROSORGH3-1-1-1-1/22B | |
| SSGA/RAP/349 | |
| Stress conditions (C) | NAROSORGH1 x NAROSORGH3-1-1-5-1/22B |
| ASARECA 13-1 x NAROSORGH3-1-1-1-1/22B | |
| GE16/2/20B x IESV92041SH (SSEA 18B#6) | |
| NAROSORGH 1 x FRAMIDA-1-1-5-1/22B | |
| NAROSORGH1 x NAROSORGH3 -1-1-1-1/22B | |
| ICSX152666-B-2-7-3-1-1-1 | |
| Poor performer in both (D) stress and non-stress (D) |
ICSX 152005-SB-5-3-2-1 |
Disclaimer/Publisher’s Note: The statements, opinions and data contained in all publications are solely those of the individual author(s) and contributor(s) and not of MDPI and/or the editor(s). MDPI and/or the editor(s) disclaim responsibility for any injury to people or property resulting from any ideas, methods, instructions or products referred to in the content. |
© 2025 by the authors. Licensee MDPI, Basel, Switzerland. This article is an open access article distributed under the terms and conditions of the Creative Commons Attribution (CC BY) license (http://creativecommons.org/licenses/by/4.0/).
Copyright: This open access article is published under a Creative Commons CC BY 4.0 license, which permit the free download, distribution, and reuse, provided that the author and preprint are cited in any reuse.


