Preprint
Article

This version is not peer-reviewed.

Yield Stability of Drought Tolerant Sorghum [Sorghum bicolor (L.) Moench] Genotypes in Southern and Western Parts of Ethiopia

Submitted:

24 November 2024

Posted:

26 November 2024

You are already at the latest version

Abstract

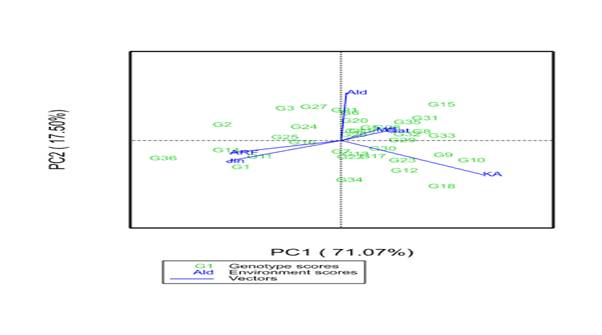
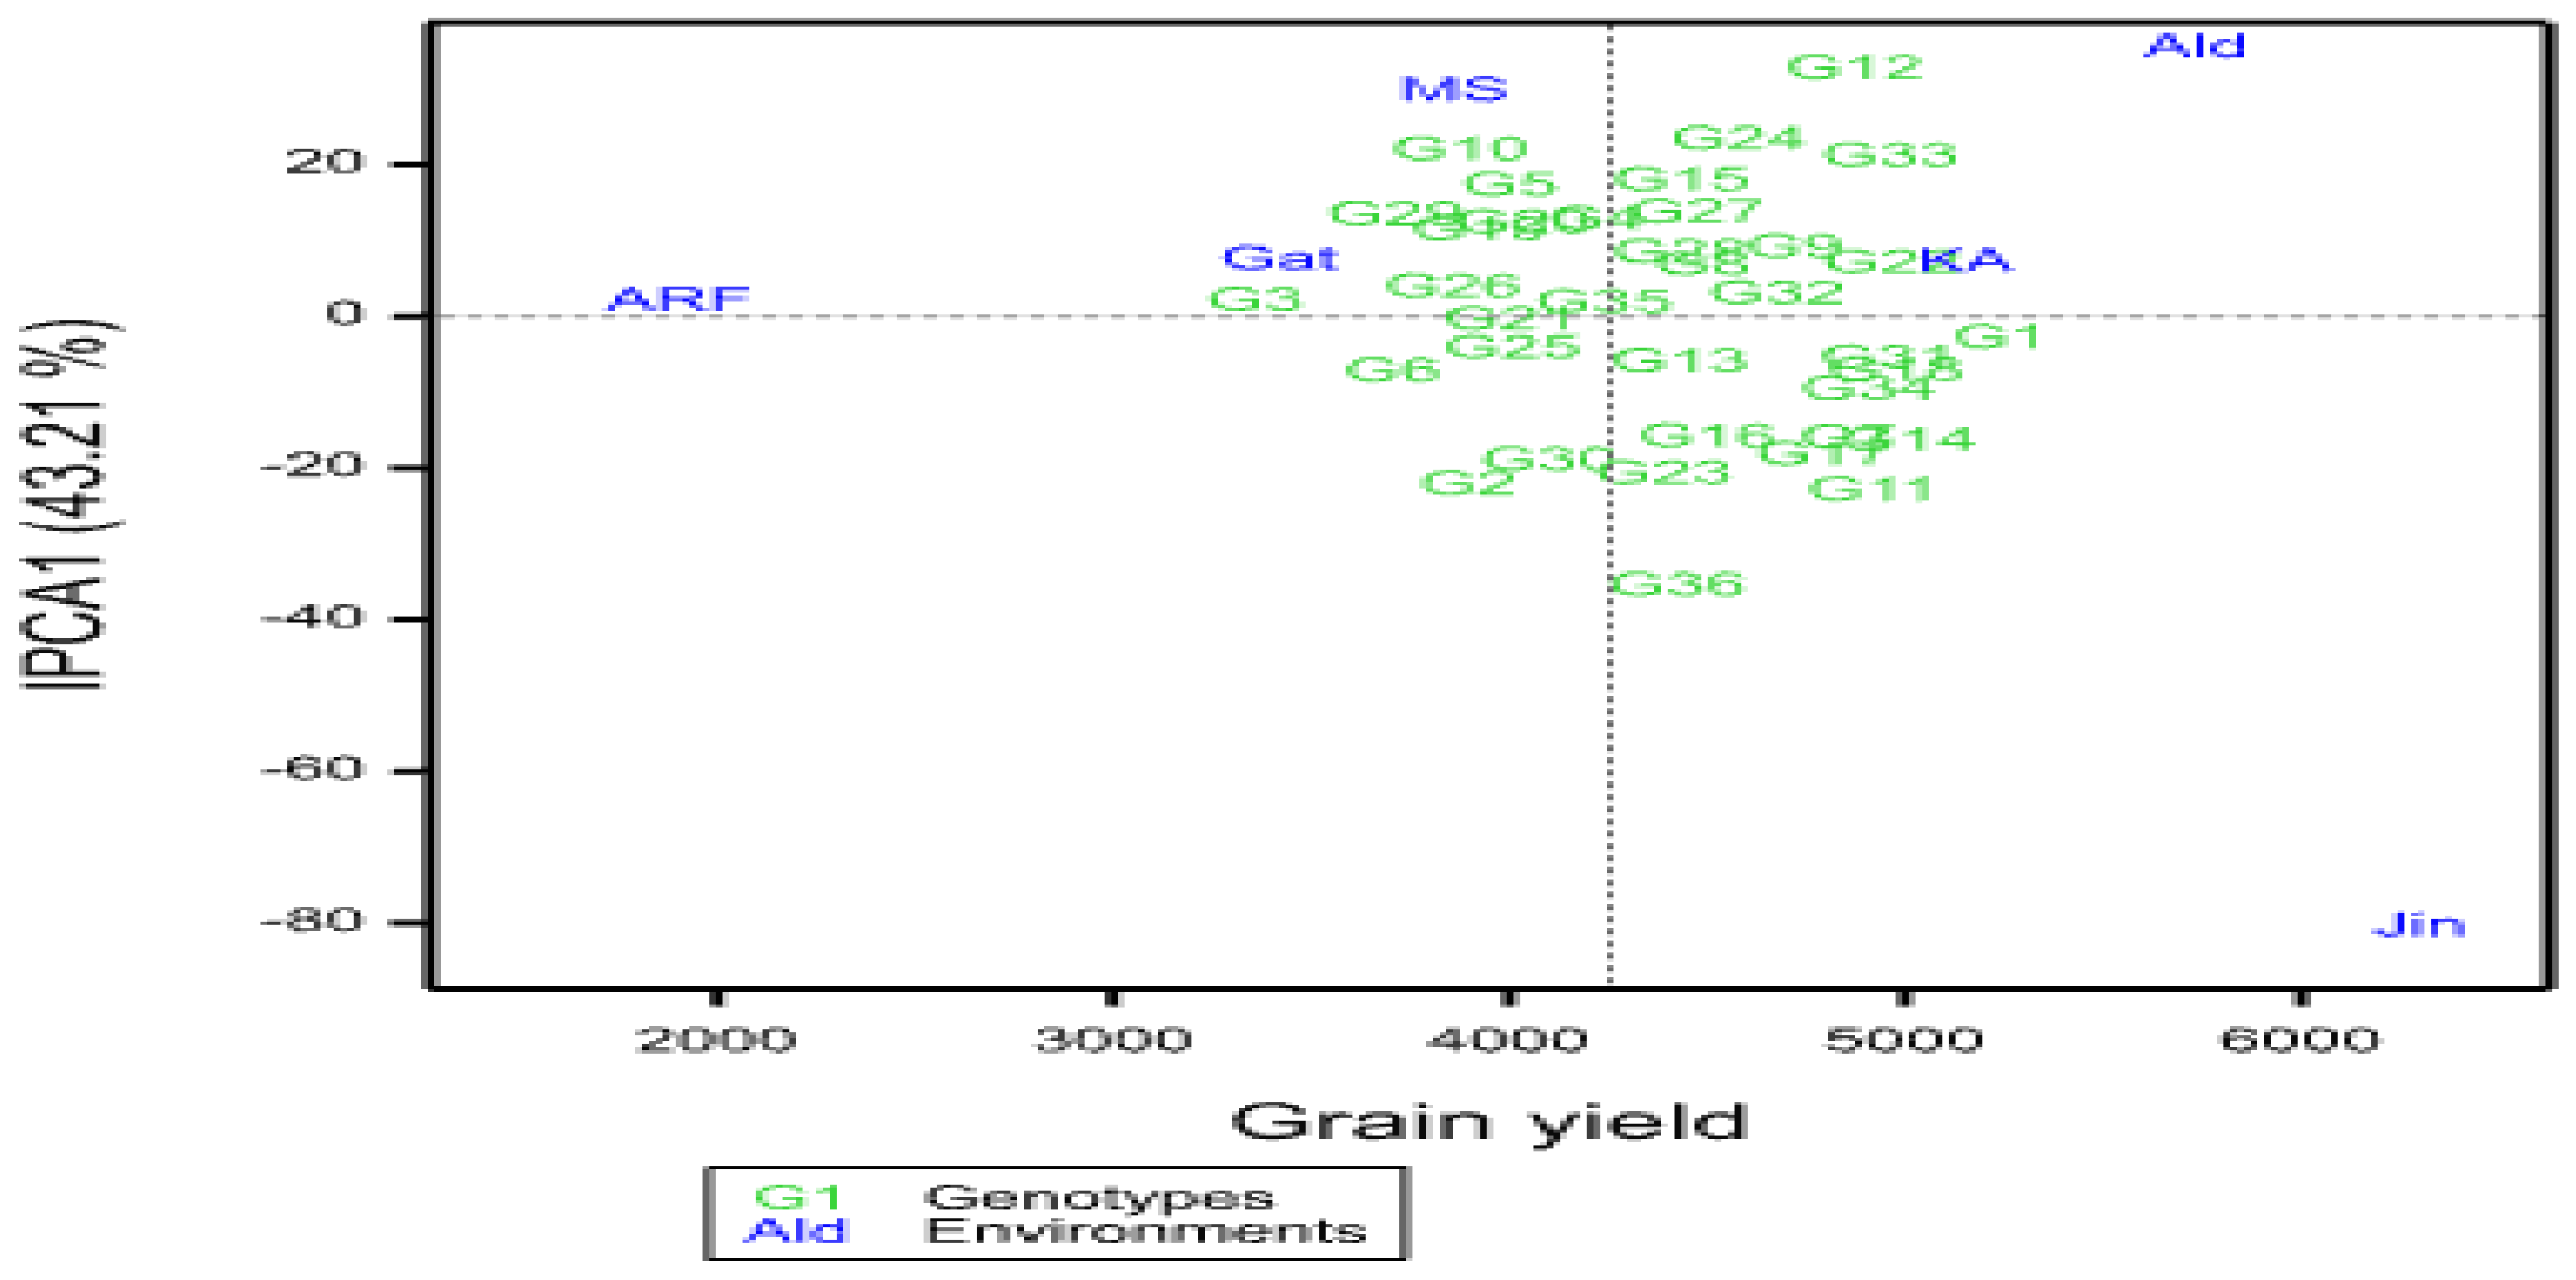
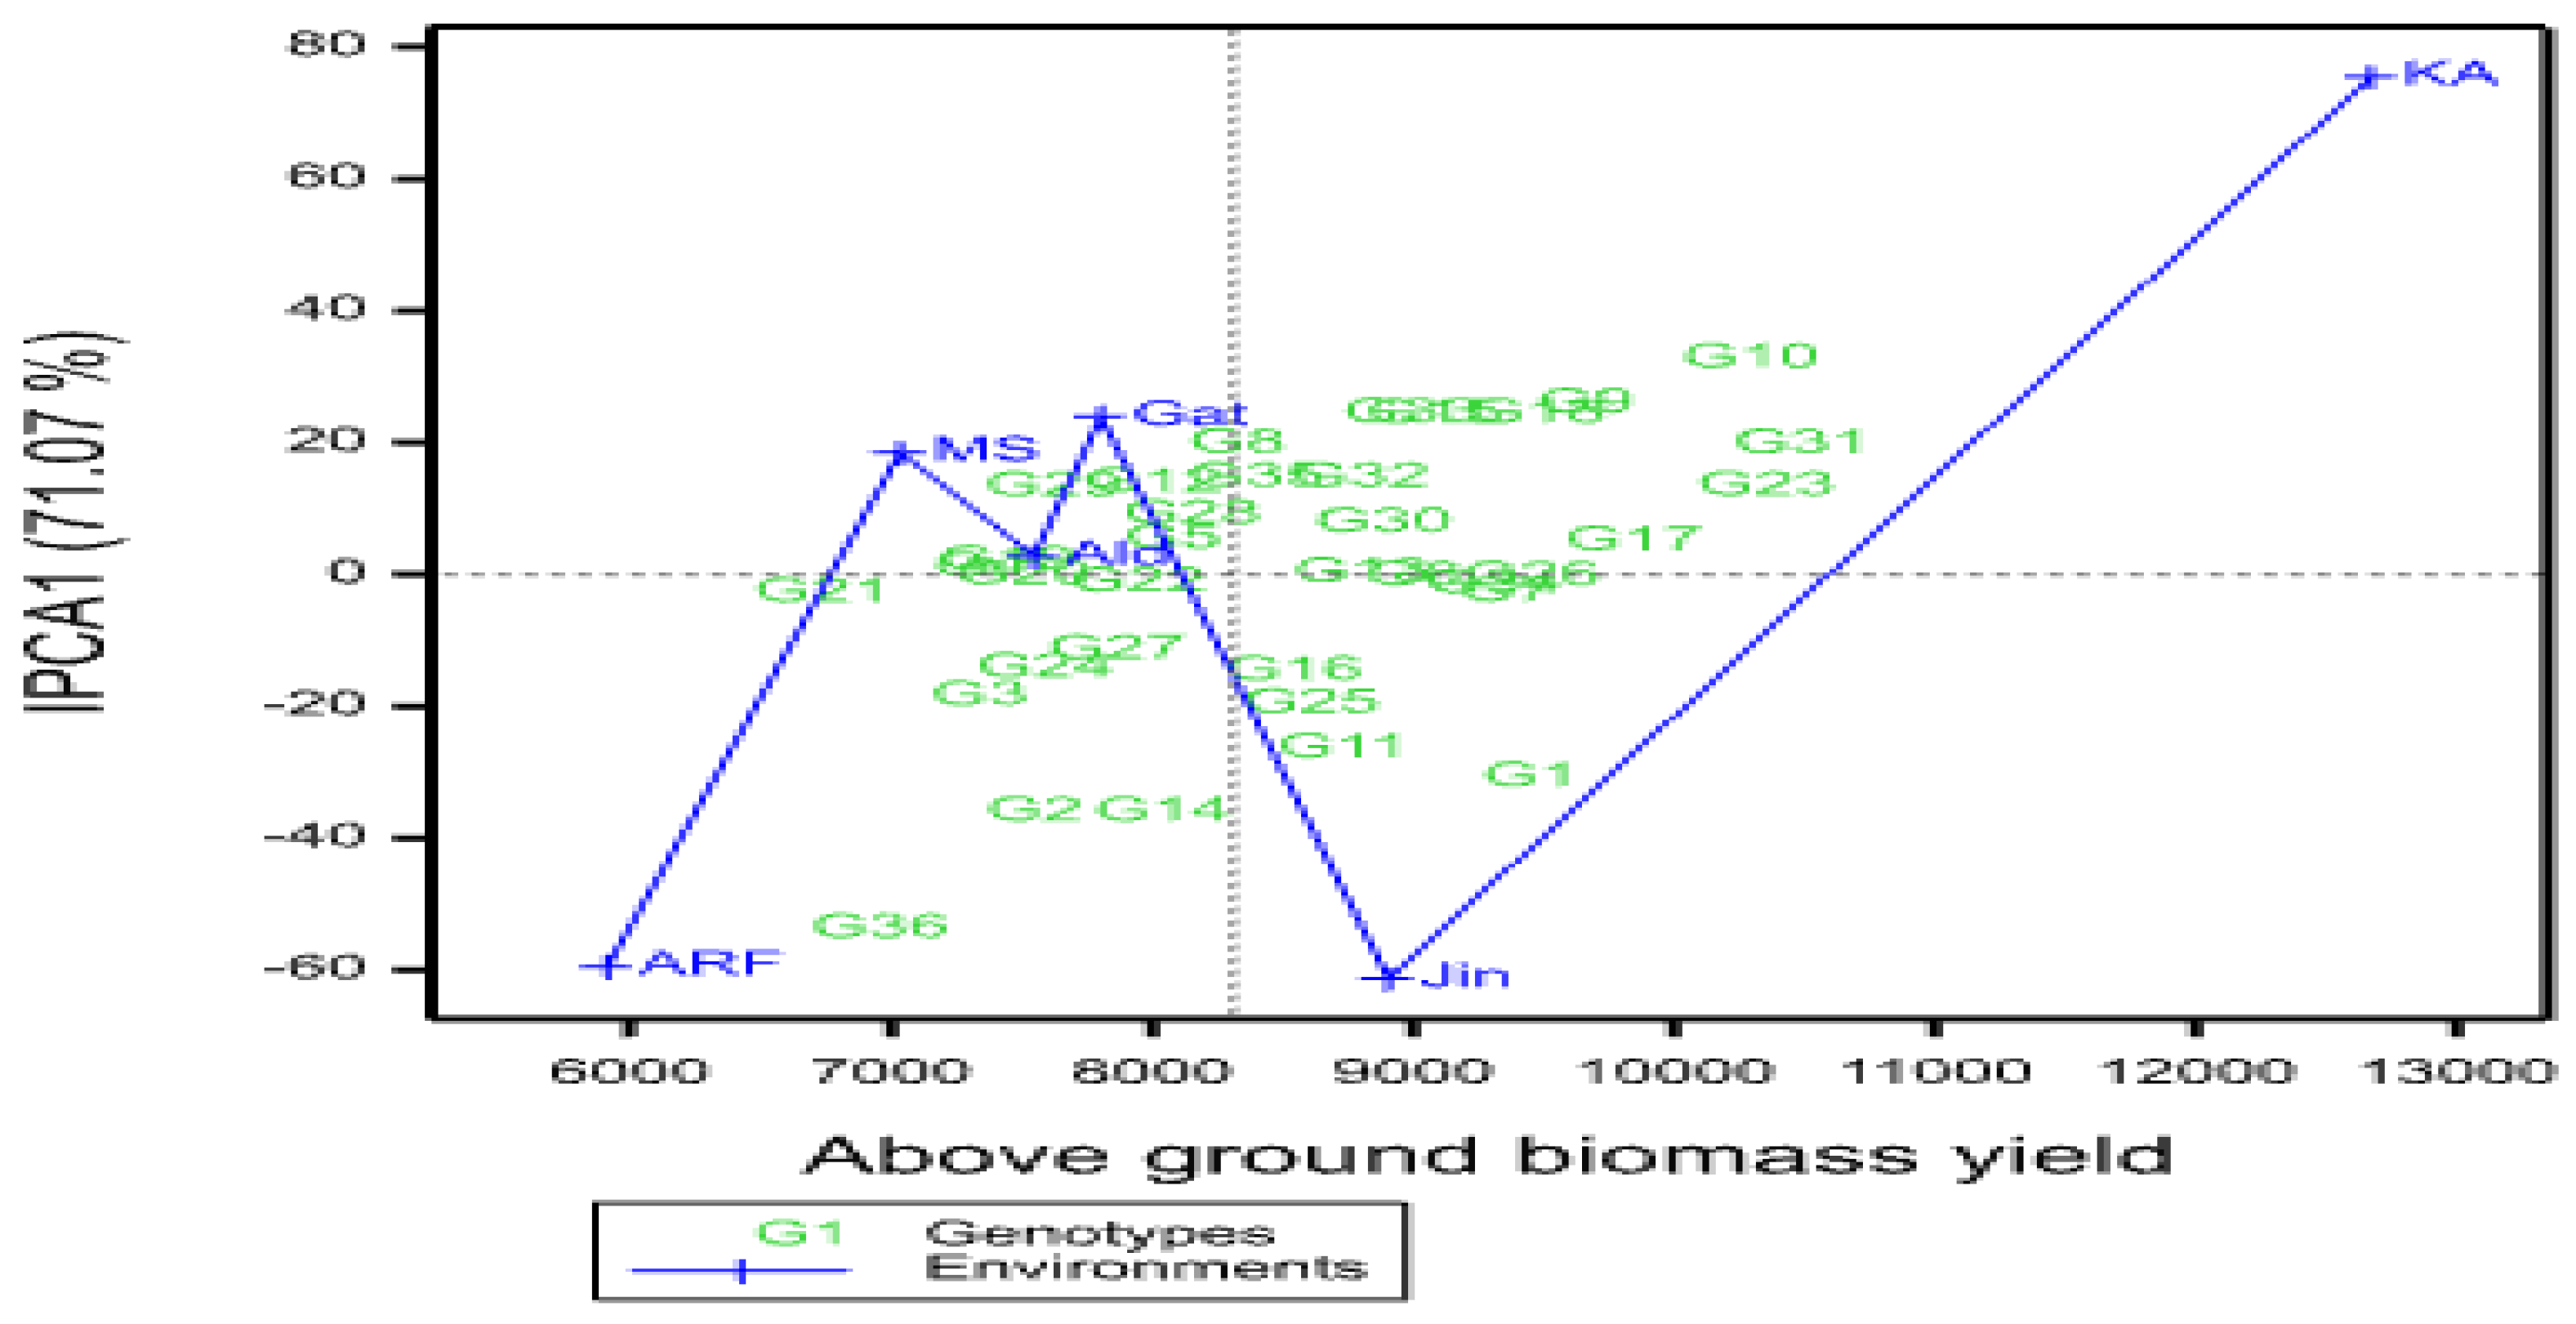
A multi-environment evaluation of sorghum genotypes was conducted across six environments in the 2021 main growing season in a randomized complete block design with three replications. The objectives of the study were to estimate the magnitude of genotypes by environment interaction (GEI) and grain yield stability of drought-tolerant sorghum genotypes across different environments. Data were subjected to analysis of variance, Additive Main Effects and Multiplicative Interaction (AMMI), and GGE biplot analysis. Combined analysis of variance revealed significant variations among genotypes, environments, and GEI for yield and yield-related traits, indicating that these factors significantly affected grain yield. The maximum mean grain yield value of genotypes due to the mean effect of the environment was obtained from G1 (5119.93kg ha-1), followed by G14 (4834.57 kg ha-1), and G18 (4801.20 ha-1), while the least mean grain yield was obtained from G3 (3314.50 kg ha-1). The multiplicative variance of the treatment sum of squares due to GEI was partitioned into four principal component axes (PCA). Sum squares of the first and second interaction principal component axis (IPCA) explained 71.07% and 17.50% of the GEI variation, respectively. The IPCA1&2 mean squares were highly significant (P≤0.01), indicating the adequacy of the AMMI model with the first two IPCAs for cross-validation of grain yield variation. The magnitude of the GEI sum squares was 3.9 times that of the genotype sum squares for grain yield, indicating the presence of substantial differences in genotypic responses across environments. The results of cultivar superiority measure (Pi), yield stability index (YSI), AMMI stability value (ASV), regression coefficient (bi), and deviation from regression (S2di) depicted that genotypes G18, G22, G31, and 32 were the most stable genotypes for grain yield and biomass yield, respectively. AMMI2 biplot showed Jinka, Alduba, and Kako were the most discriminating environments as indicated by the long distance from the origin; whereas testing locations Meioso and Gato with short vector length indicated that these locations had less discriminating power on the genotypes' performance. The study has provided precious information on the yield stability status of the sorghum genotypes and the best environments for future improvement programs in Ethiopia.

Keywords: 
;  ;  ;  

1. Introduction

Sorghum [Sorghum bicolor (L.) Monech ] is the fifth most important cereal crop in the world, after wheat, rice, maize, and barley [1]. It is a C4 plant that has high photosynthetic efficiency and originated in the Ethiopian region [2]. Multi-environment trials are used to select the best-performing genotype for different locations and environmental conditions. Plant breeders need to identify drought-tolerant genotypes with stable yield performance in various environments. Developing countries require stable cultivars with high yields.
In Ethiopia, several studies have been conducted to investigate the interaction between genotype and environment when it comes to crops like sorghum [3,4,5,6,7], maize [8,9], wheat [10], teff [11], and finger millet [12]. However, there is limited information available on the impact of genotype, environment, and GEI on sorghum yield using drought-tolerant genotypes in Ethiopia. To address this gap, a study was carried out to determine the extent of the effect of genotypes by environment interaction and to assess the performance and stability of drought-tolerant sorghum genotypes that show promise for adaptation to different conditions and cultivation under farmers’ conditions in Ethiopia. Yield Stability of Drought Tolerant Sorghum [Sorghum bicolor (L.) Moench] Genotypes in Southern and Western Ethiopia

2. Materials and Methods

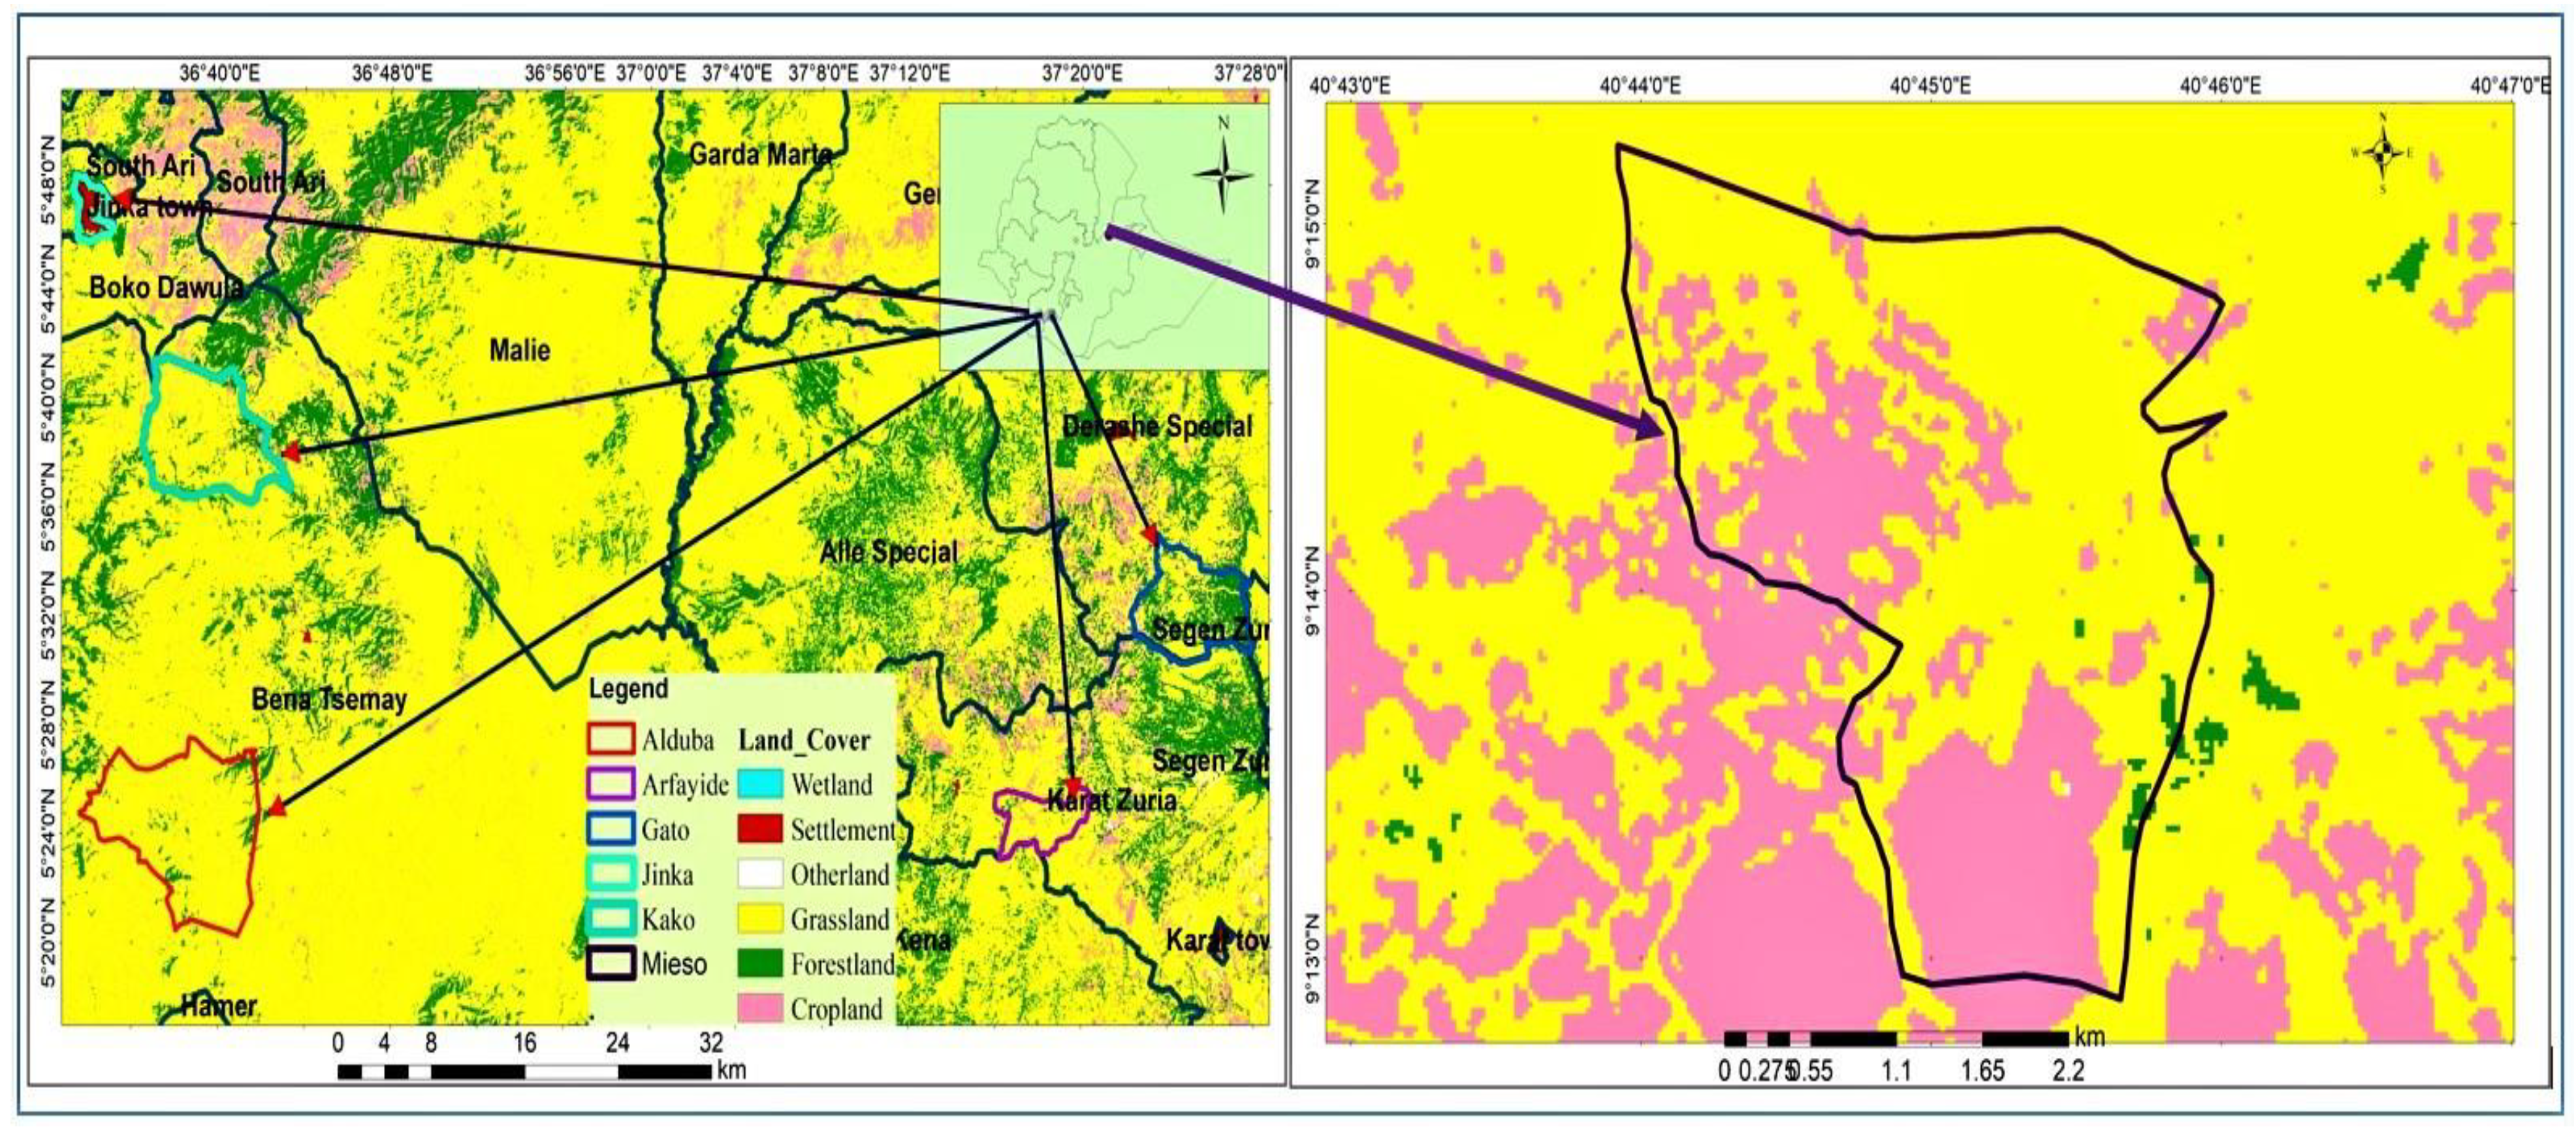
2.1. Description of the study area

The experiment was conducted at six locations during the 2021 main cropping season. These locations represent the main lowland sorghum-growing areas of the country (Figure 1).
Figure 1. Study area map. Different colors designate land cover of study locations.
Preprints 140664 g001

2.2. Trial Materials

Thirty-four genotypes were selected based on their drought performance from the moisture stress trial conducted at Weoito(Appendix Tables 1 and 2), and two standard check varieties were included. A list of genotypes used for genotype-by-environment experiments is provided in (Table 1).

2.2.3. Experimental Design and Procedures

The experiment used randomized complete block design with three replications at all locations with plot size of 3.75mX5m. Seeds were drilled into 5-meter-long paired rows spaced 0.75 meters apart. Weeds were removed from the plots 2-3 weeks after sowing. The seed rate was 15 kg/ha, and plots received NPS fertilizer at planting (19 kg/ha N, 38 kg/ha P2O5, and 7 kg/ha S), with an additional 23 kg/ha of nitrogen in the form of urea applied at 45 days after planting. Data was collected from the four middle rows.

2.2.4. Data Collection

Data was collected on sorghum based on descriptors developed by the International Board for Plant Genetic Resources [13]. At maturity, yield components were recorded, including panicle length, panicle weight, panicle yield, and thousand kernel weight. Data was collected on a plot basis and plant basis, including measurements of straw weight, grain yield, total biomass, harvest index, and panicle weight.

2.2.5. Data Analyses

Various statistical software packages were used to analyze the data. SAS software 9.0 was used for combined analyses of variance and mean comparison with the LSD test [14]. Additionally, GEA-R Version 4.1 was used for several analyses, including AMMI analysis and GGE biplot stability analysis [15].

2.2.5.1. Analysis of Variance for Individual Location and Combined Data Over the Location

The data from different locations were analyzed using a mixed linear model through the analysis of variance based on Gomez and Gomez [16]. Bartlett’s test was used to check the homogeneity of error variances before combining the analysis [17]. The combined analysis of variance was conducted using SAS software 9.0 [14] to determine the differences between genotypes across and among environments and their interaction. In the combined analysis, genotypes were considered as fixed while locations were considered a random variable. The following model was used for ANOVA of data of individual location: Yij =µ + Gi +Bj + eij
Where; Yij = observed value of genotype i in block j, µ = Grand mean of the experiment, Gi= the effect of genotype i, Bj = the effect of block j, eij =the error of genotype i in block j.
Combined analysis of variance over locations was carried out using the following statistical model:
Yijk=μ + Gi +Ej +GEij+ Bk(j)+ eijk
where; Yijk = observed value of genotype i in block k of environment (location) j, μ = Grand mean of the experiment, Gi = the effect of genotype i, GEj = the interaction effect of genotype i with environment j, Bk(j) =the effect of block k in location (environment) j, eijk =the error effect of genotype i in block k of environment j. Mean separation was done using Duncan multiple range test to discriminate the genotypes and identify superior ones based on yield.

2.2.5.2. Stability Analysis

Analysis of variance only detects genotype by environment interaction effects. To determine the stability of a genotype’s performance across different environments, breeders need additional information. Stability depends on the genetic structure of the cultivar’s population and the genotype of individual plants. So, the significance of genotype by environment interaction was further analyzed using stability parameters. Means of genotypes for grain yield across locations were analyzed using SAS [18]. AMMI model, biplot technique, and AMMI stability value analysis were computed per standard procedures.

2.2.5.3. AMMI Analysis

The Additive Main effect and Multiplicative Interaction (AMMI) model analysis was performed for grain yield and biomass. The AMMI model equation is given as:
y ij = μ + G i + E j + ( K n V ni S nj ) + Q ij + e ij
where, yij= is the observed yield of genotype i in environment j
μ = is the grand mean, G i = the additive effect of the ith genotype (genotype means minus the grand mean), E j =is the additive effect of the jth environment (environment mean deviation), K n = is the eigenvalues of the PCA axis n, V ni   and S nj = are scores for the genotype i and environment j for the PCA axis n, Q ij = is the residual for the first n multiplicative components, e ij = is the error

2.2.5.4. AMMI stability value (ASV)

The AMMI stability value as described by Purchase [19] was calculated as follows:
ASV = [ [ IPCAA   1   Sum   of   squares IPCAA   2   Sum   of   squares   ( IPCAA   1   scores ) ] 2 +   [ IPCAA   2   scores ] 2 ]
Where;
ASV= AMMI stability value, IPCAA1 = interaction principal component analysis 1, IPCAA2 = interaction principal component analysis 2, SSIPCAA1 = sum of square of the interaction principal component one, SSIPCAA2 = sum of square of the interaction principal component two.

3. Results and Discussion

3.1. Combined Analysis of Variance

In the study, significant differences were found in the environment, genotype, and genotype by environment interactions for all traits studied (Table 2). Our findings are in agreement with an earlier study on bread wheat [20]. The AMMI analysis revealed that a large portion of the variation was attributed to environmental effects (69.29%) followed by genotype by environment interactions (24.49%) and genotype effects (6.22%). This suggests that the performance of sorghum genotypes varied across different locations, highlighting the need for further evaluation of genotypes with wider adaptability and testing them in diverse environments. The diversity in environments indicated by the large sum of squares emphasizes the importance of testing sorghum genotypes at multiple locations to account for variations in climatic and soil conditions. These findings are consistent with earlier studies [21,22,23] on sorghum and support the idea that testing genotypes across various environments is crucial for understanding their performance and adaptation.

3.2. Mean Performance of Genotypes

3.2.1. Grain Yield

The analysis of variance results for each environment showed significant differences (P≤0.01) in grain yield among sorghum genotypes tested at multiple locations (Table 2). This aligns with previous studies on sorghum that also reported significant variations in grain yield among different varieties [24]. The tested genotypes exhibited varying performances for grain yield across the different environments, with the mean grain yield ranging from 1148.1 kg/ha for genotype G34 at Arfayide to 9137 kg/ha for genotype G36 at Jinka, with an overall environmental mean yield of 4250.12 kg/ha (Table 2). The average environmental grain yield varied from 1721.61 kg/ha at Arfayide to 6182.31 kg/ha at Jinka, while the average genotype grain yield across environments ranged from 3314.50 kg/ha for genotype G3 to 5119.93 kg/ha for G1(Table 3). These findings indicate that it is crucial to evaluate sorghum genotypes in various environments to comprehend their adaptability and performance variations. Additionally, the study demonstrated that the GEI sum square magnitudes were around 3.9 times greater than those of the genotypes sum squares for grain yield. This suggests significant differences in genotypic responses across different environments, resulting in observed variations in genotypic responses across environments. These findings align with the research by Amare et al. [24], which also highlighted a threefold difference in the magnitude of the GEI sum of squares compared to wheat genotypes, indicating substantial variations in genotypic responses across environments. The larger sum of squares of GEI relative to genotypes underscores the significant differences in genotypic responses across environments, emphasizing the considerable variance in genotypic responses across different conditions. Consequently, GEI poses challenges to the selection process by complicating the assessment of genotypes’ yield performance and weakening the correlation between genotypic and phenotypic values [25]. The GEI observed in this study follows a cross-over pattern, leading to shifts in genotype rankings for specific environments, making it challenging to interpret grain yield based solely on genotype and environment means. These findings are consistent with the findings of Tekle et al. [26] regarding mung bean.
The highest mean grain yields across the environment were recorded for the genotypes (G1 and G14), with a mean yield of (5119.93 and 4834.57 kg ha-1), respectively. Whereas, the lowest mean grain yield was recorded from the genotype (G3) with an average mean yield of 3314.50 kg ha-1 (Table 3), indicating that the tested genotypes had inconsistent performance across the tested environments. In this study, most of the tested genotypes gave relatively good grain yield performance, and it could be suggested that there is an opportunity to get high-yielding sorghum genotypes for future variety development. The large variation due to the environments in our study also confirmed the high diversity of weather conditions during growing seasons and the locations had different soil types, temperature, and rainfall as well as altitude, directly affecting the performances of the genotypes. Thus, the selection and development of sorghum varieties in the future should follow environment-specific approaches. This result is in agreement with the work of Yitayeh et al. [22] and Abiy[27] on the early maturing sorghum genotype, who reported that the performance of sorghum genotypes was different from location to location, similar to that of Tegegn et al.[28] in finger millet. Ranking based on the genotype-focused scaling assumed that stability and mean yield were equally important [29].
The best candidate genotypes were expected to have a high mean seed yield with stable performance across all test locations. However, such genotypes are very rare to find in practice. Therefore, high-yielding and relatively stable genotypes can be considered as a reference for genotype evaluation [30].
Table 3. Mean grain yield (kg ha-1) of 36 sorghum genotypes across six different test locations.
Genotype Jinka Kako Alduba Arfayide Gato Mieso Mean
G1 7694abcd 5852abc 8440ab 1816.0abcde 3669.6a 3248abcd 5119.93
G2 7749abcd 3639c 5096bcdefg 1957.2abcde 1455.8bc 3311abcd 3868.00
G3 5176abcd 3555c 4992dcefg 1331.6bcde 1269.4c 3563abcd 3314.50
G4 4957bcd 6080abc 4851defg 1034.9e 4092.1ab 4859abc 4312.33
G5 4134d 5354abc 4277efg 1333.3bcde 3581.1a 4596abc 3879.23
G6 5406abcd 5347abc 2677g 1837.3abcde 3490.6a 2737bcd 3582.48
G7 7798abcd 6844a 5511bcdefg 1503.7bcde 3864.1ab 2878bcd 4733.13
G8 5596abcd 5665abc 4533defg 1639.2bcde 3694.4ab 5063abc 4365.10
G9 6058abcd 5230abc 7816abcd 1612.5bcde 3658.1a 3211abcd 4597.60
G10 3879d 4167bc 5872abcdefg 1960.0abcde 2447.2abc 3893abcd 3703.03
G11 8869ab 5301abc 6528abcdef 1573.3bcde 3173.0a 3074abcd 4753.05
G12 4353cd 4876abc 8336abc 2010.6abcd 3675.1a 4941abc 4698.62
G13 6425abcd 6093abc 5126bcdefg 1277.0cde 3887.6ab 2737bcd 4257.60
G14 8333abc 5267abc 6654abcdef 1917.5abcde 3539.9a 3296abcd 4834.57
G15 4467cd 5923abc 4109efg 1475.6bcde 3916.1ab 5678a 4261.45
G16 7674abcd 4350bc 4543defg 1787.7abcde 3113.2a 4485abcd 4325.48
G17 8209abc 4350bc 5333bcdefg 1360.5bcde 3665.4a 4015abcd 4488.82
G18 7658abcd 5722abc 6383abcdef 1158.5ed 3415.7a 4470abcd 4801.20
G19 4556cd 4706abc 5291bcdefg 2234.1ab 2585.8abc 3141abcd 3752.32
G20 4636cd 4706abc 4365efg 1410.4bcde 3416.4a 4563abc 3849.47
G21 5484abcd 4765abc 4230efg 2020.7abcd 3199.3a 3300abcd 3833.17
G22 6019abcd 7274a 6519abcdef 1583.5bcde 3488.7a 3530abcd 4735.70
G23 7649abcd 5101abc 4285efg 2013.8abcd 3161.9a 3093abcd 4217.28
G24 4952bcd 4303bc 7467abcde 1867.7abcde 2579.5abc 5270ab 4406.53
G25 6015abcd 4134bc 5956abcdef 2136.3abc 2985.3ab 1778d 3834.10
G26 5548abcd 3534c 5600bcdefg 1226.7cde 2610.7abc 3584abcd 3683.90
G27 5168abcd 4862abc 6198abcdef 1459.3bcde 4045.2ab 4078abcd 4301.75
G28 5342abcd 5559abc 5353bcdefg 2151.1abc 3149.0a 4007abcd 4260.18
G29 4067d 4683abc 5084bcdefg 1828.5abcde 3008.4ab 2567bcd 3539.65
G30 7212abcd 3957c 4312efg 2638.8a 2722.7ab 2723bcd 3927.58
G31 7339abcd 5362abc 6257abcdef 1860.7abcde 3676.4a 4211abcd 4784.35
G32 6064abcd 5849abc 5481bcdefg 2088.1abcd 3451.3a 4080abcd 4502.23
G33 5627abcd 4548abc 9022a 1837.0abcde 3316.1a 4381abcd 4788.52
G34 7669abcd 5647abc 5931abcdefg 1148.1de 3758.4ab 4252abcd 4734.25
G35 5644abcd 4934abc 5719abcdefg 1983.8abcd 3626.5a 2489cd 4066.05
G36 9137a 3554c 3531fg 1902.9abcde 3353.8a 4022abcd 4250.12
Mean 6182.31 5030.36 5602.17 1721.61 3270.66 3753.44
G= genotype, G1-G36 (Genotypes one up to thirty six), a=highest, b=medium, c=poor, d=poorest, e-g=bad mean grain yield, genotype having same letters are same in mean yield.

3.3. Stability Analyses

3.3.1. Additive Main Effects and Multiplicative Interaction Analysis

The Additive Main Effects and Multiplicative Interaction (AMMI) analysis of variance for grain yield (kg/ha) and biomass (kg/ha) of 36 sorghum genotypes tested across six environments is presented in Table 4. The analysis revealed that genotypes had a significant impact on grain yield, while the environment (p≤0.001) also had a significant effect on grain yield. This finding aligns with a study by Jifar et al. [31] on tef genotypes, where they observed significant effects (P≤0.01) attributed to the environment, genotype, and their interaction (G×E) on seed yield and yield components.
In this research, environmental factors explained the majority of the variance in grain yield (69.29%), with genotype-environment interaction (24.49%) and genotype (6.22%) following. The impact of the environment was the most significant, while that of genotype was the least. The result aligns with earlier studies on sorghum [32,33]. Thus, the primary source of variation in grain yield was attributed to environments, suggesting their diversity and potential subdivision into mega-environments. Significant discrepancies among environments predominantly accounted for the variability in grain yield. Similar outcomes have been noted in other studies on sorghum [22,34], where environments displayed a higher sum of squares compared to genotypes.
The interaction between genotype and environment had a significant impact on grain and biomass. Two principal components were found to be the most precise predictors for both grain and biomass. These components explained 73.86% of grain yield variability and 88.57% of the total GEI sum of squares in biomass. These findings have been observed by several researchers across various locations and years [35,36]. Similar findings have been documented for sorghum genotypes assessed across various locations and years [3,32,37]. Moreover, the mean square of IPCA1 was higher than that of IPCA2, IPCA3, and IPCA4 for grain and biomass, indicating variations in genotype performance due to GEI. This aligns with previous studies on sorghum [3,33,38].
Table 4. Analysis of variance for the AMMI model for grain and biomass yield.
Source of variations Grain yield biomass
df MS Percent Accumulated MS Percent Accumulated
Genotype(G) 35 1274121.2 6.22 6.22 1.99E+08 13.61 13.61
Environments(E) 5 99329874.8 69.29 75.51 9.93E+08 67.78 81.39
Interactions(GxE) 175 1003128.411 24.49 100.00 2.72E+08 18.61 100.00
PC1 39 1944759.538 43.21 43.21 1.94E+08 71.07 71.07
PC2 37 1454432.622 30.65 73.86 47685656 17.50 88.57
PC3 35 703341.9714 14.02 87.88 25943186 9.52 98.10
PC4 33 472733.0303 8.89 96.77 4233067 1.55 99.65
Residuals 31 182925.3226 3.23 953107 0.35
Total 215 3.33E+06 1.46E+09
df= degree of freedom, MS=Mean of squares, PC= principal component ,PC1-PC4 (principal component one up to four), E+=10 to the power of, *, **, significant at 5% & 1% probability level; ns, non-significant.
The Additive main effects and multiplicative interaction one (AMMI 1) biplot
AMMI 1 biplot shows genotype and environment interaction effects on yield [25]. The X-axis represents yield, while the Y-axis shows IPCA1 scores. It helps interpret interaction effects and evaluate adaptability (Figure 1 and Figure 2). The study identified stable genotypes G21, G25, G13, G32, G35, G28, and G8, with G21 and G25 underperforming and G32, G8, G28, and G13 exhibiting high grain yield (Figure 1). For biomass, genotypes G20, G22, G5, G13, G30, G28, G35, G6, and G12 were stable but G22, G20, and G28 didn’t perform well. Genotypes G11, G2, and G1 were generally adaptable to all environments, while G6, G15, and G29 exhibited specific adaptability. Yitayeh et al. [22] utilized this model to assess the yield stability of early maturing sorghum. Genotypes on the right of the perpendicular line midpoint had higher yields than those on the left. G13, G34, G14, G31, G18, G16, G7, G17, G11, and G1 had higher grain yields, while G26, G19, G20, G29, G5, and G3 had lower yields. G1, G11, G25, and G16 had higher biomass, while G19, G29, G12, G28, and G5 had lower yields (Figure 2).
In summary, Alduba, Jinka, and Kako were favorable testing locations while Arifyde, Gato, and Meioso were unfavorable. Genotypes G22 and G33 showed higher grain yields in Kako and Alduba. For biomass, Jinka and Kako were favorable while Arifyde, Gato, and Meioso were unfavorable. Locations far from the origin, such as Arifyde, Kako, and Jinka, played a crucial role in the genotype-environment interaction, affecting the stability of biomass performance. Genotypes G1 and 11 showed higher biomass at Jinka, indicating their adaptability to this location. Crossa et al. [25] also noted that Genotype and location combinations with IPCA1 scores of the same sign resulted in positive specific interaction effects, while combinations with opposite signs led to negative specific interactions.
Figure 1. AMMI-1, where AMMI is additive main effect and multiplicative interaction, biplot showing IPCA1 (first interaction principal component axis) of sorghum genotypes evaluated in six environments for (a) grain yield (kg ha−1). Keys: G1 = 2790, G2 =69313, G3 = 69330, G4 = 70084, G5 = 70154, G6 = 70373, G7 = 71018, G8 = 74654, G9 = 74669, G10 = 74679, G11 = 74680, G12 = 74684, G13 = 74686, G14 = 74691, G15 = 74693, G16 = 74704, G17 = 74705, G18 = 200617, G19 =Dekeba, G20 = Melkam, G21 = 201453, G22 = 204602, G23= 2046, G24 = 204629 , G25 = 204631, G26 = 204633, G27 = 204634, G28 =206285, G29 = 206286, G30 = 213008, G31 = 213017, G32 = 213019, G33 = 213026, G34 = 214010, G35 = 214109, G36 = 216906, Jin=Jinka, KA = Kako, Ald =Alduba, ARF = Arifyde, Gat = Gato, MS = Meioso.
Preprints 140664 g002
Figure 2. AMMI1, AMMI-1, where AMMI is additive main effect and multiplicative interaction, biplot showing IPCA1 (first interaction principal component axis) of sorghum genotypes evaluated in six environments for above ground biomass yield (kg ha−1). Keys: G1 = 2790, G2 =69313, G3 = 69330, G4 = 70084, G5 = 70154, G6 = 70373, G7 = 71018, G8 = 74654, G9 = 74669, G10 = 74679, G11 = 74680, G12 = 74684, G13 = 74686, G14 = 74691, G15 = 74693, G16 = 74704, G17 = 74705, G18 = 200617, G19 =Dekeba, G20 = Melkam, G21 = 201453, G22 = 204602, G23= 2046, G24 = 204629 , G25 = 204631, G26 = 204633, G27 = 204634, G28 =206285, G29 = 206286, G30 = 213008, G31 = 213017, G32 = 213019, G33 = 213026, G34 = 214010, G35 = 214109, G36 = 216906, Jin=Jinka, KA = Kako, Ald =Alduba, ARF = Arifyde, Gat = Gato, MS = Meioso.
Preprints 140664 g003

3.3. AMMI Stability Value (ASV)

The Interaction Principal Component One (IPCA1) and Interaction Principal Component Two (IPCA2) scores in the AMMI model serve as stability indicators. The AMMI Stability Value (ASV) provides a balanced measure of stability [19]. Genotypes with lower ASV values are deemed stable, while those with higher ASV values are considered unstable. As per Appendix Table1, G35 exhibited the highest stability with an ASV of 4.54, followed by G3 (6.60), G32 (7.51), G26 (8.29), G31 (9.17), G22 (9.57), and G18 (11.87) as the most unstable genotypes for grain yield. The stable genotypes (G31, G22, G32, and G18) showed mean grain yield above the grand mean, aligning with findings from Alemu et al. [39] and Yitayeh et al. [22] who utilized this stability parameter to assess sorghum genotypes’ stability. Concerning biomass, genotype G26 (3.90) demonstrated the highest stability, followed by G4 (7.31), G13 (9.40), and G19 (10.90), while G36 (218.71), G2 (146.83), G14 (146.72), and G10 (133.48) were identified as the most unstable genotypes.
Considering cultivar superiority measure (Pi), yield stability index (YSI), AMMI stability value (ASV), regression coefficient (bi), and deviation from regression (S2di) (Supplementary table 1) genotypes (G18, G22, G31, and G32) were the most stable genotypes for grain yield and biomass yield, respectively.

4. Conclusions

This study has provided precious information on the yield stability status of the sorghum genotypes and the best environments for future improvement programs in Ethiopia. The combined analysis of variance showed significant variation among the sorghum genotypes, environments, and their interaction (G x E). In the AMMI analysis, genotypes (G) and environments (E) contributed to 24.49% and 69.29% of the treatment sum of squares, respectively, whereas the G x E interaction accounted for 14.8%. The environment played a more significant role in the total sum of squares than genotypes. The two IPCAs validated the grain yield variation explained by genotype-environment interaction, explaining 73.86% of the interaction sum of squares. The AMMI1 and AMMI2 biplots identified the most stable genotypes for grain and biomass. For various stability measures, genotypes G18, G22, G31, and G32 were identified as the most stable genotypes for grain and biomass.
The study identified sorghum genotypes G18 and G31 as stable and high-yielding candidates for variety development programs in Ethiopia. These genotypes exhibit consistent performance across different environments and show promise for further enhancement in sorghum production.

Author Contributions

Wedajo Gebre: Writing – original draft, Methodology, Formal analysis, Data curation, Conceptualization.Firew Mekbib: Writing – review & editing, Supervision. Alemu Tirfessa: Writing – review & editing, Validation, Methodology. Agdew Bekele: Writing – review & editing, Visualization, Conceptualization.

Data Availability

The data used to support the findings of this study are made available from the corresponding author upon reasonable request.

Acknowledgements

This paper was supported by the Ministry of Education and Jinka University. We are grateful for their financial and logistical support.

Conflicts of Interest

The authors declare that they have no conflicts of interest.

References

  1. FAO. Statistical database, Food and Agriculture Organization of the United Nations, Rome, Italy. 2015, http://faostat3.fao.org/home/E.
  2. Vavilov, N.I. The origin, variation, immunity and breeding of cultivated plants. Chronica Botanica, 1951, 13:1-366. [CrossRef]
  3. Seyoum, A., Gebreyohannes, A., Nega, A., Nida, H., Tadesse, T., Tirfessa, A. and Bejiga, T. Performance evaluation of Sorghum [Sorghum bicolor (L.) Moench] genotypes for grain yield and yield related traits in drought prone areas of Ethiopia. Advances in Crop Science and Technology. 2019, 7(2), p.423.
  4. Belete, T. and Bediru, N. Yielding and stability appraisal of released varieties of sorghum [Sorghum bicolor (L.) Moench.]. Journal of Agricultural Research Advances. 2020. Vol 02 No 4, pp 31-35/31.
  5. Belay, F., Mekbib, F. and Tadesse, T. Genotype by environment interaction and grain yield stability of Striga resistant sorghum [Sorghum bicolor (L.) Moench] genotypes in Ethiopia. Ethiopian Journal of Crop Science. 2020, 8(2), pp.79-99.
  6. Anum, W., Yasmeen, S., Ali, L., Riaz, U., Ali, A., Ahmed, R.I., Akhtar, I., Manzoor, N., Ur-Rahman, A., Maan, N.A. and Hussain, A. Environment X Genetic Stability of Different Sorghum Bicolor Varieties/Promising Lines Under Various Environmental Conditions. AGJSR. 2021, 39 (2): 69-81. [CrossRef]
  7. Enyew, M., Feyissa, T., Geleta, M., Tesfaye, K., Hammenhag, C. and Carlsson, A.S. Genotype by environment interaction, correlation, AMMI, GGE biplot and cluster analysis for grain yield and other agronomic traits in sorghum [Sorghum bicolor L. Moench],” Plos one. 2021, 16(10), p.e0258211.
  8. Abate, M. Genotype by environment interaction and yield stability analysis of open pollinated maize varieties using AMMI model in Afar Regional State, Ethiopia. Journal of Plant breeding and crop science. 2020. 12(1), pp.8-15.
  9. Belay, N. Genotype-by-environment interaction of maize testcross hybrids evaluated for grain yield using GGE biplots. International Journal of Food Science and Agriculture. 2022, 6(2), 216-227.
  10. Alemu, G., Dabi, A., Geleta, N., Duga, R., Solomon, T., Zegaye, H., Getamesay, A., Delesa, A., Asnake, D., Asefa, B. and Shewaye, Y. Genotype× environment interaction and selection of high yielding wheat genotypes for different wheat-growing areas of Ethiopia. Am. J. Biosci. 2021, 9, pp.63-71. [CrossRef]
  11. Jifar, H., Assefa, K., Tesfaye, K., Dagne, K. and Tadele, Z. Genotype-by-environment interaction and stability analysis in grain yield of improved Tef ( Eragrostis tef) varieties evaluated in Ethiopia. Journal of experimental agriculture international. 2019, 35(5), pp.1-13. [CrossRef]
  12. Haile, S. Genotype x Environment Interaction and Grain Yield Stability of Finger Millet [Eleusine coracana(L) subsp. Coracana] Varieties in Eastern and Western, Ethiopia. MSc Thesis, Haramaya, Haramaya University.2020.
  13. IBGR and ICRISAT. Descriptors for sorghum [Sorghum bicolor (L.) Moench]. International Board for Plant Genetic Resources. 1993. Rome, Italy, p.432.
  14. SAS Institute. SAS/STAT User’s Guide. 2004. SAS Institute, Cary, North Carolina. USA.
  15. Angela, P., Mateo, V., Gregorio, A., Francisco, R., Marco, L., José, C and Juan, B. GEAR (Genotype x Environment Analysis with R for Windows) Version 4.1.2016. CIMMYT Research Data and Software Repository Network. The Crop Journal. 2020, Volume 8, Issue 5, 745-756.
  16. Gomez, K.A. and Gomez, A.A. Statistical Procedures for Agricultural Research. 2nd Edition John Wiley and Sons Inc. 1984, New York. [CrossRef]
  17. Bartlett, M.S. Multivariate analysis. Supplement to the journal of the royal statistical society.1947, 9(2), pp.176-197.
  18. Hussein, M.A., Bjornstad, A.S. and Aastveit, A.H. SASG× ESTAB: A SAS program for computing genotype× environment stability statistics. Agronomy journal. 2000, 92(3), pp.454-459. [CrossRef]
  19. Purchase, J.L. Parametric analysis to describe genotype x environment interaction and yield stability in winter wheat. Ph.D. Thesis, Department of Agronomy, Faculty of Agriculture of the University of the Free State, Bloemfontein, South Africa. 1997.http://hdl.handle.net/11660/1966.
  20. Amare, A., Mekbib, F., Tadesse, W. and Tesfaye, K. Genotype X environment interaction and stability of drought tolerant bread wheat (Triticum aestivum L.) genotypes in Ethiopia. International Journal of Research. 2020, 6(3), pp.26-35.
  21. Belay, F., Mekbib, F. and Tadesse, T. Genotype by environment interaction and grain yield stability of Striga resistant sorghum [Sorghum bicolor (L.)Moench] genotypes in Ethiopia. Ethiopian Journal of Crop Science. 2020, 8(2), pp.79-99.
  22. Yitayeh, Z.S., Mindaye, T.T. and Bisetegn, K.B. AMMI and GGE Analysis of GxE and Yield Stability of Early Maturing Sorghum [Sorghum bicolor (L.)Moench] Genotypes in Dry Lowland Areas of Ethiopia. Adv. in Crop Sci. T.2019.
  23. Mulugeta, B., Tesfaye, K., Geleta, M., Johansson, E., Hailesilassie, T., Hammenhag, C., Hailu, F. and Ortiz, R. Multivariate analyses of Ethiopian durum wheat revealed stable and high yielding genotypes. PloS One. 2022, 17(8), p.e0273008. [CrossRef]
  24. Amare, A., Mekbib, F., Tadesse, W. and Tesfaye, K. Screening of drought tolerant bread wheat (Triticum aestivum L.) genotypes using yield based drought tolerance indices. Ethiopian Journal of Agricultural Sciences. 2019, 29(2), pp.1-16.
  25. Crossa, J., Gauch Jr, H.G. and Zobel, R.W. Additive main effects and multiplicative interaction analysis of two international maize cultivar trials. Crop science. 1990, 30(3), pp.493-500. [CrossRef]
  26. Ganta, T., Mekbib, F., Amsalu, B., & Tadele, Z. Genotype by Environment Interaction and Yield Stability of Drought Tolerant Mung Bean [Vigna radiata (L.) Wilczek] Genotypes in Ethiopia. Journal of Agriculture and Environmental Sciences. 2022, 7 (1), 43-62.
  27. Legesse, A. and Mekbib, F. Genotype X environment interaction and stability of early maturing sorghum [Sorghum bicolor (L.) Moench] genotypes in Ethiopia, 2015. MSc. Thesis, Alemaya University of Agriculture, Ethiopia.
  28. Belete, T., Tulu, L.A. and Senbetay, T. Evaluation of finger millet [Eleusine coracana (L.) Gaertn.] varieties at different locations of southwestern Ethiopia. Journal of Genetic and Environmental Resources Conservation. 2020, 8(2), pp.9-17.
  29. Yan, W. and Rajcan, I. Biplot analysis of test sites and trait relations of soybean in Ontario. Crop science. 2002, 42(1), pp.11-20.
  30. Yan, W. and Tinker, N.A. Biplot analysis of multi-environment trial data: Principles and applications. Canadian journal of plant science, 2016, 86(3), pp.623-645. [CrossRef]
  31. Jifar, H., Assefa, K., Tesfaye, K., Dagne, K. and Tadele, Z. Genotype-by-environment interaction and stability analysis in grain yield of improved tef (Eragrostis tef) varieties evaluated in Ethiopia. Journal of experimental agriculture international. 2019, 35 (5), pp.1-13. [CrossRef]
  32. Worede, F., Mamo, M., Assefa, S., Gebremariam, T. and Beze, Y. Yield stability and adaptability of lowland sorghum [Sorghum bicolor (L.) Moench] in moisture-deficit areas of Northeast Ethiopia. Cogent Food & Agriculture. 2020, 6(1), p.1736865.
  33. Birhanu, C., Bedada, G., Dessalegn, K., Lule, D., Chemeda, G., Debela, M. and Gerema, G. Genotype by environment interaction and grain yield stability analysis for Ethiopian sorghum [Sorghum bicolor (L.) Moench] genotypes. Int. J. Plant Breeding and Crop Sci. 2021, 8, pp.975-986.
  34. Worede, F., Tarekegn, F. and Teshome, K. Simultaneous selection for grain yield and stability of sorghum [Sorghum bicolor (L.) Moench] genotypes in Northeast Ethiopia. African Journal of Agricultural Research. 2021, 17(10), pp.1316-1323.
  35. Gauch Jr, H.G. and Zobel, R.W. Optimal replication in selection experiments,” Crop Science. 1996, 36(4), pp.838-843.
  36. Yan, W., Hunt, L.A., Sheng, Q. and Szlavnics, Z. Cultivar evaluation and mega-environment investigation based on the GGE biplot” Crop science, 2000, 40(3), pp.597-605.
  37. Al-Naggar, A.M.M., Abd El-Salam, R.M., Hovny, M.R.A. and Yaseen, W.Y. Genotype× Environment Interaction and Stability of Sorghum bicolor Lines for Some Agronomic and Yield Traits in Egypt. Asian Journal of Agricultural and Horticultural Research. 2018, pp.1-14. [CrossRef]
  38. Admas, S. and Tesfaye, K. (2017), Genotype-by-environment interaction and yield stability analysis in sorghum [Sorghum bicolor (L.) Moench] genotypes in North Shewa, Ethiopia. Acta Universitatis Sapientiae, Agriculture and Environment. 2017, 9(1), pp.82-94.
  39. Alemu, B., Negash, G., Raga, W. and Abera, D. Multi-locations evaluation of sorghum [Sorghum bicolor (L.) Moench] genotypes for grain yield and yield related traits at western Oromia, Ethiopia,” Journal of Cereals and Oilseeds. 2020, 11(2), pp.44-51.
Table 1. List of genotypes used for genotypes by environment experiments.
Serial no. Genotypes Code Region Zone District
1 27907 G1 South West Bench Maji Gura Farda
2 69321 G2 South Konso Karat zuria
3 69331 G3 South Ari Bakodawla
4 70084 G4 South Konso Karat zuria
5 70154 G5 South Dirashe Dirashe
6 70229 G6 South Dirashe Dirashe
7 71010 G7 South Konso Kena
8 74667 G8 South Dirashe Dirashe
9 74669 G9 South Konso Segen zuria
10 74679 G10 South Konso Segen zuria
11 74680 G11 South Dirashe Dirashe
12 74684 G12 South Dirashe Dirashe
13 74686 G13 South Dirashe Dirashe
14 74691 G14 South Dirashe Dirashe
15 74693 G15 South Dirashe Dirashe
16 74704 G16 South Dirashe Dirashe
17 74705 G17 South Dirashe Dirashe
18 200617 G18 South Dirashe Dirashe
19 201453 G21 South Dirashe Dirashe
20 204602 G22 South Dirashe Gumade
21 204619 G23 South Konso Karat zuria
22 204629 G24 South Konso Segen zuria
23 204631 G25 South Konso Segen zuria
24 204633 G26 South Konso Kena
25 204634 G27 South Konso Kena
26 206285 G28 South Konso Karat zuria
27 206286 G29 South Burji Karat zuria
28 213008 G30 South Konso Kena
29 213017 G31 South Burji Burji
30 213019 G32 South Dirashe Dirashe
31 213026 G33 South Gamo Bonke
32 214010 G34 South South omo Hamer Bena
33 214109 G35 South South omo Benatesmy
34 216906 G36 South Gamo Gofa Zuria
35 Dekeba( check ) G19
36 Melkam(check) G20
Note: In the table, codes (G1-G18 &G21-G26) designated for genotypes obtained from Ethiopian Biodiversity Institute (EBI), while codes (G19 & G20) for nationally released sorghum varieties obtained from Melkassa Agricultural Research Center (MARC).
Table 2. Analysis of variance of morphological traits between genotypes (G), environment (E) and GEI interaction for 36 sorghum genotypes across six locations.
Trait DF MD GFP PHT
Source of variation df MS Percent MS Percent MS Percent MS Percent
Environment(E) 5 3026.16** 28.64 17357.93** 56.66 8170.96** 44.99 120104.56** 28.38
Genotype (G) 35 150.20** 9.95 150.84** 3.45 77.04** 3.01 13494.25** 22.32
GxE interactions
Rep(E)
Error
175
12
420
71.95**
226.2**
40.77
23.84
5.14
61.46**
3167.80**
7.02
24.82
72.61**
1337.36**
13.97
17.64
2023.64**
9735.66**
16.74
5.52
32.42 29.39 8.06 44.27 20.45 44.27 27.05

Trait
PL PY PW SW
Source of variation df MS Percent MS Percent MS Percent MS Percent
Environment(E) 5 3631.75** 34.65 418611.32** 58.85 366168.77** 40.70 419507928** 47.34
Genotype (G) 35 137.87** 9.21 2025.96* 3.18 7848.58** 6.11 15762275** 12.45
GxE interactions
Rep(E)
Error
175
12
420
85.18**
82.24**
32.21
28.44
1.88
25.82
3042.56**
9413.07**
1779.34
14.97
3.18
21.01
5260.07**
19546.56**
2946.62
20.46
5.21
27.51
2353159** 9.29
70190040** 19.01
1255266 11.90

Trait
BM TKW GY HI
Source of variation df MS Percent MS Percent MS Percent MS Percent
Environment(E) 5 597883554** 43.59 1799.68** 43.90 298875131** 48.30 419507928** 39.58
Genotype (G) 35 16989501** 8.67 74.47** 12.72 3897432** 4.14 15762275** 7.68
GxE interactions
Rep(E)
Error
175
12
420
4667812**
103932563**
2881993
11.91
18.18
17.65
16.20**
75.54**
12.27
13.83
4.42
0.06
3031950**
12269443**
1877757
16.98
4.77
25.81
2353159** 21.12
70190040** 3.24
1255266 28.38
*, **, =Significant at 5% and 1% level of probability respectively, DF= days to flowering, DM = days to maturity, GFP = grain filling period PHT= plant height (cm), PL= panicle length (cm), PY= panicle yield (g), PW = panicle weight (g), SW = Straw weight (kg), BM = biomass (kg), TKW = thousand- kernel weight (g) and GY = grain yield (kg).
Disclaimer/Publisher’s Note: The statements, opinions and data contained in all publications are solely those of the individual author(s) and contributor(s) and not of MDPI and/or the editor(s). MDPI and/or the editor(s) disclaim responsibility for any injury to people or property resulting from any ideas, methods, instructions or products referred to in the content.
Copyright: This open access article is published under a Creative Commons CC BY 4.0 license, which permit the free download, distribution, and reuse, provided that the author and preprint are cited in any reuse.
Prerpints.org logo

Preprints.org is a free preprint server supported by MDPI in Basel, Switzerland.

Subscribe

Disclaimer

Terms of Use

Privacy Policy

Privacy Settings

© 2025 MDPI (Basel, Switzerland) unless otherwise stated