Submitted:
17 August 2025
Posted:
19 August 2025
You are already at the latest version
Abstract
Sponge city theory utilizes policy-driven design to mitigate urban flooding and shape urban development. However, existing approaches primarily focus on micro-scale landscape facilities and performance assessments, overlooking the integration of macro-scale urban design strategies. This study develops a parametric design framework linking the quantitative control requirements of sponge city policies to urban morphological elements, establishing a "form-performance" correlation model. Key design indicators (green space, roof, water body, pavement, and their sub-indicators) were identified, and sensitivity analysis evaluated their responses to varying plot ratios and site scales. Results indicate that policy-guided stormwater runoff reduction strategies differ significantly by development density: high-density projects favor increased green roof ratios, while low-density projects are better suited for permeable pavements. Larger sites necessitate greater emphasis on peak runoff control and rational catchment zoning. The analysis empirically validated the framework and model, revealing that current policies risk over-incentivizing specific high-performance technologies, potentially compromising strategic diversity and resilience to extreme weather events. Consequently, optimizing policy evaluation metrics and refining design guidelines is recommended to achieve more balanced, efficient, and resilient stormwater management during preliminary urban design phases.
Keywords:
sponge city
; urban design
; parametric design
; policy-driven
; stormwater runoff control
1. Introduction
1.1. Background
As the global climate crisis deepens, extreme weather events increasingly threaten urban systems. In China, floods alone affected over 52 million people in 2023, with 309 casualties and economic losses of 244.57 billion yuan [1]. Over the past decade, China has promoted “Sponge City Construction” to tackle flooding and water issues [2,3]. This policy integrates LID/green infrastructure (e.g., green roofs, sunken green spaces, permeable pavements) with improved drainage systems for a healthier hydrological cycle [4,5,6,7,8,9,10].
China has issued multiple guidelines [11,12,13] to govern stormwater control, yet the implementation outcomes deviate from policy expectations. The 2021 heavy rainstorm in Zhengzhou caused significant public concern, as the city’s 54.3 billion yuan investment in Sponge City infrastructure did not appear to prevent major losses. The event affected approximately 14.8 million people, resulted in the collapse of around 39,000 houses, and caused economic damages estimated at 120.06 billion yuan [14]. From an urban design perspective, three issues emerge: (1) policies focus on moderate events, overlooking extreme rainfall [12]; (2) LID alone struggles during severe storms [15,16,17,18]; (3) compliance checks rely on the “volume method,” lacking robust verification post-construction.
Although some interdisciplinary studies bolster Sponge City initiatives [19,20], few investigate its impact on urban design. This research thus examines policy-driven Sponge City practices, probing potential design challenges. Additionally, a dedicated analytical tool is crucial for stormwater performance. Traditional approaches shift from field surveys to advanced techniques (e.g., infrared sensing, digital simulation) [21,22,23,24,25]. Parametric design can optimize spatial layouts [26,27,28,29], but often requires programming skills [30] and cross-disciplinary collaboration [31]. Meanwhile, stormwater modeling—whether physically based [32], statistical [33], or hybrid [34]—is commonly embedded in SWMM, HEC-RAS, or MIKE FLOOD [35,36,37], which are not always designer-friendly. Recent efforts integrate parametric methods into flood management [38,39,40], albeit with high data demands [41,42]. Grasshopper’s open-source environment offers a more accessible option, as demonstrated by rainwater+ [43], the SRTF tool [44], and customized simulations [45]. These precedents inform the methodology proposed here.
1.2. Significance of the Study
As a policy-driven concept in a nation with diverse climates, “Sponge City” must simplify certain control measures for practical operation. Yet over-simplification can undermine effectiveness, especially when four major objectives—total runoff, peak runoff, pollution, and rainwater resource utilization—are compressed into a single metric of total runoff control [12]. The question remains whether such limited policy guidance fully supports complex, cross-professional projects.
From an urban design perspective, stormwater models are needed early in the planning stage. Although some work addresses runoff control in design [43,44,45], a comprehensive framework is lacking. To fill this gap, this study explores how Sponge City policies influence design outcomes and potential risks. We employ an automated parametric framework to generate multiple design samples, link “form–performance” via a correlation model, and use sensitivity analysis for iterative feedback (Figure 1).
1.3. Research Objectives and AIM
This study has three main research objectives: developing a parametric design framework, identifying key indicators, and analyzing specific impacts.
(1) Stormwater-Driven Urban Design: Integrate stormwater runoff control into early-stage urban design via a parametric framework. By embedding Sponge City principles in the design process, the framework rapidly generates sample data for sensitivity analysis.
(2) Key Indicators: Identify which urban design elements are shaped by Sponge City policies. Through a correlation model, the study pinpoints how policies and design measures intersect, systematically analyzing relevant indicators.
(3) Specific Impacts: Determine the potential effects and risks of these policies on urban design. Using sensitivity analysis on key indicators, the study illuminates how Sponge City objectives influence urban form and heightens practitioners’ flood-mitigation awareness.
2. Methods
2.0. Overview of Research Methods
This paper employs collaborative design concepts and parametric methods to assess how Sponge City policies affect urban design. First, it proposes a Grasshopper-based, computer-aided optimization framework that integrates policy directives into urban design. Next, it examines urban design and runoff control processes separately, establishing correlation models to identify key Sponge City design elements. Finally, sensitivity analysis combines the parametric framework, correlation models, and statistical methods to clarify the specific impacts of these policies.
The framework builds on Rhinoceros and Grasshopper, widely used in architecture and urban design. Rhinoceros allows designers to evaluate stormwater runoff directly on existing 3D geometries, while Grasshopper’s visual programming capabilities transform geometric data into quantifiable performance metrics. Kangaroo, a physics simulation plugin, enables real-time form-finding, optimization, and constraint solving, supporting stormwater runoff simulations within the same environment.
2.1. Collaborative Design Framework Development in Parametric Design
This study employs Grasshopper for Rhino to construct a correlation-model-based framework in three steps: objectives setting, performance mapping, and form optimization (Figure 2).
2.1.1. Design Objectives Setting
The framework defines two types of design goals: binding and guiding. Binding objectives: Quantitative performance targets, such as meeting local runoff requirements. Guiding objectives: Spatial optimization goals (e.g., avoiding flooding risks) to ensure design quality. Balancing these goals prevents designs from fixating on a single metric at the expense of broader quality.
2.1.2. Mapping Rule Setting
Performance mapping establishes numerical links between design parameters and performance targets. For binding objectives, a policy-based model translates Sponge City guidelines into quantifiable criteria. For guiding objectives, the Kangaroo physics engine simulates stormwater runoff. Additionally, a cost-control constraint avoids overly performance-centric designs.
2.1.3. Form Automatic Optimization
This stage introduces an automatic optimization mechanism to provide immediate feedback and dynamic quantification. By applying appropriate algorithms, the framework generates numerous near-optimal design samples in a short time, surpassing limitations of traditional one-way processes.
2.1.4. Collaborative Design Decisions
Designers must reconcile performance data with diverse stakeholder needs (managers, citizens, developers). The decision-making process balances technical results and spatial considerations. From the automated outputs, designers choose promising layouts that meet runoff targets while maintaining high urban design quality.
2.2. Construction of Correlation Models Driven by Policy
This study adopts Sharifi’s classification for resilient cities [46,47], distinguishing meso and micro urban scales. The meso scale involves neighborhood design, density, land use mix, site planning, urban blocks, and open-space configuration; the micro scale focuses on more specific engineering measures. Current Sponge City research emphasizes micro-level LID measures, whereas urban design typically manages the meso level.
Accordingly, we examine cross-scale correlation between policy-driven Sponge City methods (micro) and design-driven spatial forms (meso). From micro to meso, we identify the technologies and measures directly affecting runoff management. From meso to micro, we seek key indicators in urban design that shape micro-scale interventions, establishing correlation models across the two scales.
2.2.1. Policy-Driven Research—Study of Quantitative Control Methods from Micro to Meso Scale
The “Guidelines” identify four planning objectives for low-impact development stormwater systems—total runoff control, peak runoff control, pollution control, and rainwater resource utilization—with total runoff control emphasized as the primary target [12]. In practice, Sponge City projects commonly measure compliance via the “Volume Capture Ratio of Annual Rainfall.”
Under policy-driven scenarios, firms often apply the “Volume Method” to verify annual runoff control. This method ensures the total LID storage capacity in a given plot satisfies its required “Volume of LID Facilities for Catchment Runoff Control.” The specific steps for applying the “ Volume Method “ in practice are as follows:
STEP1: Determine the Volume Capture Ratio of Annual Rainfall based on planning goals and look up the corresponding Design Rainfall Depth H in a reference table (List of Design Rainfall Depth Corresponding to Volume Capture Ratio of Annual Rainfall in Selected Chinese Cities) [13] (Table 1).
STEP2: Initially, propose LID control indicators for each plot, which may include the sunken green space ratio and its depth, permeable pavement ratio, green roof ratio, and other storage capacities. Then, calculate the comprehensive Volumetric Runoff Coefficient φ.
STEP3: Calculate the Design Storage Volume V using the formula V=10HφF, where V is the design storage volume in m3, H is the Design Rainfall Depth in mm, φ is the comprehensive Volumetric Runoff Coefficient (calculated as a weighted average), and F is the catchment area in hm2.
STEP4: Calculate the Actual Storage Volume V’ of facilities with storage functions.
STEP5: Derive the Actual Rainfall Depth using H=V/10φF, then use interpolation to look up the Volume Capture Ratio of Annual Rainfall in the reference table (Table 1). Finally, determine whether the Volume Capture Ratio of Annual Rainfall meets the standard. If it does not, return to S2 to adjust the plan until it meets the requirements.
Based on the design flowchart of the “Volume Method, (Figure 5)” it is evident that this is a unidirectional linear process, and the results often depend on the designer’s experience. Two key indicators significantly impact urban design: the Volumetric Runoff Coefficient φ, representing the overall performance of the underlying surface, and the Actual Storage Volume V’, representing the project’s actual storage capacity.
2.2.2. Design-Driven Research—Study of Urban Design Processes from Meso to Micro Scale
In early-stage urban design, practitioners primarily manage underlying surface elements—green spaces, roofs, water bodies, roads, and pavements—by adjusting their shapes and sizes. Although such form-based decisions affect runoff outcomes, direct infrastructure (LID or gray measures) often occurs later. Hence, connecting “surface forms” to “stormwater effects” is crucial for identifying key indicators.
Based on the design process, primary indicators include the ratio of green spaces, roofs, water bodies, and pavements (Figure 6). Secondary indicators capture the proportion of LID strategies for each surface: e.g., sunken green spaces, vegetative swales, permeable pavements, green roofs, or water storage facilities. According to the volume method, the comprehensive “Volumetric Runoff Coefficient” decreases as LID adoption increases, thereby raising the effective Design Rainfall Depth.
- (1)
- Overall Correlation Framework
After clarifying design-driven and policy-driven paths for stormwater control, we propose a framework with four main components: Design Elements, Correlation Logic, Data Conversion, and Data Calculation.
Design Elements: Identify the underlying surface types—roofs, green spaces, pavements, water bodies—that most affect runoff in early-stage urban design.
Correlation Logic: Construct a model that aligns policy-related engineering measures with design-control elements, supporting numerical simulation.
Data Conversion: Apply Sponge City formulas (e.g., the volume method) to translate morphological indicators into performance metrics.
Data Calculation: Use a parametric environment to evaluate if the design meets runoff goals. If not, results loop back to Design Elements for further optimization.
Serving as a theoretical framework, this structure clarifies both policy-driven and design-driven factors, detailing their categories and proportions for stormwater runoff management.
- (2)
- Indicator Correlation Model
From a design-driven perspective, surface shape and size greatly affect a project’s runoff control capacity. Under the volume method, the comprehensive “Volumetric Runoff Coefficient” depends on LID proportion: less runoff coefficient yields a larger effective Design Rainfall Depth. Hence, LID ratios become secondary indicators beneath four primary indicators (green spaces, roofs, pavements, and water bodies), as shown in Figure 7.
Common secondary indicators include sunken green spaces, vegetative swales, and bioretention for green areas; extensive/intensive green roofs; permeable pavers/asphalt for pavements; and detention ponds or cisterns for water bodies. The total area at each level equals the corresponding higher-level surface area, ensuring 100% across both primary and secondary indicators.
Within a parametric design framework, this model uses the control variable method for sensitivity analysis. By assigning preset values as independent variables, analysts observe changes in dependent outputs, then apply statistical approaches to reveal how variations in LID measures influence overall stormwater performance.
2.3. Policy-Driven Sensitivity Analysis of Key Indicators
By applying the policy-driven parametric design framework and correlation indicator model, we perform sensitivity analysis through controlled variable experiments.
2.3.1. Overview of the Research Plan
This study uses a parametric collaborative design framework to simulate and analyze key indicators. We first identify these indicators, run data-driven experiments, and then systematically interpret the results.
2.3.2. Research Subjects
Focusing on Chinese university campuses, we classify them by land area and plot ratio, omitting those under 50 hectares or with a ratio below 0.5. This yields eight common types (Figure 8), covering small (50 ha), medium (100 ha), and large (150 ha) sites, each crossed with low (0.5), medium (1.0), or high (1.5) plot ratios. Examples include A50/P1.0, A100/P0.5, and A150/P1.5.
A standard condition is established as a benchmark for comparing experimental outcomes. Guangzhou, located in southern China’s Pearl River Delta, has a subtropical monsoon climate with annual rainfall near 1,700 mm and frequent heavy downpours over 50 mm [48]. According to Sponge City Construction Guidelines, Guangzhou’s Volume Capture Ratio (60–85%) corresponds to design rainfall of 18.4–43.4 mm. For this study, an 85% annual runoff control rate was selected, i.e., 43.4 mm.
Taking a 50 ha, 1.5 plot ratio campus (A50/P1.5) as an example, local stormwater rules set a 70% permeable paving minimum and 50% sunken green space. Calculations show that a 75% green roof ratio yields an actual design rainfall of 43.52 mm (meeting the 43.4 mm target). Actual storage volume is 2,701.125 m3, with a design storage of 2,693.60 m3, and the total controllable stormwater reaches 4,864.98 m3. Hence, 75% green roof, 50% sunken greens, and 70% permeable paving define the standard condition.
2.3.3. Studied Indicators
(1) Sensitivity Analysis of Construction Intensity Indicators
Here, land area and plot ratio serve as independent variables, while the model’s primary and secondary indicators remain fixed (standard conditions). A parametric platform simulates outputs such as “Actual Design Rainfall Depth” or “Total Stormwater Runoff to be Controlled and Utilized,” allowing us to assess how different land areas or plot ratios affect peak runoff. Since the primary and secondary indicators are fixed, total runoff control stays constant, focusing this analysis on peak control (i.e., total runoff to be managed).
(2) Sensitivity Analysis of the Proportion of Low-Impact Development Facilities
In this approach, the study presets primary indicators and varies a secondary indicator (the LID proportion). We again observe shifts in “Actual Design Rainfall Depth” or “Total Stormwater Runoff to be Controlled and Utilized.” Because water bodies have a volumetric runoff coefficient of 1.0 and don’t enhance infiltration, the study excludes them. Meanwhile, greening, roofs, and pavements emerge as crucial surfaces. Common low-impact measures—sunken green spaces, green roofs, and permeable pavements—are chosen as key secondary indicators.
Note that primary indicators (ratios of the four surface types) are not directly examined, since actual engineering practice often fixes their proportions through planning. Instead, this study focuses on the secondary indicators that dictate each surface’s real runoff control.
2.3.4. Evaluation Indicators
Among the four LID goals—total runoff, peak runoff, pollution, rainwater utilization—total runoff control is pivotal and can aid the other objectives [12]. Hence it is prioritized. Peak runoff control further boosts resilience against extreme rainfall, measured by “Total Stormwater Runoff to be Controlled and Utilized.” Accordingly, we treat the “Volume Capture Ratio of Annual Rainfall” (linked to Design Rainfall Depth) and the “Total Stormwater Runoff to be Controlled and Utilized” as our two main dependent variables.
2.3.5. Parametric Model Configuration
(1) Indicator Control Model
To perform both construction-intensity and LID-facility sensitivity analyses, a parametric program employs the correlation model for controlled variable experiments. In the construction intensity analysis, land area and plot ratio act as independent variables under preset standard conditions, while the total or peak stormwater runoff (Figure 9) serves as the dependent variable.
For the LID-facility proportion analysis, the secondary indicator (e.g., LID ratio) becomes the independent variable, with other indicators fixed. Again, total or peak runoff (Figure 10) is observed as the dependent measure.
(2) Calculation Formula
This section primarily utilizes the “Sponge City+” toolkit, which includes tools such as the “Sponge Campus Calculator,” “Actual Design Rainfall Calculator,” and “Total Stormwater Runoff to be Controlled and Utilized Calculator” to construct the experimental platform. These calculation plugins are based on the “Volume Method” formulas outlined in the Technical Guidelines. The main calculation formulas used in the analysis plan are as follows:
Comprehensive Volumetric Runoff Coefficient:
Design Storage Volume:
Actual Storage Volume:
Actual Design Rainfall Depth:
Volume of LID Facilities For Catchment Runoff Control:
Total Stormwater Runoff to be Controlled and Utilized:
In the formulas:, represents comprehensive volumetric runoff coefficient; represents volumetric runoff coefficient of the corresponding element; represents catchment area of the corresponding element (m2); F represents total catchment area (hm2); V represents design storage volume (m3); V′ represents actual storage volume (m3); F’ represents catchment area of facilities with storage function (m2); h represents storage depth of facilities with storage function (m); a represents reduction coefficient; H′ represents actual rainfall depth (mm); H represents design rainfall depth (mm), V ua represents volume of LID facilities for catchment runoff control; W represents total stormwater runoff to be controlled and utilized (m3); C,, represents volumetric runoff coefficient; O,, represents volumetric runoff coefficient corresponding to the control peak runoff, which should meet the local planning control requirements; ℎy represents design daily rainfall (mm), determined by the maximum 24-hour rainfall of the year, not less than the design rainfall corresponding to the volume capture ratio of annual rainfall of the locality; Fy represents hardened catchment area (hm2), calculated based on the horizontal projection area of the hardened catchment area.
These formulas have been integrated into a parametric plugin developed in Grasshopper, which we refer to as “Sponge City+” (Figure 11).
2.3.6. Sensitivity Analysis
Sensitivity analysis examines how variations in model inputs influence outputs. Typically, it involves adjusting relevant variables and using statistical methods (e.g., regression, variance, screening, metamodeling) to determine which parameters most strongly affect results. Here, we employ a sensitivity coefficient, defined as the ratio of a key indicator’s change rate to the change rate of its influencing factor, reflecting the system’s degree of sensitivity. The calculation formula is as follows:
In the formula: represents the change in the significant influencing factor F; represents the change in the model output result Q due to the change in the significant influencing factor F.
3. Results
3.1. Overall Impact of Construction Intensity on Total Stormwater Runoff Control
3.1.1. Overall Impact Analysis
To assess the overall trend in peak runoff control capability across the eight types of construction intensity, this study calculates the “Total Stormwater Runoff to be Controlled and Utilized” for each of eight scales under standard conditions and conducts a comparative statistical analysis (Figure 12, Table 2).
- Data analysis shows that under the same plot ratio, when using the “Volume Method” for sponge city compliance checks, the larger the construction land area, the greater the “Total Stormwater Runoff to be Controlled and Utilized”. This means that for larger urban design projects, sponge city policies tend to focus design efforts on controlling peak runoff. By di-viding catchment areas more rationally, potential risks such as excessively high peak runoff and premature peak times can be mitigated;
- Data analysis indicates that under the same construction land area, when using the “Volume Method” for sponge city compliance checks, a higher plot ratio, along with a higher green roof ratio, helps reduce the “Total Stormwater Runoff to be Controlled and Utilized”. This means that for high plot radio urban design projects, sponge city policies will guide designers to emphasize the development of green roofs and enhance the runoff control potential of roof-related LID facilities.
3.1.2. Sensitivity Analysis of Land Area
To independently analyze the impact of land area on peak runoff control capability, this study keeps the plot ratio constant and uses land area as the independent variable. The impact of changes in land area under the P1.5 condition on the “Total Stormwater Runoff to be Controlled and Utilized” is statistically analyzed. The line graph reveals that when the plot ratio is constant, an increase in campus land area corresponds to a greater total stormwater runoff that needs to be controlled and utilized (Figure 13, Table 3).
3.1.3. Sensitivity Analysis of Plot Ratio
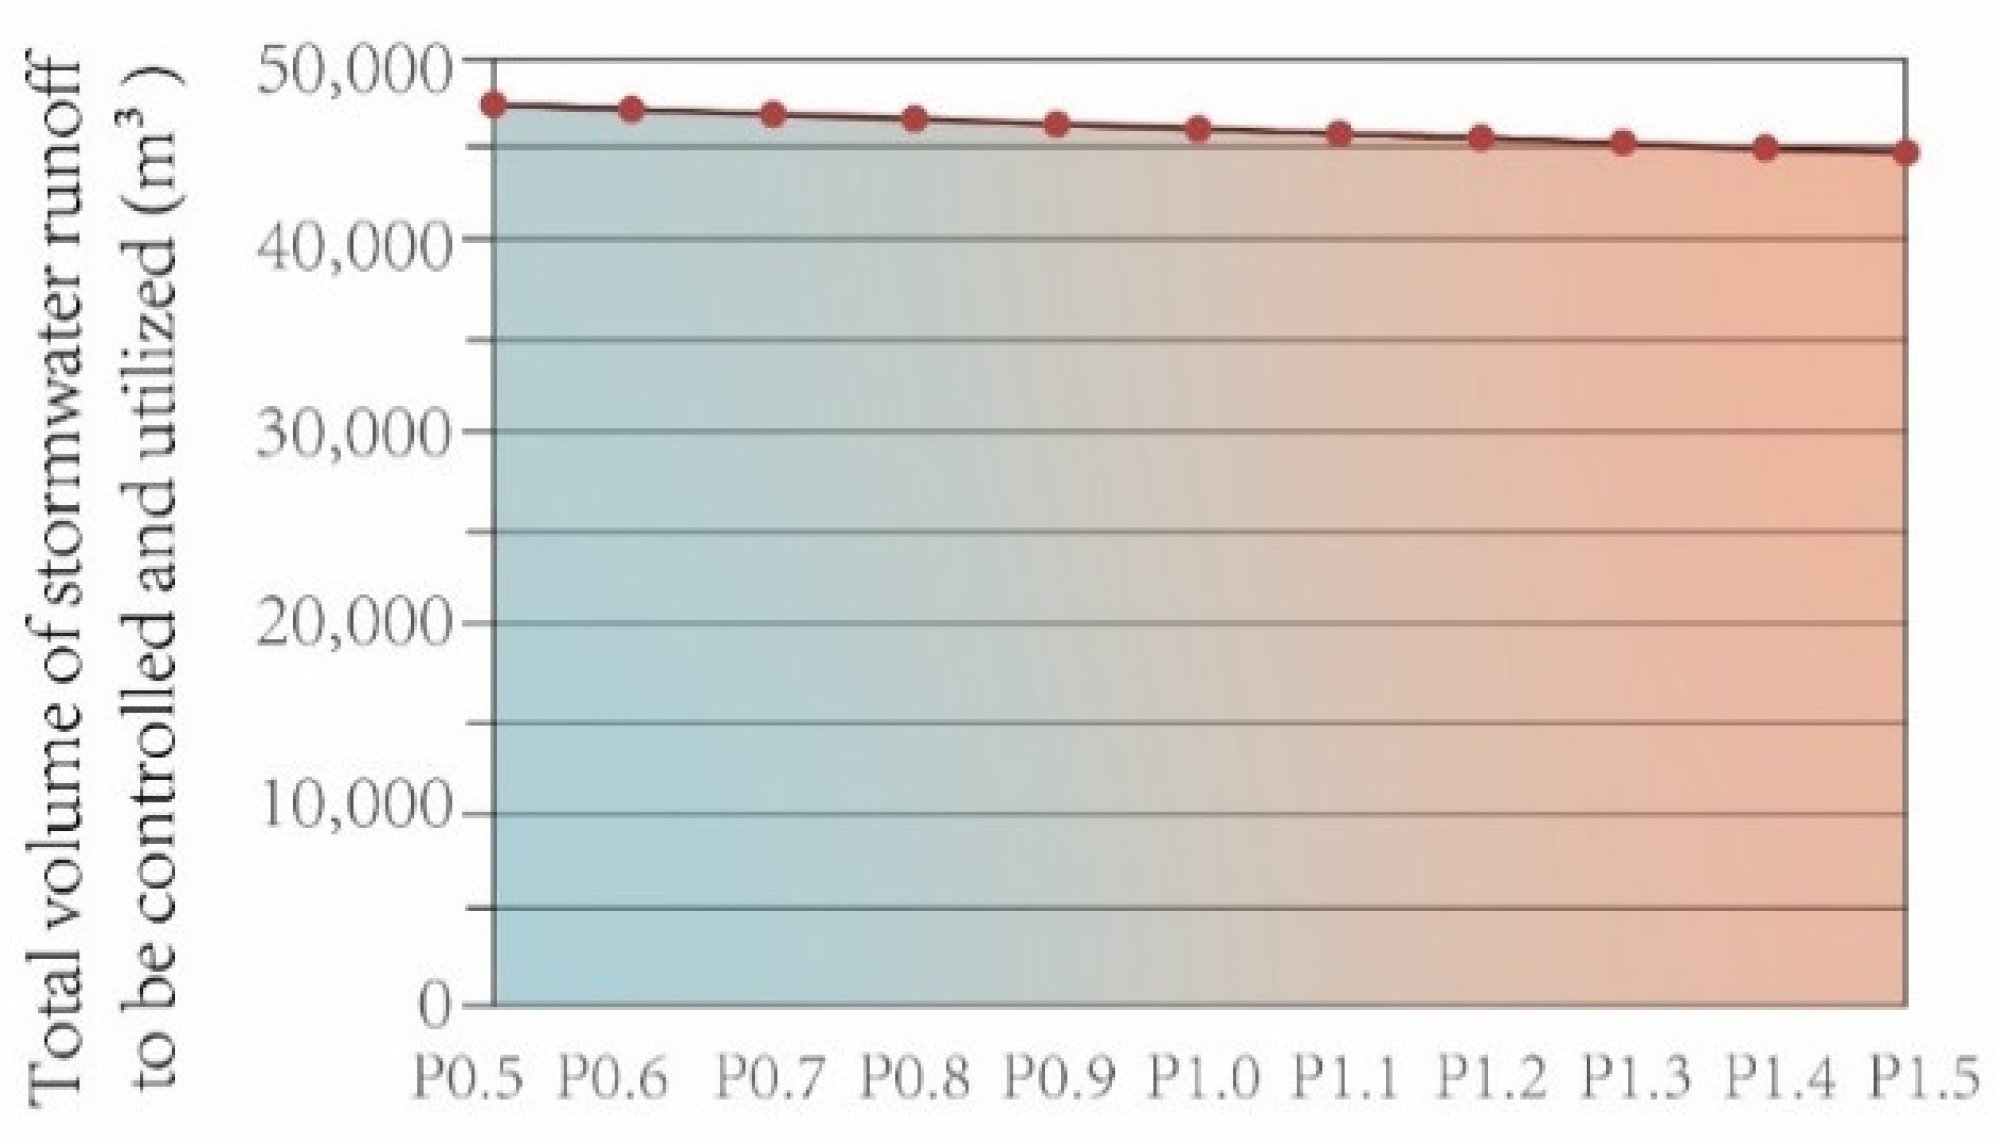
To analyze the impact of plot ratio (plot ratio) on peak runoff control capability, this study takes the 150 hectares type (A150) as an example and statistically analyzes the impact of changes in plot ratio on the “Total Stormwater Runoff to be Controlled and Utilized.” By analyzing the line graph, we can draw the following conclusion: when the land area remains constant, a higher plot ratio results in a smaller total stormwater runoff that needs to be controlled and utilized. However, since this conclusion is somewhat counterintuitive, this study further examined the calculation conditions to ensure accuracy and to understand the underlying factors contributing to this outcome. The results indicate that the primary reason for this variation is that the green roof ratio is higher than the paving ratio. As the plot ratio increases, the proportion of green roofs also increases, which reduces the overall hardened catchment area and consequently decreases the total stormwater runoff that needs to be controlled and utilized (Figure 14).

Table 4.
Analysis of the Impact of Plot Ratio Changes on “Total Stormwater Runoff to be Controlled and Utilized” Under A150 Condition.
Table 4.
Analysis of the Impact of Plot Ratio Changes on “Total Stormwater Runoff to be Controlled and Utilized” Under A150 Condition.
| Research object | Total volume of stormwater runoff to be managed and utilized(m3) |
|---|---|
| P0.5 | 47388.13 |
| P0.6 | 47138.71 |
| P0.7 | 46889.30 |
| P0.8 | 46639.89 |
| P0.9 | 46390.48 |
| P1.0 | 46141.07 |
| P1.1 | 45891.66 |
| P1.2 | 45642.28 |
| P1.3 | 45392.84 |
| P1.4 | 45143.43 |
| P1.5 | 44894.01 |
* P, the plot ratio, which is dimensionless.
Figure 14.
Analysis of the Impact of Plot Ratio Changes on “Total Stormwater Runoff to be Controlled and Utilized” Under A150 Condition.
Figure 14.
Analysis of the Impact of Plot Ratio Changes on “Total Stormwater Runoff to be Controlled and Utilized” Under A150 Condition.
3.1.4. Summary of Results
Based on the analysis results, the following design strategy guidelines are summarized: Under the same plot ratio conditions, larger land areas result in greater Total Stormwater Runoff to be Controlled and Utilized. This implies that, under the sponge city policy, urban design projects with larger land areas have higher demands for managing peak runoff. Consequently, the policy emphasizes dividing catchment areas in these larger-scale projects to disperse peak runoff pressure and avoid concentrated runoff treatment. Additionally, when land area is constant, a higher plot ratio correlates with an increased green roof ratio, which helps reduce the Total Stormwater Runoff to be Controlled and Utilized. This suggests that for high plot ratio urban design projects, the sponge city policy will guide designs to focus on developing green roofs and enhancing the runoff control potential of roof-related low-impact development facilities.
3.2. Impact of Secondary Indicators on Stormwater Runoff Control
This part of the calculation also requires presetting standard conditions. This study uses a low land area (50 hectares) / high plot ratio(1.5) (A50/P1.5) campus as an example. Referring to the “Stormwater Runoff Control Measures for Construction Projects in Guangzhou,” the minimum permeable paving ratio is set at 70%, and the minimum sunken green space ratio is set at 50%. Using the “Sponge City+” tool, results meeting the Volume Capture Ratio of Annual Rainfall requirements can be obtained. When the green roof ratio is set at 75%, the actual design rainfall reaches 43.52mm, which is higher than the control target of 43.4mm, thus meeting the design requirements. Under these conditions, the actual storage volume is 2701.125m3, the design storage volume is 2693.60m3, and the Total Stormwater Runoff to be Controlled and Utilized is 4864.98m3. Therefore, the scenario with a green roof ratio of 75%, sunken green space ratio of 50%, and permeable paving ratio of 70% is selected as the standard condition.
3.2.1. Impact of Key Underlying Surfaces on Total Stormwater Runoff
Using the A50/P1.5 type campus as an example, the secondary indicators analyzed are the green roof ratio, sunken green space ratio, and permeable paving ratio. Each of these indicators is controlled and simulated separately. Additionally, based on the analysis results of the three variable experiments, the calculation results for the three secondary indicators are plotted as line graphs. Further analysis of other campus types reveals that the size of the land area does not affect the final results, but different plot ratios produce different outcomes. For ease of analysis, experimental samples with plot ratios of 1.5(Table 5~3), 1.0, and 0.5 are compared (Figure 15). By interpreting the line graphs of the statistical results, the following conclusions can be drawn:
- According to Figure 15(a), the sensitivity coefficients of the secondary indicators, ranked from highest to lowest, are: sunken green space ratio > permeable paving ratio ≈ green roof ratio;
- A horizontal comparison of the sensitivity line graphs of secondary indicators with different plot ratios shows that at lower plot ratios, the sensitivity of the permeable paving ratio is higher relative to the green roof ratio (Figure 15(b));
- As the plot ratio increases, the sensitivity of the permeable paving ratio and the green roof ratio tends to become consistent (Figure 15(c)).
Table 5.
Sensitivity Analysis of Green Roof Ratio (75% as Standard Condition).
| Variables | 0% | 10% | 20% | 30% | 40% | 50% | 60% | 70% | 75% | 80% | 90% | 100% |
|---|---|---|---|---|---|---|---|---|---|---|---|---|
| ΔFGR | -0.75 | -0.65 | -0.55 | -0.45 | -0.35 | -0.25 | -0.15 | -0.05 | 0.00 | 0.05 | 0.15 | 0.25 |
| QGR | 31.83 | 32.83 | 33.89 | 35.02 | 36.23 | 37.52 | 38.91 | 40.41 | 41.20 | 42.03 | 43.78 | 45.69 |
| ΔQGR | -9.37 | -8.37 | -7.31 | -6.18 | -4.97 | -3.68 | -2.29 | -0.79 | 0.00 | 0.83 | 2.58 | 4.49 |
| SGR | 12.49 | 12.88 | 13.29 | 13.73 | 14.21 | 14.71 | 15.25 | 15.79 | - | 16.56 | 17.20 | 17.94 |
* ΔFGR represents the change in the green roof ratio, QGR represents the design rainfall resulting from the change in the green roof ratio, ΔQGR represents the change in design rainfall resulting from the change in the green roof ratio, SGR represents the sensitivity coefficient of the green roof ratio.
Table 6.
Sensitivity Analysis of Sunken Green Space Ratio (50% as Standard Condition).
| Variables | 0% | 10% | 20% | 30% | 40% | 50% | 60% | 70% | 80% | 90% | 100% |
|---|---|---|---|---|---|---|---|---|---|---|---|
| ΔFSC | -0.50 | -0.40 | -0.30 | -0.20 | -0.10 | 0.00 | 0.10 | 0.20 | 0.30 | 0.40 | 0.50 |
| QSC | 0.00 | 8.24 | 16.48 | 24.72 | 32.96 | 41.20 | 49.44 | 57.68 | 65.93 | 74.17 | 82.41 |
| ΔQSC | -41.20 | -32.96 | -24.72 | -16.48 | -8.24 | 0.00 | 8.24 | 16.48 | 24.73 | 32.97 | 41.21 |
| SSC | 82.40 | 82.40 | 82.40 | 82.39 | 82.37 | - | 82.44 | 82.42 | 82.42 | 82.42 | 82.41 |
* ΔFSC represents the change in the sunken green space ratio, QSC represents the design rainfall resulting from the change in the sunken green space ratio, ΔQSC represents the change in design rainfall resulting from the change in the sunken green space ratio, SSC represents the sensitivity coefficient of the sunken green space ratio.
Table 7.
Sensitivity Analysis of Permeable Paving Ratio (70% as Standard Condition).
| Variables | 0% | 10% | 20% | 30% | 40% | 50% | 60% | 70% | 80% | 90% | 100% |
|---|---|---|---|---|---|---|---|---|---|---|---|
| ΔFPP | -0.70 | -0.60 | -0.50 | -0.40 | -0.30 | -0.20 | -0.10 | 0.00 | 0.10 | 0.20 | 0.30 |
| Q PP | 31.98 | 33.04 | 34.16 | 35.37 | 36.67 | 38.07 | 39.57 | 41.20 | 42.97 | 44.90 | 47.01 |
| ΔQ PP | -9.22 | -8.16 | -7.04 | -5.83 | -4.53 | -3.13 | -1.63 | 0.00 | 1.77 | 3.70 | 5.81 |
| S PP | 13.17 | 13.61 | 14.07 | 14.57 | 15.10 | 15.67 | 16.27 | - | 17.74 | 18.52 | 19.38 |
* ΔFpp represents the change in the permeable paving ratio, Qpp represents the design rainfall resulting from the change in the permeable paving ratio, ΔQpp represents the change in design rainfall resulting from the change in the permeable paving ratio, Spp represents the sensitivity coefficient of the permeable paving ratio.
Design Trends Based on Total Runoff Control Optimization Under Policy-Driven Approach: The sunken green space ratio plays a more significant role in total runoff control within sponge city, while the green roof ratio and permeable paving ratio contribute relatively less. Additionally, increasing the proportion of sunken green spaces can help reduce the reliance on more expensive green roof measures. Therefore, under the sponge city initiative, there is a strong emphasis on increasing the sunken green space ratio. In high plot ratio urban design schemes, emphasis is placed on increasing the green roof ratio; in low plot ratio urban design schemes, it is necessary to increase the permeable paving ratio to reduce the use of more expensive green roof facilities per unit cost.
3.2.2. Impact of Key Underlying Surfaces on Peak Stormwater Runoff
The specific method involves using the standard condition as a baseline (75% green roof ratio, 50% sunken green space ratio, 70% permeable paving ratio). By controlling the changes in the green roof ratio and permeable paving ratio, the “Sponge City+” tool is used to calculate the Total Stormwater Runoff to be Controlled and Utilized for each sample. The statistical results are shown in Table 8, Table 9 and Figure 16.
By analyzing the statistical results, we can draw the following conclusions:
- For schemes with the same land area but different plot ratios, the slope of the green roof ratio is smaller than that of the permeable paving ratio. However, as the plot ratio in-creases, the gap between the two decreases. When the scheme reaches a plot ratio of 1.5, the contribution gap between the green roof ratio and the permeable paving ratio in peak runoff control becomes minimal. Therefore, it can be concluded that the higher the plot ratio, the greater the contribution of the green roof ratio to peak runoff control;
- For schemes with the same land area but different plot ratios, the smaller the plot ratio, the greater the slope difference between the green roof ratio and the permeable paving ratio. Therefore, it can be concluded that the smaller the plot ratio, the greater the contribution of the permeable paving ratio to peak runoff control.
Policy-Driven Design Trends Based on Peak Runoff Control Optimization: In the context of sponge city policies (specifically, the “guidelines” [13]), for high plot ratio schemes, the contribution of the green roof ratio to peak runoff control is greater. This indicates that to achieve optimal peak runoff control, high plot ratio urban design schemes should emphasize increasing and utilizing the green roof ratio. For low plot ratio schemes, the permeable paving ratio is more significant compared to the green roof ratio in terms of peak runoff control. This suggests that to achieve both ideal peak runoff control and cost-effectiveness, low plot ratio urban design schemes should focus on increasing and applying the permeable paving ratio.
4. Discussions
4.1. Significance of the Study
4.1.1. Significance of the Parametric Design Framework Construction
Currently, there is a lack of rainstorm simulation tools for urban designers and architects that can effectively enable interactive design. The rainwater+ toolkit developed by Yujiao Chen et al. and the SRTF tool developed by Julius Morschek et al. both utilize the Grasshopper parametric design platform, which is more suitable for early-stage urban design rainstorm analysis, providing significant inspiration for this study [45,46]. This study, based on the performance evaluation requirements of sponge city policies (specifically, the “ Volume Method “[13]), proposes a parametric collaborative design method to achieve automatic numerical simulation and evaluation of sponge city design outcomes. The toolbox, built on the Grasshopper platform, uses built-in programs and c## language to create related plugins. Due to its open-source nature, simplicity, and interactivity, this toolbox enables real-time feedback in sponge city design, shifting from the traditional “post-evaluation” model of sponge city design and paving the way for future related research (Figure 17). Additionally, this toolbox addresses the issue of insufficient numerical simulation samples. By setting parameters, it can efficiently generate multiple schemes that meet performance evaluation requirements, providing a solid foundation for the sensitivity analysis component of this study.
4.1.2. Significance of the “Form-Performance” Correlation Indicator Analysis
In practical engineering design work, the impact of early-stage urban design on stormwater runoff control performance is often overlooked. This study, through the analysis of “form-performance” correlation indicators and the construction of a correlation model, clarifies the logical connections between these factors. Although this correlation logic is based on sponge city-related policies and its actual effectiveness needs further verification, the research still holds positive significance for interdisciplinary collaborative research on flood resilience. Overall, by establishing design-driven and policy-driven correlation models, this study delves into the “black box” of sponge city design, identifying key influencing factors in urban design under the guidance of sponge city policies. This approach provides clear design guidelines for future urban designers.
4.1.3. Significance of Sensitivity Analysis of Key Indicators
The impact of sponge city policies on urban design, as well as the potential risks they may pose, are currently unexplored. Through sensitivity analysis of key indicators, this study clarifies how sponge city policies influence urban design. These analyses help identify key measures that may be widely used or even become overused, as well as key indicators that might not be promoted due to their lack of superior performance. Additionally, the study highlights other potential risks that future urban design may encounter. These insights have positive implications for policy revision and design optimization.
4.2. Limitations
The limitations of this study are as follows: Firstly, while this study attempts to quantify the impact of sponge city policies on urban design by proposing a collaborative design framework, the parametric design framework primarily optimizes processes that are heavily influenced by the subjective decisions of designer. As a result, it cannot fully capture the policy-driven influence on sponge city design. Secondly, there are inherent limitations in the “policy-driven” analysis, as it does not account for the impact of actual rainfall events on urban design; it focuses solely on the limitations of the policy itself. Future studies should incorporate real data to improve scientific rigor. Lastly, this study emphasizes the impact of underlying surfaces on stormwater runoff control, particularly non-point source control, but it does not consider the comprehensive influence of the stormwater drainage network. Therefore, future research should strengthen collaboration with water supply and drainage professionals to achieve more systematic research conclusions.
In general, the aim of this research was to offer suggestions for China’s sponge city policies, which might limit the paper’s international perspective. However, we believe it can also benefit other countries. Firstly, the design framework explored in this paper can serve as a toolkit for urban designers and researchers in other countries. In broader contexts, since different nations have varying urban planning goals and stormwater runoff calculation methods, one only needs to adjust the performance calculation methods to repurpose this framework. Secondly, because mainland China encompasses diverse climatic conditions, if the actual effectiveness of China’s sponge city “Volume Method” (the core rule of our design framework) is validated in the future, the toolkit proposed in this paper could be applied in a wider range of countries.
5. Conclusions
Achieving Rainfall-Runoff-Driven Urban Design: Using Grasshopper for Rhino and Rhinoceros, this study constructs a parametric design framework that enables the implementation of stormwater runoff control in the early stages of urban design. Under various conditions, this framework also facilitates sensitivity analyses for different key indicators. The research process serves as an empirical demonstration, verifying the effectiveness of the design framework. Potential applications include compliance checks for individual design schemes and conducting sensitivity analyses through the rapid generation of multiple compliant solutions.
Establishing a Correlation Model of Key Indicators: By analyzing the rules of the compliance check method (“Volume Method”) described in the “Guidelines,” this study explores a correlation model that ultimately links stormwater runoff control performance data to underlying surface morphology data in urban design. The study clarifies that, in the early stages of urban design, four primary indicators are controlled: green space ratio, roof ratio, water body ratio, and pavement ratio. The secondary indicators are the proportions of LID measures associated with these four categories. For different types of urban design projects, both the plot ratio and the land area also significantly influence sponge city design.
Summarized the impacts of sponge city policies on various key indicators in urban design:
- For high Plot Ratio urban project types, sponge city policies will guide the increase in average building heights to achieve reduced building density, thereby increasing the green space ratio and decreasing the area of hardened catchments;
- For urban project types with larger construction land areas, due to higher potential peak stormwater runoff, sponge city policies will emphasize peak runoff control. This will be achieved through rational catchment zoning design to prevent excessive concentrated runoff treatment;
- As the Plot Ratio increases, the importance of green roofs in controlling total runoff and peak runoff also rises. Consequently, sponge city policies will guide urban design schemes with higher Plot Ratio projects to adopt more green roof measures;
- For urban project types with lower Plot Ratio, permeable paving significantly contributes to controlling total runoff and peak runoff, while green roofs contribute less. Therefore, sponge city will encourage low Plot Ratio sites to adopt permeable paving as a cost-effective alternative to green roofs;
- The sunken green space ratio is one of the most important secondary indicators, and sponge city policies will lead to the widespread use of sunken green spaces.
In summary, under policy-driven guidance, urban design is likely to trend towards lower density, higher green space ratios, and decentralized development. High plot ratio urban design schemes will see widespread adoption of green roof strategies, while low plot ratio schemes will favor permeable paving strategies. Given the high efficiency of sunken green spaces in sponge city evaluations, this strategy is expected to be widely implemented, though there is a risk of it being overused. However, it’s important to note that sunken green spaces are only suitable for plants with strong water tolerance, which could potentially harm biodiversity.
Furthermore, we note two issues with sponge city policies. First, there is a lack of redundancy consideration for extreme rainfall events. Current sponge city policies design targets based on average rainfall for different cities, which means that areas with lower average rainfall may lack the capacity to handle heavy rains. To address this, future sponge city policies should incorporate the concept of “resilience” by incorporating appropriate redundancy in design, enhancing urban spaces’ ability to cope with sudden heavy rain events. Second, there is an overemphasis on numerical indicators at the expense of spatial design quality. The current implementation of sponge city policies primarily evaluates construction outcomes based on the achievement of performance targets, focusing on numerical requirements. However, whether specific facilities are effectively designed to collect and manage rainwater during events is not part of the evaluation. This could result in urban designs that prioritize meeting indicators over ensuring functional and effective design. Therefore, future sponge city construction should not only include mandatory performance targets but also strengthen guiding design goals to ensure that the designed facilities perform as intended.
Author Contributions
Conceptualization, K.X.; methodology, K.X.; software, S.W. and K.X.; validation, K.X., X.Y. and H.W.; formal analysis, K.X., R.H. and H.W.; investigation, R.H. and K.X.; resources, K.X.; data curation, K.X.; writing—original draft preparation, K.X.; writing—review and editing, S.W. and K.X. visualization, C.Z., X.Y. and H.W.; supervision, S.W.; project administration, K.X. All authors have read and agreed to the published version of the manuscript.
Funding
This research received no external funding.
Data Availability Statement
Data are contained within the article.
Acknowledgments
During the preparation of this manuscript, the authors used Chat-gpt in order to improve language and readability. The authors have reviewed and edited the output and take full responsibility for the content of this publication.
Conflicts of Interest
The authors declare no conflicts of interest.
Abbreviation
The following abbreviations are used in this manuscript:
| LID | low impact development |
References
- Extreme Weather Events Are the New Normal. Nature 2017, 548, 499–499. [CrossRef]
- Ministry of Water Resource of the People’s Republic of China China Flood and Drought Disaster Prevention Bulletin; 2023.
- Qiu, B. The Connotation, Approaches, and Prospects of Sponge City (LID). Water Supply Drain. 2015, 1–7. [CrossRef]
- Yu K.; Li D.; Yuan H.; Fu W.; Qiao Q.; Wang S. “Sponge City” Theory and Practice. Urban Plan. 2015, 26–36.
- Yin, D.; Xu, C.; Jia, H.; Yang, Y.; Sun, C.; Wang, Q.; Liu, S. Sponge City Practices in China: From Pilot Exploration to Systemic Demonstration. Water 2022, 14, 1531. [CrossRef]
- Yin, D.; Chen, Y.; Jia, H.; Wang, Q.; Chen, Z.; Xu, C.; Li, Q.; Wang, W.; Yang, Y.; Fu, G.; et al. Sponge City Practice in China: A Review of Construction, Assessment, Operational and Maintenance. J. Clean. Prod. 2021, 280, 124963. [CrossRef]
- Lee, Y.-J.; Lin, S.-Y.; Pong, C.-S.; Lin, S.-B. Strategic Planning for Taipei Sponge City. IOP Conf. Ser. Earth Environ. Sci. 2018, 191, 012132. [CrossRef]
- Wu, R.; Yang, Y.; He, J.; Zhu, J. A Core Framework of “Mountain Management–Water Management–Moist City” for Sponge City Special Planning: The Case of Northwestern China. Front. Public Health 2022, 10. [CrossRef]
- Peng, Y.; Reilly, K. Using Nature to Reshape Cities and Live with Water: An Overview of the Chinese Sponge City Programme and Its Implementation in Wuhan. Rep. EU Proj. GROWGREEN—Green Cities Clim. Water Resil. Sustain. Econ. Growth Healthy Citiz. Environ. Grant Agreem. No 730283 2021.
- 1Yawen, W.; Jun, L.; Haowen, X.; Guangyuan, Y.; Hong, Z.; Yichen, Y. Towards Government Mechanisms of Sponge City Construction in China: Insights from Developed Countries. Water Policy 2020, 22, 574–590. [CrossRef]
- Hawken, S.; Sepasgozar, S.M.E.; Prodanovic, V.; Jing, J.; Bakelmun, A.; Avazpour, B.; Che, S.; Zhang, K. What Makes a Successful Sponge City Project? Expert Perceptions of Critical Factors in Integrated Urban Water Management in the Asia-Pacific. Sustain. Cities Soc. 2021, 75, 103317. [CrossRef]
- Assessment Standard for Sponge City Construction Effect; 2018.
- Ministry of Housing and Urban-Rural Development of the People’s Republic of China Technical Guidelines for Sponge City Construction – Construction of Stormwater Systems for Low-Impact Development; 2014.
- Technical Code for Rainwater Management and Utilization of Building and Sub-District; 2016.
- China State Council Disaster Investigation Team Investigation Report on the “7·20” Heavy Rainstorm Disaster in Zhengzhou, Henan Province; 2022.
- Sohn, W.; Kim, J.-H.; Li, M.-H.; Brown, R. The Influence of Climate on the Effectiveness of Low Impact Development: A Systematic Review. J. Environ. Manage. 2019, 236, 365–379. [CrossRef]
- Hua, P.; Yang, W.; Qi, X.; Jiang, S.; Xie, J.; Gu, X.; Li, H.; Zhang, J.; Krebs, P. Evaluating the Effect of Urban Flooding Reduction Strategies in Response to Design Rainfall and Low Impact Development. J. Clean. Prod. 2020, 242, 118515. [CrossRef]
- Zeng, S.; Guo, H.; Dong, X. Understanding the Synergistic Effect between LID Facility and Drainage Network: With a Comprehensive Perspective. J. Environ. Manage. 2019, 246, 849–859. [CrossRef]
- Mao, X.; Jia, H.; Yu, S.L. Assessing the Ecological Benefits of Aggregate LID-BMPs through Modelling. Ecol. Model. 2017, 353, 139–149. [CrossRef]
- Ding, M.-Q.; Lu, M.-Y.; Cui, C.-H.; Ding, J.; Pang, J.-W.; Ren, N.-Q.; Yang, S.-S. ESSCC: A New Multi-Scale and Extensively Applicable Evaluation System for the Construction of Sponge Cities. Sustain. Horiz. 2023, 8, 100069. [CrossRef]
- Qi, Y.; Chan, F.K.S.; Thorne, C.; O’Donnell, E.; Quagliolo, C.; Comino, E.; Pezzoli, A.; Li, L.; Griffiths, J.; Sang, Y.; et al. Addressing Challenges of Urban Water Management in Chinese Sponge Cities via Nature-Based Solutions. Water 2020, 12, 2788. [CrossRef]
- A Bibliometric Analysis of the Research on Sponge City: Current Situation and Future Development Direction - Zha - 2021 - Ecohydrology - Wiley Online Library Available online: https://onlinelibrary.wiley.com/doi/10.1002/eco.2328 (accessed on 6 December 2024).
- Chen, L.; Ng, E.; An, X.; Ren, C.; Lee, M.; Wang, U.; He, Z. Sky View Factor Analysis of Street Canyons and Its Implications for Daytime Intra-urban Air Temperature Differentials in High-rise, High-density Urban Areas of Hong Kong: A GIS-based Simulation Approach. Int. J. Climatol. 2012, 32, 121–136. [CrossRef]
- Jalali, Z.; Noorzai, E.; Heidari, S. Design and Optimization of Form and Facade of an Office Building Using the Genetic Algorithm. Sci. Technol. Built Environ. 2020, 26, 128–140. [CrossRef]
- Chatzidimitriou, A.; Yannas, S. Microclimate Development in Open Urban Spaces: The Influence of Form and Materials. Energy Build. 2015, 108, 156–174. [CrossRef]
- Xue, F.; Gou, Z.; Lau, S.S.Y. Green Open Space in High-Dense Asian Cities: Site Configurations, Microclimates and Users’ Perceptions. Sustain. Cities Soc. 2017, 34, 114–125. [CrossRef]
- Mushore, T.D.; Odindi, J.; Dube, T.; Matongera, T.N.; Mutanga, O. Remote Sensing Applications in Monitoring Urban Growth Impacts on In-and-out Door Thermal Conditions: A Review. Remote Sens. Appl. Soc. Environ. 2017, 8, 83–93. [CrossRef]
- Huang, C.; Zhang, G.; Yao, J.; Wang, X.; Calautit, J.K.; Zhao, C.; An, N.; Peng, X. Accelerated Environmental Performance-Driven Urban Design with Generative Adversarial Network. Build. Environ. 2022, 224, 109575. [CrossRef]
- Beirão, J.; Montenegro, N.; Arrobas, P. City Information Modelling: Parametric Urban Models Including Design Support Data.; July 2012.
- De Luca, F. Environmental Performance-Driven Urban Design: Parametric Design Method for the Integration of Daylight and Urban Comfort Analysis in Cold Climates. In Computer-Aided Architectural Design. “Hello, Culture”; Lee, J.-H., Ed.; Communications in Computer and Information Science; Springer Singapore: Singapore, 2019; Vol. 1028, pp. 15–31 ISBN 978-981-13-8409-7.
- Amado, M.; Poggi, F. Solar Urban Planning: A Parametric Approach. Energy Procedia 2014, 48, 1539–1548. [CrossRef]
- Steinø, N. Parametric Urban Design from Concept to Practice. In Proceedings of the Blucher Design Proceedings; Editora Blucher: Porto, Portugal, December 2019; pp. 817–826.
- Hazbei, M.; Cucuzzella, C. Revealing a Gap in Parametric Architecture’s Address of “Context.” Buildings 2023, 13, 3136. [CrossRef]
- van den Bout, B.; Jetten, V.G.; van Westen, C.J.; Lombardo, L. A Breakthrough in Fast Flood Simulation. Environ. Model. Softw. 2023, 168, 105787. [CrossRef]
- Rahman, A.; Weinmann, P.E.; Hoang, T.M.T.; Laurenson, E.M. Monte Carlo Simulation of Flood Frequency Curves from Rainfall. J. Hydrol. 2002. [CrossRef]
- Charalambous, J.; Rahman, A.; Carroll, D. Application of Monte Carlo Simulation Technique to Design Flood Estimation: A Case Study for North Johnstone River in Queensland, Australia. Water Resour. Manag. 2013, 27, 4099–4111. [CrossRef]
- Löwe, R.; Urich, C.; Sto. Domingo, N.; Mark, O.; Deletic, A.; Arnbjerg-Nielsen, K. Assessment of Urban Pluvial Flood Risk and Efficiency of Adaptation Options through Simulations – A New Generation of Urban Planning Tools. J. Hydrol. 2017, 550, 355–367. [CrossRef]
- Niazi, M.; Nietch, C.; Maghrebi, M.; Jackson, N.; Bennett, B.R.; Tryby, M.; Massoudieh, A. Storm Water Management Model: Performance Review and Gap Analysis. J. Sustain. Water Built Environ. 2017, 3, 10.1061/jswbay.0000817. [CrossRef]
- Nkwunonwo, U.C.; Whitworth, M.; Baily, B. A Review of the Current Status of Flood Modelling for Urban Flood Risk Management in the Developing Countries. Sci. Afr. 2020, 7, e00269. [CrossRef]
- Sherly, M.A.; Karmakar, S.; Chan, T.; Rau, C. Design Rainfall Framework Using Multivariate Parametric-Nonparametric Approach. J. Hydrol. Eng. 2016, 21, 04015049. [CrossRef]
- Gądek, W.; Baziak, B.; Tokarczyk, T.; Szalińska, W. A Novel Method of Design Flood Hydrographs Estimation for Flood Hazard Mapping. Water 2022, 14, 1856. [CrossRef]
- Martins, I.L.; Lyra, A.P. Development and Application of an Algorithmic-Parametric Tool to Assess the Contribution of Urban Forestry to Mitigate Floods. Int. J. Archit. Comput. 2022. [CrossRef]
- Balica, S.F.; Popescu, I.; Beevers, L.; Wright, N.G. Parametric and Physically Based Modelling Techniques for Flood Risk and Vulnerability Assessment: A Comparison. Environ. Model. Softw. 2013, 41, 84–92. [CrossRef]
- Mohanty, M.P.; Sherly, M.A.; Karmakar, S.; Ghosh, S. Regionalized Design Rainfall Estimation: An Appraisal of Inundation Mapping for Flood Management Under Data-Scarce Situations. Water Resour. Manag. 2018, 32, 4725–4746. [CrossRef]
- Chen, Y.; Samuelson, H.W.; Tong, Z. Integrated Design Workflow and a New Tool for Urban Rainwater Management. J. Environ. Manage. 2016, 180, 45–51. [CrossRef]
- Morschek, J.; König, R.; Schneider, S. An Integrated Urban Planning and Simulation Method to Enforce Spatial Resilience towards Flooding Hazards. In Proceedings of the Proceedings of the Symposium on Simulation for Architecture and Urban Design; 2019; pp. 1–8.
- Ke, X.; Yang, W.; Misheng, L.; Ranting, Z. Urban and Architectural Design from the Perspective of Flood Resilience: Framework Development and Case Study of a Chinese University Campus. J. Asian Archit. Build. Eng. 2023, 22, 3100–3114. [CrossRef]
- Sharifi, A. Resilient Urban Forms: A Review of Literature on Streets and Street Networks. Build. Environ. 2019, 147, 171–187. [CrossRef]
- Sharifi, A. Urban Form Resilience: A Meso-Scale Analysis. Cities 2019, 93, 238–252. [CrossRef]
- Overview of Natural Geography of Guangzhou City Available online: https://www.gz.gov.cn/zlgz/gzgk/zrdl/ (accessed on 24 December 2024).
Figure 1.
Workflow.
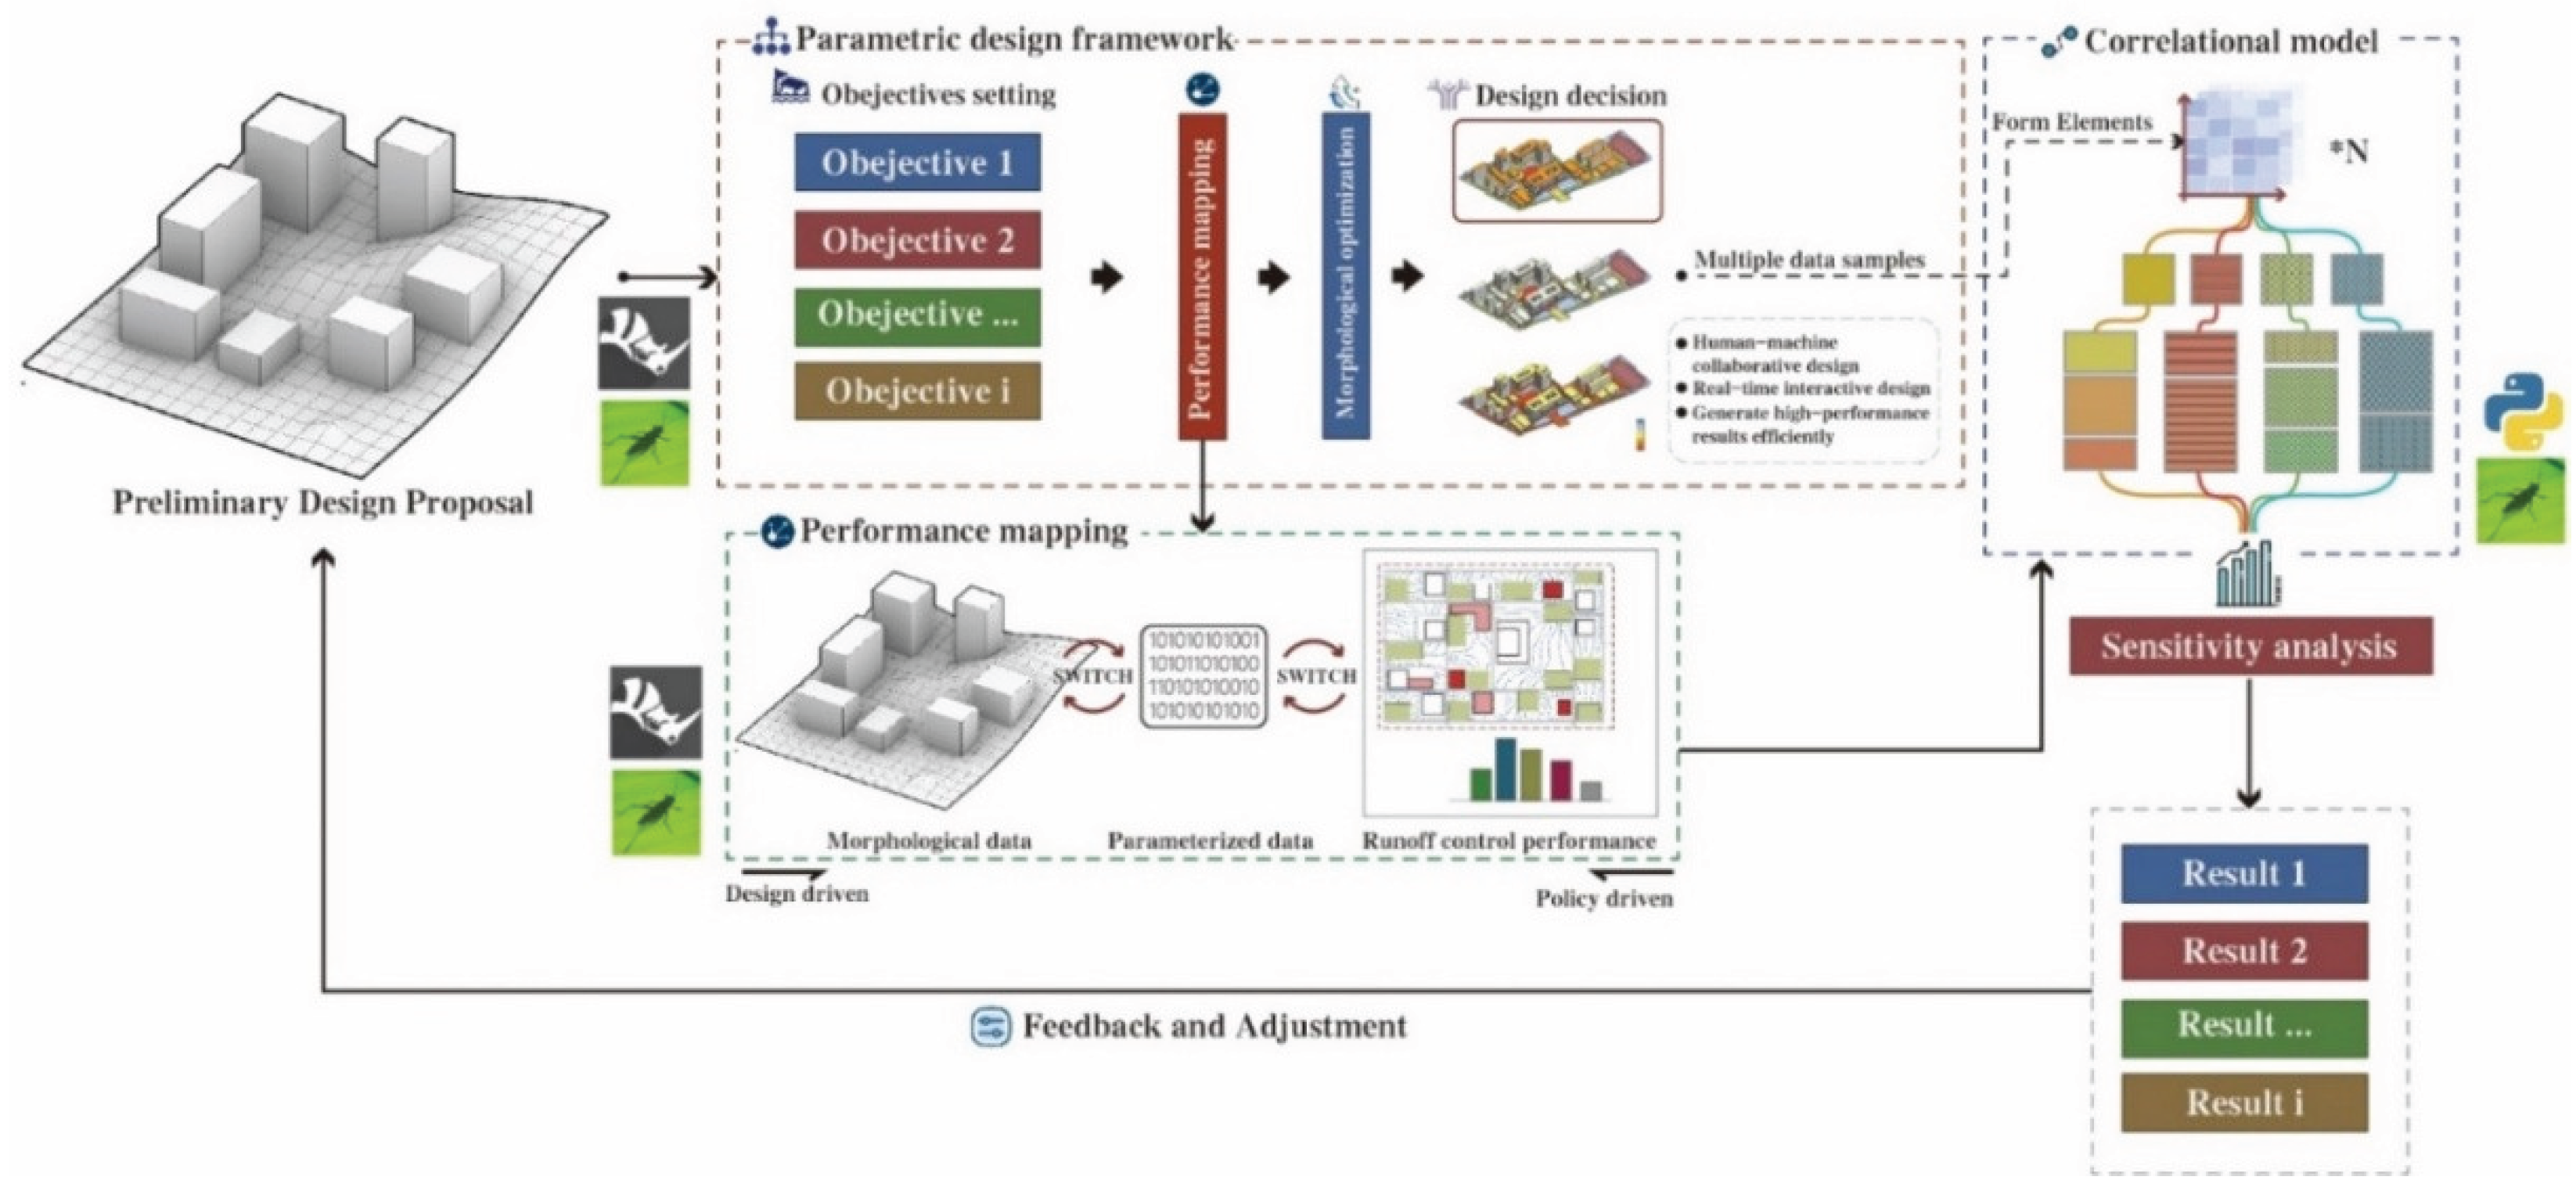
Figure 2.
Parametric Design Framework.
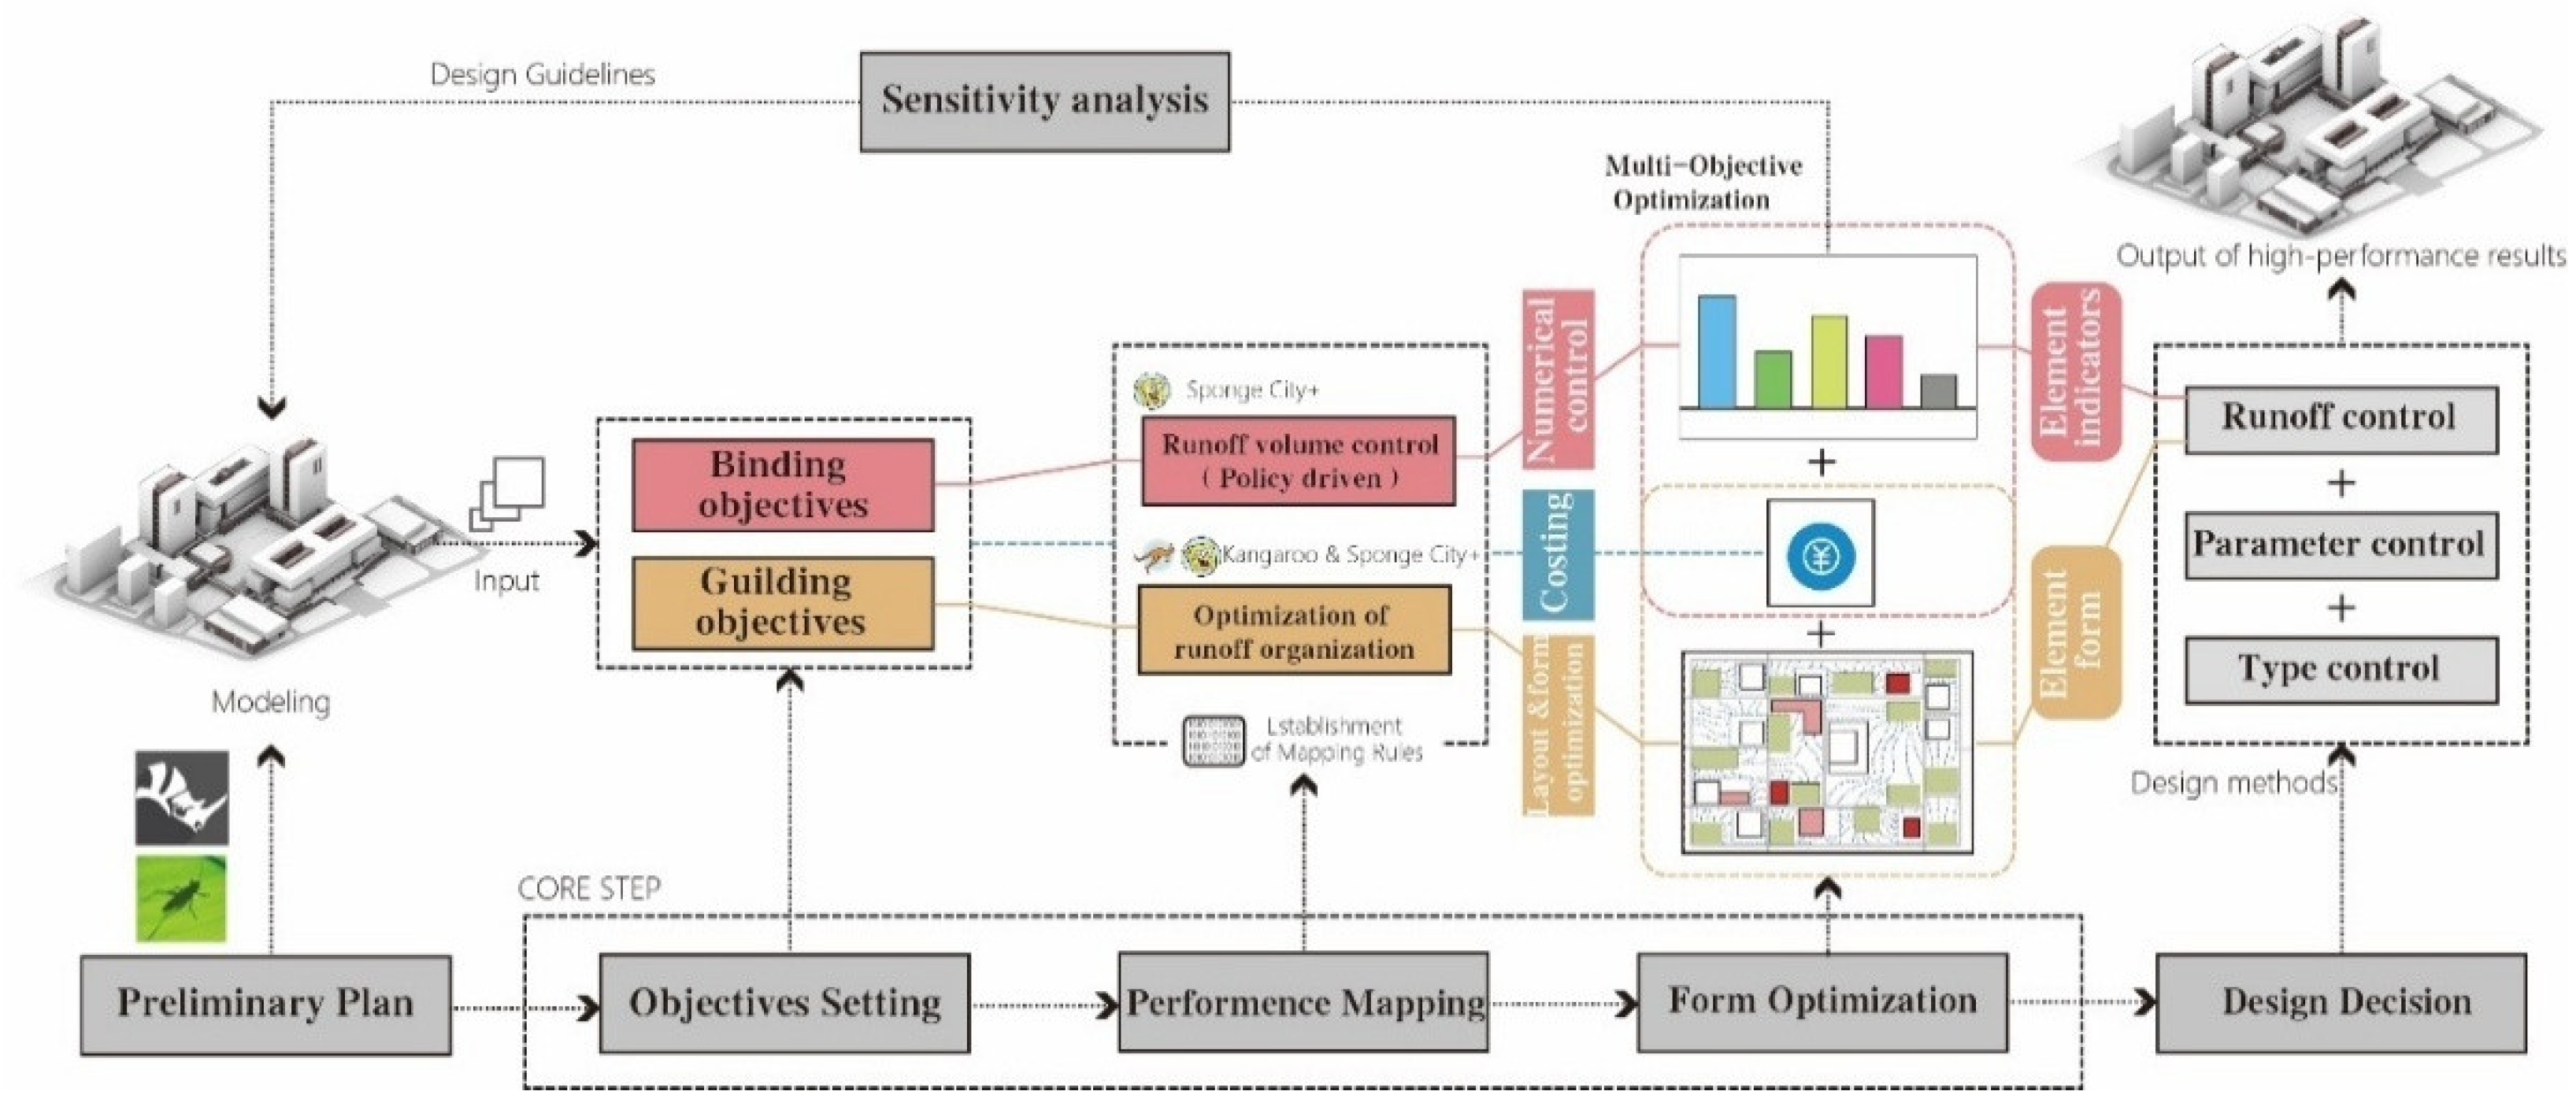
Figure 3.
A visualization module for the runoff control capabilities.
Figure 4.
A risk analysis module for building damage.
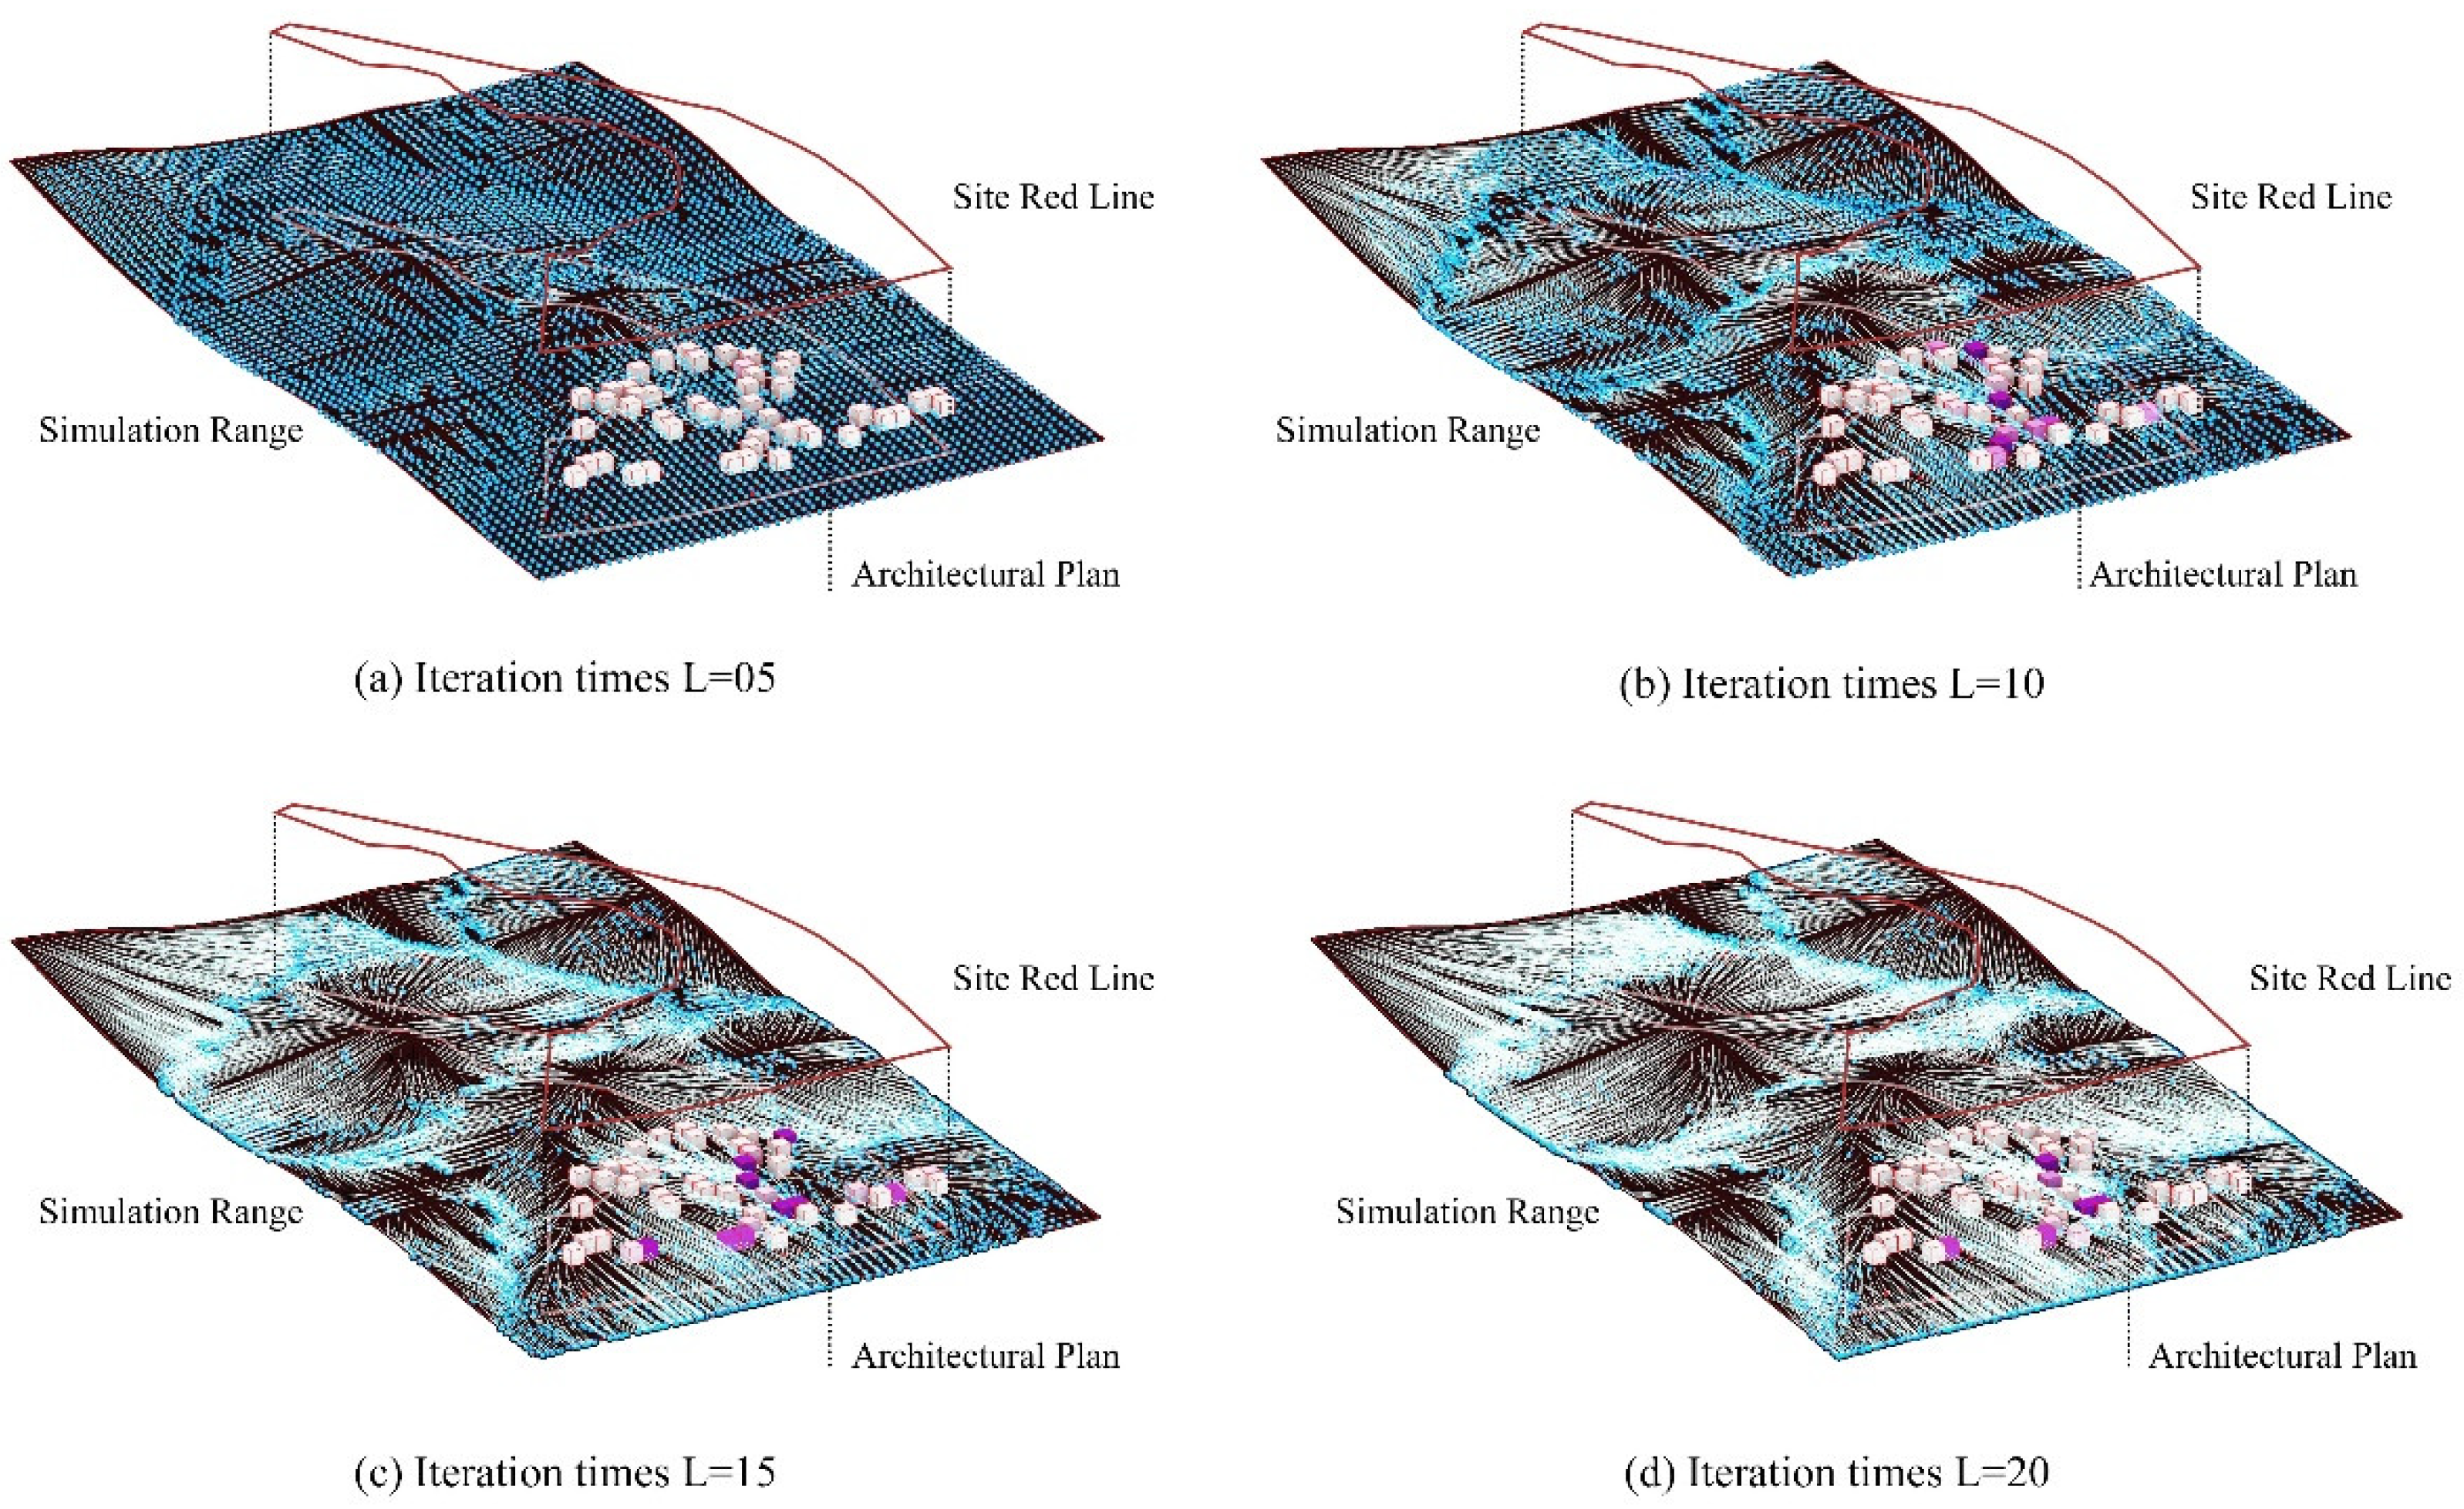
Figure 5.
Implementation Steps of the Volume Method.
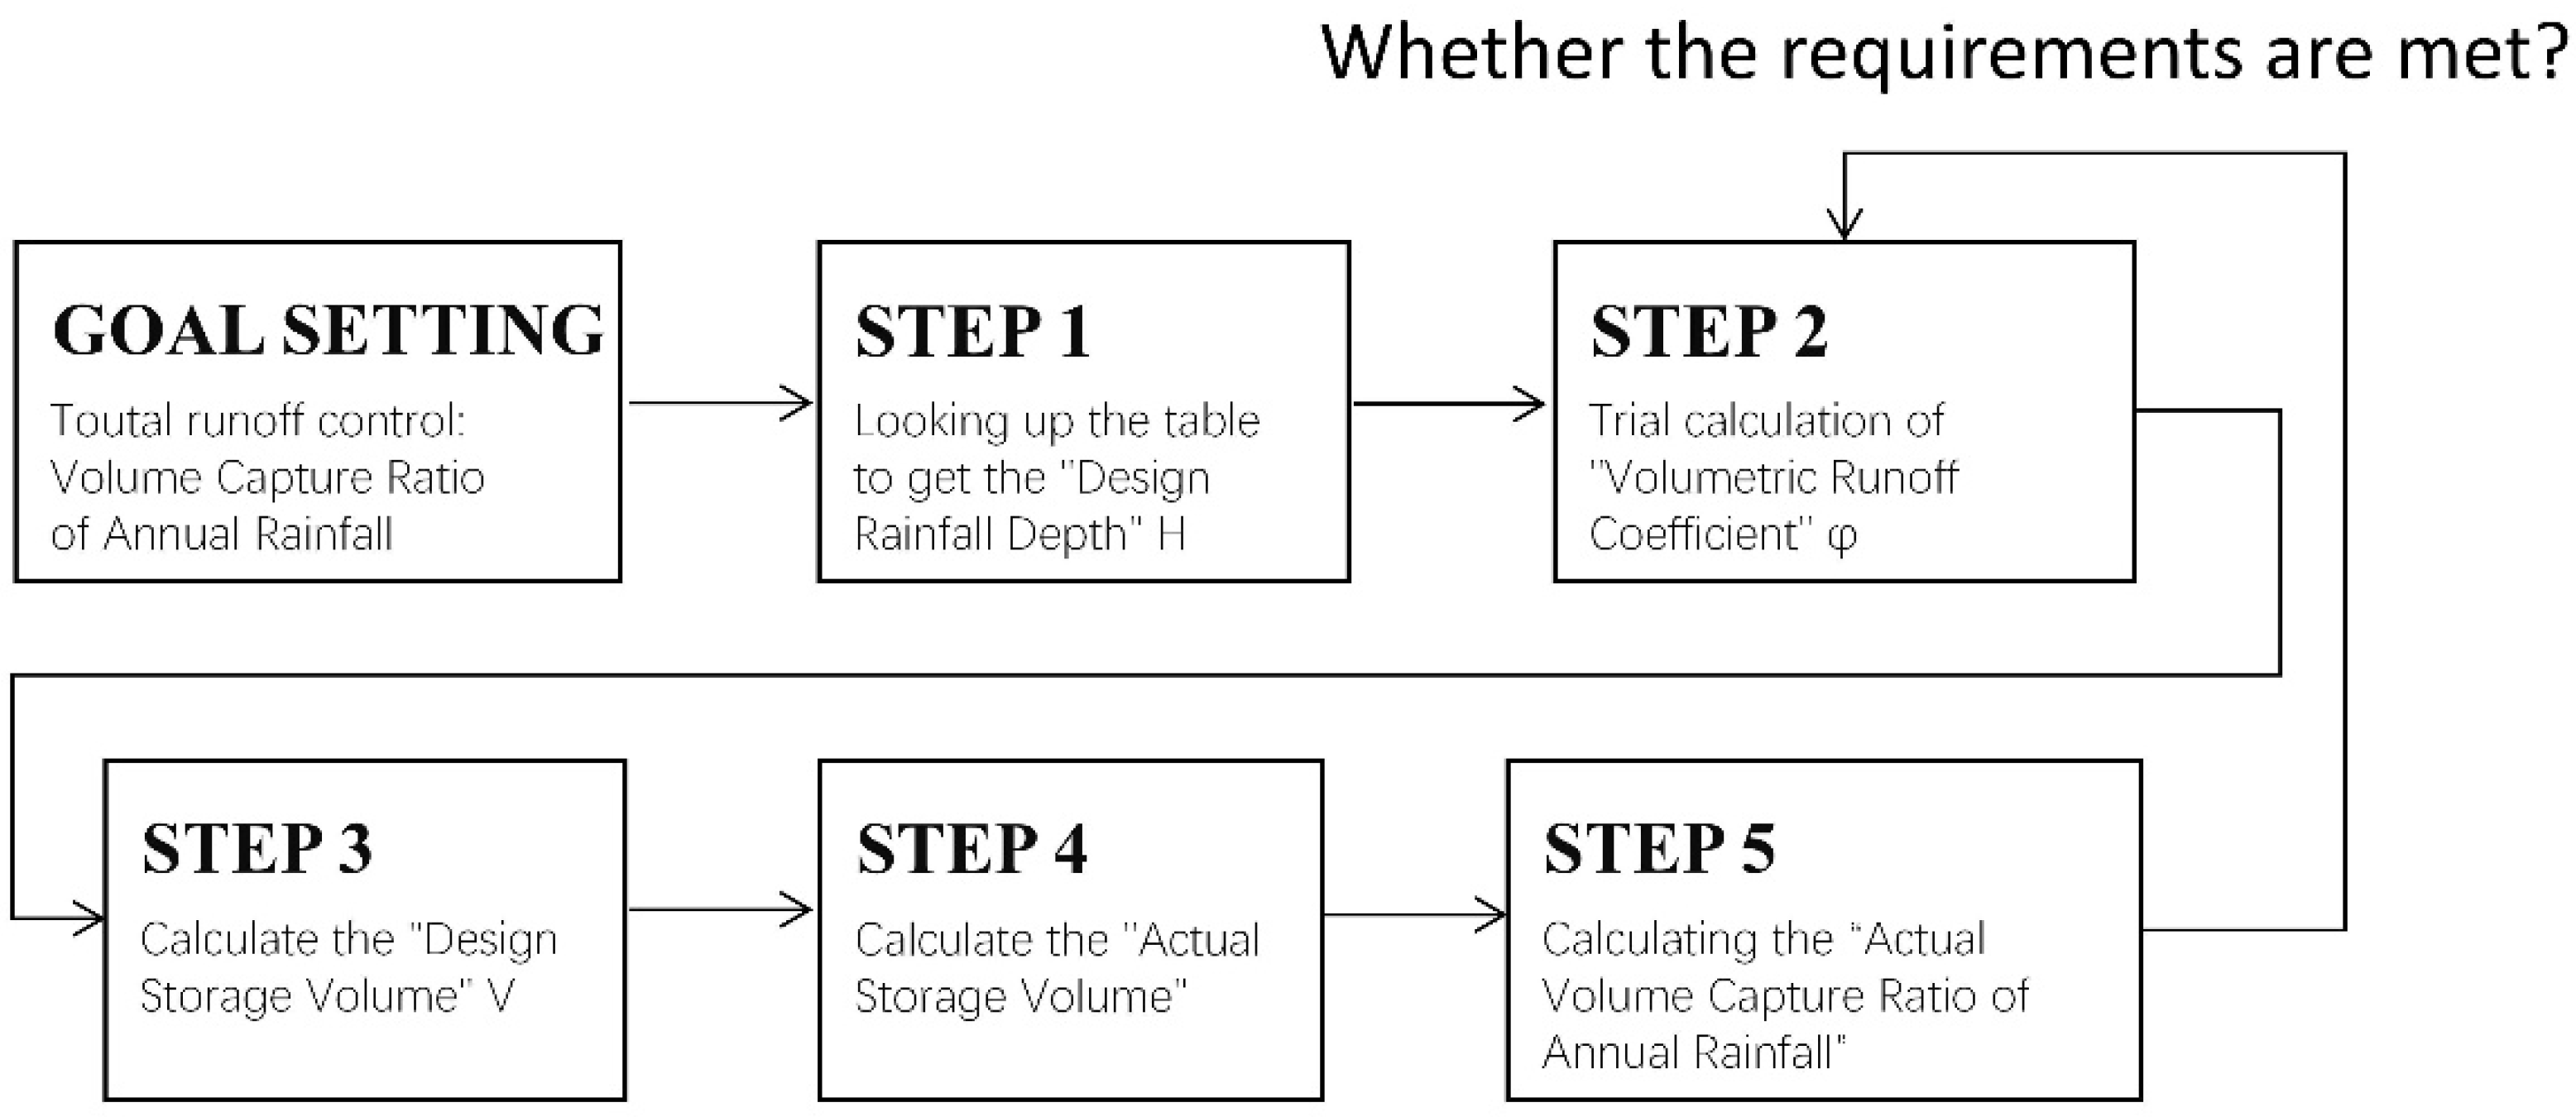
Figure 6.
Four Types of Elements Controlled in the Early Stages of Urban Design.
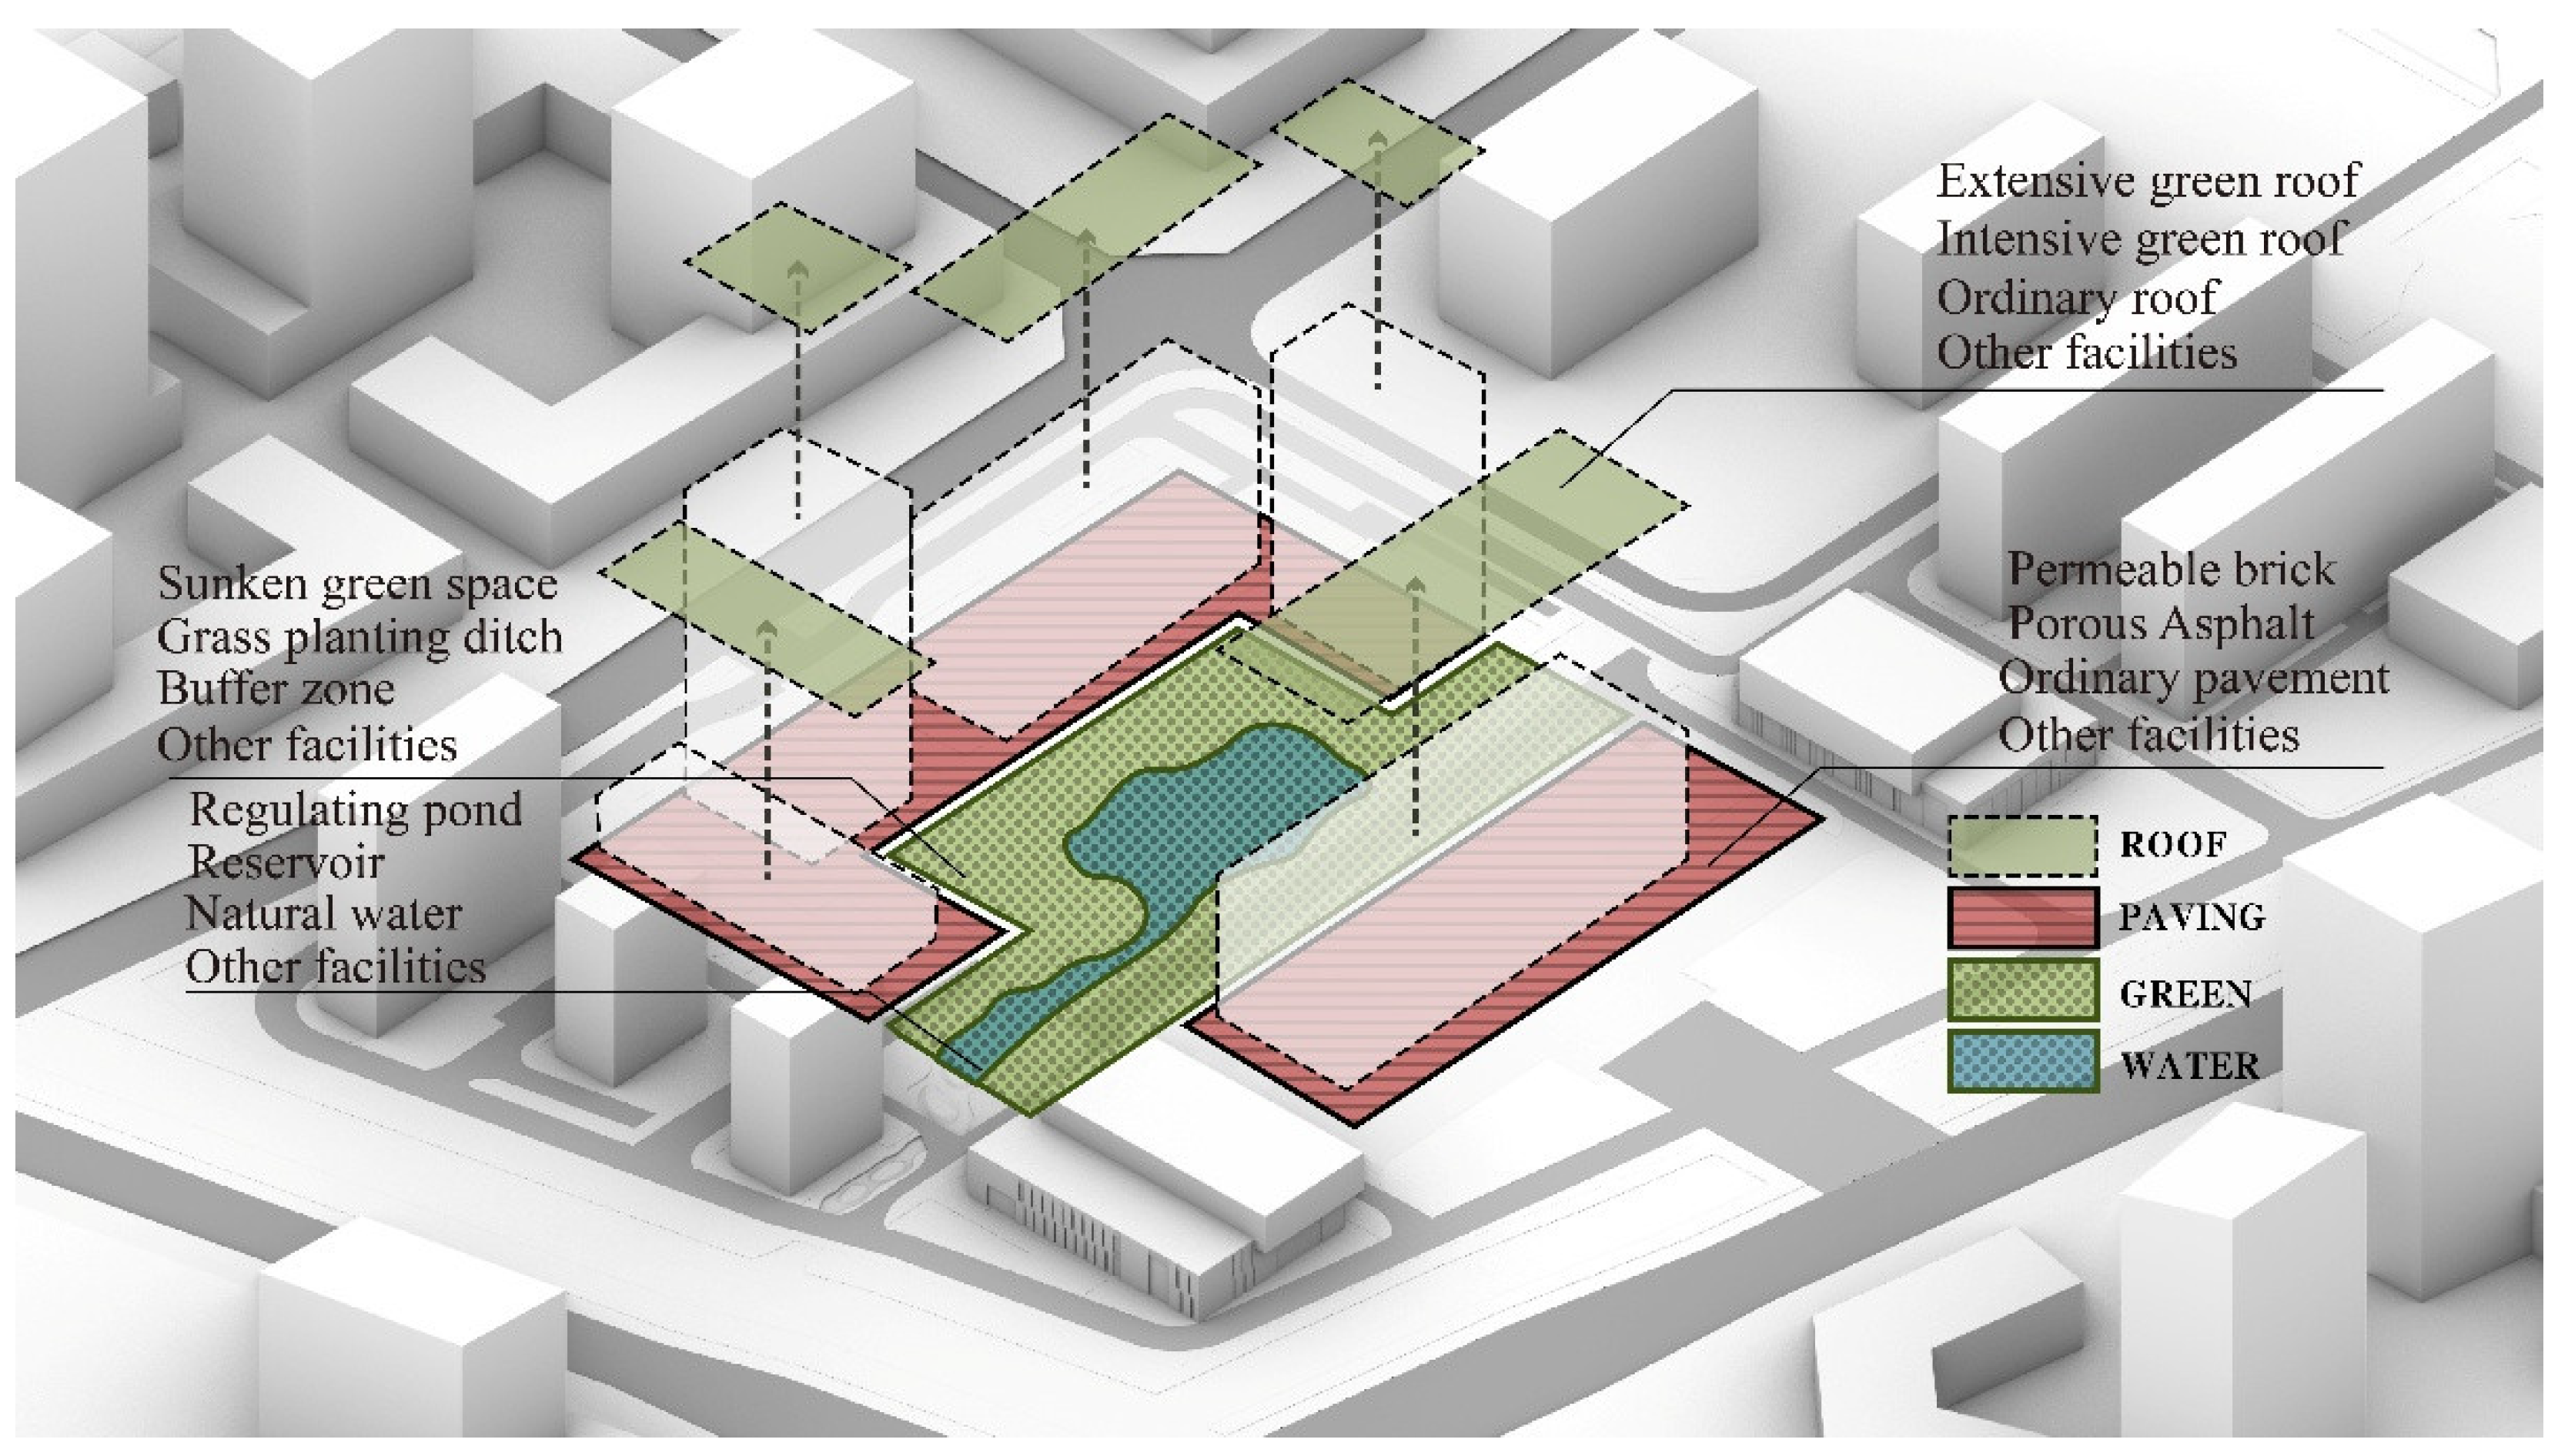
Figure 7.
Development framework for correlation model. * Rate, refers to the proportion associated with a particular spatial type, specifically the ratio of an indicator’s projected area to the projected area of its corresponding higher-level indicator.
Figure 7.
Development framework for correlation model. * Rate, refers to the proportion associated with a particular spatial type, specifically the ratio of an indicator’s projected area to the projected area of its corresponding higher-level indicator.
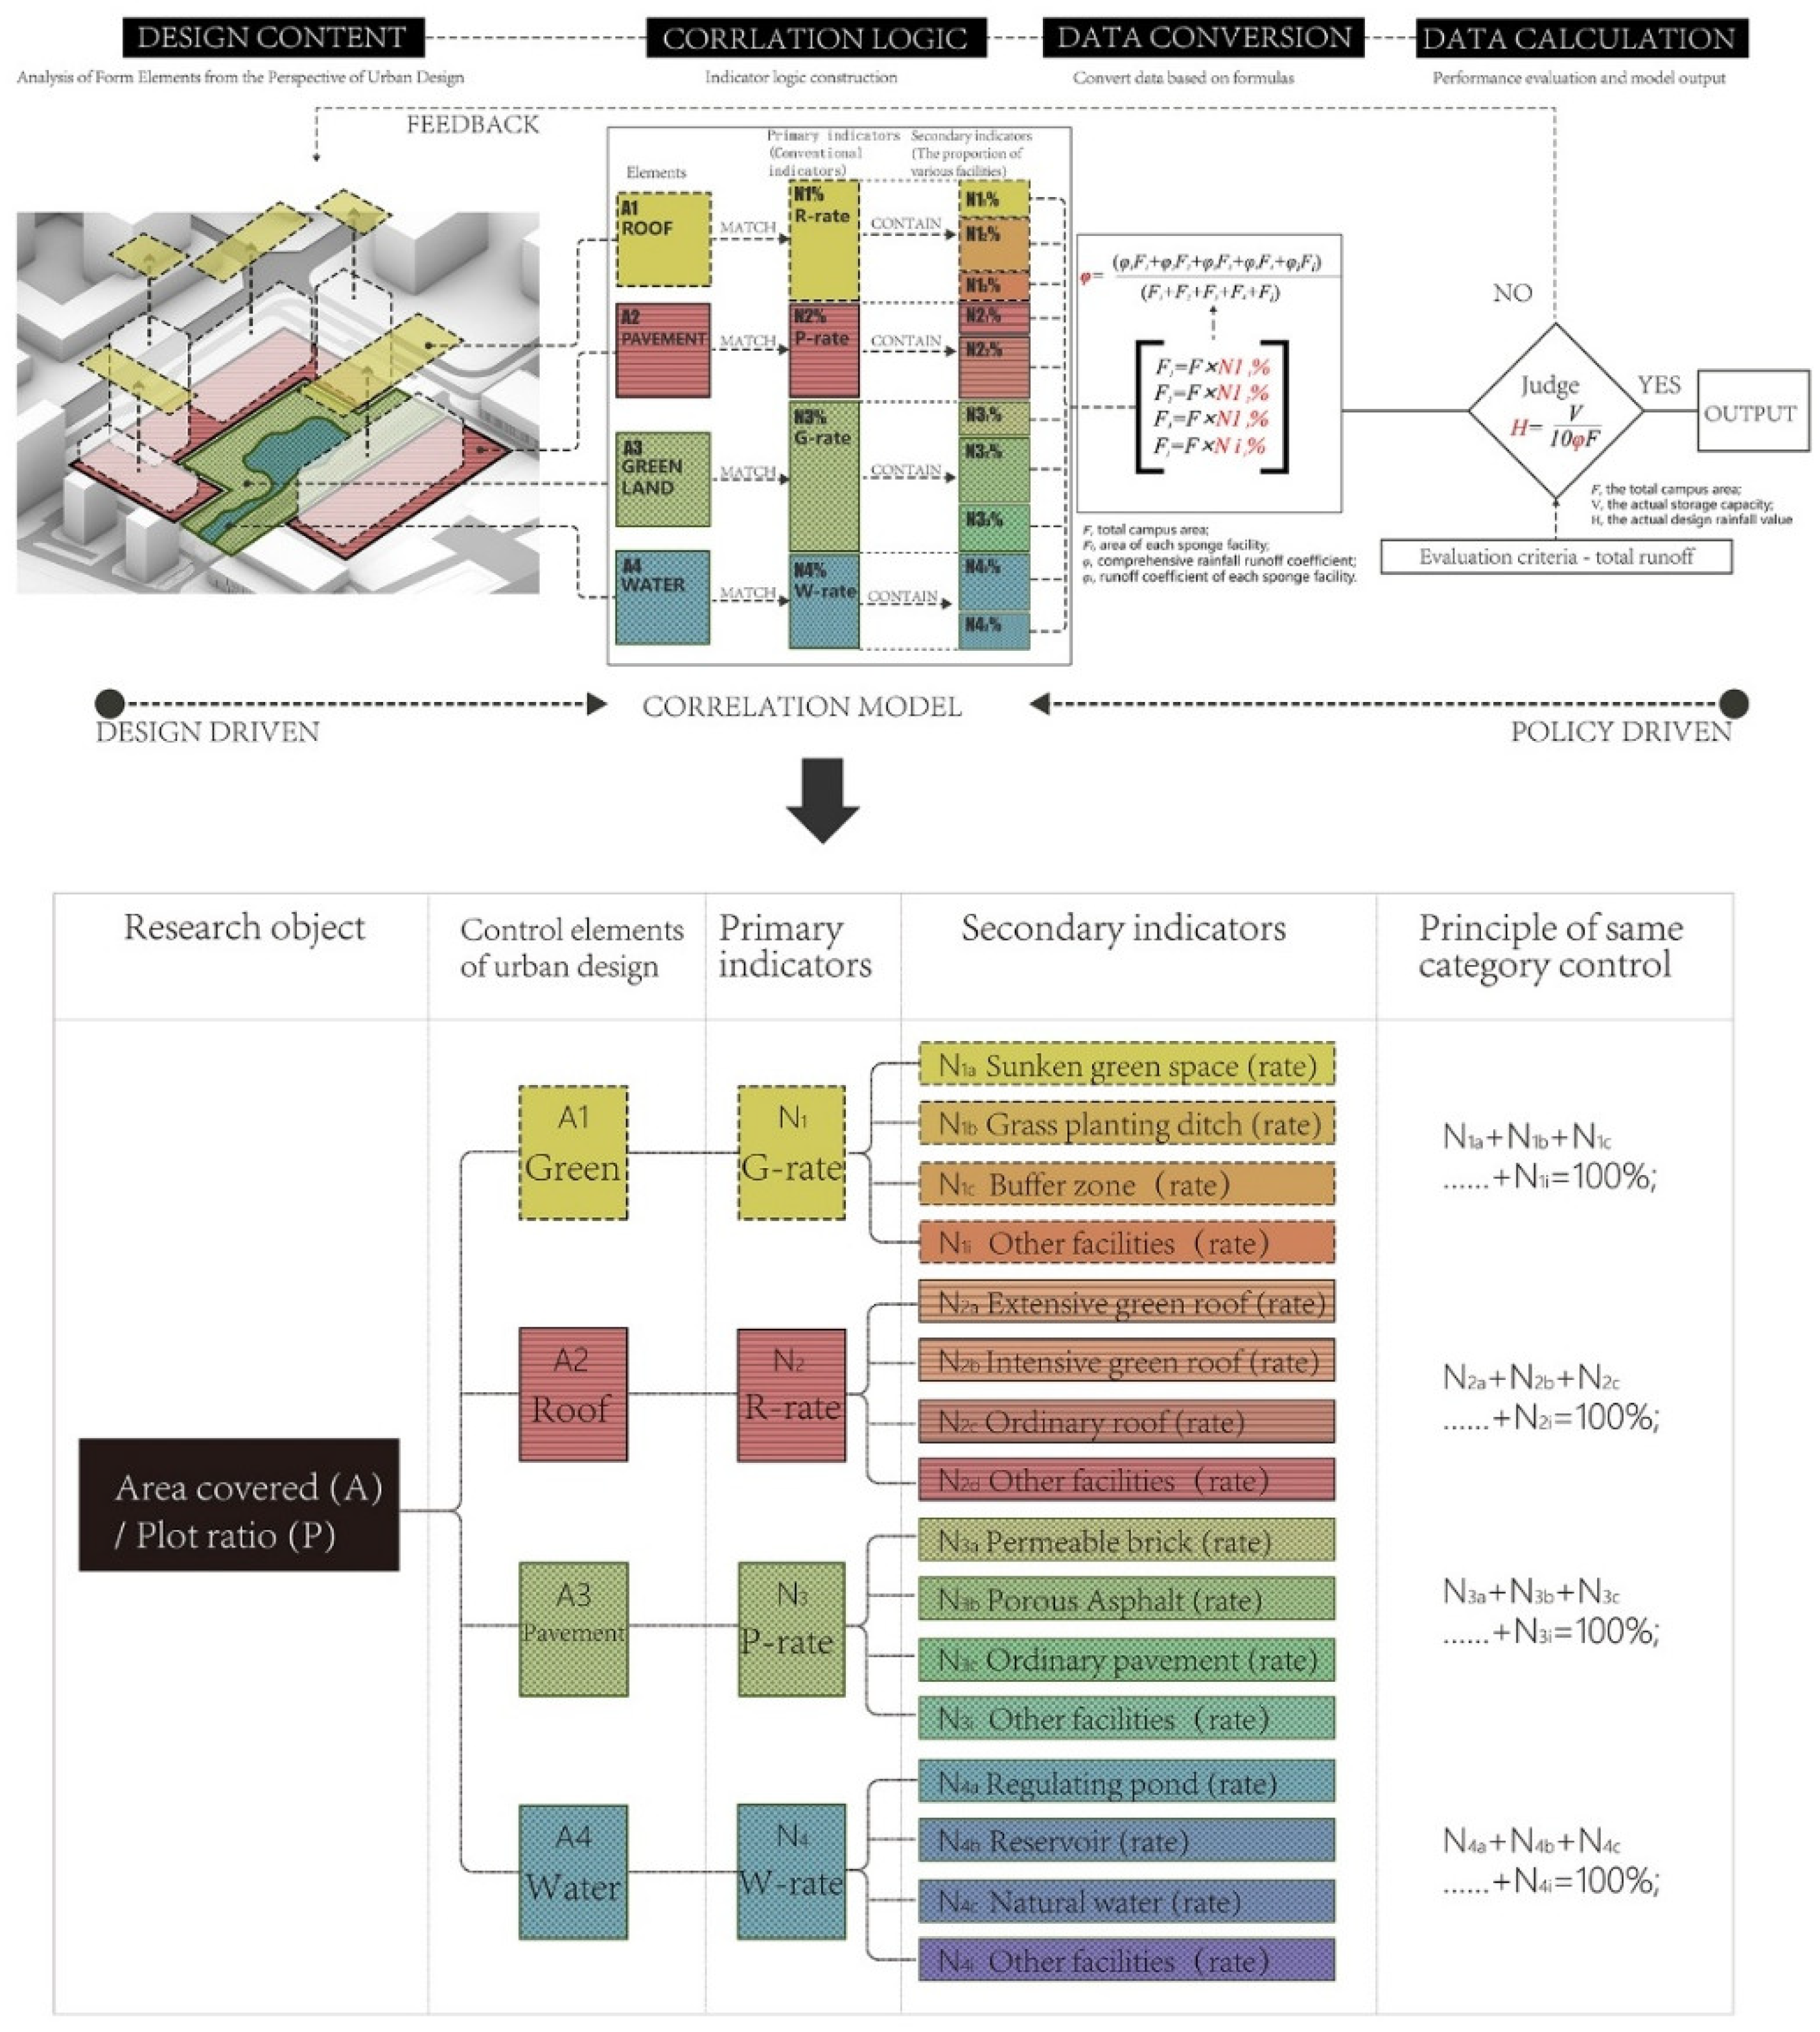
Figure 8.
Types of University Campus Construction in China.
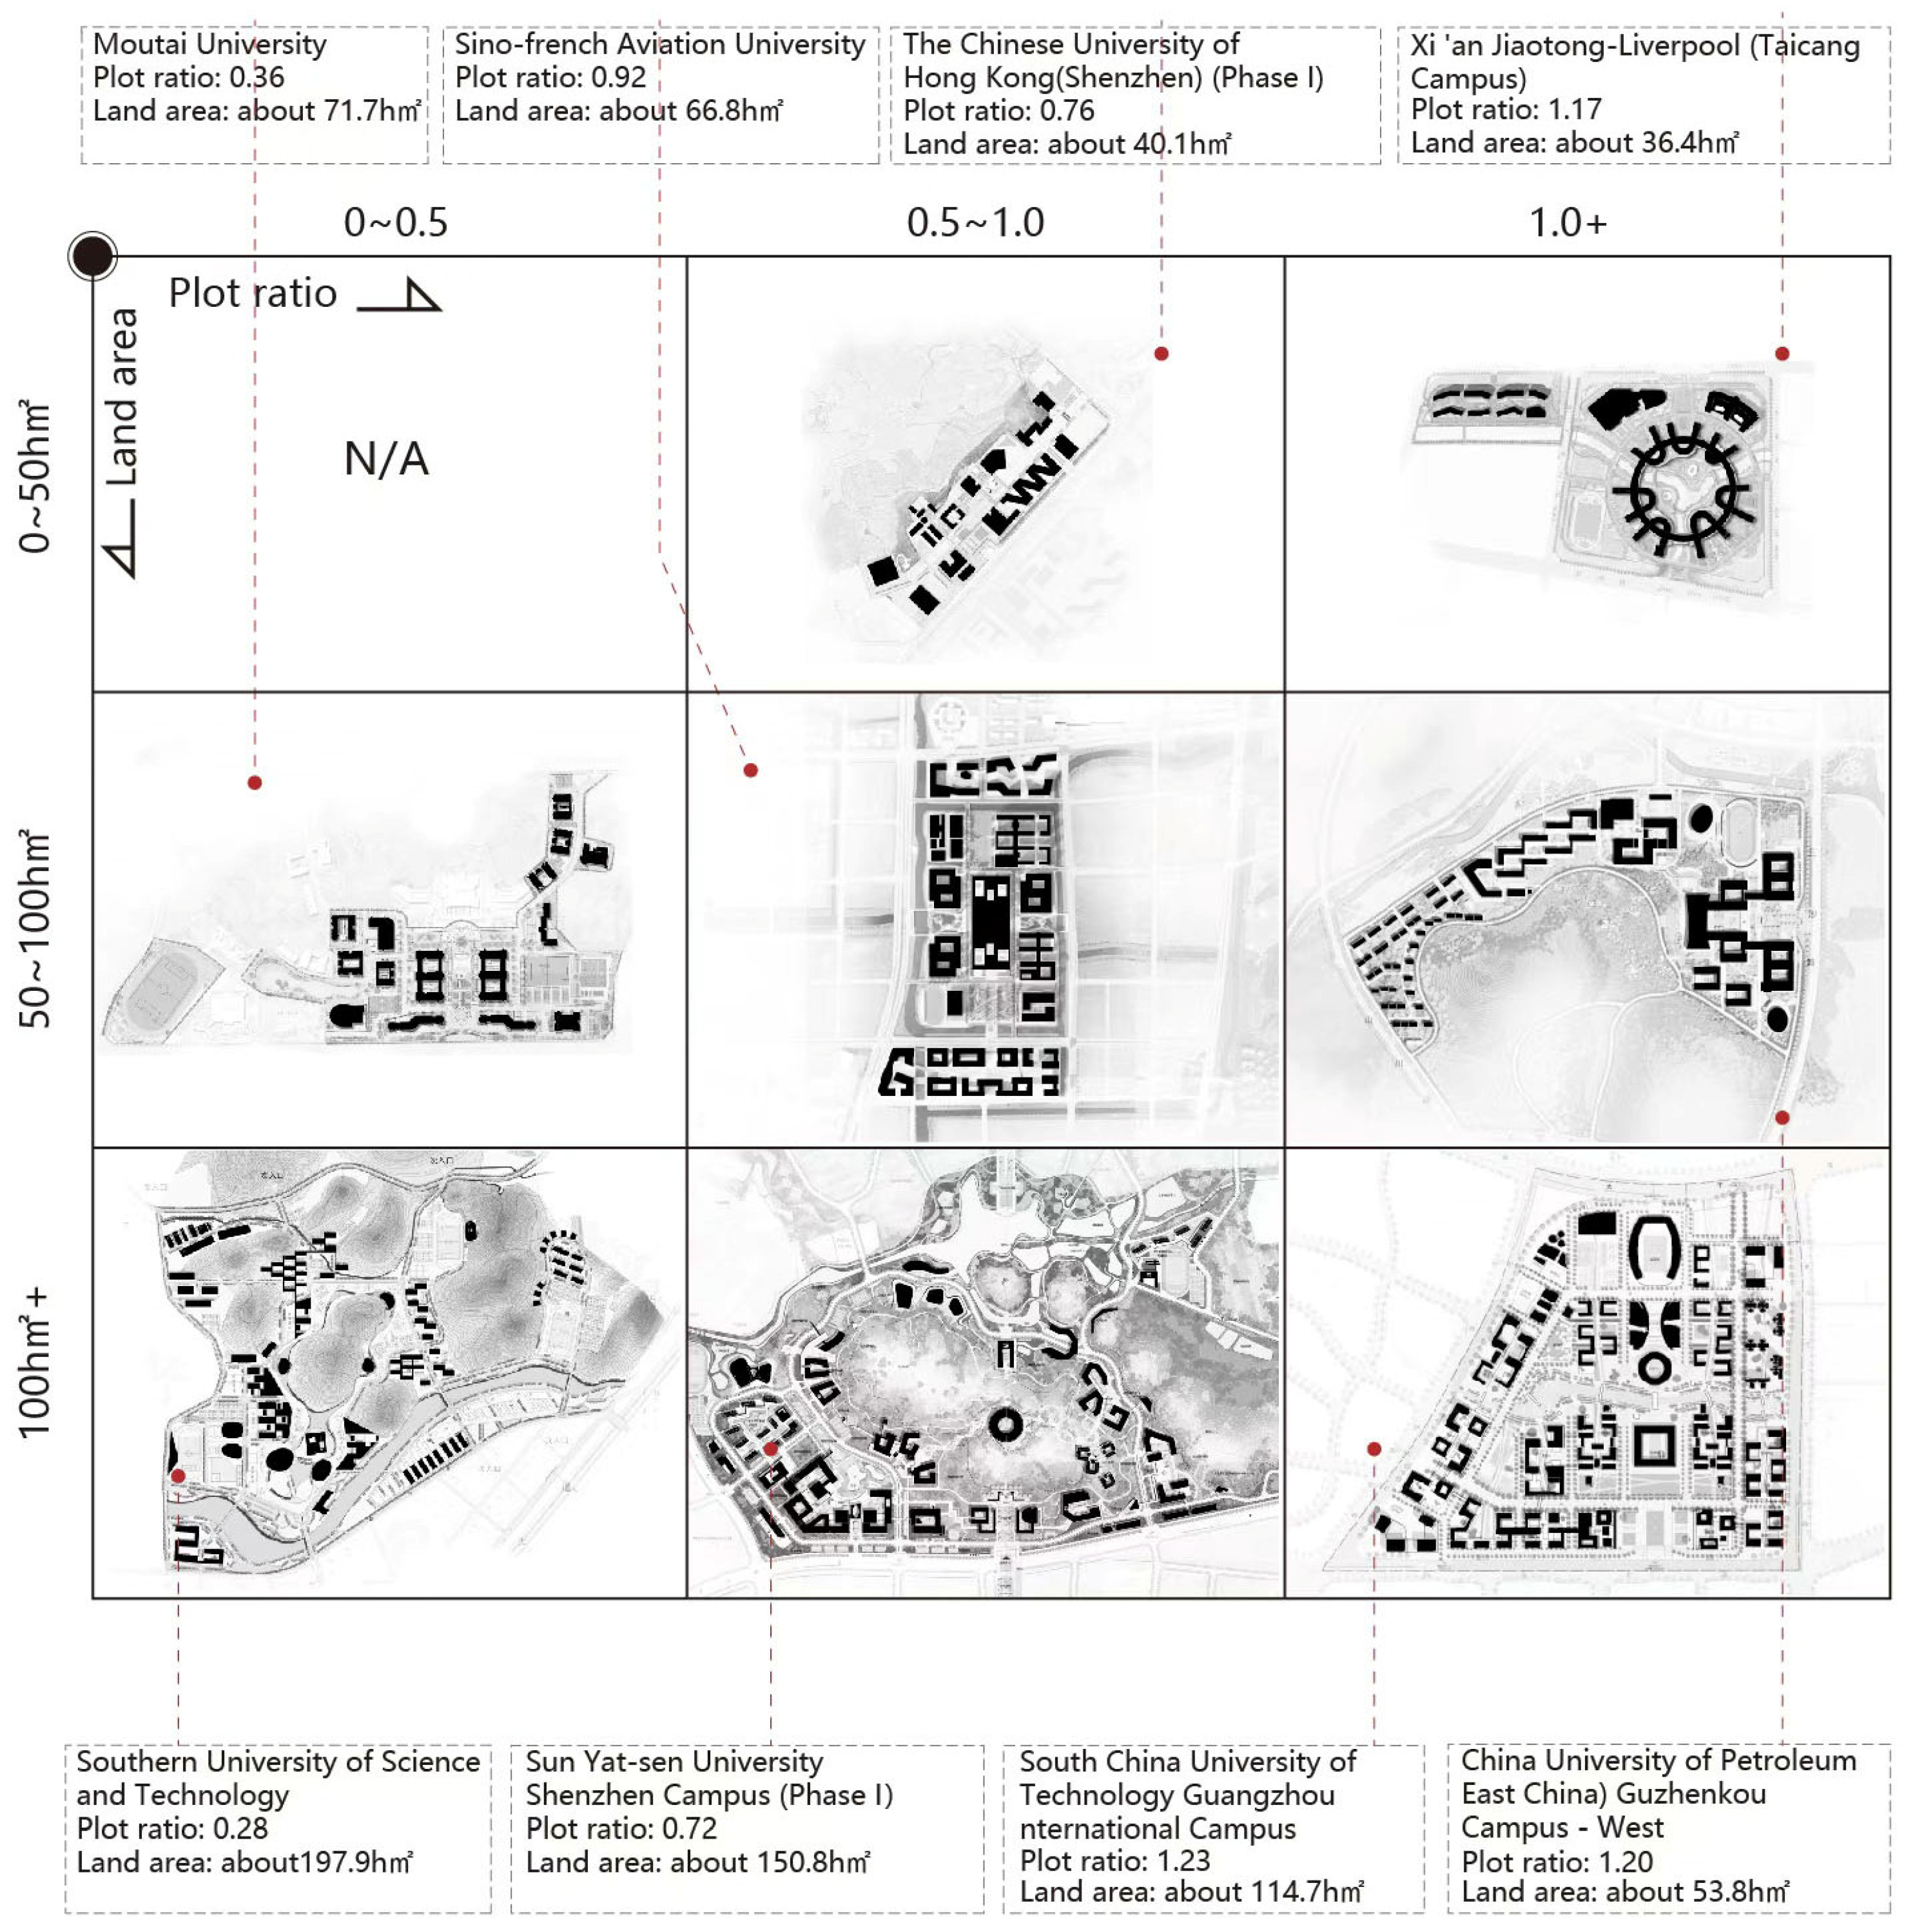
Figure 9.
Sensitivity analysis of construction intensity indicators. Ni, represents the first-level indicators in the correlation model, corresponding to water bodies, green spaces, roofs, and pavements; Nii, represents the second-level indicators associated with each first-level indicator.
Figure 9.
Sensitivity analysis of construction intensity indicators. Ni, represents the first-level indicators in the correlation model, corresponding to water bodies, green spaces, roofs, and pavements; Nii, represents the second-level indicators associated with each first-level indicator.
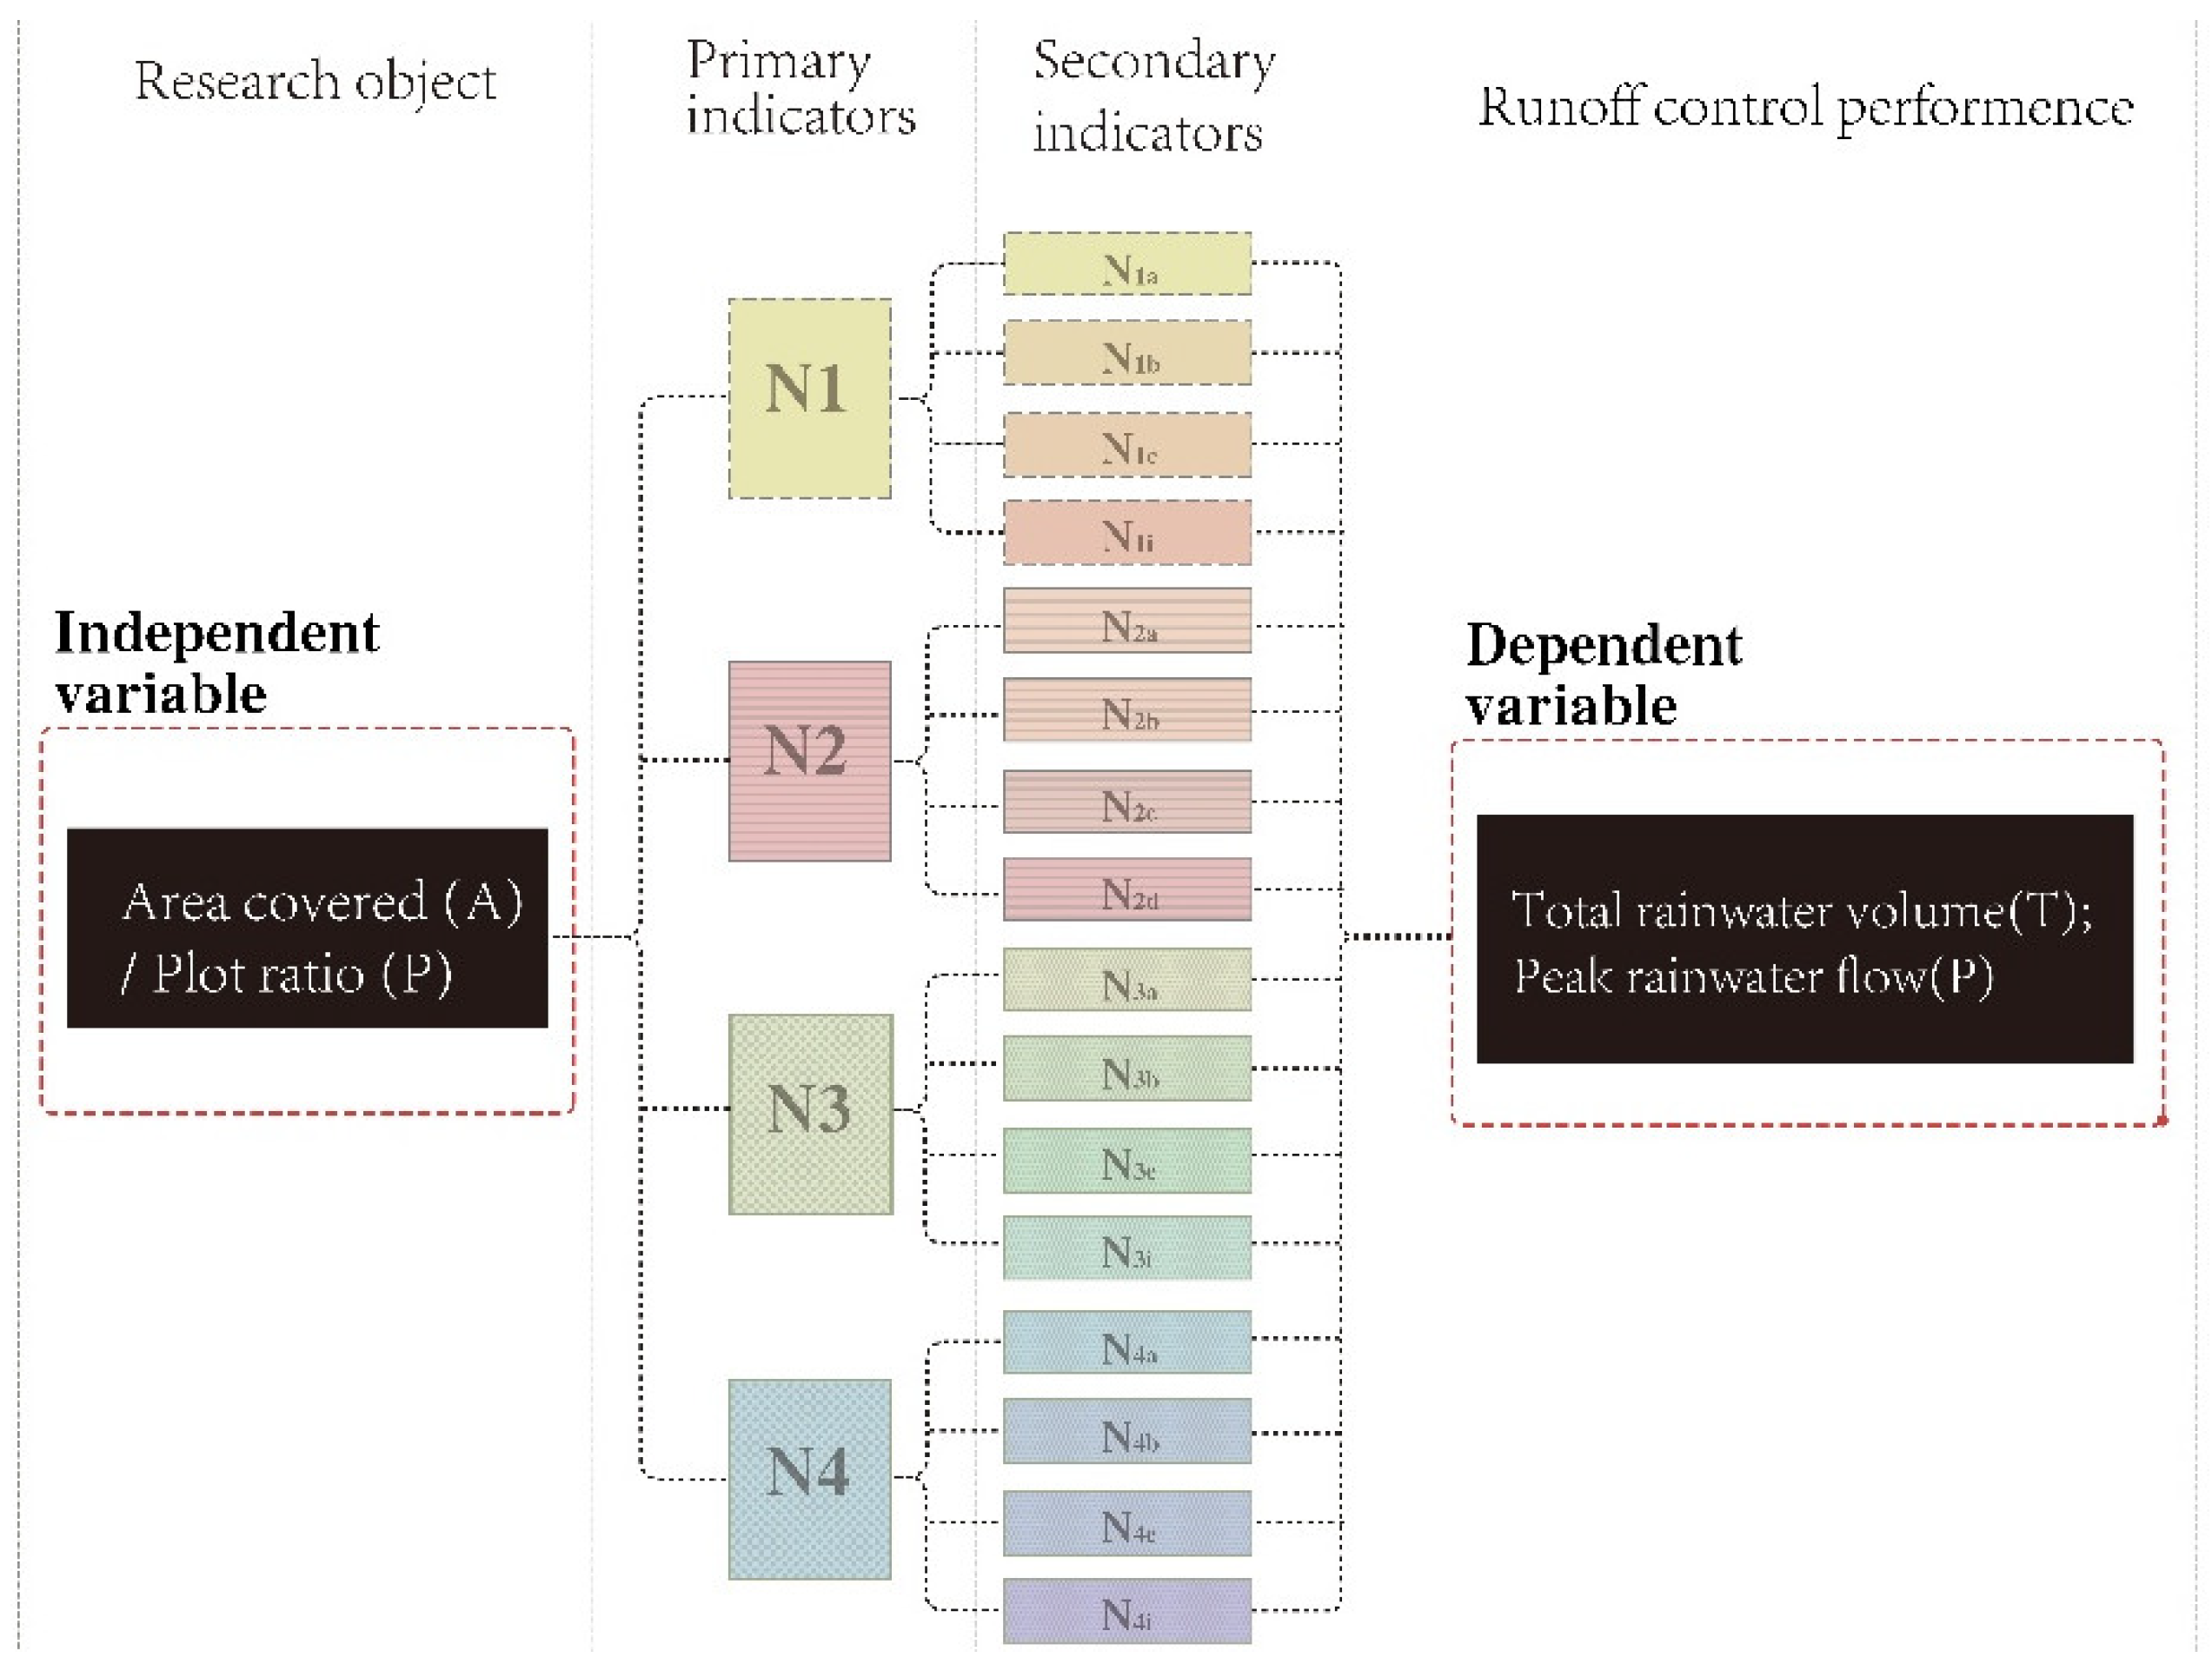
Figure 10.
Sensitivity analysis of the proportion of low-impact development facilities.
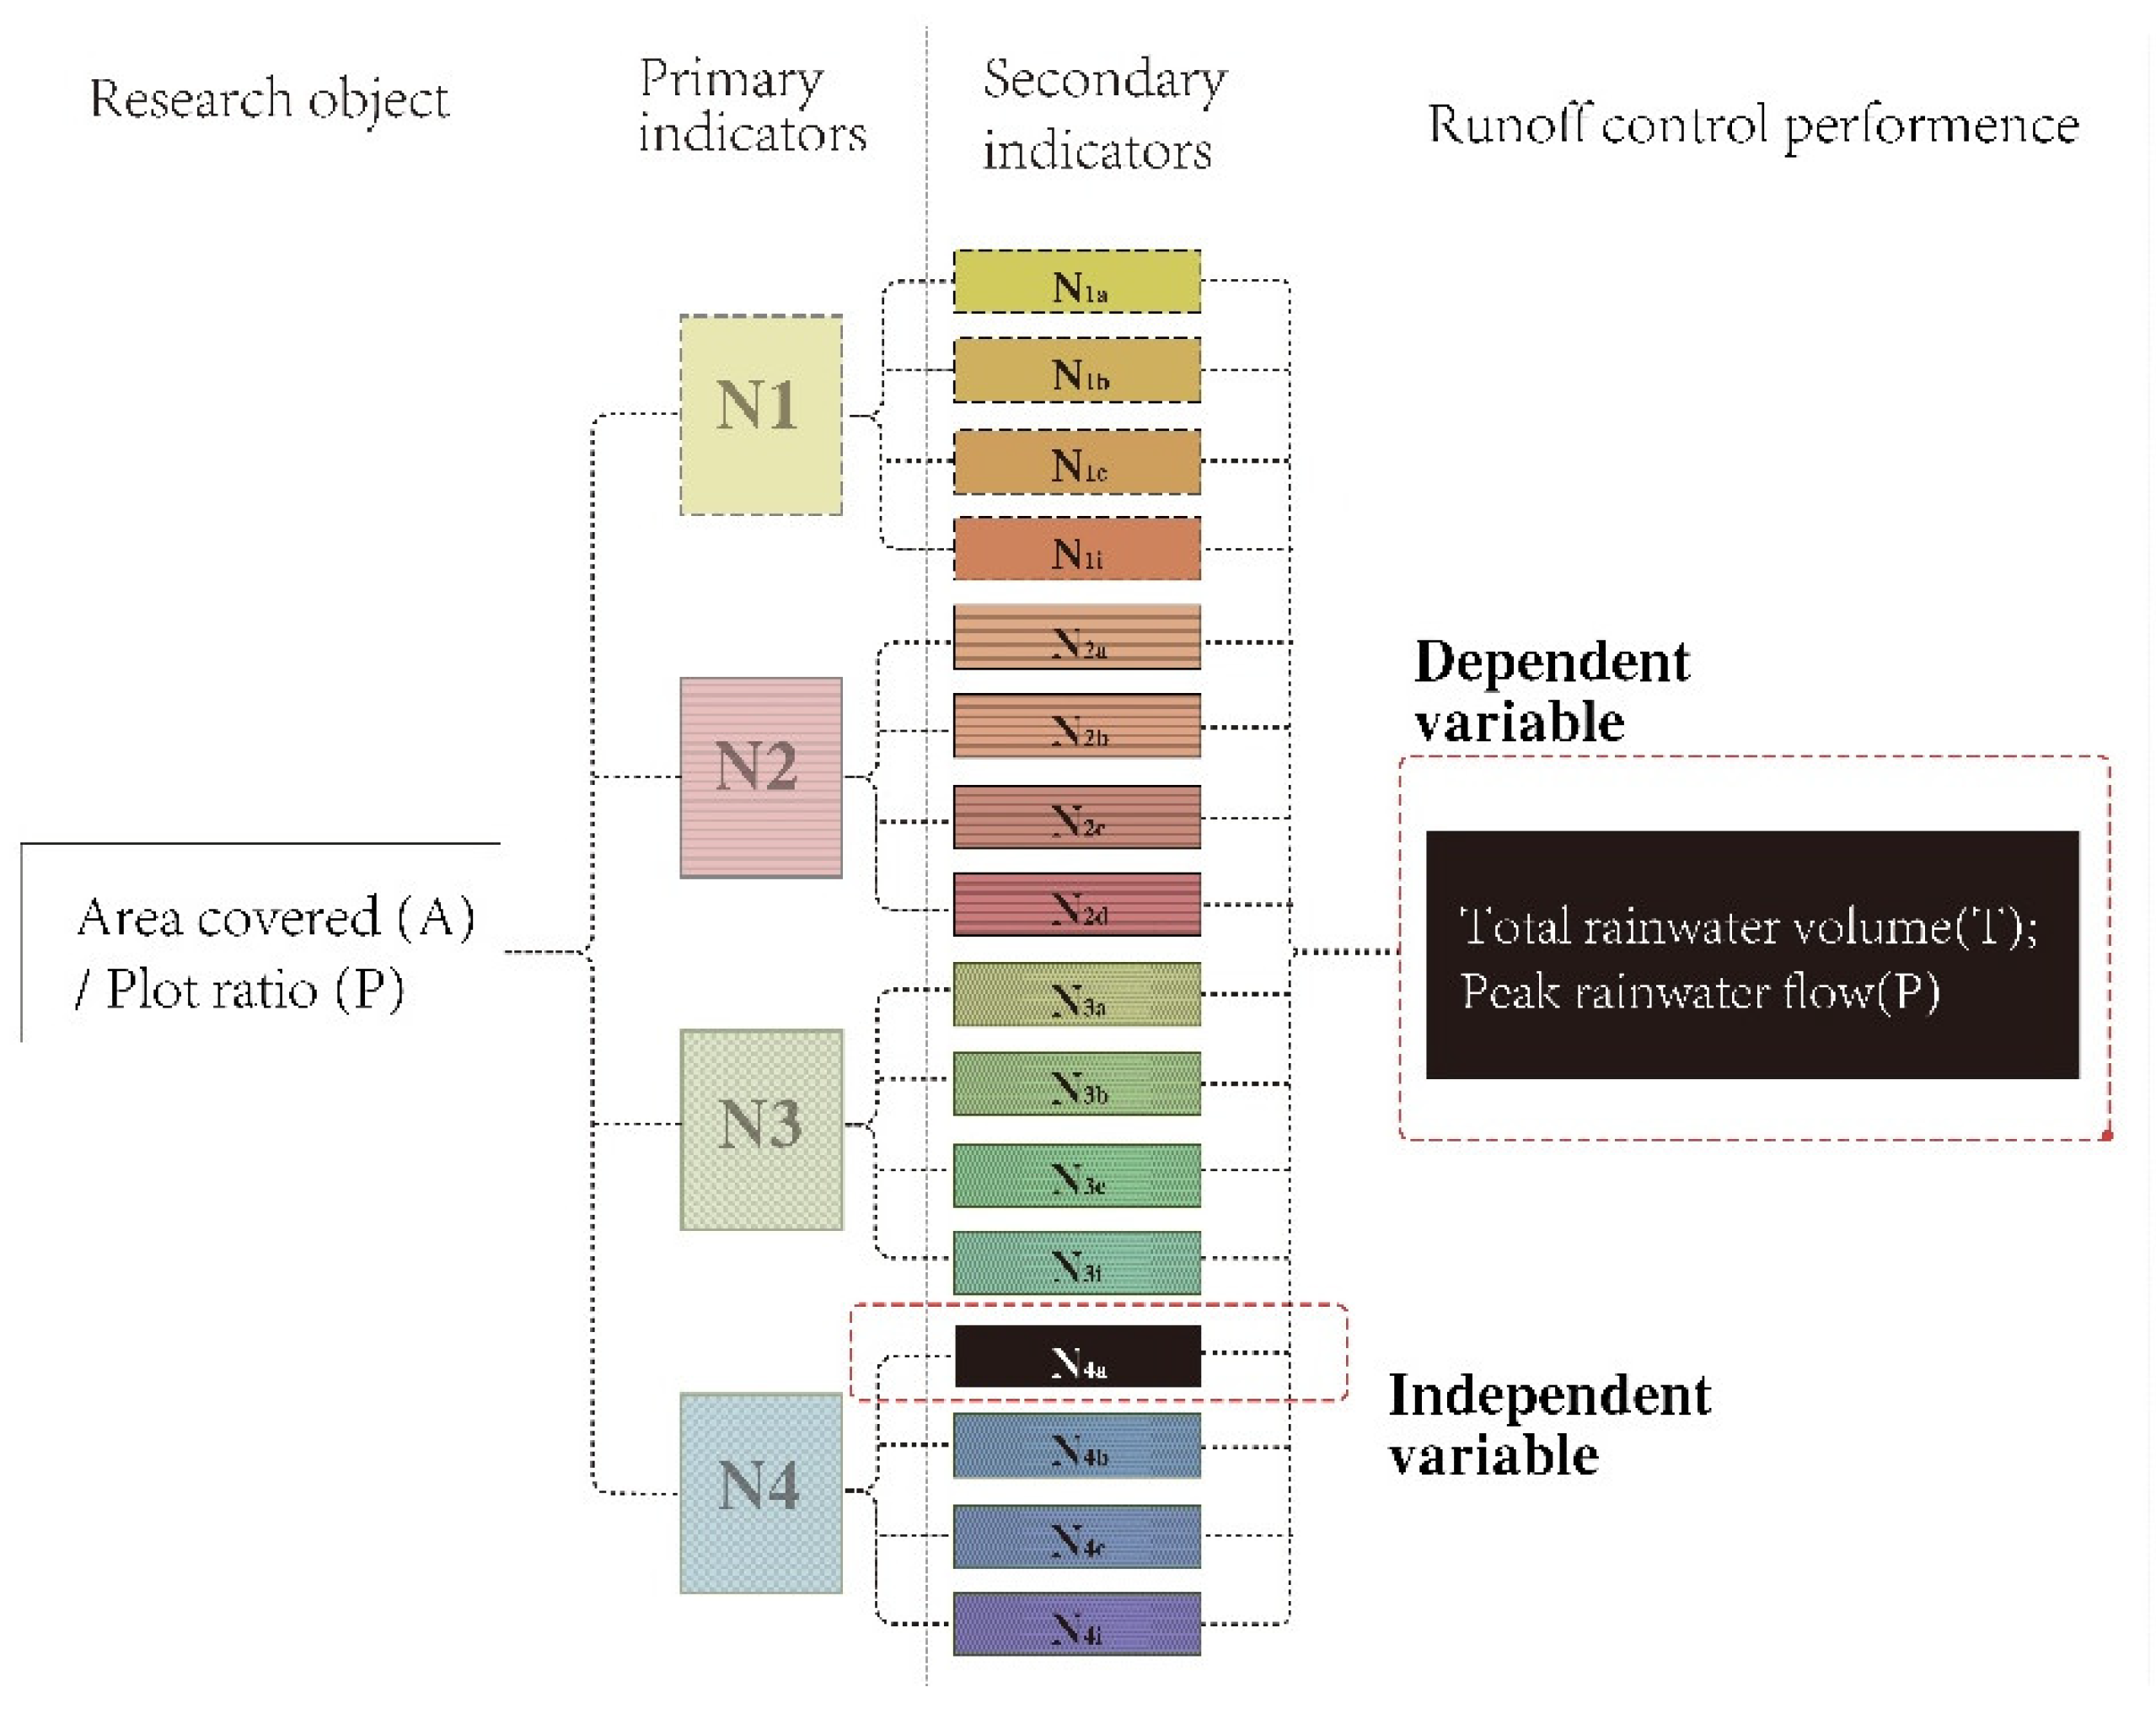
Figure 11.
“Sponge City+” Toolkit.
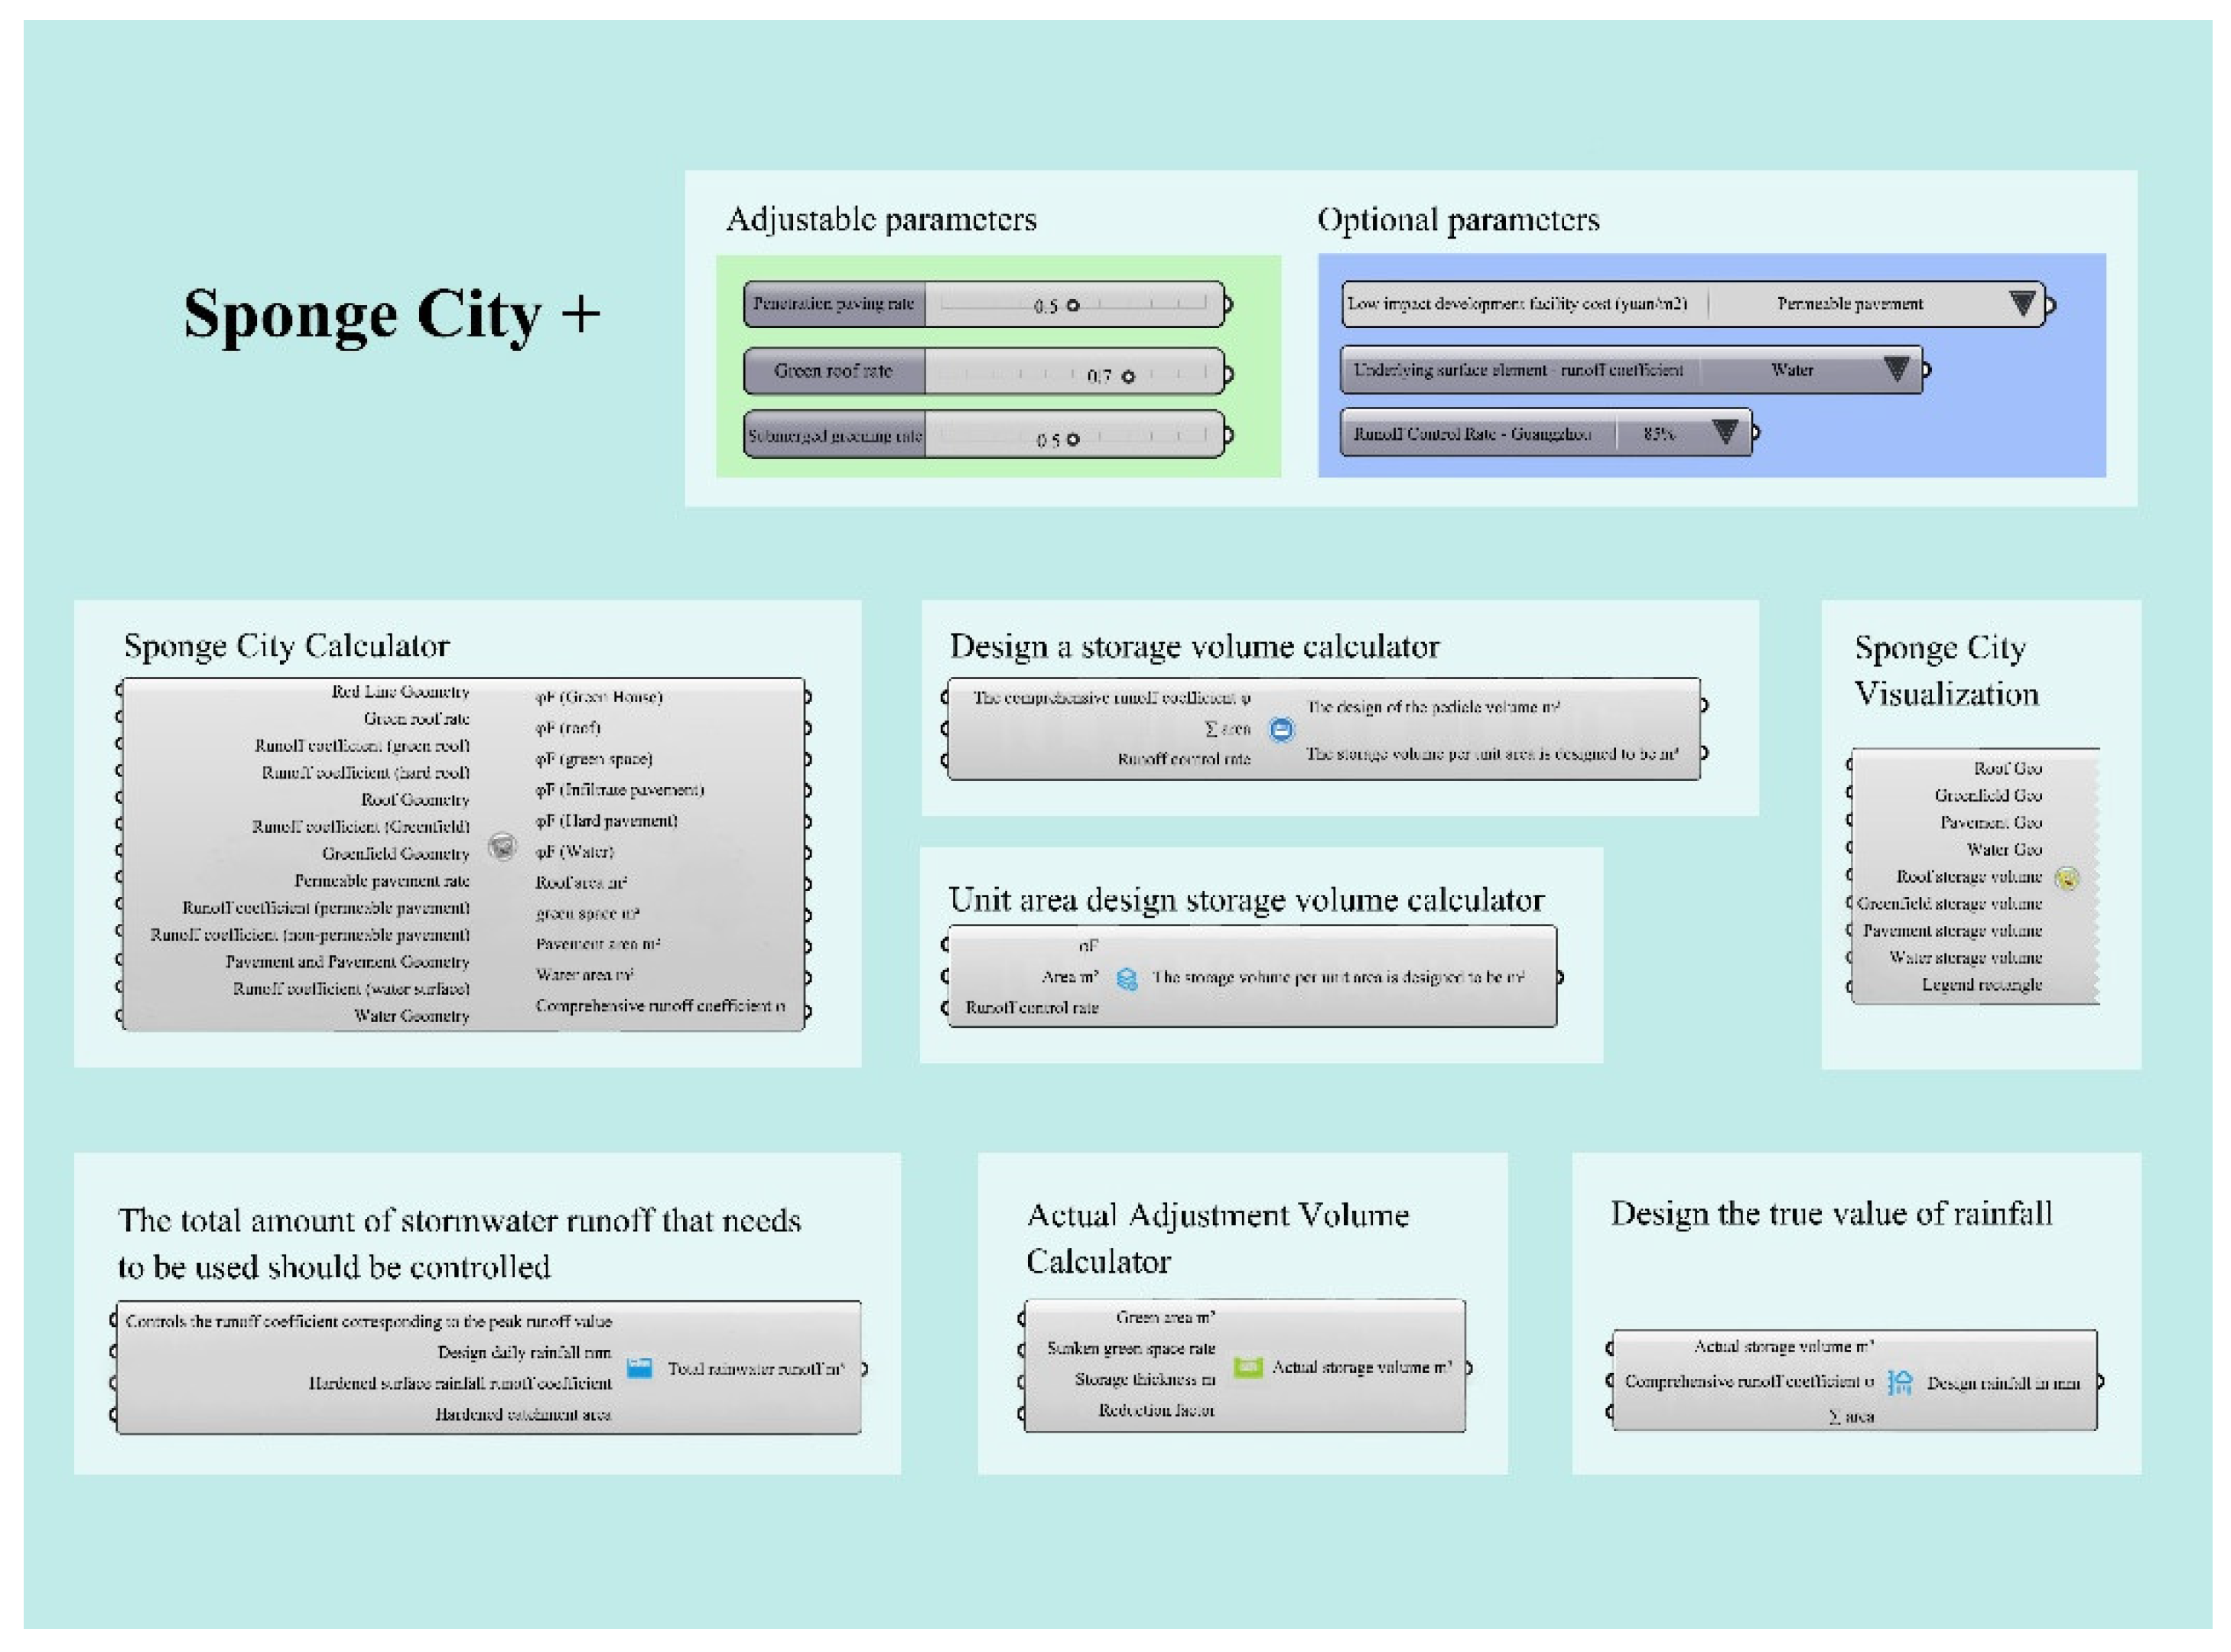
Figure 12.
Statistical Results of “Total Stormwater Runoff to be Controlled and Utilized” for 8 Campus Scales Under Standard Conditions.
Figure 12.
Statistical Results of “Total Stormwater Runoff to be Controlled and Utilized” for 8 Campus Scales Under Standard Conditions.
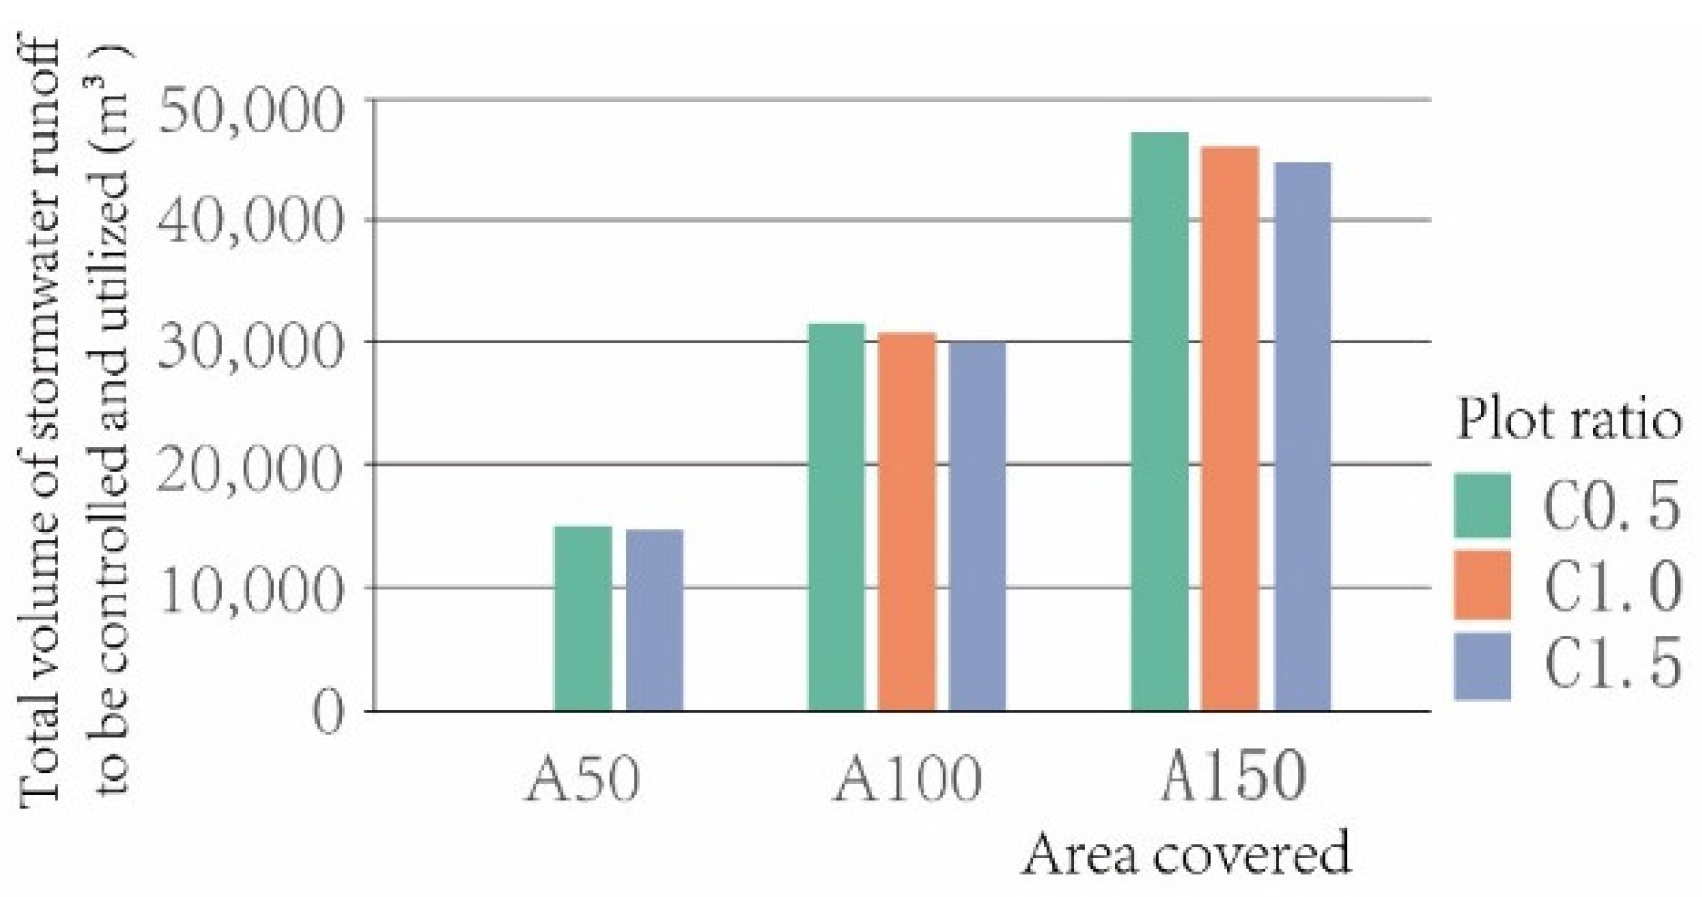
Figure 13.
Analysis of the Impact of Land Area Changes on “Total Stormwater Runoff to be Controlled and Utilized” Under P1.5 Condition.
Figure 13.
Analysis of the Impact of Land Area Changes on “Total Stormwater Runoff to be Controlled and Utilized” Under P1.5 Condition.
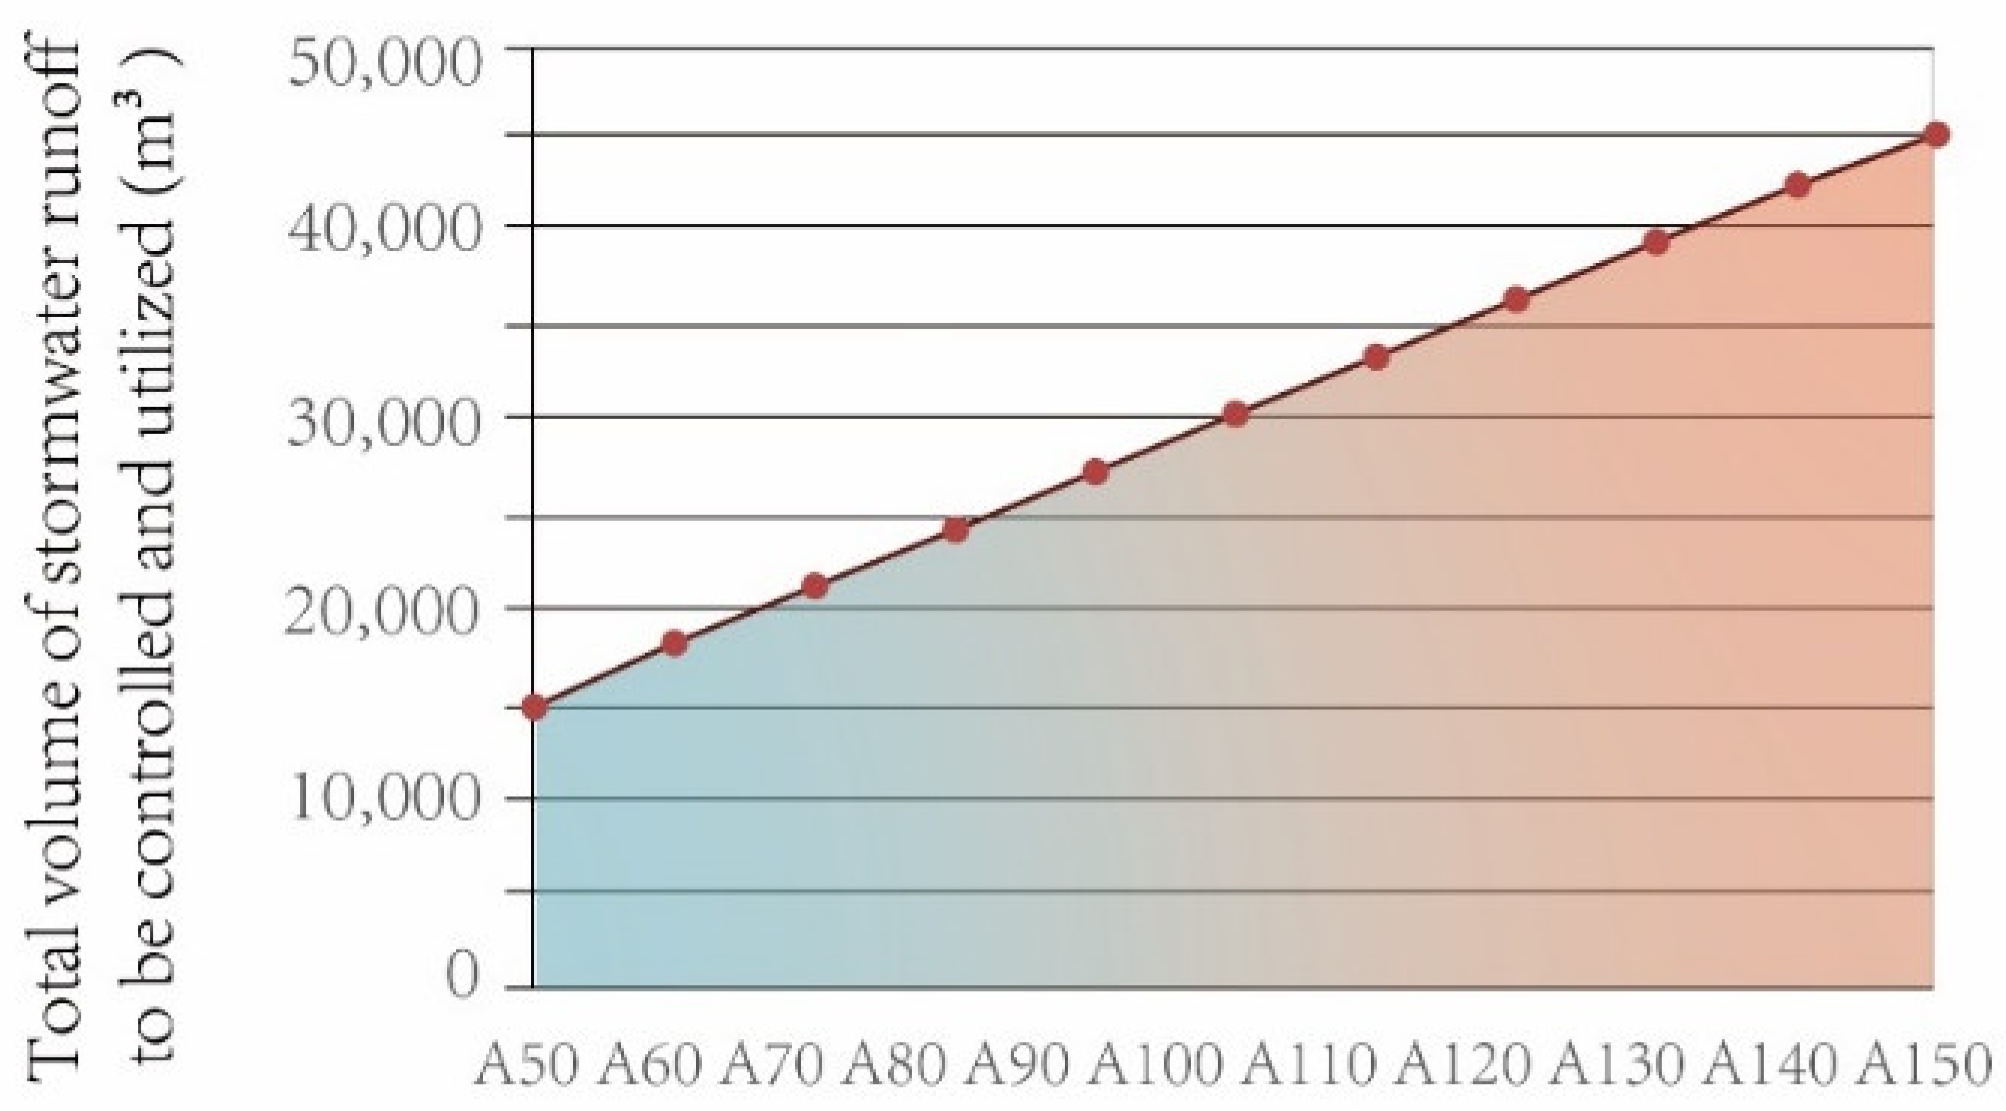
Figure 15.
Sensitivity Line Graph of Secondary Indicators for Various Campuses. (a) Sensitivity Line Graph of Secondary Indicators for Campus with P1.5; (b) Sensitivity Line Graph of Secondary Indicators for Campus with P1.0; (c) Sensitivity Line Graph of Secondary Indicators for Campus with P0.5.
Figure 15.
Sensitivity Line Graph of Secondary Indicators for Various Campuses. (a) Sensitivity Line Graph of Secondary Indicators for Campus with P1.5; (b) Sensitivity Line Graph of Secondary Indicators for Campus with P1.0; (c) Sensitivity Line Graph of Secondary Indicators for Campus with P0.5.
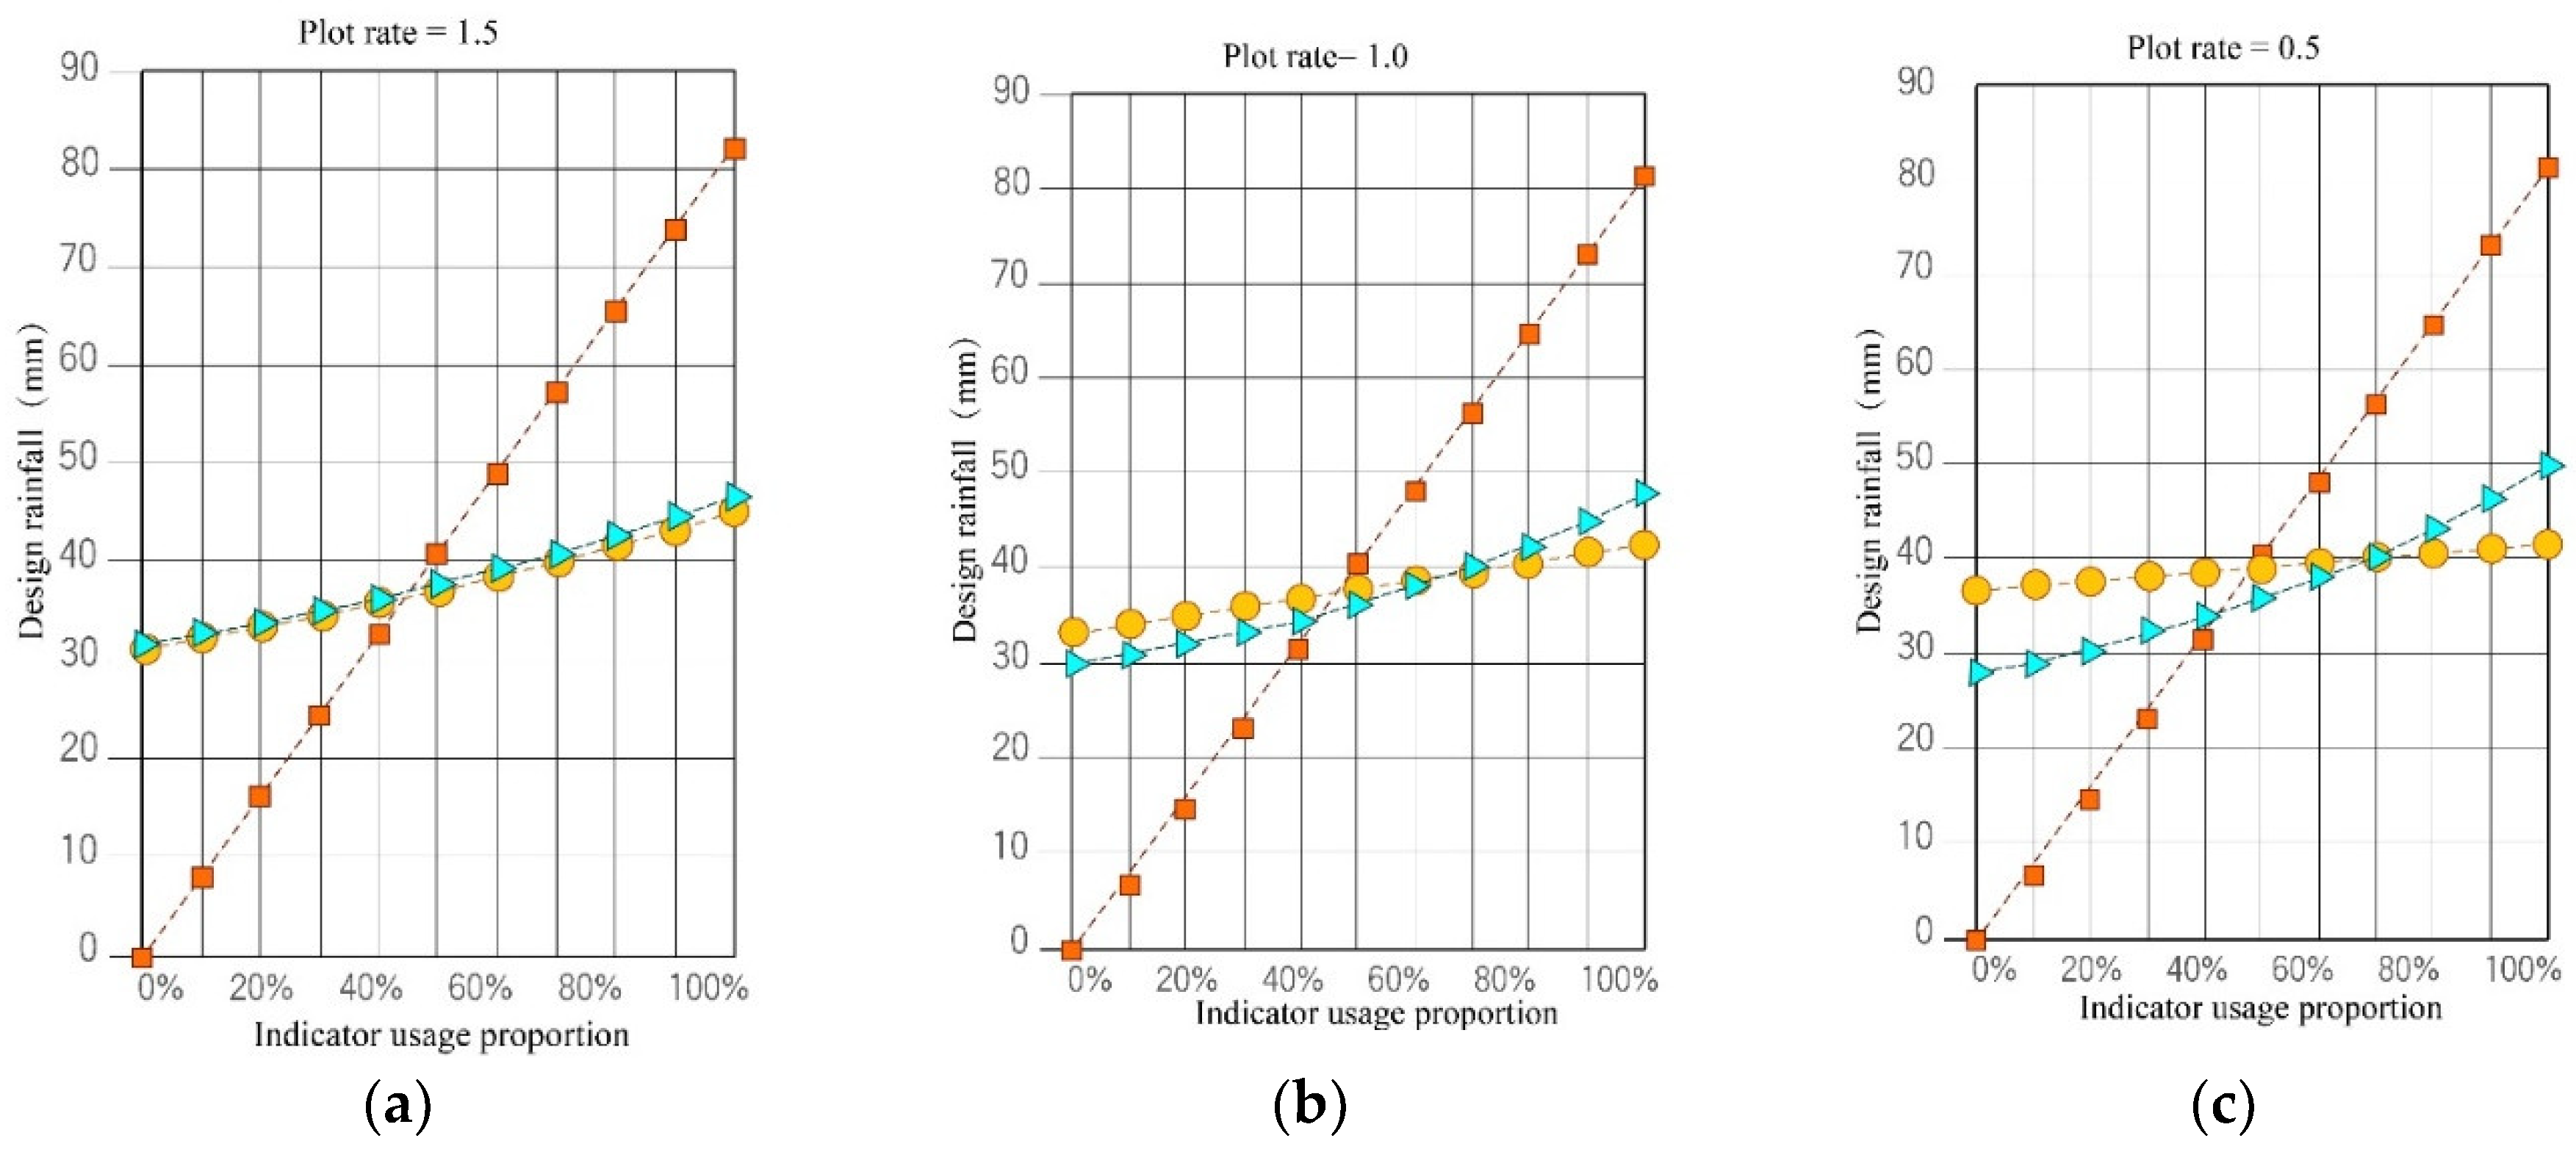
Figure 16.
Impact of Secondary Indicator Changes on “Total Stormwater Runoff to be Controlled and Utilized”. (a) to (h) represent different types of campus: (a) A50/P1.5, (b) A50/P1.0, (c) A100/P1.5, (d) A100/P1.0, (e) A100/P0.5, (f) A150/P1.5, (g) A150/P1.0, (h) A150/P0.5.
Figure 16.
Impact of Secondary Indicator Changes on “Total Stormwater Runoff to be Controlled and Utilized”. (a) to (h) represent different types of campus: (a) A50/P1.5, (b) A50/P1.0, (c) A100/P1.5, (d) A100/P1.0, (e) A100/P0.5, (f) A150/P1.5, (g) A150/P1.0, (h) A150/P0.5.
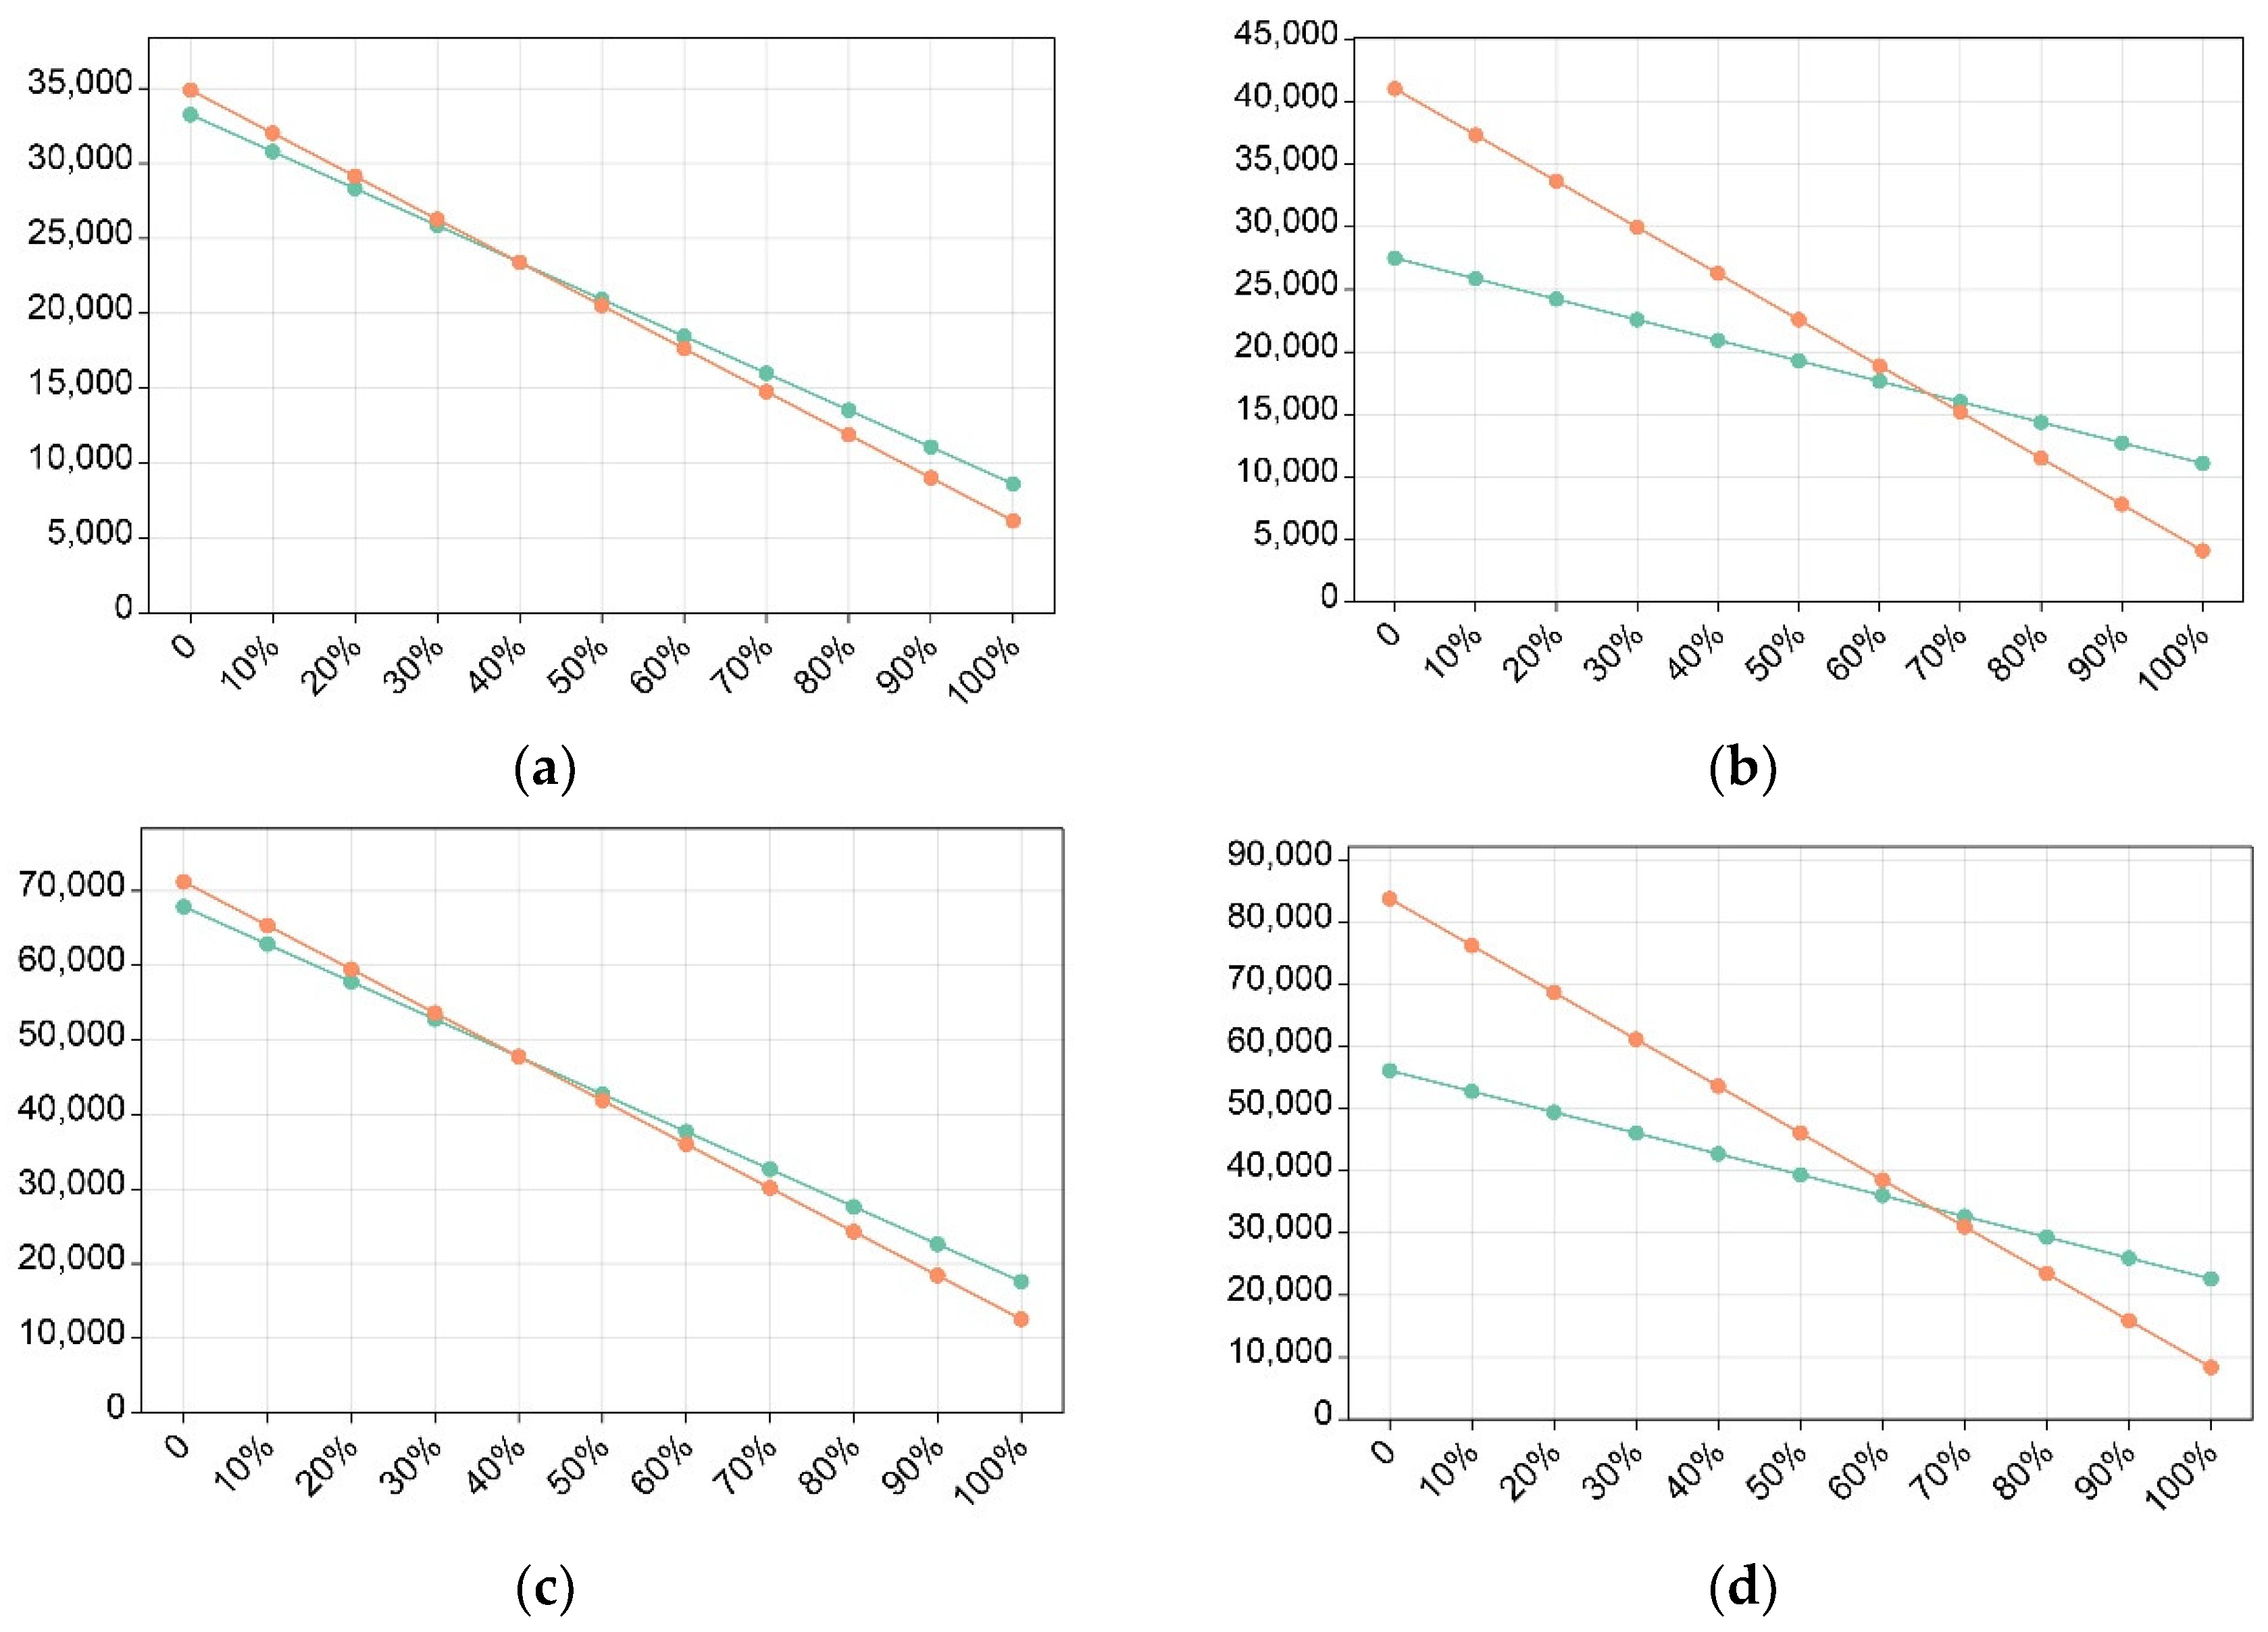
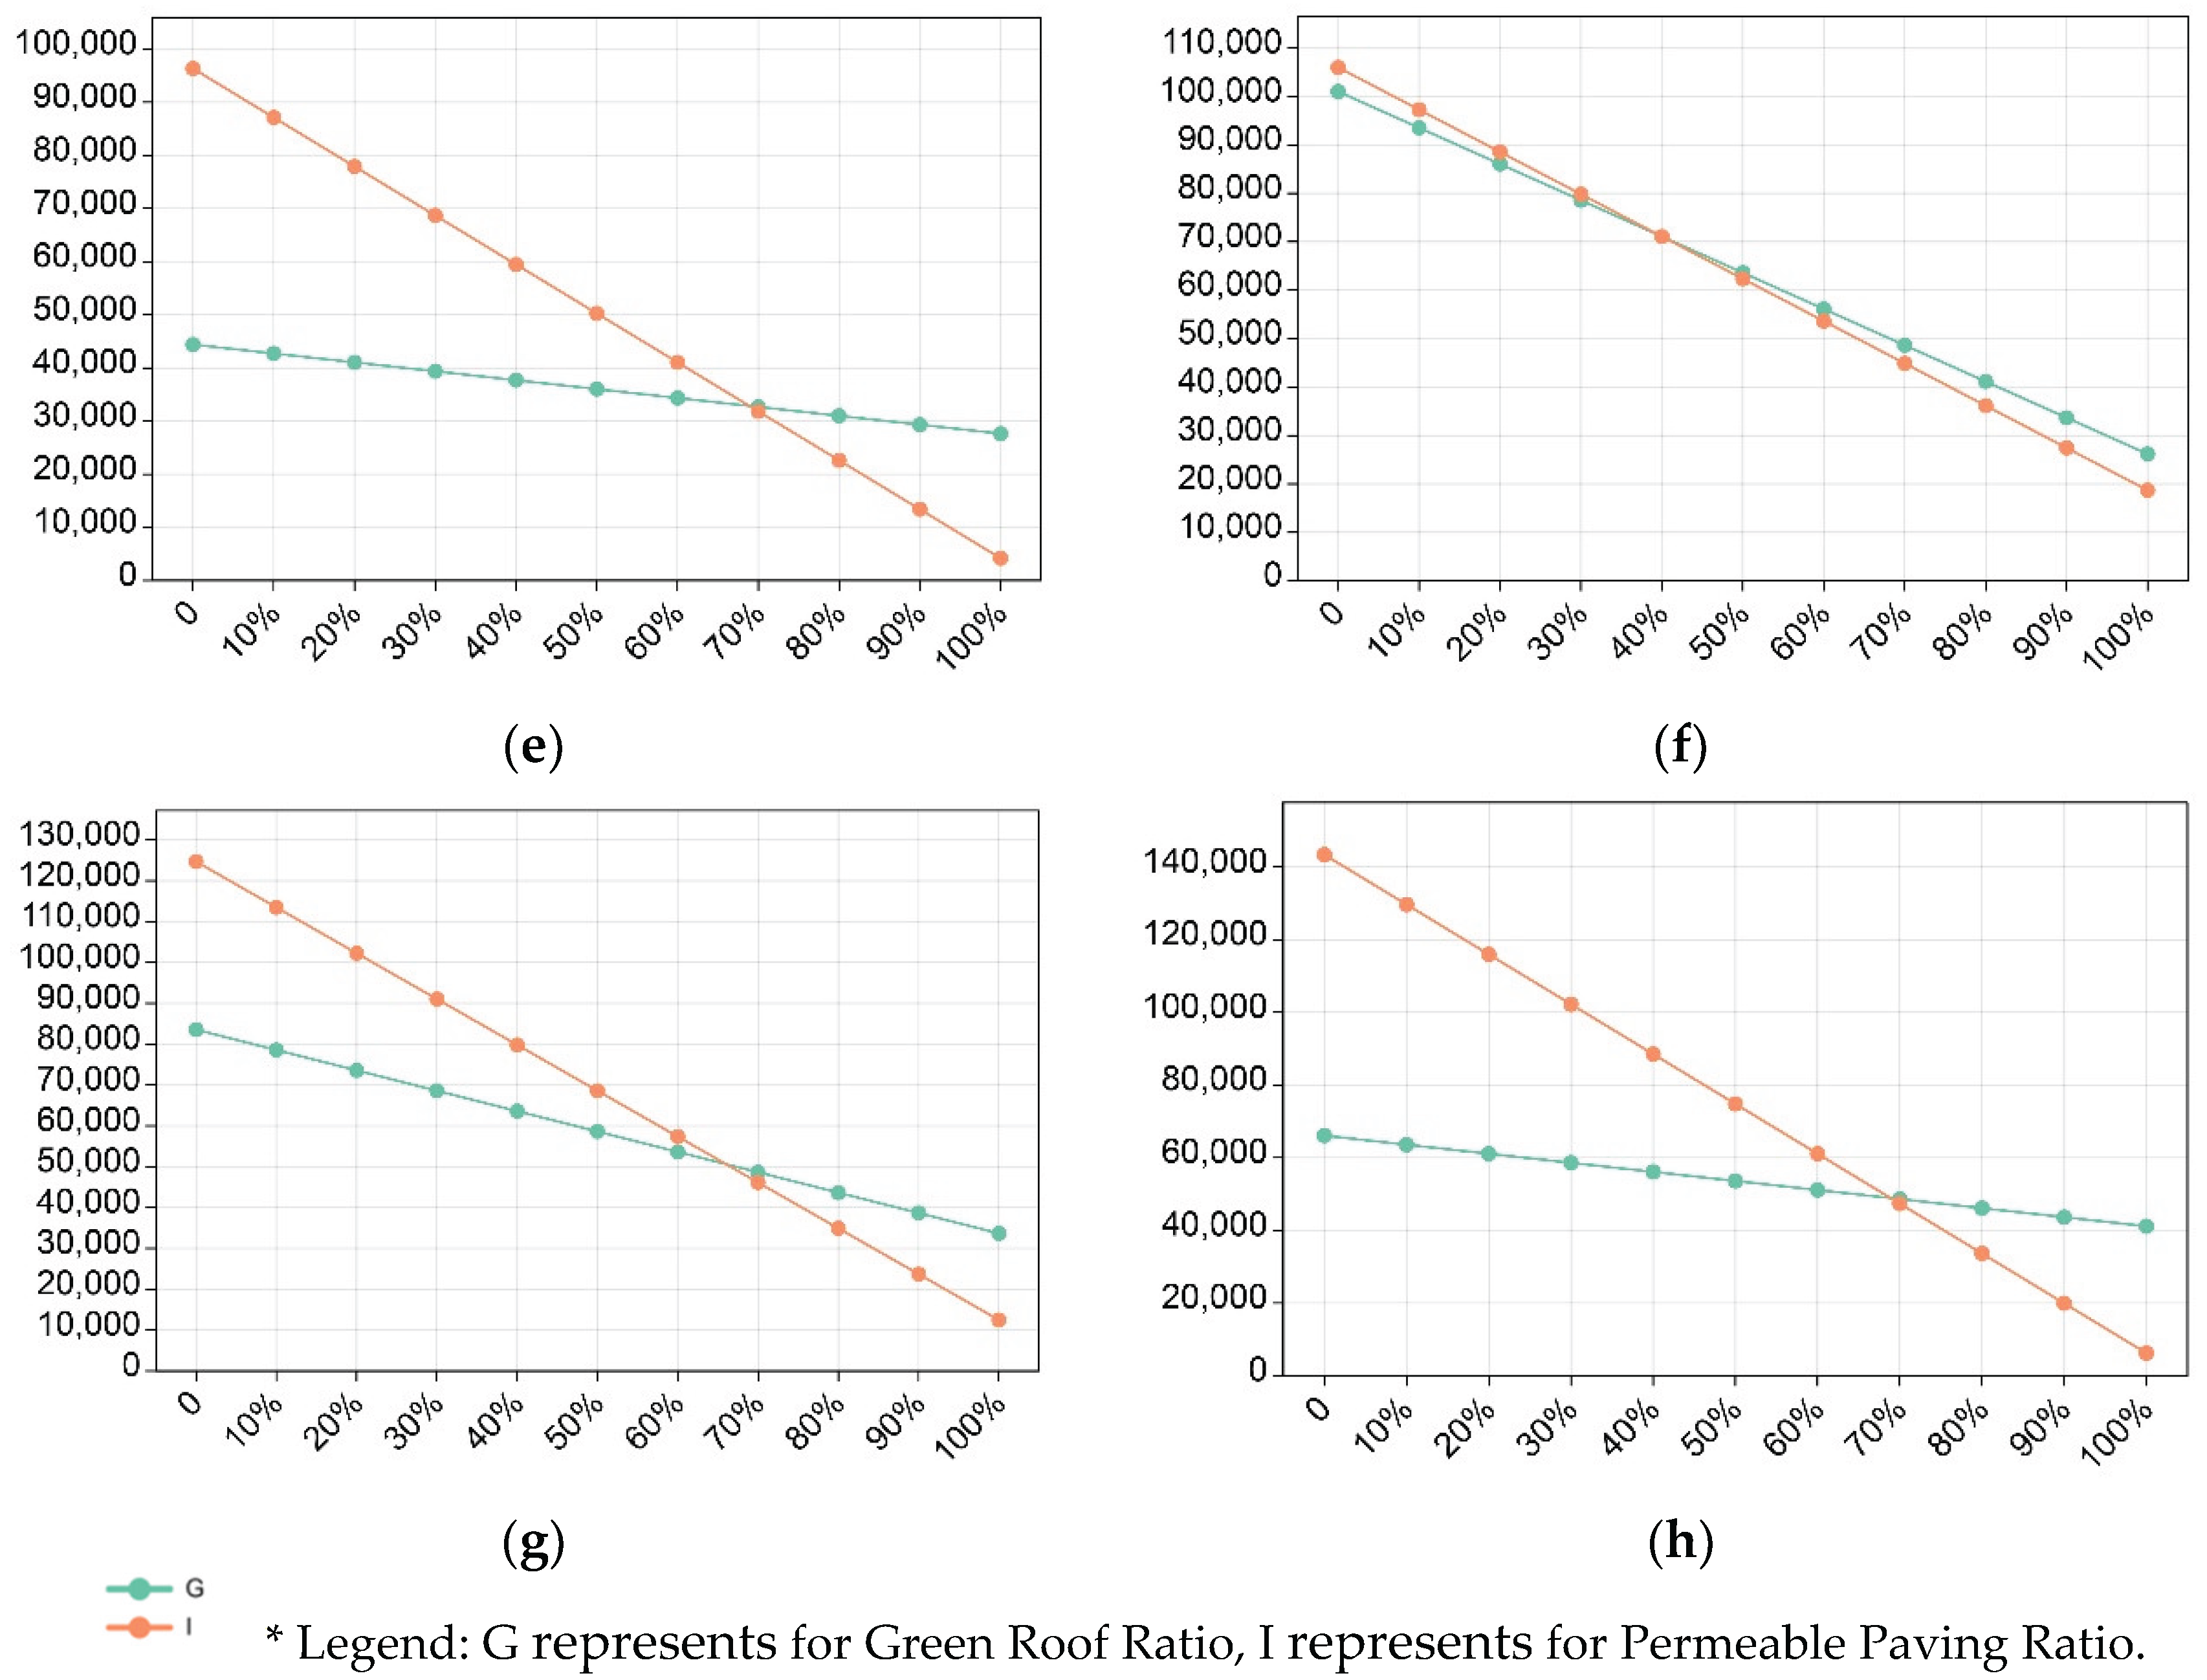
Figure 17.
Integrating stormwater runoff control into the early stages of urban design.
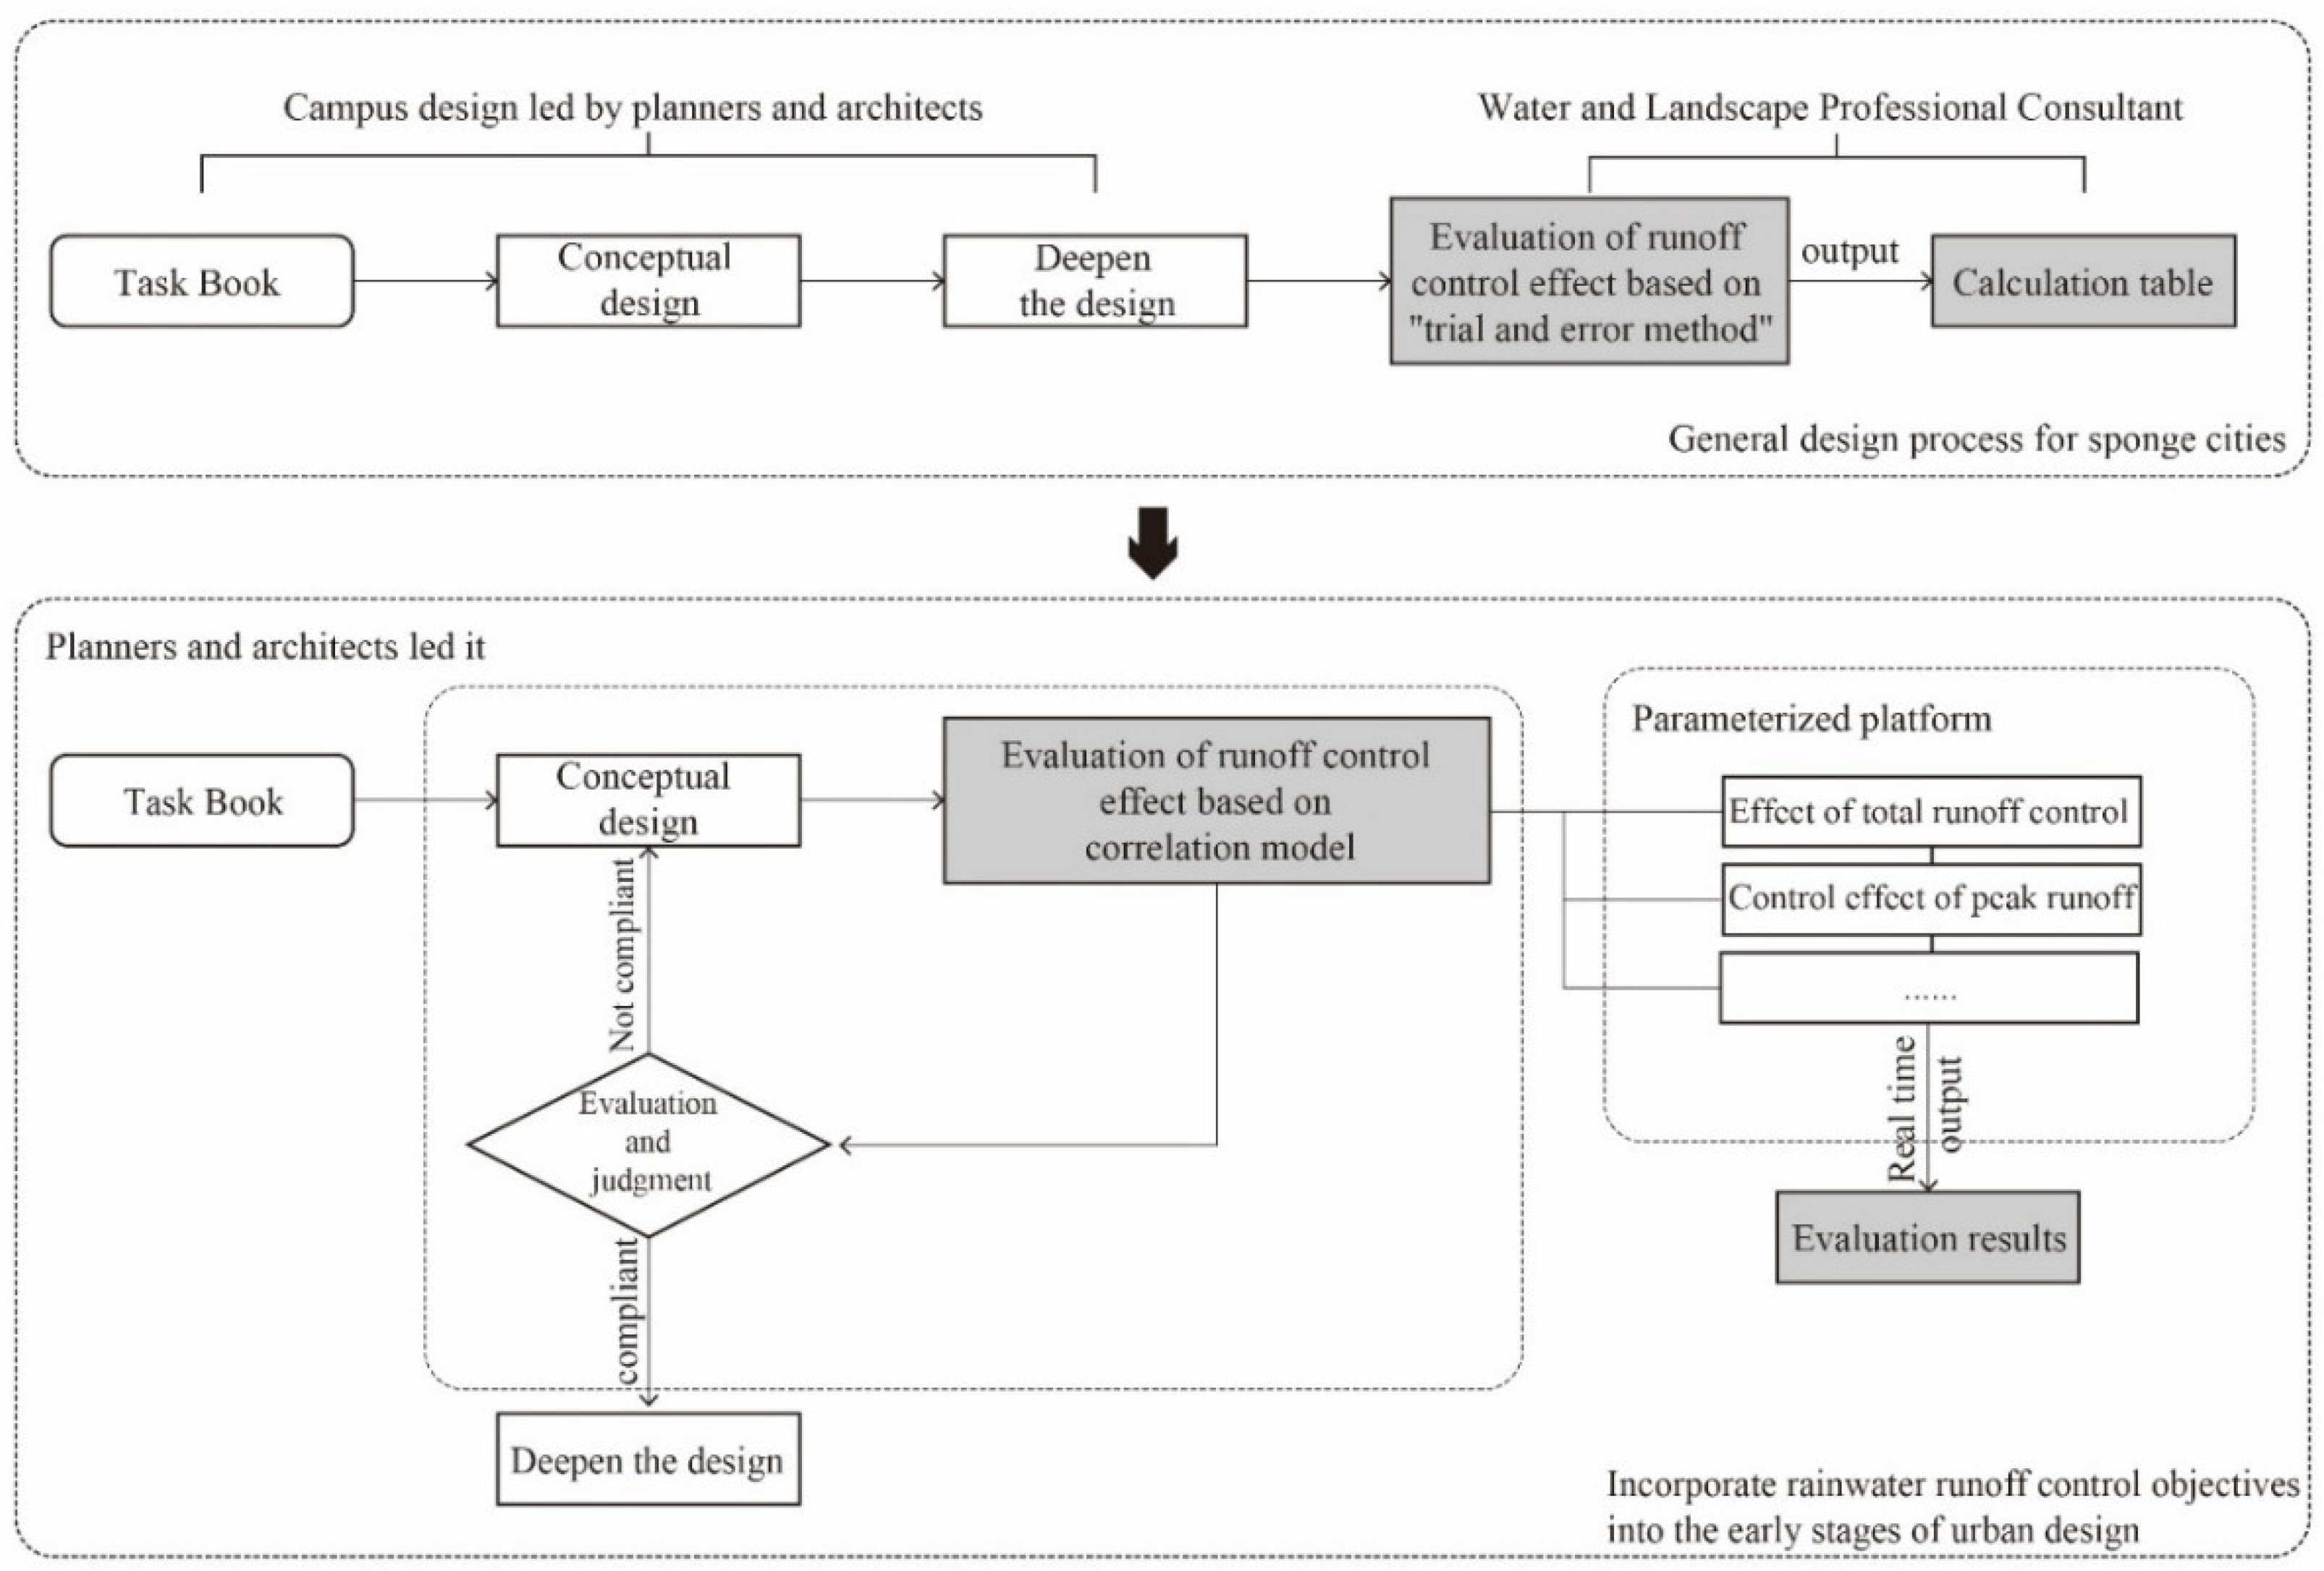
Table 1.
List of Design Rainfall Depth Corresponding to Volume Capture Ratio of Annual Rainfall in Selected Chinese Cities.
Table 1.
List of Design Rainfall Depth Corresponding to Volume Capture Ratio of Annual Rainfall in Selected Chinese Cities.
| City | Design Rainfall Depth Corresponding to Volume Capture Ratio of Annual Rainfall (mm) | ||||
| 60% | 70% | 75% | 80% | 85% | |
| Jiuquan | 4.1 | 5.4 | 6.3 | 7.4 | 8.9 |
| Lasa | 6.2 | 8.1 | 9.2 | 10.6 | 12.3 |
| Xining | 6.1 | 8 | 9.2 | 10.7 | 12.7 |
| Wulumuqi | 5.8 | 7.8 | 9.1 | 10.8 | 13 |
| Yinchuan | 7.5 | 10.3 | 12.1 | 14.4 | 17.7 |
| Huhehaote | 9.5 | 13 | 15.2 | 18.2 | 22 |
| Haerbin | 9.1 | 12.7 | 15.1 | 18.2 | 22.2 |
| Taiyuan | 9.7 | 13.5 | 16.1 | 19.4 | 23.6 |
| Zhenzhou | 14 | 19.5 | 23.1 | 27.8 | 34.3 |
| Shanghai | 13.4 | 18.7 | 22.2 | 26.7 | 33 |
| Beijing | 14 | 19.4 | 22.8 | 27.3 | 33.6 |
| Guangzhou | 18.4 | 25.2 | 29.7 | 35.5 | 43.4 |
Table 2.
Statistical Results of “Total Stormwater Runoff to be Controlled and Utilized” for 8 Cam-pus Scales Under Standard Conditions.
Table 2.
Statistical Results of “Total Stormwater Runoff to be Controlled and Utilized” for 8 Cam-pus Scales Under Standard Conditions.
| Research object | Total volume of stormwater runoff to be managed and utilized(m3) |
|---|---|
| A50/P1.0 | 15190.22 |
| A50/P1.5 | 14779.67 |
| A100/P0.5 | 31838.30 |
| A100/P1.0 | 31000.45 |
| A100/P1.5 | 30162.60 |
| A150/P0.5 | 47388.13 |
| A150/P1.0 | 46141.07 |
| A150/P1.5 | 44894.01 |
*A, the area of construction land in hectares (hm2); P, the plot ratio, which is dimensionless.
Table 3.
Analysis of the Impact of Land Area Changes on “Total Stormwater Runoff to be Controlled and Utilized” Under P1.5 Condition.
Table 3.
Analysis of the Impact of Land Area Changes on “Total Stormwater Runoff to be Controlled and Utilized” Under P1.5 Condition.
| Research object | Total volume of stormwater runoff to be managed and utilized(m3) |
|---|---|
| A50 | 14779.67 |
| A60 | 18116.41 |
| A70 | 21130.98 |
| A80 | 24107.04 |
| A90 | 27164.47 |
| A100 | 30162.60 |
| A110 | 33190.96 |
| A120 | 36165.71 |
| A130 | 39199.31 |
| A140 | 42212.23 |
| A150 | 44894.01 |
*A, the area of construction land in hectares (hm2); P, the plot ratio, which is dimensionless.
Table 8.
Statistical Analysis of the Impact of Secondary Indicator Changes on Total Stormwater Runoff to be Controlled and Utilized - Table a.
Table 8.
Statistical Analysis of the Impact of Secondary Indicator Changes on Total Stormwater Runoff to be Controlled and Utilized - Table a.
| Variables | A50/P1.5 | A50/P1.0 | A100/P1.5 | A100/P1.0 | ||||
|---|---|---|---|---|---|---|---|---|
| GF | PP | GF | PP | GF | PP | GF | ||
| 0% | 33254.27 | 34896.45 | 27506.62 | 41054.65 | 67865.85 | 71217.25 | 56135.95 | 83785.00 |
| 10% | 30790.99 | 32022.63 | 25864.43 | 37359.73 | 62838.75 | 65352.30 | 52784.55 | 76244.35 |
| 20% | 28327.71 | 29148.80 | 24222.24 | 33664.81 | 57811.65 | 59487.35 | 49433.15 | 68703.70 |
| 30% | 25864.43 | 26274.98 | 22580.06 | 29969.89 | 52784.55 | 53622.40 | 46081.75 | 61163.05 |
| 40% | 23401.15 | 23401.15 | 20937.87 | 26274.98 | 47757.45 | 47757.45 | 42730.35 | 53622.40 |
| 50% | 20937.87 | 20527.33 | 19295.69 | 22580.06 | 42730.35 | 41892.50 | 39378.95 | 46081.75 |
| 60% | 18474.59 | 17653.50 | 17653.50 | 18885.14 | 37703.25 | 36027.55 | 36027.55 | 38541.10 |
| 70% | 16011.31 | 14779.67 | 16011.31 | 15190.22 | 32676.15 | 30162.60 | 32676.15 | 31000.45 |
| 80% | 13,548.03 | 11905.85 | 14369.13 | 11495.3 | 27649.05 | 24297.65 | 29324.75 | 23459.80 |
| 90% | 11,084.76 | 9032.02 | 12726.94 | 7800.38 | 22621.95 | 18432.70 | 25973.35 | 15919.15 |
| 100% | 8,621.48 | 6158.20 | 11084.76 | 4105.47 | 17594.85 | 12567.75 | 22621.95 | 8378.50 |
*A represents the land area in hm2; C represents the plot ratio (plot ratio), dimensionless; “GF” stands for the green roof ratio; “PP” stands for the permeable paving ratio.
Table 9.
Statistical Analysis of the Impact of Secondary Indicator Changes on Total Stormwater Runoff to be Controlled and Utilized - Table b.
Table 9.
Statistical Analysis of the Impact of Secondary Indicator Changes on Total Stormwater Runoff to be Controlled and Utilized - Table b.
| Variables | A100/P0.5 | A150/P1.5 | A150/P1.0 | A150/P0.5 | ||||
|---|---|---|---|---|---|---|---|---|
| GF | PP | GF | PP | GF | PP | GF | ||
| 0% | 44406.05 | 96352.75 | 101011.53 | 105999.75 | 83552.75 | 124705.59 | 66093.96 | 143411.43 |
| 10% | 42730.35 | 87136.40 | 93529.20 | 97270.36 | 78564.52 | 113482.09 | 63599.85 | 129693.82 |
| 20% | 41054.65 | 77920.05 | 86046.86 | 88540.97 | 73576.30 | 102258.59 | 61105.74 | 115976.2 |
| 30% | 39378.95 | 68703.70 | 78564.52 | 79811.58 | 68588.08 | 91035.08 | 58611.63 | 102258.59 |
| 40% | 37703.25 | 59487.35 | 71082.19 | 71082.19 | 63599.85 | 79811.58 | 56117.52 | 88540.97 |
| 50% | 36027.55 | 50271.00 | 63599.85 | 62352.8 | 58611.63 | 68588.08 | 53623.41 | 74823.36 |
| 60% | 34351.85 | 41054.65 | 56117.52 | 53623.41 | 53623.41 | 57364.57 | 51129.29 | 61105.74 |
| 70% | 32676.15 | 31838.30 | 48635.18 | 44894.01 | 48635.18 | 46141.07 | 48635.18 | 47388.13 |
| 80% | 31000.45 | 22621.95 | 41152.85 | 36164.62 | 43646.96 | 34917.57 | 46141.07 | 33670.51 |
| 90% | 29324.75 | 13405.60 | 33670.51 | 27435.23 | 38658.73 | 23694.06 | 43646.96 | 19952.9 |
| 100% | 27649.05 | 4189.25 | 26188.17 | 18705.84 | 33670.51 | 12470.56 | 41152.85 | 6235.28 |
*A represents the land area in hm2; C represents the plot ratio (plot ratio), dimensionless; “GF” stands for the green roof ratio; “PP” stands for the permeable paving ratio.
Disclaimer/Publisher’s Note: The statements, opinions and data contained in all publications are solely those of the individual author(s) and contributor(s) and not of MDPI and/or the editor(s). MDPI and/or the editor(s) disclaim responsibility for any injury to people or property resulting from any ideas, methods, instructions or products referred to in the content. |
© 2025 by the authors. Licensee MDPI, Basel, Switzerland. This article is an open access article distributed under the terms and conditions of the Creative Commons Attribution (CC BY) license (http://creativecommons.org/licenses/by/4.0/).
Copyright: This open access article is published under a Creative Commons CC BY 4.0 license, which permit the free download, distribution, and reuse, provided that the author and preprint are cited in any reuse.


