
Submitted:
30 June 2025
Posted:
01 July 2025
You are already at the latest version
Abstract
Coastal cities are vulnerable to climate change and associated hydrometeorological hazards such as flooding. Existing drainage systems have limited capacity to mitigate future climate change-induced flooding problems effectively. However, some studies have evaluated the effectiveness of integrating water-sensitive urban design (WSUD) with existing drainage systems in mitigating flooding in tropical regions. This study assesses the performance of drainage systems and integrated WSUD options under current and future climate scenarios in a sub-catchment of Saltwater Creek, a tropical catchment located in Cairns, Australia. A combination of 1-dimensional (1D) and 2-dimensional (1D2D) runoff generation and routing models (RORB, storm injector and MIKE+) is used for simulating runoff and inundation. Several types of WSUD are tested alongside different climate change scenarios to assess the impact of WSUD in flood mitigation. The results indicate that the existing grey infrastructure is insufficient to address the anticipated increase in precipitation intensity and the resulting flooding caused by climate change in the Engineers Park sub-catchment. Moderate rainfall events contributed to a 25% increase in peak flow and total runoff volume under the representative concentration pathway 8.5 in 2090 scenario. Integrating WSUD with existing grey infrastructure positively contributed to reducing the flooding problem. However, the efficiency of these combined systems is governed by several factors such as rainfall characteristics, climate change scenario, rain barrel and porous pavement systems, and the size and physical characteristics of the study area. Overall, in the tropics, the flooding problem is estimated to increase under future climatic conditions, and the integration of WSUD with grey infrastructure can play a positive role in reducing floods and their impacts.
Keywords:
climate change
; flood mitigation
; grey infrastructure
; WSUD
; flooding
1. Introduction
Floods cause widespread human and economic losses [1,2]. Tropical regions are under high risk of flooding, and these regions have experienced a fourfold increase in river flooding since 2000, the highest increase relative to other areas of the globe [3]. Rivers serve as the medium that connects urban areas and large water bodies, such as the ocean, providing a location for interaction between runoff from urban areas and the sea. Small changes in the precipitation patterns and flow of a river have a significant impact on urban flooding as well.
While flooding in the tropics is governed mostly by climate change in catchment upstream, causing extreme precipitation [4,5,6,7], sea-level rise (SLR), also impacting urban development in low-lying areas [8,9] downstream of rivers. The projected rise in global temperature is expected to lead to a significant increase in atmospheric water vapour content in the tropics, resulting in alterations to the hydrological cycle, which includes an intensification of rainfall [4]. A statistically significant correlation has been found between global warming and the intensification of extreme precipitation [10]. The historical observational data since the 1950s have shown the rise in frequency and intensity of extreme rainfall events across land areas (high confidence), and human-induced climate change is probably the key driver [4]. Climate estimates for the rest of the century have indicated a constant increase in daily extreme rainfall [4,11]. Under climate change scenarios, average rainfall will rise in the core tropics and extra-tropics while decreasing in the subtropics [12].
Local and regional variations in precipitation characteristics depend on the variability of atmospheric circulation. Some observed shifts in atmospheric circulation are correlated with climate change. A change in storm trajectories renders certain regions wetter while others, often nearby, become drier, resulting in complex patterns of change [7]. Large-scale patterns of precipitation change linked to El Niño-Southern Oscillation (ENSO) also govern global variation [13]. The locations and timing of floods and droughts are most significantly influenced by the cycle of El Niño events, specifically in the tropics and throughout the mid-latitudes of the Pacific region [14]. The rise in local urban temperatures [15,16] has also contributed to the global rise in temperature. This phenomenon has increased the probability of extreme rainfall across cities [5], in some cases by as much as 25% [17].
Predicting urban flooding solely due to climate change has significant uncertainties, since it is a complex process, resulting from a combination of climate-related variables and local controls such as insufficient drainage, rapid urbanisation, and poor infrastructure, which further exacerbate flooding [18]. Grey measures deployed in urban areas intercept, divert, and transport runoff away from developed areas, but they often fail to perform effectively during extreme rainfall events due to insufficient capacity [19]. Some studies have raised questions about the robustness of grey measures to perform under a range of flooding scenarios and have discussed other flexible and robust systems [20,21].
Water-sensitive urban design (WSUD) is an alternative method to attenuate surface/peak runoff and provide flood mitigation [21,22,23]. In Australia, the National Water Commission (2004, p. 30) [24] defined WSUD as "the integration of urban planning with the management, protection and conservation of the urban water cycle that ensures urban water management is sensitive to natural hydrological and ecological processes". WSUD has been integrated with grey measures to manage stormwater and flood mitigation [25]. Previous studies showed that, WSUD's surface runoff reduction capacity ranges from 3.6% to 78% [26,27] and peak flow reduction by 22.8% to 67.8% [28]. These studies in tropical catchments, while strongly supporting this approach, are limited in number [26,29,30,31,32,33]. The results and guidelines from temperate or arid climatic zones strongly govern existing practices [34,35,36,37]. Therefore, these critical knowledge gaps in the tropics have impacted the extensive implementation of WSUD in tropical catchments. There is a need for research into the practical application of WSUD systems and their efficiency in reducing flooding in the tropics, including the impacts of a changing climate.
This study focuses on understanding localised flooding induced by climate change in a tropical catchment, aiming to contribute to filling the knowledge gas identified above. In addition, the application of WSUD to reduce the impact of flooding in this catchment was also assessed. To understand these issues, the following research questions were addressed: (i) what is the likely impact of climate change on localised flooding? (ii) can WSUD measures contribute to flood mitigation after integration with existing grey infrastructure under climate change? and (iii) what factors affect WSUD application in the tropics under climate change?
2. Materials and Methods
2.1. Study Site
The selected study site is Engineers Park, a small sub-catchment of the Saltwater Creek catchment in Cairns city, Queensland, Australia (Latitude = -16.911, Longitude = 145.72), (Figure 1). This site was previously used for hydrodynamic study of floods in [38] and was also utilised in this study to expand the research scope to include climate change. This catchment has a total area of 0.27 km², a small fraction of the Saltwater Creek catchment, which spans a total area of 16 km². The catchment is topographically characterised by a short width of approximately 600 m and a significant elevation difference, ranging from about 11 m Australian Height Datum (AHD) at the outlet to 139 m AHD at the top.
Engineers Park is the uppermost sub-catchment of Saltwater Creek, located on the western side of the Whitfield range. Comprehensive flood modelling was undertaken at a small spatial scale, focusing on understanding rainfall-driven localised flooding at this study site, before the simulation work was expanded to the entire catchment.
The Australian Bureau of Meteorology (BOM) notes that Cairns falls in the wet tropical climatic zone. The climate record from the Cairns Aero station (31011), located at a latitude of -16.87° N and a longitude of 145.75° E, spanning the data period from 1943 to 2024, was analysed. The maximum monthly precipitation received during the wet season, from December to April, can reach up to 1417 mm. In contrast, the dry season, from July to November, precipitation is lowest. The area has an annual average rainfall ranging between 1997 mm and 3148 mm, with a long term average yearly rainfall of 2028 mm. In addition, Cairns experiences temperatures ranging from a mean maximum of 29.4°C to a mean minimum of 21.0°C; however, the maximum temperature can rise to 42.6°C during hot, humid summer days.
2.2. Datasets
All datasets used in this modelling study are detailed in [38] – also see Table 1. A high-resolution 0.5 m × 0.5 m digital elevation model (DEM), derived from a 2021 LiDAR survey provided by the Cairns Regional Council (CRC), was used to define catchment topography, delineate the catchment, and support hydrological and hydraulic modelling. Geological and soil data, including the Hodgkinson formation, were sourced from the Geological Survey of Queensland. The CRC also supplied drainage network and daily rainfall data, the latter collected via a tipping-bucket rain gauge. Water level measurements were recorded at 5-minute intervals using a pressure transducer sensor between February and September 2023, with corresponding velocity measurements taken five times during the wet season to establish a rating curve for discharge estimation. The catchment features a diverse land use, with approximately 50% covered by green spaces and tropical rainforest, transitioning from forested areas upstream to urban development downstream.
2.3. Method
2.3.1. Modelling Tools and Approach
A combination of open-source and commercial hydrological and hydraulic modelling tools was adopted. The open-source runoff-routing lumped conceptual RORB version 6.45 model was adopted for hydrological assessment [39]. This tool is a streamflow routing program that computes hydrographs from precipitation, deducting losses from precipitation to generate runoff [40]. In addition, the commercial software Storm Injector is an integrated platform where catchment files are developed using hydrological models, such as RORB [41]. Furthermore, this study adopted the MIKE+ commercial modelling tool over other modelling tools, developed by the Danish Hydraulic Institute (DHI) [42]. The tools adopted in this study have been explained in detail in an earlier study [38] and is also presented in Table 1. The research methods flow chart adopted for this study is presented in Figure 2. This research adopted the calibrated and validated MIKE+ model setup from earlier research work on Engineers Park, conducted by an identical team of authors [38]. This model was used for additional simulation scenarios, as explained in the following paragraphs.
The model calibration and validation were assessed using standard goodness-of-fit criteria. The Nash–Sutcliffe Efficiency (NSE) indicates the predictive performance of the model, where values closer to 1 reflect better agreement between observed and modelled data. The Root Mean Square Error (RMSE) measures the spread of prediction errors, indicating how closely the model results match observed values. The Percentage Bias (PBIAS) evaluates whether the model tends to overestimate or underestimate the observed data. The equations and approach adopted to evaluate the model's performance have been detailed previously [38] .
2.3.2. Climate Change Scenario Calculation
The Intergovernmental Panel on Climate Change (IPCC) has provided representative concentration pathway (RCP) scenarios used to model and project future greenhouse gas emission rates and their concentration in the atmosphere, resulting in climate change [11]. The method used to incorporate climate change scenarios in rainfall design events was detailed in the Australian Rainfall Runoff (ARR) 2019 [43]. This method facilitates the incorporation of temperature data into rainfall intensity or depth for future scenarios. As a scaling factor, the direct conversion of rainfall data from Intensity, Frequency Duration (IFD) is the least accurate and has higher uncertainty in rainfall measurements. Therefore, temperature data are often used as a parameter to assist in developing a scaling factor, as follows:
where IARR refers to the design rainfall intensity obtained from the IDF curve, 1.05 = presumed temperature scaling factor based on the exponential relationship between temperature and humidity, ARR = Australian rainfall-runoff, and Tm = Temperature at the midpoint or median of the selected class interval. The temperature data were adopted due to higher confidence in the simulation results for temperature relative to rainfall. ARR has suggested using an adjustment factor for IFD, as advised by the temperature projection in [43].
Rainfall intensity/depth scaling factor (Ip) = IARR *1.05Tm
This research used the Storm Injector to create climate scenarios. The catchment file prepared using the RORB model was imported into the Storm Injector, including storm files from the ARR data hub [44] and the intensity-frequency-duration curve from the BOM [45] can also be injected. This tool was used to incorporate climate change scenarios and calculate rainfall design events under future climate scenarios. Climate change open data was obtained from the Queensland Long Paddock [46]. This platform provides a regionalised summary of statistical data for Queensland, featuring high spatial resolution.
2.3.3. Modelling Simulation Scenarios
The modelling under the current and climate change scenarios adopted for this study are presented in Table 2. The RCP, a greenhouse gas concentration emission projection considered by the IPCC for modelling the future climate state, are adopted for modelling purposes. The three climate scenarios considered in this study are the current climate (CC), RCP 4.5, and RCP 8.5 scenarios. RCP 4.5 was considered for the assessment, representing a moderate emission trajectory and stabilisation scenario [47]. However, stable climate change impacts, such as changes in temperature patterns, rainfall, and sea level rise, are projected to be observed during this scenario [4]. Furthermore, RCP 8.5 is considered a high-emission pathway based on whether limited or no mitigation measures were implemented to reduce GHG emissions.
The study incorporated several Water Sensitive Urban Design (WSUD) features aimed at improving stormwater management and enhancing urban resilience. These included bioretention systems and raingardens, which use vegetation and engineered soils to filter and slow runoff; rain barrels, which capture and store rainwater for reuse; infiltration trenches, designed to promote groundwater recharge by allowing runoff to soak into the ground; and porous pavements, which reduce surface runoff by enabling water to pass through the pavement surface. Collectively, these WSUD measures help reduce flood risk, improve water quality, and support sustainable urban water management. For more details on the characteristics of these systems, refer to Appendix A.
3. Results
3.1. Climate Change Impact on Design Rainfall Characteristics
The alteration in rainfall depth under climate change scenarios are estimated (Table 3). The comparative assessment of rainfall depth revealed a consistent rise during the RCP 4.5 and RCP 8.5 scenarios for 2090 across minor, moderate, and major events. For instance, rainfall depth increased by approximately 7.5% and 14% during major events under RCP 4.5 in 2090 and RCP 8.5 in 2090, respectively, relative to the CC. Similarly, minor and moderate rainfall design events followed a similar pattern of change. The IPCC report highlighted the rainfall correlation with the Clausius-Clapeyron relationship, indicating a 7% rise in rainfall per one °C increase in temperature [4]. However, this study observed a marginally higher rainfall increment than the IPCC report. This was because the 7% increase in rainfall for every degree is an average value that varies depending on local climate and data [48]. The application of high-resolution local climatic data from Queensland’s Long Paddock [46] contributed to providing marginally different results from the IPCC report.
The critical time to peak flow was 30 minutes for minor and moderate events, and 25 minutes for major events. Despite the increase in rainfall depth under future climate scenarios, the critical time for peak flow generation for this catchment remains constant for all scenarios. The critical time consistency might be due to the lumped nature of the RORB model. On the other hand, catchment rainfall-runoff dynamics are governed by several different parameters such as topography, land use features [49], antecedent moisture [50], and hydraulic structures [51]. This finding suggests that an in-depth understanding of local catchment characteristics is key to assessing the impact of climate change.
3.2. Flood Mitigation Under Climate Change Scenarios
A comprehensive evaluation of WSUD performance under current and future climate change scenarios, considering both 1D and coupled 1D2D results, is presented to understand the effectiveness of individual and mixed WSUD technologies.
3.2.1. Grey Infrastructure Performance Under Climate Change
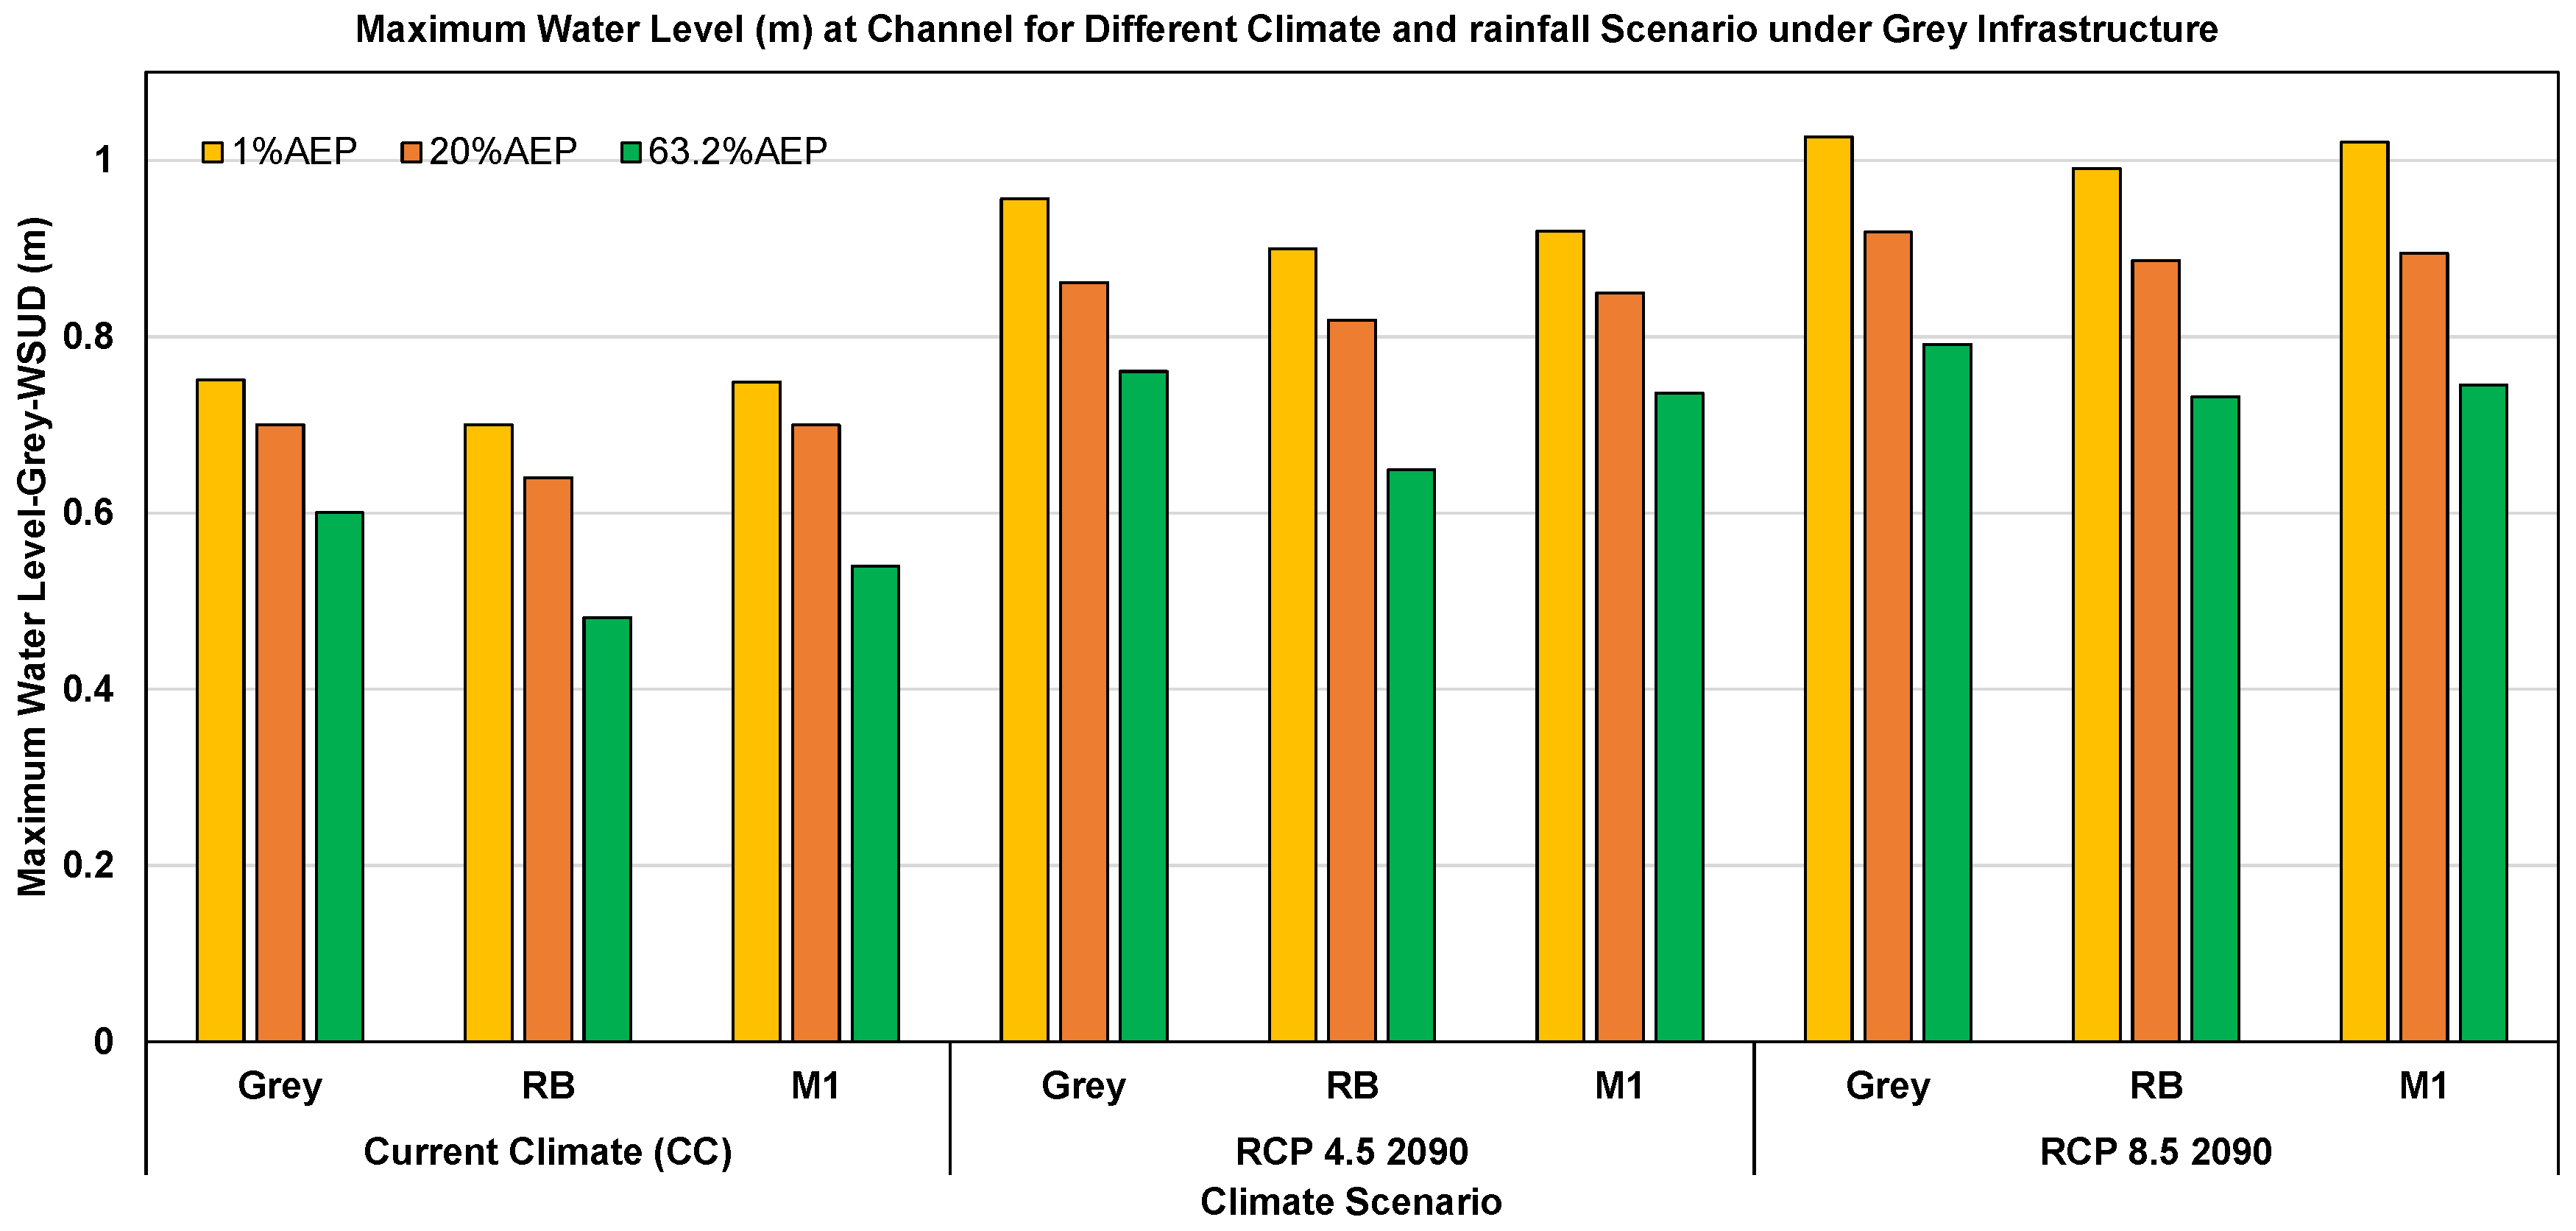
During this simulation, rainfall intensity was the only dynamic parameter that influenced the flow in the catchment. Other parameters affecting flow, such as land use, were kept constant to ensure comparable results. An increasing trend in peak flow and total runoff volume was observed with existing grey infrastructure under climate change scenarios across all rainfall scenarios (Table 3). The comparative assessment of peak flow during the CC and RCP 8.5 in 2090 revealed increments of 20%, 25% and 16% during major, moderate, and minor AEP, respectively. The total runoff volume also exhibited increments of 20%, 25%, and 19% when compared between CC and RCP 8.5 in 2090 under major, moderate, and minor events, respectively. These moderate-sized rainfall events exhibited the highest peak flow and total runoff volume increments, followed by major and minor events under climate scenarios, indicating that moderate-sized rainfall events can also exacerbate flooding to a similar extent as major events. The spatially distributed grey infrastructure within the study site plays a critical role in governing this phenomenon. Runoff generated from different catchment locations was efficiently intercepted and transported, particularly during moderate events. Subsequently, natural water loss mechanisms, such as infiltration and retention, were reduced during the runoff travel time, resulting in higher peak flow and total runoff volume values during such events. These findings highlight the critical role of grey measures in exacerbating flooding conditions in future climate scenarios.

Table 3.
Peak flow and total runoff volume alteration under different climate scenarios.
| peak flow (m3/s) | |||
| AEP | CC | RCP 4.5 in 2090 | RCP 8.5 in 2090 |
| Minor | 4 | 4 | 5 |
| Moderate | 6 | 7 | 8 |
| Major | 10 | 11 | 12 |
| total runoff volume (m3) | |||
| Minor | 0.33*106 | 0.38*106 | 0.41*106 |
| Moderate | 0.47*106 | 0.58*106 | 0.63*106 |
| Major | 1.56*106 | 1.75*106 | 1.95*106 |
3.2.2. Impact of Climate Change on Individual WSUD Performance
The peak flow and total runoff volume reduction achieved by individual WSUD systems under different climate scenarios is presented in Figure 3 and Figure 4. rain barrel was the best-performing WSUD system, demonstrating peak flow and total runoff volume reductions ranging from 1% to 42% and 7% to 46%, respectively. On the other hand, bio-retention was the worst-performing system, with peak flow and total runoff volume reductions ranging from -6.0% to 40% and 1% to 42%, respectively. Overall, the individual WSUD systems’ peak flow and total runoff volume reductions follow an ascending order of bio-retention < rain garden < infiltration trench < porous pavement < rain barrel.
A comparative analysis of the best- and worst-performing WSUD efficiency under rainfall events reveals that the percentage reduction in peak flow ranges from 1% to 21% under climate change (CC) and from 6% to 27% for the RCP 8.5 in 2090. At the same time, the efficiency difference between the best and worst WSUD under climate change scenarios ranges from 1% to 7% and 0% to 4% during major rainfall events under CC and RCP 8.5 in 2090, respectively. Similarly, total runoff volume reduction performance shows a small degree of variation. During minor rainfall, total runoff volume reduction ranges from 11% to 15% and 2% to 18% for rain barrel and bio-retention, respectively, for RPC 8.5 in 2090. On the other hand, under RCP 8.5 in 2090, total runoff volume reduction differences between rain barrel and bio-retention range from 1.5% to 3.9% during major rainfall, with bio-retention intermittently showing negative performance (-2.6%). The sensitivity of individual WSUD peak flow reduction efficiency is notably high compared to total runoff volume, remarkably during rainfall events.
The wide range of WSUD performance variation under rainfall design events was due to significant alteration in rainfall depth, i.e., by 29% and 48% during major rainfall relative to minor rainfall events. However, the rainfall depth variation compared to the climate scenario between CC and RCP 8.5 in 2090 was only about 14%. The rainfall variation between minor and major design events under the current climate was almost 2 to 3 times higher than in the climate scenarios. The performance of WSUD systems observed a nominal decline in efficiency of flood mitigation when comparing current and future climate scenarios. The selection of the rainfall design event is a critical factor, followed by climate change factors, in determining the performance of WSUD flood mitigation [52].
The minimum effective impervious area reduction required to achieve positive peak flow reduction under CC was a 10% reduction in effective impervious area during minor rainfall. Under CC, an effective impervious area reduction of 10% or less after intervention by WSUD resulted in a negative peak flow reduction, implying an increase in peak flow. In addition, under RCP 8.5 in 2090, an effective impervious area reduction of < 20% yielded a negative result. In comparison, for RCP 8.5 in 2090, WSUD, such as bio-retention and RG, resulted in higher negative results than the CC scenario. The study also found that the increasingly negative values become more noticeable during peak flow reduction, resulting from lower WSUD coverage of 20% effective impervious area, particularly during moderate or minor rainfall events, in addition to major events.
In contrast, with maximum effective impervious area reduction, the peak flow efficiency remains almost constant after 60% effective impervious area under current climate conditions. However, the WSUD peak flow reduction, particularly effective impervious area reduction under RCP 8.5 in 2090, requires an 80% effective impervious area reduction to achieve maximum efficiency. The results suggest that the impact of climate change necessitates an increase in effective impervious area reduction in proportion to the effect during minor, moderate, and major events. However, a 40% to 60% effective impervious area reduction with WSUD application appears to be the optimal peak flow reduction for all WSUD types under current and future climate change scenarios.
Examining the trend of peak flow and total runoff volume reduction efficiency, the WSUD peak flow reduction exhibits a non-linear relationship with the effective impervious area reduction, influenced by climate change. Climate change scenarios are projected to increase rainfall intensity, implying an increase in complexity and potential uncertainty in their performance. The relationship between effective impervious area reduction and peak flow and total runoff volume reduction exhibits a linear trend until 60% effective impervious area under CC, after which the results remain constant even with an effective impervious area increment to 100% effective impervious area. However, under RCP 8.5 in 2090 climate change scenarios, WSUD showed a linear relationship with efficiency until an 80% effective impervious area reduction remained constant or exhibited a nominal increment towards 100% effective impervious area. In general, the relationship between WSUD efficiency and effective impervious area reduction showed a non-linear trend, depending on the rainfall design events; this trend becomes more prominent with the impact of climate change.
3.2.3. Mixed WSUD Performance
The application of a mixed WSUD approach assumes that different individual methods can be combined to enhance the flood mitigation capacity. The mixed WSUD peak flow and total runoff volume reduction is presented in Figure 5 and Figure 6. The graphs indicate that M1 (which is porous pavement+rain barrel) and M4 (which is porous pavement+rain barrel+bio-retention+rain garden+infiltration trench) are the most and least effective mixed WSUD for peak flow and total runoff volume reduction, respectively. Mixed WSUD can be ranked in ascending order: M1 > M2 > M3 > M4, for all rainfall and climate scenarios. The individual performance of WSUD in this catchment controlled the overall ranking of the WSUD options.
Earlier studies have reported that combining different WSUDs helps improve peak flow reduction [23,28,53,54,55]. The combination of individual systems influences the functions of both retention and infiltration-based systems, thereby enhancing overall efficiency. The low infiltration capacity of the soil in this catchment limited the effectiveness of the infiltration-based systems, and the combination of retention and infiltration-based systems contributed to reducing the negative results with small effective impervious area reductions.
Furthermore, combining different WSUD systems significantly reduced the inconsistency in results compared to those of individual WSUD systems under climate change scenarios. The negative peak flow value, with the minimum effective impervious area reduction, observed positive results or improvements in efficiency. For illustration, the discrepancy in peak flow between the best- and worst-performing WSUD during major rainfall under RCP 8.5 in 2090 is 15%, with 100% effective impervious area for an individual WSUD component. It reduced the discrepancy of individual WSUD components in peak flow by 7.6%. A 50% improvement in alignment between options was observed with the combination of different WSUD systems. The inconsistency in efficiency was reduced after combining the WSUD system under a broader range of uncertain scenarios, improving the reliability of WSUD performance under uncertain conditions.
3.2.4. WSUD Performance
To assess the flood mitigation performance of WSUD, a coupled 1D/2D model was used to simulate both individual and combined WSUD systems. Results showed water level variations ranging from 0.05 m to 1.03 m across different rainfall and climate scenarios. Higher water level changes occurred in channel and roadside areas, especially near culverts and road ends, under intense rainfall. Integrating WSUD with grey infrastructure reduced maximum water levels at the catchment outlet by 7–20% under current climate conditions, and by 3–7% under RCP 8.5 for 2090. WSUD also significantly reduced overland flow, though extreme rainfall under climate change scenarios challenged inlet and pipe capacities, leading to localized overflow.
Figure 7.
Engineers Park maximum water level variation under CC, RCP 4.5 in 2090, RCP 8.5 in 2090 with grey and best WSUD (rain barrel & M1) with 100% effective impervious area.
Figure 7.
Engineers Park maximum water level variation under CC, RCP 4.5 in 2090, RCP 8.5 in 2090 with grey and best WSUD (rain barrel & M1) with 100% effective impervious area.
The maximum velocity variation at the channel outlet under different rainfall and climate scenarios ranged from 1 to 3.5 m/s under current conditions and up to 5 m/s under RCP 8.5 by 2090, indicating a potential 40% increase due to intensified rainfall (Figure 8). While velocity is less discussed in literature compared to inundation or water level, it is critical for assessing flood hazard. The increase is attributed not only to greater runoff but also to the steep upper catchment and grey infrastructure. In contrast, effective WSUD measures like rain barrels and M1 significantly reduced velocities by 4–48%, particularly under major and moderate rainfall events. High velocities pose safety risks, transporting debris and increasing flood damage potential, even during minor events.
The number of flooded nodes under different climate scenarios and rainfall conditions varied notably with the integration of WSUD. Under RCP 8.5 in 2090, flooded nodes increased by up to 33% and 62% during moderate and minor events, respectively, due to higher rainfall and runoff. However, WSUD implementation led to a reduction in flooded nodes by up to 30% (current climate) and 57% (RCP 8.5) during moderate events, and up to 62% and 25% under minor events, respectively (Figure 9). The data suggest WSUD is most effective in reducing node flooding during moderate and minor rainfall, while its impact is limited under major events.
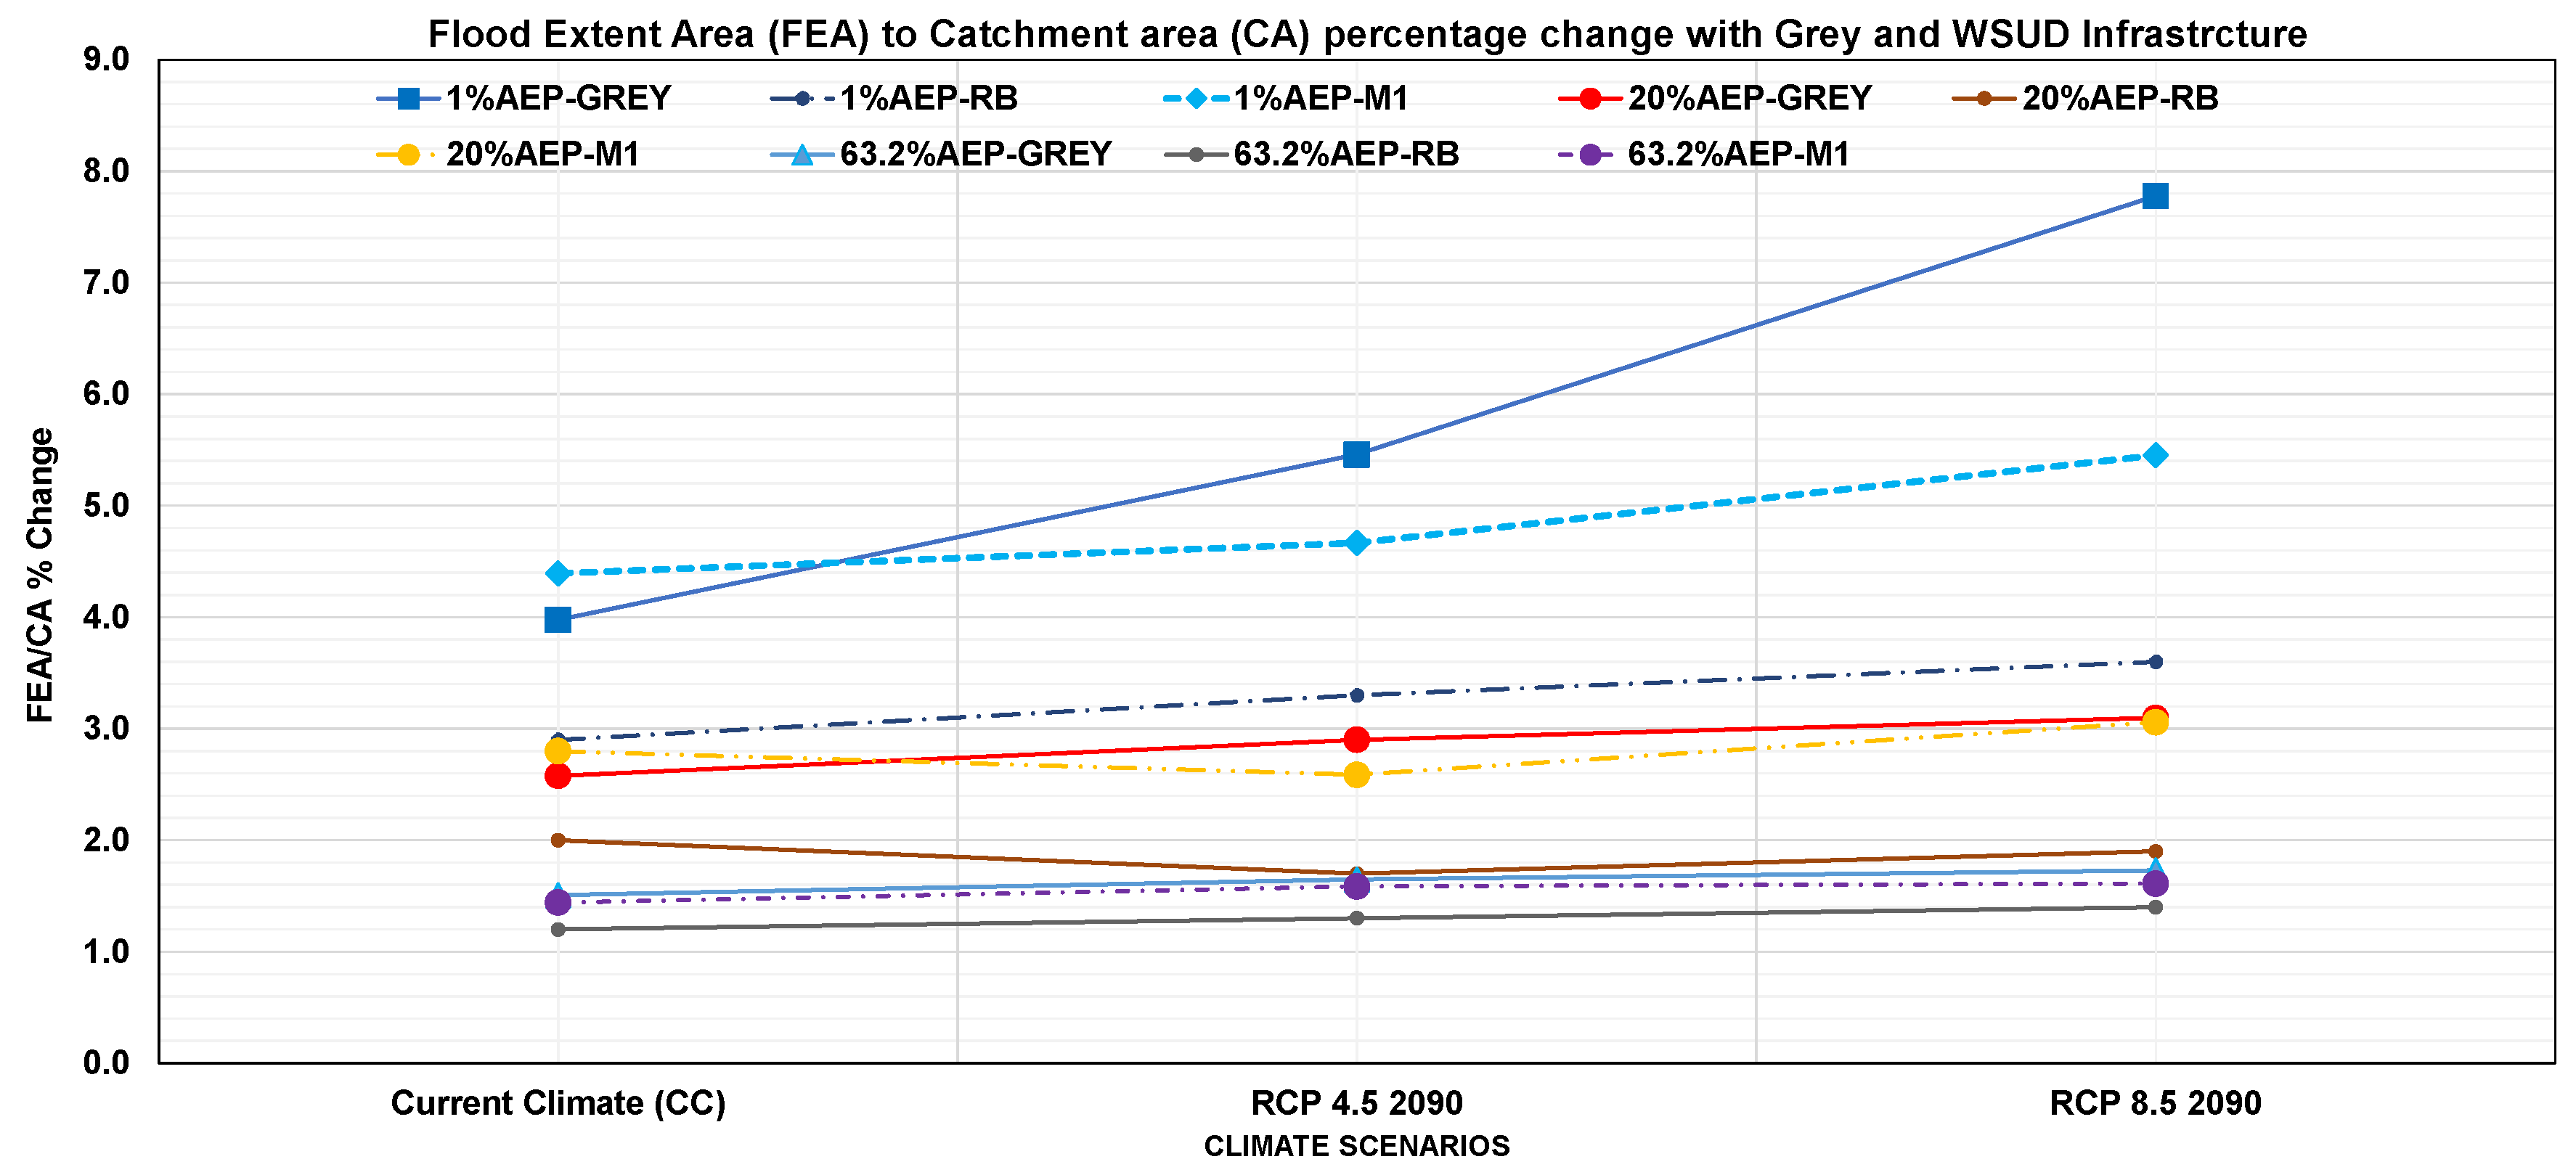
The flood extent area to catchment area (FEA/CA) ratio, ranging from 1% to 8% across scenarios, serves as a key indicator of flood mitigation efficiency. A sharp increase in this ratio was observed during major rainfall under future climate scenarios (RCP 4.5 and 8.5 in 2090), while it remained relatively stable during minor and moderate events (Figure 10). WSUD integration significantly improved runoff management by intercepting direct flows from impervious surfaces and routing them to inlets, effectively reducing flooded nodes, overland flow, and inundation depths. Overall, WSUD reduced the FEA by 22–26% under current climate and by 18–54% under RCP 8.5 in 2090, with the most notable reductions during major rainfall events.
4. Discussion
4.1. Flood Mitigation Under Climate Change Scenarios
Even in a small catchment, projected increases in rainfall depth under climate change can have critical impacts, suggesting that compact urban areas may face significant hydrological stress. The findings indicate that existing grey infrastructure may become overwhelmed, particularly during moderate and minor events, not just major storms. Under future climate scenarios, runoff volumes are likely to exceed design capacities, leading to surface flow accumulation in low-lying areas, overspilling from culverts, and increased flood risks throughout the catchment. While grey infrastructure is effective at intercepting runoff, this also accelerates water movement, reduces infiltration, and contributes to flash flooding, especially downstream.
The study area, located in the steep upper reaches of the Saltwater Creek catchment, experiences rapid runoff due to a sharp elevation drop, increasing the risk of high-velocity flows and flash flooding in urbanised zones. Although prolonged inundation is unlikely, the fast-moving water poses serious safety hazards to pedestrians and vehicles. These results highlight the need for a more strategic and integrated flood management approach. Complementing grey systems with low-cost WSUD solutions—such as those that can be incorporated into residential gardens—offers an opportunity to improve local resilience and reduce flood impacts at the sub-catchment scale.
4.2. WSUD Performance Under Climate Change
Rainfall intensity, climate scenarios, and the degree of effective impervious area reduction influence the performance of WSUD in this study. This study confirms a linear relationship between effective impervious area reduction and WSUD effectiveness in mitigating peak flow and total runoff volume, up to 40% effective impervious area reduction.
Optimal performance of the WSUD systems was observed when effective impervious area was decreased by 40% and 60% compared to existing scenarios. The studies conducted in Genoa, Italy, with a Mediterranean climate, and in New Zealand, with a temperate climate, reported similar results [57,58]. While effective impervious area reductions of more than 40% were observed, peak flow and total runoff volume efficiency were nonlinearly related to effective impervious area reduction during major events. During major events, other parameters, such as the amount of runoff received by the system, antecedent moisture, soil infiltration, and retention capacity, play a vital role in WSUD performance. With climate change, the WSUD performance in decreasing peak flow and total runoff volume is expected to follow a non-linear trend, with increasing rainfall intensity.
Different WSUD systems responded differently under various climate and rainfall conditions. Retention-based systems, such as rain barrel and porous pavement, performed better than infiltration-based systems, including bio-retention, rain garden, and infiltration trench, especially during major storm events. The topography of the catchment was the primary regulator of these results. Therefore, incorrect selection of WSUD systems, without considering site-specific slope and soil properties, could lead to reduced performance or reverse effects on peak flow and total runoff volume.
The study demonstrates that carefully selected and appropriately scaled WSUD systems can significantly reduce peak flow and total runoff volume under a range of climate scenarios. Their performance is particularly valuable in tropical climates where high-intensity rainfall events are becoming more frequent. These findings underscore the importance of context-sensitive design and a comprehensive evaluation of multiple influencing factors when planning WSUD interventions.
The application of WSUD needs to be carefully assessed in the context of climate change scenarios. Under these scenarios, moderate and minor rainfall events can equally exacerbate flooding, like a major event. WSUD performance under high emission scenarios has been observed to degrade by up to 50%. During climate change conditions, the WSUD performance does not follow a linear trend; thus, its performance becomes highly unpredictable. Alteration in the characteristics of rainfall events due to climate change decreases the reliability of WSUD flood mitigation efficiency.
In general, the implementation of WSUD measures at the study site had a positive overall effect on flood mitigation across various climate change scenarios. By intercepting runoff from roofs, pavements, and streets at its source, WSUD systems reduced the runoff entering the drainage network, leading to lower peak flow, total runoff volume, and overland flow along roadsides. These benefits were observed at the site scale. WSUD reduced roadside flooding and water depth, lowering the risk to pedestrians and vehicles. At the catchment scale, reductions in total runoff and delayed peak flows may help mitigate flood severity and flashiness in downstream, low-lying areas. This dual benefit highlights WSUD as a key strategy for improving flood resilience across multiple spatial scales.
4.3. Incorporating Climate Change: Philosophical and Methodological Issues
Climate change impacts are evident in design rainfall, including the type of rainfall, its frequency, intensity, and spatial and chronological distribution, antecedent moisture, and changes in sea level [34]. ARR 2019 has proposed several philosophical and methodological approaches to address such uncertainty, reflecting the evolving understanding of climate science and its implications for hydrology. Each method discussed, as shown in Table 4, has its strengths and weaknesses; however, none of the approaches thoroughly addresses the limitations. To overcome this uncertainty, this study employed an integrated, precautionary, scenario-based approach within the regional context, along with an adaptive management principles approach, to evaluate current flood mitigation measures and the potential of WSUD systems. The current study assessed the effectiveness of existing grey measures during three rainfall events under current and future climate change scenarios. The best available local data, obtained from the Cairns Regional Council and fieldwork, were utilised to establish the model setup, calibration, and validation phases. In addition, not only the existing measures, but also proposed interventions using WSUD measures were evaluated. Although this is a time- and resource-consuming process, it can be an advantageous approach to reduce potential sources of uncertainty and improve the reliability of decision-making.
Climate change evaluations generally rely on long-term historical records of temperature, rainfall, evaporation, and sea level rise [22]. Although there is availability of estimated rainfall data, it often lacks the spatial and temporal accuracy essential for direct flood modelling. To address this constraint, [35] proposed a method that leverages more reliable temperature projections to estimate rainfall changes under future climate scenarios. Thus, this study has adopted temperature climate data to assess the impact of climate change on rainfall.
5. Limitations and Future Research
The WSUD modelling approach adopted during this study showed promising results. These results could have been further validated with measured data from the inflow and outflow of the WSUD systems themselves. Despite the absence of a WSUD system at our study site, our results can serve as a preliminary guide for the future application of such measures in tropical regions and further validate the current findings.
Future research should focus on how flooding patterns change in response to climate change, including the effectiveness of existing flood mitigation measures at the catchment scale. The impact of climate change on WSUD performance needs to be assessed. Most of the study focuses on the WSUD site-scale contribution; however, future research should also examine its catchment-scale implications and the suitability of centralised or decentralised application approaches.
6. Conclusions
This study evaluated the performance of grey infrastructure and WSUD systems in mitigating flooding under various rainfall intensities and climate change scenarios in a tropical urban catchment.
Under future climate change scenarios, grey infrastructure alone proved inadequate for managing increased flood risk. In contrast, integrating WSUD with grey infrastructure significantly improved flood mitigation outcomes. WSUD implementation reduced peak flow, total runoff volume, node flooding, and the flood extent ratio across all climate and rainfall scenarios.
The study suggests a critical need to evaluate the role of grey measures in urban flood management. Future urban flood mitigation and adaptation approaches must be able to cope with future greater water volumes to address the challenges posed by climate change effectively. This result implies that the increase in peak flow and total runoff volume under future climate change was evident for all AEP, exacerbating flood risk. While WSUD demonstrated clear potential for enhancing flood resilience in this tropical catchment, the performance of some WSUD systems may be limited by steep terrain, soil properties, or design constraints. Combining multiple WSUD strategies can help overcome these limitations, but careful evaluation of individual system performance is required before integration. Overall, WSUD integration represents a valuable complement to grey infrastructure in tropical urban settings. However, its long-term effectiveness will depend on site-specific design, climate adaptability, and integration into broader flood management planning frameworks.
Author Contributions
Conceptualization, S.B.G. and B.J.; Data collection and modelling works, S.B.G.; investigation, S.B.G.; resources, S.B.G., S.B.G.; writing—original draft preparation, S.B.G.; writing—review and editing, S.B.G., B.J., R.J.W., and M.B.; visualisation; supervision, B.J., R.J.W., and M.B.; All authors have read and agreed to the published version of the manuscript.
Funding
The authors gratefully acknowledge the support of James Cook University for providing funding through the International Research Training Program (IRTPS) for this research. Additionally, the authors would like to acknowledge the Cairns Regional Council (PD23041 Saltwater Creek Flood Mitigation Project) and the Queensland Government Department of Environment and Science for funding this project. Furthermore, the authors would also like to thank the Hunter Research Grant for providing the additional funds to purchase the software tools.
Data Availability Statement
The field data used in this study are available from the corresponding author upon request.
Acknowledgments
The authors would also like to acknowledge James Cook University, the Cairns Regional Council, and the Queensland Government Department of Environment and Science for their funding of this project. Specifically, we would like to thank Iain Brown and David Ryan for providing us with valuable data, reports, and information. The authors would like to acknowledge DHI Australia for providing the student version of the MIKE+ Tool license for research purposes. The authors also appreciate the Australian Bureau of Meteorology (BOM) and Queensland Long Paddock. The authors would also like to thank the Hunter Research Grant for providing the additional funds to purchase the tools. The authors also acknowledge the anonymous reviewers whose comments have improved this manuscript.
Conflicts of Interest
The authors declare that they have no conflicts of interest.
Appendix A
| Parameters | Bioretention | Raingarden | Rain Barrel | Infiltration trench | Porous Pavement |
|---|---|---|---|---|---|
| Surface | |||||
| Berm height (mm) | 1000 | 1000 (100-1000) | 200 | 100 (100-1000) | |
| Vegetative cover | 0.7 | 0.7 | 0 | 0 | |
| Surface slope (%) | 1 | 1 | 1 | ||
| Surface roughness (m^1/3)/s | 0.1 | 0.1 (0.1-0.15) | 0.1 | 0.1 (0.1-0.15) | |
| Soil infiltration capacity (mm/h) | 1 | 10-140 | - | - | |
| Swale side slope (rise/run) | - | - | 3-4 | ||
| Soil | |||||
| Field capacity | 0.31 | 0.31 | 0.31 | 0.31 | |
| Wilting point | 0.09 | 0.09 | 0.09 | 0.09 | |
| Flow Capacity based (leak capacity/infiltration capacity/h) | 1.5 |
1.5 |
- | - | |
| Infiltration capacity (mm/hr) | 50 | 50 | |||
| Conductivity based | 5 | 1.5 | - | - | |
| Conductivity, conductivity slope, suction header) | 49.5 | 5-105 | - | - | |
| Pavement | |||||
| Thickness | - | - | - | 150 | |
| Porosity | - | - | - | 0.21 | |
| Permeability | - | - | - | 3000 | |
| Impervious surface | - | 10-70 | 10-70 | 0 | |
| Storage | |||||
| Height (mm) | 300 | - | 900 | 500 | 250 |
| Porosity | 0.3 | - | 0.35 | 0.9 | |
| Conductivity | 300 | - | 300 | 1000 | |
| Clogging factor | 0 | - | 0 | 0 | |
| Drain | - | - | |||
| Offset height (mm) | 200 | - | 300 | 200 | 200 |
| Delay (h) | - | - | 0.5 | 0.5 | - |
| exponent | 0.5 | - | 0.5 | - | 0.5 |
| Drain capacity (per area-capacity area mm/h) | 50 | - | 50 | 50 | 50 |
| Drain coefficient | - | 0 -120 | 0-20 | - |
References
- Dottori, F.; Szewczyk, W.; Ciscar, J.C.; Zhao, F.; Alfieri, L.; Hirabayashi, Y.; Bianchi, A.; Mongelli, I.; Frieler, K.; Betts, R.A.; et al. Increased human and economic losses from river flooding with anthropogenic warming. Nature Climate Change 2018, 8, 781–786. [Google Scholar] [CrossRef]
- Liu, Q.; Du, M.; Wang, Y.; Deng, J.; Yan, W.; Qin, C.; Liu, M.; Liu, J. Global, regional and national trends and impacts of natural flood, 1990–2022. Bulletin of the World Health Organisation 2024, 102, 410–420. [Google Scholar] [CrossRef]
- Najibi, N.; Devineni, N. Recent trends in the frequency and duration of global floods. Earth System Dynamics 2018, 9, 757–783. [Google Scholar] [CrossRef]
- IPCC. Climate change 2021: The physical science basis summary for policymakers, 1–42.
- IPCC. Research handbook on climate change and agricultural law. Research Handbook on Climate Change and Agricultural Law 2019, 1–472. [Google Scholar] [CrossRef]
- Kundzewicz, Z.W.; Szwed, M.; Pińskwar, I. Climate variability and floods-A global review. Water (Switzerland) 2019, 11. [Google Scholar] [CrossRef]
- Trenberth, K.E. Changes in precipitation with climate change. Climate Research 2011, 47, 123–138. [Google Scholar] [CrossRef]
- Chen, A.; Giese, M.; Chen, D. Flood impact on Mainland Southeast Asia between 1985 and 2018—The role of tropical cyclones. Journal of Flood Risk Management 2020, 13. [Google Scholar] [CrossRef]
- Lambin, E.F.; Geist, H.J.; Lepers, E. Dynamics of land-use and land-cover change in tropical regions. Annual Review of Environment and Resources 2003, 28, 205–241. [Google Scholar] [CrossRef]
- O'Gorman, P.A.; Schneider, T. The physical basis for increases in precipitation extremes in simulations of 21st-century climate change.
- IPCC. Foreword Technical and Preface. Climate Change and Land: an IPCC special report on climate change, desertification, land degradation, sustainable land management, food security, and greenhouse gas fluxes in terrestrial ecosystems.
- Chadwick, R.; Good, P.; Martin, G.; Rowell, D.P. Large rainfall changes consistently projected over substantial areas of tropical land. Nature Climate Change 2016, 6, 177–181. [Google Scholar] [CrossRef]
- Cha, E.J.; Knutson, T.R.; Lee, T.-C.; Ying, M.; Nakaegawa, T. Third assessment on impacts of climate change on tropical cyclones in the Typhoon Committee Region – Part II: Future projections. Tropical Cyclone Research and Review 2020, 9, 75–86. [Google Scholar] [CrossRef]
- Trenberth, K.E.; Fasullo, J.T. Tracking Earth's Energy: From El Niño to Global Warming. Surveys in Geophysics 2012, 33, 413–426. [Google Scholar] [CrossRef]
- Simperler, L.; Kretschmer, F.; Ertl, T. A methodical framework for analysing the cause of urban pluvial flooding in a hillside settlement. Water Science and Technology 2019, 79, 1798–1807. [Google Scholar] [CrossRef] [PubMed]
- Tabari, H.; Moghtaderi Asr, N.; Willems, P. Developing a framework for attribution analysis of urban pluvial flooding to human-induced climate impacts. Journal of Hydrology 2021, 598, 126352–126352. [Google Scholar] [CrossRef]
- IPCC. P54 / WGI-14 - Changes to the underlying scientific-technical assessment to ensure consistency with the approved SPM These trickle backs will be implemented in the Chapter during copy-editing P54 / WGI-14 - Changes to the underlying scientific-technical a.
- Dharmarathne, G.; Waduge, A.O.; Bogahawaththa, M.; Rathnayake, U.; Meddage, D.P.P. Adapting cities to the surge: A comprehensive review of climate-induced urban flooding. Results in Engineering 2024, 22. [Google Scholar] [CrossRef]
- Sui, X.; van de Ven, F. Can the implementation of Low Impact Development reduce basin runoff? Hydrology and Earth System Sciences Discussions 2021, 1–24. [Google Scholar]
- Chen, W.; Wang, W.; Huang, G.; Wang, Z.; Lai, C.; Yang, Z. The capacity of grey infrastructure in urban flood management: A comprehensive analysis of grey infrastructure and the green-grey approach. International Journal of Disaster Risk Reduction, 54, 102045 2021, 54. [Google Scholar] [CrossRef]
- Eckart, K.; McPhee, Z.; Bolisetti, T. Performance and implementation of low impact development – A review. Science of the Total Environment 2017, 607-608, 413–432. [Google Scholar] [CrossRef]
- Dandy, G.C.; Di Matteo, M.; Maier, H.R. Optimization of WSUD Systems; Elsevier Inc.: 2018; pp. 303-328.
- Walker, C.; Lucke, T. Urban Lakes as a WSUD System. Woodhead Publishing: In Approaches to Water Sensitive Urban Design, 2019; pp. pp. 269-285.
- Cook, S.; van Roon, M.; Ehrenfried, L.; LaGro, J.; Yu, Q. WSUD “Best in Class”-Case Studies From Australia, New Zealand, United States, Europe, and Asia. Elsevier: 2018; pp. 561-585.
- Ladson, A. Using WSUD to Restore Predevelopment Hydrology. Elsevier: 2018; pp. 209-228.
- Patel, P.; Karmakar, S.; Ghosh, S.; Aliaga, D.G.; Niyogi, D. Impact of green roofs on heavy rainfall in tropical, coastal urban area. Environmental Research Letters 2021, 16. [Google Scholar] [CrossRef]
- Teang, L.; Wongwatcharapaiboon, J.; Irvine, K.; Jamieson, I.; inchumphu, D. Modelling the Impact of Water Sensitive Urban Design on Pluvial Flood Management in a Tropical Climate; 2021.
- Yau, W.K.; Radhakrishnan, M.; Liong, S.Y.; Zevenbergen, C.; Pathirana, A. Effectiveness of ABC waters design features for runoff quantity control in Urban Singapore. Water (Switzerland) 2017, 9, 577. [Google Scholar] [CrossRef]
- Irvine, K.N.; Ho, H.L.; Chua, L.H.C. Dynamics of runoff quality associated with an urban park and WSUD treatment train in a tropical climate. Environmental Technology (United Kingdom) 2021, 0, 1–16. [Google Scholar] [CrossRef]
- Rech, A.; Pacheco, E.; Caprario, J.; Rech, J.C.; Finotti, A.R. Low-Impact Development (LID) in Coastal Watersheds: Infiltration Swale Pollutant Transfer in Transitional Tropical/Subtropical Climates. Water (Switzerland) 2022, 14. [Google Scholar] [CrossRef]
- Taniwaki, R.H.; Piggott, J.J.; Ferraz, S.F.B.; Matthaei, C.D. Climate change and multiple stressors in small tropical streams. Hydrobiologia 2017, 793, 41–53. [Google Scholar] [CrossRef]
- Hermawan, A.A.; Talei, A.; Salamatinia, B.; Chua, L.H.C. Seasonal performance of stormwater biofiltration system under tropical conditions. Ecological Engineering 2020, 143. [Google Scholar] [CrossRef]
- Vojinovic, Z.; van Teeffelen, J. An integrated stormwater management approach for small islands in tropical climates. Urban Water Journal 2007, 4, 211–231. [Google Scholar] [CrossRef]
- Sharma, A.K.; Pezzaniti, D.; Myers, B.; Cook, S.; Tjandraatmadja, G.; Chacko, P.; Chavoshi, S.; Kemp, D.; Leonard, R.; Koth, B.; et al. Water sensitive urban design: An investigation of current systems, implementation drivers, community perceptions and potential to supplement urban water services. Water (Switzerland) 2016, 8. [Google Scholar] [CrossRef]
- Li, C.; Peng, C.; Chiang, P.C.; Cai, Y.; Wang, X.; Yang, Z. Mechanisms and applications of green infrastructure practices for stormwater control: A review. 2019, 568, 626-637. [CrossRef]
- Byrne, J.; Green, M.; Dallas, S. WSUD Implementation in a Precinct Residential Development. Elsevier: 2018; pp. 541-559.
- Ahammed, F.; Rohita Sara, G.; Paul Kai, H.; Yan, L. Optimum numbering and sizing of infiltration-based water sensitive urban design technologies in South Australia. International Journal of Sustainable Engineering 2021, 14, 79–86. [Google Scholar] [CrossRef]
- Gurung, S.B.; Wasson, R.J.; Bird, M.; Jarihani, B. Water-Sensitive Urban Design (WSUD) Performance in Mitigating Urban Flooding in a Wet Tropical North Queensland Sub-Catchment. Hydrology 2025, 12, 151. [Google Scholar] [CrossRef]
- https://harc.com.au/software/rorb/. (accessed on 5/8).
- Laurenson, E.M.; Mein, R.G.; Nathan, R.J. User Manual of RORB Runoff Routing Program, Version 6 Department of Civil Engineering, Monash University, Australia: 2010.
- https://csse.com.au/index.php/products/storm-injector. (accessed on 8/8).
- https://www.dhigroup.com/technologies/mikepoweredbydhi/mikeplus. (accessed on 6/6).
- Ball, J.; Babister, M.; Retallick, M.; Weinmann, E. Australian Rainfall & Runoff Book 1: A Guide to Flood Estimation; 2019.
- https://data.arr-software.org/. (accessed on 12/08).
- http://www.bom.gov.au/water/designRainfalls/revised-ifd/?year=2016, c.t.d.l.-l.s.t.s.t.s.t.u.l. (accessed on 12/08).
- https://www.longpaddock.qld.gov.au/qld-future-climate/dashboard/#responseTab1. (accessed on 2023).
- IPCC. Glossary of Terms, 403–424.
- Xu, M.; Bravo de Guenni, L.; Córdova, J.R. Climate change impacts on rainfall intensity–duration–frequency curves in local scale catchments. Environmental Monitoring and Assessment 2024, 196. [Google Scholar] [CrossRef]
- Cœur, D.; Lang, M. Use of documentary sources on past flood events for flood risk management and land planning. 2008, 340, 644-650. [CrossRef]
- Wasko, C.; Nathan, R.; Peel, M.C. Changes in Antecedent Soil Moisture Modulate Flood Seasonality in a Changing Climate. Water Resources Research 2020, 56, no. [Google Scholar] [CrossRef]
- Martínez, C.; Vojinovic, Z.; Sanchez, A. Multi-Objective Model-Based Assessment of Green-Grey Infrastructures for Urban Flood Mitigation. Hydrology 2021, 8, 110–110. [Google Scholar] [CrossRef]
- Zhou, Q. A review of sustainable urban drainage systems considering the climate change and urbanization impacts. Water (Switzerland) 2014, 6, 976–992. [Google Scholar] [CrossRef]
- Goncalves, M.L.R.; Zischg, J.; Rau, S.; Sitzmann, M.; Rauch, W.; Kleidorfer, M. Modeling the effects of introducing low impact development in a tropical city: A case study from Joinville, Brazil. Sustainability (Switzerland) 2018, 10. [Google Scholar] [CrossRef]
- Pour, S.H.; Wahab, A.K.A.; Shahid, S.; Asaduzzaman, M.; Dewan, A. Low impact development techniques to mitigate the impacts of climate-change-induced urban floods: Current trends, issues and challenges. Sustainable Cities and Society 2020, 62, 102373–102373. [Google Scholar] [CrossRef]
- Sui, X.; van de Ven, F. Can the implementation of Low Impact Development reduce basin runoff? 2021. [CrossRef]
- Vojinovic, Z.; Alves, A.; Gómez, J.P.; Weesakul, S.; Keerakamolchai, W.; Meesuk, V.; Sanchez, A. Effectiveness of small- and large-scale Nature-Based Solutions for flood mitigation: The case of Ayutthaya, Thailand. Science of the Total Environment 2021, 789. [Google Scholar] [CrossRef]
- Palla, A.; Gnecco, I. Hydrologic modelling of Low Impact Development systems at the urban catchment scale. Journal of Hydrology 2015, 528, 361–368. [Google Scholar] [CrossRef]
- Castiglia Feitosa, R.; Wilkinson, S. Modelling green roof stormwater response for different soil depths. Landscape and Urban Planning 2016, 153, 170–179. [Google Scholar] [CrossRef]
- (https://geoscience.data.qld.gov.au/data/map-collection/mr002086). (: Available online.
- https://www.hobodataloggers.com.au/. (accessed on 15/05).
Figure 1.
Boundary of Engineers Park in the Saltwater Creek catchment in Cairns City, digital elevation model for Engineers Park, Cairns Regional Council (CRC), Queensland, Australia, with key features highlighted.
Figure 1.
Boundary of Engineers Park in the Saltwater Creek catchment in Cairns City, digital elevation model for Engineers Park, Cairns Regional Council (CRC), Queensland, Australia, with key features highlighted.
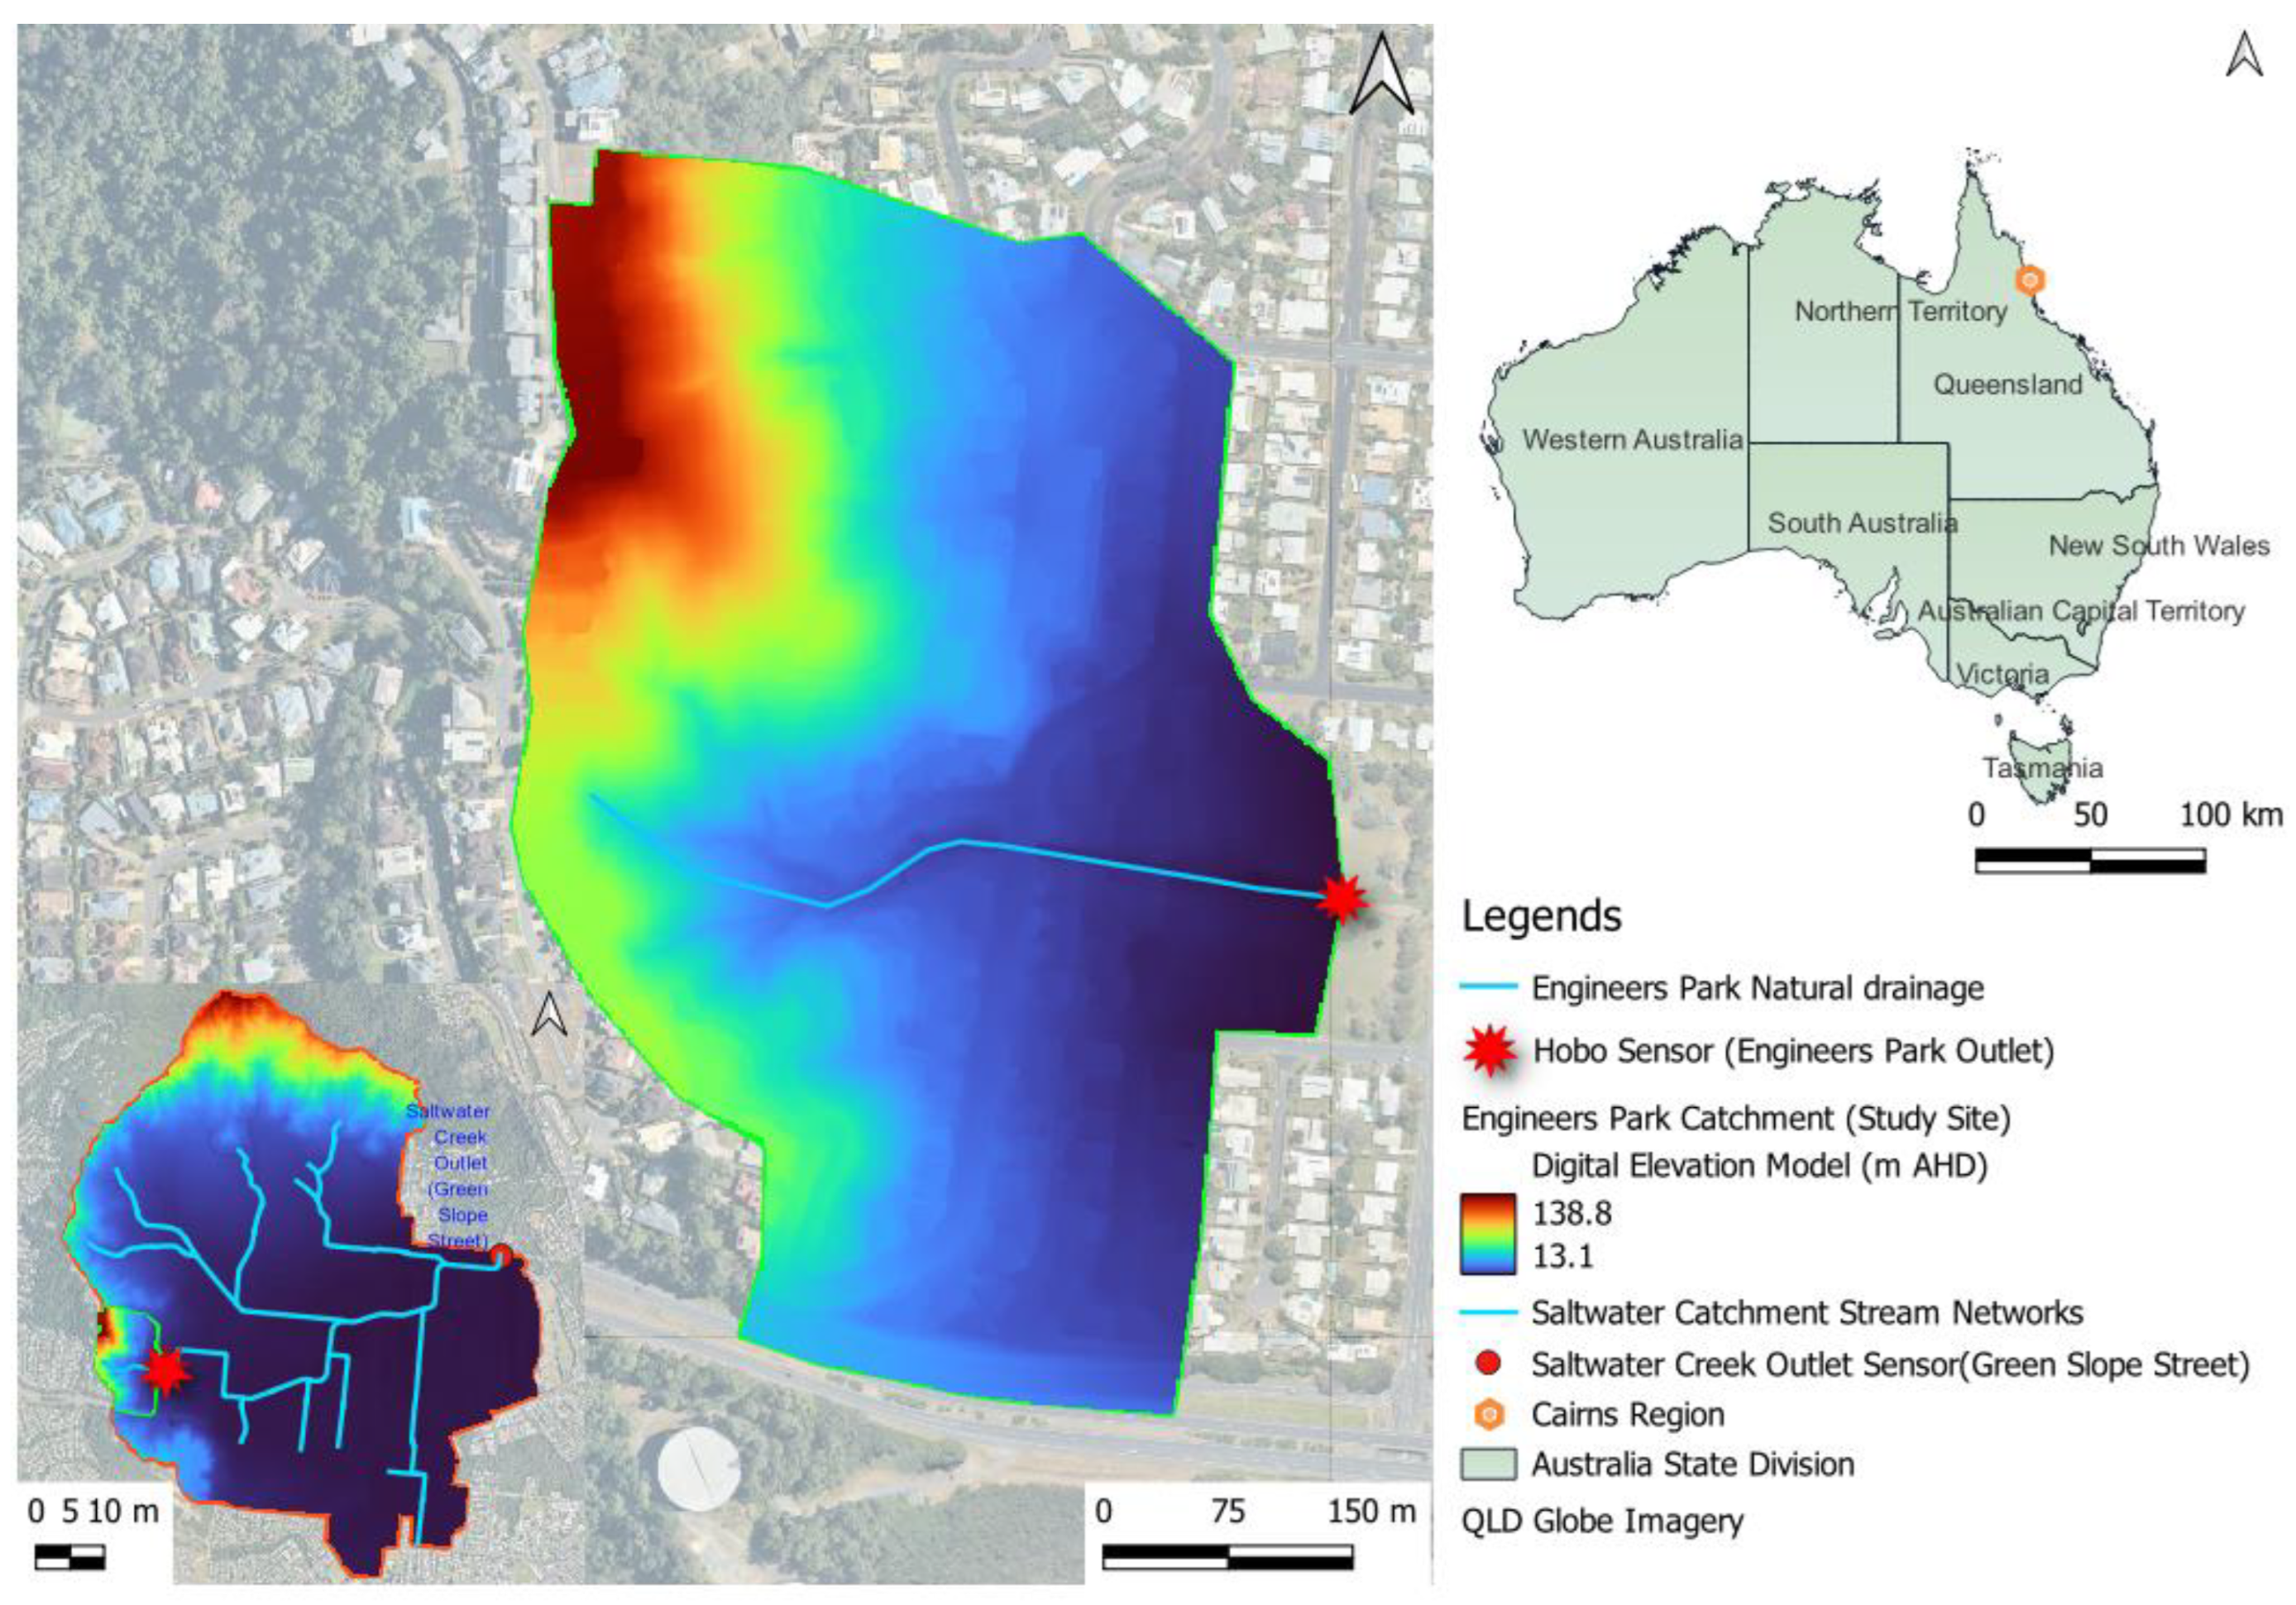
Figure 2.
Flood modelling approach with flowchart steps.
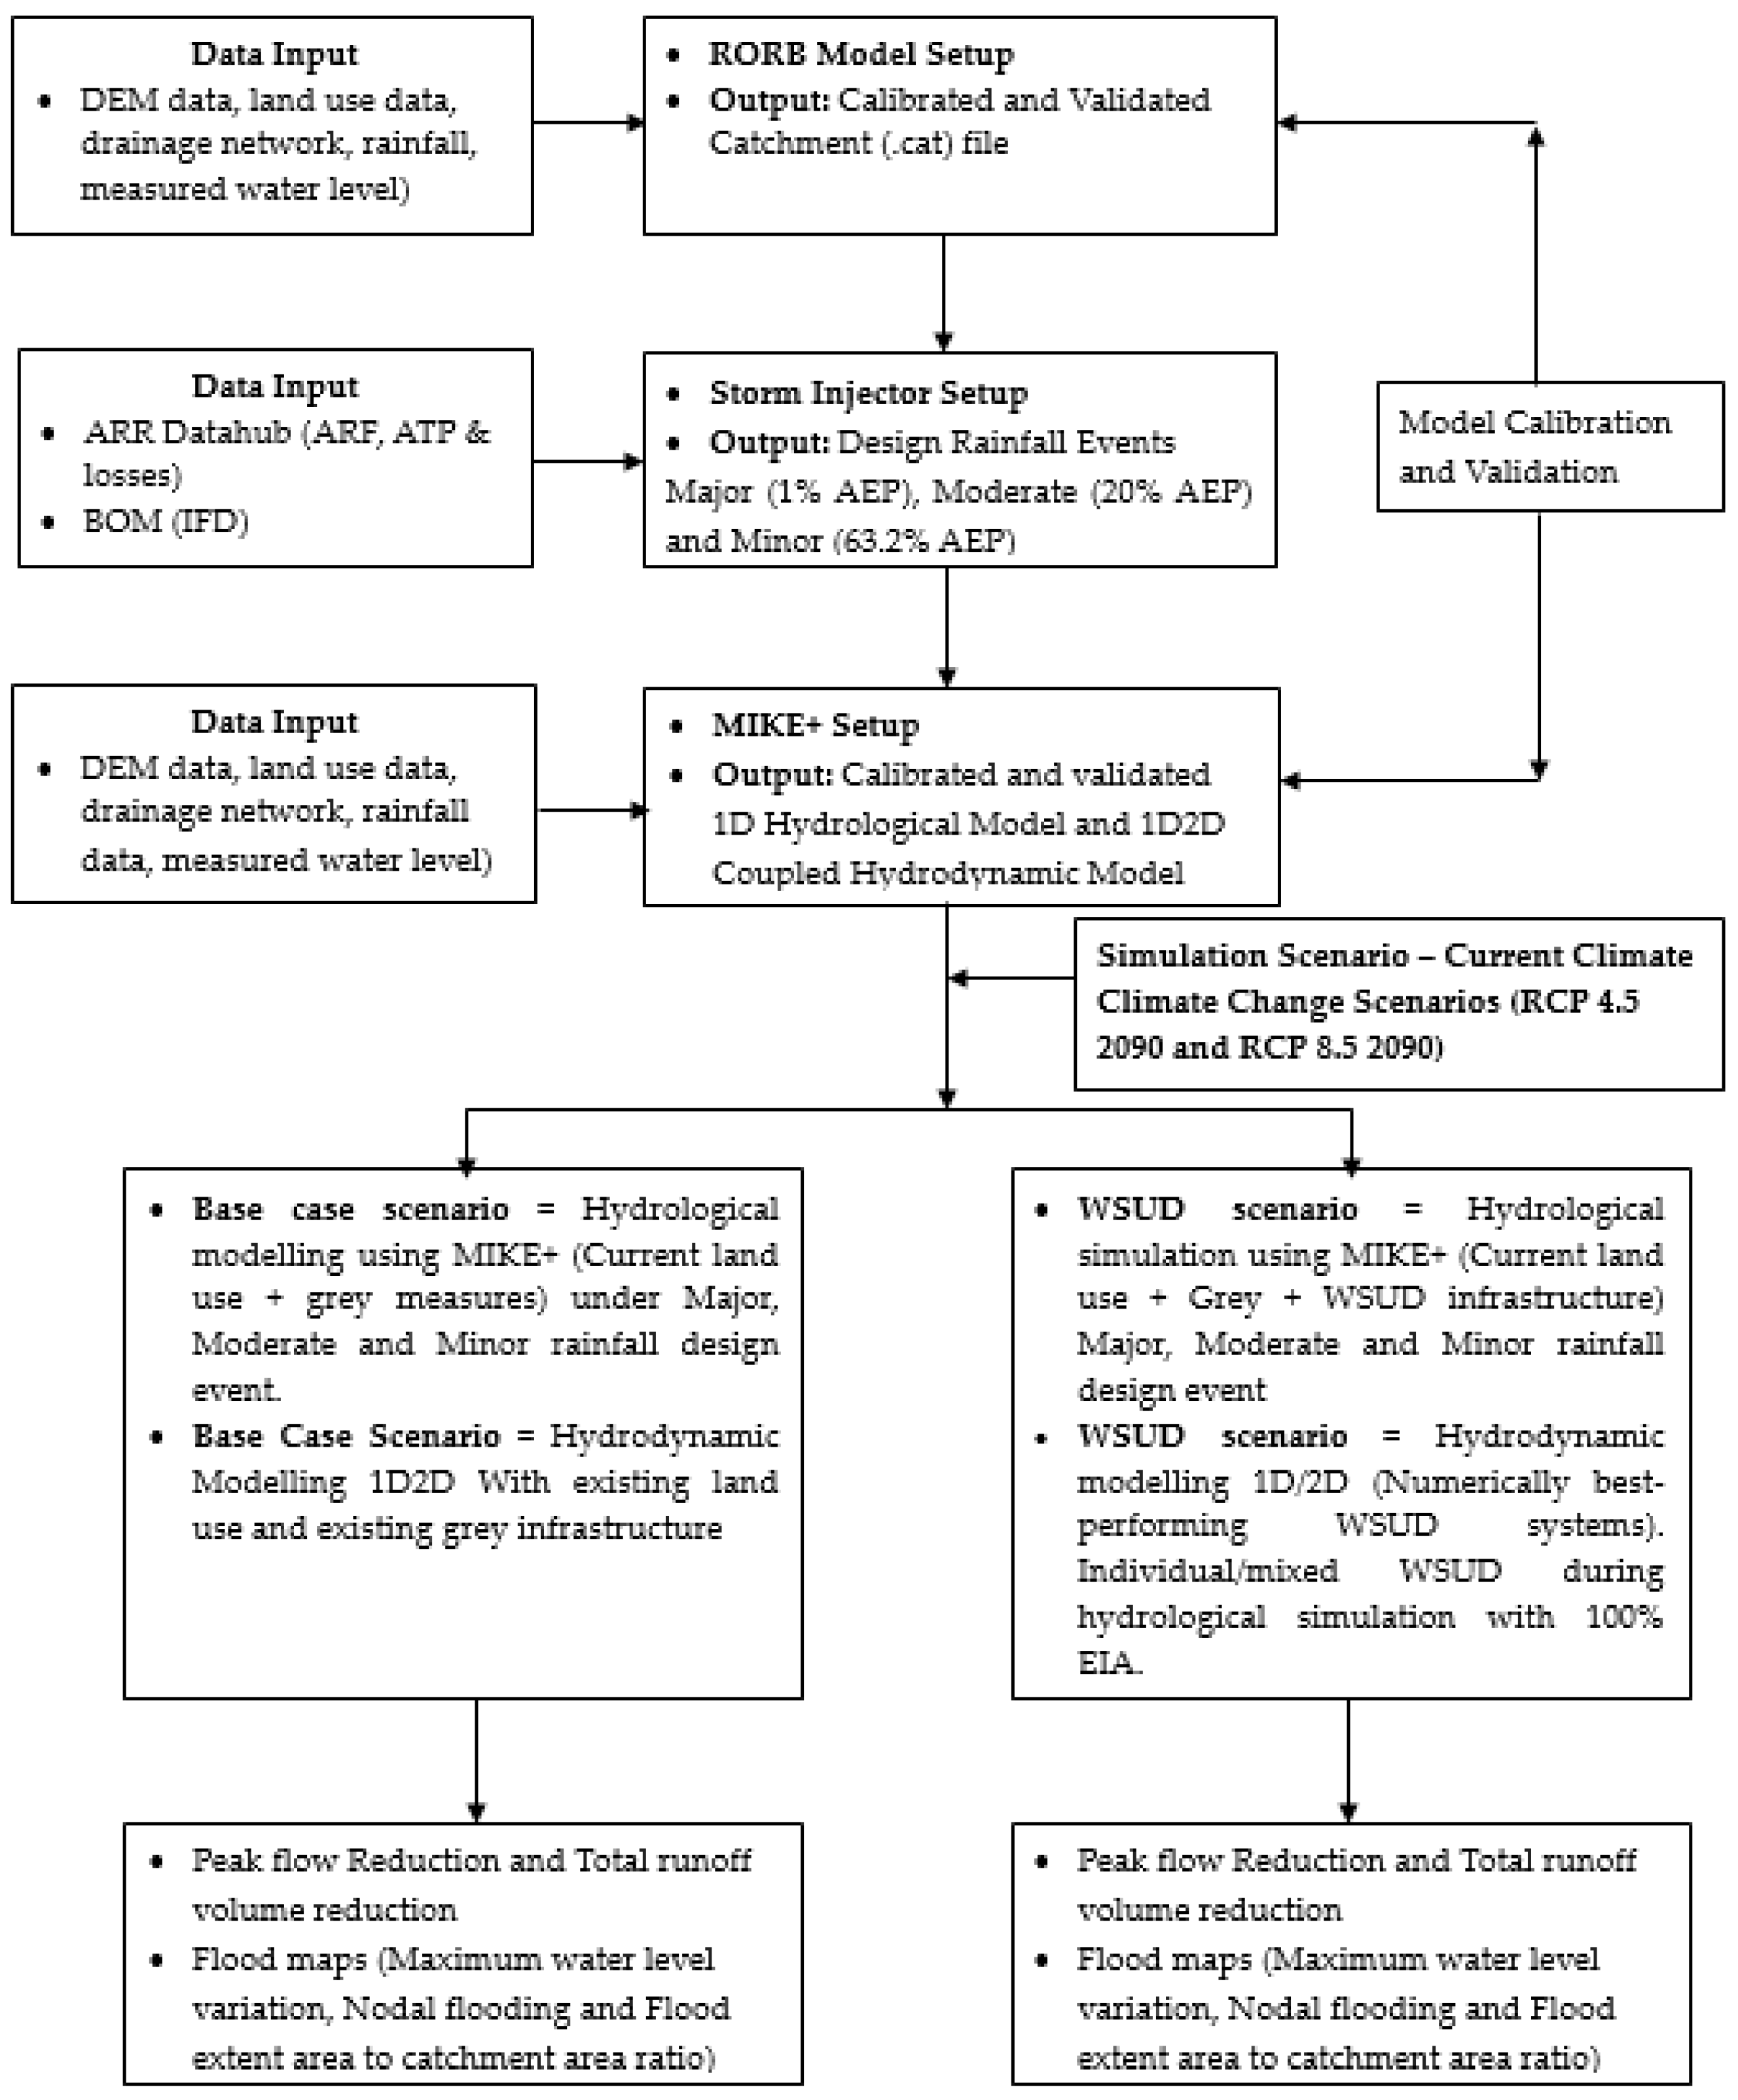
Figure 3.
Peak flow Reduction with individual WSUD performance under (a) Major event_CC, (b) Major event_RCP 4.5 in 2090, (c) Major_RCP 8.5 in 2090, (d) Moderate_CC, (e) Moderate_RCP 4.5 in 2090, (f) Moderate_RCP 8.5 in 2090, (g) Minor_CC, (h) Minor_RCP 4.5 in 2090 and (i) Minor_RCP 8.5 in 2090.
Figure 3.
Peak flow Reduction with individual WSUD performance under (a) Major event_CC, (b) Major event_RCP 4.5 in 2090, (c) Major_RCP 8.5 in 2090, (d) Moderate_CC, (e) Moderate_RCP 4.5 in 2090, (f) Moderate_RCP 8.5 in 2090, (g) Minor_CC, (h) Minor_RCP 4.5 in 2090 and (i) Minor_RCP 8.5 in 2090.
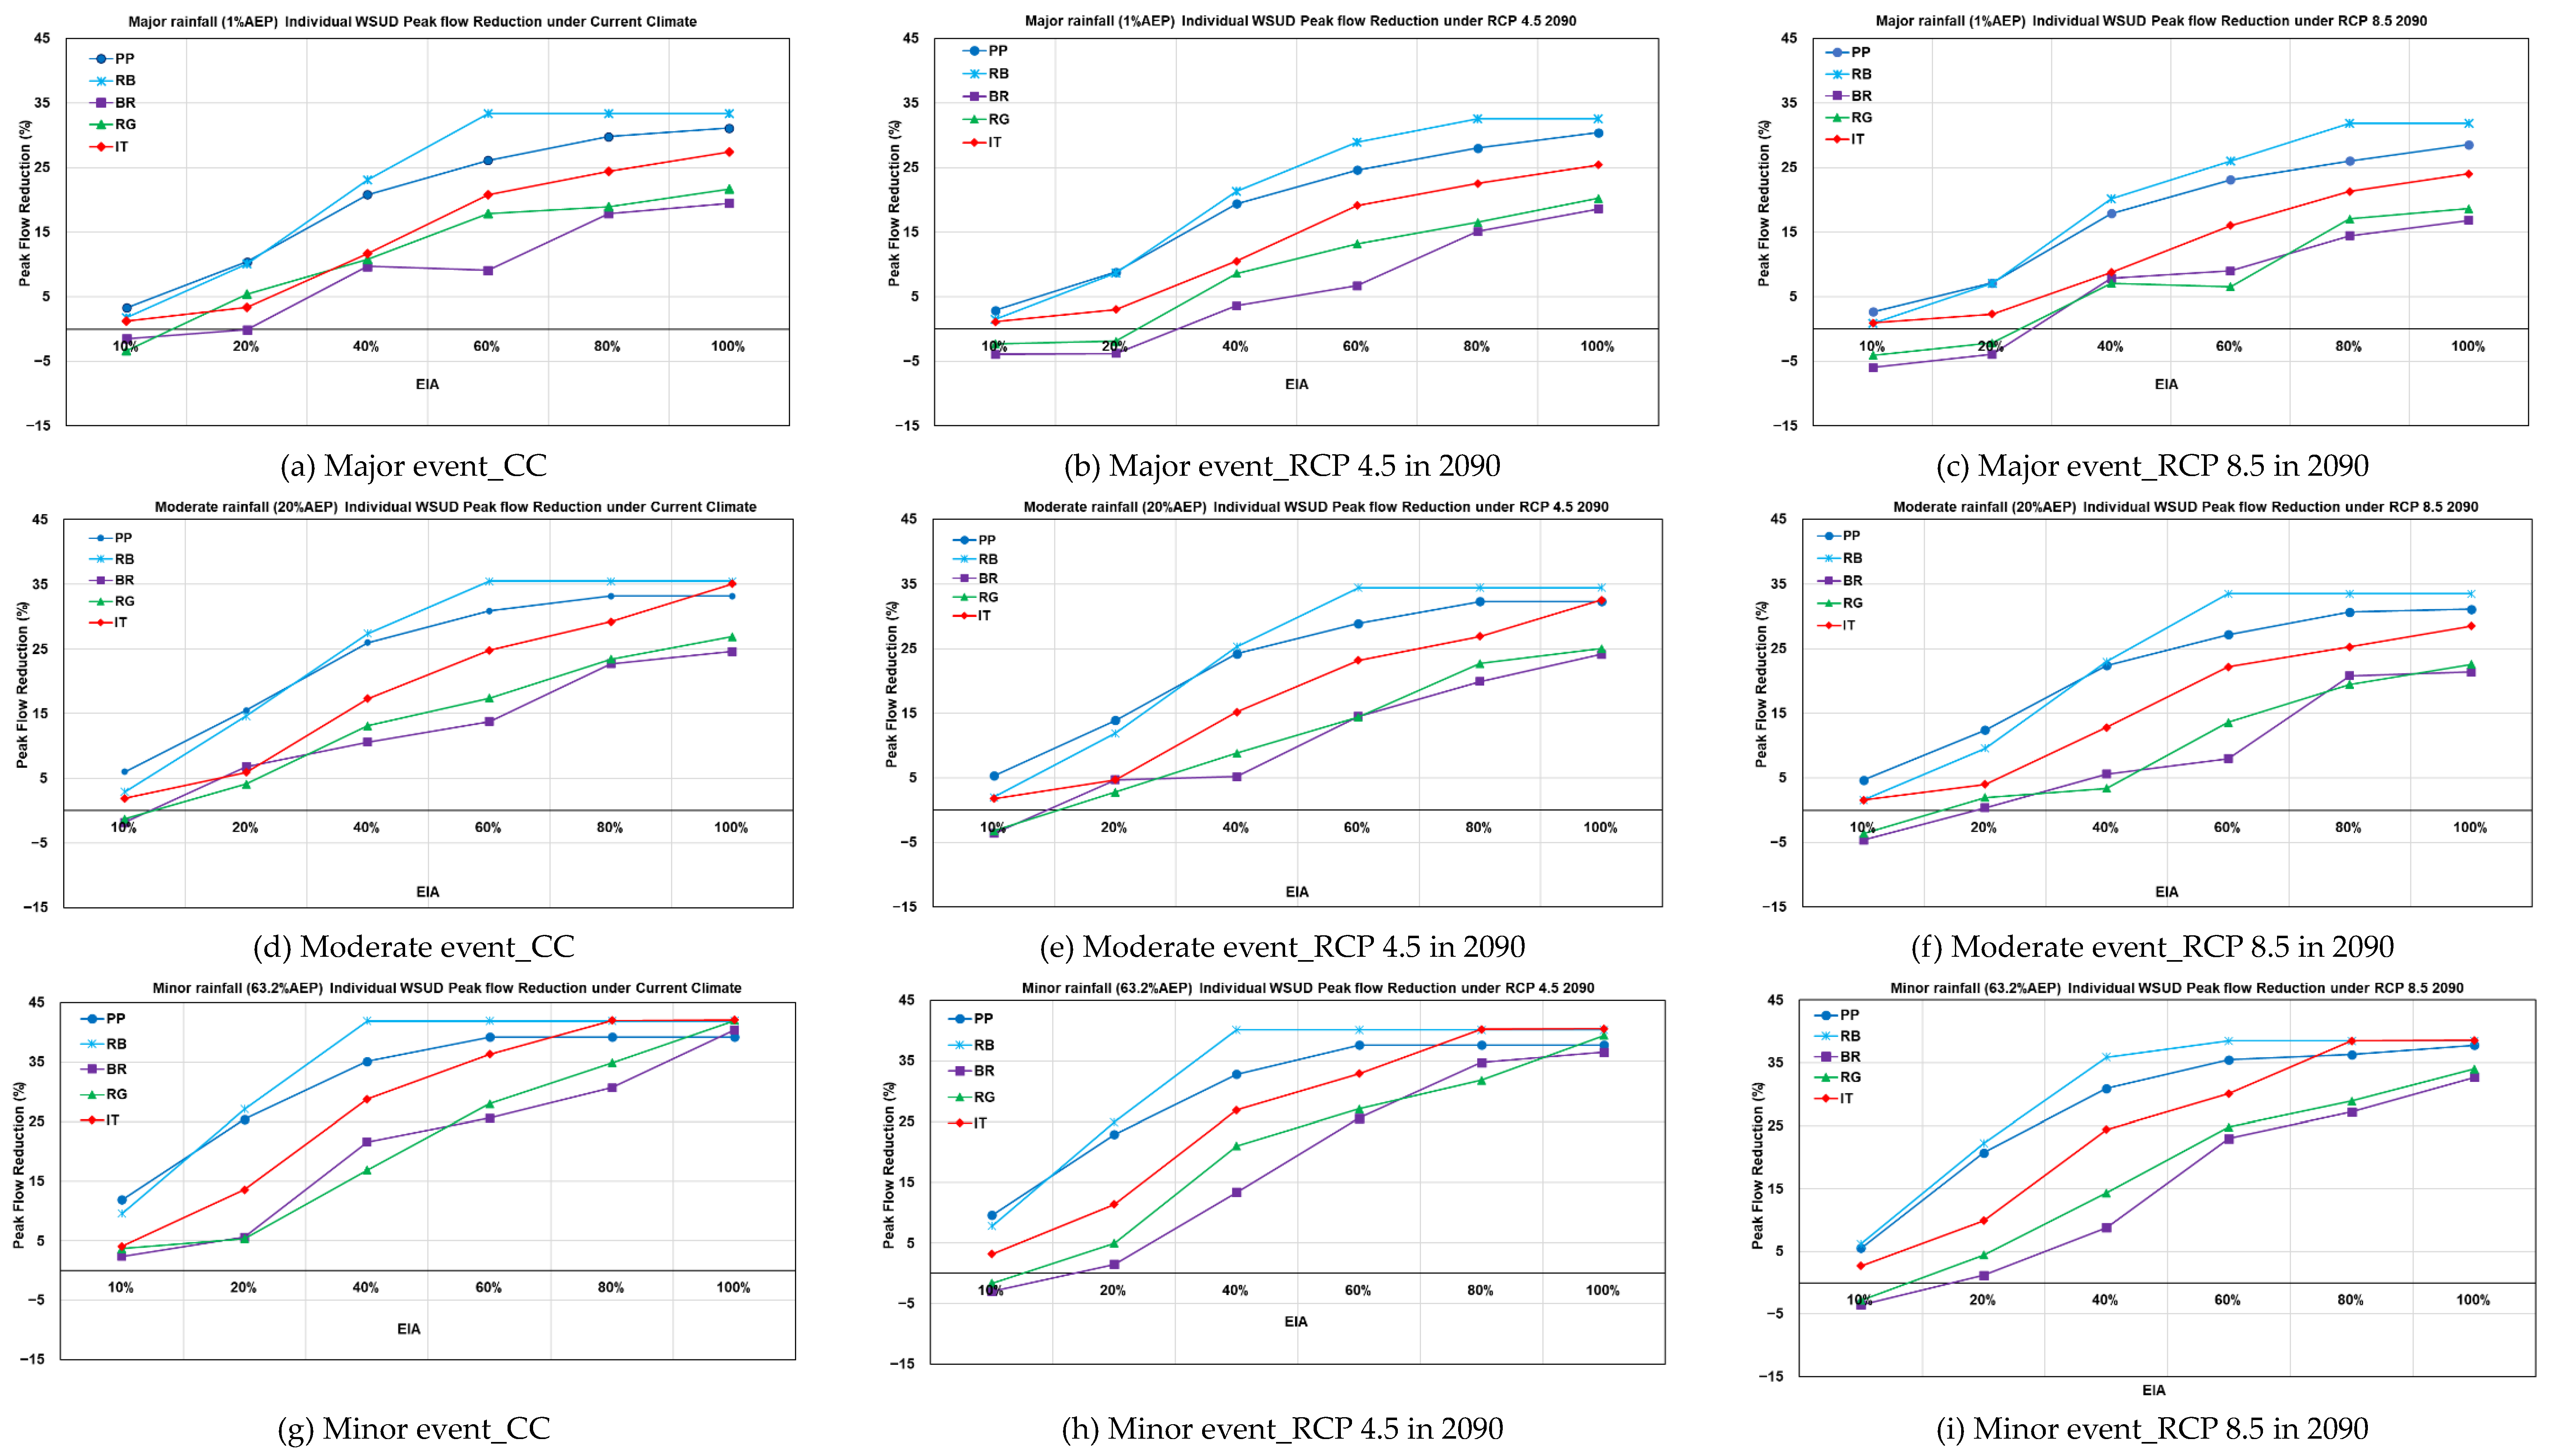
Figure 4.
Total runoff volume reduction with individual WSUD performance under (a) Major event_CC, (b) Major event_RCP 4.5 in 2090, (c) Major event_RCP 8.5 in 2090, (d) Moderate_CC, (e) Moderate_RCP 4.5 in 2090, (f) Moderate_RCP 8.5 in 2090, (g) Minor_CC, (h) Minor_RCP 4.5 in 2090 and (i) Minor_RCP 8.5 in 2090.
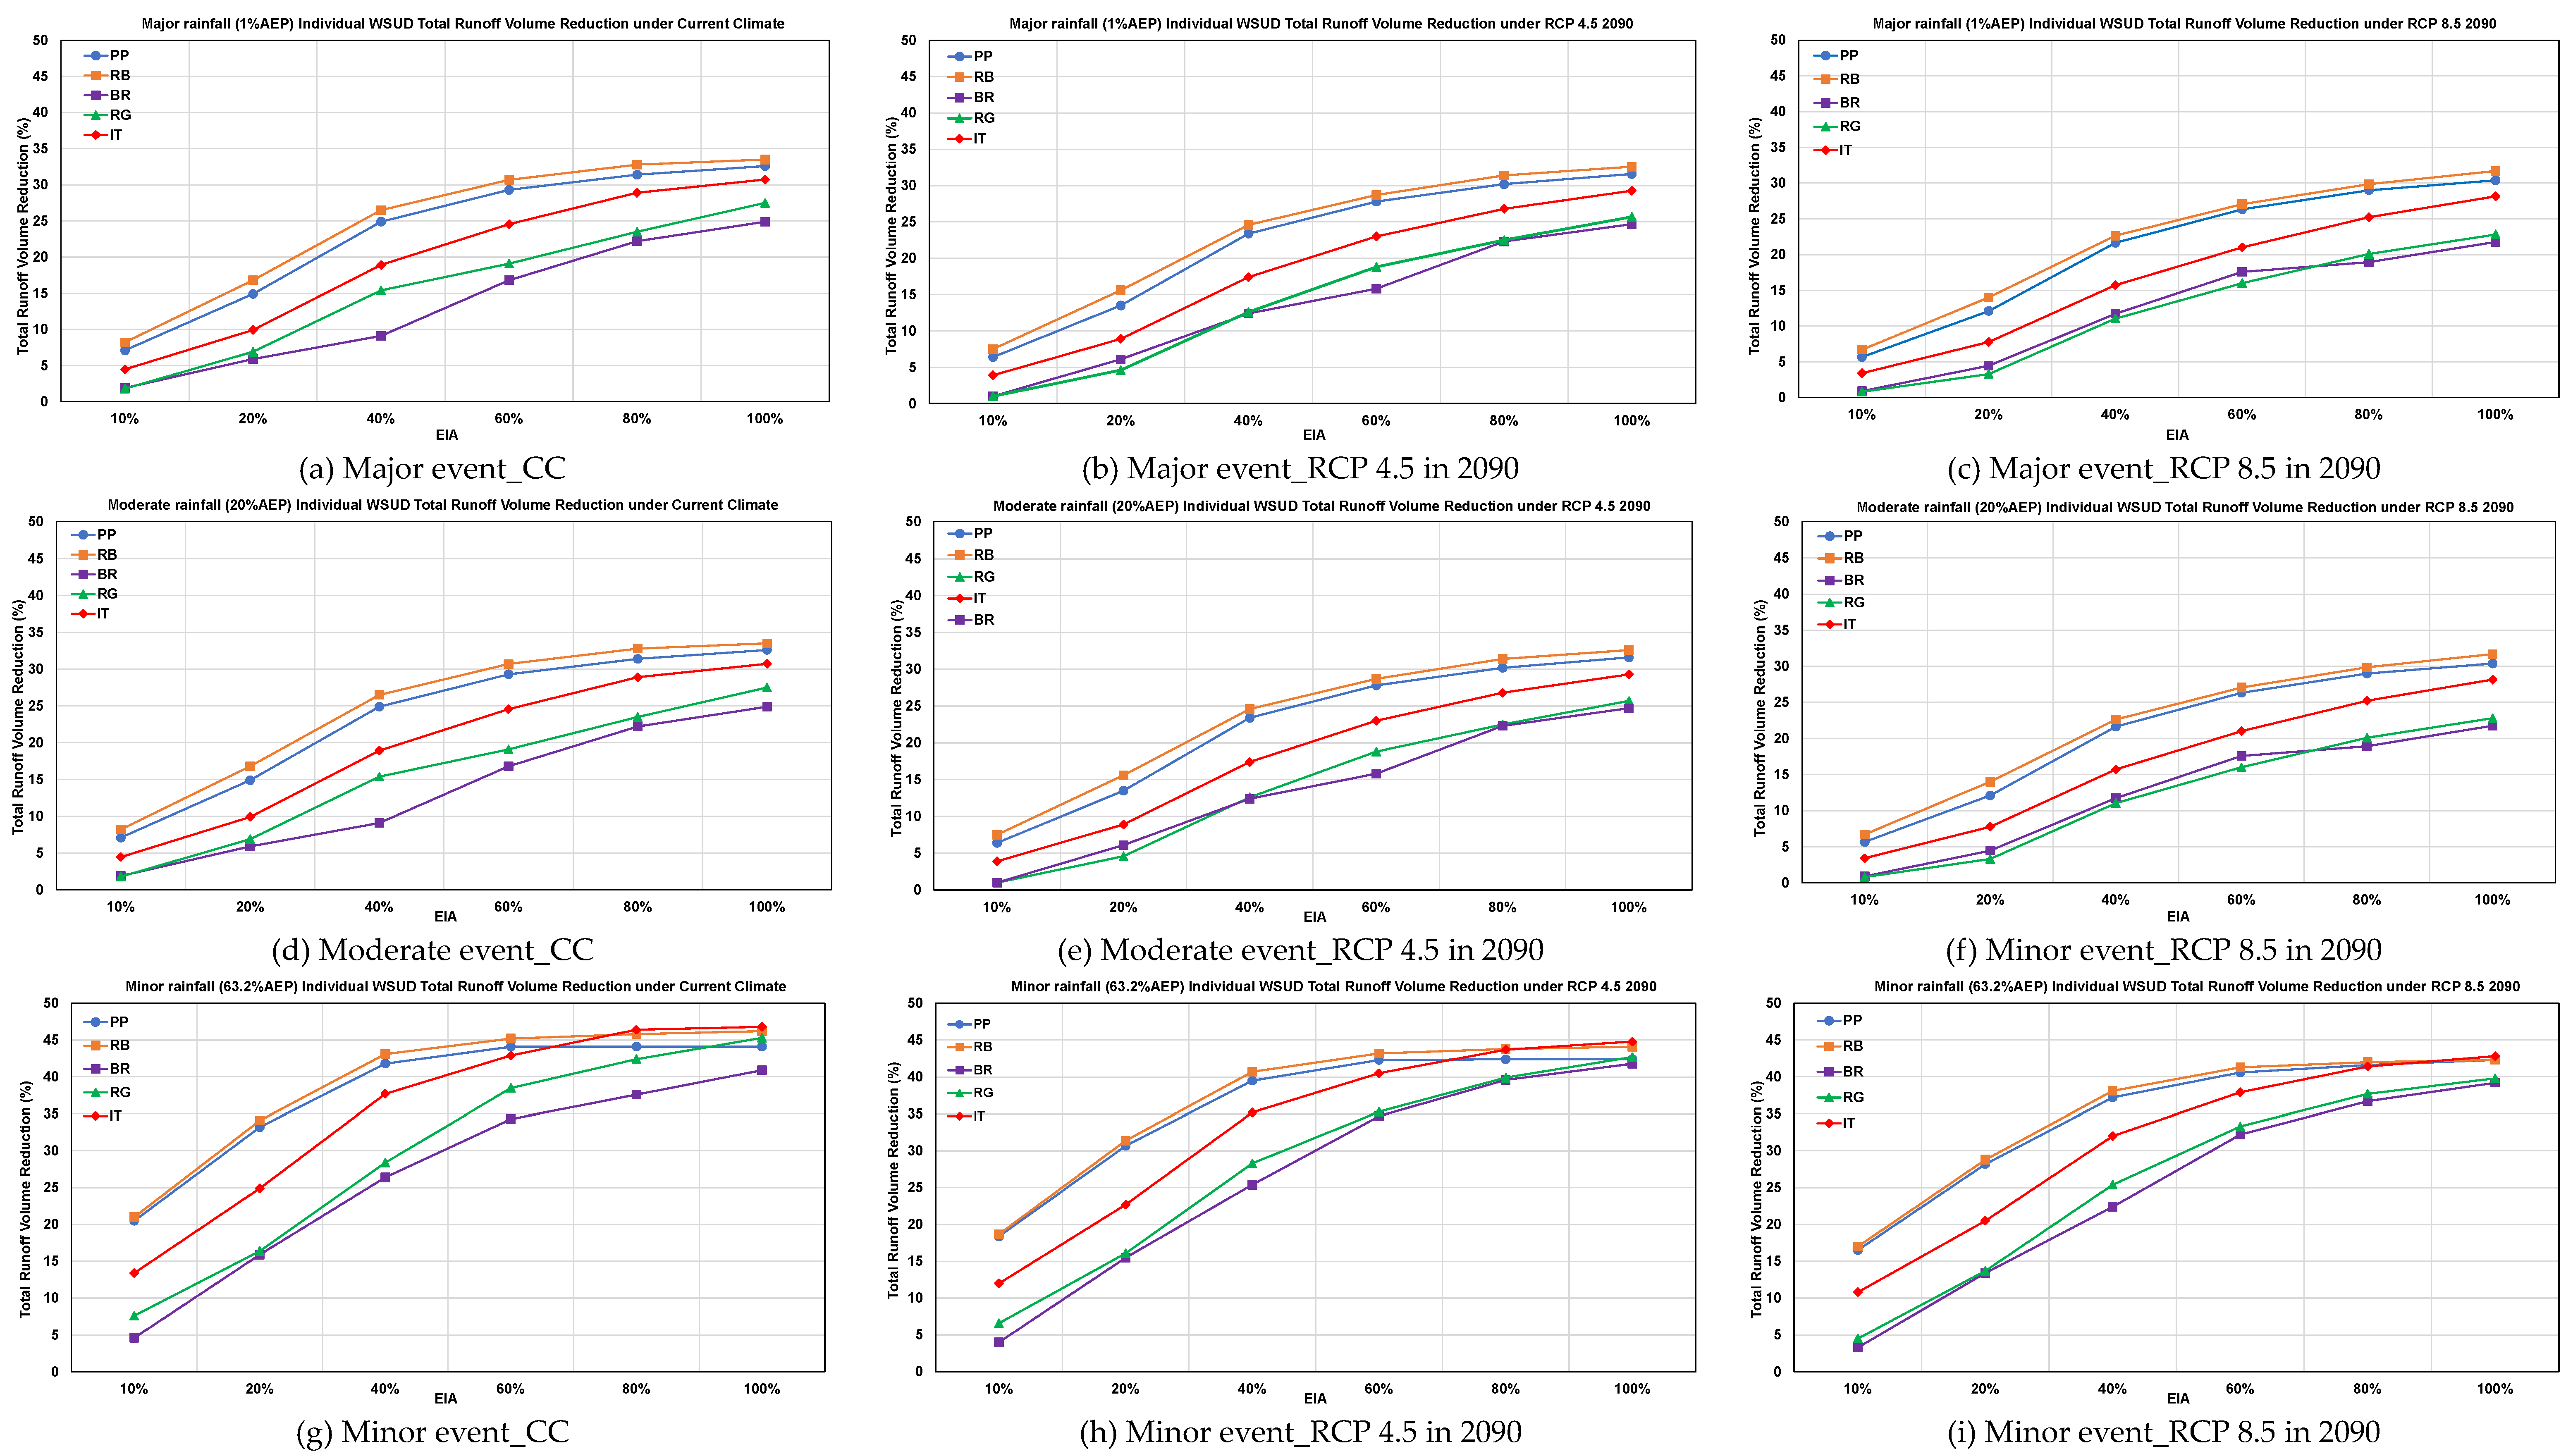
Figure 5.
Peak flow reduction with mixed WSUD performance under (a) Major event_CC, (b) Major event_RCP 4.5 in 2090, (c) Major_RCP 8.5 in 2090, (d) Moderate_CC, (e) Moderate_RCP 4.5 in 2090, (f) Moderate_RCP 8.5 in 2090, (g) Minor_CC, (h) Minor_RCP 4.5 in 2090 and (i) Minor_RCP 8.5 in 2090.
Figure 5.
Peak flow reduction with mixed WSUD performance under (a) Major event_CC, (b) Major event_RCP 4.5 in 2090, (c) Major_RCP 8.5 in 2090, (d) Moderate_CC, (e) Moderate_RCP 4.5 in 2090, (f) Moderate_RCP 8.5 in 2090, (g) Minor_CC, (h) Minor_RCP 4.5 in 2090 and (i) Minor_RCP 8.5 in 2090.
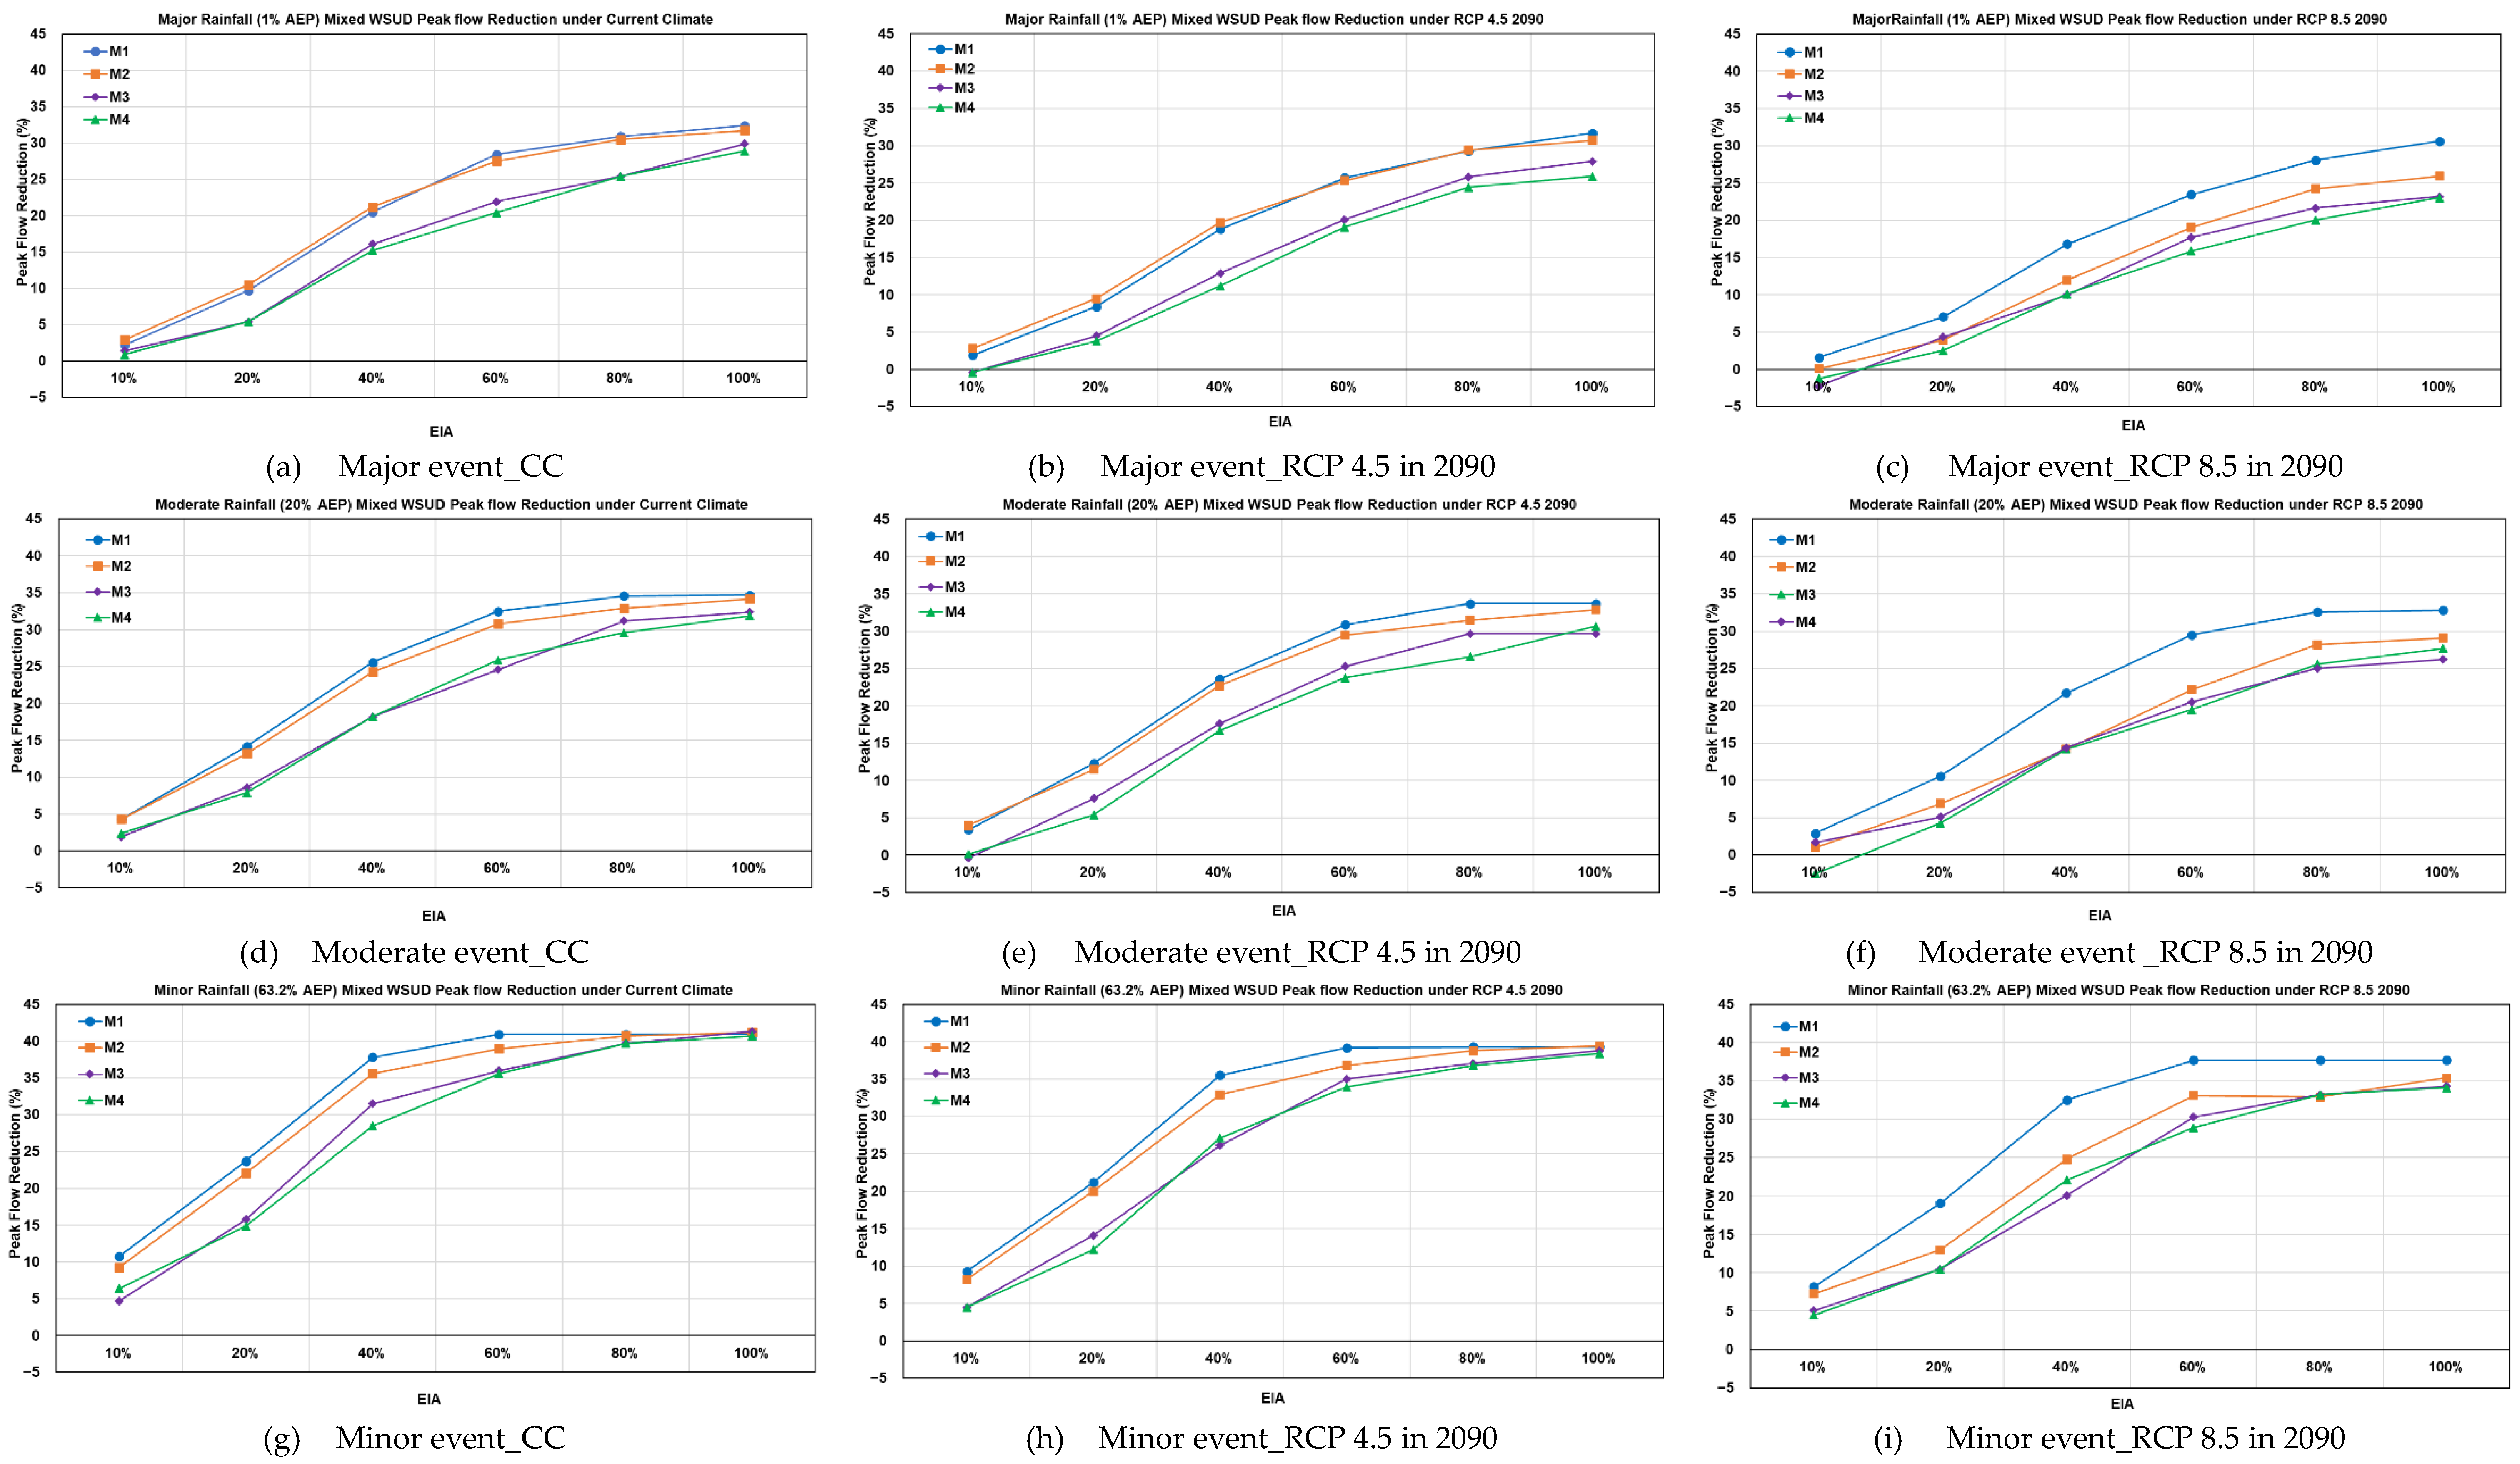
Figure 6.
Total runoff volume reduction with mixed WSUD performance under (a) Major event_CC, (b) Major event_RCP 4.5 in 2090, (c) Major event_RCP 8.5 in 2090, (d) Moderate_CC, (e) Moderate_RCP 4.5 in 2090, (f) Moderate_RCP 8.5 in 2090, (g) Minor_CC, (h) Minor_RCP 4.5 in 2090 and (i) Minor_RCP 8.5 in 2090.
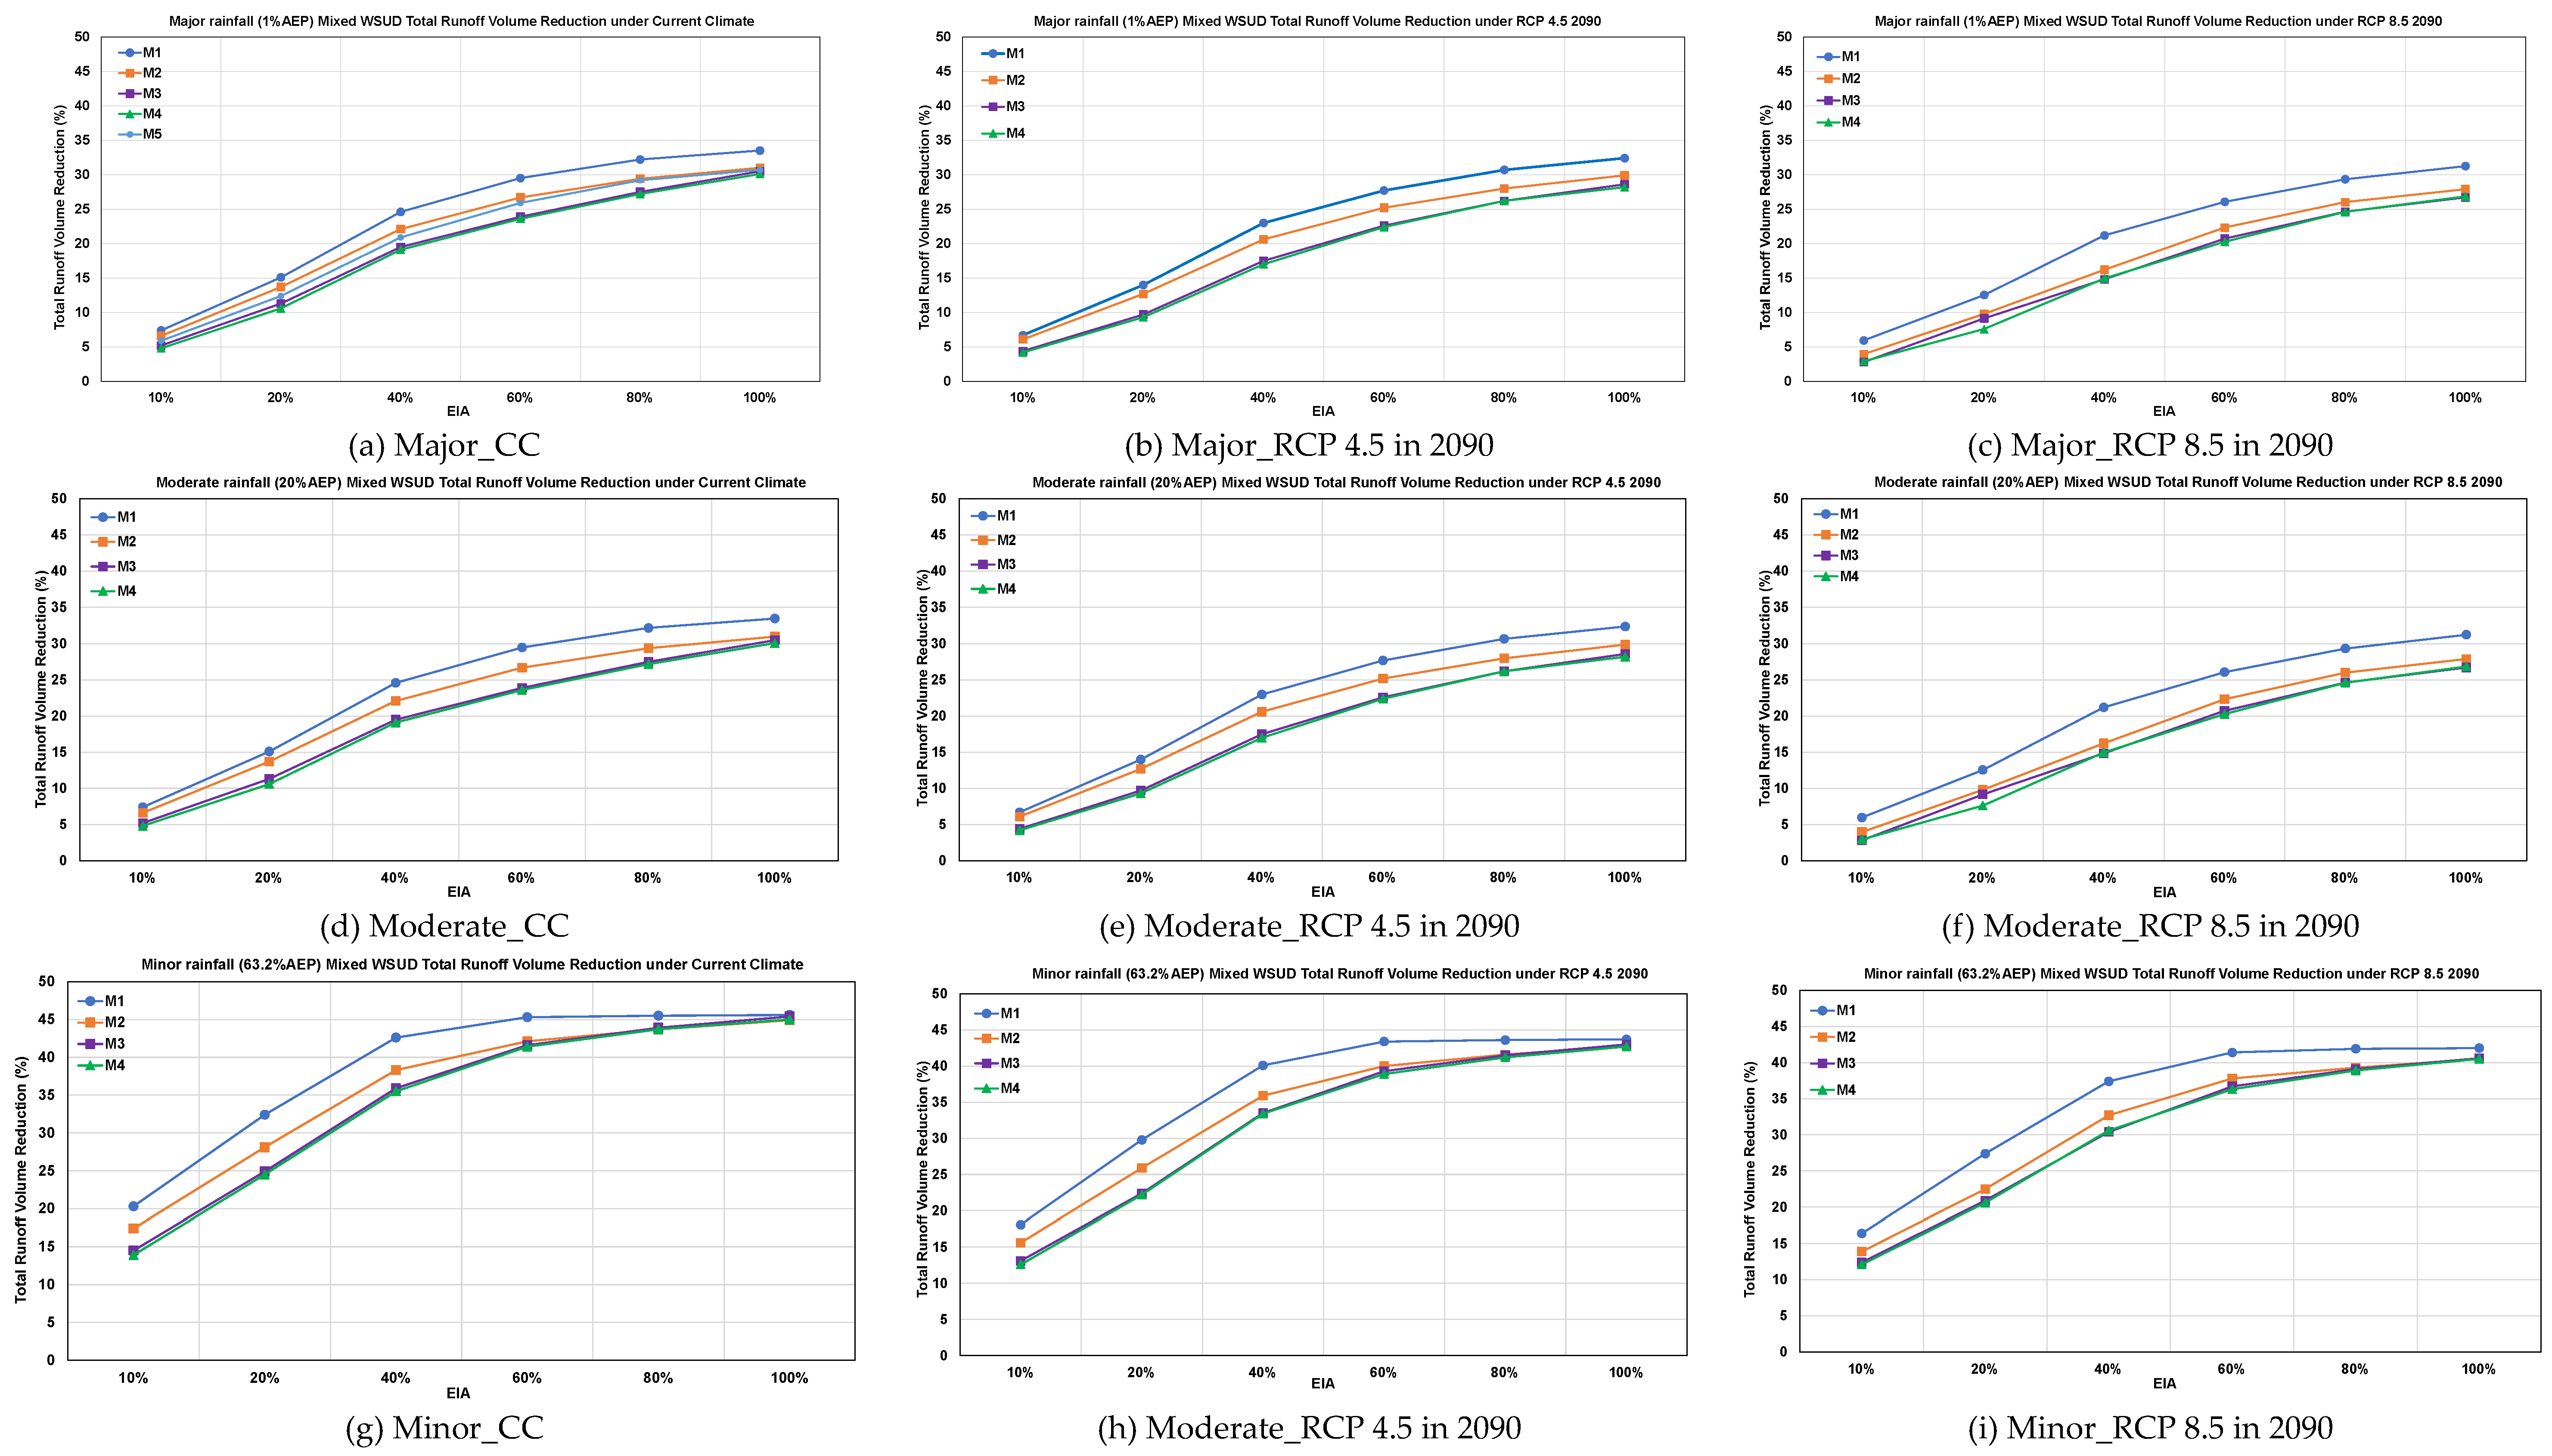
Figure 8.
Engineers’ Park maximum velocity variation under CC, RCP 4.5 in 2090, RCP 8.5 in 2090 with grey and best WSUD (rain barrel & M1) with 100% effective impervious area.
Figure 8.
Engineers’ Park maximum velocity variation under CC, RCP 4.5 in 2090, RCP 8.5 in 2090 with grey and best WSUD (rain barrel & M1) with 100% effective impervious area.
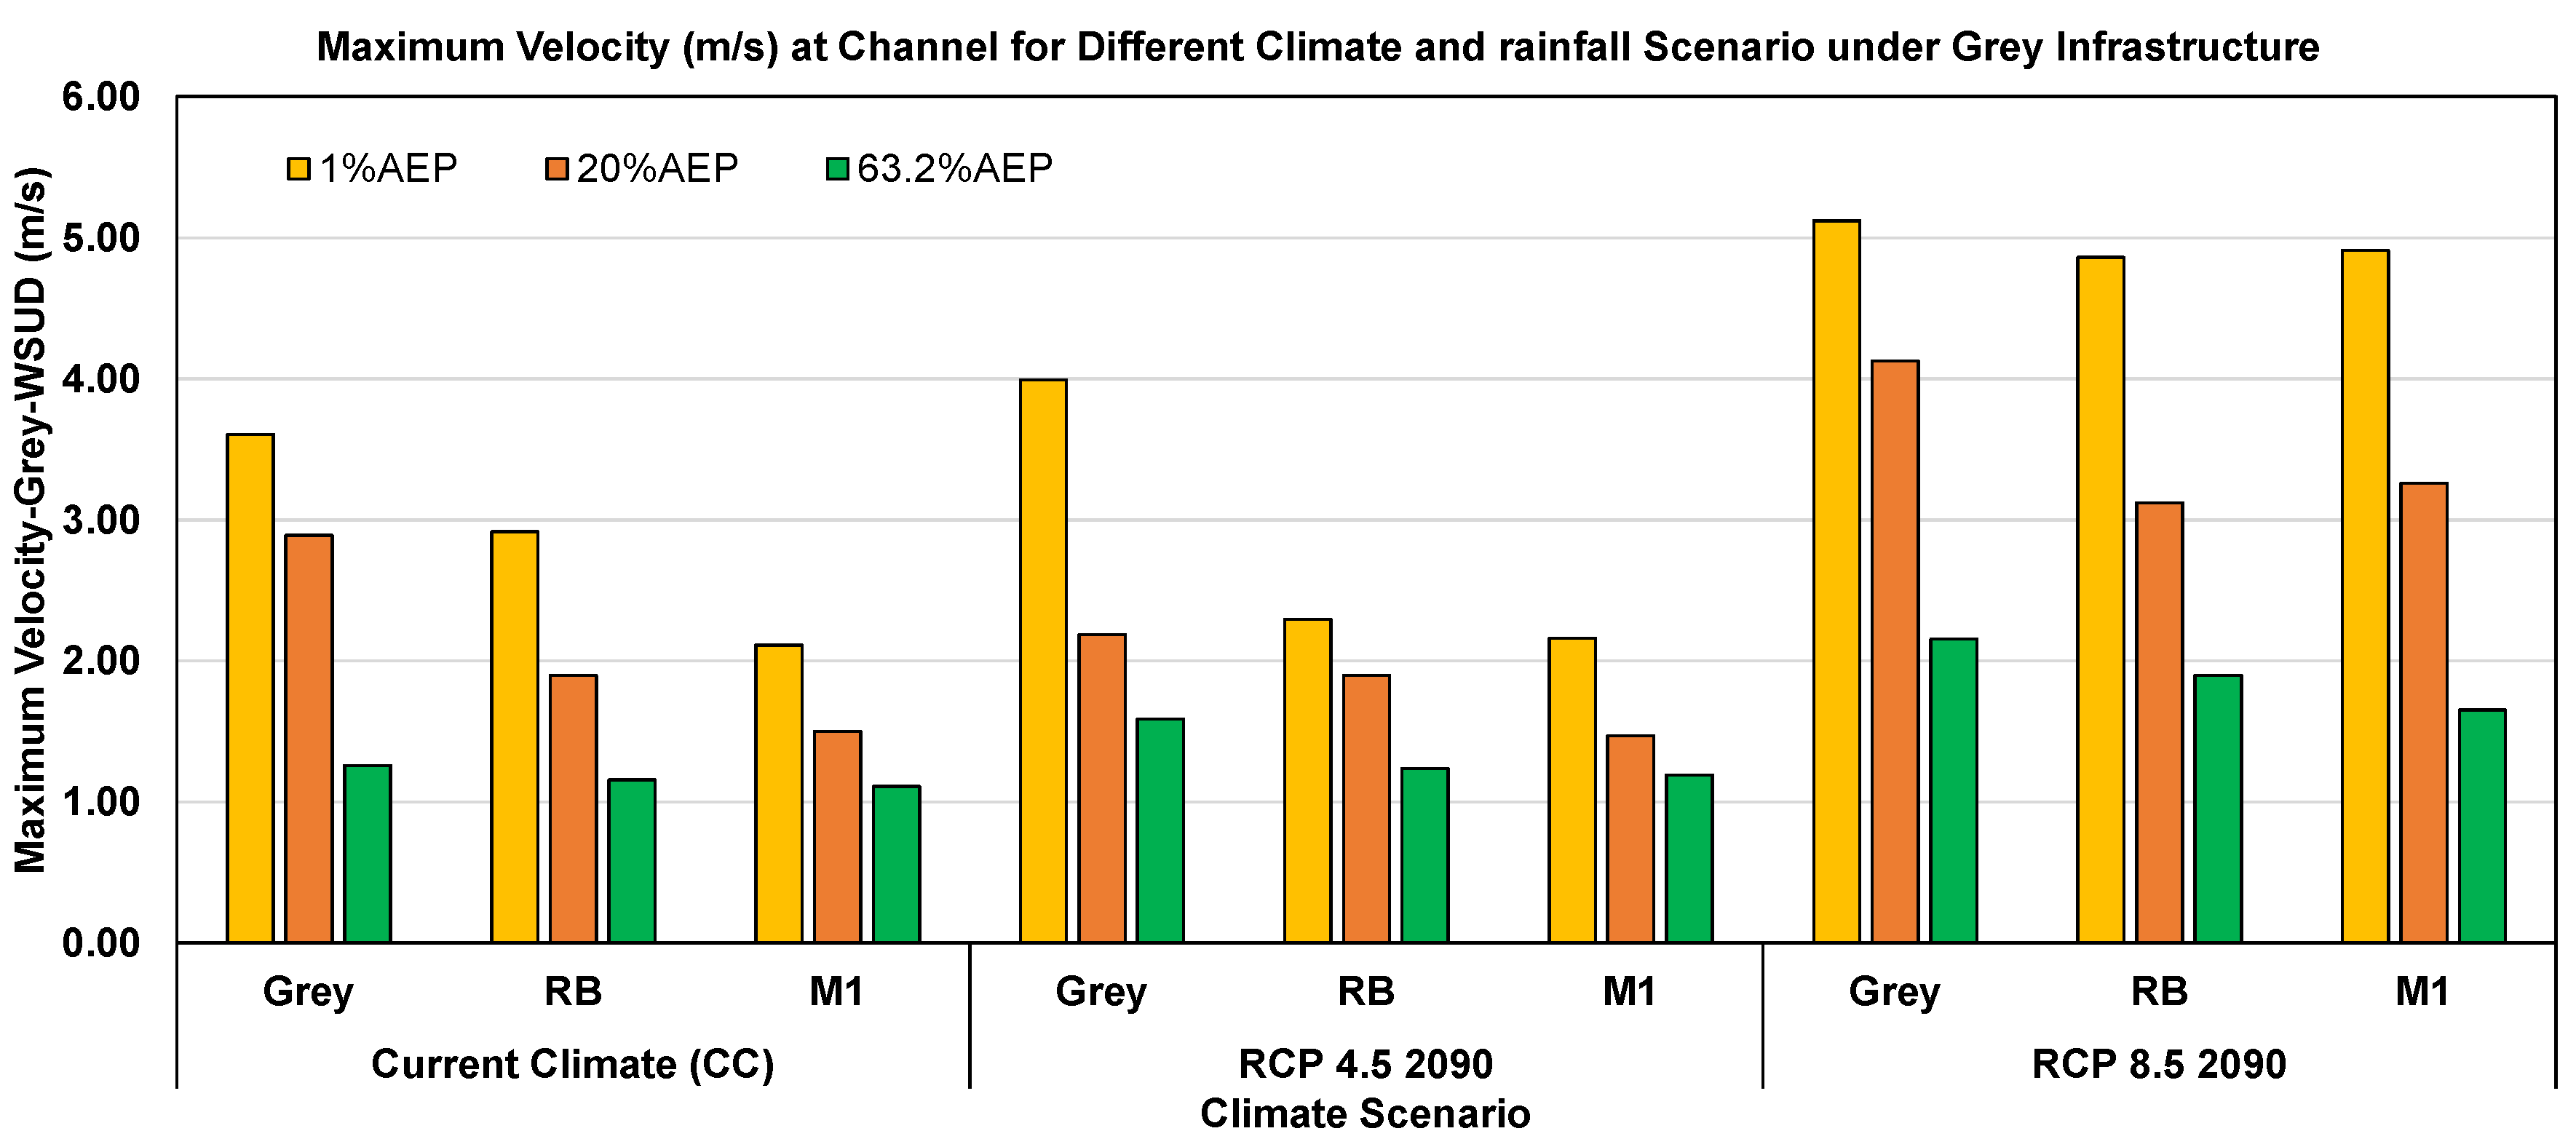
Figure 9.
Engineers Park nodal flooding under CC, RCP 4.5 in 2090, and RCP 8.5 in 2090 with grey and best WSUD (rain barrel & M1) with 100% effective impervious area.
Figure 9.
Engineers Park nodal flooding under CC, RCP 4.5 in 2090, and RCP 8.5 in 2090 with grey and best WSUD (rain barrel & M1) with 100% effective impervious area.
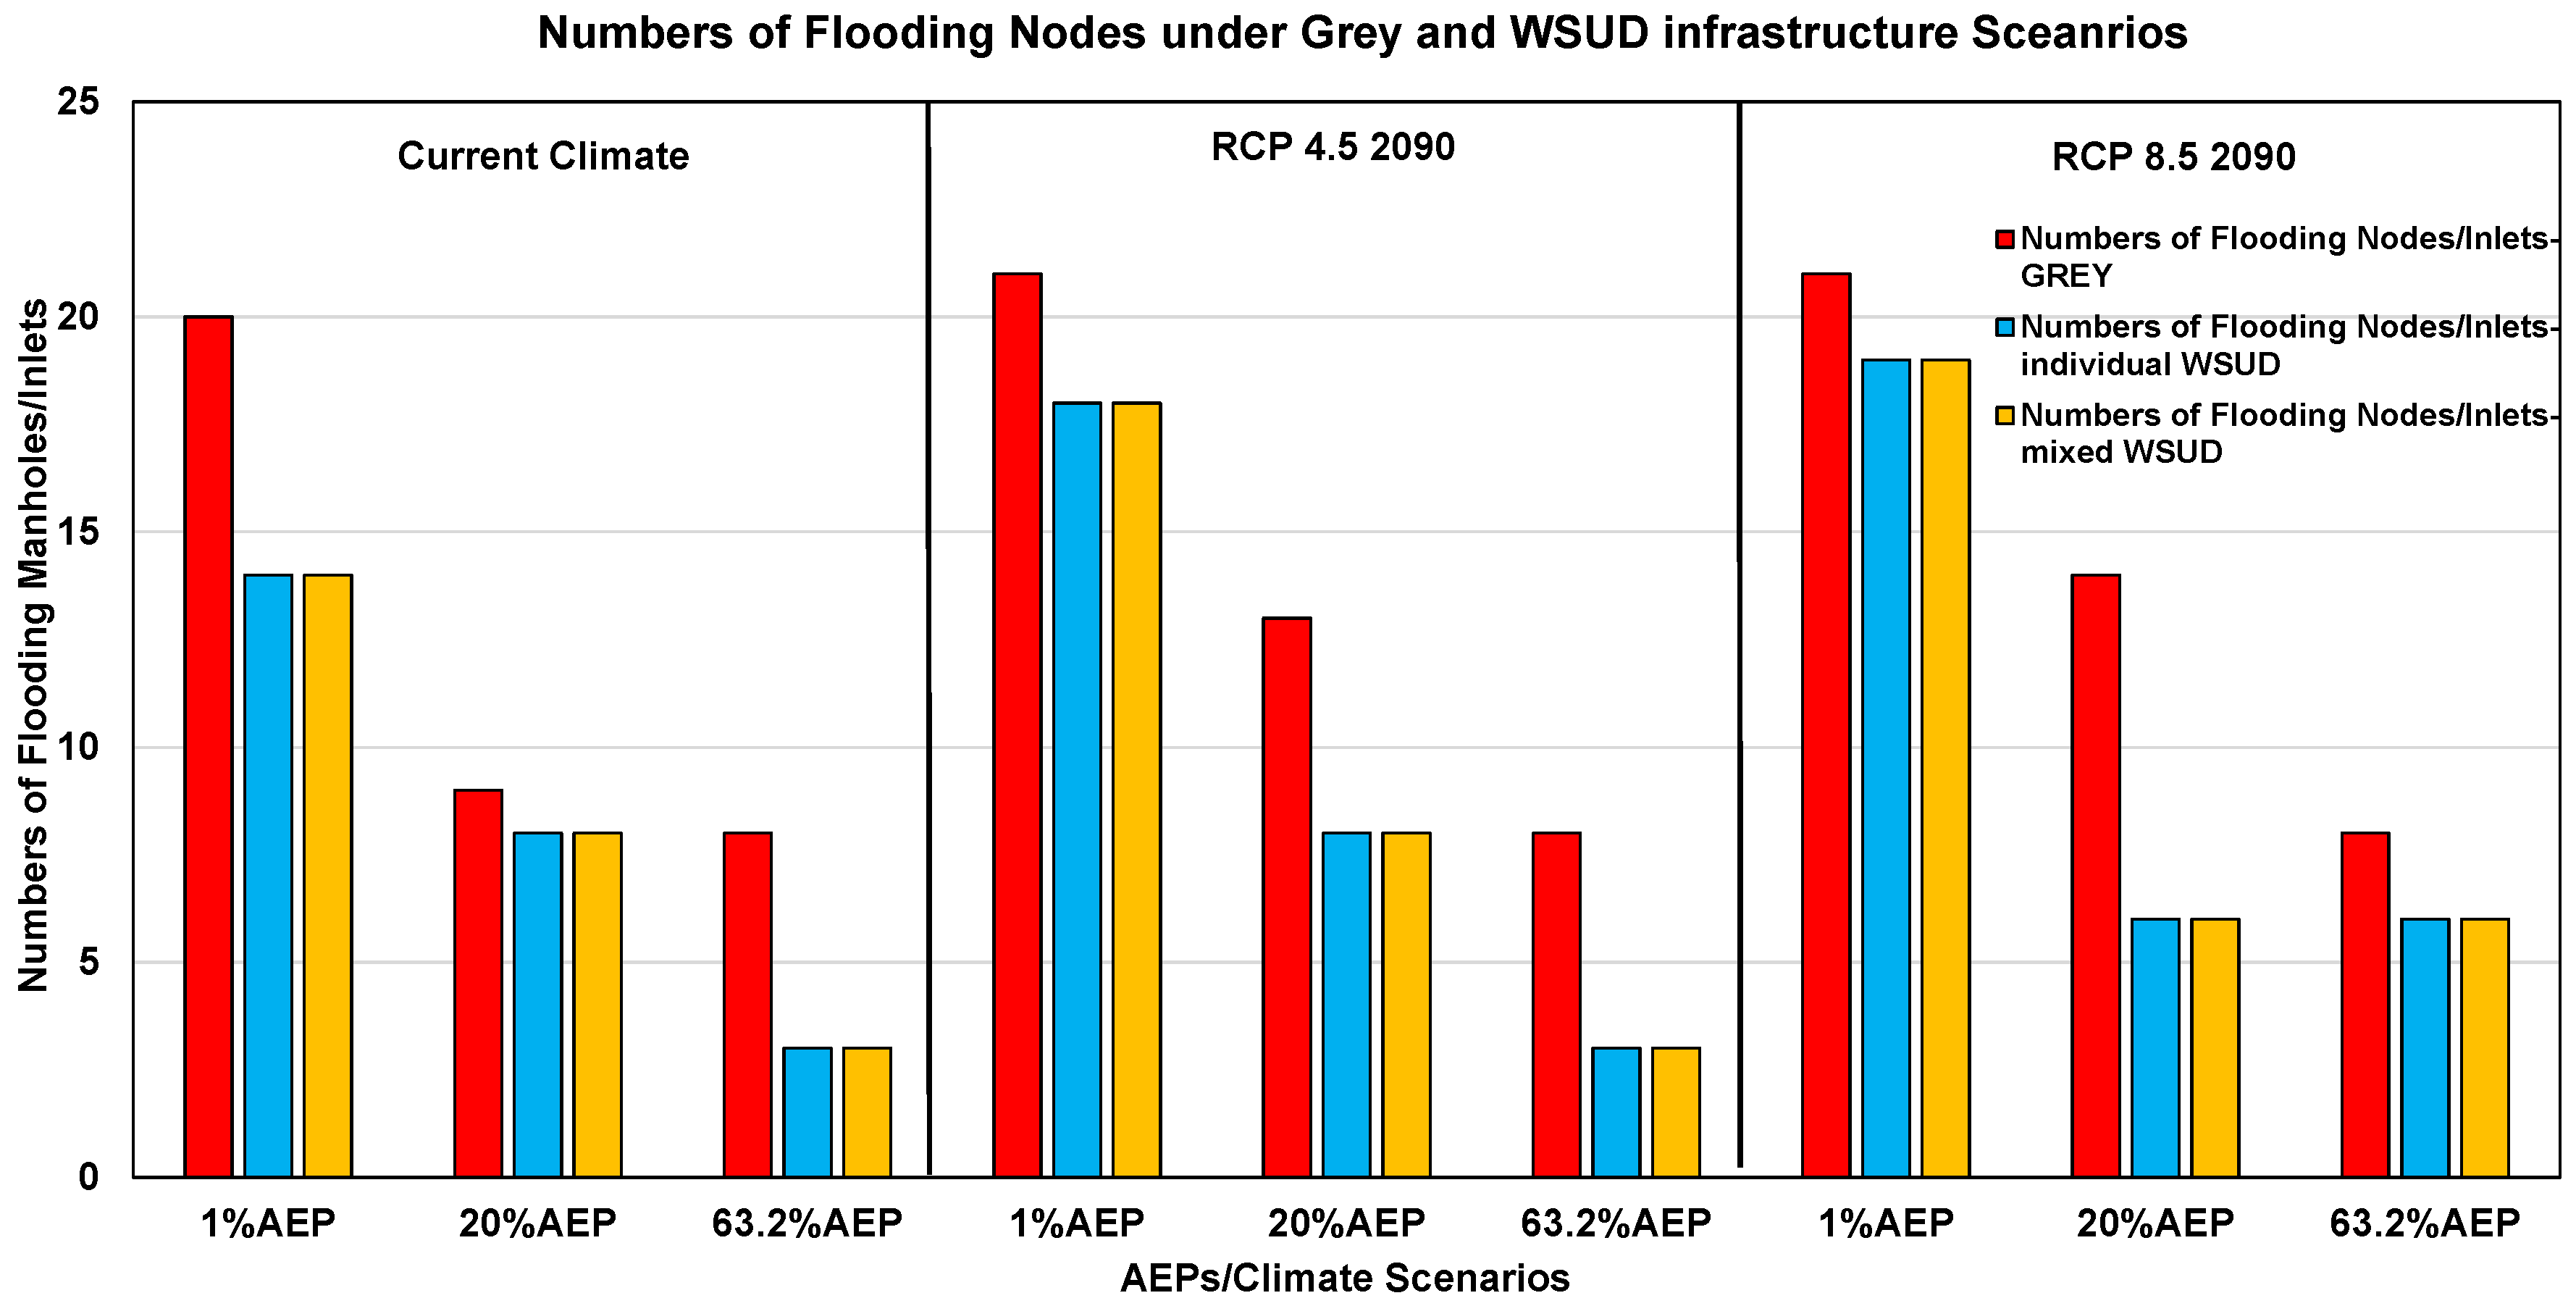
Figure 10.
Engineers Park flood extent area (FEA) and catchment area (CA) under CC, RCP 4.5 in 2090, and RCP 8.5 in 2090 with grey and best WSUD (rain barrel & M1) with 100% effective impervious area.
Figure 10.
Engineers Park flood extent area (FEA) and catchment area (CA) under CC, RCP 4.5 in 2090, and RCP 8.5 in 2090 with grey and best WSUD (rain barrel & M1) with 100% effective impervious area.
| Data | Sources | Open/Purchase | Resolution |
|---|---|---|---|
| Rainfall Data | CRC | Tipping bucket rain gauge | |
| Digital Elevation Model (DEM) | CRC | - | High resolution (0.5x0.5x, 2021) |
| Shapefile (Land use/Landcover) | CRC | - | |
| Drainage network (pipe, manhole, inlets details) | CRC | - | |
| Hydrological input (ARF, ATP, IDF) | [44,45] | Open source | |
| Soil type | [59] | Open source | |
| Water level data | [60] | Field work | Hobo Pressure transducer (Short duration) |
| Climate Data | [46] | Open source | High resolution |
| RORB Model | [39] | Open Source | |
| Storm Injector | [41] | Purchase | |
| MIKE+ | [42] | Open source (Student Version-Unlimited) |
Table 2.
Model simulation scenarios.
| Scenarios | Descriptions |
|---|---|
| Current Climate (CC) Scenarios |
|
| |
| RCP 4.5 in 2090 Scenarios |
|
| |
| RCP 8.5 in 2090 Scenarios |
|
|
Table 3.
Design event rainfall depth and critical time of peak flow generation under different climate scenarios.
Table 3.
Design event rainfall depth and critical time of peak flow generation under different climate scenarios.
| AEP/Critical Time | Current Climate (CC) (mm) | RCP 4.5 2090 (mm) | RCP 8.5 in 2090 (mm) |
| Minor (63.2% AEP), Critical time: 30 minutes |
34 | 36 | 39 |
| Moderate (20% AEP), Critical time: 30 minutes |
47 | 51 | 55 |
| Major (1% AEP), Critical time: 25 minutes |
66 | 70 | 75 |
Table 4.
Climate Change incorporation: philosophical and methodological approaches described in ARR,2019 [43].
Table 4.
Climate Change incorporation: philosophical and methodological approaches described in ARR,2019 [43].
| Philosophical Approaches | Salient features | Strength | Limitations |
|---|---|---|---|
| Precautionary principle | Adoption of rainfall increase factors | Reduces the risk of under-design | Can lead to overdesign and economic burden |
| Scenario-based | Range of future climate scenarios (representative concentration pathways -RCP) | Resilient and flexible system | Laborious, time-consuming, complex, and lead to an ambiguous decision |
| Risk-based approach | Design based on the criticality of assets | Aligns with consequences | Data and expertise intensive |
| Regional Context | Methods adjusted and adopted are specific to the localised context | More accurate and relevant | Challenging due to limited data in many regions |
| Adaptive management | Interactive planning | Sustainable long-term | Complex to institutionalise |
Disclaimer/Publisher’s Note: The statements, opinions and data contained in all publications are solely those of the individual author(s) and contributor(s) and not of MDPI and/or the editor(s). MDPI and/or the editor(s) disclaim responsibility for any injury to people or property resulting from any ideas, methods, instructions or products referred to in the content. |
© 2025 by the authors. Licensee MDPI, Basel, Switzerland. This article is an open access article distributed under the terms and conditions of the Creative Commons Attribution (CC BY) license (http://creativecommons.org/licenses/by/4.0/).
Copyright: This open access article is published under a Creative Commons CC BY 4.0 license, which permit the free download, distribution, and reuse, provided that the author and preprint are cited in any reuse.


