
Submitted:
14 August 2025
Posted:
15 August 2025
You are already at the latest version
Abstract
This study investigates the application of triboelectrostatic belt separator (TBS) as an alternative to conventional magnetic methods for concentrating apatite from a complex phosphate ore rich in phyllosilicates. The testing material, containing 22.9% P₂O₅ and exhibiting over 90% mineral liberation even in coarser fractions (+0.6mm), was mainly composed of apatite and Mg/Al-bearing phyllosilicates, with minor quantities of car-bonates, amphibole, and feldspar. Pilot-scale experiments using an M6c TBS model were conducted in rougher and cleaner stages. Apatite’s strong tendency to acquire a positive charge enabled selective separation from the negatively charged gangue. Under optimal rougher conditions (run#4), the process yielded a concentrate with 25.3% P₂O₅ and 85.1% recovery. Subsequent cleaner tests improved product quality, with two configurations (run#15 and run#18) producing final concentrates assaying 29.0% and 28.9% P₂O₅ and overall P₂O₅ recoveries of 69.3% and 74.5%, respectively. Compared to high-intensity magnetic separation conducted at Unidade de Mineração de Angico, TBS demonstrated superior mass and P₂O₅ recoveries and improved MgO removal, although R₂O₃ levels remained slightly above commercial limits. These findings point out TBS as a viable, efficient, and selective technique for apatite concentration. Future research should focus on finer particles (-0.3 mm), electrode configurations, and charge-modifying agents to further enhance performance and industrial applicability.
Keywords:
apatite
; triboelectrostatic separation
; phyllosilicates
1. Introduction
Apatite is a P-bearing mineral that occurs in phosphate ores together with several gangue minerals, such as carbonates (calcite, dolomite), silicates (quartz, mica, pyroxene, amphibole), and oxides (magnetite, hematite, ilmenite, anatase) [1,2,3]. Raw phosphate ores are seldom used in the production of fertilizers without previous beneficiation, which usually involves comminution, sizing and many sorts of concentration, as magnetic separation and froth flotation [3,4,5]. Low grade ores have been concentrated via froth flotation for more than 80 years on a large scale around the world, requiring the use of suitable chemicals (surfactants, polymers, pH modifiers) and generating large amounts of wet tailings, which demand appropriate disposal in the environment [5,6]. On the other hand, along the last decades, an increasing scarcity of water [7] calls for dry concentration processes to replace the conventional wet method (froth flotation). In this regard, triboelectrostatic separation (TES) for dry processing of phosphate ores have been proposed and demonstrated for over 90 years to separate apatite from silicates and/or carbonates, mostly in laboratory scale [8].
This paper approaches the dry concentration of a phosphate ore from Unidade de Mineração de Angico (UMA), an enterprise belonging to the mining company Fosnor (Fertilizantes Fosfatados do Norte-Nordeste LTDA) located in the municipality of Angico dos Dias-BA, Brazil [9,10]. Because the enterprise is located in a semiarid region, phosphate concentration has been accomplished for more than 20 years by three steps of Magnetic Separation (MS): low intensity MS (magnetic field ~ 0.05T) to remove magnetite, high intensity MS (magnetic field ~ 0.5T) to remove hematite/ilmenite, and very high intensity MS (magnetic field > 1.0T) to remove Fe2+-bearing phyllosilicates (Figure 1-a). However, as the mining front advanced to the lower levels of the open pit mine, new ore types containing non-magnetic phyllosilicates started to be exploited and, eventually, fed the beneficiation plant, jeopardizing the quality of the final apatite concentrate, since the content of R2O3 (Al2O3 + Fe2O3) increased to values greater than 5%, although the content of P2O5 remained in an acceptable range 28-30%. To solve the problem, the separation apatite/gangue via triboelectrostatic separation was considered to replace the two existing high intensity (>0.05T) magnetic separators at the current mineral processing plant of UMA (Figure 1-b). This paper is an initiative to demonstrate not solely the suitability of a dry separation method to concentrate phosphate ores, but also to study the influence of the operational variables of a triboelectrostatic belt separator (TBS) operating in pilot scale to produce apatite concentrate exhibiting a P2O5 content greater than 28.5%, accompanied by the possibly highest recovery.
2. Background
Triboelectrostatic separation (TES) exploits differences in the triboelectric charging properties of non-conductive materials to accomplish minerals separation based on the magnitude and sign of the acquired surface charge [11]. In this regard, similarly to froth flotation (Table 1), TES may be thought of as a process whose selectivity is based on the surface properties of the involved minerals [11,12,13,14,15,16], in opposition to other concentration technologies which rely on differences in the minerals’ bulk properties, as magnetic susceptibility/magnetic separation, density/gravity separation [17]. Since surface properties can be modified, the effectiveness of froth flotation [12] or TES [11,14,15,16] largely relies on appropriate surface modification beforehand to ensure selective separation. However, as maintained by Mirkowska and co-workers [11], because the triboelectrification mechanisms that govern the selectivity of TES are not completely understood, the prediction of separation results and controlling separation parameters are challenging tasks. This way, this paper attempts to contribute towards a better understanding on the operational variables of the TBS.
The selectivity of TES is based on differences in the ability of different solid substances to develop and keep a static surface charge. The surface charge acquired by two materials after contacting each other may be predicted by their Work Function (WF), that is defined as the minimum energy that must be supplied to extract an electron from the surface of a solid [13,14,18,19,20]. As illustrated in Figure 2, when two particles are in contact or rubbed against each other, the particle with higher WF becomes negatively charged, whereas the particle of lower WF becomes positively charged. The transfer of electrons (charge) from the surface of one particle to another occurs through contact plus frictional charging mechanisms (triboelectrification), which can arise from collision, sliding, and vibration at contact surfaces [18]. Since the triboelectrification process is highly influenced by the presence of water adsorbed onto solid/gas interface, and adsorbed water is in equilibrium with air moisture; the content of water in the air must be kept at its minimum during TES [21,22].
The capacity or tendency of a mineral species to acquire a positive or negative charge relative to another can be predicted by “triboelectric series”, an empirical list of materials vertically ordered, where those that tend to acquire a positive charge (lower WF) are positioned at the top of the series, whereas those that tend to acquire a negative charge (higher WF) are at the bottom of the list [23]. Working in laboratory scale with an electrostatic plate separator, Ferguson [24], repeating the experimental approach maintained by Fraas [25], estimated the relative position of interesting minerals in triboelectric series illustrated in Table 2, where it is possible to observe that apatite is positioned at the top of both triboelectric series, indicating its prominent ability to donate electrons after being in contact with particles of typical gangue minerals, such as quartz and hydrous/aluminum silicates (mica, clays).
Once mineral particles are charged, they must respond to an external electric field applied between two parallel electrodes of opposite polarity (positive and negative). The separation occurs due to the different trajectories taken by the positively and negatively charged particles, which result from their distinct surface charges acquired during the triboelectric process. According to information compiled in Table 3, the separation is governed by electrostatic forces, weight (gravity) and the resistance (drag) posed by the dry air to particle flow. The combination of those three kinds of forces can lead to a selective separation between apatite and gangue minerals [26,27].
At least two types of triboelectrostatic separators are available on the market: Free Settling Separators (FSS) [30] and TBS [31]. According to Figure 3, FSS operates with two electrodes working in a vertical position, whereas TBS operates with horizontal electrodes. This way, the latter allows choosing the kind of mineral particles will flow upwards/downwards within the equipment, by setting the polarity of the upper and lower electrodes.
Another prominent difference between both sorts of equipment resides in the fact that FSS requires any sort of device (pneumatic cyclones, fluidized bed, vibrating chutes and cones) to generate surface charge on mineral particles before carrying out the concentration [32], whereas TBS promotes charge generation (friction/contact between particle/particle and particle/belt) simultaneously with the separation [33]. This way, in TBS, charge generation starts at the feed distributor and continues to occur inside the equipment during the separation.
TBS have been operating industrially to separate unburned carbon from fly ash minerals in coal fired-power plants to produce concrete grade pozzolan for use as a cement substitute [34], and industrial minerals [35,36]. In contrast to FSS that are typically limited to particles >75 µm in size, the TBS is suited for separation of very fine (<1 µm) to moderately coarse (500 µm) particles [31].
2.1. Factors Influencing the Separation Process
The performance of the separation process can be optimized through the proper configuration of operational parameters of TBS separators, such as the feed port position, top electrode polarity, feed rate, electrode gap, and belt speed, as detailed in Section 3.3 of this article for the model used in this study.
However, beyond these variables, other physical and operational factors may impact the efficiency of the triboelectric separation. Mirkowska et al. [11] presented a comprehensive list of factors that can influence the TES, including surface physicochemical properties (such as composition, dopants, roughness, and the adsorption of molecules or ions), charge transfer mechanisms (involving electrons, ions, or mass), and material history effects (e.g., grinding, aging, and storage). Environmental conditions—such as temperature, humidity, and gas atmosphere—are also cited as influential parameters. Some of those factors were considered in this study, as:
Temperature of the processed material: The temperature of phosphate minerals affects its triboelectric charge (C) and its separation from the gangue minerals, as silicates and carbonates [37].
Electric field geometry: Eventually asymmetries in the electrode configuration can result in regions of low field intensity, insufficient to adequately deflect higher-density particles, compromising the selectivity of the separation.
Turbulence in the inter-electrode gap: Aerodynamic instabilities in the space between electrodes can deviate particles from their predicted trajectories, causing losses due to drag or cross-contamination between collected fractions.
Residence time: The residence time of particles during triboelectrostatic separation has a direct impact on the recovery of the target mineral. Extended residence time can lead to electrode overloading due to the increased thickness of the adhered particle layer, while turbulence generated by the counter-current motion of the belt may dislodge weakly adhered particles from the electrode surface. These effects can reduce both the recovery efficiency and the selectivity of the separation process.
Residual moisture in the particles: The presence of surface moisture directly interferes with triboelectric charging mechanisms, reducing their efficiency.
Particle size and shape distribution: The mass-to-surface ratio, dependent on morphology and granulometry, influences the particles’ response both to aerodynamic drag and to the action of the electric field.
Charging by contact with the conveyor belt: Heavier particles tend to exert greater pressure on the belt surface and among themselves, intensifying physical contact and consequently altering the triboelectric charging pattern. The material properties of the belt and its surface conditions play a decisive role in particle polarization and thus in process efficiency.
Additionally, in TBS equipment with parallel electrodes and horizontal orientation, such as the model used in this study, system performance is significantly influenced by the electrode polarity configuration. The alternation between positive polarity on the top electrode and negative polarity on the bottom electrode (or vice-versa) can substantially alter particle trajectories, especially when there are density differences among mixture constituents. For example, when the target material has higher density and is attracted to the top electrode, its trajectory results from the interaction between gravitational force, which tends to direct it downward, and the electrostatic attraction force, which pulls it upward. To these forces are added possible aerodynamic drag effects caused by turbulence generated during the conveyor belt movement, as well as fluctuations associated with the feed point, and the movement of the mixture along the belt while particles remain in the separation zone. These phenomena can introduce variability in particle trajectories, compromising separation efficiency. On the other hand, when the particles of interest, despite being denser, are attracted to the bottom electrode, gravitational and electrostatic forces act concurrently, reinforcing the displacement of material toward the lower region. This condition tends to result in more stable and predictable separations.
The opening in the upper electrode, designed to allow the passage of the three inlets (feed ports) may introduce an asymmetry between the electrodes, potentially altering the geometry of the electrostatic field and impacting electrode performance. Monitoring the electric currents at the electrodes provides a useful tool for inferring the dynamic behavior of particles inside the separator, particularly regarding trajectory randomness and separation efficiency. Such behavior can be interpreted in light of the Shockley–Ramo theorem, which describes the current induced on an electrode as a function of the motion of charged particles under the action of an electric field [38,39]. According to this theorem, the induced current is given by Equation 1:
where:
charge of the particle;
velocity vector of the particle;
weighting field (a function of the geometry and position of the electrodes).
While a particle moves within the electric field, its velocity directly contributes to the measured current. However, if its trajectory is erratic, the resulting induced current will display random fluctuations, indicating instability in the separation process. Such behavior may reflect a loss of control over dynamic separation conditions, thereby compromising system selectivity.
In addition to trajectory irregularities, another significant factor contributing to the reduction in electric current measured at the electrodes is the accumulation of insulating particles on their surfaces. Materials with high electrical resistivity, commonly present in mineral mixtures, can modify the local electric field distribution near the electrodes. This phenomenon is analogous to that observed in electrostatic precipitators, where non-conductive dust forms a dielectric layer over the electrode surface, leading to a decrease in the collected current [40].
In this context, the adhered particles act as a dielectric layer on the electrodes, locally distorting the electric field at the electrode–free-space interface and contributing to the suppression of the induced current. This accumulation creates a capacitive barrier which, beyond obstructing the interaction between newly charged particles and the electrodes, causes a reduction in the effective electric field within the active separation zone. The effect is especially pronounced in systems involving materials with low electrical conductivity, such as the minerals of low electrical conductivity evaluated in this study [41].
Rather than promoting current flow as in a resistive medium, this condition leads to attenuated electrostatic coupling between the applied field and free particles. As a result, the overall performance of the separator deteriorates, particularly under excessive particle accumulation, typically associated with extended residence times. If particle buildup becomes too rapid or excessive, the electrode surfaces may become overloaded, eventually causing particle detachment due to system flow dynamics.
3. Materials and Methods
3.1. Mineral Sample That Fed the Pilot Tests
The mineral sample (500kg) used in the triboelectrostatic separation tests was taken directly from the beneficiation plant of UMA [9,10]. According to Figure 1, it represents the non-magnetic product (concentrate) yielded by the low intensity magnetic separator that operates in the industrial plant. The mineral sample was submitted to dry screening through a sieve of 0.6 mm opening mesh, whose oversize (+0.6 mm) was ground and mixed with the undersize (-0.6 mm), aiming at yielding a final product exhibiting P900.6 mm, according to results displayed in Table 4. The product of the sample preparation (screening plus grinding) was named “Testing Material” (TM), because it fed the pilot tests. This sample preparation process allowed to assume that particle shapes are approximately similar, reducing the effect of the particle sizes shape as a varying factor in the performance among the tests conducted. After preparation, TM was homogenized in a Chevron Pile, from where aliquots of 10 kg were taken for drying, prior to triboelectrostatic separation tests. Drying was carried out in a laboratory oven (at 100oC) endowed with an air exhaustion system. The oven was loaded with 120 kg of material per batch, evenly distributed across 12 trays. After 8 hours of drying, the trays were removed and the contents sealed in plastic bags to prevent moisture absorption. The samples were then allowed to cool to ambient temperature prior to testing, in order to eliminate any potential influence of elevated temperatures (>40 °C) on separation performance. For each experiment, the bags were opened immediately before feeding the TBS. The surface humidity of TM was controlled by an empirical procedure developed by the company STET, the TBS supplier [42]. It consists of inserting the probe HM46, manufactured by Vaisala, within the plastic bag containing dried TM to measure the moisture in the air which fills the existing voids among the particles. Accordingly, if the air moisture between the particles was higher than 1%, the sample of TM was dried again for further eight hours.
3.2. Characterization of the TM and Products Yielded by the TES
The particle size distribution of the TM was determined by wet screening. The chemical composition of TM and the products generated during the tests (concentrate and tailings)—including P2O5, CaO, SiO2, Al2O3, Fe2O3, MgO, TiO2, and K2O—was analyzed using X-ray fluorescence (XRF) with a Zetium spectrometer (Malvern Panalytical, UK), employing fused bead preparation. Due to the presence of OH-bearing phyllosilicates, the volatile matter or Loss on Ignition (LOI) was measured by gravimetric analysis after roasting the samples at 1020 °C for 2 hours. The mineralogical composition of TM was assessed by X-ray diffraction (XRD) using the powder method with an Empyrean diffractometer (Malvern Panalytical, 2020, UK). Crystalline phases were identified by comparing the obtained diffractograms with the PDF-2 database from the International Centre for Diffraction Data (ICDD) and the Inorganic Crystal Structure Database (ICSD). Quantitative mineralogical analysis was performed using the Rietveld refinement method. The specific gravity of TM (2,988 kg/m3) was determined using a pycnometer. Finally, the degree of apatite liberation in TM was evaluated using a Mineral Liberation Analyzer (MLA, FEI), assisted by a Quanta 650 FEG scanning electron microscope (SEM) equipped with an energy-dispersive spectroscopy (EDS) system (Bruker).
3.3. Triboelectrostatic Belt Separator (TBS): Description and Mode of Operation
The separator used in this study was the TBS M6c model (manufactured by STET - USA), based on the technology described in the patent by David R. Whitlock [43,44], which proposes a continuous triboelectric separation system. In this system, particles of different natures acquire charges by contact (triboelectrification) and are separated by the action of an electric field generated between parallel electrodes. A conveyor belt made of dielectric material was used, offering high mechanical strength, low abrasiveness, and good thermal stability. Additionally, the belt applied on this study was thin and mesh-like, with a porous and continuous structure that enables the simultaneous transport of particles with opposite charges in opposite directions within the inter-electrode space.
Pilot experiments were conducted using this separator, as depicted in Figure 4(a). Triboelectric charging (as depicted in Figure 2) occurs by vigorous agitation of the mineral particles just after the Testing Material (TM) is poured into the equipment’s feeder, which can be placed in three different positions (Feed Ports) illustrated in Figure 4(b). Although the separator is endowed by three feed ports, just one operates when processing. To accomplish mineral separation inside the M6c TBS, negatively and positively charged (top and bottom) 6.1-meters long electrode panels attract the oppositely charged particles. Positively charged apatite particles move toward the negative electrode, while negatively charged phyllosilicate particles are drawn to the positive electrode. Because the equipment allows changing the polarity of the electrodes, both conditions were tested. A belt that runs between the top and bottom electrode panels sweeps the mineral particles into two separate hoppers (E1 and E2 depicted in Figure 4-b) that are located at either end of the machine. During the tests, after becoming positively charged, the apatite particles were attracted to the negatively charged electrode panel and, regardless of its position (either top or bottom), those particles were always swept by the belt to the End 1 of the separator (E1), after a convenient adjustment of the direction (to the right or to the left) of the belt movement. In the same way, the negatively charged gangue particles were attracted to the positively charged electrode panel and were swept by the belt to the End 2 of the separator (E2).
The operation of the M6c TBS is controlled by four primary independent variables presented in Table 5: “electrode voltage”, “electrode gap” (G), “belt speed” (S), and “mass feed rate of solids” (F). These variables are called “independent”, because they are adjusted directly in the separator control panel. After setting the four operational variables in the equipment’s control panel, seven responses were generated, as shown on Table 5, and their magnitude can be used to interpretate the experimental results: cross-sectional area (A) for solids flux, solids volumetric flowrate (Q), solids flux velocity (V) due to Q, total solids flux velocity () due to V and belt speed (S), residence time (T) of particles in the equipment, and the electrical current on top and bottom electrodes (I). The magnitude of the responses A, Q, V, and was assessed based on the value of the primary variables (Table 6) according to Equation 2 to Equation 4. The distance (L) traveled by particles of either apatite or gangue from their feed port (1, 2 and 3) until the place where they were collected (End 1, End 2) was assessed by the dimensions of the equipment (M6c TBS), and are shown on Table 7. The apatite was always collected on End 2 (E2) and gangue on End 1 (E1). This information enabled the assessment of particle residence time (T) in the equipment by using Equation 5. The electric current passing through the electrodes was measured using a built-in sensor, with the readings displayed on the equipment’s control panel. Prior to introducing the sample, the current displayed was 2.0 mA for both electrodes. Upon feeding the sample into the separator, the current values began to fluctuate. After a few seconds, the readings stabilized, and the final values were recorded.
where:
F = Mass feed rate of solids;
Q = Solids volumetric flowrate;
Solids specific gravity (2,988 kg/m3);
Solids flux velocity (m/s);
Overall solids flux velocity (m/s);
Residence time (s) to reach End 1;
Residence time (s) to reach End 2.
3.4. Pilot Tests
Pilot tests were performed by 20 runs carried out in batches of 10kg of TM. Those batches were conducted in duplicate under the experimental conditions displayed in Table 8. The values of the top and bottom electrodes electrical current correspond to the average of the measures on both runs. The first 14 tests (from run#1 to run#14) explored the independent variables displayed in Table 5 in a rougher stage. Just before processing any new experimental test (run), the equipment (M6c TBS) was cleaned with 5 kg of a fresh sample of TM (called flush) to remove the remaining residues from the previous experiment. Since no rougher concentrate showed a P2O5 grade higher than 28.5%, further six runs (from run #15 to run #20) were carried with the duty of cleaning the rougher concentrate. This way, after selecting the run that exhibited the best performance (run#4) in the rougher stage, its operational conditions were repeated 12 times, on batches of 20 kg to produce sufficient mass to carry out the complementary 6 cleaning runs (run#15 to run#20) in duplicate. The yielded rougher concentrates were homogenized in a Chevron pile, from where samples of 10 kg were taken to accomplish cleaner experiments.
Any experimental run yielded two products: concentrate (collected at the position E2) and tailings, collected at the position E1 – Figure 4(b). Those products were weighed, homogenized in a Chevron pile from where an aliquot of both was sent to chemical analysis by x-ray fluorescence. The mass percentage (Y) yielded by any test, as well as the metallurgical recovery (R) of any interesting analyte (P2O5, MgO, etc.) was calculated by Equation 6 and Equation 7, respectively. The quality of the separation apatite/phyllosilicates was assessed by the Separation Efficiency (E) maintained by Shultz [45], according to Equation 8.
where:
Y = Mass recovery (%)
C = Mass of concentrate (recovered in the electrode E2);
T = Mass of tailings (recovered in the electrode E1);
R = Recovery of P2O5 or other key analytes, as MgO;
c = Content of a target analyte (P2O5, MgO, etc.) in the concentrate;
t = Content of a target analyte (P2O5, MgO, etc) in the tailings;
E = Shultz Efficiency (%).
= Recovery of apatite, assessed by Equation 8 using the content of P2O5;
= Recovery of phyllosilicates by Equation 8, using the content of MgO.
4. Results and Discussion
4.1. Characterization of the Testing Material (TM)
According to results displayed in Table 9 as TM, the material that fed the pilot tests is mainly composed of CaO (31.0%) and P2O5 (22.9%), leading to a CaO/P2O5 ratio of 1.35, which is slightly greater than that expected from the stoichiometry of apatite (ratio ~1.32). Values of CaO/P2O5 ratio greater than 1.32 indicate the presence of carbonates (calcite/dolomite), as it evidently occurs in the finest size fraction (-0.74mm). In addition, the main chemical contaminants (17.4% of SiO2, 6.81% of Fe2O3, 6.50% of MgO, and 4.99% of Al2O3) together with the content of K2O (1.16%) and LOI (4.62%) indicate the abundance of phyllosilicates. Qualitative mineralogical analysis depicted in Figure 5 reveals that TM is mostly composed of apatite and phyllosilicates (vermiculite, vermiculite interstratified with hydromica, and smectite), as well as minor components, as amphibole, carbonates (calcite, dolomite), and feldspar (plagioclase).
The mineralogical composition of the size fraction -0.60mm +0.078mm of TM shown in Table 10, resembles its chemical composition (Table 9), because it is predominantly composed of apatite (60-61%), followed by phyllosilicates (30-32%), and minor components, as feldspar (2.5%), pyroxene/amphibole (1.2-2.0%), Fe-oxides (1.1-1.7%), calcite/dolomite (1.1%), quartz (0.8-1.2%), Ti-oxides (0.1-0.5%), as well as traces of psilomelane (0.1-0.2%), and others (0.1-0.8%).
According to the Ferguson’s triboelectric series [24] depicted in Table 2 (apatite >>> tremolite > hydrous silicates > actinolite > pyroxene > feldspar > quartz), the trend of apatite particles to acquire positive charge is very much higher than the Si-bearing minerals that compose TM (Table 10), indicating a potentially selective separation apatite/silicates by TES.
In fact, preliminary studies carried out on a laboratory scale had shown this trend, encouraging studies in pilot scale. In the same way, the position of Fe-bearing oxides either in the Ferguson’s [24] or in Fraas’ [25] triboelectric series is very much closer to the position occupied by apatite, signalizing a potentially less selective separation apatite/oxides by TES. Furthermore, the distribution of the main analytes (P2O5, CaO, SiO2, Al2O3, Fe2O3, MgO, TiO2, K2O) among the mineral species that make up the TM (Table 11) can be used to assess the selectivity of the separation. The vast majority of the P2O5 (~100%) and 97% of CaO that exist in TM are found in apatite, while phyllosilicates contain 95% of the total MgO and 85% of total Al2O3 in TM. This way, the content of P2O5 (representing apatite) and MgO (representing phyllosilicates) in the concentrates and tailings yielded by all triboelectrostatic separation tests were used to assess the Separation Efficiency [39] between apatite and phyllosilicates by Equation (8). Other interesting key analytes (SiO2, TiO2, Al2O3, and Fe2O3) were only used to evaluate the quality of the concentrates yielded by triboelectrostatic separation tests.
Particle size distribution of FM shown on Table 4 indicates that 20% of the total mass of TM contains particles with a diameter lower than 0.500 mm, which is the most suitable range of particle size to be treated by M6c TBS. Results from studies conducted by Scanning Electron Microscopy (SEM) endowed by WDS allowed the assessment of the liberation degree of apatite and phyllosilicates via image analysis (MLA). Accordingly, apatite particles show a high liberation degree (>90%) even in the coarsest size fraction (+0.6 mm) of the TM, as illustrated in Figure 6. Although this particle size distribution is not optimal for TBS processing, as recommended by the manufacturer (-0.5 mm) [31], it was chosen for testing because the degree of liberation was high (>90%).
4.2. Results from Triboelectrostatic Separation Tests
Results from the first 14 experiments (from run#1 to run#20) yielded by the pilot campaign are presented in Table 12, where it is possible to observe that products collected at E2 (concentrate) did not show P2O5 grades higher than 28.5%. This trend indicated the need to accomplish a cleaner stage to enrich the rougher concentrate and meet the expectations posed by the phosphate mining company (FOSNOR).
4.2.1. Rougher Stage
Results obtained from rougher experiments were used to explore and understand the influence of the operational variables on the separation process. According to triboelectric series maintained by Ferguson [24] and Fraas [25], apatite particles tend to acquire a positive charge after contact/rubbing with particles of gangue minerals, as silicates and oxides. This way, during a triboelectric separation test, they are likely to be attracted to the electrode of negative polarity, whereas the gangue particles (mostly Mg-bearing phyllosilicates) tend to be attracted to the electrode of positive polarity. Results depicted in Figure 7 indicate that the highest P2O5 recoveries (run#1 to run#8) were achieved when the negatively charged particles were attracted by the positive electrode operating at the top position. Such behavior indicates that negatively charged particles (gangue) move upwards more easily than positively charged particles (apatite) and that is the best operational condition to accomplish apatite concentration by using M6c TBS for the tested material. The results yielded by run#1 to run#8 align with a second-degree polynomial (r2=0.95) expressed by Equation 9. Conversely, run#9 to run#14 yielded very low metallurgical recoveries and scattered points (grade, recovery) in Figure 7 that do not fit to any curve. This finding discouraged to operate the M6c TBS with the top electrode exhibiting negative polarity in this specific application.
where:
R = Recovery of P2O5;
c = P2O5 content in the concentrate.
Accounting for the polynomial expressed by Equation 9, deriving P2O5 recovery (R) with respect to P2O5 grade (c), a maximum recovery (90.8%) is attained at = 0, as P2O5 grade is c = 24%. However, all the experiments (run#1 to run#8) carried out with the top electrode working with positive polarity yielded concentrates with P2O5 grade greater than 24% (Table 11). This way, the Schultz Separation Efficiency (E) between apatite and phyllosilicates was used to select the best experimental conditions to carry out the rougher stage, as shown in Figure 8. Accordingly, the highest value of the Separation Efficiency (E=49.3%) was achieved under the experimental conditions used to carry out run#4, such as: mass flowrate = 0.4kg/s, belt speed = 8.4m/s, gap between the electrodes = 1.25x10⁻²m, Feed Port 2. Therefore, they were adopted to carry out the rougher stage, that produced a concentrate assaying 25.3% of P2O5, mass recovery (yield) of 75.3% and P2O5 recovery of 85.1%, as shown in Table 12.
Based on Table 8 and the graphs in Figure 9, which show the electric current measured at the top electrode, on the left, and the bottom electrode, on the right, as a function of apatite residence time up to the collection point E2, it is possible to interpret the system’s behavior under different electrode polarity configurations and understand its relationship with separation efficiency and, consequently, with the apatite recovery rate. Prior to the introduction of the ore into the separator, both electrodes exhibited a stable current of 2.0 mA. Once the process was initiated, the current began to fluctuate until reaching a new steady state. This behavior reflects the interaction of charged particles with the electric field and their trajectory within the separator.
When the top electrode is configured with positive polarity (▲), and consequently the bottom electrode is negative (▲), a significant decrease in current is observed in both electrodes as the residence time ( increases. This behavior is associated with the attraction of negatively charged particles, predominantly gangue, to the top electrode, and positively charged particles, associated with apatite, to the bottom electrode. As previously discussed, in the background, apatite exhibits a higher density than gangue, which favors a separation consistent with the balance between electrostatic and gravitational forces. As a result, particle trajectories become more predictable and the induced currents stabilize at lower values, indicating improved selectivity and reduced disturbance of the electric field.
Conversely, under the configuration in which the top electrode is negatively polarized (●) and the bottom electrode is positive (■), the current at the top electrode remains above 2.0 mA, with little or no decreasing trend. At the bottom electrode, the current behavior appears more erratic, with only a slight tendency toward reduction. This instability suggests that the particles do not follow well, defined trajectories, interacting with the electric field in a disordered manner, which compromises selectivity, leads to greater contamination of the collected fraction, and results in poorer apatite separation performance.
The graphs presented in Figure 9 show that, only for apatite residence time of 0.1 seconds, the currents tend to remain above the initial values, this behavior can be attributed to the strong interaction and movement of the mixture particles and its induced current on the electrodes. For all the others apatite residence time, the electrode currents showed a decreased value, indicating that the adherence of the particles to the electrodes is occurring and that the dielectric layer is being formed along the electrodes. Furthermore, the graph in Figure 10, which depicts the recovery of P2O5 as a function of apatite residence time (TE2) in the configuration with a positive top electrode during the rougher stage, demonstrates a high recovery rate, indicating that the mineral is separated almost immediately upon exposure to the electric field. The residence time (TE2) of 0.36 seconds, of the run#4, indicates that this run achieved a high P2O5 recovery, as shown in Figure 10, and according to Figure 8, this run showed the best Shultz Separation Efficiency, indicating that there is a best residence time to achieve the best particles adherence rate (observed by the decrease on electrodes currents). When the residence time exceeds 0.4 seconds, it is possible to observe a decrease on P2O5 recovery, indicating that the electrode surface can become overloaded, eventually leading to particle detachment from the electrodes due to the flow dynamics of the system.
Since run#4 was selected as the configuration able to deliver the best Shultz Separation Efficiency between apatite and phyllosilicates, this run was repeated 12 times, on batched of 20kg to yield sufficient mass to carry out cleaner experiments, the rougher concentrate presented a chemical composition displayed in Table 12. It slightly differs from the grades exhibited in Table 11 because they are averaged values () representing 12 rougher experiments that repeated the experimental conditions that characterize run#4. Notwithstanding, all the values displayed in Table 13 exhibit low standard deviation (s) and percentual standard deviation () lower than 10%. These results clearly indicate a reliable reproducibility of the experiments.
4.2.2. Cleaner Stage
After generating sufficient mass to conduct the cleaner stage tests, the first test campaign aimed to replicate the configuration of rougher run #4, while exploring the effects of varying belt speed and mass flow rate. Three configurations were tested, which were runs #15, #16, and #17, using a constant electrode gap of 1.25 × 10⁻² m and Feed Port 2, with mass flow rates ranging from 0.3 to 0.6 kg/s and belt speeds from 6.1 to 12.2 m/s. The results, presented in Figure 11 and Table 14, showed that the P2O5 grade of the concentrate decreased as the residence time (TE2) increased. Based on these findings, a second test campaign was designed to investigate the effect of shorter residence time. To achieve this, Feed Port 1 was used, reducing the travel distance of apatite particles. Runs #18 and #19 were performed under these conditions. To further maximize the P2O5 grade, an extreme strategy was tested in run #20, which combined Feed Port 1 with an increased belt speed and a reduced feed rate of 0.2 kg/s. This configuration resulted in a concentrate with 31.9% P2O5, but with a low P2O5 recovery of only 33.2%. Notably, this run also yielded the lowest R2O3 (Fe2O3 + Al2O3) content observed during the tests, 6.2%.
Considering the target grade of >28.5% P2O5, two favorable results were achieved in run#15 and run#18. Both runs produced concentrates grades of 29% and 28.9% P2O5, respectively, along with high P2O5 recoveries of 81.4% and 87.6%, meeting both recovery and quality criteria.
4.2.3. Full Circuit Configuration Rougher/Cleaner
Feeding the M6c triboelectric belt separator (TBS) with a testing material assaying 22.9% P2O5 and running the equipment as a rougher concentrator under the operational variables characterized by run#4, cleaner stage was carried out to enrich the P2O5 grade of the final concentrate to values greater than 28.5%. Two different sets of configurations were considered based on cleaner-stage test results: i) option 1 uses the concentrate product from run#15, which yielded a concentrate with 29.0% P2O5 and a reduction in all major contaminants (SiO2, Fe2O3, Al2O3, and MgO). This configuration resulted in an overall mass recovery of 50.0% and a P2O5 recovery of 69.3%; ii) option 2 uses the product from run #18, which achieved a very similar concentrate grade of 28.9% P2O5. However, it outperformed in terms of recovery, reaching an overall mass recovery of 54.8% and a P2O5 recovery of 74.5%. Table 15 summarizes the results obtained in this study.
When compared to results previously reported by Fosnor using two high intensity magnetic separator, one with 0.5 T and the other with >1.0 T, both TBS configurations showed improved performance. Option 1 demonstrated an increase in mass recovery of 13.7% and in P2O5 recovery of 13.6%, while option 2 achieved increases of 18.5% and 18.8%, respectively. Additionally, MgO removal improved by 8.1% in option 1 and 6.6% in option 2, indicating greater selectivity in removing phyllosilicates.
Although the TBS did not significantly enhance the final P2O5 grade compared to magnetic separation, slight reductions in R2O3 (Fe2O3 + Al2O3) content were observed, as 0.49% of reduction for option 1 and 0.2% for option 2. However, these values remained above the market specification threshold of <5%.
Despite this limitation, the TBS process clearly outperformed conventional magnetic separation methods in overall recovery and contaminant removal. These findings indicate the potential of triboelectric separation as a viable and efficient alternative for processing this type of phosphate ore
Although the sample exhibited a high degree of mineral liberation, the particle size used in this study (-0.6 mm) may not have been optimal for processing with the TBS, which has shown the most effective industrial performance with finer materials, typically below -0.5 mm. Future studies should evaluate the performance of TBS at finer size ranges to determine its true potential under ideal operating conditions. Additionally, the application of TBS could be explored in other stages of the beneficiation circuit, such as processing the magnetic product from the high-intensity dry magnetic separator, with the aim of recovering apatite losses that are not captured in the current flowsheet.
Further research should also focus on investigating the use of chemical modifiers or surfactants to selectively influence surface charging, thereby enhancing triboelectric contrast and improving separation efficiency. Building on this, the development of more advanced kinetic models that incorporate key factors such as mineral liberation, electrostatic behavior, and particle morphology could significantly improve the prediction and optimization of TBS performance. Together, these approaches—combined with continued efforts in process modeling and control—can contribute to establishing TBS as a more efficient and versatile technology in phosphate ore beneficiation.
5. Conclusions
This study aimed to evaluate the technical feasibility and operational performance of a Triboelectrostatic Belt Separator (TBS) for the dry concentration of apatite in phosphate ores rich in phyllosilicates, at pilot scale. Using the M6c TBS equipment, the configuration of run#4 proved to be the most effective, producing a rougher stage concentrate with a grade of 25.3% P2O5 and a P2O5 recovery of 85.1%. In the cleaner stage, run#18 generated concentrates with more than 28.5% P2O5 and P2O5 recovery of up to 74.5%, surpassing the performance of high-intensity magnetic separators currently employed at Fosnor’s industrial plant.
Unlike most studies conducted at laboratory scale, this investigation demonstrated the practical applicability of the TBS under real pilot-scale conditions, using industrial samples, thus bridging the gap between fundamental research and industrial implementation. The analysis confirmed that key operational variables—voltage, electrode gap, belt speed, and feed rate—significantly influence separation efficiency.
Moreover, the study proposed an approach grounded in the Shockley–Ramo theorem and Ohm’s law for resistive media to explain the relationship between the electric current measured at the electrodes, the selectivity, and the overall separation performance of the TBS. It was concluded that an increase in electrode current can be attributed to the erratic motion of charged particles within the electrode gap, which induces electric current on the electrodes, as predicted by the Shockley–Ramo theorem. Conversely, a decrease in the measured current is associated with the immobilization of particles—when particles adhere to the electrode surface and become nearly stationary, their contribution to the induced current effectively disappears, and the electrical resistance due to the insulating nature of the particle layer can form a dielectric layer that acts as a barrier to electron flow, further limiting current conduction. Summarizing, the interaction between electrode polarity and particle properties, such as density, resistivity, and triboelectric behavior, plays a crucial role in TBS performance.
The repeatability of the twelve repetitions of run#4 highlights the robustness and operational stability of the TBS at pilot scale. The data also indicated that inadequate operating configurations compromise recovery and selectivity, emphasizing the importance of precise parameter control.
Although the R2O3 contents in the final concentrates remained slightly above commercial limits, the TBS demonstrated superior performance in terms of overall P2O5 recovery and MgO removal. This dry separation route could not only reduce water consumption in phosphate beneficiation but also minimize the generation of wet tailings, offering environmental and operational advantages for plants located in semi-arid regions. Future investigations should focus on optimizing the separation of finer particles (−0.3 mm), as well as exploring new electrode configurations and surface charge modifiers, aiming to enhance process efficiency and expand its industrial applicability.
Author Contributions
Conceptualization, B.C., L.S. and F.H; methodology, B.C. and L.S; soft-ware, B.C.; validation, L.S., F.H. and G.S; formal analysis, B.C., L.S., R.O., and G.S.; investigation, B.C. and L.S.; resources, R.O.; data curation, B.C.; writing—original draft preparation, B.C. and L.S..; writing—review and editing, B.S., L.S. and G.S.; visualization, B.C. and L.S.; supervision, L.S.; project administration, L.S. All authors have read and agreed to the published version of the manuscript.
Funding
This research received no external funding.
Data Availability Statement
The data presented in this study are available on request from the corresponding author due to confidentiality and proprietary rights held by Fosnor - Fosfatados do Norte-Nordeste S.A. and ST Equipment & Technology LLC.
Acknowledgments
Dr. Elaíne Andrade for her support on chart generation using Origin software. Fosnor – Fosfatados do Norte-Nordeste S.A. and ST Equipment & Technology for the authorization to publish the data of this study.
Conflicts of Interest
The authors declare no conflicts of interest.
Abbreviations
The following abbreviations are used in this manuscript:
| TBS | Triboelectrostatic Belt Separator |
| TES | Triboelectrostatic Separation |
| UMA | Unidade de Mineração de Angico |
| FSS | Free Settling Separators |
| TM | Testing Material |
| STET | ST Equipment & Technology LLC |
| XRD | X-ray diffraction |
| ICDD | International Center for Diffraction Data |
| ICSD | Inorganic Crystal Structure Database |
| EDS | Energy Dispersion X-ray Spectrometer |
| SEM | Scanning Electron Microscope |
| MLA | Mineral Liberation Analyzer |
References
- Notholt, A.J.G.; Sheldon, R.P.; Davidson, D.F. Phosphate deposits of the world - phosphate rock resources. Cambridge University Press, Cambridge, United Kingdom, 1969; 1, 565.
- Boujlel, H.; Daldoul, G.; Tlil, H.; Souissi, R.; Chebbi, N.; Fattah, N.; Souissi, F. The Beneficiation Processes of Low-Grade Sedimentary Phosphates of Tozeur-Nefta Deposit (Gafsa-Metlaoui Basin: South of Tunisia). Minerals 2019, 9, 2. [CrossRef]
- Leal Filho, L.S.; Assis, S.M.; Araujo, A.C.; Chaves, A.P. Process mineralogy studies for optimizing the flotation performance of two refractory phosphate ores. Minerals Engineering 1993, 6, 907-917. [CrossRef]
- Lynch, A.J.; Harbort, G.J.; Nelson, M.G. History of flotation. AusIMM, Carlton-Australia, 2010; 1, 348.
- Steiner, G.; Geissler, B.; Watson, I.; Mew, M.C. Efficiency developments in phosphate rock mining over the last three decades. Resources, Conservation and Recycling 2015, 105, 235-245. [CrossRef]
- Abouzeid, A.M. Physical and thermal treatment of phosphate ores – an overview. International Journal of Mineral Processing 2008, 85, 59-84. [CrossRef]
- Northey, S.A.; Mudd, G.M.; Wener, T.T.; Jowitt, S.M.; Haque, N.; Yellishety, M.; Weng, Z. The exposure of global base metal resources to water criticality, scarcity and climate change. Global Environmental Change 2017, 44, 109-124. [CrossRef]
- Bittner, J.D.; Gasiorowski, S.A.; Hrach, F.J.; Guicherd, H. Electrostatic beneficiation of phosphate ores: review of past work and discussion of an improvised separation system. Procedia Engineering 2015, 1, 1-11.
- Luciano, R. L.; Godoy, A. M. Geologia do complexo metacarbonatítico de Angico dos Dias. 2017. Geociências, vol. 1891, p. 301–314.
- Mata, C.E.D.; Sousa, P.L.R.; Pereira, C.A. Technological characterization of phosphate ore blended with the micacea and mafic typologies of the Angico dos Dias-BA alkaline-carbonatitic complex. Proceedings of the 28. ENTMME: Brazilian national meeting on ore treatment and extractive metallurgy. 2019, Belo Horizonte, pp. 4-8. Available at: http://www.entmme2019.entmme.org/trabalhos/084.pdf. Acesso em: 4 out. 2022.
- Mirkowska, M.; Kratzer, M.; Teichert, C.; Flachberger, H. Principal factors of contact charging of minerals for a successful triboelectrostatic separation process – a review. Berg und Hüttenmännische Monatshefte (BHM) 2016, 161, 359-382. https://link.springer.com/article/10.1007/s00501-016-0515-1.
- Leja, J. Surface chemistry of froth flotation. Plenum Press, New York, United States of America, 1982; 1, 758.
- Manouchehri, H.R.; Hanumantha Rao, K.; Forssberg, K.S.E. Review of electrical separation methods - Part 1: Fundamental aspects. Mining, Metallurgy & Exploration 2000, 17, 23–36. [CrossRef]
- Gupta, R.; Gidaspow, D.; Wasan, D.T.; Electrostatic separation of powder mixture based on the work function of its constituents. Powder Technology 1993, 75, 79-87. [CrossRef]
- Turcaniova, L.; Soong, Y.; Lovas, M.; Mockcciakova, A.; Orinak, A.; Justinova, M.; Znamenackova, I.; Bezovska, M.; Marchant, S. The effect of microwave radiation on the triboelectrostatic separation of coal. Fuel 2004, 83, 2075-2079. [CrossRef]
- Horn, G.D.; Smith, D.T.; Grabbe, A. Contact electrification induced by monolayer modification of a surface and relation to acid-base interactions. Nature 1993, 366, 442-443. [CrossRef]
- Wills, B.A.; Hopkins, D.W. Mineral Processing Technology - An Introduction to the Practical Aspects of Ore Treatment and Mineral Recovery. Pergamon Press, Oxford, England, 2013; 646.
- Shen, Y.; Tao, D.; Zhang, L.; Shao, H.; Bai, X.; Yu, X. An experimental study of triboelectrostatic particle charging behavior and its associated fundamentals. Powder Technology 2023, 429, 118880. [CrossRef]
- Bittner, J.D.; Flynn, K.P.; Hrach, F.J. Expanding applications in dry triboelectric separation of minerals. Proceedings of the XXVII International Mineral Processing Congress – IMPC 2014, Santiago, Chile, 2014, 216-230. Available online: https://steqtech.com/wp-content/uploads/2015/11/IMPC-2014-Bittner-et-al-revised-140808.pdf.
- Kelly, E.G.; Spottiswood, D.J. The theory of electrostatic separations: a review — part I. Fundamentals. Minerals Engineering 1989, 2, 33-46. [CrossRef]
- Zhou, H.; Yao, J.; Chen, S.; Li, H.; Chen, Y.; Wu, X. Effect of moisture content on charging and triboelectrostatic separation of coal gasification fine ash. Separation and Purification Technology 2024, 333, 125976. [CrossRef]
- Lindley, K.S.; Rowson, N.A. Feed preparation factors affecting the efficiency of the electrostatic separation. Magnetic and Electrical Separation 1997, 8, 161-169. [CrossRef]
- Galembeck, F.; Burgo, T.A.L.; Balestrin, B.S.; Gouveia, R.F.; Silva, C.A.; Galembeck, A. Friction, tribochemistry and triboelectricity: recent progress and perspectives. Royal Society of Chemistry Advances 2014, 4, 64280-64298. [CrossRef]
- Ferguson, D.N. A basic triboelectric series for heavy minerals from inductive electrostatic separation behavior. The Journal of The Southern African Institute of Mining and Metallurgy 2010, 110, 75-78. Available online: http://www.scielo.org.za/scielo.php?script=sci_arttext&pid=S2225-62532010000200005&lng=en&nrm=iso.
- Fraas, F. Electrostatic separation of granular materials, US Bureau of Mines 1962, B603, 26.
- Inculet, I. Electrostatic mineral separation, electrostatics and electrostatic application series. Research Studies Press, John Wiley & Sons, New York, 1994, 215p.
- He, J.; Huang, S.; Chen, H.; Zhu, L.; Guo, C.; He, X.; Yang, B. Recent advances in the intensification of triboelectric separation and its application in resource recovery: A review. Chemical Engineering and Processing - Process Intensification, vol. 185, 2023, p. 109308. [CrossRef]
- Souza Pinto, T.C.; Lima, O.A.; Leal Filho, L.S. Sphericity of apatite particles determined by gas permeability through packed beds. Minerals & Metallurgical Processes 2009, 26, 105-108. [CrossRef]
- Rankin, W.J. Minerals, metals and sustainability. CRC Press/Balkema, Leiden - The Netherlands, 2011, 419p.
- Küppers, H.; Knauer, H. Electrostatic free fall separator. United States Patent 4,797,201, 1989. Available online: https://patents.google.com/patent/US4797201A/en.
- Bittner, J.D.; Hrach, F.J.; Gasiorowskia, S.A.; Canellopoulus, L.A.; Guicherd, H. Triboelectric belt separator for beneficiation of fine minerals. Procedia Engineering 2014, 83, 122 – 129. [CrossRef]
- Chelgani, S.C.; Neisiani, A.S. Dry mineral processing. Springer Verlag, Berlim, Germany, 2022; 1, 156.
- Lindley, K.S.; Rowson, N.A. Feed preparation factors affecting the efficiency of the electrostatic separation. Magnetic and Electrical Separation 1997, 8, 161-169. [CrossRef]
- Ban, H.; Li, T.X.; Hower, J.C.; Schaefer, J.L.; Stencel, J.M. Dry triboelectrostatic beneficiation of fly ash. Fuel, 1997, 76, 801-805.
- Hrach, F.; Flynn, K.; Miranda, P.J. Beneficiation of industrial minerals using a triboelectrostatic belt separator. Canadian Institute of Mining Metallurgy and Petroleum, 2016. Available online: https://onetunnel.org/documents/beneficiation-of-industrial-minerals-using-a-tribo-electric-belt-separator.
- Bada, S.O.; Falcon, L.M.; Falcon, R.M.S.; Bergmann, C.P. Feasibility study on triboelectrostatic concentration of <105μm phosphate ore. The Journal South African Institute of Mining and Metallurgy, 2012, 112, 2-6. Available online: https://scielo.org.za/scielo.php?script=sci_arttext&pid=S2225-62532012000500004.
- Ciccu, R.; Ghiani, M. M.; Ferrara, G.: Selective tribocharging of particles for separation, Kona, 11, 1993, 5–16. Available online: https://www.jstage.jst.go.jp/article/kona/11/0/11_1993006/_pdf.
- Shockley, W. Currents to conductors induced by a moving point charge. Journal of Applied Physics, 1938, 9, 635-636. [CrossRef]
- Ramo, S. Currents induced by electron motion. Proceedings of the IRE, 1939, 27, 584-585. [CrossRef]
- Parker, K. R. Applied Electrostatic Precipitation. Blackie Academic & Professional, London, United Kingdom, 1997; 1, 521.
- Keller, G. V. Section 26: Electrical properties of rocks and minerals. Handbook of Physical Constants, Geological Society of America, 1966, 1, 553, . [CrossRef]
- ST Equipment & Technology LLC. M6c Manual. Installation and Operation Manual, 2020, 50p.
- Whitlock, David R. Separating Constituents of a Mixture of Particles. United States Patent 4,839,032, 1989. Available online: https://patents.google.com/patent/US4839032A/en.
- Whitlock, David R. Separating Constituents of a Mixture of Particles. United States Patent 4,874,507, 1989. Available online: https://patents.google.com/patent/US4874507A/en.
- Schulz, N.F. Separation efficiency. Transactions of the American Institute of Mining, Metallurgical, and Petroleum Engineers, 1970, 247, 81-87.
Figure 1.
Phosphate beneficiation at UMA: (a) Traditional industrial circuit; (b) Simplified industrial circuit with triboelectrostatic separation.
Figure 1.
Phosphate beneficiation at UMA: (a) Traditional industrial circuit; (b) Simplified industrial circuit with triboelectrostatic separation.
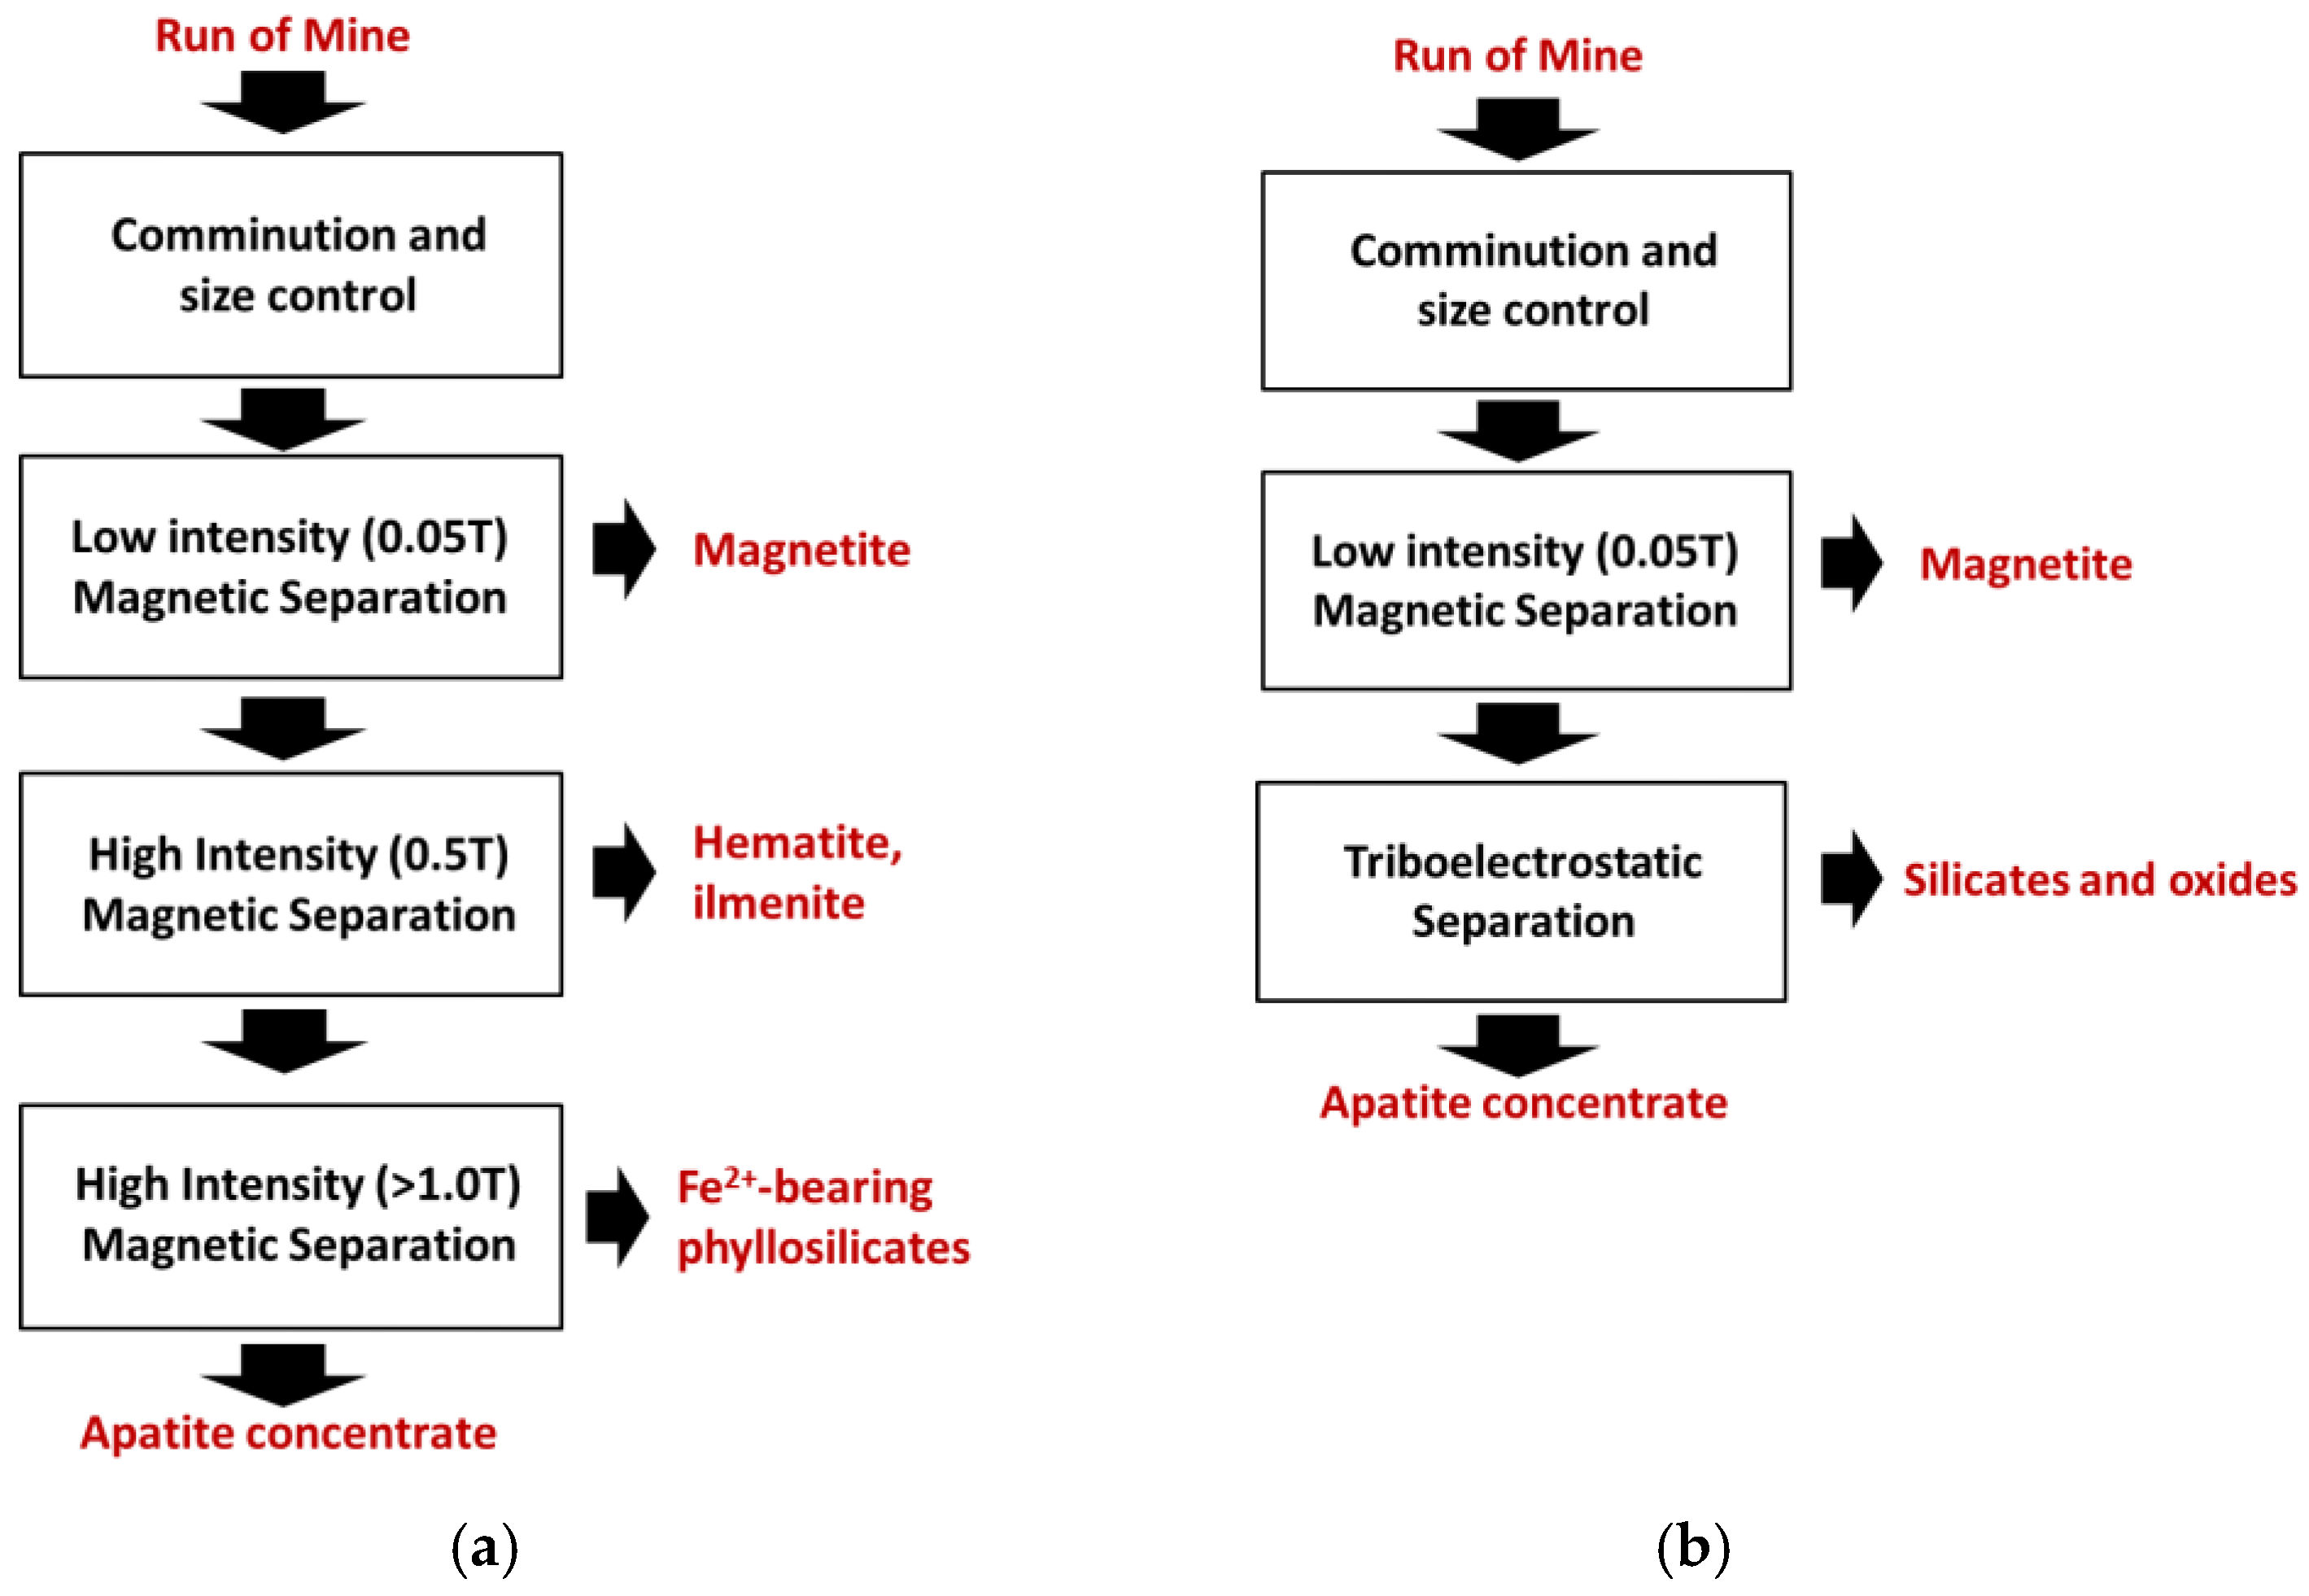
Figure 2.
Illustration of the triboelectrification phenomena.
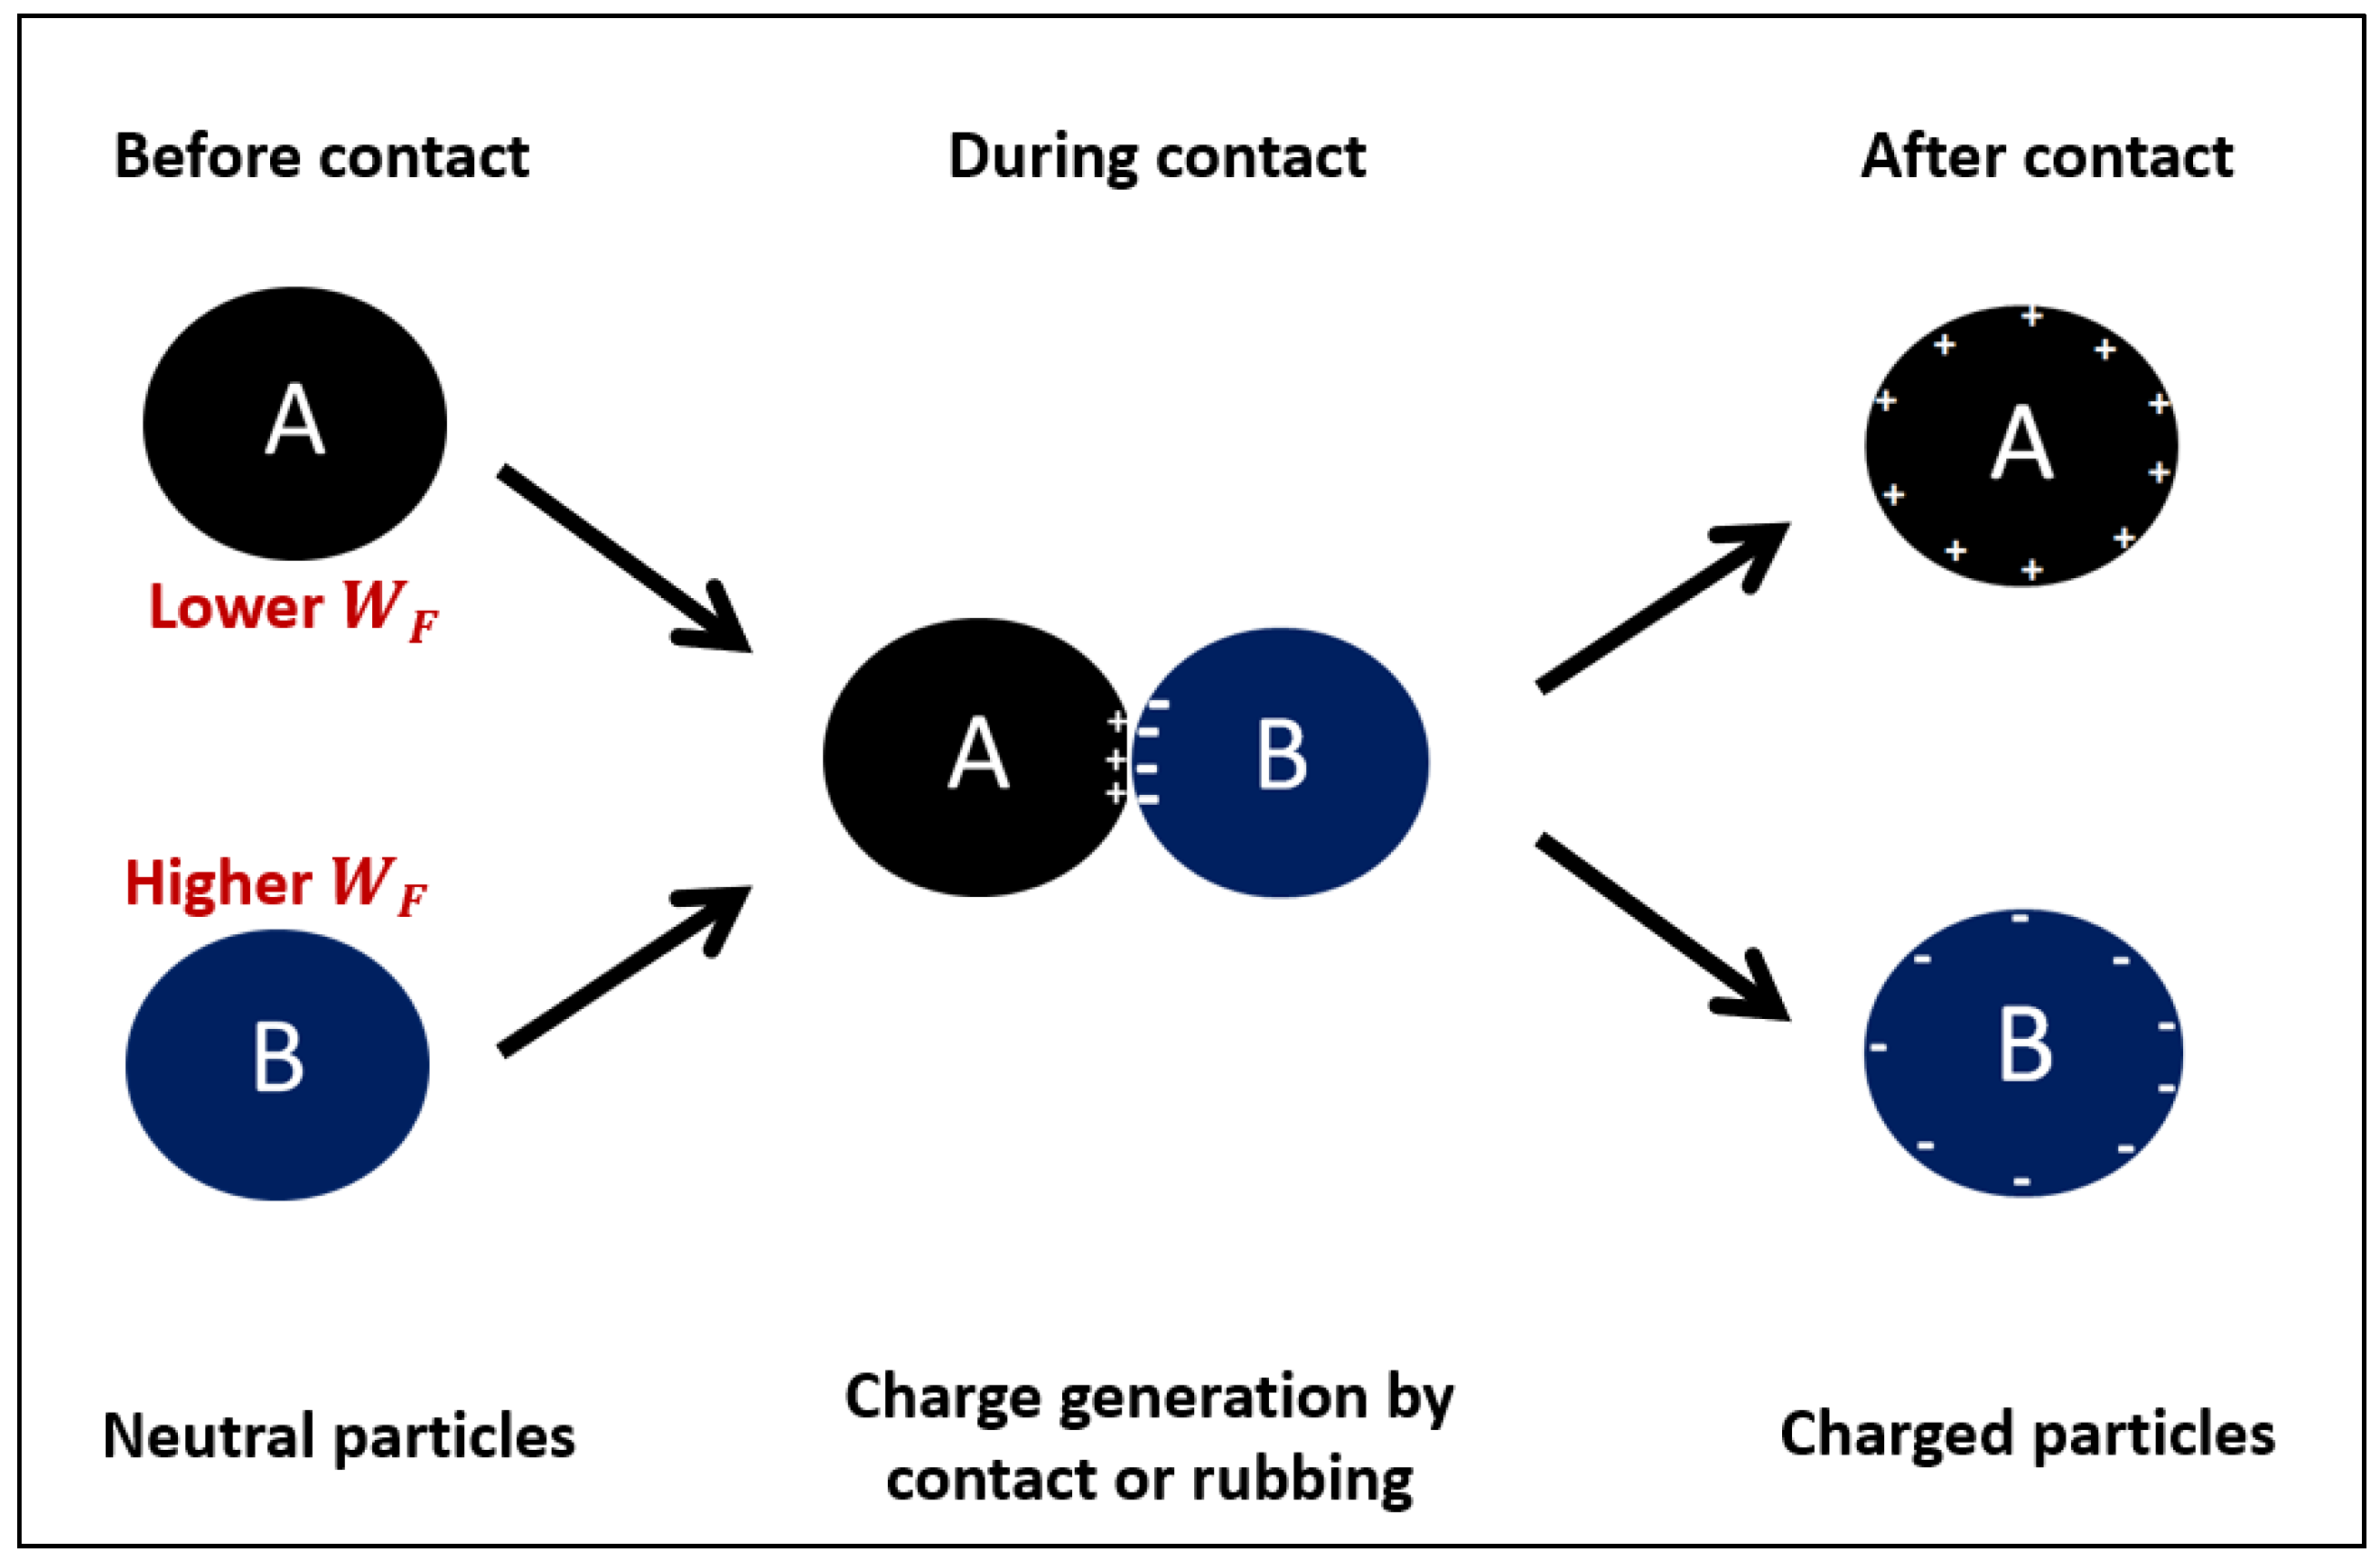
Figure 3.
Illustration of triboelectrostatic separators: (a) FSS (b) TBS.
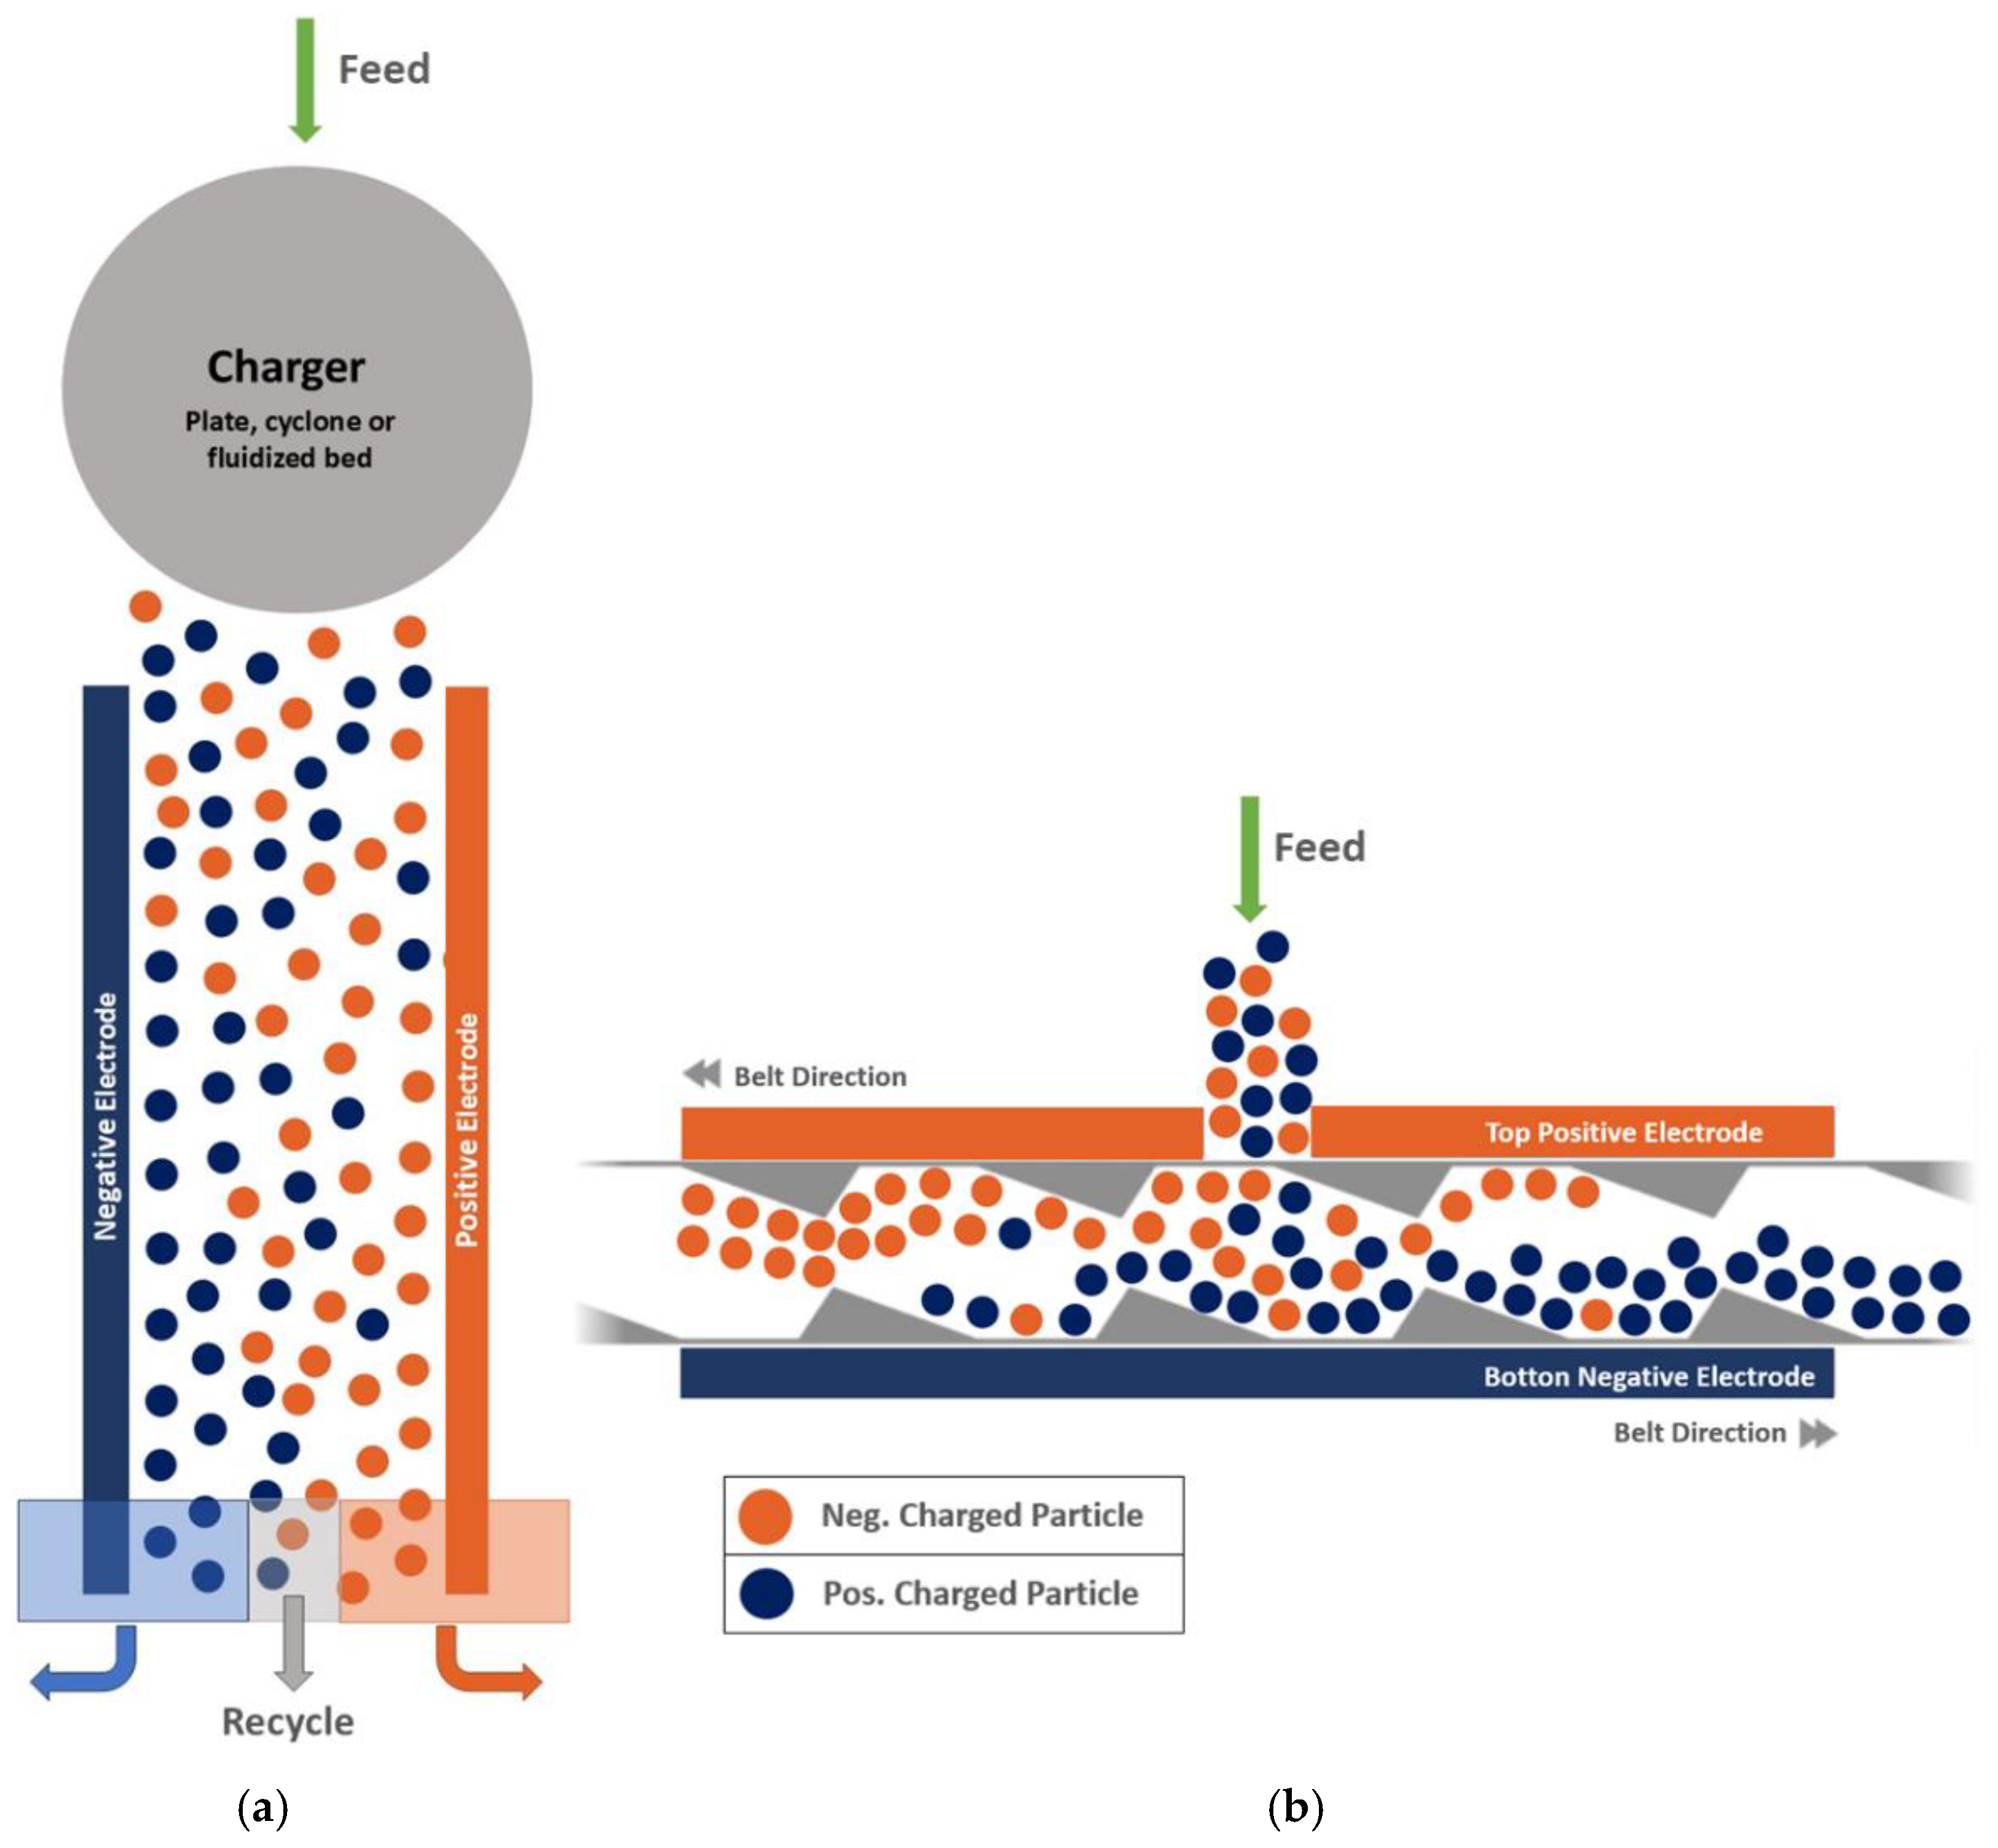
Figure 4.
Illustration of the M6c TBS: (a) Installed in a container; (b) Schematic drawing of the M6c [42].
Figure 4.
Illustration of the M6c TBS: (a) Installed in a container; (b) Schematic drawing of the M6c [42].
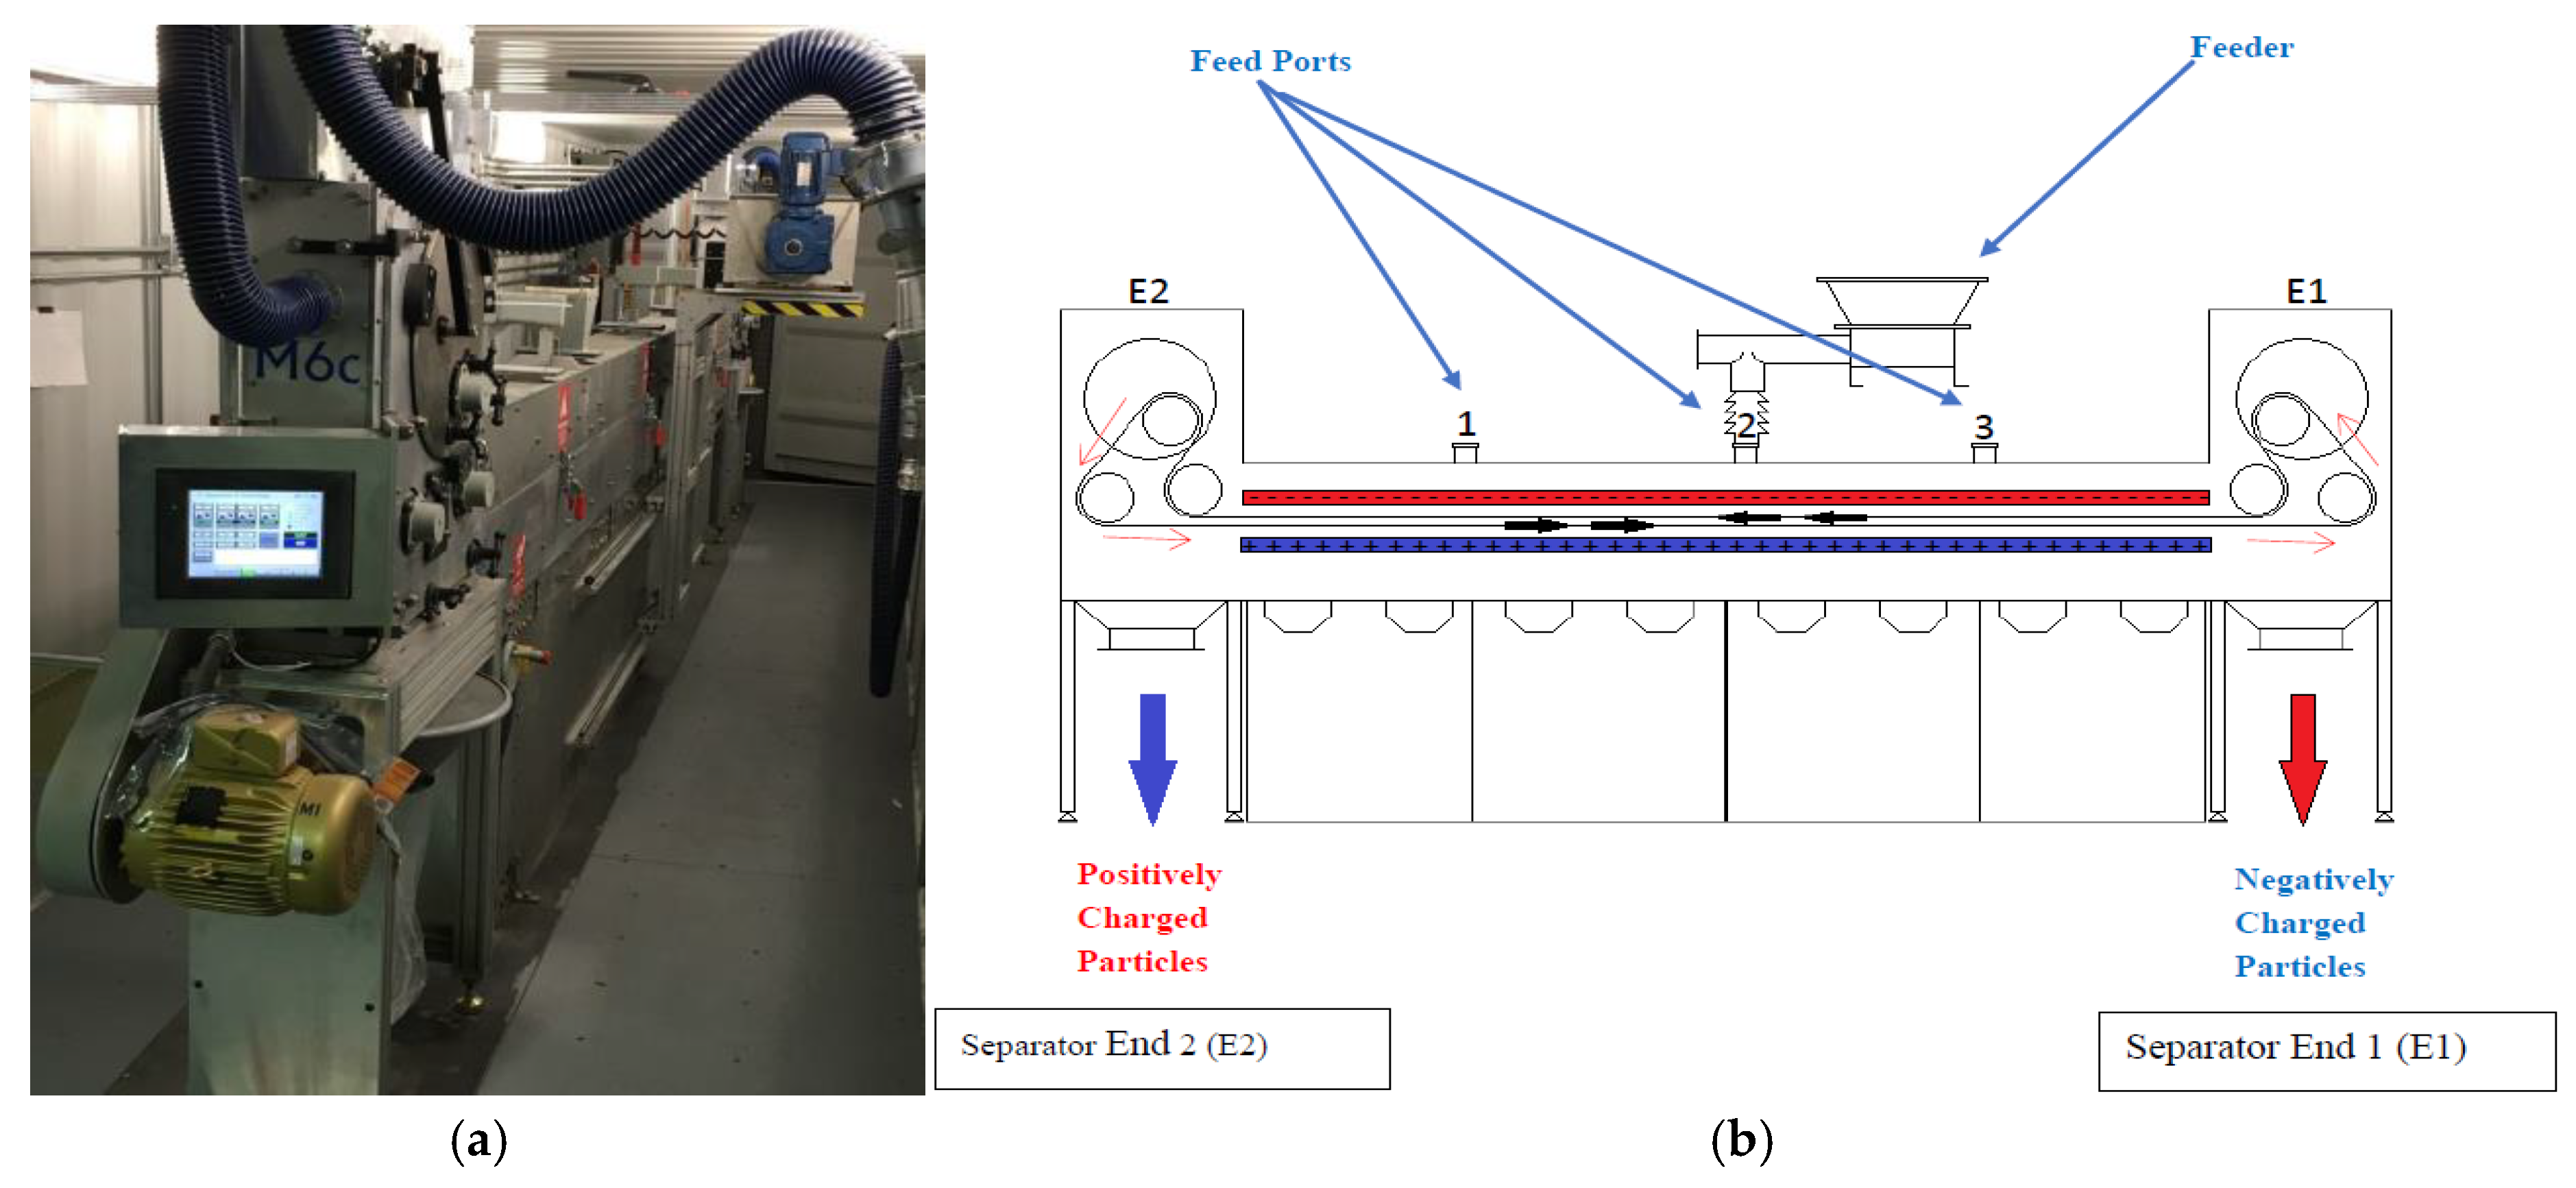
Figure 5.
X-ray diffraction patterns of the Feed Material (FM).
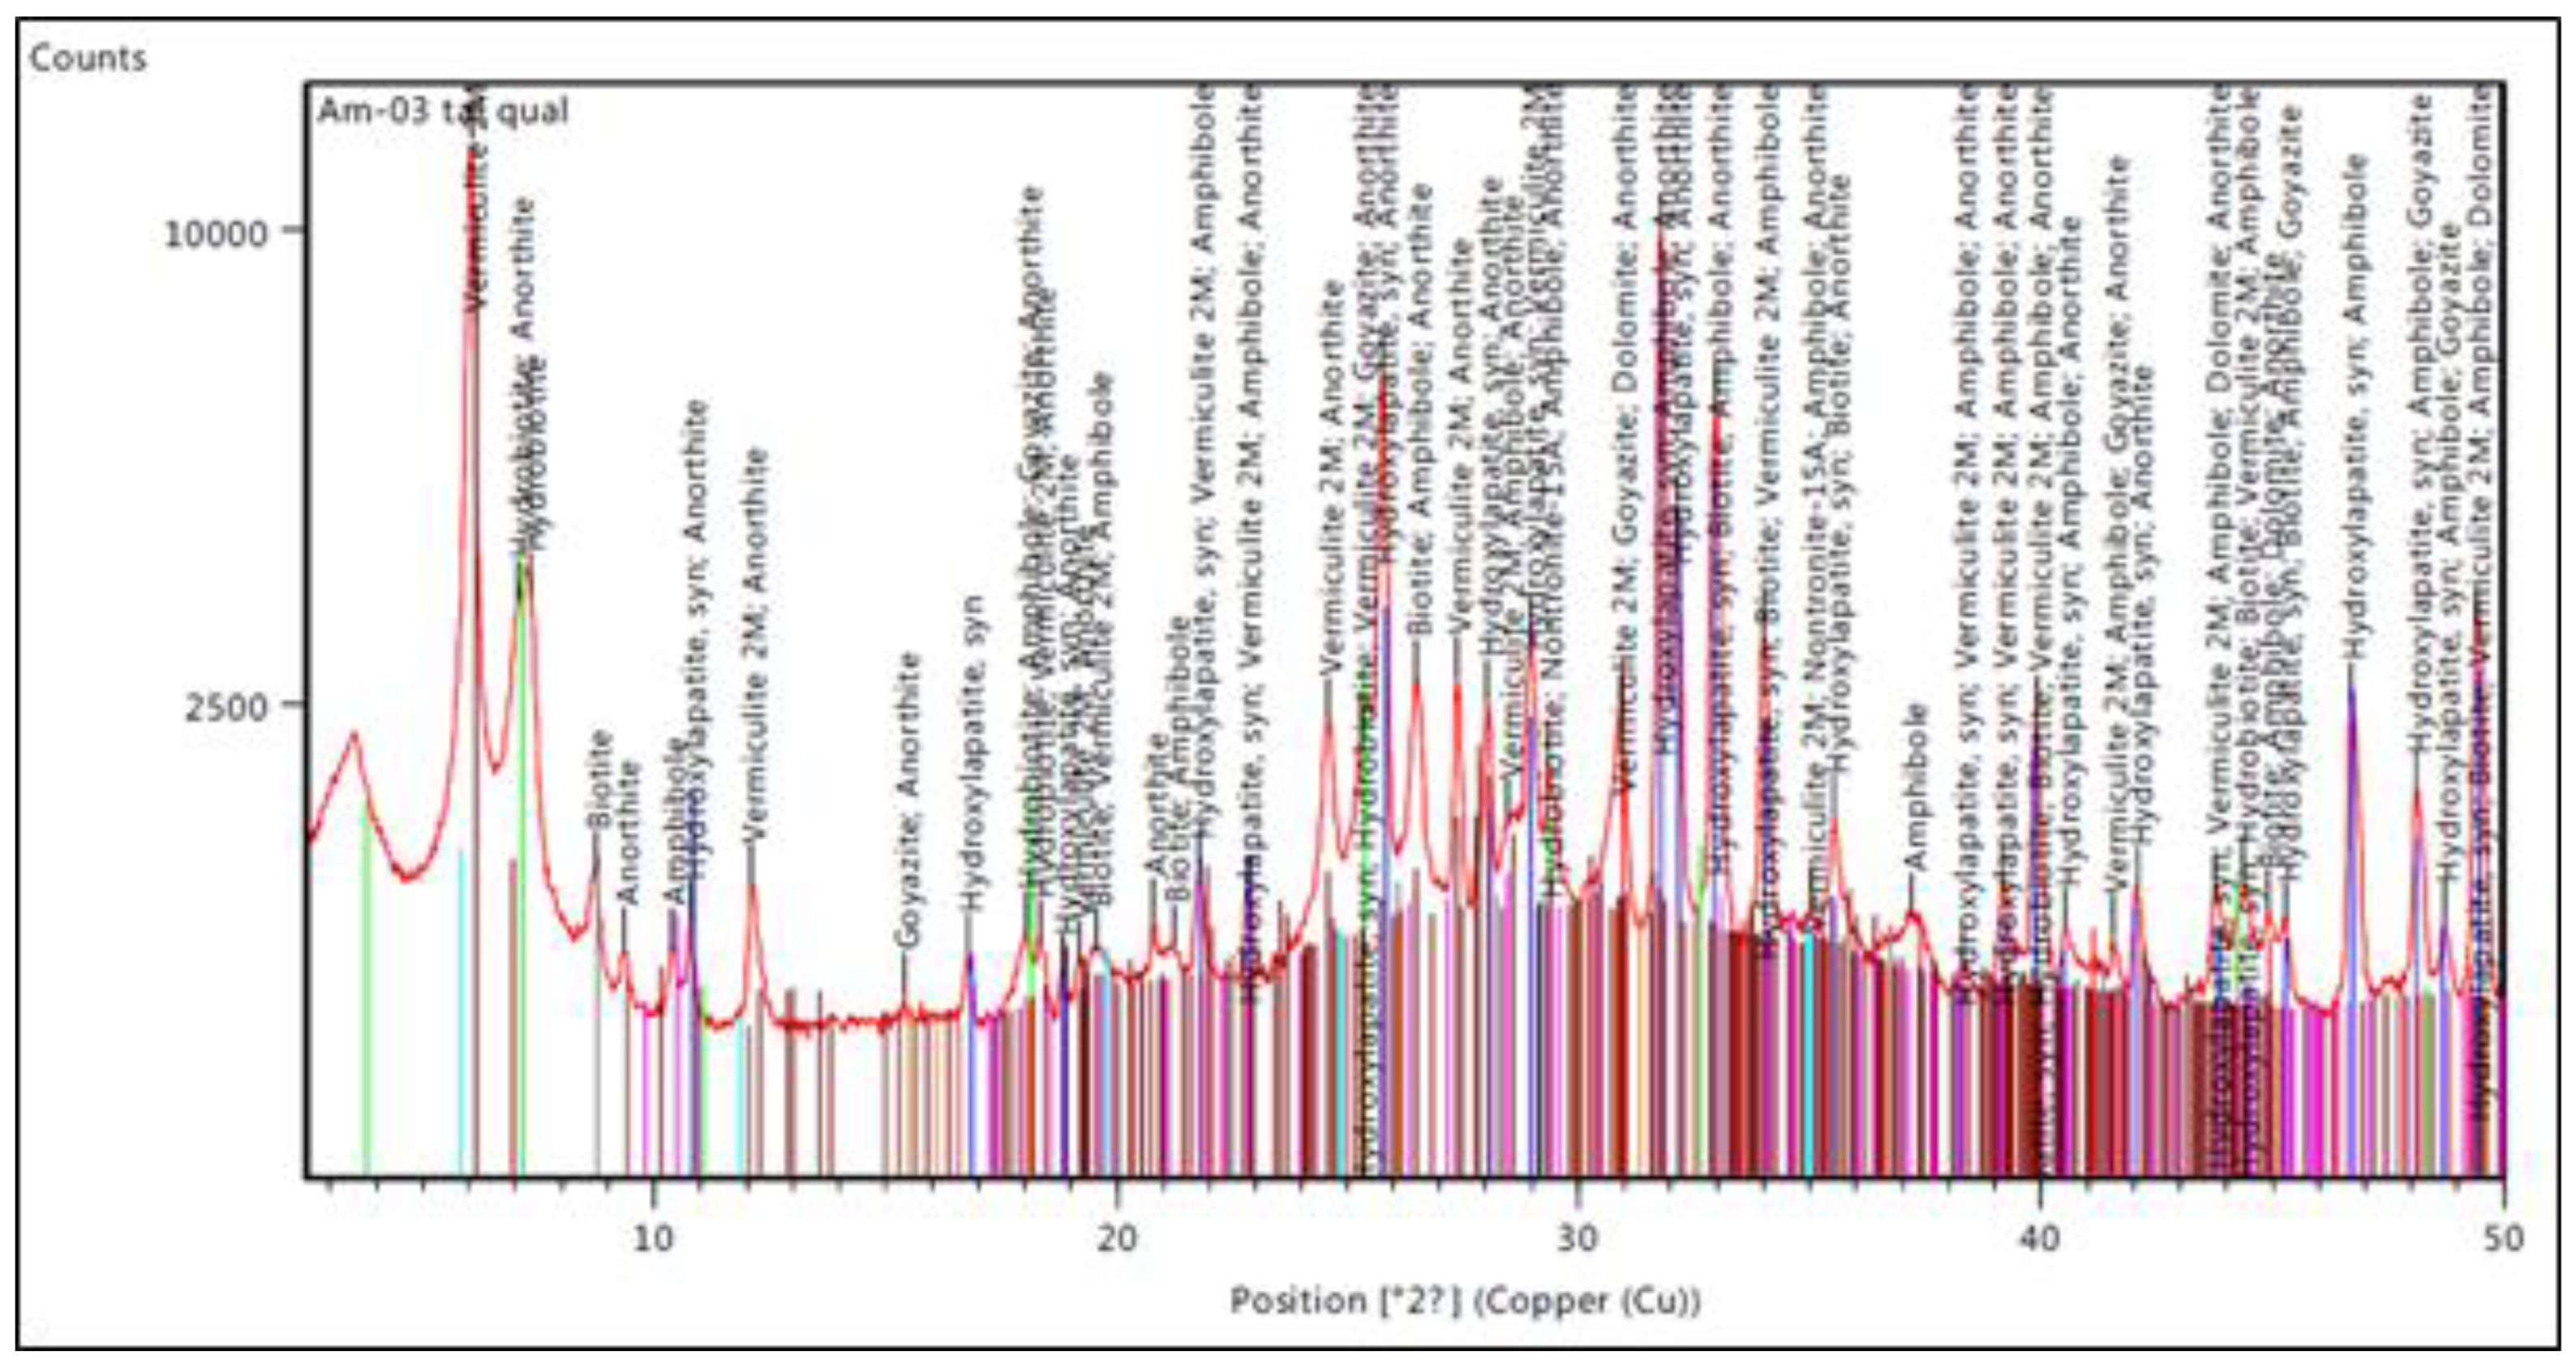
Figure 6.
Images of particles of apatite versus gangue (+0.600mm) obtained by MLA.
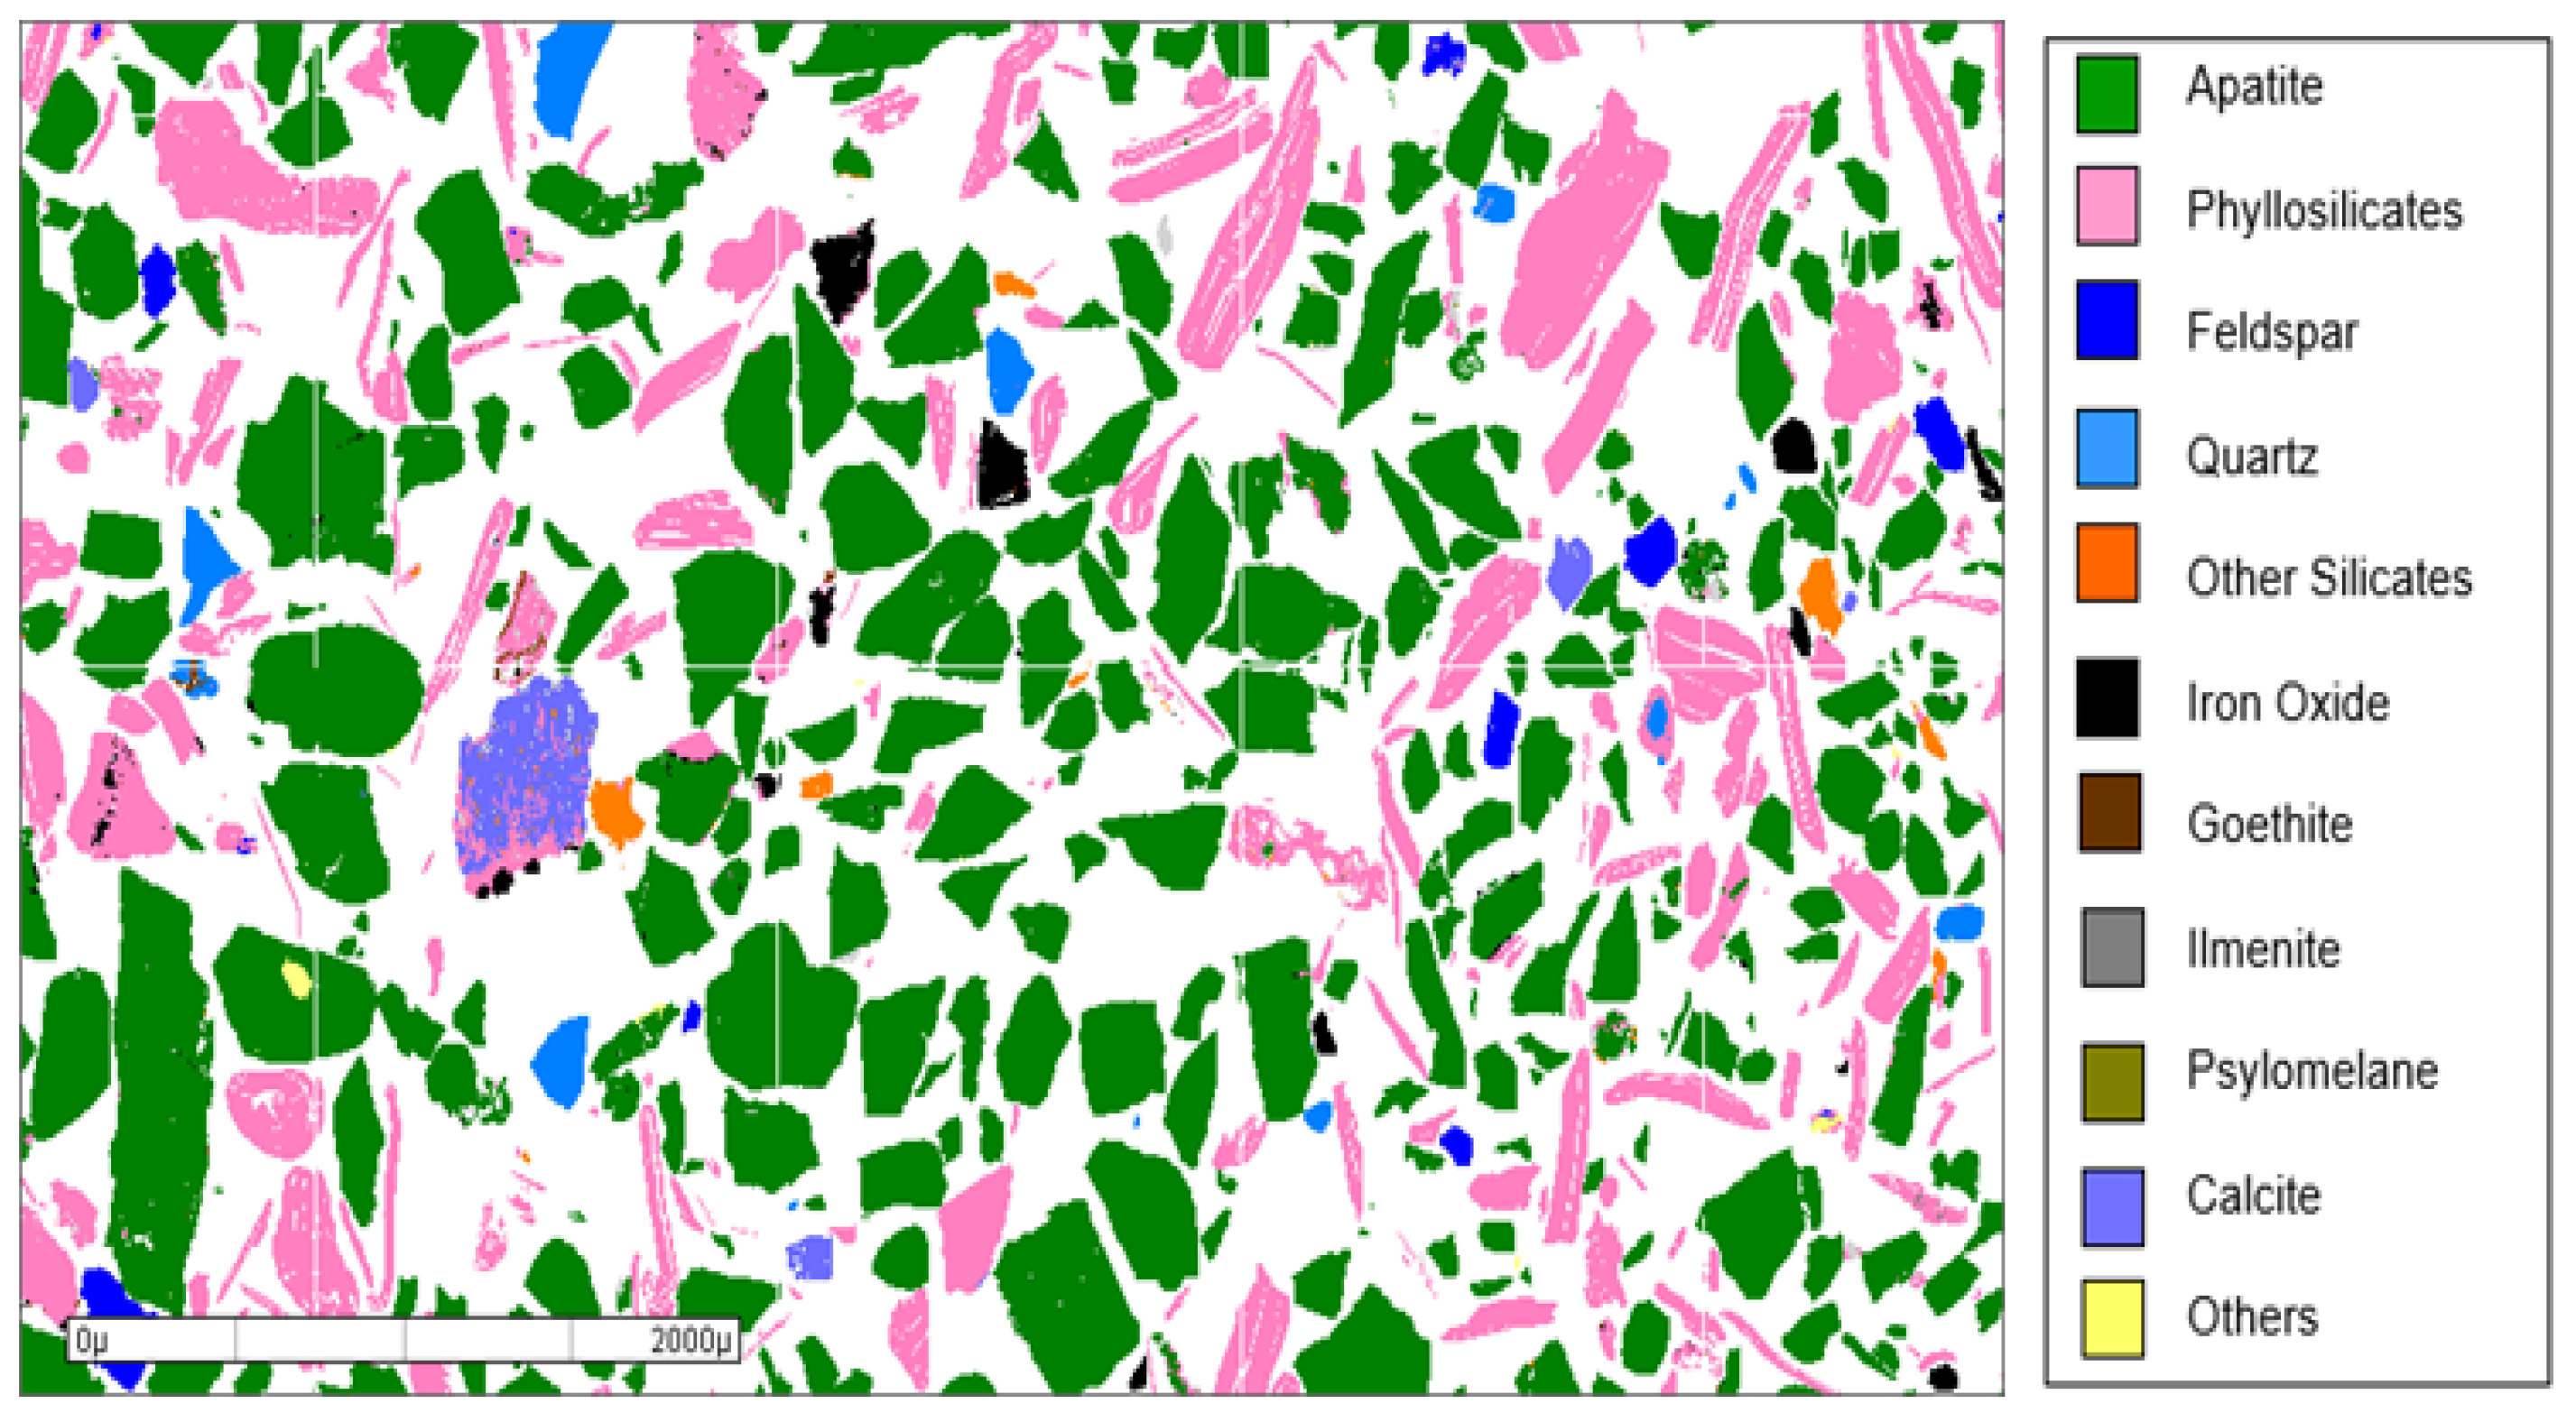
Figure 7.
Performance of triboelectrostatic separation tests varying the polarity of the top electrode (positive x negative) of rougher stage.
Figure 7.
Performance of triboelectrostatic separation tests varying the polarity of the top electrode (positive x negative) of rougher stage.
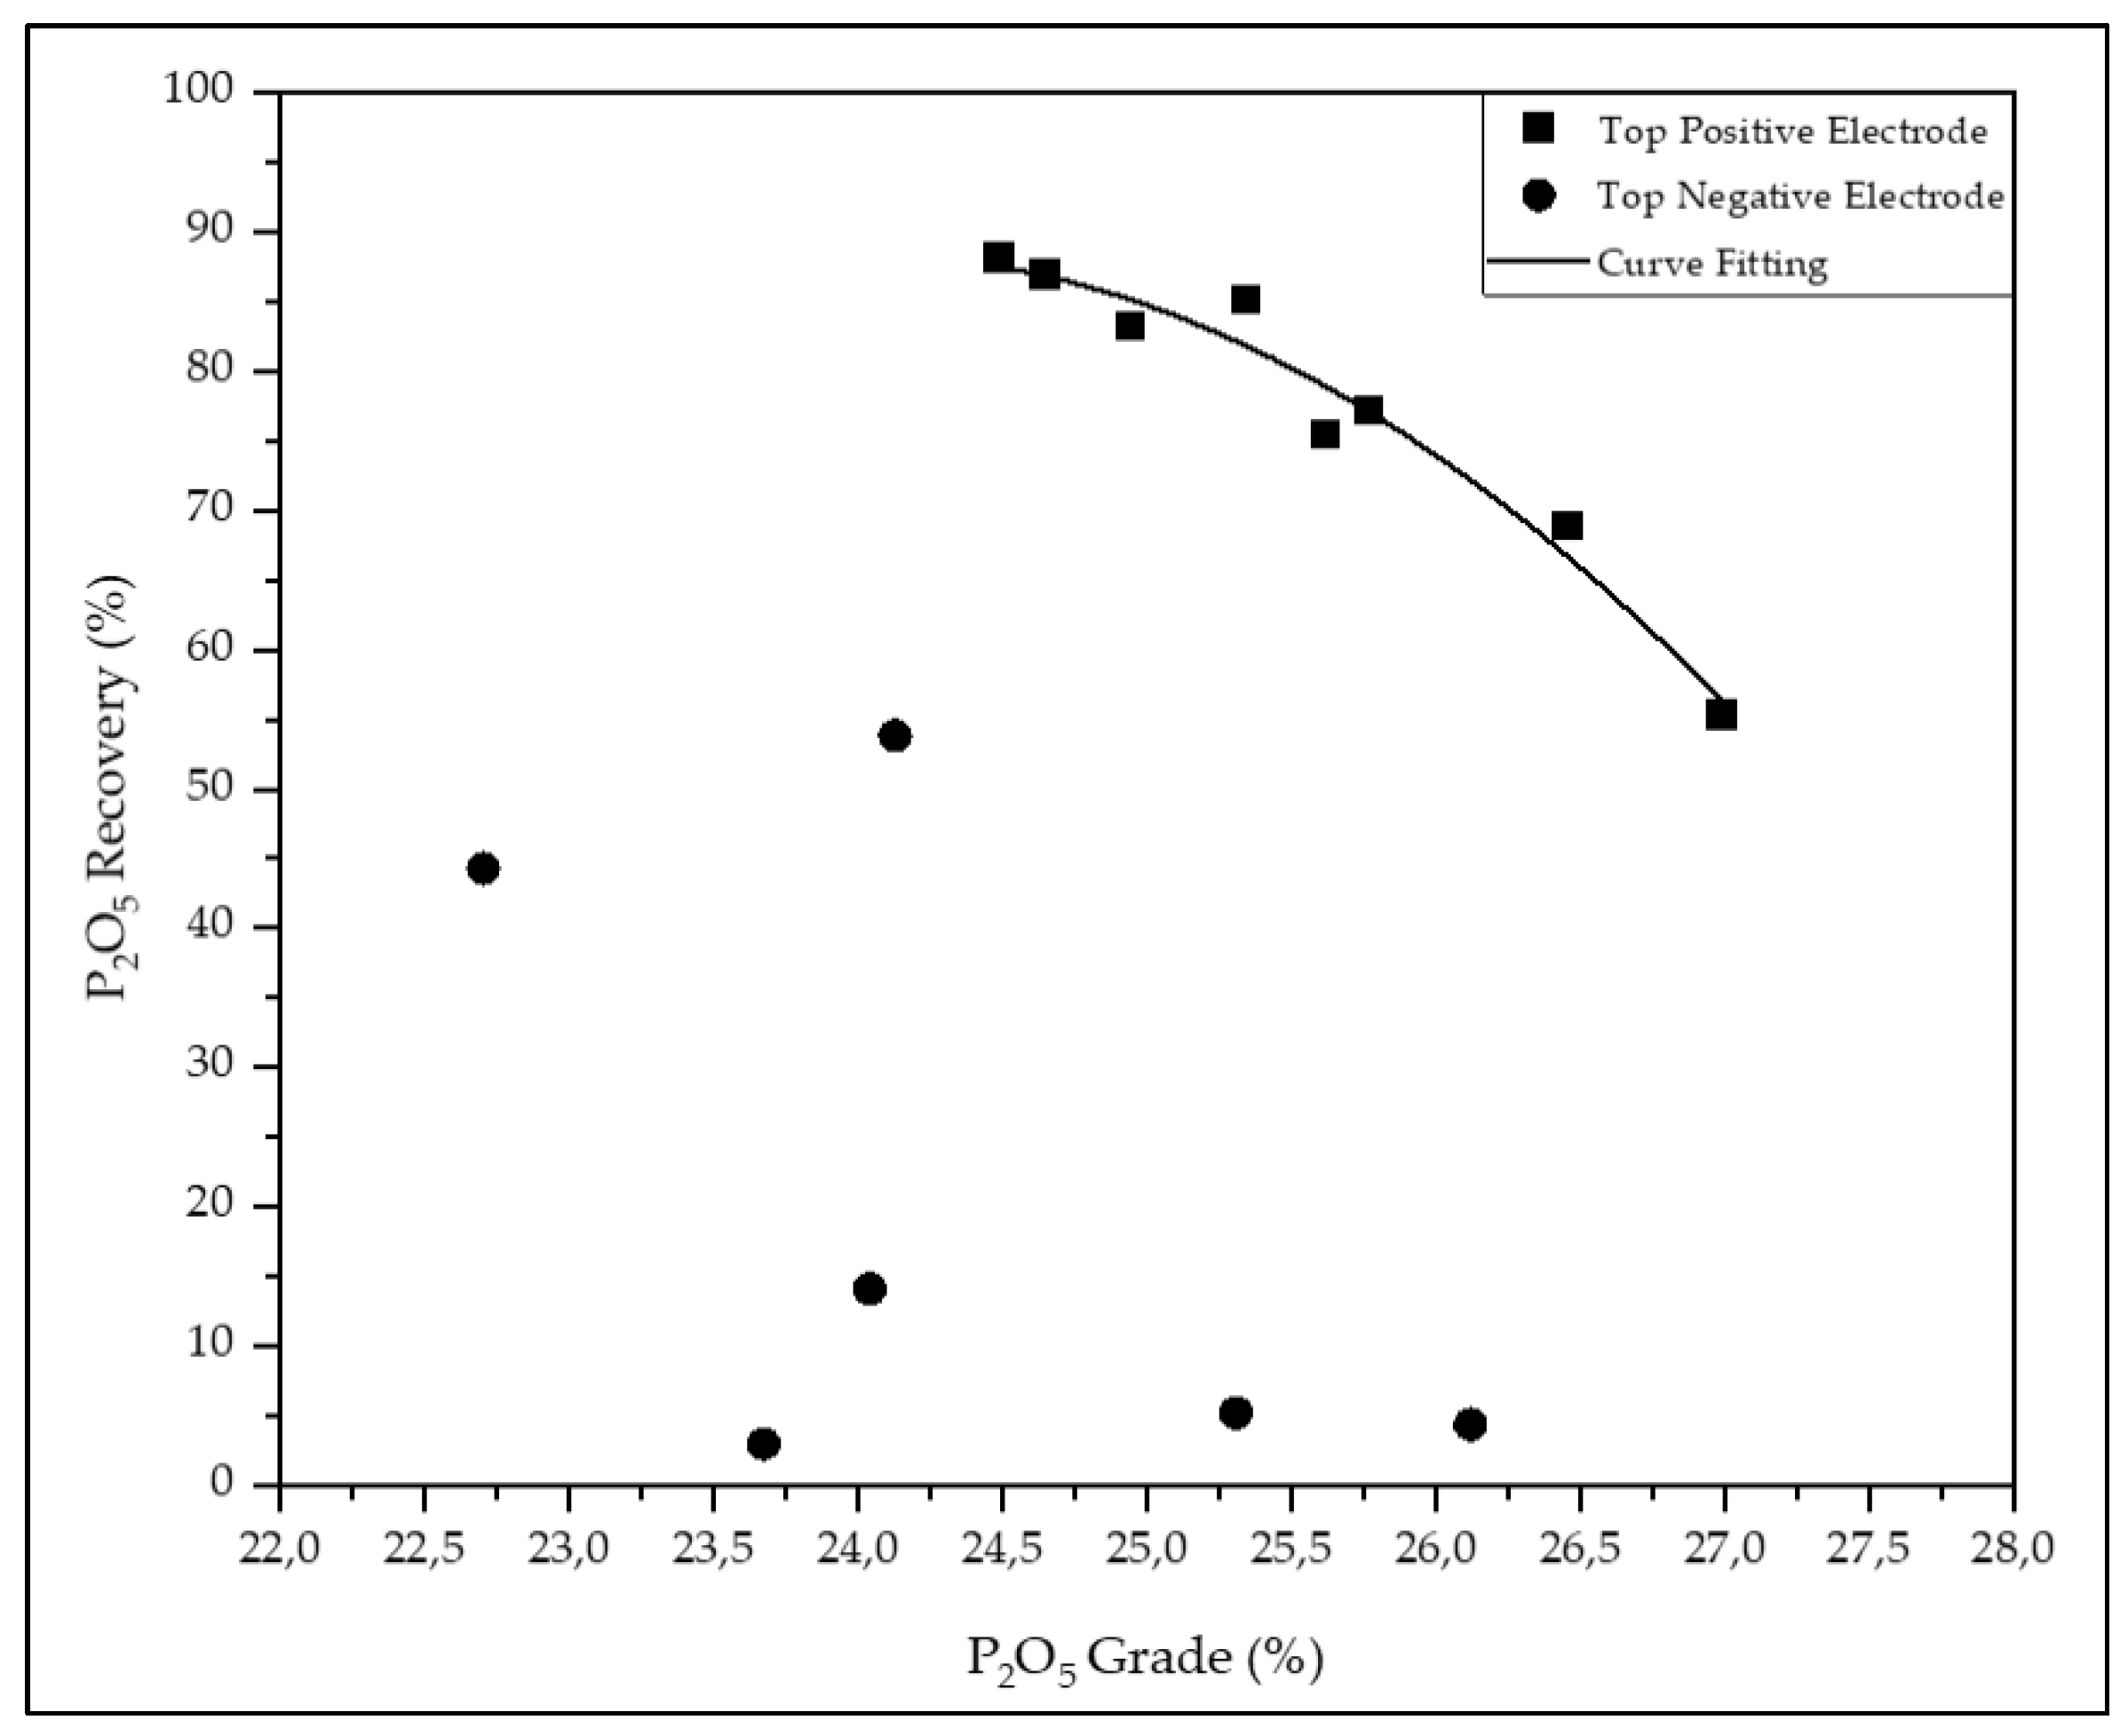
Figure 8.
Shultz Separation Efficiency between apatite and phyllosilicates, varying the polarity of the top electrode (positive x negative).
Figure 8.
Shultz Separation Efficiency between apatite and phyllosilicates, varying the polarity of the top electrode (positive x negative).
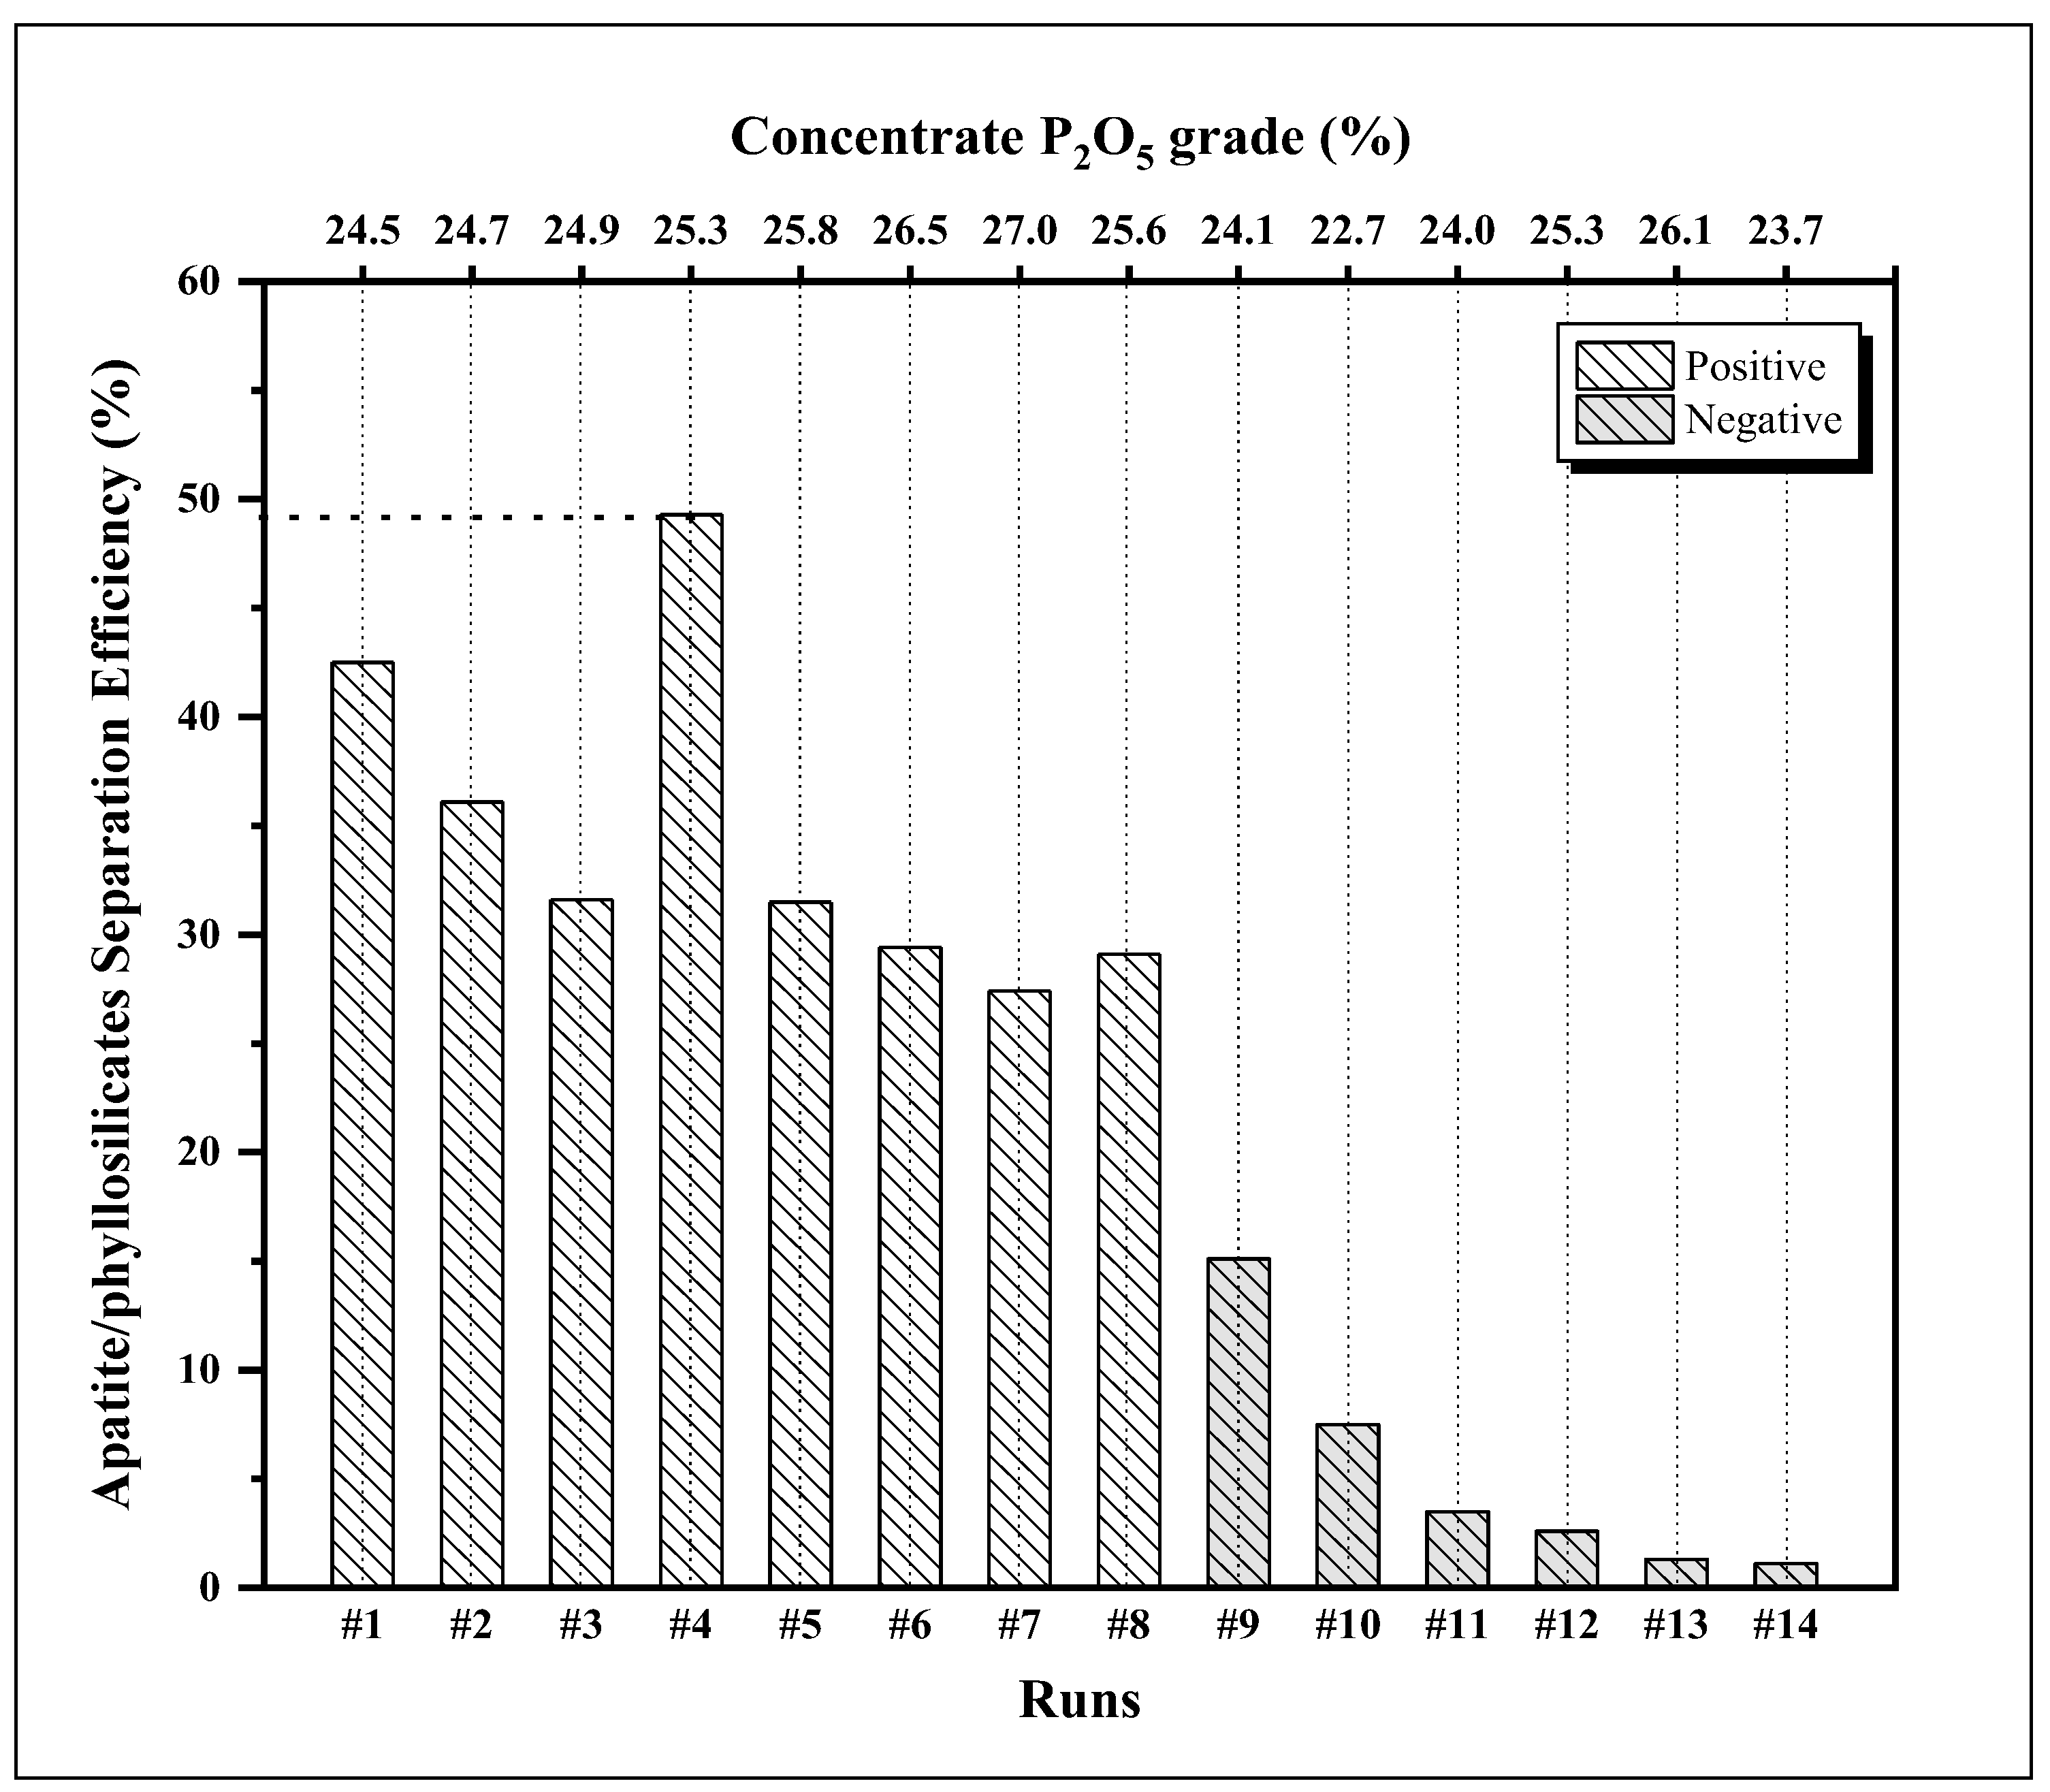
Figure 9.
Variation on top and bottom electrode current for different polarity configuration of rougher stage.
Figure 9.
Variation on top and bottom electrode current for different polarity configuration of rougher stage.
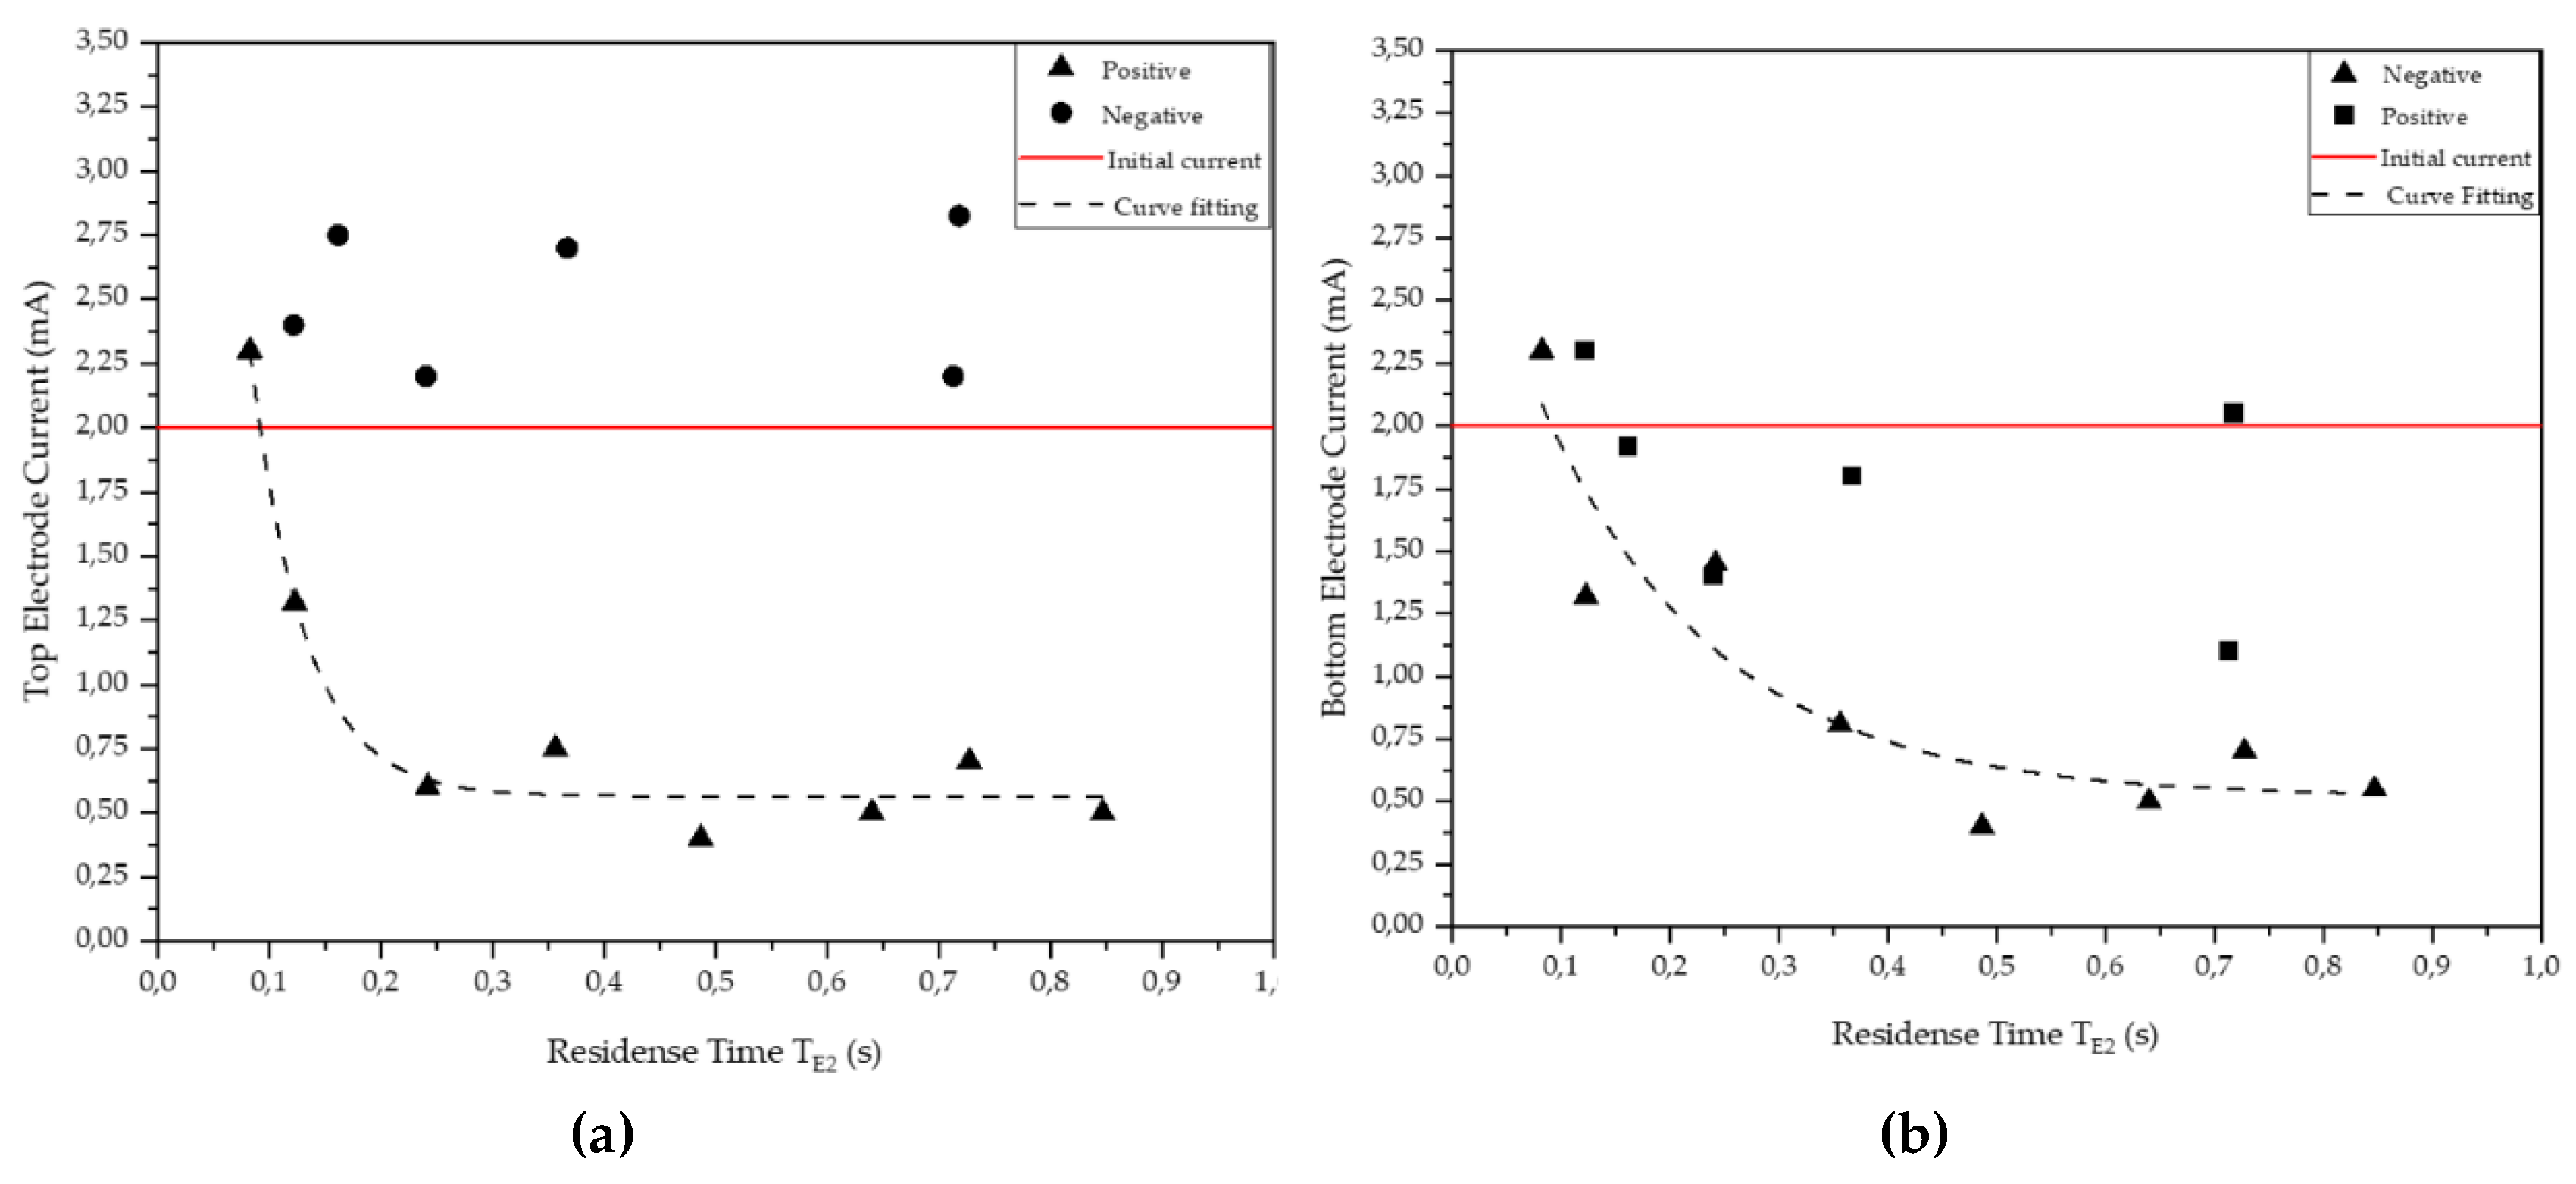
Figure 10.
P2O5 recovery in function of the residence time of the apatite (TE2) for the top positive electrode configuration, of the rougher stage.
Figure 10.
P2O5 recovery in function of the residence time of the apatite (TE2) for the top positive electrode configuration, of the rougher stage.
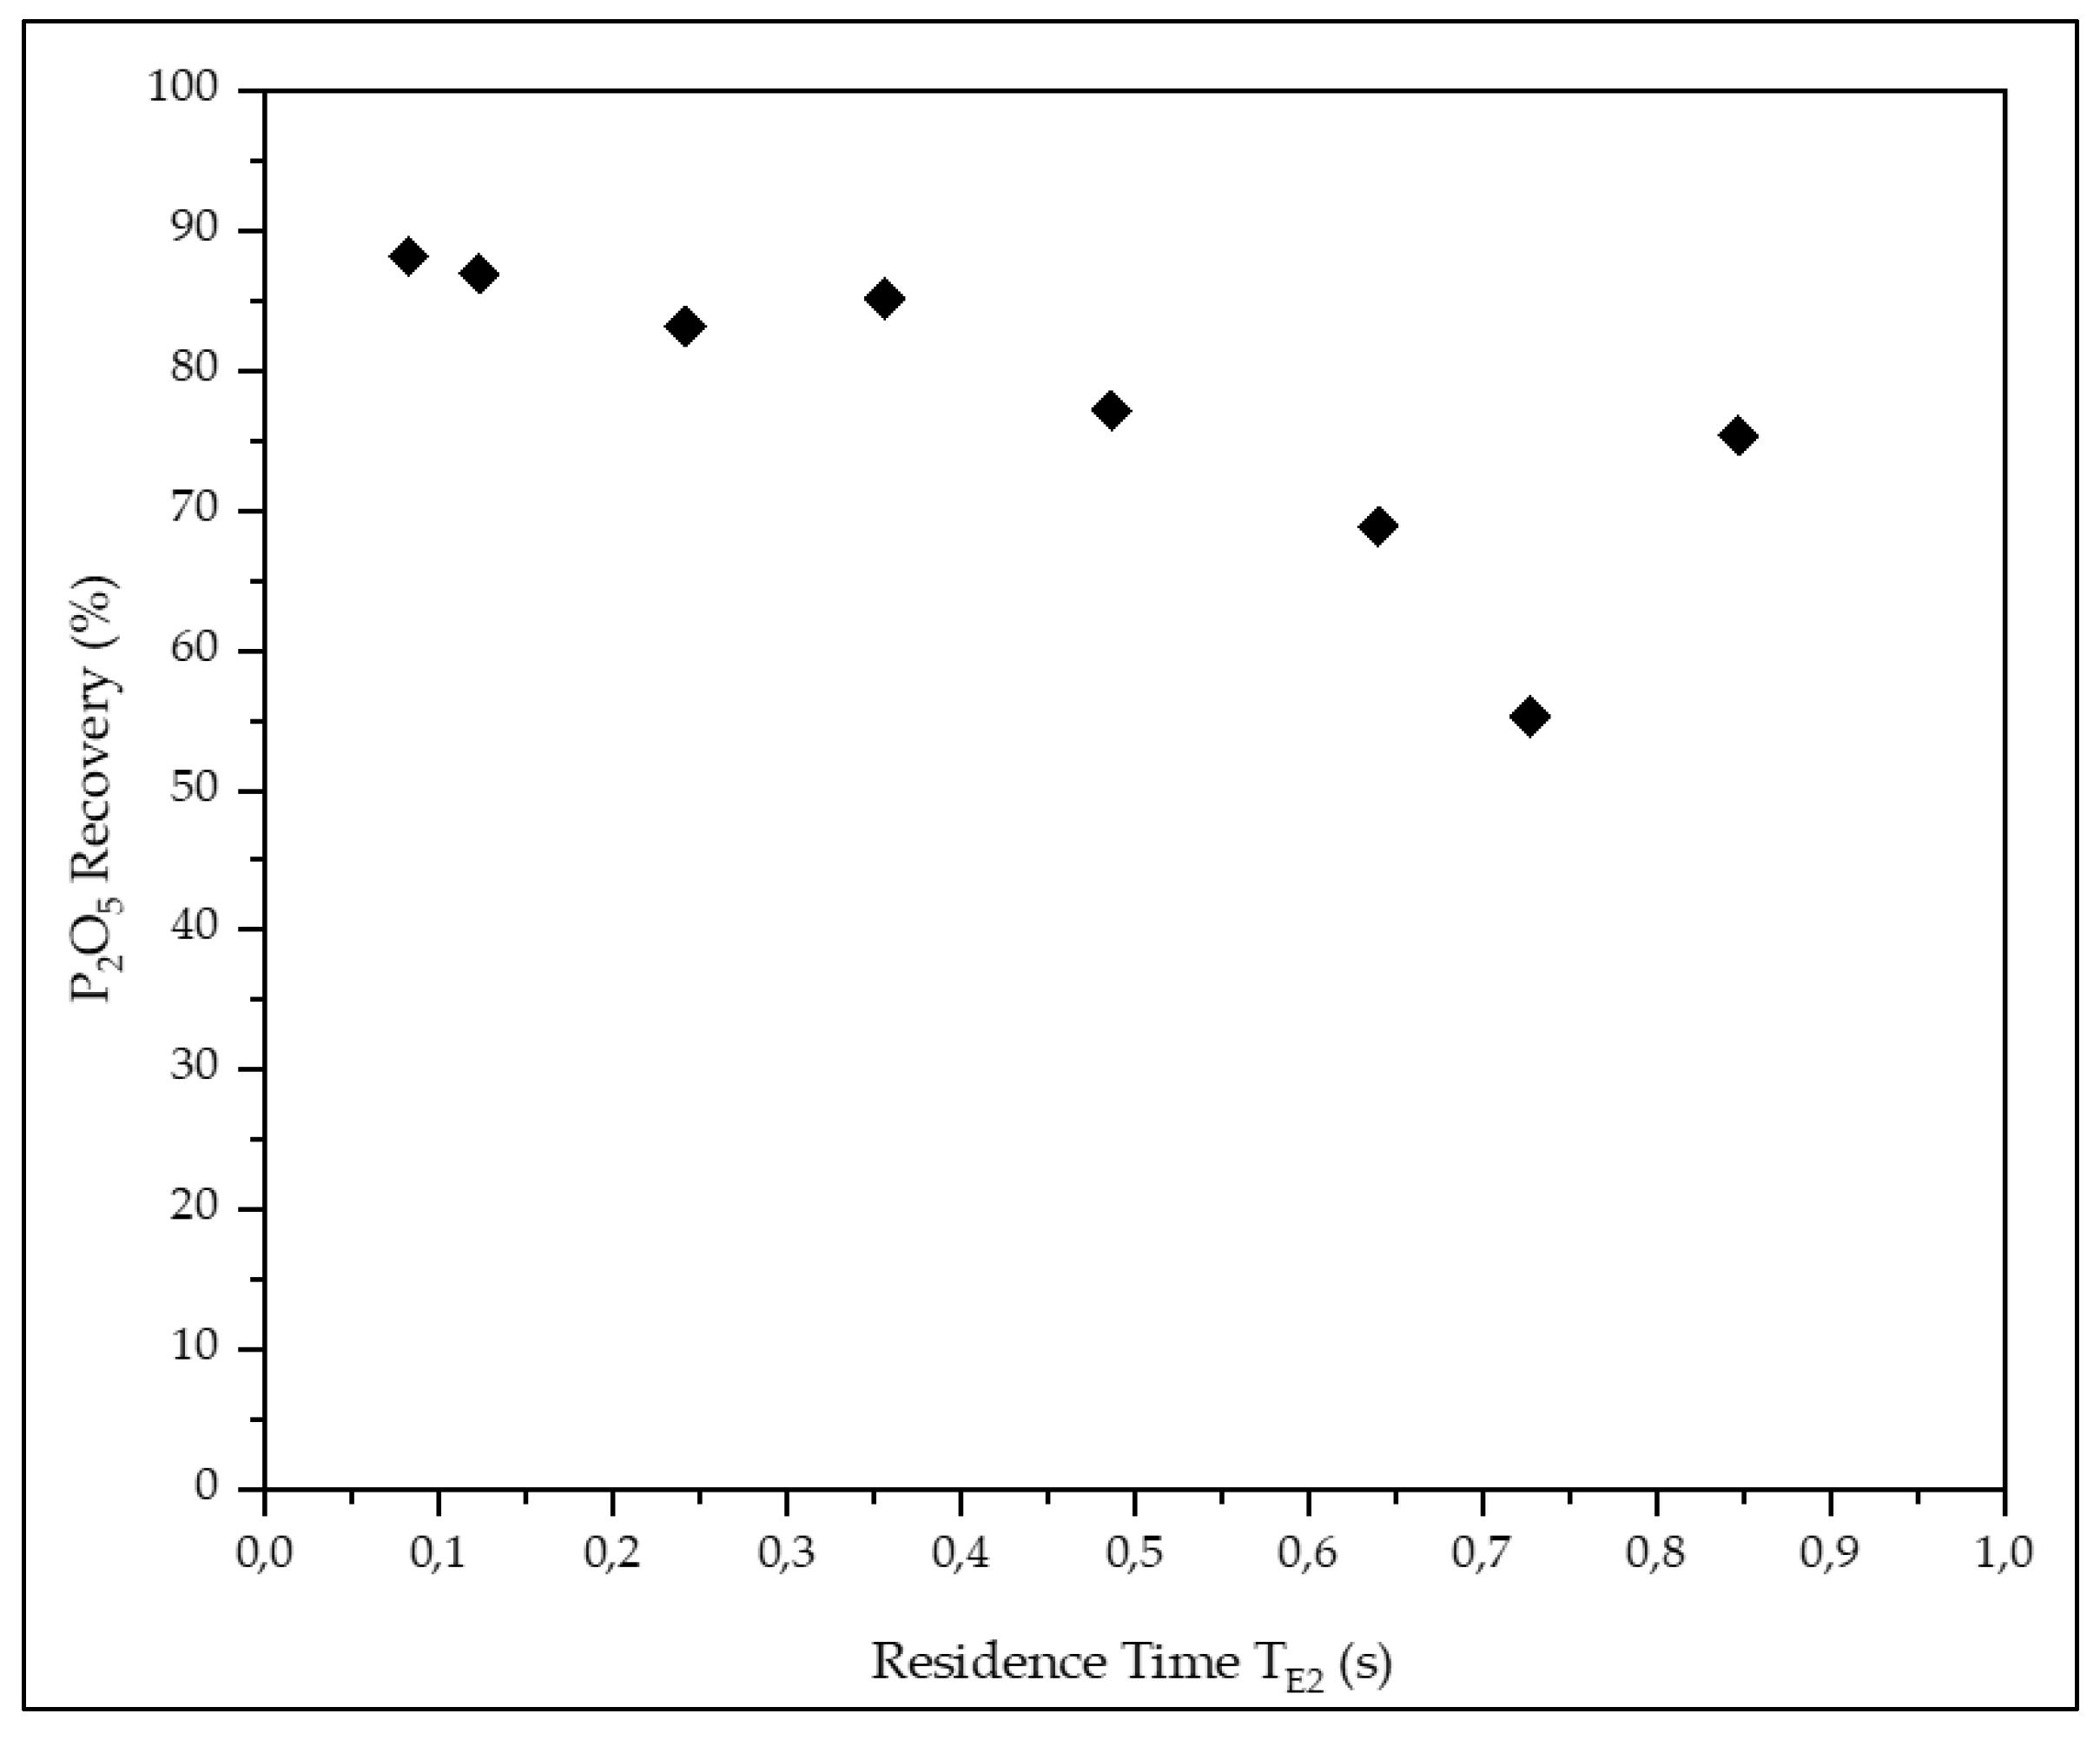
Figure 11.
P2O5 grade in function of the residence time of the apatite (TE2) for the top positive electrode configuration, of the cleaner stage.
Figure 11.
P2O5 grade in function of the residence time of the apatite (TE2) for the top positive electrode configuration, of the cleaner stage.
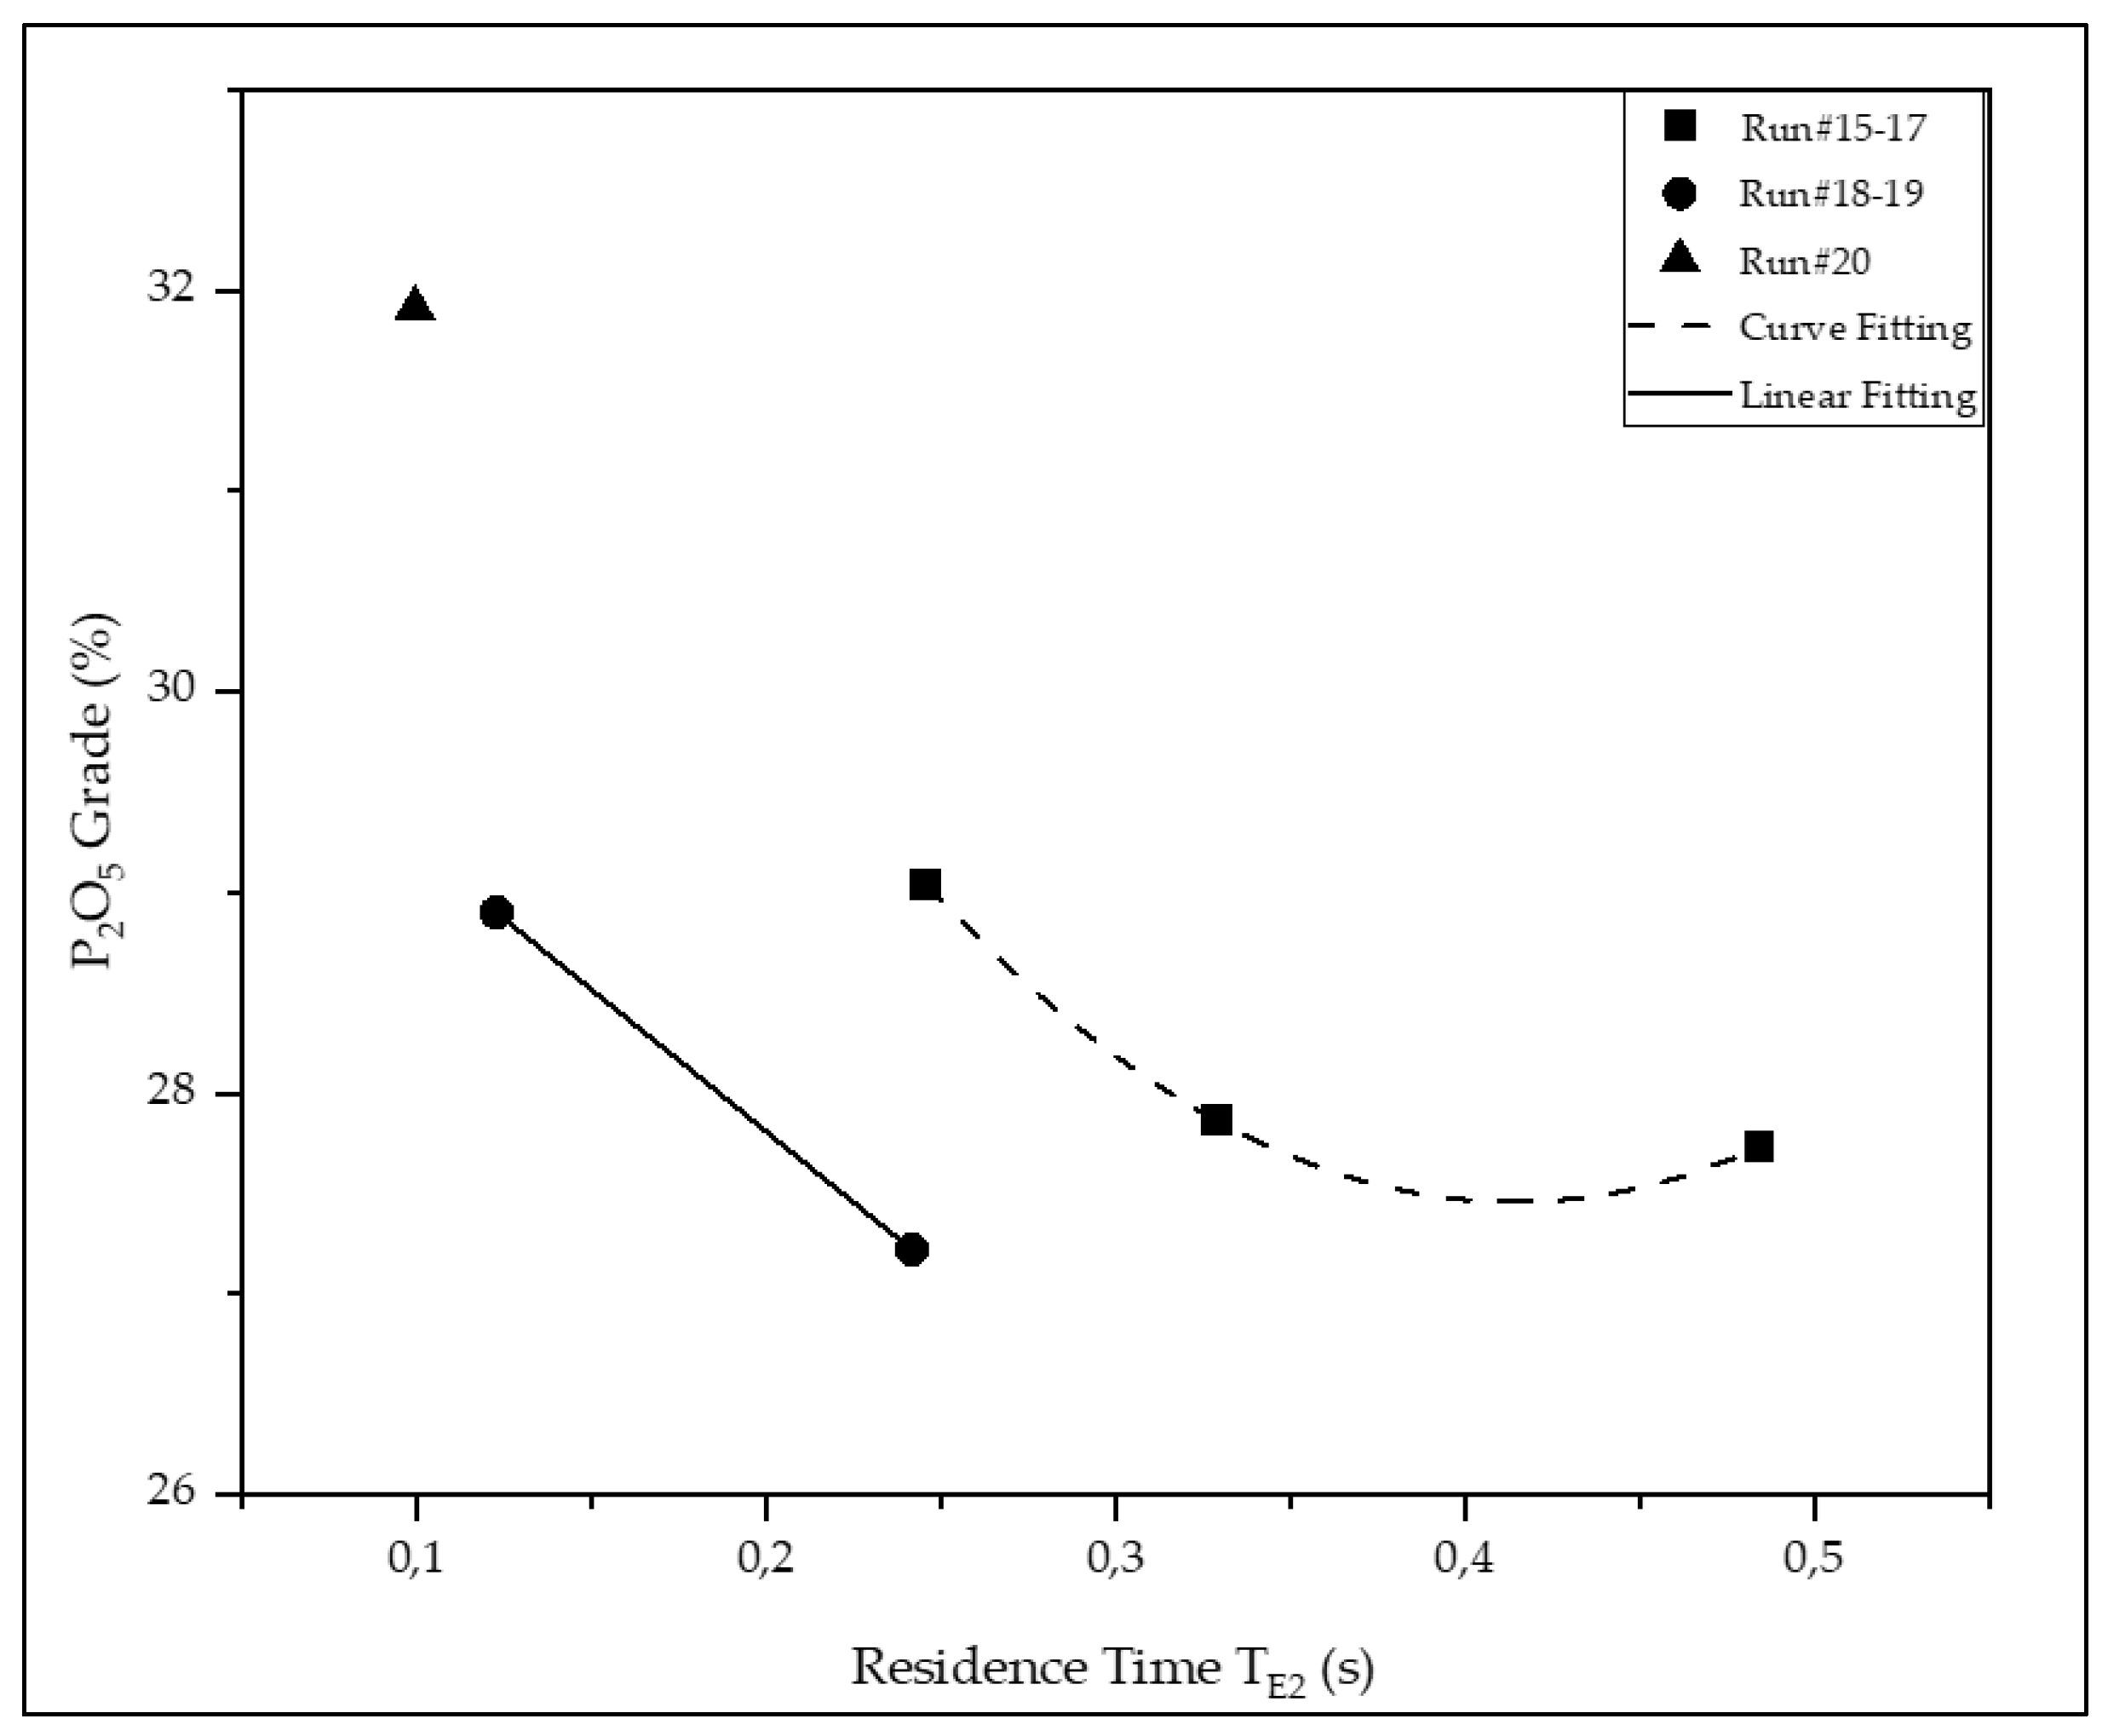

Table 1.
Froth flotation versus triboelectrostatic separation (TES).
| Attributes | Froth flotation [10] | TES [11,12,13,14] |
|---|---|---|
| Separating medium | Water | Air |
| Differentiating property | Wettability by water | Fermi level/work function |
| Variable that controls the differentiating property | Contact angle | Density and sign of the acquired surface charge. |
| Surface modification previous to separation | Conditioning with chemical reagents (collectors, frothers, modifiers). | Contact/friction between mineral/mineral, mineral/polymers, mineral/walls of equipment, assisted or not by gas adsorption and radiation. |
| Modus operandi of the mineral separation | Hydrophobic particles collide and adhere to air bubbles and float; Hydrophilic particles do not adhere to air bubbles and sink |
Negatively charged particles move to the positively charged electrode, vice-versa. |
Table 2.
Examples of triboelectric series developed for non-conductive minerals.
| Intensity and relative signs of the acquired charge | Triboelectrostatic Series | |
|---|---|---|
| Fraas [25] | Ferguson [24] | |
| ++++++++++++++ | Siderite | |
| ++++++++++++ | Olivine | |
| +++++++++++ | Andracite | |
| ++++++++++ | Apatite | Apatite |
| +++++++++ | Nepheline | Carbonates |
| ++++++++ | Magnesite | Monazite |
| +++++++ | Allanite | Titanomagnetite |
| +++++ | Staurolite | Ilmenite |
| ++++ | Beryl | Rutile |
| +++ | Grossularite | Leucoxene |
| ++ | Eudialyte | Magnetite/Hematite |
| + | Sphene | Spinel |
| - | Stilbite | Garnet |
| -- | Netafite | Staurolite |
| --- | Diopside | Altered Ilmenite |
| ---- | Cryolite | Goethite |
| ------ | Hornblende | Zircon |
| ------- | Monazite | Epidote |
| -------- | Chromite (Spinel) | Tremolite |
| --------- | Euxenite | Hydrous Silicates |
| ----------- | Scheelite | Aluminosilicates |
| ------------- | Microcline | Tourmaline |
| -------------- | Albite | Actinolite |
| --------------- | Quartz | Pyroxene |
| ----------------- | Rinodolite | Titanite |
| ------------------- | Actinolite | Feldspar |
| --------------------- | Hexagonite | Quartz |
| ----------------------- | Glauconite | |
Table 3.
Forces acting on a particle that settles in triboelectrostatic separators and their contribution towards the selectivity of the apatite/silicates separation.
Table 3.
Forces acting on a particle that settles in triboelectrostatic separators and their contribution towards the selectivity of the apatite/silicates separation.
| Forces | Cause | Effect | Contribution to the Selectivity |
|---|---|---|---|
| Electrostatic | Magnitude, density, and sign of mineral surface charge prior to separation [26]; Magnitude and polarity of the static field generated by the electrodes positioned within the separators [26,27]. |
Attractive/repulsive forces between mineral particles and the equipment’s electrodes [26,27]. | Different position of apatite versus silicates in the triboelectric series maintained by either Ferguson [24] or Fraas [25]. |
| Gravity | Volume (size) and specific gravity () of the particles involved in the separation [26,27]. | Larger, heavier particles settle more quickly than smaller, lighter ones despite their buoyancy [26,27]. | Apatite particles (>3,000 kg/m3) are denser than many silicates ( < 2,800 kg/m3) [29]. |
| Drag | Particles’ shape and air temperature [26,27]. | Particles of lower sphericity factor () settle at a lower rate than rounded particles [26,27,28]. | Apatite particles settle as rough tetrahedrons (0.62 < Ψ < 0.64), whereas mica and clay particles show a platy-shaped habit (Ψ < 0.3) [28]. |
Table 4.
Particle size distribution of the Testing Material (TM).
| Size Fractions | Mass (%) | |
|---|---|---|
| (mm) | Retained | Accumulated |
| +0.600 | 9.8 | 9.8 |
| -0.600 +0.500 | 10.3 | 20.1 |
| -0.500 +0.300 | 14.6 | 34.7 |
| -0.300 +0.210 | 17.3 | 52.0 |
| -0.210 +0.150 | 14.5 | 66.5 |
| -0.150 +0.074 | 16.7 | 83.2 |
| -0.074 | 16.8 | 100.0 |
| Total | 100.0 | - |
Table 5.
Independent variables of TBS.
| Variables | Units | Typical range |
|---|---|---|
| Top electrode polarity | - | Positive/negative |
| Electrode voltage | 6 (*) | |
| Belt speed (S) | 4.6-19.8 | |
| Feed port | - | 1, 2 and 3 |
| Electrode gap (G) | 1.0-1.5 (x10-2) | |
| Mass feed rate of solids (F) | 0.13-1.25 |
(*) Constant due to results from exploratory studies.
Table 6.
Secondary variables of TBS.
| Secondary variables | Units | Assessment |
|---|---|---|
| Cross sectional area (A) | Based on electrode gap (G) | |
| Solids volumetric flowrate (Q) | Equation 2 | |
| Solids flux velocity (V) | Equation 3 | |
| Total flux velocity () | Equation 4 | |
| Residence time (T) | s | Equation 5 |
| Electric current on the electrodes (I) | mA | Current meter (*) |
(*) Informed by the control panel.
Table 7.
Distance traveled by particles of gangue minerals (LE1) and apatite (LE2) from each feed port.
Table 7.
Distance traveled by particles of gangue minerals (LE1) and apatite (LE2) from each feed port.
| Feed Port | LE1 (m) | LE2 (m) |
|---|---|---|
| 1 | 4.58 | 1.53 |
| 2 | 3.05 | 3.05 |
| 3 | 1.53 | 4.58 |
Table 8.
Operational conditions used to perform pilot tests.
| Runs | Duty | Independent variables | Secondary variables | |||||||||
| Feed Port | Top Electrode Polarity |
Feed Rate (kg/s) |
Gap (x10-2 m) |
Belt speed (m/s) |
Solids flowrate (x 10-4 m3/s) |
Total flux velocity (m/s) |
Time to reach E2 (s) (*) | Time to reach E1 (s) (**) | Top Electrode Current (mA) |
Bottom Electrode Current (mA) |
||
| #1 | Rougher | 1 | + | 0.56 | 1.52 | 18.3 | 1.9 | 18.4 | 0.08 | 0.25 | 2.3 | 2.3 |
| #2 | Rougher | 1 | + | 0.56 | 1.32 | 12.2 | 1.9 | 12.4 | 0.12 | 0.37 | 1.3 | 1.3 |
| #3 | Rougher | 1 | + | 0.47 | 1.21 | 6.1 | 1.6 | 6.3 | 0.24 | 0.73 | 0.6 | 1.5 |
| #4 | Rougher | 2 | + | 0.44 | 1.25 | 8.4 | 1.5 | 8.6 | 0.36 | 0.36 | 0.8 | 0.8 |
| #5 | Rougher | 2 | + | 0.44 | 1.27 | 6.1 | 1.5 | 6.3 | 0.49 | 0.49 | 0.4 | 0.4 |
| #6 | Rougher | 2 | + | 0.39 | 1.14 | 4.6 | 1.3 | 4.8 | 0.64 | 0.64 | 0.5 | 0.5 |
| #7 | Rougher | 3 | + | 0.39 | 1.14 | 6.1 | 1.3 | 6.3 | 0.73 | 0.24 | 0.7 | 0.7 |
| #8 | Rougher | 3 | + | 0.44 | 1.14 | 5.2 | 1.5 | 5.4 | 0.85 | 0.28 | 0.5 | 0.6 |
| #9 | Rougher | 1 | - | 0.56 | 1.08 | 12.2 | 1.9 | 12.5 | 0.12 | 0.37 | 2.4 | 2.3 |
| #10 | Rougher | 1 | - | 0.56 | 1.13 | 9.1 | 1.9 | 9.4 | 0.16 | 0.49 | 2.8 | 1.9 |
| #11 | Rougher | 1 | - | 0.56 | 1.20 | 6.1 | 1.9 | 6.3 | 0.24 | 0.72 | 2.2 | 1.4 |
| #12 | Rougher | 3 | - | 0.56 | 1.14 | 12.2 | 1.9 | 12.5 | 0.37 | 0.12 | 2.7 | 1.8 |
| #13 | Rougher | 3 | - | 0.56 | 1.08 | 6.1 | 1.9 | 6.4 | 0.71 | 0.24 | 2.2 | 1.1 |
| #14 | Rougher | 3 | - | 0.56 | 1.14 | 6.1 | 1.9 | 6.4 | 0.72 | 0.24 | 2.8 | 2.1 |
| #15 | Cleaner | 1 | + | 0.22 | 1.33 | 15.2 | 0.7 | 15.3 | 0.10 | 0.30 | 0.6 | 0.6 |
| #16 | Cleaner | 1 | + | 0.56 | 1.27 | 12.2 | 1.9 | 12.4 | 0.12 | 0.37 | 0.5 | 0.5 |
| #17 | Cleaner | 1 | + | 0.56 | 1.27 | 6.1 | 1.9 | 6.3 | 0.24 | 0.73 | 1.7 | 1.8 |
| #18 | Cleaner | 2 | + | 0.56 | 1.27 | 12.2 | 1.9 | 12.4 | 0.25 | 0.25 | 0.6 | 0.6 |
| #19 | Cleaner | 2 | + | 0.31 | 1.27 | 9.1 | 1.0 | 9.3 | 0.33 | 0.33 | 0.8 | 0.7 |
| #20 | Cleaner | 2 | + | 0.48 | 1.23 | 6.1 | 1.6 | 8.3 | 0.48 | 0.48 | 1.5 | 1.5 |
(*) Concentrate (**) Tailings.
Table 9.
Chemical composition of the Testing Material (TM) by size.
| Size Fractions (mm) |
Mass (%) | Content of analytes (%) | ||||||||||
|---|---|---|---|---|---|---|---|---|---|---|---|---|
| Retained | Accum. (*) | P2O5 | CaO | SiO2 | Al2O3 | Fe2O3 | MgO | TiO2 | K2O | LOI | CaO:P2O5 | |
| +0.30 | 34.7 | 34.7 | 25.1 | 33.8 | 15.4 | 4.35 | 4.79 | 6.76 | 0.45 | 1.18 | 4.08 | 1.35 |
| -0.30+0.21 | 17.3 | 52.0 | 26.5 | 35.5 | 14.1 | 3.81 | 5.01 | 5.56 | 0.49 | 1.03 | 3.73 | 1.34 |
| -0.21+0.15 | 14.5 | 66.5 | 27.3 | 36.6 | 12.9 | 3.40 | 5.29 | 4.95 | 0.65 | 0.93 | 3.51 | 1.34 |
| -0.15+0.074 | 16.7 | 83.2 | 25.0 | 33.9 | 15.1 | 4.01 | 7.09 | 5.26 | 0.51 | 0.99 | 4.12 | 1.36 |
| -0.74 | 16.8 | 100.0 | 11.4 | 16.3 | 27.4 | 8.51 | 14.6 | 7.39 | 0.71 | 1.34 | 7.67 | 1.43 |
| Head (TM) | 100.0 | - | 22.9 | 31.0 | 17.4 | 4.99 | 6.81 | 6.50 | 0.48 | 1.16 | 4.62 | 1.35 |
| Total Calc. | 100.0 | - | 23.3 | 31.6 | 16.8 | 4.76 | 6.94 | 6.15 | 0.54 | 1.11 | 4.55 | 1.35 |
(*) Mass accumulated above.
Table 10.
Mineralogical composition of the Testing Material (TM) by size.
| Mineral species | Content (%) | |
|---|---|---|
| Fraction +0.600mm | Fraction -0.600 +0.074mm | |
| Apatite | 61 | 60 |
| Phyllosilicates | 32 | 30 |
| Feldspar | 2.5 | 2.5 |
| Quartz | 0.8 | 1.2 |
| Pyroxene + amphibole | 1.2 | 2.0 |
| Iron oxides (*) | 1.1 | 1.7 |
| Carbonates (**) | 1.1 | 1.1 |
| Titanium oxides (***) | 0.1 | 0.5 |
| Psilomelane | 0.1 | 0.2 |
| Others | 0.1 | 0.8 |
(*) Magnetite, hematite, goethite; (**) Calcite, dolomite. (***) Ilmenite, anatase.
Table 11.
Partition of the main analytes that make up the Testing Material (TM).
| Minerals | P2O5 | CaO | SiO2 | Al2O3 | Fe2O3 | MgO | TiO2 | K2O |
|---|---|---|---|---|---|---|---|---|
| Apatite | 100 | 97 | ||||||
| Phyllosilicates | <1 | 1 | 78 | 85 | 68 | 95 | 56 | 86 |
| Feldspar | 9 | 13 | 13 | |||||
| Quartz | 7 | |||||||
| Other Silicates | 1 | 5 | 2 | 4 | 4 | <1 | ||
| Hematite/magnetite | <1 | 23 | <1 | 8 | ||||
| Goethite | 3 | |||||||
| Ilmenite | 3 | 31 | ||||||
| Psilomelane | ||||||||
| Others | <1 | <1 | 1 | 1 | <1 | <1 | 5 |
Table 12.
Performance of triboelectrostatic separation experiments carried out in the rougher stage.
Table 12.
Performance of triboelectrostatic separation experiments carried out in the rougher stage.
| Runs | Concentrate composition (%) | Recovery (%) | ||||||
|---|---|---|---|---|---|---|---|---|
| P2O5 | SiO2 | Fe2O3 | Al2O3 | MgO | Mass | P2O5 | MgO | |
| #1 | 24.5 | 11.0 | 6.18 | 3.78 | 3.75 | 81.7 | 88.1 | 45.6 |
| #2 | 24.7 | 11.4 | 6.20 | 3.86 | 4.16 | 80.2 | 86.9 | 50.8 |
| #3 | 24.9 | 10.9 | 7.33 | 3.84 | 3.51 | 76.9 | 83.2 | 51.6 |
| #4 | 25.3 | 10.9 | 5.85 | 3.52 | 3.37 | 75.3 | 85.1 | 35.8 |
| #5 | 25.8 | 11.2 | 5.82 | 3.60 | 3.33 | 68.7 | 77.1 | 45.8 |
| #6 | 26.5 | 10.6 | 5.61 | 3.41 | 4.22 | 59.3 | 68.9 | 39.5 |
| #7 | 27.0 | 11.0 | 5.58 | 3.70 | 3.83 | 46.9 | 55.3 | 27.9 |
| #8 | 25.6 | 11.0 | 5.92 | 3.54 | 3.56 | 65.1 | 75.4 | 46.3 |
| #9 | 24.1 | 9.8 | 8.08 | 3.89 | 3.14 | 48.0 | 53.8 | 38.7 |
| #10 | 22.7 | 10.5 | 9.41 | 4.13 | 4.04 | 41.3 | 44.3 | 36.8 |
| #11 | 24.0 | 10.1 | 8.85 | 3.76 | 3.36 | 12.9 | 14.1 | 10.6 |
| #12 | 25.3 | 9.0 | 7.62 | 3.08 | 2.42 | 4.5 | 5.2 | 2.6 |
| #13 | 26.1 | 10.4 | 6.70 | 3.76 | 3.67 | 3.7 | 4.4 | 3.1 |
| #14 | 23.7 | 10.4 | 8.61 | 4.11 | 3.66 | 2.6 | 3.0 | 1.9 |
Table 13.
Chemical composition of the rougher concentrate yielded by twelve tests reproducing the experimental conditions that characterize run#4.
Table 13.
Chemical composition of the rougher concentrate yielded by twelve tests reproducing the experimental conditions that characterize run#4.
| Analytes | s | (*) | |
|---|---|---|---|
| P2O5 | 25.8 | 0.4 | 1.6 |
| SiO2 | 11.4 | 0.5 | 4.8 |
| Al2O3 | 4.0 | 0.8 | 5.0 |
| MgO | 3.8 | 0.3 | 8.8 |
(*)
Table 14.
Performance of triboelectrostatic separation experiments carried out in the cleaner stage.
Table 14.
Performance of triboelectrostatic separation experiments carried out in the cleaner stage.
| Runs | Concentrate composition (%) | Recovery (%) | ||||||
|---|---|---|---|---|---|---|---|---|
| P2O5 | SiO2 | Fe2O3 | Al2O3 | MgO | Mass | P2O5 | MgO | |
| #15 | 29.0 | 8.62 | 4.62 | 2.96 | 2.84 | 66.5 | 81.4 | 55.3 |
| #16 | 27.9 | 10.16 | 5.43 | 3.28 | 2.42 | 67.3 | 76.7 | 41.8 |
| #17 | 27.7 | 10.34 | 5.19 | 3.14 | 3.06 | 62.3 | 71.0 | 50.2 |
| #18 | 28.9 | 9.78 | 4.81 | 2.99 | 2.89 | 72.8 | 87.6 | 59.6 |
| #19 | 27.2 | 9.51 | 5.10 | 3.14 | 2.99 | 63.5 | 71.6 | 55.1 |
| #20 | 31.9 | 8.89 | 3.94 | 2.29 | 1.64 | 20.8 | 33.2 | 12.9 |
Table 15.
Summary of the triboelectrostatic separation results compared with Fosnor’s results.
| Item | Chemical composition (%) | Overall recovery (%) | ||||||
|---|---|---|---|---|---|---|---|---|
| P2O5 | SiO2 | Fe2O3 | Al2O3 | MgO | Mass | P2O5 | MgO | |
| Feed | 22.9 | 17.4 | 6.81 | 4.99 | 6.50 | - | - | - |
| Run#4 (*) | 25.3 | 10.9 | 5.85 | 3.52 | 3.37 | 75.3 | 85.1 | 35.8 |
| Run#15 (*) | 29.0 | 8.62 | 4.62 | 2.96 | 2.84 | 66.5 | 81.4 | 55.3 |
| Run#18 (*) | 28.9 | 9.78 | 4.81 | 2.99 | 2.89 | 72.8 | 87.6 | 59.6 |
| Total Option 1(**) | 29.0 | 8.62 | 4.62 | 2.96 | 2.84 | 50.0 | 69.3 | 19.8 |
| Total Option 2 (***) | 28.9 | 9.78 | 4.81 | 2.99 | 2.89 | 54.8 | 74.5 | 21.3 |
| Fosnor (****) | 29.5 | 9.51 | 4.94 | 3.13 | 1.98 | 36.3 | 55.7 | 27.9 |
(*) Concentrate product; (**) Considering the performance of run#4 and run#15; (***) Considering the performance of run#4 and run#18; (****) Considering results of high-intensity magnetic separators.
Disclaimer/Publisher’s Note: The statements, opinions and data contained in all publications are solely those of the individual author(s) and contributor(s) and not of MDPI and/or the editor(s). MDPI and/or the editor(s) disclaim responsibility for any injury to people or property resulting from any ideas, methods, instructions or products referred to in the content. |
© 2025 by the authors. Licensee MDPI, Basel, Switzerland. This article is an open access article distributed under the terms and conditions of the Creative Commons Attribution (CC BY) license (http://creativecommons.org/licenses/by/4.0/).
Copyright: This open access article is published under a Creative Commons CC BY 4.0 license, which permit the free download, distribution, and reuse, provided that the author and preprint are cited in any reuse.


