
Submitted:
14 August 2025
Posted:
15 August 2025
You are already at the latest version
Abstract
Heart rate (HR) monitoring is a practical method for assessing internal load (IL). However, it remains unclear that from which age group HR would be appropriate predictor of IL considering the relationship with external load (EL). Thus, this study aims to evaluate the relevance and applicability of HR monitoring by exploring the relationship between EL and IL among U16 soccer players. EL was measured using global positioning system (GPS) data, while IL was assessed through training impulse (TRIMP), Edward's TRIMP, HR exertion, rate of perceived exertion (RPE) and session-RPE (s-RPE). Nineteen (N=19) male footballers from an elite football academy participated, with data collected from 50 training sessions and 11 matches. In the analysis of the training sessions, TRIMP demonstrated a near-perfect correlation with total distance (TD) (p < 0.001) and eTRIMP correlated strongly with TD (r = 0.82) and player load (r = 0.79). HR exertion also correlated significantly with TD, medium-speed running, decelerations, inertial movement analysis (IMA) events, and player load (p < 0.001). In matches, large correlation was observed between TRIMP and TD (r = 0.73), while the strongest correlation was with RPE and s-RPE with TD and PL (p < 0.001). Furthermore, TD emerged as the best GPS-derived predictor of both TRIMP and HR exertion in training contexts. These findings provide evidence for the validity and usability of heart rate-based and RPE-based measures to indicate IL in U16 soccer players. Future research should focus on contextual factors in exploring the relationship between EL and IL.
Keywords:
GPS
; heart rate
; monitoring
; RPE
; training load
; youth soccer
1. Introduction
Training load (TL) has been defined as the physiological and psychological stress experienced by an individual [1] and is used to elicit the desired training response by manipulating training variables [2]. TL can be further divided into external load (EL) and internal load (IL) [3]. In soccer, EL refers to the physical movements of a player, which can be expressed in various running speed zones, accelerations, and decelerations [4,5], while IL encompasses the psycho-physiological stress imposed on a player [6].
The global positioning system (GPS) is being recognized as a standard device for quantifying and monitoring EL in soccer [7] and provides reliable locomotor TL variables. The use of integrated microtechnology, commonly known as inertial measurement units (IMUs) provides mechanical TL variables derived from a tri-axial accelerometer, magnetometer and gyroscope [8]. The current challenge is to identify the relevant GPS-based variables in terms of TL regarding a specific sport. Based on scientific evidence and citations, it has been suggested to use total distance, high-speed running, sprint running, accelerations, decelerations, and player load in soccer [9,10,11,12]. Nowadays researchers use both volume and intensity parameters, to precisely determine players' EL [13,14].
Conversely, heart rate (HR) serves as an individually based, yet objectively measured [15] indicator of IL, offering valid and reliable feedback on players' physiological responses [16] during both training sessions and matches [17]. However, compared with adults for young soccer players, the natural growth and maturation of the heart is an ongoing process, making it challenging to accurately determine their internal TL [18]. To record HR a wearable technology is required [19], therefore in soccer for monitoring this non-invasive method is universally employed [20]. Interestingly, commercially available photoplethysmography-based devices (sports watches) are not allowed the field; instead, ECG-based heart rate sensors have become prevalent in soccer. Previous studies have examined heart rate data using TRIMP (total duration multiplied by average heart rate), Banister's TRIMP [21], and Edward's TRIMP [22] equations for field-based training and matches [23,24]. However, Banister's TRIMP is limited by the difficulty of accurately measuring resting HR [25], as players arrive on the field in an elevated physiological and psychological state. Furthermore, it was found that HR measurements could be inadequate to determine IL during very-high intensity training [26]. Instead, it is recommended to use Edwards' TRIMP, which provides a more accurate representation of TL [19,24,27] by considering exercise intensity.
Additionally, the rating of perceived exertion (RPE) and session-RPE (s-RPE) methods have been widely employed in soccer to describe the individual perception of IL [14,28,29,30]. Previous research has reported moderate to very large correlations between Edward's TRIMP and s-RPE, suggesting their validity and reliability [24,31].
In elite soccer, GPS and HR monitoring technologies are commonly used together to assess EL and IL [32], representing the cumulative exposure of each player to training and competition [33]. However, this topic has not been investigated in youth soccer, and the appropriate starting age for monitoring has yet to be defined. Therefore, the primary aim of this article is to explore the feasibility of tracking heart rate from the U16 age group in soccer by examining the relationship between HR-based metrics, GPS-derived variables with RPE and s-RPE data. We also sought to identify GPS variables that could predict HR values in trainings.
2. Materials and Methods
2.1. Procedure
A total of 50 field-based training sessions and 11 matches were conducted during the study, resulting in over 534 observations (465 training, 69 match). We have intentionally focused on the competition period for our data collection, as training adaptation could otherwise influence the results. We only considered training session data for weeks with also at least one match. The training sessions were performed on weekdays at the same time of the day, roughly between 15:30 and 17:00, at least four times a week on artificial pitches. During both training sessions and matches, GPS-derived and HR-based data were collected. Warm-up session data, which lasted approximately ten minutes before ball training, were also included in the analysis. Additionally, training sessions that occurred indoors were excluded due to satellite connection errors, which may affect the reliability of the GPS-based variables.
The training program consisted of both technical and tactical components. The warm-up followed the FIFA 11+ protocol [34] and was included in the data analysis alongside ball training, while the cool-down period was excluded. The microcycle structure was defined as a weekly cycle within an annual program [35]. Training days were referenced relative to match day (MD±), in accordance with previous literature [36]. All teams had rest days on MD-6 and MD+1. MD-5 and MD+2 were designated as recovery sessions that also included tactical development. On MD-4 and MD+3, the training focus was on small-sided games (e.g., 1v1, 2v2, 3v3) to enhance speed and reactive agility. MD-3 targeted strength-endurance through large-sided games with and without specific constraints (e.g., free play). MD-2 emphasized technical and tactical preparations specific based on the upcoming opponent. MD-1 served as an activation day with neuromuscular focus and reduced training load. Additionally, a 30-minute strength and conditioning session was implemented on Mondays, Tuesdays, and Thursdays prior to ball training.
2.2. Participants
Nineteen (N = 19) male academy soccer players (age 15.41 ± 0.37 years, age at peak height velocity 14.42 ± 0.40 years, maturity offset 1.40 ± 0.53 years, height 175.30 ± 7.18 cm, body mass 61.73 ± 5.23 kg; all measurements are mean ± standard deviation) participated in this study. Only outfield players who attended 80% of training sessions and played at least 60 consecutive minutes in a match [37] were included. Another necessary exclusion criterion was that only participants with no known injuries during the study were included. Goalkeepers were not included in the present study due to the lack of sensors. Since confounding factors such as dehydration may influence the players' perceived exertion, players were allowed to drink still water during training sessions' resting periods. Considering matches, fluid intake was uncontrollable for the players on the field, which they certainly had time to replenish at the half time with certainty. All participants were informed about the goal of the study and were already familiarized with the appropriate devices to wear (at the start of pre-season) as part of their daily routine monitoring. Thus, no consent form was required for this study [38]. This research received an institutional ethical approval and was conducted in accordance with the latest version of the Declaration of Helsinki.
2.3. External Training Load Measurement Procedures
EL data was collected using a 10 Hz portable GPS device (Catapult Vector S7, Catapult Sports Ltd., Melbourne, Australia) equipped with an integrated 100 Hz tri-axial accelerometer, magnetometer and gyroscope. The combination of these components has demonstrated acceptable validity and reliability for measuring distance and high-speed movement metrics in team sports contexts [39], with a typical measurement error reported at 1.3% [40]. To minimize inter-unit variability, all players wore the same model of GPS device throughout the study [41]. The average horizontal dilution of precision (HDOP) during data collection was 0.76 ± 0.1, with an average of 14.88 ± 0.2 connected satellites and a mean Global Navigation Satellite System (GNSS) signal quality of 70.51% ± 1.1%, these values are accordance with previously published standards [42]. Data sets showing substantial deviation from these signal quality indicators were excluded from the analysis. Each device was worn in a manufacturer-provided vest (Catapult Sports) positioned between the scapulae. In line with the recommendations of Maddison and Ni Mhurchu (2009) [43], all units were activated while docked at least five minutes prior to the start of each session to ensure stable satellite connection and optimal signal acquisition. The selected locomotor and mechanical TL variables are presented in Table 1. The velocity-based variables were classified based on previous literature [44,45], which later become the default setting in the Catapult system.
2.4. Internal Training Load Measures
Heart rate was recorded using a Polar heart rate sensor (Polar H9, Polar Electro Oy, Kempele, Finland). The device was attached to a chest strap positioned between the abdomen and the chest, little bit above the processus xiphoideus. It was worn together with the Catapult vest and activated simultaneously and synchronized with the GPS sensor via Bluetooth. At the beginning of the pre-season, the individual maximum heart rate (HRmax) was determined through a maximal incremental spiroergometric running test, which could later be modified during training and/or matches (new records can be updated in the OpenField Cloud system after each activity). After data collection, IL was expressed using three formulas (see Table 2). For the HR exertion measure, eight different HR zones were established based on the default settings of the Catapult system. The method of Edwards' TRIMP (eTRIMP) was employed [22]. This expresses the heart rate (HR) responses of athletes as a percentage of their HRmax. In this context, eTRIMP was calculated based on the time spent in the five HR zones, multiplied by a zone-specific weighting factor.
For the purposes of this study, we also included the rating of perceived exertion (RPE) to assess players' subjective exertion, as proposed by Foster (1998) [47]. It represents a single number expressed in arbitrary unit (AU). It was asked 20-30 minutes after the activities [48] by the team's strength and conditioning coach in person and later recorded in an Excel spreadsheet. A modified Borg CR-10 (Category-Ratio) scale was used, where players were informed that ‘1’ indicates very weak activity and ‘10’ indicates extraordinarily strong activity [49]. Also, to derive session-RPE (s-RPE), the RPE was multiplied by total duration in minutes [48] after each training session and match. If a player failed to respond in time (<1 hour after an activity), even if he later did provide information, that data was discarded from further analysis due to bias of subjective feeling of fatigue.
2.5. Statistical Analysis
All results are presented as means and standard deviations (mean ± SD). Training sessions and matches were analyzed separately. Following each physical session, GPS- and HR-based data were collected using the OpenField Console software (Catapult Sports, Melbourne, Australia; version 3.9) and subsequently exported in .csv format for further analysis. Statistical analyses were performed using JASP software (The Jeffrey's Amazing Statistics Program; version 0.19.2, JASP Team, Amsterdam, Netherlands). Descriptive statistics were calculated, and the Shapiro–Wilk test was employed to assess the normality of the data. As the data were not normally distributed, Spearman’s rank correlation coefficient was used to examine associations between EL and IL metrics. The strength of correlations was interpreted according to the thresholds proposed by Hopkins et al. (2009) [50]: trivial (r < 0.1), small (0.1 ≤ r < 0.3), moderate (0.3 ≤ r < 0.5), large (0.5 ≤ r < 0.7), very large (0.7 ≤ r < 0.9), and almost perfect (r ≥ 0.9). In addition, HR-derived variables from trainings were entered into a multiple linear regression model to investigate predictors of IL. The GPS-based variables included as predictors— TD, HSR, SPR and ACC —were selected. Model performance was evaluated using standardized beta coefficients and R-squared values. Statistical significance was set at p < 0.05.
3. Results
Table 3 shows the descriptive statistics of EL and IL variables dataset.
Figure 1 illustrates weakly variation in IL and EL metrics during training sessions and matches over an 11-week period. After the evaluation of the datasets, TRIMP and HR exertion demonstrated similar pattern, indicating a strong correlation between these two variables of IL, particularly when analyzed as weekly averages throughout the training period. Similarly, TD and PL exhibited a comparable trend, with the exception of deviations observed in weeks two and eleven. In contrast, the TL variables observed during matches were less pronounced, as weeks of two, three, eight, ninth and eleventh demonstrated a reduced strength of association between the variables.
Figure 2 presents the relationship between IL regarding both subjective and objective parameters. For both trainings and matches, the strongest relationship was observed between TRIMP and HR exertion. Additionally, s-RPE demonstrated a very large correlation with TRIMP (p < 0.001).
Figure 3 and Figure 4 present the correlations between EL and IL volume and intensity parameters during training sessions and matches. Considering trainings, HR exertion showed a large correlation with TD, MSR, DEC, IMA, and PL (p < 0.001). Its intensity variable (HR exertion/min) exhibited a small to moderate correlation with GPS-based variables. Notably, TRIMP showed a near-perfect correlation with TD (p < 0.001) and very large correlation with MSR, DEC, IMA and PL ranging from 0.72 to 0.88. Additionally, eTRIMP exhibited very large correlation with TD and PL. Interestingly, RPE and s-RPE showed very large correlation with TD and PL (p < 0.001).
In matches, TRIMP demonstrated very large correlation with TD from HR-based variables (p < 0.001). Furthermore, RPE and s-RPE showed very large correlation with TD.
Meanwhile, multiple linear regression analysis was conducted to evaluate the extent to which GPS variables could predict HR metrics. Low collinearity was confirmed with tolerance values ranging from 0.38 to 0.78 and variance inflation factor (VIF) ranging from 1.28 to 2.73. A significant regression was found (F(1, 465) = 596.71, p < 0.001) with an R² of 0.82. The average TRIMP score for U16 players increased for each meter of TD (ß = 0.98, p < 0.001). Additionally, a significant correlation was found (F(1, 465) = 1156.49, p < 0.001), indicating that TD explained 71% of the variance in HR exertion.
4. Discussion
The primary aim of this study was to identify the relationship between HR metrics and GPS-derived variables for U16 youth male soccer players. Monitoring TL can play a crucial role in optimizing the physical preparation of youth soccer players and provide valuable support for coaches in individualizing training stimuli. A recent study was conducted with the U16 age group, analyzing half a year of training and match data separately and differences in weekly mean TLs were assessed using descriptive statistical analysis.
Upon examining the descriptive statistics, variations were observed in both EL and IL across different weeks, in both trainings and matches. In terms of correlation results, we found the strongest relationship between EL and IL concerning volume variables of TD and PL with TRIMP. However, notable deviations were detected in weeks 2 and 11, where athletes appeared to engage in more high-intensity activities. Although this was not directly analyzed, the IL values suggest an increased intensity during these weeks, further highlighting the limitations of HR-based measures in accurately monitoring high-intensity efforts [26]. On the other hand, eTRIMP showed strong correlation with TD and PL which is consistent with the findings of previous literature [19,24]. Our results also support the conclusions of Lisbôa et al. (2019) that higher intensity training can affect HR, thus recommending the use of eTRIMP to manage this sensitivity [19,24]. Moreover, HR exertion showed an extraordinarily strong correlation with TD, MSR, DEC, IMA, and PL variables. Unfortunately, there is limited research literature regarding this subject, but the reliability of the HR exertion variable is acknowledged in the context of matches [51]. Regarding intensity variables, TD/min showed a large correlation with all heart rate-based variables (p < 0.001). This confirms the importance of examining intensity parameters in TL research [13]. The weakest relationship was observed with ACC/min and IMA/min, suggesting that these variables should be further examined. In this study, each intensity zone was integrated into a formula, yielding weak results; therefore, it is advisable to apply them separately [30].
In matches, we found a very strong correlation between TRIMP and TD, reinforcing the significance of these two variables in determining TL [27]. The most pronounced differences were observed in weeks 3 and 11. Matches in these weeks were substantially less physically demanding compared to others, as indicated by lower IL values despite relatively high EL, suggesting a mismatch between physical output and perceived exertion. It has been previously proposed that the intensity of matches is superior to that of training [2], which is concordance with our findings regarding HR values, making them much more sensitive [24]. These considerations may account for the observed small to moderate correlations between eTRIMP and HR exertion/min, and EL metrics such as TD and PL. Furthermore, s-RPE emerged as a more reliable indicator of IL intensity.
The secondary aim was to identify the best IL predictor via GPS-based variables during practice. Based on our linear regression model, we found that TD is the best predictor of HR exertion and TRIMP variables (p < 0.001). This result strongly corroborates with previous research [19] and further supports the close relationship between TD and IL parameters for youth soccer (13,14,32).
Additionally, we correlated s-RPE with HR-based variables (TRIMP, HR exertion) and found a very large relationship, further validating the s-RPE method in youth soccer considering both trainings and matches [14,30,52].
4.1. Practical Applications
The findings of the research offer significant contributions to the understanding of the relationship between EL and IL in U16 soccer. In training, HR-based variables appear to show a stronger association with GPS-derived metrics. When assessing IL through HR measures, it is recommended to consider multiple, composite variables rather than focusing solely on simpler metrics such as the current beat-to-beat value (HR) and the average rate of HR. For tracking TL in real time, cumulative indices such TRIMP, eTRIMP and HR exertion may offer a more accurate representation of IL. However, during matches, significantly higher correlations were observed with RPE and s-RPE, which may indicate its utility. Given the limited or no availability of HR monitoring tools in many football academies, there is a practical need for an accessible, cost-effective and easy-to-interpret measurement methodology, which the RPE scale effectively fulfills. While subjective measures cannot replace standardized HR metrics, in certain circumstances, it is possible to implement alternative solutions as proxies.
4.2. Limitations
While the study provides forward-looking insights into the relationship between GPS-derived variables, HR metrics and RPE in youth soccer, there are however several limitations that should be mentioned. Firstly, we are aware of the fact, that the simple size is limited, as only the team of U16 players participated in the current study from one football academy. However, this was an intentional methodological consideration to ensure sample homogeneity. Although players were not exposed to the same TL considering both EL and IL, they participated in the same training sessions, thereby reducing the possibility of deviation in the influence of independent external factors such as environment, play style, rules, coach attitude on the individuals in the sample. Secondly, the shortcomings in the contextual factors (e.g. environmental conditions, relative speed zones, opponent in matches, overtraining) that may influence the relationship between EL and IL. Thirdly, it is important to emphasize that trimming GPS data may significantly influence intensity-related parameters, as it matters where each period within an activity begins and ends. In this study, all periods were analyzed in activities (training sessions), meaning that rest intervals were also included. These often involve tactical discussions, carrying football goal, changing jerseys and refreshing with water. In the context of matches, such interruptions typically occur in the form of stoppages (e.g. standing kicks, substitutions, cooling breaks due extreme heat, or sudden injures), although these are generally less frequent in the latter cases.
5. Conclusions
This study provides valuable insights into the relationship between EL, as measured by GPS-derived variables, and IL, represented by HR-based metrics, RPE and s-RPE, in U16 soccer. The findings revealed large to almost perfect correlations between EL and IL measures, with TD and PL emerging as the most strongly associated GPS metrics with TRIMP and HR exertion during training. Notably, TD proved to be the most consistent predictor of both TRIMP and HR exertion, underscoring its relevance in monitoring TL. These results are particularly meaningful for practitioners, as TD is commonly used by coaches to evaluate training demands. Furthermore, strong correlations were observed between TD, PL and RPE and s-RPE, suggesting perceived exertion serves as a reliable substitute for IL assessment, especially in settings where HR monitoring is not feasible. These results are reinforcing the practical utility of GPS technology, HR monitoring and RPE measures in U16 soccer for effective TL management and the physical development of the players.
Author Contributions
Conceptualization, K.H., S.S. and G.G.; methodology, K.H., P.J.T., C.B., T.H. and G.P.S.; formal analysis, B.K. and T.H.; data curation, B.K. and T.H.; writing—original draft preparation, K.H.; writing—review and editing, K.H., P.J.T., B.K., S.S. and C.B.; visualization, G.P.S.; Z.S. and B.K.; supervision, S.S., B.K. and G.G. All authors have read and agreed to the published version of the manuscript.
Funding
This research received no external funding.
Institutional Review Board Statement
The study was conducted in accordance with the Declaration of Helsinki and approved by the Ethical Committee of Hungarian University of Sports Science (MTSE-KEB/No12/2025 and 26 June 2025) for studies involving humans.
Informed Consent Statement
No individual consent was required for participation, as the procedures involved are part of the players' daily routine at the football academy. It was stated [38] that “It is probable that these data are not obtained as part of a formal research project and hence have not been subject to scrutiny by a properly constituted ethics committee. Moreover, in occupational settings, principles of informed consent might not be fully upheld.”. From the U15 age group onward, all athletes receive detailed education and information regarding these protocols. For U16 age group, the procedures are already well known and integrated into their regular training. Although newly recruited players are typically briefed again, this did not affect the current study, as data collection was conducted exclusively during the competition period, at which point the teams are already formed.
Data Availability Statement
The data presented are available on request from the corresponding author.
Conflicts of Interest
The authors declare no conflicts of interest.
Abbreviations
The following abbreviations are used in this manuscript:
| ACC | Accelerations |
| AU | Arbitrary unit |
| CR | Category-ratio |
| DEC | Decelerations |
| EL | External load |
| eTRIMP | Edward's training impulse |
| GNSS | Global navigation satellite system |
| GPS | Global positioning system |
| HDOP | Horizontal dilution of precision |
| HR | Heart rate |
| HRmax | Maximum heart rate |
| HR exer | Heart rate exertion |
| HSR | High-speed running distance |
| IL | Internal load |
| IMA | Inertial movement analysis |
| IMUs | Inertial measurement units |
| MD | Match day |
| MSR | Medium-speed running distance |
| PL | Player load |
| RPE | Rating of perceived exertion |
| s-RPE | Session-rating of perceived exertion |
| SPR | Sprint distance |
| TD | Total distance |
| TDu | Total duration |
| TL | Training load |
| TRIMP | Training impulse |
| VIF | Variance inflation factor |
References
- Banister, E.W.; Calvert, T.W.; Savage, M.V.; Bach, T. A systems model of training for athletic performance. Aust. J. Sports Med. 1975, 7, 57–61. [Google Scholar]
- Impellizzeri, F.M.; Marcora, S.M.; Coutts, A.J. Internal and External Training Load: 15 Years On. Int. J. Sports Physiol. Perform. 2019, 14, 270–273. [Google Scholar] [CrossRef]
- Jaspers, A.; Brink, M.S.; Probst, S.G.; Frencken, W.G.; Helsen, W.F. Relationships Between Training Load Indicators and Training Outcomes in Professional Soccer. Sports Med. 2017, 47, 533–544. [Google Scholar] [CrossRef]
- Halson, S.L. Monitoring training load to understand fatigue in athletes. Sports Med. 2014, 44, S139–S147. [Google Scholar] [CrossRef]
- Gabbett, T.J. The training-injury prevention paradox: should athletes be training smarter and harder? Br. J. Sports Med. 2016, 50, 273–280. [Google Scholar] [CrossRef]
- Bourdon, P.C.; Cardinale, M.; Murray, A.; Gastin, P.; Kellmann, M.; Varley, M.C.; Gabbett, T.J.; Coutts, A.J.; Burgess, D.J.; Gregson, W.; Cable, N.T. Monitoring Athlete Training Loads: Consensus Statement. Int. J. Sports Physiol. Perform. 2017, 12, S2161–S2170. [Google Scholar] [CrossRef] [PubMed]
- Cummins, C.; Orr, R.; O'Connor, H.; West, C. Global positioning systems (GPS) and microtechnology sensors in team sports: a systematic review. Sports Med. 2013, 43, 1025–1042. [Google Scholar] [CrossRef]
- Chambers, R.; Gabbett, T.J.; Cole, M.H.; Beard, A. The Use of Wearable Microsensors to Quantify Sport-Specific Movements. Sports Med. 2015, 45, 1065–1081. [Google Scholar] [CrossRef]
- Akenhead, R.; Harley, J.A.; Tweddle, S.P. Examining the External Training Load of an English Premier League Football Team With Special Reference to Acceleration. J. Strength Cond. Res. 2016, 30, 2424–2432. [Google Scholar] [CrossRef] [PubMed]
- Varley, M.C.; Jaspers, A.; Helsen, W.F.; Malone, J.J. Methodological Considerations When Quantifying High-Intensity Efforts in Team Sport Using Global Positioning System Technology. Int. J. Sports Physiol. Perform. 2017, 12, 1059–1068. [Google Scholar] [CrossRef] [PubMed]
- Malone, J.J.; Barrett, S.; Barnes, C.; Twist, C.; Drust, B. To infinity and beyond: the use of GPS devices within the football codes. Sci. Med. Footb. 2019, 4, 82–84. [Google Scholar] [CrossRef]
- Oliva-Lozano, J.M.; Conte, D.; Fortes, V.; Muyor, J.M. Exploring the Use of Player Load in Elite Soccer Players. Sports Health. 2023, 15, 61–66. [Google Scholar] [CrossRef]
- Marynowicz, J.; Kikut, K.; Lango, M.; Horna, D.; Andrzejewski, M. Relationship Between the Session-RPE and External Measures of Training Load in Youth Soccer Training. J. Strength Cond. Res. 2020, 34, 2800–2804. [Google Scholar] [CrossRef] [PubMed]
- Havanecz, K.; Tóth, P.J.; Kopper, B.; Bartha, C.; Sáfár, S.; Fridvalszki, M.; Géczi, G. Relationship Between GPS-Derived Variables and Subjective Questionnaires Among Elite Youth Soccer Players. Sports 2025, 13, 246. [Google Scholar] [CrossRef]
- Eniseler, N. Heart rate and blood lactate concentrations as predictors of physiological load on elite soccer players during various soccer training activities. J. Strength Cond. Res. 2005, 19, 799–804. [Google Scholar] [CrossRef] [PubMed]
- Little, T.; Williams, A.G. Suitability of soccer training drills for endurance training. J. Strength Cond. Res. 2006, 20, 316–319. [Google Scholar] [CrossRef] [PubMed]
- Bangsbo, J.; Mohr, M.; Krustrup, P. Physical and metabolic demands of training and match-play in the elite football player. J. Sports Sci. 2006, 24, 665–674. [Google Scholar] [CrossRef]
- Henderson, B.; Cook, J.; Kidgell, D.J.; Gastin, P.B. Game and Training Load Differences in Elite Junior Australian Football. J. Sports Sci. Med. 2015, 14, 494–500. [Google Scholar] [PubMed]
- Askow, A.T.; Lobato, A.L.; Arndts, D.J.; Jennings, W.; Kreutzer, A.; Erickson, J.L.; Esposito, P.E.; Oliver, J.M.; Foster, C.; Jagim, A.R. Session Rating of Perceived Exertion (sRPE) Load and Training Impulse Are Strongly Correlated to GPS-Derived Measures of External Load in NCAA Division I Women's Soccer Athletes. J. Funct. Morphol. Kinesiol. 2021, 6, 90. [Google Scholar] [CrossRef]
- Dellal, A.; da Silva, C.D.; Hill-Haas, S.; Wong del, P.; Natali, A.J.; De Lima, J.R.; Bara Filho, M.G.; Marins, J.J.; Garcia, E.S.; Chamari, K. Heart rate monitoring in soccer: interest and limits during competitive match play and training, practical application. J. Strength Cond. Res. 2012, 26, 2890–2906. [Google Scholar] [CrossRef]
- Banister, E.W. Modeling elite athletic performance. In H. J. Green, J. D. McDougal & H. A. Wenger (Eds), Physiological Testing of Elite (High-Performance) Athletes. Champaign, IL: Human Kinetics, 1991, 347, 403–422. [Google Scholar]
- Edwards, S. In The heart rate monitor book. Sacramento, CA: Polar Electro Inc., 1994, 113-123.
- Rebelo, A.; Brito, J.; Seabra, A.; Oliveira, J.; Drust, B.; Krustrup, P. A new tool to measure training load in soccer training and match play. Int. J. Sports Med. 2012, 33, 297–304. [Google Scholar] [CrossRef]
- Scott, B.R.; Lockie, R.G.; Knight, T.J.; Clark, A.C.; Janse de Jonge, X.A. A comparison of methods to quantify the in-season training load of professional soccer players. Int. J. Sports Physiol. Perform. 2013, 8, 195–202. [Google Scholar] [CrossRef]
- Berkelmans, D.M.; Dalbo, V.J.; Kean, C.O.; Milanović, Z.; Stojanović, E.; Stojiljković, N.; Scanlan, A.T. Heart Rate Monitoring in Basketball: Applications, Player Responses, and Practical Recommendations. J. Strength Cond. Res. 2018, 32, 2383–2399. [Google Scholar] [CrossRef]
- Lisbôa, F.D.; Raimundo, J.A.G.; Salvador, A.F.; Pereira, K.L.; Turnes, T.; Diefenthaeler, F.; Oliveira, M.F.M.; Caputo, F. Acute Cardiopulmonary, Metabolic, and Neuromuscular Responses to Severe-Intensity Intermittent Exercises. J. Strength Cond. Res. 2019, 33, 408–416. [Google Scholar] [CrossRef]
- Alemdaroğlu, U. External and internal training load relationships in soccer players. J. Human Sport Exer. 2020, 16, 304–316. [Google Scholar] [CrossRef]
- Haddad, M.; Stylianides, G.; Djaoui, L.; Dellal, A.; Chamari, K. Session-RPE Method for Training Load Monitoring: Validity, Ecological Usefulness, and Influencing Factors. Front. Neurosci. 2017, 11, 612. [Google Scholar] [CrossRef] [PubMed]
- Teixeira, J.E.; Forte, P.; Ferraz, R.; Leal, M.; Ribeiro, J.; Silva, A.J.; Barbosa, T.; Monteiro, A. The association between external training load, perceived exertion and total quality recovery in sub-elite youth football. The Open Sports Sci. J. 2022, 15, 1–9. [Google Scholar] [CrossRef]
- de Dios-Álvarez, V.; Suárez-Iglesias, D.; Bouzas-Rico, S.; Alkain, P.; González-Conde, A.; Ayán-Pérez, C. Relationships between RPE-derived internal training load parameters and GPS-based external training load variables in elite young soccer players. Res. Sports Med. 2023, 31, 58–73. [Google Scholar] [CrossRef]
- Alexiou, H.; Coutts, A.J. A comparison of methods used for quantifying internal training load in women soccer players. Int. J. Sports Physiol. Perform. 2008, 3, 320–330. [Google Scholar] [CrossRef] [PubMed]
- Barbero-Álvarez, J.C.; Gómez López, M.; Barbero-Álvarez, V.; Granda Vera, J.; Castagna, C. Heart rate and activity profile for young female soccer players. J. Hum. Sport Exer. 2008, 3, 1–11. [Google Scholar] [CrossRef]
- Jaspers, A.; De Beéck, T.O.; Brink, M.S.; Frencken, W.G.P.; Staes, F.; Davis, J.J.; Helsen, W.F. Relationships Between the External and Internal Training Load in Professional Soccer: What Can We Learn From Machine Learning? Int. J. Sports Physiol. Perform. 2018, 13, 625–630. [Google Scholar] [CrossRef] [PubMed]
- Soligard, T.; Myklebust, G.; Steffen, K.; Holme, I.; Silvers, H.; Bizzini, M.; Junge, A.; Dvorak, J.; Bahr, R.; Andersen, T.E. Comprehensive warm-up programme to prevent injuries in young female footballers: cluster randomised controlled trial. BMJ. 2008, 337, a2469. [Google Scholar] [CrossRef] [PubMed]
- Bompa, T.O.; Buzzichelli, C. Periodization-: theory and methodology of training . Champaign, IL: Human Kinetics, 2019, 6, 203. [Google Scholar]
- Martín-García, A.; Gómez Díaz, A.; Bradley, P.S.; Morera, F.; Casamichana, D. Quantification of a Professional Football Team's External Load Using a Microcycle Structure. J. Strength Cond. Res. 2018, 32, 3511–3518. [Google Scholar] [CrossRef] [PubMed]
- Stevens, T.G.; de Ruiter, C.J.; Twisk, J.W.; Savelsbergh, G.J.; Beek, P.J. Quantification of in-season training load relative to match load in professional Dutch Eredivisie football players. Sci. Med. Footb. 2017, 1, 117–125. [Google Scholar] [CrossRef]
- Winter, E.M.; Maughan, R.J. Requirements for ethics approvals. J. Sports Sci. 2009, 27, 985. [Google Scholar] [CrossRef]
- Scott, M.T.; Scott, T.J.; Kelly, V.G. The Validity and Reliability of Global Positioning Systems in Team Sport: A Brief Review. J. Strength Cond. Res. 2016, 30, 1470–1490. [Google Scholar] [CrossRef]
- Johnston, R.J.; Watsford, M.L.; Kelly, S.J.; Pine, M.J.; Spurrs, R.W. Validity and interunit reliability of 10 Hz and 15 Hz GPS units for assessing athlete movement demands. J. Strength Cond. Res. 2014, 28, 1649–1655. [Google Scholar] [CrossRef]
- Gaudino, P.; Iaia, F.M.; Alberti, G.; Hawkins, R.D.; Strudwick, A.J.; Gregson, W. Systematic bias between running speed and metabolic power data in elite soccer players: influence of drill type. Int. J. Sports Med. 2014, 35, 489–493. [Google Scholar] [CrossRef]
- Weston, M.; Siegler, J.; Bahnert, A.; McBrien, J.; Lovell, R. The application of differential ratings of perceived exertion to Australian Football League matches. J. Sci. Med. Sport. 2015, 18, 704–708. [Google Scholar] [CrossRef]
- Maddison, R.; Ni Mhurchu, C. Global positioning system: a new opportunity in physical activity measurement. Int. J. Behav. Nutr. Phys. Act. 2009, 6, 73. [Google Scholar] [CrossRef] [PubMed]
- Bradley, P.S.; Sheldon, W.; Wooster, B.; Olsen, P.; Boanas, P.; Krustrup, P. High-intensity running in English FA Premier League soccer matches. J. Sports Sci. 2009, 27, 159–168. [Google Scholar] [CrossRef]
- Mallo, J.; Mena, E.; Nevado, F.; Paredes, V. Physical Demands of Top-Class Soccer Friendly Matches in Relation to a Playing Position Using Global Positioning System Technology. J. Hum. Kinet. 2015, 47, 179–188. [Google Scholar] [CrossRef] [PubMed]
- Boyd, L.J.; Ball, K.; Aughey, R.J. The reliability of MinimaxX accelerometers for measuring physical activity in Australian football. Int. J. Sports Physiol. Perform. 2011, 6, 311–321. [Google Scholar] [CrossRef]
- Foster, C. Monitoring training in athletes with reference to overtraining syndrome. Med Sci Sports Exerc. 1998, 30, 1164–1168. [Google Scholar] [CrossRef]
- Foster, C.; Florhaug, J.A.; Franklin, J.; Gottschall, L.; Hrovatin, L.A.; Parker, S.; Doleshal, P.; Dodge, C. A new approach to monitoring exercise training. J. Strength Cond. Res. 2001, 15, 109–115. [Google Scholar] [CrossRef] [PubMed]
- Noble, B.J.; Borg, G.A.; Jacobs, I.; Ceci, R.; Kaiser, P. A category-ratio perceived exertion scale: relationship to blood and muscle lactates and heart rate. Med. Sci. Sports Exerc. 1983, 15, 523–528. [Google Scholar] [CrossRef] [PubMed]
- Hopkins, W.G.; Marshall, S.W.; Batterham, A.M.; Hanin, J. Progressive statistics for studies in sports medicine and exercise science. Med. Sci. Sports Exerc. 2009, 41, 3–13. [Google Scholar] [CrossRef]
- Williams, J.H.; Hoffman, S.; Jaskowak, D.J.; Tegarden, D. Physical demands and physiological responses of extra time matches in collegiate women’s soccer. Sci. Med. Footb. 2019, 3, 307–312. [Google Scholar] [CrossRef]
- Impellizzeri, F.M.; Rampinini, E.; Coutts, A.J.; Sassi, A.; Marcora, S.M. Use of RPE-based training load in soccer. Med. Sci. Sports Exerc. 2004, 36, 1042–1047. [Google Scholar] [CrossRef] [PubMed]
Figure 1.
Weekly analysis of average HR-based IL parameters and GPS-derived EL metrics regarding trainings and matches. Minimum and maximum values are presented. AU = arbitrary unit, m = meter, TRIMP = training impulse, HR exertion = heart rate exertion, TD = total distance, PL = player load.
Figure 1.
Weekly analysis of average HR-based IL parameters and GPS-derived EL metrics regarding trainings and matches. Minimum and maximum values are presented. AU = arbitrary unit, m = meter, TRIMP = training impulse, HR exertion = heart rate exertion, TD = total distance, PL = player load.
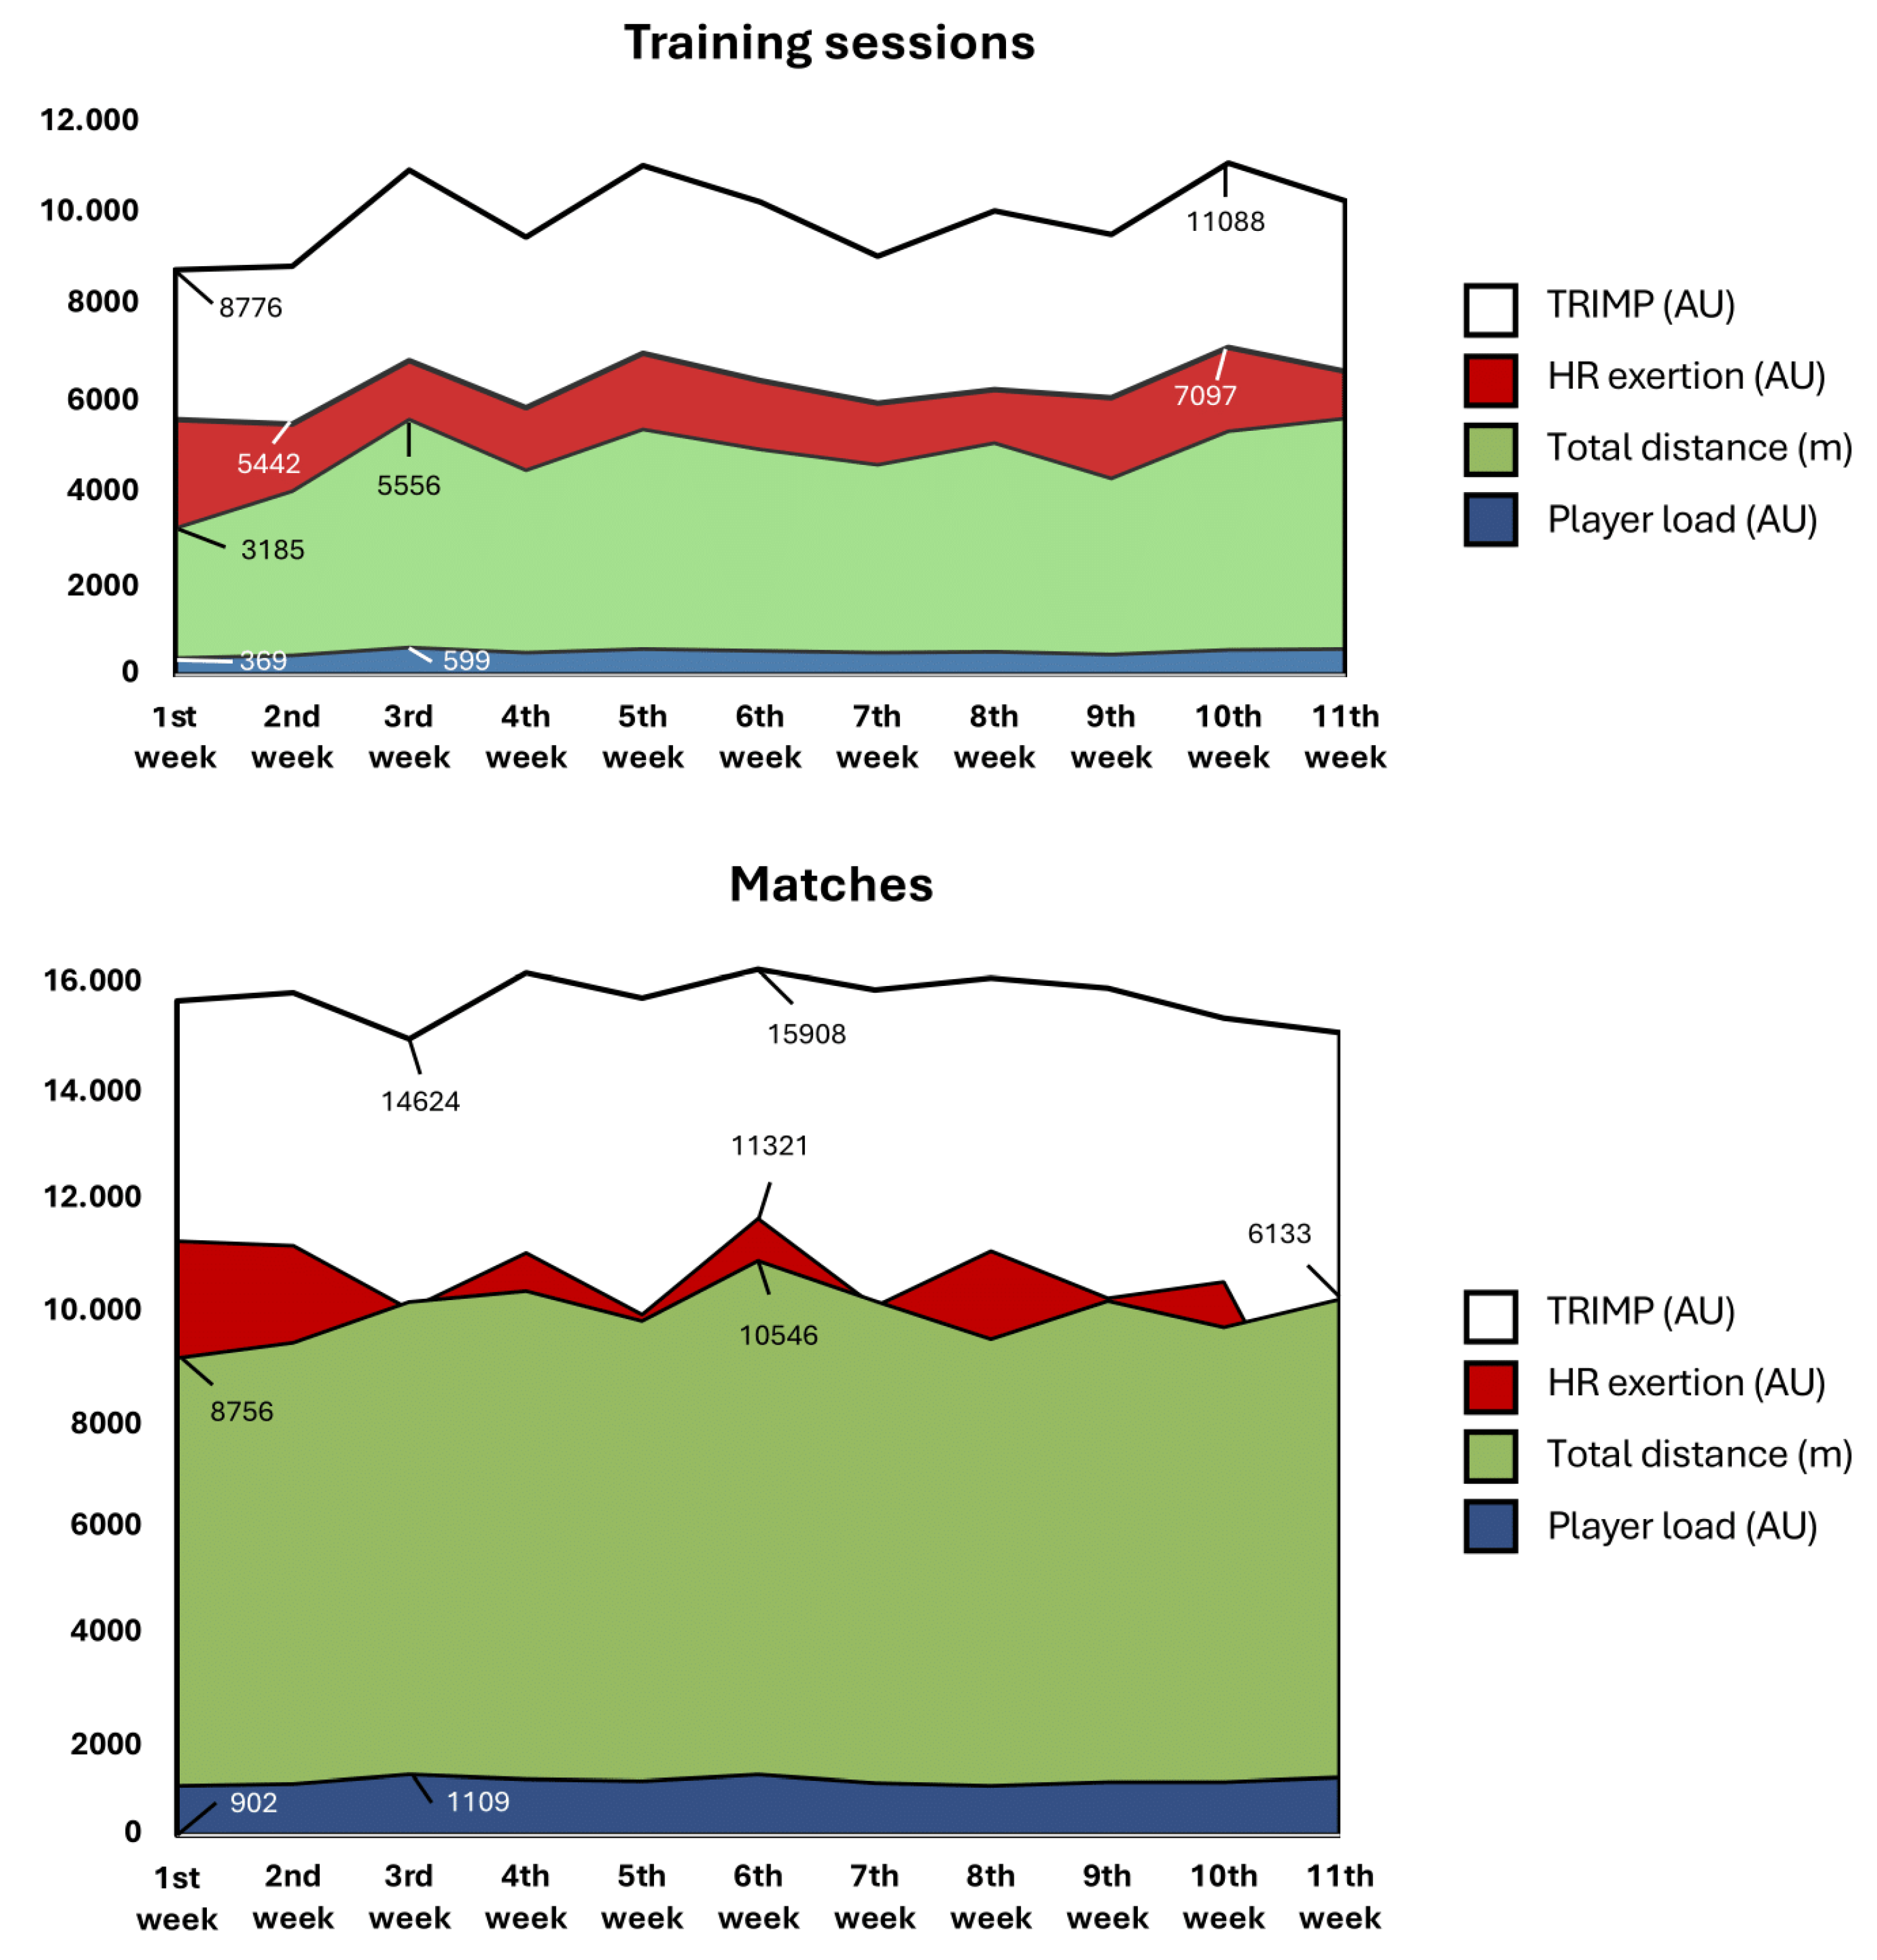
Figure 2.
The relationship between HR exertion, TRIMP and s-RPE in training and matches. TRIMP = training impulse, HR exertion = heart rate exertion, s-RPE = session-rating of perceived exertion.
Figure 2.
The relationship between HR exertion, TRIMP and s-RPE in training and matches. TRIMP = training impulse, HR exertion = heart rate exertion, s-RPE = session-rating of perceived exertion.
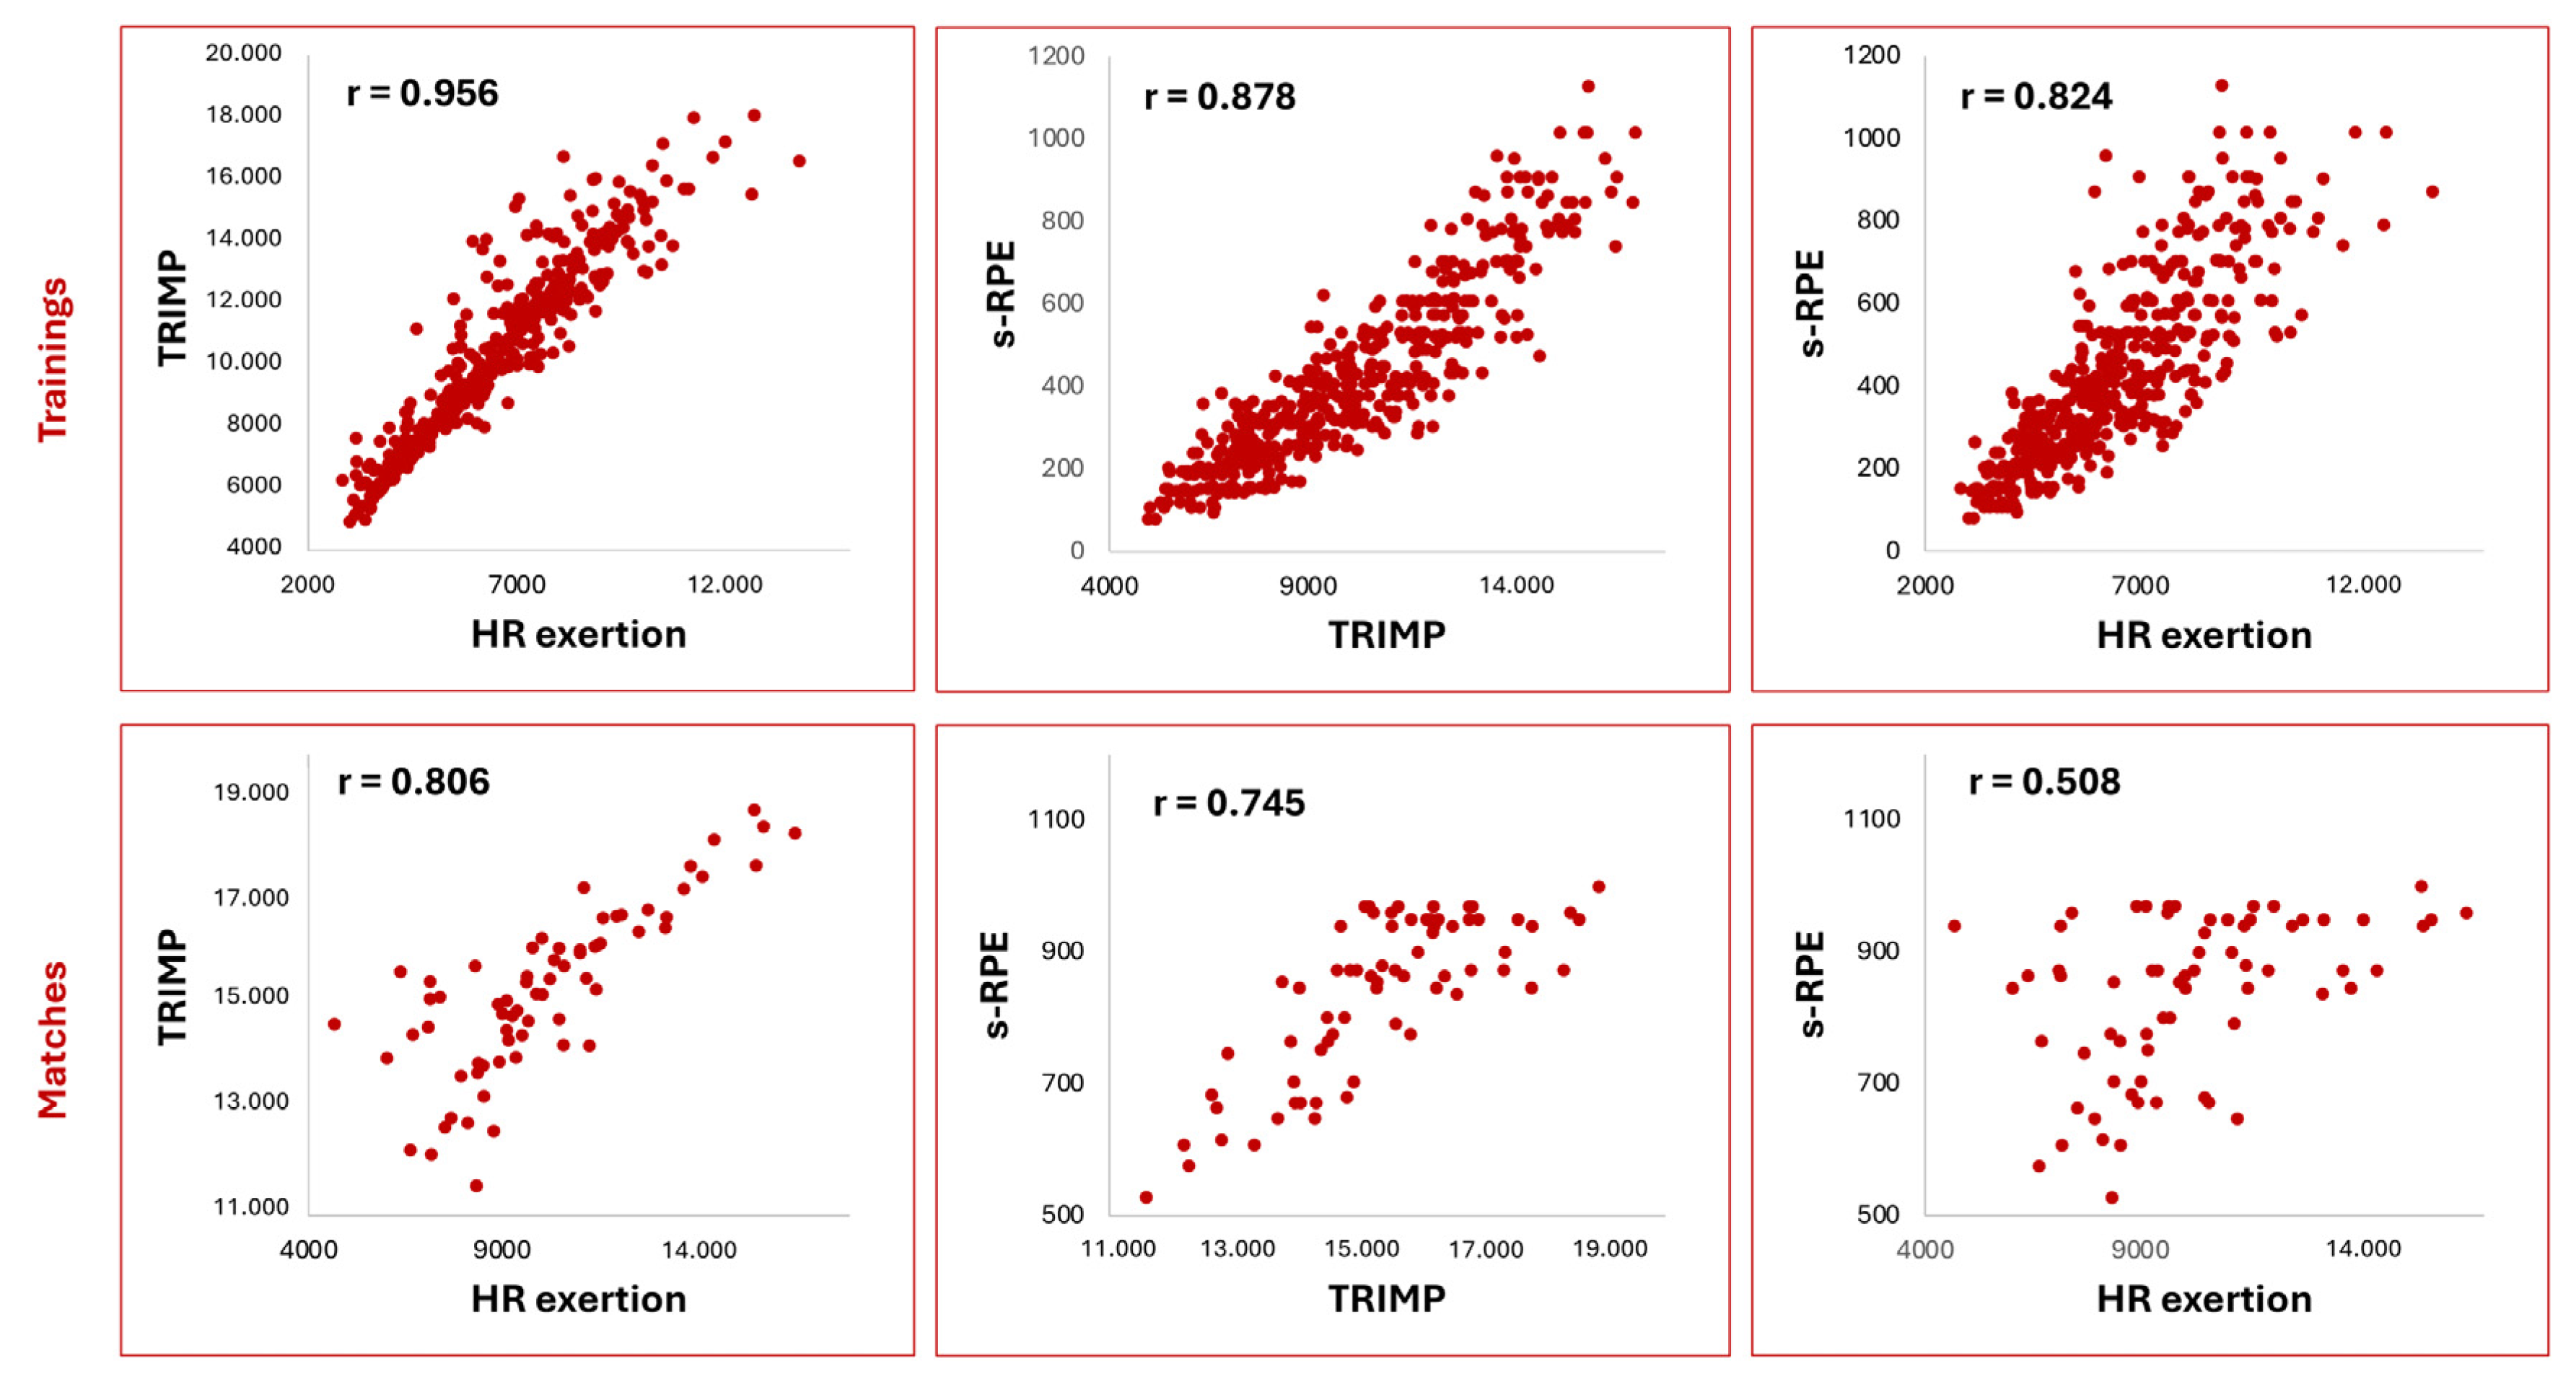
Figure 3.
Relationship between GPS-derived variables, HR-based metrics, RPE and s-RPE measures regarding training sessions. Values represent correlation coefficients between corresponding variables. Color code indicates strength of correlation between variables. HREXER = heart rate exertion, TRIMP = training impulse, eTRIMP = Edward's TRIMP, RPE = rating of perceived exertion, s-RPE = session-RPE, TD = total distance, MSR = medium-speed running distance, HSR = high-speed running distance, SPR = sprint distance, ACC = accelerations DEC = decelerations, IMA = inertial movement analysis, PL = player load.
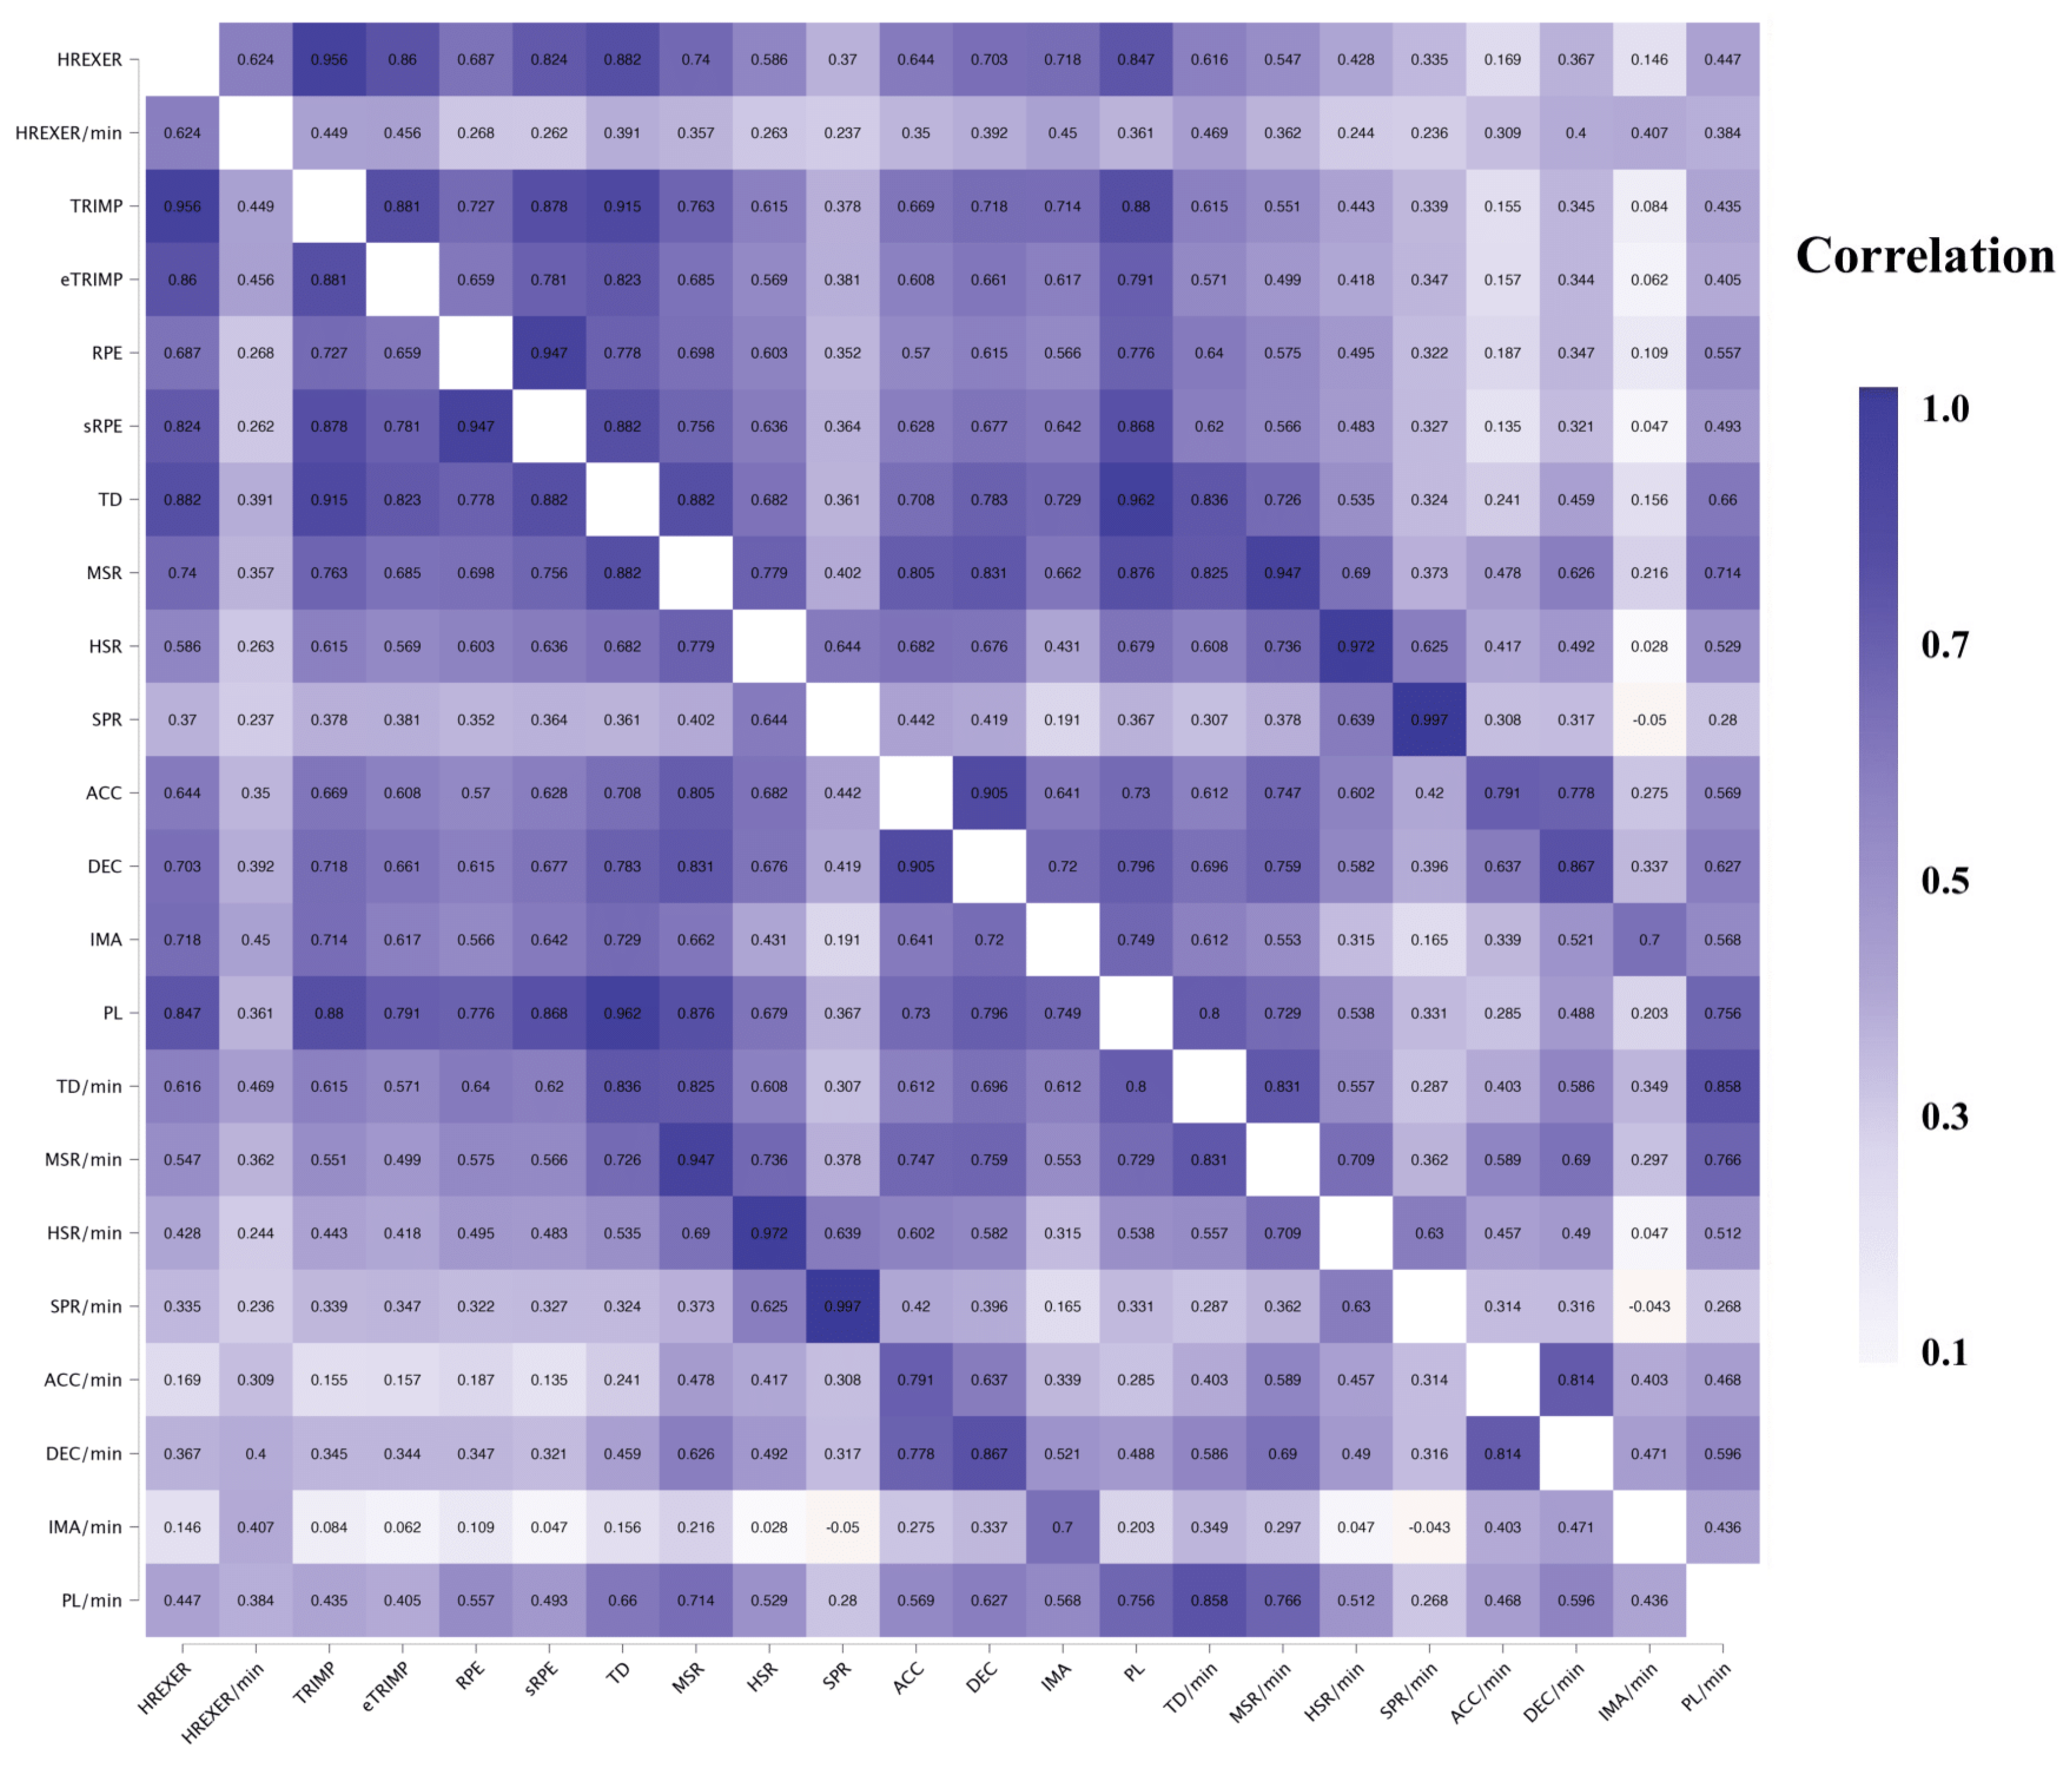
Figure 4.
Relationship between GPS-derived variables, HR-based metrics, RPE and s-RPE measures regarding matches. Values represent correlation coefficients between corresponding variables. Color code indicates strength of correlation between variables. HREXER = heart rate exertion, TRIMP = training impulse, eTRIMP = Edward's TRIMP, RPE = rating of perceived exertion, s-RPE = session-RPE, TD = total distance, MSR = medium-speed running distance, HSR = high-speed running distance, SPR = sprint distance, ACC = accelerations DEC = decelerations, IMA = inertial movement analysis, PL = player load.
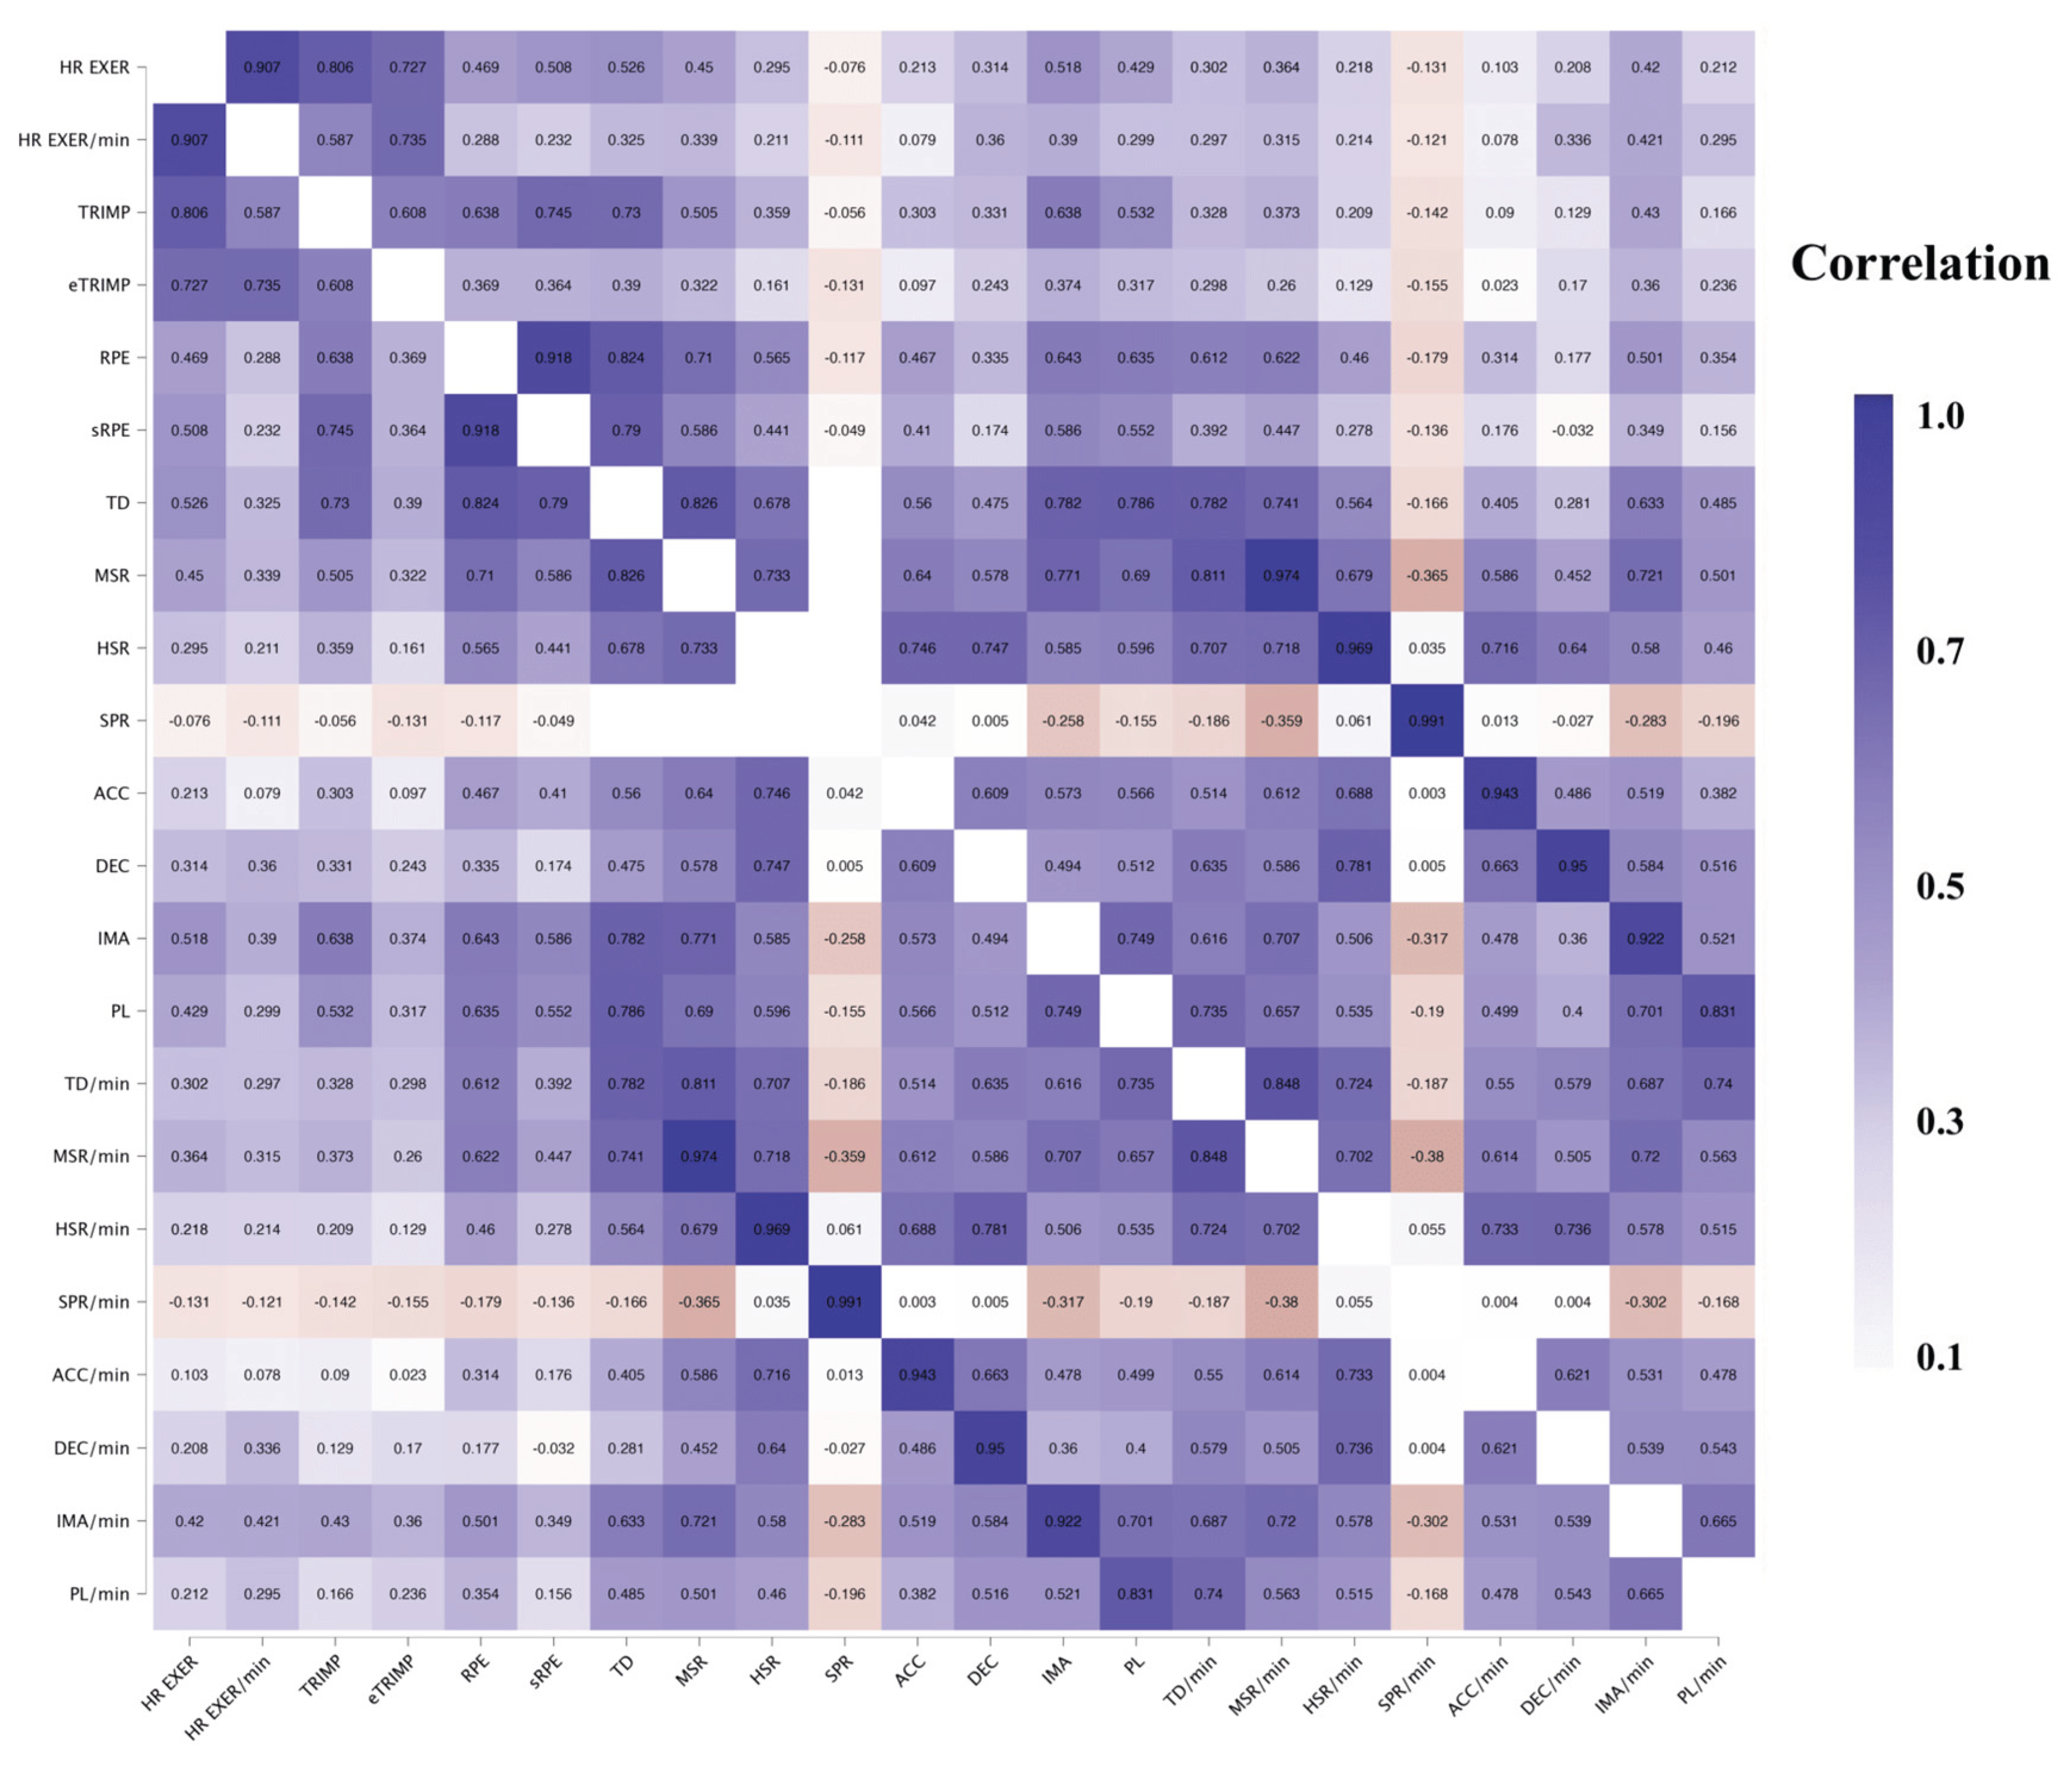

Table 1.
GPS-derived TL variables.
|
Locomotor TL variables |
Mechanical TL variables |
|
| Volume parameters |
TD (m) | ACC (m) |
| MSR (m) | DEC (m) | |
| HSR (m) | IMA (n) | |
| SPR (m) | PL (AU) | |
| Intensity parameters |
TD/min (m) | ACC/min (m) |
| MSR/min (m) | DEC/min (m) | |
| HSR/min (m) | IMA/min (n) | |
| SPR/min (m) | PL/min (AU) |
TL = training load, m = meter, n = number, AU = arbitrary unit, TD = total distance, MSR = medium-speed running distance, HSR = high-speed running distance, SPR = sprint distance, ACC = accelerations, DEC = decelerations, IMA = inertial movement analysis, PL = player load.
Table 2.
Formulas showing the players' internal load.
| Methods | Equations |
| TRIMP | average heart rate * total duration expressed in AU |
| eTRIMP | time spent in zone 1 (50-59% of HRmax) multiplied by 1, time spent in zone 2 (60-69% of HRmax) multiplied by 2, time spent in zone 3 (70-79% of HRmax) multiplied by 3, time spent in zone 4 (80-89% of HRmax) multiplied by 4, time spent in zone 5 (90-100% of HRmax) multiplied by 5, and these scores were subsequently summed and expressed in AU |
| HR exertion | time spent in zone 1 (≤45% of HRmax) multiplied by 1, time spent in zone 2 (45-55% of HRmax) multiplied by 1.122, time spent in zone 3 (55-65% of HRmax) multiplied by 1.322, time spent in zone 4 (65-75% of HRmax) multiplied by 1.554, time spent in zone 5 (75-85% of HRmax) multiplied by 2.037, time spent in zone 6 (85-95% of HRmax) multiplied by 3.252, time spent in zone 7 (95-105% of HRmax) multiplied by 5.439, time spent in zone 8 (>105% of HRmax) multiplied by 9.0, and these scores were summarized and expressed in AU |
HR = heart rate, HRmax = maximal heart rate, TRIMP = training impulse, eTRIMP = Edward's training impulse, AU = arbitrary unit.
Table 3.
Descriptive statistics of EL and IL variables in trainings and matches.
| Trainings | Matches | |||||||
| mean ± sd | min | max | range | mean ± sd | min | max | range | |
|
External TL variables |
||||||||
| TDu | 1:10:49 ± 0:17:28 | 0:39:46 | 1:53:10 | 1:13:24 | 1:32:03 ± 0:06:24 | 1:15:37 | 1:40:19 | 0:24:42 |
| TD | 4893.19 ± 1904.15 | 1461.70 | 10020.09 | 8558.39 | 9582.18 ± 1214.26 | 6571.84 | 13187.78 | 6615.94 |
| MSR | 428.37 ± 309.17 | 39.20 | 1559.52 | 1520.32 | 1382.95 ± 448.63 | 683.14 | 2656.53 | 1993.39 |
| HSR | 115.43 ± 109.31 | 0.00 | 628.14 | 628.14 | 474.28 ± 160.07 | 175.12 | 796.98 | 621.86 |
| SPR | 17.45 ± 35.72 | 0.00 | 209.99 | 209.99 | 85.06 ± 53.85 | 0.00 | 249.25 | 249.25 |
| ACC | 188.47 ± 79.67 | 32.43 | 479.18 | 446.75 | 313.51 ± 68.81 | 166.85 | 444.94 | 278.09 |
| DEC | 70.65 ± 33.81 | 12.07 | 188.83 | 176.76 | 127.96 ± 34.18 | 50.72 | 217.03 | 166.31 |
| IMA | 398.448 ± 134.90 | 115.00 | 890.00 | 775.00 | 489.46 ± 159.93 | 279.00 | 972.00 | 693.00 |
| PL | 519.35 ± 193.94 | 168.83 | 1126.35 | 957.52 | 992.71 ± 182.19 | 686.37 | 1633.60 | 947.23 |
| TD/min | 67.27 ± 13.73 | 36.76 | 100.53 | 63.77 | 104.85 ± 9.99 | 87.12 | 138.48 | 51.36 |
| MSR/min | 5.67 ± 3.19 | 0.69 | 16.96 | 16.27 | 15.08 ± 4.65 | 7.90 | 27.89 | 19.99 |
| HSR/min | 1.52 ± 1.23 | 0.00 | 7.17 | 7.17 | 5.18 ± 1.67 | 2.51 | 8.91 | 6.40 |
| SPR/min | 0.24 ± 0.54 | 0.00 | 4.50 | 4.50 | 0.93 ± 0.59 | 0.00 | 2.67 | 2.67 |
| ACC/min | 2.65 ± 0.94 | 0.52 | 6.22 | 5.70 | 3.43 ± 0.69 | 1.94 | 4.85 | 2.91 |
| DEC/min | 0.98 ± 0.39 | 0.23 | 2.50 | 2.27 | 1.41 ± 0.38 | 0.77 | 2.28 | 1.51 |
| IMA/min | 5.65 ± 1.49 | 2.12 | 10.29 | 8.17 | 5.33 ± 1.59 | 3.50 | 10.35 | 6.85 |
| PL/min | 7.19 ± 1.49 | 3.63 | 12.20 | 8.57 | 10.88 ± 1.83 | 7.41 | 17.15 | 9.74 |
|
Internal TL variables |
||||||||
| TRIMP | 10.138.57 ± 2837.25 | 4970.10 | 18104.89 | 13134.79 | 15402.90 ± 1616.32 | 11590.88 | 18921.23 | 7330.35 |
| eTRIMP | 160.18 ± 33.36 | 91.00 | 227.00 | 136.00 | 222.48 ± 67.51 | 92.00 | 396.00 | 304.00 |
| HR exer | 6341.53 ± 1968.51 | 2813.87 | 13786.94 | 10973.07 | 10131.31 ± 2528.90 | 4667.89 | 16575.69 | 11907.80 |
| HR exer/min | 88.74 ± 14.10 | 54.89 | 144.50 | 89.61 | 110.78 ± 25.04 | 49.92 | 172.72 | 122.80 |
| RPE | 4.64 ± 1.71 | 1.00 | 9.00 | 8.00 | 9.12 ± 0.78 | 8.00 | 10.00 | 2.00 |
| s-RPE | 423.71 ± 217.06 | 80.00 | 1130.00 | 1050.00 | 836.81 ± 121.28 | 528.00 | 1000.00 | 472.00 |
TL = training load, sd = standard deviation, min = minimum, max = maximum, TDu = total duration (h:m:s), TD = total distance (m), MSR = medium-speed running distance (m), HSR = high-speed running distance (m), SPR = sprint distance (m), ACC = accelerations in distance (m), DEC = decelerations in distance (m), IMA = inertial movement analysis (n), PL = player load (AU), TRIMP = training impulse (AU), eTRIMP = Edward's TRIMP (AU), HR exer = heart rate exertion (AU), RPE = rating of perceived exertion (AU), s-RPE = session-RPE (AU).
Disclaimer/Publisher’s Note: The statements, opinions and data contained in all publications are solely those of the individual author(s) and contributor(s) and not of MDPI and/or the editor(s). MDPI and/or the editor(s) disclaim responsibility for any injury to people or property resulting from any ideas, methods, instructions or products referred to in the content. |
© 2025 by the authors. Licensee MDPI, Basel, Switzerland. This article is an open access article distributed under the terms and conditions of the Creative Commons Attribution (CC BY) license (http://creativecommons.org/licenses/by/4.0/).
Copyright: This open access article is published under a Creative Commons CC BY 4.0 license, which permit the free download, distribution, and reuse, provided that the author and preprint are cited in any reuse.


