
Submitted:
29 April 2025
Posted:
29 April 2025
You are already at the latest version
Abstract
Background/Objectives: understanding the relationship between physical demands and game performance is essential to optimize player development and management in basketball. This study aimed to examine the association between game performance and physical demands in youth male basketball players. Methods: Fifteen players (16.3 ± 0.7 years) from a Spanish 4th division team were monitored over seven official games. Game performance variables were extracted from official statistics, including traditional and advanced metrics. Physical demands were monitored using Electronic Performance Tracking System device, combining positioning system and inertial sensors. Partial correlations, controlling for minutes played, were calculated to explore associations between physical demands and performance variables, both for the entire team and by playing position. Results: Significant correlations between physical demands and game performance were observed. Points scored correlated strongly with total distance and high-intensity accelerations, while assists correlated with high-intensity decelerations. Inertial metrics, such as Player Load and the number of jumps, showed large correlations with points, two-point attempts, and efficiency rating. Positional analysis revealed stronger and more numerous correlations for centers compared to guards and forwards. Inertial sensor-derived metrics exhibited a greater number and strength of correlations than positioning metrics. Conclusions: Game performance and physical demands are intrinsically related, with specific patterns varying by playing position. Inertial sensors provide valuable complementary information to positioning systems for assessing physical demands in basketball. These findings can assist practitioners in tailoring monitoring and training strategies to optimize performance and manage player workload effectively.
Keywords:
external load
; load monitoring
; performance
; injury prevention
1. Introduction
Basketball is one of the most widely played and followed sports globally, engaging millions of participants and enthusiasts [1]. Its popularity stems from sport’s dynamic nature, physical demands, technical skills, and tactical complexity[2]. Besides, it is characterized by high-intensity actions such as changes of direction, jumps, and physical impacts, which require a minimum level of physical fitness, combined with mastery of specific technical skills (e.g., shooting, passing, dribbling), tactical knowledge (e.g., reading concepts, game systems, strategies), and the ability to make quick decisions in a chaotic and ever-changing environment [3].
This combination of elements necessitates the active participation of all players on the court during both offensive and defensive phases. As a result, recording and analyzing game events has become a key aspect of performance evaluation [4]. Over the past decades, these methods have evolved from traditional statistics to advanced metrics, with the National Basketball Association serving as a benchmark in the identification, formulation, and promotion of performance evaluation metrics [5]. These statistics have played a crucial role in assessing both individual and team performance. Traditionally, the most used metrics focused on basic parameters such as points, rebounds, and assists. However, with the advent of technological tools and the incorporation of data science methodologies, advanced statistics have emerged, enabling deeper and more precise evaluations[4]. These advanced metrics integrate temporal variables and probabilities of events occurring, such as the number of potential rebounds available following missed shots. By relativizing events, new metrics have been developed. Among these variables, offensive rating, defensive rating or usage rate, have been highlighted as the most used, offering a more holistic understanding of a player’s contribution to team success. These metrics surpass traditional measures like player efficiency ratings, which aggregate various variables [5].
Concurrently, interest in assessing the physical demands faced by players during competition has grown as well. These demands include variables such as total distance covered, the number and intensity of sprints, and high-intensity accelerations and decelerations during games. These metrics are derived from change in positioning of the players over time. A method and metrics imported to indoor sports from outdoor sports, such as football and rugby [6]. Outdoors’ sports demand high rates of locomotion and in which both success and fatigue-related actions are linked to a change of position. In the case of indoor sports, where spaces for each player are smaller, there are not so many possibilities of displacement, and the performance in the game has been related more to high intensity actions in different planes of movement, including acceleration, change of direction, jumps or impacts [7]. Many of these actions occur with little or no movement of the players in space, so positioning systems, especially in vertical jumping actions or fighting between players, have limitations in monitoring physical demands in basketball [8]. For this reason, the use of inertial sensors (a combination of accelerometers, gyroscopes and magnetometers) has been proposed for the quantification of physical demand to assess physical, allowing the recording of actions that occur with little or no displacement and at a high speed, thus avoiding the limitations of positioning systems [8,9]. It also allows for continuous and independent monitoring as it does not require the installation of anchors systems. However, they are not incompatible monitoring systems in any case, as in recent years some manufacturers have developed called Electronic Performance Tracking Systems (EPTS), which integrate both sensors and provide a deeper overview of the physical demands [10].
The integration of performance evaluation through globally recognized methodologies and load monitoring using validated devices has driven recent studies exploring the relationship between game performance and physical demands [9,11,12]. Nevertheless, findings to date have been inconsistent for our knowledge. For example, in male basketball players, studies employing traditional statistical metrics and positioning system data have not found significant relationships [11,13]. Conversely, in female basketball players, significant relationships have been reported using inertial sensors and advanced statistical metrics [9]. Espasa et al. (2024) highlighted methodological differences, including data acquisition methods, variables used, and statistical analyses developed, as the primary reasons for these discrepancies. Despite this lack of methodological consensus about how to evaluate game performance and physical demands, both constructs are intrinsically linked, emphasizing that fatigue may impair a player’s ability to execute technical skills and make effective tactical decisions [14]. For these reasons, proper load management would maximize performance without compromising player’s health [15,16].
Based on this background, the primary objective of this study is to examine the relationship between physical demands, evaluated using EPTS, and game performance, assessed through traditional and advanced statistics, in male basketball players. This analysis aims to provide an integrated perspective on how physical demands during competition influence statistical performance, offering valuable insights for coaches and physical trainers to optimize sports performance.
2. Materials and Methods
2.1. Participants
Fifteen young and highly trained [17] male basketball players (mean age: 16.3 ± 0.7 years at the start of the season) from a 4th Spanish League Team participated in this study (from October 2023 to April 2024). All players participated in at least two games. The players were categorized by coaches as follows: (1) guards; (2) forwards; and (3) centers. The positions were established by the technical staff by consensus, indicating which player corresponded to each of the categories. All participants were healthy before starting data collection.
Players were routinely monitored during the entire competitive season [18]. This study was approved by the Ethics Committee of Clinical Research of the Sports Administration of Catalonia (code 013/CEICGC/2022) and the Institutional Review Board of the club. Also followed the ethical standards of the Committee for Responsible Human Experimentation (established by Law 14/2007, Spain) and the principles of the Declaration of Helsinki [19]. Before collecting data, all players were informed about the research procedures and agreed to participate providing written consent. The data obtained were treated with confidentiality, complying with the Organic Law 15/1999 of the 13th of December on the Protection of Personal Data and the General Data Protection Regulation applicable within the European Union [20].
2.2. Procedures
A descriptive and comparative design was used to examine the relationship between player’s physical demands and performance. All games were conducted following FIBA basketball rules during the complete 2023/24 season. Data was collected from a total of seven official games, which were played at the home arena. All players were monitored using performance-tracking devices (Wimu, Hudl ® SL, Lincoln, NE, USA). The device (81 × 45 × 15 mm, 70 g) was placed on the upper back using an adjustable top (Figure 1A). This device collects different sensor signals through ultrawide band and inertial technologies. Using ultrawideband signals into a local reference system setup through a total of six anchors (Figure 1B), the device might register during every moment its position in the court and its position changes over time, letting it self-calculate variables related to space and time (speed and accelerations). On the other hand, due to the device is equipped with a total of four accelerometers that record in different magnitude spectrums (x2: 16 G; x1: 32 G; x1: 400 G at 1000 Hz), three gyroscopes (x2: ±2000 degrees per second; x1: ±4000 degrees per second at 1000 Hz), a magnetometer (±8 Gauss at 160 Hz), and one barometer (±1200 mbar at 100 Hz) using a sampling frequency of 100 Hz [21]. All used variables were described below. All games were video recorded by automatic cameras Pixellot Show S3 (Pixellot®, Tel Aviv, Israel). The video, positioning, and IMU signals were synchronized using the specific software of the manufacturer, SPROTM (version 2.2.0, Wimu, Hudl ® SL, Lincoln, NE, USA). After it, game periods and player activity on the court signals were identified and selected for the analysis, excluding intervals between quarters and timeouts. Subsequently, the data collected during these periods were incorporated into the final statistical analysis.
2.3. Variables
All variables studied were categorized as independent and dependent. While the metrics used for game performance evaluation were considered independent, the variables related to physical demands were considered as dependent, considering two subcategories based on methods used: positioning or inertial sensors.
2.3.1. Game Performance Variables
Statistical data were retrieved from the official website of the Spanish Basketball Federation (https://baloncestoenvivo.feb.es/, accessed on 28th November 2024) and recorded in a customized Excel ® spreadsheet (Microsoft Corporation, Redmond, Washington, DC, USA). The variables used for game performance analysis included the following: (1) total minutes played; (2) points scored; (3) free throws made and attempted (FT: M/A); (4) two-point field goals made and attempted (2P: M/A); (5) three-point field goals made and attempted (3P: M/A); (6) offensive rebounds (OR); (7) defensive rebounds (DR); (8) total rebounds (TR); (9) assists; (10) steals; (11) turnovers; (12) fouls committed; (13) fouls received (FR); (14) efficiency rating (ER); and (15) balance. From this data, advanced statistical variables were calculated based on possessions and total opportunities in each action. The advanced variables included: (1) effective field goal percentage (eFG%); (2) true shooting percentage (TS%); (3) assist-turnover ratio; (4) offensive rebound percentage; (5) defensive rebound percentage; (6) possessions; (7) points per possession (PPP); and (8) player usage percentage (PU%). The formulas used to compute advanced statistics were based on those proposed by the National Basketball Association [5]. Furthermore, player position was treated as a categorical independent variable, classifying players based on their tactical roles on the court. Game quarters and different matches were also considered as temporal independent variables, allowing for the examination of how physical demands fluctuate over the course of a game and among various matches.
2.3.2. Physical Demands Variables: Positioning System
The variables derived from the players' positioning on the court were as follows: 1) total distance covered (TD); 2) absolute high-speed running (HSR: >18 km/h); 3) number of high-intensity accelerations (Hi-Acc: >3 m/s²); and 4) number of high-intensity decelerations (Hi-Dec: <-3 m/s²). The dwell time of acceleration was fixed at 0.5 s [22].
2.3.3. Physical Demands Variables: Inertial Movement Units
The variables reported by the sensors included in the analysis were as follows: player load (PL), high-intensity player load (Hi-PL, >2G) [23], jumps, jumps’ high-intensity takeoff (Hi-Takeoff), jumps’ high-intensity landing (Hi-Landing) [24], high-intensity horizontal impacts (Hi-HI) [25], the sum of change in inertia (COI), and the sum of high-intensity change in inertia (Hi-COI) [26].
2.4. Statistical Analysis
Descriptive (mean ± standard deviation) and normality tests (Shapiro–Wilk) were initially performed for all variables by two levels, all players and clustered by position, to determine the data distribution for each case. Parametric and non-parametric tests were performed in each case. To assess the correlation among variables, partial correlation analyses were conducted, controlling for the variable of minutes played. These partial correlation analyses were performed for both team and position grouping. Accordingly, correlation analyses were developed based on player positions. The analysis was adapted to the distribution of the data, using Pearson’s or Spearman’s test (r or Rho, respectively). The strength of the correlation coefficients was interpreted as small (0–0.3), moderate (0.31–0.49), large (0.5–0.69), very large (0.7–0.89), and near perfect (0.91.0) following Cohen’s scale [27]. Statistical significance was set at p < 0.05. All data were analyzed using Jamovi project (2023), Jamovi ® (Version 2.3) [28].
3. Results
Firstly, to provide context for the data on load and performance during gameplay, the findings from the analyses of various contextual game factors are presented (Table 1).
The results of the descriptive and normality analyses are presented in Table 2, grouping by the team and playing positions. When evaluating the distribution of the data, the independent variables (game performance) that showed a normal distribution were Balance, and PU%. In the case of the dependent variables (physical demand variables), on one hand, the normality was met for only for TD, PL and Hi-PL).
On the other hand, after analyzing the distribution by positions, in the case of guards the normality was found for minutes played, 2P%, DR, TR, assists, FR, +/-, balance, eFG%, DRB, possessions, PPP, and PU%, while normality was identified for all physical demands’ variables except Hi-HI. Regarding forwards, the variables which showed normal distribution of their game performance were only minutes, balance and PPP. For physical demands all variables followed normality except Hi-HI, Jumps, Hi-Takeoff and Hi-Landings. Finally, centers showed normality for minutes, 2PA, +/-, balance, TS%, possessions, PPP and PU% and for all physical demands variables except for Hi-HI.
3.1. Physical Demand During Competition by Positions
The descriptive analysis of physical demand data revealed positional differences in movement volume and high-intensity actions (Table 2).
Guards covered the greatest total distance on average (TD = 2965.81 ± 1453.80 m) and recorded the highest number of high-intensity accelerations (Hi-Acc = 39.07 ± 21.16) and decelerations (Hi-Dec = 42.79 ± 26.54), emphasizing their greater movement workload. Forwards displayed moderate values across most metrics, with Jumps (24.53 ± 13.29) and Player Load (PL = 42.69 ± 14.43 AU) standing out as key variables. In contrast, centers recorded the lowest movement-related values (TD = 2207.62 ± 1143.64 m) but exhibited higher values for jumping-related variables, such as Hi-Takeoff (11.00 ± 7.22) and Hi-Landing (11.38 ± 6.91).
Significant differences were observed in high-intensity variables, with guards representing the highest number of Hi-Acc and Hi-Dec actions (p < 0.05). In contrast, centers exhibited a significantly greater number of high-intensity landing actions (Hi-Landing, p < 0.01),
3.2. Correlations Between Game Performance and Physical Demands
3.2.1. Partial Correlations by Team Data
The results of the partial correlation analyses between game performance and physical demands are presented in Table 3. The analysis revealed that the strength of these relationships ranged from small to large (0.234 – 0.604). Notably, large correlations were identified for Points, 2PA, ER, TR, PPP, DR, PPM, PU%, 3PA, and 2PM with various physical demand metrics.
When analyzing the correlations between game performance variables and physical demands derived from positioning metrics, the strongest associations were observed between points and TD (r = 0.646, p < 0.001), as well as Hi-Acc (Rho = 0.503, p < 0.01). In contrast, Hi-Dec demonstrated the strongest correlation with assists (Rho = 0.46, p < 0.01). The HSR exhibited only small correlations with various performance metrics, with the most notable relationship observed with TS% (Rho = 0.286, p < 0.05). However, the remaining correlations between positioning metrics and game performance variables were statistically significant (p < 0.001).
Regarding inertial sensor-derived metrics, two-point field goal attempts (2PA) exhibited large correlations with Player Load (PL) (r = 0.626, p < 0.001), high-intensity takeoff (Hi-Takeoff) (Rho = 0.566, p < 0.01), high-intensity landing (Hi-Landing) (Rho = 0.549, p < 0.01), and changes of inertia (COI) (Rho = 0.520, p < 0.01). Similarly, points scored (PTS) demonstrated strong correlations with PL (r = 0.603, p < 0.001), high-intensity player load (Hi-PL) (Rho = 0.548, p < 0.01), Jumps (Rho = 0.644, p < 0.001), and Hi-Takeoff (Rho = 0.527, p < 0.01). In case of ER, large correlations were found with PL (r = 0.584, p < 0.001) and Hi-Landing (Rho = 0.501, p < 0.01). TR exhibited large correlations with Hi-Takeoff (Rho = 0.505, p < 0.01) and Hi-Landing (Rho = 0.576, p < 0.001), while defensive rebounds (DR) showed a significant correlation with Hi-Landing (Rho = 0.546, p < 0.01). For PU%, the strongest correlation was found with Jumps (Rho = 0.517, p < 0.01). Additionally, PPP displayed strong correlations with Jumps (Rho = 0.547, p < 0.01). Lastly, 2PM was significantly correlated with Jumps (Rho = 0.501, p < 0.01). The weakest correlations were observed between game performance indicators and Hi-HI, with moderate associations identified for 1FM (Rho = 0.484, p < 0.05), 1FA (Rho = 0.478, p < 0.05), and FR (Rho = 0.468, p < 0.05).
3.2.2. Partial Correlations by Positions
Partial correlations between performance and physical demands data were analyzed by position. Analyzing the physical demands variables by positions the distribution of data was normal except in the case of Hi-HI for Guards and Centers. Table 5, includes the total number and maximal level of correlation of partial correlations among variables from LPS and IMU systems by groups for the rest of them.
When analyzing correlations by playing position, guards exhibited the lowest number of significant associations, both with positioning system variables (7 correlations) and inertial sensor metrics (19 correlations), compared to forwards and centers. However, all significant partial correlations identified were of large or very large magnitude (0.606 – 0.791). The strongest correlation among positioning variables and game statistics was observed between HSR and eFG% (r = 0.651, p < 0.05). Additionally, an inverse correlation between OR and HSR (Rho = -0.616, p < 0.05). Among inertial sensor metrics, Ass exhibited the highest number of correlations (n = 4), though the strongest association was found between 3FGM and Jumps (Rho = 0.791, p < 0.01). The Jumps and PL metrics were the most frequently correlated with performance variables.
Forwards exhibited a total of 14 significant correlations between positioning system variables and game performance metrics. Among these, TD showed the highest number of correlations (n=10), with its strongest association observed with steals (Rho = 0.492, p < 0.01), indicating that greater movement volume may contribute to defensive playmaking. Regarding inertial sensor-derived metrics, a total of 42 correlations were identified, which is three times more than those detected for positioning system metrics. Among these, the most notable relationships were: Jumps and 2FGA (Rho = 0.847, p < 0.001), reinforcing the strong link between jumping actions and offensive shot creation; Hi-Takeoff and TR (Rho = 0.573, p < 0.01), as well as FR (Rho = 0.592, p < 0.01), suggesting that explosive jumping efforts contribute to rebounding and drawing fouls; and Assists and Hi-Landing (Rho = 0.356, p < 0.05), indicating that landing mechanics might be linked to playmaking opportunities, potentially in transition or post-rebound scenarios.
Centers exhibited the highest number of significant correlations, reinforcing the strong link between physical workload and game performance in this subgroup. The highest correlation values were observed between total distance covered (TD) and points scored (Rho = 0.836, p < 0.001), 2FA (Rho = 0.815, p < 0.001), and assists (Rho = 0.732, p < 0.001), suggesting that movement volume plays a significant role in scoring and playmaking among centers. Additionally, Jumps were strongly correlated with points scored (Rho = 0.863, p < 0.001) and 2FGA (Rho = 0.847, p < 0.001), highlighting the reliance on jumping actions for offensive production. The high-intensity horizontal impacts (Hi-HI) variable showed a very large correlation with offensive rebounds (OR, Rho = 0.794, p < 0.001), reinforcing the importance of physical contact in rebounding success.
4. Discussion
The primary objective of this study was to analyze the relationships between game performance and physical demands in male basketball players, utilizing metrics from positioning systems and inertial sensors. The main findings confirmed that game performance metrics are significantly correlated with physical demands, identifying greater relationship between points and TD and Hi-Acc, while assists showed a moderate level of correlation with Hi-Dec, suggesting that rapid deceleration actions may facilitate playmaking opportunities. Regarding the relationship between performance and metrics of IMUs, 2PA correlated with PL, Hi-Takeoff, and Hi-Landing, and COI, while points demonstrated significant correlations with PL, Hi-PL, Jumps, and Hi-Takeoff, being both the performance variables who more correlated with physical demands. This suggests that higher outputs in game performance metrics could arrow that the player was exposure to a higher demands too. This finding could be of interest to better contextualize and understand the physical demands during competition, particularly in context where monitoring technology is unavailable.
To address the study's objectives, the authors introduced two methodological modifications compared to prior scientific literature, which are detailed in the following sections. Subsequently, the results obtained from the analyses are discussed.
The first methodological consideration is the treatment of performance metrics as independent variables and physical demands as dependent variables. While this approach is not novel [9], it involves analyzing the data under the assumption that observed physical demands are the result of specific game actions (successful or otherwise). Conversely, the opposing framework has led some authors to claim that physical demands facilitate game performance [11,13,29]. Although both constructs are inseparable and essential for understanding performance and physical demands, it is recommended not to interpret physical demands recorded during gameplay as indicators of fitness levels or athletes’ maximal conditional capabilities. These values are instead a result of the chaotic and stochastic nature of the game, influenced by tactical intentions from coaches, individual player talent, and other factors. An example, based on the findings of this study, is the identification of a relationship where a higher volume of shots (a statistical performance indicator) translates into an increased number of jumps (physical demands), especially accentuated in the Center position. The authors consider this a key point for reflection, which could help future researchers and practitioners better understand the relationship between game performance and the physical efforts required.
Moreover, this study employs partial correlation analyses controlling for playing time. This approach, previously proposed in earlier studies [9], differs from the bivariate correlations commonly used in this type of analysis [11,13,30,31,32]. This previous research has proposed two approaches to address the issue of varying playing time exposure in sports with unlimited player substitutions: setting arbitrary participation thresholds or using time-relative metrics. The first approach excludes players who, despite participating for only a few minutes, may play decisive roles in the team’s performance. The second, while potentially addressing the limitations of the former, may not fully account for the cumulative impact of fatigue throughout a game. Additionally, this second type of analysis requires meticulous data handling to exclude continuous pauses during the game, which could otherwise overlook high-intensity actions occurring during stoppages (e.g., baseline or sideline throw-ins).
The use of partial correlations aims not only to mitigate exposure differences among players but also to acknowledge that the initial minutes of play occur under conditions of lower fatigue, which progressively increases as the game unfolds. This factor, not previously emphasized in literature, significantly influences tactical decisions by coaches and the execution of high-intensity actions by players and should be further explored in future research. While the partial correlation approach may have its own limitations, it is proposed as a starting point for collective reflection in the search for a solution to better understand the impact of it on performance, physical demands, and fatigue.
4.1. Performance and Physical Demands Correlations
The correlation analysis revealed significant associations between game performance and positioning metrics. Notably, TD and Hi-Acc showed associations with points scored (r = 0.604, p < 0.001; and Rho = 0.526, p < 0.001, respectively). These correlations could be explained by the need to find open spaces away from defenders to execute shots and score, which inherently requires covering more ground and/or performing high-intensity accelerations [33]. This notion is further supported by the observed correlations between TD and Hi-Acc with 2PA and 3PA. Similar findings have been reported in the literature, highlighting that covering greater distances and performing intense accelerations could align with a fast and aggressive playing style that promotes more opportunities for fast breaks and transition shots [34], ultimately increasing the likelihood of scoring more points.
Additionally, Hi-Dec was significantly correlated with assists. This finding suggests that the ability to brake quickly and in a controlled manner may be critical for creating spaces and passing opportunities, providing empirical support for the idea that sharp changes in pace can “break” defensive setups and facilitate ball distribution [35]. On the other hand, HSR showed few significant correlations and generally low magnitudes, with a slightly higher correlation observed with TS%. Overall, the observed correlations between performance variables and positioning metrics are consistent with previous studies [9,12,36]. Unlike other sports, the small dimensions of the basketball court and frequent interruptions in play make peak speeds (long sprints) less common. Instead, short and explosive actions, such as accelerations, decelerations, and changes of direction, become more relevant [36]. At this point, it is worth questioning whether high-intensity positioning variables (Hi-Acc and Hi-Dec) are the most appropriate metrics to describe physical demands in basketball.
Regarding the inertial sensors’ metrics, the highest correlations were observed between 2PA and metrics such as PL, Hi-Takeoff, and Hi-Landing. Given that prior research has reported strong relationships between movement volume metrics, such as TD and PL [37], it is not surprising that similar correlations were found between these two metrics and basketball statics. Furthermore, the association of jump-related metrics and 2PA may highlight the importance of jumping actions performed during drives to the basket [9,38]. While this finding applies to the total number of two-point attempts, a large association was also observed between total points scored and metrics like Hi-PL, Jumps, and Hi-Takeoff. This underscores the physical cost of achieving offensive success (e.g., absorbing impacts and generating lower limb power). The importance of jumping during the game is also evident, having shown correlations between TR and DR and Jumps, Hi-Takeoff, and Hi-Landing. These correlations suggest that rebounding actions involve substantial physical demands. They are associated not only with the jump variable but also with indicators of high-velocity efforts (Hi-Takeoff) and great impacts (Hi-Landings). Therefore, the number of rebounds captured may reflect greater physical exertion throughout the match.
Furthermore, the correlation between PU% and Jumps suggests that players who perform more jumping actions during a game may be more involved in offensive situations, including drawing fouls that lead to free throws. Similarly, the positive association between metrics like 2PM or PPP and jumping metrics reinforces the idea that repeated jumping actions contribute directly to offensive performance. This could occur by generating second-chance opportunities or enhancing efficiency in close-range finishes near the basket.
4.2. Performance and Physical Demands Correlations by Positions
In male basketball, physical demands differ significantly across playing positions, primarily due to the unique roles and responsibilities associated with each position. The results of the partial correlations for each playing position revealed notable differences in which performance variables were correlated, the number of correlations observed, and their magnitude.
As mentioned below, basketball is a sport that involves numerous actions such as changes of direction, pivoting, physical contests, and jumps, which may not be fully captured by positioning variables, as they often lack significant player displacement yet require considerable physical effort. Mainly reason for including IMUs as load monitoring method. The results of this research not only showed different correlation level between game performance metrics and physical demands among positions, also the game performance and physical demand metrics were different, with some being collected through positioning and others through IMUs. These findings suggest that it could be necessary to study physical demands through different variables for each position. All these observed differences will be discussed in detail below.
4.2.1. Guards
Guards exhibited the fewest significant associations with both positioning variables (n=7) and inertial sensor-derived metrics (n=19). However, all recorded correlations were of high or very high magnitude (r = 0.606–0.791), highlighting that while their load patterns may not be broadly related to a wide range of performance indicators, the intensity of these relationships is notable when they occur. Of particular interest is the strong positive correlation between eFG% and HSR. This is noteworthy as high-speed distance covered did not even show moderate correlations in the team-level analysis. This suggests that highly efficient guards tend to execute movements at higher speeds. Fast-break situations, where guards are typically responsible for ball handling, likely elevate speed and create such scenarios [39]. Furthermore, considering that HSR is likely to occur during counterattacks, it can be hypothesized that these counterattacks contribute to an increase in eFG%. Maintaining possession through offensive rebounds slows the pace of play, reducing the need for high-speed transitions. Since second-chance opportunities allow teams to reset their offense, guards are less likely to sprint in fast-break situations.
All inertial sensor metrics that showed associations with game performance were related to PL and jumping actions (Jumps, Hi-Takeoff, and Hi-Landing). Regarding PL, the highest correlations were found with defensive rebounds and assists (r = 0.729, p < 0.01; and r = 0.712, p < 0.01, respectively). The authors hypothesize that these actions are preceded by physical contests and struggles with opponents, which increase PL. On the other hand, jumping actions were more strongly related to shooting metrics. For example, 3PM (Rho = 0.791, p < 0.05) and 3PA (Rho = 0.698, p < 0.05) demonstrated strong correlations with Jumps, suggesting that intense lower-limb muscle activation is required by guards when performing long-range shots. Future studies should analyze this potential correlation.
4.2.2. Forwards
For forwards, 14 significant associations were identified with positioning system metrics, with TD appearing in 10 of them, although none reached a large magnitude. This phenomenon could indicate that the involvement of forwards in both offense and defense requires covering more ground compared to guards or centers (2965 vs. 2608 and 2708 meters, respectively). This idea is further supported by correlations between global performance evaluation metrics such as ER, +/−, or PU and TD. It raises the question of whether the role of this position involves accumulating more meters due to increased movement on both sides of the court, an idea previously noted by other authors [13,39]. Among these correlations, the strongest was observed with steals (Rho = 0.492, p < 0.05). This could be attributed to the fact that more steels create transition opportunities, allowing them to exploit open spaces to run in fast-break situations.
A remarkable increase in associations was observed when considering IMU metrics (n=42), tripling the number found for positioning variables. This reinforces the idea that inertial sensors provide a more detailed capture of the variety of explosive and contact actions that characterize the hybrid role of forwards. Among these, notable relationships include Jumps with 2PA (Rho = 0.847) and Hi-Takeoff with TR and FR, suggesting that explosive takeoffs are common actions for forwards. These actions appear to be associated with mid-range shots, drives to the basket, and rebound attempts, situations in which there might also be a higher likelihood of drawing fouls.
4.2.3. Centers
Centers exhibited the highest number of significant correlations across a wide variety of metrics, including both positioning and inertial systems. This indicates that their statistical performance (points, shoot attempts, assists, rebounds) is strongly linked to the physical load they endure during games. Notably, there were very high correlations between TD and variables such as points, 2PA, and assists. For centers, the volume of movement may be related to their tactical mobility, both offensively (e.g., creating space to receive passes and score) and defensively (e.g., rotations and help defense). Similarly, Jumps emerged as a critical factor, showing strong correlations with Points (r = 0.863) and 2PA (r = 0.847). This highlights the reliance of centers on these actions for offensive production, whether in post-up plays, "pick and roll" actions, or offensive rebounds leading to second-chance opportunities. This idea is further supported by the correlation between global performance, measured by ER, and Hi-Takeoff (Rho = 0.828, p < 0.001). This finding indicates that part of the physical demand accumulated by inside players is found in the quantity and intensity of these vertical component actions.
For the first time, for the best of the authors knowledge, correlations between Hi-HI and player performance were observed, specifically with offensive rebounds. This finding suggests that physical contact, collisions, and body impacts during rebounding battles are critical determinants of centers' performance [22]. The physicality required in these paint-area duels demands a high degree of impact resistance, underscoring the unique physical demands of this position. These findings highlight distinct movement patterns based on playing position, reinforcing the need for position-specific physical preparation strategies.
4.3.4. Difference Among Positions
The differences observed in correlations across positions (the predominance of certain variables over others and their significance levels) underscore the importance of individualizing the monitoring process for physical demands. While the general analysis of partial correlations provides an integrated team view to identify broad trends affecting collective performance, a more detailed position-specific analysis reveals key nuances associated with the unique characteristics and responsibilities of each role. Combining these two perspectives offers a more comprehensive and practical understanding of the impact of physical demands on performance, enabling both collective and individualized strategic interventions to enhance physical preparation and competitive performance.
4.3. Positioning and Inertial Systems for Physical Demand Monitoring in Basketball
At this point, it is important to remember that positioning systems were originally developed for outdoor sports like soccer and rugby [6] and were later adapted for indoor games. These sports not only take place in enclosed arenas (requiring the development and implementation of specific monitoring technologies) but also feature markedly different rules, notably smaller playing areas and unlimited player substitutions. Given these differences, it is necessary to reflect on whether sports like basketball should reconsider how load-monitoring methods have been utilized to describe and evaluate the physical demands of specific actions.
Although the percentage of correlations between positioning and inertial variables was similar, inertial sensors showed higher levels of correlation and greater significance, both in team-wide analyses and when broken down by positions. For example, in the case of 2PA, only TD demonstrated a large correlation among positioning metrics, whereas six variables derived from IMUs showed large correlations. Findings like this highlight the potential of IMUs compared to positioning systems for describing physical demands in basketball. While past studies have already explored the relationship between these two systems [40], future position-specific analyses could help further refine the metrics of interest for each role on the court, enabling a deeper understanding of the impact of physical demands and allowing for the individualization of recovery and training processes.
4.3. Limitations and Future Research
Despite the relevance of these findings, several limitations of the study must be considered. First, correlations, even when statistically significant, do not imply causation. It cannot be conclusively stated that higher physical demand "cause" better performance, such as technical, tactical, psychological or team dynamics factors could influence both variables. Furthermore, the assumptions discussed lack data on opponents. Second, the sample size and the number of games analyzed may limit the generalizability of the results to other competitions, categories, or skill levels. Third, the potential effects of specific player roles (e.g., playmaker, shooter) were not accounted for.
While addressing these limitations is challenging, future studies should aim to tackle them. First, the authors consider it essential to validate all the described findings through video analysis, synchronizing performance and physical demand metrics, and including, where possible, data on opponents (e.g., statistics, physical demands, tactical variables). Additionally, leveraging the insights gained to narrow the selection of variables, longitudinal analyses should be conducted to establish the evolution of demand and their impact on individual and team performance improvement. Finally, it is necessary to reach a scientific consensus to identify specific roles within the same position, a common practice in professional basketball [41]. Such an approach would help to better understand the specific requirements of actions linked to performance.
4.4. Practical Applications
Understanding the physical demands of action reflected in statistical performance during basketball games could be highly valuable. This knowledge would benefit a wide range of professionals, including researchers, by providing context for the physical load endured beyond the minutes of exposure during competition.
Furthermore, the observation of a greater number of correlations between basketball-specific actions and inertial sensors, compared to positioning systems (and with higher significance levels), suggests that inertial sensors could be effective and suitable tools for monitoring load. This is particularly relevant given that positioning variables in sports like basketball often present greater accessibility barriers, as they require the installation of antenna systems in arenas. Therefore, the metrics obtained from inertial sensors could be especially useful for practitioners due to their lower cost and lack of need for additional infrastructure.
5. Conclusions
In conclusion, the data presented highlights the importance of studying in-game performance to better understand and contextualize physical demands and, if monitoring technology is available, to choose the appropriate variables to assess players in their specific position. Metrics, such as TD, PL and high-intensity actions, particularly acceleration, decelerations, jumps and impacts, especially during offensive phases and rebound situations showed significant correlation. These findings provide valuable context for evaluating physical demands during competition, even for professionals without access to advanced technology analyzing the stats performance data. This insight may enable practitioners to integrate these insights into technical-tactical decision-making processes to optimize competitive performance. Moreover, the findings emphasize the necessity of accurately monitoring and quantifying physical demands through the combined use of positioning systems and inertial sensors, ensuring that the selection of variables is tailored to each player position. This approach will yield more valuable information for designing individualized strategies to enhance game performance, maintain optimal fitness levels, and ensure long-term health care for athletes.
Author Contributions
Conceptualization, J.E.-L; methodology, J.E.-L., and C.M.-R.; software, C.M.-R.; formal analysis, J.E.-L. and C.M.-R.; investigation, J.E.-L.; resources: J.E-L., and F.G.; data curation, J.E.-L., and J.G.; writing—original draft preparation, J.E.-L.; writing—review and editing, J.E.-L., C.M.-R., F.G., A.F-V; J.G., and J.C.-G.; supervision, A.F.-V., and J.C-G. All authors have read and agreed to the published version of the manuscript.
Funding
This research received no external funding.
Institutional Review Board Statement
This study was conducted in accordance with the Declaration of Helsinki and approved by the Ethics Committee of Clinical Research of the Sports Administration of Catalonia under code 013/CEICGC/2022.
Informed Consent Statement
Informed consent was obtained from all subjects involved in this study. Written informed consent was obtained from the participants to publish this scientific article.
Acknowledgments
The authors express their gratitude to the team coaches and the club for granting access to the data and for sharing their deep and specific knowledge of the sport and their players, which enabled the authors to draw more accurate and insightful conclusions and bring to us new questions for the future.
Conflicts of Interest
The authors declare no conflicts of interest.
Abbreviations
The following abbreviations are used in this manuscript:
| EPTS | EPTS: electronic performance tracking system |
| 2PM | two-points made |
| 2PA | two-points attempted |
| 3PM | three-points made |
| 3PA | three-points attempted |
| OR | offensive rebound |
| DR | defensive rebounds |
| TR | total rebounds |
| FR | fouls received |
| ER | efficiency rating |
| eFG% | effective field goal percentage |
| TS% | true shooting percentage |
| PPP | Points per possession |
| PU% | Player usage percentage |
References
- Russell, J.L.; McLean, B.D.; Impellizzeri, F.M.; Strack, D.S.; Coutts, A.J. Measuring Physical Demands in Basketball: An Explorative Systematic Review of Practices; Springer International Publishing, 2021; Vol. 51; ISBN 4027902001375.
- Petway, A.J.; Freitas, T.T.; Calleja-González, J.; Leal, D.M.; Alcaraz, P.E. Training Load and Match-Play Demands in Basketball Based on Competition Level: A Systematic Review. PLoS One 2020, 15. [CrossRef]
- Fox, J.L.; Scanlan, A.T.; Stanton, R. A Review of Player Monitoring Approaches in Basketball: Current Trends and Future Directions. J Strength Cond Res 2017, 31, 2021–2029. [CrossRef]
- Leicht, A.; Gomez, M.; Woods, C. Team Performance Indicators Explain Outcome during Women’s Basketball Matches at the Olympic Games. Sports 2017, 5, 96. [CrossRef]
- NBA Advanced Stats Glossary.
- Hausler, J.; Halaki, M.; Orr, R. Application of Global Positioning System and Microsensor Technology in Competitive Rugby League Match-Play: A Systematic Review and Meta-Analysis. Sports Medicine 2016, 46, 559–588. [CrossRef]
- McLaren, S.J.; Macpherson, T.W.; Coutts, A.J.; Hurst, C.; Spears, I.R.; Weston, M. The Relationships Between Internal and External Measures of Training Load and Intensity in Team Sports: A Meta-Analysis. Sports Medicine 2018, 48, 641–658. [CrossRef]
- Wellm, D.; Jäger, J.; Zentgraf, K. Dismissing the Idea That Basketball Is a “Contactless” Sport: Quantifying Contacts during Professional Gameplay. Front Sports Act Living 2024, 6. [CrossRef]
- Espasa-Labrador, J.; Martínez-Rubio, C.; Oliva-Lozano, J.M.; Calleja-González, J.; Carrasco-Marginet, M.; Fort-Vanmeerhaeghe, A. Relationship between Physical Demands and Player Performance in Professional Female Basketball Players Using Inertial Movement Units. Sensors 2024, 24, 6365. [CrossRef]
- Robertson, S.; Duthie, G.M.; Ball, K.; Spencer, B.; Serpiello, F.R.; Haycraft, J.; Evans, N.; Billingham, J.; Aughey, R.J. Challenges and Considerations in Determining the Quality of Electronic Performance & Tracking Systems for Team Sports. Front Sports Act Living 2023, 5. [CrossRef]
- García, F.; Fernández, D.; Martín, L. Relationship Between Game Load and Player’s Performance in Professional Basketball. Int J Sports Physiol Perform 2022, 17, 1473–1479. [CrossRef]
- Miró, A.; Vicens-Bordas, J.; Beato, M.; Salazar, H.; Coma, J.; Pintado, C.; García, F. Differences in Physical Demands and Player’s Individual Performance Between Winning and Losing Quarters on U-18 Basketball Players During Competition. J Funct Morphol Kinesiol 2024, 9, 211. [CrossRef]
- Vázquez-Guerrero, J.; Casals, M.; Corral-López, J.; Sampaio, J. Higher Training Workloads Do Not Correspond to the Best Performances of Elite Basketball Players. Research in Sports Medicine 2020, 28, 540–552. [CrossRef]
- Canlı, U.; Arı, Y.; Özmutlu, İ. The Effects of Morphological Structure and Fatigue on the Passing Skill in Pre-Pubescent Basketball Players. J Educ Train Stud 2018, 6, 37. [CrossRef]
- Gabbett, T.J. The Training—Injury Prevention Paradox: Should Athletes Be Training Smarter and Harder? Br J Sports Med 2016, 50, 273–280. [CrossRef]
- Impellizzeri, F.M.; Marcora, S.M.; Coutts, A.J. Internal and External Training Load : 15 Years on Training Load : Internal and External Load Theoretical Framework : The Training Process. Int J Sports Physiol Perform 2019, 14, 270–273.
- McKay, A.K.A.; Stellingwerff, T.; Smith, E.S.; Martin, D.T.; Mujika, I.; Goosey-Tolfrey, V.L.; Sheppard, J.; Burke, L.M. Defining Training and Performance Caliber: A Participant Classification Framework. Int J Sports Physiol Perform 2022, 17, 317–331. [CrossRef]
- Winter, E.M.; Maughan, R.J. Requirements for Ethics Approvals. J Sports Sci 2009, 27, 985–985. [CrossRef]
- World Medical Association Declaration of Helsinki. JAMA 2013, 310, 2191. [CrossRef]
- European Parliament and Council, Regulation (EU) 2016/679. European Parliament and of the Council 2016.
- Gómez-Carmona, C.D.; Rojas-Valverde, D.; Rico-González, M.; Ibáñez, S.J.; Pino-Ortega, J. What Is the Most Suitable Sampling Frequency to Register Accelerometry-Based Workload? A Case Study in Soccer. Proc Inst Mech Eng P J Sport Eng Technol 2021, 235, 114–121. [CrossRef]
- Delves, R.I.M.; Aughey, R.J.; Ball, K.; Duthie, G.M. The Quantification of Acceleration Events in Elite Team Sport: A Systematic Review. Sports Med Open 2021, 7, 45. [CrossRef]
- Gómez-Carmona, C.D.; Bastida-Castillo, A.; González-Custodio, A.; Olcina, G.; Pino-Ortega, J. Using an Inertial Device (WIMU PRO) to Quantify Neuromuscular Load in Running: Reliability, Convergent Validity, and Influence of Type of Surface and Device Location. J Strength Cond Res 2020, 34, 365–373. [CrossRef]
- García-de-Alcaraz, A.; Rico-González, M.; Pino-Ortega, J. Criterion Validity and Reliability of a New Algorithm to Detect Jump Performance in Women’s Volleyball Players. Proc Inst Mech Eng P J Sport Eng Technol 2025, 239, 6–11. [CrossRef]
- Antúnez, A.; López-Sierra, P.; Vila-Suárez, H.; Ibáñez, S.J. Neuromuscular Load in Professional Women’s Handball: Segmentation of the Player Load and the Impacts at Group and Individual Level. Sensors 2024, 24, 5750. [CrossRef]
- Avilés, R.; Brito de Souza, D.; Pino-Ortega, J.; Castellano, J. Agreement, Accuracy, and Reliability of a New Algorithm for the Detection of Change of Direction Angle Based on Integrating Inertial Data from Inertial Sensors. Algorithms 2023, 16, 496. [CrossRef]
- Cohen, J. Statistical Power Analysis for the Behavioral Sciences; Routledge, 2013; ISBN 9781134742707.
- The Jamovi Project 2023.
- Fox, J.; Stanton, R.; J. O’Grady, C.; Teramoto, M.; Sargent, C.; T. Scanlan, A. Are Acute Player Workloads Associated with In-Game Performance in Basketball? Biol Sport 2022, 39, 95–100. [CrossRef]
- Brown, F.S.A.; Fields, J.B.; Jagim, A.R.; Baker, R.E.; Jones, M.T. Analysis of In-Season External Load and Sport Performance in Women’s Collegiate Basketball. J Strength Cond Res 2024, 38, 318–324. [CrossRef]
- Gasperi, L.; Sansone, P.; Gómez-Ruano, M.-Á.; Lukonaitienė, I.; Conte, D. Female Basketball Game Performance Is Influenced by Menstrual Cycle Phase, Age, Perceived Demands and Game-Related Contextual Factors. J Sports Sci 2023, 1–8. [CrossRef]
- Salazar, H.; Castellano, J.; Svilar, L. Differences in External Load Variables Between Playing Positions in Elite Basketball Match-Play. J Hum Kinet 2020, 75, 257–266. [CrossRef]
- Baena-Raya, A.; Díez-Fernández, D.M.; Martínez-Rubio, C.; Conceição, F.; López-Sagarra, A. Kinetic and Kinematic Characteristics Underpinning Change of Direction Performance in Basketball: A Comparative Study Between Sexes and Tests. J Strength Cond Res 2024. [CrossRef]
- Montgomery, P.G.; Pyne, D.B.; Minahan, C.L. The Physical and Physiological Demands of Basketball Training and Competition. Int J Sports Physiol Perform 2010, 5, 75–86. [CrossRef]
- Abdelkrim, N. Ben; El Fazaa, S.; El Ati, J. Time-Motion Analysis and Physiological Data of Elite under-19-Year-Old Basketball Players during Competition. Br J Sports Med 2007, 41, 69–75. [CrossRef]
- Puente, C.; Abián-Vicén, J.; Areces, F.; López, R.; Del Coso, J. Physical and Physiological Demands of Experienced Male Basketball Players During a Competitive Game. J Strength Cond Res 2017, 31, 956–962. [CrossRef]
- Stojanović, E.; Stojiljković, N.; Scanlan, A.T.; Dalbo, V.J.; Berkelmans, D.M.; Milanović, Z. The Activity Demands and Physiological Responses Encountered During Basketball Match-Play: A Systematic Review. Sports Medicine 2018, 48, 111–135. [CrossRef]
- Conte, D.; Favero, T.G.; Lupo, C.; Francioni, F.M.; Capranica, L.; Tessitore, A. Time-Motion Analysis of Italian Elite Women’s Basketball Games. J Strength Cond Res 2015, 29, 144–150. [CrossRef]
- García, F.; Vázquez-Guerrero, J.; Castellano, J.; Casals, M.; Schelling, X. Differences in Physical Demands between Game Quarters and Playing Positions on Professional Basketball Players during Official Competition. J Sports Sci Med 2020, 19, 256–263.
- Heishman, A.; Peak, K.; Miller, R.; Brown, B.; Daub, B.; Freitas, E.; Bemben, M. Associations Between Two Athlete Monitoring Systems Used to Quantify External Training Loads in Basketball Players. Sports 2020, 8, 33. [CrossRef]
- Çene, E.; Özdalyan, F.; Parim, C.; Mancı, E.; İnan, T. How Do European and Non-European Players Differ: Evidence from EuroLeague Basketball with Multivariate Statistical Analysis. Proc Inst Mech Eng P J Sport Eng Technol 2024. [CrossRef]
Figure 1.
A) Positioning of the device in the upper back and anchors distribution in the court. B) Position of anchors in the local positioning system.
Figure 1.
A) Positioning of the device in the upper back and anchors distribution in the court. B) Position of anchors in the local positioning system.
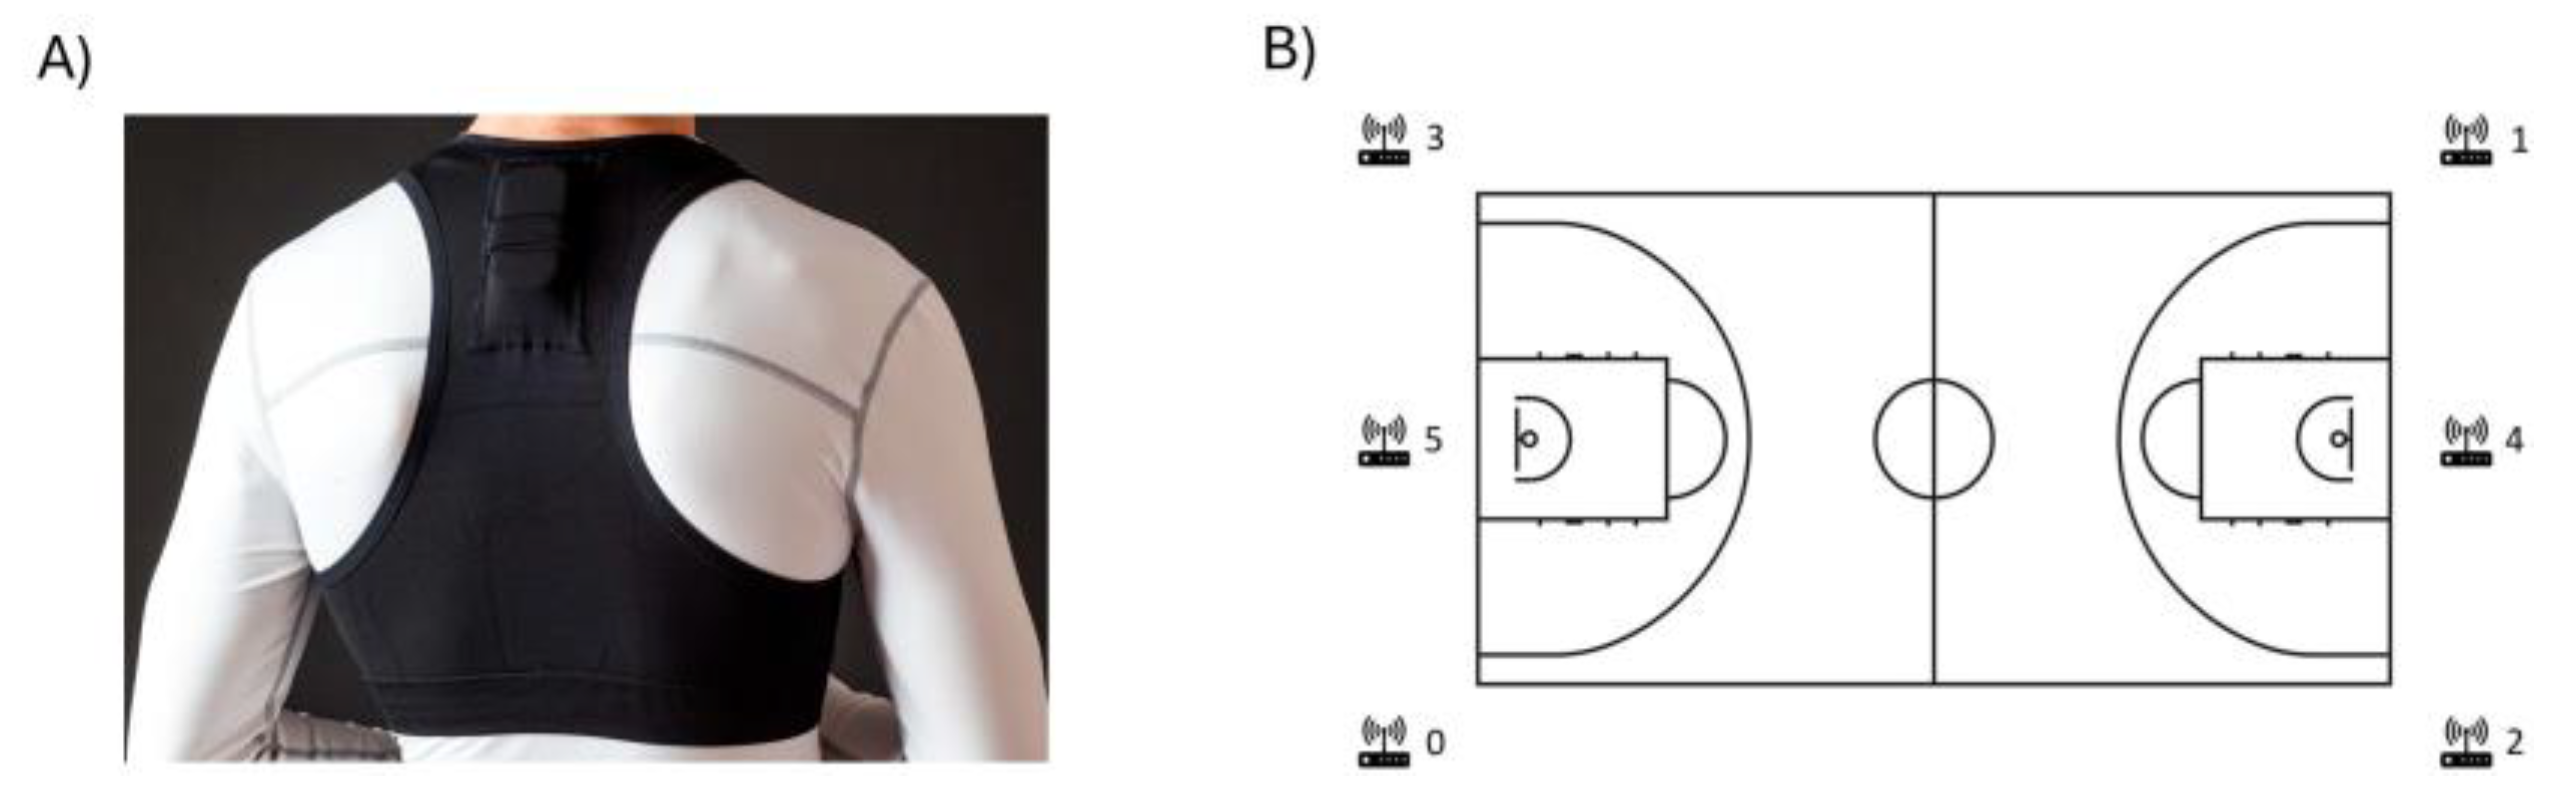

Table 1.
Contextual data of games and team’s stats.
| Game 1 | Game 2 | Game 3 | Game 4 | Game 5 | Game 6 | Game 7 | All games | |
|---|---|---|---|---|---|---|---|---|
| Round (over 30) | 2 | 5 | 7 | 13 | 16 | 19 | 21 | - |
| Rival ranking (over 16) | vs 9th | vs 3rd | vs 6th | vs 7th | vs 11th | vs 2nd | vs 11th | - |
| Score | 88-63 | 86-59 | 73-66 | 95-80 | 68-62 | 75-87 | 76-67 | 533-480 |
| Win/Lose | Win | Win | Win | Win | Win | Lose | Win | 6/7 |
| FT (M/A; %) | 28/34; 0.82 | 25/33; 0.76 | 13/17; 0.76 | 21/28; 0.75 | 15/18; 0.83 | 20/29; 0.69 | 17/29; 0.59 | 139/188; 0.74 |
| 2P (M/A; %) | 18/38; 0.47 | 20/30; 0.66 | 12/24; 0.5 | 16/30; 0.53 | 16/31; 0.52 | 23/40; 0.58 | 19/34; 0.56 | 124/227; 0.55 |
| 3P (M/A; %) | 8/24; 0.33 | 7/19; 0.37 | 12/35; 0.34 | 14/35; 0.4 | 7/22; 0.32 | 3/25; 0.12 | 7/23; 0.30 | 58/183; 0.32 |
| TR: OR/DR (n) | 35: 10/25 | 38: 7/31 | 36: 9/27 | 41: 12/29 | 37: 7/30 | 31: 10/21 | 40: 10/30 | 258: 65/193 |
| Sum of Assists (n) | 18 | 13 | 14 | 18 | 15 | 13 | 9 | 100 |
| Sum of steals (n) | 12 | 10 | 8 | 7 | 10 | 10 | 7 | 64 |
| Sum of TO (n) | 16 | 27 | 21 | 12 | 19 | 18 | 17 | 130 |
| Sum of blocks (n) | 4 | 0 | 4 | 1 | 2 | 3 | 1 | 15 |
| Sum of dunks (n) | 4 | 0 | 4 | 1 | 2 | 3 | 1 | 15 |
| Sum of FC (n) | 22 | 24 | 18 | 17 | 17 | 32 | 23 | 153 |
| Sum of FR (n) | 27 | 23 | 19 | 22 | 17 | 25 | 28 | 161 |
| Sum of ER (au) | 102 | 93 | 77 | 113 | 78 | 66 | 78 | 607 |
| Mean of +/− (au) | 10.42 | 11.25 | 2.92 | 6.82 | 2.50 | -5.00 | 3.75 | 4.66 |
| Mean of possessions (n) | 39.38 | 33.40 | 38.85 | 34.95 | 44.32 | 44.75 | 30.70 | 38.05 |
| Mean of PPP (au) | 0.18 | 0.18 | 0.15 | 0.19 | 0.14 | 0.17 | 0.20 | 0.17 |
| Mean of eFG (%) | 0.38 | 0.55 | 0.39 | 0.48 | 0.32 | 0.38 | 0.42 | 0.42 |
| Mean of ORB (%) | 0.06 | 0.08 | 0.05 | 0.08 | 0.03 | 0.05 | 0.07 | 0.06 |
| Mean of DRB (%) | 0.11 | 0.15 | 0.14 | 0.14 | 0.14 | 0.08 | 0.19 | 0.14 |
| Mean of TS (%) | 0.44 | 0.66 | 0.37 | 0.51 | 0.40 | 0.36 | 0.49 | 0.46 |
| Mean of A/TO | 1.03 | 0.38 | 0.73 | 0.77 | 0.44 | 0.55 | 0.40 | 0.61 |
| Mean of PU (%) | 0.20 | 0.18 | 0.18 | 0.16 | 0.17 | 0.18 | 0.20 | 0.18 |
+/−: player balance; : 2P: two-point field goals (M: made; A: attempted); 3P: three-point field goals (M: made; A: attempted); A/TO: assists–turnover ratio; DR: defensive rebounds; DRB: defensive rebound percentage; eFG: efficiency field goal percentage; ER: efficiency rating; FC: fouls committed; FR: fouls received; FT: free throws (M: made; A: attempted); OF: offensive rebounds; ORB: offensive rebound percentage; PPP: points per possession; TR: total rebounds; USG: usage percentage. au: arbitrary units.
Table 2.
Descriptive (mean ± SD) and normality data by all games and positions.
| All players (n=72) | Guards (n=14) | Forwards (n=36) | Centers (n=21) | |
|---|---|---|---|---|
| TD (m) | 2608.89 ± 1142.35 | 2965.81 ± 1453.80 | 2708.99 ± 977.78 | 2207.62 ± 1143.64 |
| HSR (n)2 | 14.92 ± 7.57 | 11.57 ± 4.38 | 14.44 ± 5.45 | 18.19 ± 10.88 |
| Hi-Acc (n)1,2 | 29.03 ± 14.47 | 39.07 ± 21.16 | 28.06 ± 11.30 | 24.10 ± 11.44 |
| Hi-Dec (n)1,2 | 26.00 ± 17.01 | 42.79 ± 26.54 | 24.53 ± 10.69 | 17.48 ± 9.54 |
| PL (au) | 42.45 ± 17.81 | 47.20 ± 24.50 | 42.69 ± 14.43 | 38.90 ± 18.49 |
| Hi-PL (au) | 14.51 ± 6.34 | 15.87 ± 9.26 | 14.46 ± 4.87 | 13.62 ± 6.55 |
| Jumps (n) | 27.94 ± 18.95 | 35.93 ± 30.89 | 24.53 ± 13.29 | 28.67 ± 16.67 |
| Hi-Takeoff (n) | 10.00 ± 6.76 | 11.57 ± 9.74 | 8.75 ± 4.93 | 11.00 ± 7.22 |
| Hi-Landing (n) | 11.18 ± 7.61 | 13.57 ± 10.98 | 10.06 ± 6.45 | 11.38 ± 6.91 |
| Hi-HI (n)2 | 5.40 ± 5.82 | 8.57 ± 9.71 | 5.31 ± 4.36 | 3.19 ± 3.43 |
| COI (n)1,2 | 153.00 ± 75.14 | 204.93 ± 123.13 | 147.36 ± 44.97 | 128.90 ± 63.86 |
| Hi-COI (n)1,2 | 33.92 ± 21.34 | 50.36 ± 35.20 | 32.75 ± 13.37 | 25.19 ± 15.02 |
* p < 0.05, ** p < 0.01, *** p < 0.001; a: Pearson’s correlation coefficients; β: Spearman correlation coefficients. †: significant difference among quarters; 1: significant difference between guards and forwards; 2: significant difference between guards and centers; 3: significant difference between forwards and centers. COI: changes of inertia; Hi-COI: high-intensity changes of inertia; Hi-HI: high-intensity horizontal impacts; Hi-Landing: jumps’ high-intensity landing; Hi-PL: high-intensity player load; Hi-Takeoff: jumps’ high-intensity takeoff; HSR: high-speed running; PL: player load; TD: distance covered; au: arbitrary units.
Table 3.
Partial correlation between game performance and physical demands obtained from positioning system.
Table 3.
Partial correlation between game performance and physical demands obtained from positioning system.
| Variables | TD (m)a | HSR (n)β | Hi-Accβ | Hi-Decβ |
|---|---|---|---|---|
| Points | 0.604*** | 0.279* | 0.526*** | 0.396*** |
| FTM | 0.386*** | 0.039 | 0.266* | 0.231 |
| FTA | 0.338** | 0.042 | 0.246* | 0.197 |
| 2PM | 0.436*** | 0.252* | 0.367** | 0.223 |
| 2PA | 0.594*** | 0.280* | 0.434*** | 0.308** |
| 3PM | 0.421*** | 0.171 | 0.375** | 0.315** |
| 3PA | 0.445*** | 0.186 | 0.441*** | 0.431*** |
| TR (n) | 0.230** | 0.188 | 0.308** | 0.305** |
| OR (n) | 0.300 | 0.229 | 0.213 | 0.231 |
| DR (n) | 0.337* | 0.155 | 0.298* | 0.283* |
| Assists (n) | 0.499*** | -0.052 | 0.346** | 0.476*** |
| Steals (n) | 0.383*** | -0.188 | 0.199 | 0.340** |
| TO (n) | 0.443*** | -0.034 | 0.194 | 0.294* |
| Blocks (n) | 0.079 | 0.037 | 0.061 | -0.034 |
| Dunks (n) | 0.198 | 0.234* | 0.120 | 0.052 |
| FC (n) | 0.217 | 0.155 | 0.208 | 0.251* |
| FR (n) | 0.378** | -0.012 | 0.337** | 0.351** |
| ER (au) | 0.522*** | 0.127 | 0.454*** | 0.423*** |
| +/− (au) | 0.333** | 0.259* | 0.351** | 0.261* |
| Possessions (n) | 0.035 | -0.135 | 0.010 | 0.032 |
| PPP (au) | 0.449*** | 0.163 | 0.377** | 0.257* |
| eFG (%) | 0.299* | 0.289* | 0.269* | 0.159 |
| ORB (%) | 0.068 | 0.175 | 0.155 | 0.168 |
| DRB (%) | 0.101 | 0.108 | 0.175 | 0.165 |
| TS (%) | 0.404*** | 0.305** | 0.344** | 0.249* |
| A/TO | 0.311** | -0.012 | 0.291* | 0.407*** |
| PU (%) | 0.367** | 0.065 | 0.292* | 0.250* |
* p < 0.05, ** p < 0.01, *** p < 0.001; a: Pearson’s correlation coefficients; β: Spearman correlation coefficients. +/−: player balance; : 2P: two-point field goals (M: made; A: attempted); 3P: three-point field goals (M: made; A: attempted); A/TO: assists–turnover ratio; DR: defensive rebounds; DRB: defensive rebound percentage; eFG: efficiency field goal percentage; ER: efficiency rating; FC: fouls committed; FR: fouls received; FT: free throws (M: made; A: attempted); Hi-Acc: high accelerations (> 3m/s2); Hi-Dec: high decelerations (< -3m/s2); HSR: high-speed running; OF: offensive rebounds; ORB: offensive rebound percentage; PPP: points per possession; TD: total distance; TR: total rebounds; USG: usage percentage. AU: arbitrary units.
Table 4.
Partial correlation levels between game performance and physical demands derived from inertial sensors.
Table 4.
Partial correlation levels between game performance and physical demands derived from inertial sensors.
| Variables | PL (au)a | Hi-PL (au)a | Jumps (n)β | Hi-Takeoff (n)β | Hi-Landings (n)β | Hi-HI (n)β | COI (n)β | Hi-COI (n)β |
|---|---|---|---|---|---|---|---|---|
| Points | 0.605*** | 0.533*** | 0.665*** | 0.562*** | 0.518*** | 0.356** | 0.492*** | 0.349** |
| FTM | 0.417*** | 0.367** | 0.446*** | 0.425*** | 0.400*** | 0.491*** | 0.233 | 0.229 |
| FTA | 0.396*** | 0.354** | 0.448*** | 0.443*** | 0.407*** | 0.482*** | 0.218 | 0.216 |
| 2PM | 0.495*** | 0.456*** | 0.510*** | 0.521*** | 0.448*** | 0.181 | 0.410*** | 0.226 |
| 2PA | 0.625*** | 0.565*** | 0.650*** | 0.573*** | 0.555*** | 0.178 | 0.527*** | 0.337** |
| 3PM | 0.349** | 0.290* | 0.431*** | 0.205 | 0.169 | 0.069 | 0.240* | 0.177 |
| 3PA | 0.322** | 0.240* | 0.384*** | 0.163 | 0.118 | 0.047 | 0.356** | 0.337** |
| TR (n) | 0.501*** | 0.513*** | 0.493*** | 0.500*** | 0.573*** | 0.289* | 0.412*** | 0.244* |
| OR (n) | 0.313** | 0.308** | 0.322** | 0.321** | 0.359** | 0.160 | 0.288* | 0.074 |
| DR (n) | 0.459*** | 0.473*** | 0.485*** | 0.489*** | 0.538*** | 0.270* | 0.392*** | 0.271* |
| Assists (n) | 0.472*** | 0.407*** | 0.327** | 0.249* | 0.312** | 0.122 | 0.371** | 0.279* |
| Steals (n) | 0.307** | 0.245* | 0.126 | 0.116 | 0.130 | 0.185 | 0.226 | 0.157 |
| TO (n) | 0.412*** | 0.354** | 0.304** | 0.377** | 0.274* | 0.269* | 0.245* | 0.235* |
| Blocks (n) | 0.190 | 0.221 | 0.226 | 0.293* | 0.248* | 0.242* | -0.013 | -0.072 |
| Dunks (n) | 0.279* | 0.285* | 0.318** | 0.358** | 0.337** | 0.141 | 0.050 | -0.130 |
| FC (n) | 0.227 | 0.212 | 0.325** | 0.250* | 0.216 | 0.143 | 0.309** | 0.239* |
| FR (n) | 0.397*** | 0.332** | 0.339** | 0.369** | 0.317** | 0.469*** | 0.307** | 0.285* |
| ER (au) | 0.602*** | 0.559*** | 0.524*** | 0.512*** | 0.519*** | 0.381** | 0.443*** | 0.283* |
| +/− (au) | 0.337** | 0.312** | 0.336** | 0.243* | 0.223 | 0.192 | 0.302* | 0.294* |
| Possessions (n) | -0.034 | -0.081 | -0.016 | -0.076 | -0.111 | -0.164 | -0.002 | -0.053 |
| PPP (au) | 0.464*** | 0.423*** | 0.566*** | 0.471*** | 0.421*** | 0.318** | 0.349** | 0.259* |
| eFG (%) | 0.316** | 0.281* | 0.362** | 0.372** | 0.291* | 0.178 | 0.220 | 0.013 |
| ORB (%) | 0.159 | 0.182 | 0.268* | 0.270* | 0.329** | 0.128 | 0.225 | 0.035 |
| DRB (%) | 0.253* | 0.275* | 0.378** | 0.401*** | 0.471*** | 0.228 | 0.277* | 0.181 |
| TS (%) | 0.424*** | 0.391*** | 0.391*** | 0.365** | 0.325** | 0.275* | 0.293* | 0.155 |
| A/TO | 0.270* | 0.205 | 0.216 | 0.121 | 0.177 | 0.041 | 0.331** | 0.234* |
| PU (%) | 0.359** | 0.312** | 0.524*** | 0.426*** | 0.387*** | 0.244* | 0.313** | 0.270* |
* p < 0.05, ** p < 0.01, *** p < 0.001; a: Pearson’s correlation coefficients; β: Spearman correlation coefficients. +/−: player balance; : 2P: two-point field goals (M: made; A: attempted); 3P: three-point field goals (M: made; A: attempted); A/TO: assists–turnover ratio; COI: changes of inertia; DR: defensive rebounds; DRB: defensive rebound percentage; eFG: efficiency field goal percentage; ER: efficiency rating; FC: fouls committed; FR: fouls received; FT: free throws (M: made; A: attempted); Hi-COI: high-intensity changes of inertia; Hi-HI: high-intensity horizontal impacts; Hi-Landing: jumps’ high-intensity landing; Hi-PL: high-intensity player load; Hi-Takeoff: jumps’ high-intensity takeoff; OF: offensive rebounds; ORB: offensive rebound percentage; PL: player load; PPP: points per possession; TR: total rebounds; USG: usage percentage. AU: arbitrary units.
Table 5.
Number of significant correlations and highest level detected between game performance and physical demands from positioning and inertial systems by positions.
Table 5.
Number of significant correlations and highest level detected between game performance and physical demands from positioning and inertial systems by positions.
| Variables | Guards | Forwards | Centers | |||
|---|---|---|---|---|---|---|
| LPS | IMU | LPS | IMU | LPS | IMU | |
| FTM | ND | 2; Hi-Takeoffβ = 0.703** | 1; TDβ = 0.374* | 7; PLβ = 0.665*** | 3; Hi-Decβ = 0.600** | 6; Hi-Takeoffβ = 0.649** |
| FTA | ND | 2; Hi-Takeoffβ = 0.67* | 1; TDβ = 0.367* | 6; PLβ = 0.649*** | 1; Hi-Decβ = 0.461* | 6; Hi-Takeoffβ = 0.605** |
| 2PM | ND | ND | 1; TDβ = 0.373* | 1; Hi-Takeoffβ = 0.357* | 4; TDβ = 0.723*** | 8; Jumpsβ = 0.749*** |
| 2PA | ND | ND | 1; TDβ = 0.404* | 3; Jumpsβ = 0.547*** | 4; TDa = 0.815*** | 7; Jumpsa = 0.847*** |
| 3PM | 1; Hi-Accβ: 0.572* | 3; Jumpsβ = 0.791** | ND | 1; Jumpsβ = 0.376* | 2; Hi-Accβ = 0.543* | 1; Jumpsβ = 0.472* |
| 3PA | ND | 1; Jumpsβ = 0.698** | ND | 1; Jumpsβ = 0.511** | 2; HSRβ = 0.592** | 1; Hi-COIβ = 0.575** |
| TR (n) | ND | 1; PLa = 0.645* | ND | 3; Hi-Landingβ = 0.373* | 2; Hi-Decβ = 0.481* | 6; Hi-Landingβ = 0.847*** |
| OR (n) | 1; HSRβ = -0.616* | ND | 1; Hi-Decβ = 0.357* | ND | ND | 5; Hi-Landingβ = 0.617** |
| DR (n) | ND | 1; PLa = 0.729** | ND | 1; COIβ = 0.344* | 2; Hi-Decβ = 0.516* | 6; Hi-Landingβ = 0.692*** |
| Assists (n) | ND | 4; PLa = 0.712** | 1; TDβ = 0.373* | 1; Hi-Landingβ = 0.356* | 4; TDβ = 0.644** | 5; Jumpsβ = 0.611** |
| Steals (n) | ND | ND | 1; TDβ = 0.492** | ND | 1; TDβ = 0.444* | 1; Jumpsβ = 0.461* |
| TO (n) | ND | ND | ND | 2; Hi-Takeoffβ = 0.526** | 1; Hi-Decβ = 0.472* | ND |
| Blocks (n) | ND | ND | ND | ND | ND | 2; Hi-HI = 0.609** |
| Dunks (n) | ND | ND | ND | ND | ND | 5; Hi-Takeoff = 0.631** |
| FC (n) | ND | 1; Jumpsβ = 0.631* | 1; Hi-Decβ = 0.36* | ND | 1; HSRβ = 0.497* | 3; COIβ = 0.566** |
| FR (n) | ND | ND | ND | 8; PLβ = 0.615*** | 1; Hi-Decβ = 0.454 | 6; Hi-Takeoffβ = 0.592** |
| ER (au) | ND | 1; PLa = 0.634* | 1; TDβ = 0.426** | 3; PLβ = 0.423* | 3; TDa = 0.700*** | 7; Hi-Takeoff = 0.828*** |
| +/− (au) | ND | ND | 1; HSRa = 0.399* | ND | 3; TDa = 0.575** | 7; Jumps = 0.604** |
| Possessions (n) | ND | ND | ND | ND | ND | ND |
| PPP (au) | ND | 1; Jumpsa = 0.616* | ND | 1; Jumpsβ = 0.483** | 3; Hi-Acca = 0.693*** | 7; Jumps = 0.668** |
| eFG (%) | 2; HSRa = 0.651* | ND | ND | ND | 1; TDβ = 0.454* | 6; Hi-Takeoffβ = 0.706*** |
| ORB (%) | ND | ND | 1; Hi-Decβ = 0.374* | ND | ND | 2; Hi-HIβ = 0.575** |
| DRB (%) | 1; TDa = 0.643* | 1; PLa = 0.606* | ND | ND | ND | 3; Hi-HIβ = 0.709*** |
| TS (%) | 1; Hi-Accβ = 0.612* | 1; Jumpsβ = 0.667* | 1; TDβ = 0.351* | ND | 3; TDa = 0.583** | 6; Hi-Takeoff = 0.623*** |
| A/TO | 1; TDβ = 0.555* | ND | 1; TDβ = 0.376* | ND | 3; TDβ = 0.541* | 5; Hi-PLβ = 0.513* |
| PU (%) | ND | ND | 1; TDβ = 0.412* | 4; Jumpsβ = 0.71*** | ND | ND |
* p < 0.05, ** p < 0.01, *** p < 0.001; a: Pearson’s correlation coefficients; β: Spearman correlation coefficients. +/−: player balance; A/TO: assists–turnover ratio; COI: changes of inertia; DR: defensive rebounds; DRB: defensive rebound percentage; eFG: efficiency field goal percentage; ER: efficiency rating; FC: fouls committed; FG: field goals (made/attempted); FR: fouls received; Hi-COI: high-intensity changes of inertia; Hi-HI: high-intensity horizontal impacts; Hi-Landing: jumps’ high-intensity landing; Hi-PL: high-intensity player load; Hi-Takeoff: jumps’ high-intensity takeoff; ND: not detected; OF: offensive rebounds; ORB: offensive rebound percentage; PL: player load; PPP: points per possession; TR: total rebounds; USG: usage percentage. AU: arbitrary units; min: minutes.
Disclaimer/Publisher’s Note: The statements, opinions and data contained in all publications are solely those of the individual author(s) and contributor(s) and not of MDPI and/or the editor(s). MDPI and/or the editor(s) disclaim responsibility for any injury to people or property resulting from any ideas, methods, instructions or products referred to in the content. |
© 2025 by the authors. Licensee MDPI, Basel, Switzerland. This article is an open access article distributed under the terms and conditions of the Creative Commons Attribution (CC BY) license (https://creativecommons.org/licenses/by/4.0/).
Copyright: This open access article is published under a Creative Commons CC BY 4.0 license, which permit the free download, distribution, and reuse, provided that the author and preprint are cited in any reuse.


