
Submitted:
23 June 2025
Posted:
24 June 2025
You are already at the latest version
Abstract
The aim of this study was to examine the relationship between the external load (EL) and internal load among U15, U17 and U19 youth soccer players, and to identify the factors best influencing the Rating of Perceived Exertion (RPE) and session-RPE (s-RPE) from Global Positioning System-derived variables. Data were collected from 50 male youth soccer players over a 14-week in-season period, encompassing a total of 1196 observations (145 training sessions and 33 matches). The findings indicate that during training sessions, the relationship between EL-derived volume variables and s-RPE exhibited moder-ate-to-very-strong correlations (U15—r ranging from 0.23 to 0.52; U17—r ranging from 0.51 to 0.78; U19—r ranging from 0.34 to 0.61, p < 0.001). The strongest relationships were observed with total distance, acceleration, deceleration (DEC) and player load variables (p < 0.001). However, perceived wellness measures showed weak correlations with almost every EL parameter. Considering matches for all age groups, total distance showed moderate to large correlation with s-RPE (ranging from 0.41 to 0.59, p < 0.001). Additionally, RPE and s-RPE were significantly influenced by total distance, acceleration, deceleration, medium-speed running per minute, sprint distance per minute and deceleration per minute variables.
Keywords:
GPS
; perceived wellness
; RPE
; training load
; youth soccer
1. Introduction
The effects of training load (TL) on the human body can be divided into physiological and psychological responses. Physiological load is further categorised into external load (EL) and internal load (IL) [1]. EL is defined as the work completed by the athlete [2], while IL represents the relative biological stresses imposed on players during training sessions and matches [3]. A better understanding of TL may benefit practitioners in developing soccer players [4,5]. Also, given that young footballers undergo significant natural growth and maturation, TL monitoring differs from that of adults [6] and should not be defined by the standards applicable to fully grown athletes [7], as young athletes are not merely “small adults” [8].
Still, one of the most challenging aspects of determining TL is to accurately monitor players’ stress levels on the field, whether considering EL or IL and their convergence. The advent of the global positioning system (GPS), data on EL-based physical demands of elite youth footballers can be monitored in relation to their matches and training sessions [9,10,11]. These measurements provide better insights when combined with systems known as the Global Navigation Satellite System (GNSS), which accurately calculates the player’s position on the field [12] at a higher sampling frequency of 10 Hz [13]. With the integration of triaxial accelerometer, magnetometer and gyroscope, it enables to see the mechanical TL (in the X-Y-Z axes) next to locomotor TL. Previously, numerous GPS-based variables were suggested to identify EL such as total distance, high-speed running, sprint distance, acceleration, deceleration and player load [14,15,16,17].
In relation to TL, the use of subjective questionnaires [18,19] offers a comprehensive insight into IL. For this, rating of perceived exertion (RPE) was developed by Borg [20] and later adapted by Foster et al. [21]. Additionally, another method (session-RPE) to quantify IL is to multiply the total duration (in minutes) by RPE [21,22]. However, it should be noted that RPE values only provides feedback on perceived exertion and does not substitute for objective IL measurement, such as heart rate measurements. Additionally, the wellness questionnaire provides feedback on the state of wellness, which was proposed by Hooper and Mackinnon [23]. This contains question items such as sleep quality, fatigue, muscle soreness, mood and stress level [24].
Recently, the combined use of GPS and subjective exertion measures has garnered increased attention in both young [4,25,26] and adult populations [27,28]. Previous research found that s-RPE and EL-based variables correlates well [29], but with higher intensity variables shows lower relationship [30], which suggests that there may be a difference in the relationship in TL during training and matches. In addition, moderate to very large correlations were observed among elite youth soccer players [26] indicating that there could be a significant difference between EL and IL in older youth age groups. They also found small correlation between perceived wellness responses and EL measures among elite youth soccer players. It was stated before that weak relationship exists between total distance, accelerations, decelerations and sleep quality and fatigue [31]. Although previous study found small to moderate relationship between during intermittent small-sided games moderate correlation between stress and total distance among amateur soccer players [32].
However, previous research has typically focused on a single age group within a football academy over a one-season follow-up period. It is crucial to examine multiple age groups, as differences in TL may be detected [19].
Thus, the aims of this study are (i) to explore the differences between the relationship between EL-derived variables, including total distance, medium-speed running distance, high-speed running distance, sprint distance, distance in accelerations, distance in decelerations, number of inertial movement analysis, player load in arbitrary unit (AU) and their respective values expressed per minute and IL variables, such as RPE, s-RPE and perceived wellness across U15, U17 and U19 age groups and (ii) to identify the GPS-derived variables that best influence RPE and s-RPE.
2. Materials and Methods
2.1. Experimental Design
A total of 1386 observations were made (U15 - training sessions 357, matches 60; U17 - training sessions 388, matches 62; U19 - training sessions 446, matches 73), including 145 soccer training sessions (U15 - 49, U17 - 46 and U19 - 50) and eleven matches per team. Additionally, 19 training sessions were excluded from the analysis out of 164 training sessions due to some indoor activities, as the data source was deemed unreliable due to inadequate satellite connection. The study lasted from February to May during the 2023-2024 competitive period. The data accumulation for this study lasted 11 weeks. On average, players trained 4 to 5 times a week.

Table 1.
Average duration of training sessions and matches including ranges and standard deviations for U15, U17 and U19.
Table 1.
Average duration of training sessions and matches including ranges and standard deviations for U15, U17 and U19.
| U15 | U17 | U19 | ||||
| mean ± sd | range | mean ± sd | range | mean ± sd | range | |
| Trainings | 67 ± 12 mins | 50 to 97 mins | 65 ± 19 mins | 52 to 124 mins | 63 ± 14 mins | 55 to 102 mins |
| Matches | 91 ± 7 mins | 80 to 98 mins | 77 ± 6 mins | 74 to 83 mins | 91 ± 9 mins | 81 to 99 mins |
sd: standard deviation, mins = minutes.
Training sessions occurred on weekdays between 15:30–17:00 and were performed on artificial pitches. It consisted technical, tactical and conditional elements (in the latter case compensation running bouts) Additionally, there was strength and conditioning program on Monday, Tuesday and on Thursday for all teams, which took 30 mins before ball training. The warm-up (FIFA 11+ protocol) was taken into account in the data analysis next to the ball training, but cool-down did not. The microcycle structure (one microcycle meant one week) was considered as number of days before or after a match day (MD±) [33]. On MD-6/MD+1 (6 days before Match Day / 1 day after Match Day) there was day off for every team. MD-5/MD+2 was considered a recovery session with tactical development. MD-4/MD+3 was primarily focused on small-sided games with 2v2, 3v3, 4v4 and 5v5 to develop speed, agility or power. MD-3 aimed to develop strength-endurance with large-sided games. MD-2 was focused on technical and further tactical development. A tapering method (decreasing TL) was also used on this day, but not on regular basis. MD-1 was an activation day (neuromuscular) with less volume TL.
Regular participation was required in both training sessions and matches. The study included players who participated in training sessions 80% of the time and all activities were completed. We determined a minimum of 70 minutes of playing time in matches for the U15 age group, while at least 80 minutes participation was required for the U17 and U19 age groups [34].
2.2. Participants
A total of 50 male academy soccer players (Nall = 50) participated in the study, comprising U15 (NU15 = 18, mean ± SD: age 14.77 ± 0.25 years, height 173.21 ± 6.11 cm, body mass 59.09 ± 4.95 kg), U17 (NU17 = 16, mean ± SD: age 16.70 ± 0.27 years, height 176.60 ± 6.36 cm, body mass 65.02 ± 5.35 kg) and U19 (NU19 = 16, mean ± SD: age 17.69 ± 0.53 years, height 180.53 ± 6.47 cm and body mass 71.99 ± 6.45 kg). Goalkeepers were excluded from the study due to a lack of GPS sensors. Also, there were players from the U15 age group who played a couple of times in the U16 team, so their data was also excluded. Another necessary exclusion criterion was to include only those who had no known injuries during the study. To control for confounding variables, such as dehydration, players were allowed to drink still water during training sessions’ resting periods. All players were familiarized with the monitoring procedures used during the study, which is a regular, everyday task for them. The research received an institutional ethical approval where it was conducted. The study conformed to the stipulations of the Declaration of Helsinki (1964).
2.3. External Load Measures
During both training sessions and matches, a portable GPS sensor was used to monitor each player’s physical activity (Catapult S7 Vector, Catapult Sports Ltd., Melbourne, Australia). All players wore the same type of GPS device, which provides locomotor load variables at a sampling rate of 10 Hz. This device also includes integrated micro inertial sensors, such as a triaxial accelerometer, gyroscopes and magnetometer, providing mechanical load variables at a sampling rate of 100 Hz. The chosen variables for this research were the following (both locomotor and mechanical variables are presented, units of measure: meter, number): total distance (TD; m), TD per minute (m), medium-speed running distance (MSR, measurement interval 14.4–19.79 km.h-1; m), MSR per minute (m), high-speed running distance (HSR, measurement interval 19.8–25.1 km.h-1; m), HSR per minute (m), sprint distance (SPR, >25.2 km.h-1; m), SPR per minute (m), acceleration band 1–3 distance (ACC, >1.5 m.s-2; m), ACC per minute (m), deceleration band 1–3 distance (DEC, <-1.5 m.s-2; m), DEC per minute (m), total micromovements (IMA; n), IMA per minute (n), total player load (PL; AU) and PL per minute (AU). In line with the suggestion of Maddison and Ni Mhurchu [35], all devices were activated at least 5 minutes before data collection commenced (before warm-up). All recorded parameters were downloaded from each unit using OpenField Console Software (Catapult Sports, Melbourne, Australia; version 3.9) and subsequently exported as .csv files.
2.4. Internal Load Measures
A modified CR-10 Borg scale was employed to measure individual effort and exertion (21]. RPE data were collected 20–30 minutes after practice [21] via a Facebook Messenger group chat. Players were informed before the research about the 1–10 scale system of RPE, in which “1” represents very weak activity and “10” denotes exceptionally strong activity [36]. This value represents a single number expressed in arbitrary units (AU). Later multiplied by the total duration (in minutes) of the session to derive s-RPE [21].
Another measurement used to determine the psychometric status of the players was the Hooper questionnaire, also known as “perceived wellness” [23}. This study comprised three items: sleep, stress and fatigue, with fatigue further divided into central and peripheral components, as suggested by De Dios-Álvarez et al. [25]. A five-point Likert scale ranging from 1 to 5 was applied, where “1” indicated very poor condition and “5” indicated very good condition [37].
Lastly, we applied the Total Quality of Recovery (TQR) measurement [38] to examine the perceived psycho-physiological recovery of the players, using the same Likert scale ranging from 1–5. Perceived wellness indicators and TQR data were collected via a Google Form and sent out through a Facebook Messenger group chat 30-min before training sessions [39]. On match days, only the RPE value was collected to allow players to focus on their primary tasks. All players were previously familiarised with these questionnaires as these was used before (expect under-15). The questionnaire data was collected by the head of strength and conditioning group at the academy.
2.5. Statistical Analysis
Data are presented as mean and standard deviation (mean ± SD). The raw data from the .csv files were integrated for statistical analyses, using IBM SPSS Statistics software (SPSS v24.0, IBM Corporation, Chicago, USA). The normality of all data was tested using the Shapiro-Wilk test. To verify the correlation between EL and IL, Pearson correlation was employed, with the alpha level of statistical significance set at p < 0.05. The magnitude of the correlation between test measurements was determined according to the following criteria [40]: trivial (r < 0.1), weak (0.1 ≤ r < 0.3), moderate (0.3 ≤ r < 0.5), strong (0.5 ≤ r < 0.7), very strong (0.7 ≤ r < 0.9) and almost perfect (r ≥ 0.9). Additionally, a multiple regression analysis was conducted to predict RPE and s-RPE from GPS-derived variables by examining the coefficients (beta value, R-squared).
3. Results
Table 2 shows the descriptive statistics of the GPS-derived variables and RPE, s-RPE and perceived wellness values.
The correlations between EL and IL for U15, U17 and U19 is illustrated in Figure 1.
Furthermore, perceived wellness values demonstrated a weak correlation with EL-derived parameters across all teams and training sessions.
As shown in Table 2 and Table 3, we distinguished between the results obtained during the training sessions and matches. The Under-15 team’s training sessions and matches exhibited a moderate correlation level between RPE and HSR and HSR/min from r = 0.38 to r = 0.34 (p < 0.001). Considering both training sessions and matches, only TD showed a strong correlation with s-RPE (r ranging from 0.53 to 0.52, p < 0.001). As shown in Figure 2 for U17, RPE demonstrated a very strong correlation with PL (r = 0.71) and s-RPE with TD (r = 0.77), ACC (r = 0.70), DEC (r = 0.76) and PL (r =0.73) (p < 0.001, respectively).
During matches, only TD showed moderate correlation with s-RPE (r = 0.41). In the U19 team’s training sessions, weak to moderate correlations were found for RPE (r ranging from 0.16 to 0.46, p < 0.001). Meanwhile, s-RPE showed moderate correlations with TD, DEC and PL (r = 0.61, p < 0.001). During matches, RPE showed the greatest correlation with PL (r = 0.42). Considering s-RPE, significant correlations were observed with TD, MSR, ACC, DEC and PL data (mean r value of 0.59, p < 0.001).
For U15, the variable DEC/min (ß = 2.463, t[414] = 2.156, p = 0.032) significantly predicted the RPE value. Additionally, SPR (ß = 1.616, t[414] = 2.591, p = 0.010), ACC (ß = 1.376, t[414] = 4.140, p < 0.001) and DEC (ß = -3.601, t[414] = -3.372, p = 0.001) significantly predicted s-RPE. For U17, the analysis indicated that MSR/min (ß = 0.221, t[447] = 3.849, p < 0.001) and SPR/min (ß = 1.186, t[447] = 1.990, p = 0.047) significantly predicted the RPE score. Furthermore, TD (ß = 0.170, t[447] = 5.533, p < 0.001) and MSR/min (ß = 19.420, t[447] = 4.612, p < 0.001) significantly predicted the value of s-RPE. Lastly, for U19, SPR/min significantly predicted the RPE value (ß = 0.48, t[515] = 6.247, p < 0.001). The best predictors of s-RPE were TD (ß = 0.146, t[515] = 4.873, p < 0.001) and SPR/min (ß = 3.569, t[515] = 6.522, p < 0.001).
4. Discussion
The primary purpose of this study was to identify the relationship between IL values and EL-derived variables and their respective values expressed per minute among U15, U17 and U19 soccer players. Our goal was also to develop a regression model to predict RPE and s-RPE values using GPS variables.
The key finding of the study was that there is a difference between the relationship of EL-based variables and IL-based variables between the three age groups. It was also found that during training sessions there was a stronger correlation between EL and IL parameters. The findings further prove the importance of TD and s-RPE values for monitoring TL.
Historically, researchers have tended to focus solely on EL-based [9,41] or IL-based [42,43] studies. The main reason for this could be the availability and applicability. Since the introduction of EL-based monitoring advancements in the early 2000s, IL-based studies were the main focus prior to GPS. The importance of the combination of the two types of TL was later proposed by Impellizzeri et al. [44] and these are used together to this day. It is indeed crucial to monitor both EL and IL in soccer [1] to make informed decisions when designing training programmes [6].
In recent years, there has been growing interest in investigating the relationship between EL and IL among youth soccer players [4,25,42,45]. Findings from Marynowicz et al. [4] indicate that RPE and s-RPE are significantly related to a large number of EL-based volume and intensity parameters, when it comes to calculating one team’s training sessions over an entire season. Specifically, the greatest correlation was found between TD, distance in ACC and s-RPE (r = 0.70, p < 0.001), which is in line with our observations. Despite the small sample size (18 players), this relationship between EL and IL is an important indicator for young footballers aged between 16 to 19. It was also found that there is a higher correlation between s-RPE and EL measurements compared to RPE, which is also supported by our results (see Figure 1), suggesting that s-RPE is a more robust index than RPE. Based on its simple formula, its applicability has been further confirmed, thus simplifying the task of strength and conditioning coaches. Teixeira et al.’s [42] research, which lasted 6 weeks during the first month of the competitive period and involved three age groups (U15, U17 and U19), found small correlations for TD in U15 and U17, while U19 showed moderate correlations for ACC and DEC. However, our findings reveal strong to very strong correlations between TD and s-RPE (U15—r = 0.52, U17— r = 0.74, p < 0.001), respectively. The significant difference in results may be attributed to the duration of the studies (6 weeks compared to our 14 weeks). Although it showed that there are some differences in the level of relationship between young age groups with sixty sub-elite players in their study. de Dios-Álvarez et al. [25] found strong to very strong correlation levels (p < 0.01) between IL-derived parameters (RPE/s-RPE) and GPS-derived parameters (number of accelerations and decelerations, total distance covered and player load). They also identified a moderate correlation between TD and RPE when training sessions (r = 0.47) and matches (r = 0.42) were analysed separately, which is also supported by our findings (see Table 3 and Table 4), noting that TD significantly affects RPE (p < 0.001).
Monitoring multiple GPS-derived variables and examining different age groups over an extended period can yield valuable insight, that can lead to a better understanding of EL, which has been previously suggested [46] and has been applied on many previous studies since then. Consistent with previous findings, we also observed differences between the three age groups, with the weakest correlation between EL and IL for U15, suggesting that 14–15-year-olds may not yet fully comprehend their own perceptions. Younger players may require a maturational period (late adolescent) to better understand their physical capabilities and bodily perceptions. Additionally, during training sessions, EL-derived volume variables (e.g., TD) show a stronger correlation with s-RPE (U15—r = 0.516; U17— r = 0.768; U19—r = 0.613). Therefore, we concluded that the difference between training and match TL is decisive even for young footballers, which was previously established by a systematic review [47]. Also, as a strength and conditioning coach, it is somewhat monotonous to say that TD is the key parameter which is strongly associated with IL measurements [29]; although every head coach tends to be curious about only this, even though countless other and interesting variables are available. By the statement of [4] TD can be helpful to monitor TL and considering the transition from youth league to the adult level.
Our regression model indicates that TD, ACC, DEC, MSR/min, SPR/min and DEC/min can accurately predict IL variables. For both U17 and U19, the SPR/min variable can predict RPE. They explained it from 32% to 14% with negligible standard error. In terms of s-RPE prediction, TD appears to be the most valuable source for U15 (R2 of .55), U17 (R2 of .73) and U19 (R2 of .71), which does not align with previous research results [25]. This confirms that the determination of TL is possible without GPS device by using only RPE values [48].
In this study, the approach to monitor EL and IL showed encouraging results to use these tools on the field. Nonetheless, some limitations must be addressed. One of them is that the completion rate of the subjective questionnaires was not perfect, which may affect the overall picture of the players’ TL. The second is that although we looked at training sessions separately (contra matches), we did not differentiate between them in terms of the distribution relative to the match. Therefore, future research should examine whether there is a difference in the distribution of different loading days (trainings).
This study aims to provide valuable insights into TL variables and enhance understanding of the correlations between EL and IL in soccer at the elite youth level. Based on our findings, we emphasise the benefits of employing GPS-derived variables in conjunction with self-reported questionnaires (these tools are highly recommended). RPE scores greatly influenced by contextual factors such as school, weather conditions and expectations of the player on the field. Hence, not all of these can be controlled by the coach. In this sense, the results suggest that collecting daily RPE and perceived wellness data may not always be necessary, as they do not consistently provide a valid and reliable source of information regarding the true IL of the player. One reason for this could be that players do not always report values that correspond with their actual perceptions, but rather to fulfil their obligation (see the results for U17 vs. U19). Therefore, to make the measures more adequate and manageable, we recommend less frequent RPE collection, focusing on key load days such as MD-4, MD+3, MD-3 and MD. Additionally, we suggest assessing perceived wellness on MD+2/MD-5 (typically Monday) to inform practitioners about players’ readiness for training, and on MD-2 (typically Thursday) “Is my athlete ready for further training, or either a step taper or an intervention is needed for recovery?” Finally, we recommend simplifying the perceived wellness questionnaires values by using pictograms (from sad to smiling faces) for young players.
5. Conclusions
Consequently, monitoring both EL and IL is essential, providing useful information about TL in relation to training sessions and matches in elite youth soccer. Our findings indicate that perceived wellness measures exhibited weak relationships with EL measures, suggesting that these questionnaire items primarily predict players’ physical and mental readiness, and not IL. The results also demonstrate that both RPE and s-RPE show moderate to very strong correlations with GPS-derived variables, particularly regarding volume metrics.
Author Contributions
Conceptualization, K.H., S.S. and G.G.; methodology, K.H., P.J.T. and M.F.; formal analysis, B.K.; data curation, B.K. and M.F.; writing—original draft preparation, K.H.; writing—review and editing, K.H., P.J.T., B.K., S.S. and CS.B.; visualization, K.H. and B.K.; supervision, S.S., B.K. and G.G. All authors have read and agreed to the published version of the manuscript.
Funding
This research received no external funding.
Institutional Review Board Statement
The study was conducted in accordance with the Declaration of Helsinki and approved by the Ethical Committee of HUNGARIAN UNIVERSITY OF SPORTS SCIENCE (MTSE-KEB/No07/2025 and 25 March 2025) for studies involving humans.
Informed Consent Statement
Informed consent was obtained from all subjects involved in the study.
Data Availability Statement
The data presented are available on request from the corresponding author.
Conflicts of Interest
The authors declare no conflicts of interest.
Abbreviations:
The following abbreviations are used in this manuscript:
| ACC | Acceleration |
| DEC | Deceleration |
| EL | External load |
| GNSS | Global Navigation Satellite System |
| GPS | Global Positioning System |
| HSR | High-speed running distance |
| IL | Internal load |
| IMA | Inertial Movement Analysis |
| MD | Match day |
| MSR | Medium-speed running distance |
| PL | Player load |
| RPE | Rating of perceived exertion |
| s-RPE | Session-RPE |
| SPR | Sprint distance |
| TD | Total distance |
| TL | Training load |
References
- Varley, M.C.; Fairweather, I.H.; Aughey, R.J. Validity and reliability of GPS for measuring instantaneous velocity during acceleration, deceleration, and constant motion. J. Sports Sci. 2012, 30, 121–127. [Google Scholar] [CrossRef] [PubMed]
- Wallace, L.K.; Slattery, K.M.; Coutts, A.J. The ecological validity and application of the session-RPE method for quantifying training loads in swimming. J. Strength Cond. Res. 2009, 23, 33–38. [Google Scholar] [CrossRef]
- Bourdon, P.C.; Cardinale, M.; Murray, A.; Gastin, P.; Kellmann, M.; Varley, M.C.; Gabbett, T.J.; Coutts, A.J.; Burgess, D.J.; Gregson, W.; Cable, N.T. Monitoring Athlete Training Loads: Consensus Statement. Int. J. Sports Physiol. Perform. 2017, 12, S2161–S2170. [Google Scholar] [CrossRef]
- Marynowicz, J.; Kikut, K.; Lango, M.; Horna, D.; Andrzejewski, M. Relationship Between the Session-RPE and External Measures of Training Load in Youth Soccer Training. J. Strength Cond. Res. 2020, 34, 2800–2804. [Google Scholar] [CrossRef] [PubMed]
- Oliveira, R.; Brito, J.P.; Moreno-Villanueva, A.; Nalha, M.; Rico-González, M.; Clemente, F.M. Reference Values for External and Internal Training Intensity Monitoring in Young Male Soccer Players: A Systematic Review. Healthcare. 2021, 9, 1567. [Google Scholar] [CrossRef] [PubMed]
- Henderson, B.; Cook, J.; Kidgell, D.J.; Gastin, P.B. Game and Training Load Differences in Elite Junior Australian Football. J. Sports Sci. Med. 2015, 14, 494–500. [Google Scholar]
- Burgess, D.J.; Naughton, G.A. Talent development in adolescent team sports: a review. Int. J. Sports Physiol. Perform. 2010, 5, 103–116. [Google Scholar] [CrossRef]
- Palucci Vieira, L.H.; Carling, C.; Barbieri, F.A.; Aquino, R.; Santiago, P.R.P. Match Running Performance in Young Soccer Players: A Systematic Review. Sports Med. 2019, 49, 289–318. [Google Scholar] [CrossRef]
- Beenham, M.; Barron, D.J.; Fry, J.; Hurst, H.H.; Figueirdo, A.; Atkins, S. A. Comparison of GPS Workload Demands in Match Play and Small-Sided Games by the Positional Role in Youth Soccer. J. Hum. Kinet. 2017, 57, 129–137. [Google Scholar] [CrossRef]
- Maughan, P.C.; MacFarlane, N.G.; Swinton, P.A. Quantification of training and match-play load across a season in professional youth football players. Int. J. Sports Sci. Coaching. 16, 1169–1177. [CrossRef]
- Mendez-Villanueva, A.; Buchheit, M.; Simpson, B.; Bourdon, P.C. Match play intensity distribution in youth soccer. Int. J. Sports Med. 2013, 34, 101–110. [Google Scholar] [CrossRef] [PubMed]
- Scott, M.T.; Scott, T.J.; Kelly, V.G. The Validity and Reliability of Global Positioning Systems in Team Sport: A Brief Review. J. Strength Cond. Res. 2016, 30, 1470–1490. [Google Scholar] [CrossRef]
- Johnston, R.J.; Watsford, M.L.; Kelly, S.J.; Pine, M.J.; Spurrs, R.W. Validity and interunit reliability of 10 Hz and 15 Hz GPS units for assessing athlete movement demands. J. Strength Cond. Res. 2014, 28, 1649–1655. [Google Scholar] [CrossRef] [PubMed]
- Akenhead, R.; Harley, J.A.; Tweddle, S.P. Examining the External Training Load of an English Premier League Football Team with Special Reference to Acceleration. J. Strength Cond. Res. 2016, 30, 2424–2432. [Google Scholar] [CrossRef] [PubMed]
- Varley, M.C.; Jaspers, A.; Helsen, W.F.; Malone, J.J. Methodological Considerations When Quantifying High-Intensity Efforts in Team Sport Using Global Positioning System Technology. Int. J. Sports Physiol. Perform. 2017, 12, 1059–1068. [Google Scholar] [CrossRef]
- Malone, J.J.; Barrett, S.; Barnes, C.; Twist, C.; Drust, B. To infinity and beyond: the use of GPS devices within the football codes. Sci. Med. Football 2019, 4, 82–84. [Google Scholar] [CrossRef]
- Oliva-Lozano, J.M.; Conte, D.; Fortes, V.; Muyor, J.M. Exploring the Use of Player Load in Elite Soccer Players. Sports Health. 2023, 15, 61–66. [Google Scholar] [CrossRef]
- Rodríguez-Marroyo, J.A.; Antoñan, C. Validity of the session rating of perceived exertion for monitoring exercise demands in youth soccer players. Int. J. Sports Physiol. Perform. 2015, 10, 404–407. [Google Scholar] [CrossRef]
- Connolly, D.R.; Stolp, S.; Gualtieri, A.; Gualtieri, A.; Ferrari, B.D.; Sassi, R.; Rampinini, E.; Coutts, A.J. How Do Young Soccer Players Train? A 5-Year Analysis of Weekly Training Load and its Variability Between Age Groups in an Elite Youth Academy. J. Strength Cond. Res. 2024, 38, e423–e429. [Google Scholar] [CrossRef]
- Borg, G.; Hassmén, P.; Lagerström, M. Perceived exertion related to heart rate and blood lactate during arm and leg exercise. Eur. J. Appl. Physiol. Occup. Physiol. 1987, 56, 679–685. [Google Scholar] [CrossRef]
- Foster, C.; Florhaug, J.A.; Franklin, J.; Gottschall, L.; Hrovatin, L.A.; Parker, S.; Doleshal, P.; Dodge, C. A new approach to monitoring exercise training. J. Strength Cond. Res. 2001, 15, 109–115. [Google Scholar] [PubMed]
- Borg, G. Perceived exertion and pain scales; Human Kinetics: Champaign IL, USA, 1998. [Google Scholar]
- Hooper, S.L.; Mackinnon, L.T. Monitoring overtraining in athletes. Recommendations. Sports Med. 1995, 20, 321–327. [Google Scholar] [CrossRef] [PubMed]
- McLean, B.D.; Coutts, A.J.; Kelly, V.; McGuigan, M.R.; Cormack, S.J. Neuromuscular, endocrine, and perceptual fatigue responses during different length between-match microcycles in professional rugby league players. Int. J. Sports Physiol. Perform. 2010, 5, 367–383. [Google Scholar] [CrossRef] [PubMed]
- Maughan, P.C.; MacFarlane, N.G.; Swinton, P.A. Relationship Between Subjective and External Training Load Variables in Youth Soccer Players. Int. J. Sports Physiol. Perform. 16, 1127–1133. [CrossRef]
- de Dios-Álvarez, V.; Suárez-Iglesias, D.; Bouzas-Rico, S.; Alkain, P.; González-Conde, A.; Ayán-Pérez, C. Relationships between RPE-derived internal training load parameters and GPS-based external training load variables in elite young soccer players. Res. Sports Med. 2023, 31, 58–73. [Google Scholar] [CrossRef]
- Campos-Vazquez, M.A.; Mendez-Villanueva, A.; Gonzalez-Jurado, J.A.; León-Prados, J.A.; Santalla, A.; Suarez-Arrones, L. Relationships between rating-of-perceived-exertion- and heart-rate-derived internal training load in professional soccer players: a comparison of on-field integrated training sessions. Int. J. Sports Physiol. Perform. 2015, 10, 587–592. [Google Scholar] [CrossRef]
- Rago, V.; Brito, J.; Figueiredo, P.; Krustrup, P.; Rebelo, A. Relationship between External Load and Perceptual Responses to Training in Professional Football: Effects of Quantification Method. Sports 2019, 7, 68. [Google Scholar] [CrossRef]
- Gaudino, P.; Iaia, F.M.; Strudwick, A.J.; Hawkins, R.D.; Alberti, D.; Atkinson, G.; Gregson, W. Factors influencing perception of effort (session rating of perceived exertion) during elite soccer training. Int. J. Sports Physiol. Perform. 2015, 10, 860–864. [Google Scholar] [CrossRef]
- McLaren, S.J.; Macpherson, T.W.; Coutts, A.J.; Hurst, C.; Spears, I.R.; Weston, M. The Relationships Between Internal and External Measures of Training Load and Intensity in Team Sports: A Meta-Analysis. Sports Med. 2018, 48, 641–658. [Google Scholar] [CrossRef]
- Haller, N.; Blumkaitis, J.C.; Strepp, T.; Schmuttermair, A.; Aglas, L.; Simon, P.; Neuberger, E.; Kranzinger, C.; Kranzinger, S.; O’Brien, J.; Ergoth, B. Comprehensive training load monitoring with biomarkers, performance testing, local positioning data, and questionnaires - first results from elite youth soccer. Front Physiol. 2022, 13, 1000898. [Google Scholar] [CrossRef]
- Clemente, F.M. Associations between wellness and internal and external load variables in two intermittent small-sided soccer games. Physiol Behav. 2018, 197, 9–14. [Google Scholar] [CrossRef]
- Martín-García, A.; Gómez Díaz, A.; Bradley, P.S.; Morera, F.; Casamichana, D. Quantification of a Professional Football Team’s External Load Using a Microcycle Structure. J. Strength Cond. Res. 2018, 32, 3511–3518. [Google Scholar] [CrossRef] [PubMed]
- Alonso, L.; Silva, L.; Paulucio, D.; Pompeu, F.; Bezerra, L.; Lima, V.; Vale, R.; Oliveira, M.; Dantas, P.; Silva, J.; Nunes, R. Field Tests vs. Post Game GPS Data in Young Soccer Player Team. J. Exer. Physiol Onl. 2017, 20. [Google Scholar]
- Maddison, R.; Ni Mhurchu, C. Global positioning system: a new opportunity in physical activity measurement. Int. J. Behav. Nutr. Phys. Act. 2009, 6, 73. [Google Scholar] [CrossRef] [PubMed]
- Noble, B.J.; Borg, G.A.; Jacobs, I.; Ceci, R.; Kaiser, P. A category-ratio perceived exertion scale: relationship to blood and muscle lactates and heart rate. Med. Sci. Sports Exerc. 1983, 15, 523–528. [Google Scholar] [CrossRef]
- Buchheit, M.; Racinais, S.; Bilsborough, J.C.; Bourdon, P.C.; Voss, S.C.; Hocking, J.; Cordy, J.; Mendez-Villanueva, A.; Coutts, A.J. Monitoring fitness, fatigue and running performance during a pre-season training camp in elite football players. J. Sci. Med. Sport. 2013, 16, 550–555. [Google Scholar] [CrossRef]
- Kenttä, G.; Hassmén, P. Overtraining and recovery. A conceptual model. Sports Med. 1998, 26, 1–16. [Google Scholar] [CrossRef]
- Nobari, H.; Fani, M.; Clemente, F.M.; Carlos-Vivas, J.; Pérez-Gómez, J.; Ardigò, L.P. Intra- and Inter-week Variations of Well-Being Across a Season: A Cohort Study in Elite Youth Male Soccer Players. Front Psychol. 12, 671072. [CrossRef]
- Hopkins, W.G. New view of statistics: Effect magnitudes; Sportscience, 2002. [Google Scholar]
- Duthie, G.M.; Thornton, H.R.; Delaney, J.A.; Connolly, D.R.; Serpiello, F.R. Running Intensities in Elite Youth Soccer by Age and Position. J. Strength Cond. Res. 2018, 32, 2918–2924. [Google Scholar] [CrossRef]
- Haddad, M.; Stylianides, G.; Djaoui, L.; Dellal, A.; Chamari, K. Session-RPE Method for Training Load Monitoring: Validity, Ecological Usefulness, and Influencing Factors. Front Neurosci. 2017, 11, 612. [Google Scholar] [CrossRef]
- Teixeira, J.E.; Forte, P.; Ferraz, R.; Leal, M.; Ribeiro, J.; Silva, A.J.; Barbosa, T.; Monteiro, A. (2022). The association between external training load, perceived exertion and total quality recovery in sub-elite youth football. Open Sports Sci. J. 2022, 15, 1–9. [Google Scholar] [CrossRef]
- Impellizzeri, F.M.; Marcora, S.M.; Coutts, A.J. Internal and External Training Load: 15 Years On. Int. J. Sports Physiol. Perform. 2019, 14, 270–273. [Google Scholar] [CrossRef] [PubMed]
- Vardakis, L.; Koutsokosta, M.; Michailidis, Y.; Zelenitsas, C.; Topalidis, P.; Metaxas, T.I. Correlation between Perceived Exertion, Wellness Scores, and Training Load in Professional Football across Microcycle Durations. Appl. Sci. 2024, 14, 6767. [Google Scholar] [CrossRef]
- Hennessy, L.; Jeffreys, I. The current use of GPS, its potential, and limitations in soccer. Strength Cond. J. 2018, 40, 83–94. [Google Scholar] [CrossRef]
- Miguel, M.; Oliveira, R.; Loureiro, N.; García-Rubio, J.; Ibáñez, S.J. Load Measures in Training/Match Monitoring in Soccer: A Systematic Review. Int. J. Environ. Res. Public. Health 2021, 18, 2721. [Google Scholar] [CrossRef]
- Nobari, H.; Alves, A.R.; Haghighi, H.; Clemente, F.M.; Carlos-Vivas, J.; Pérez-Gómez, J.; Ardigò, L.P. Association between Training Load and Well-Being Measures in Young Soccer Players during a Season. Int. J. Environ. Res. Public Health. 2021, 18, 4451. [Google Scholar] [CrossRef]
Figure 1.
The relationship between IL- and GPS-derived variables among U15, U17 and U19 according to the combination of training sessions and matches.
Figure 1.
The relationship between IL- and GPS-derived variables among U15, U17 and U19 according to the combination of training sessions and matches.
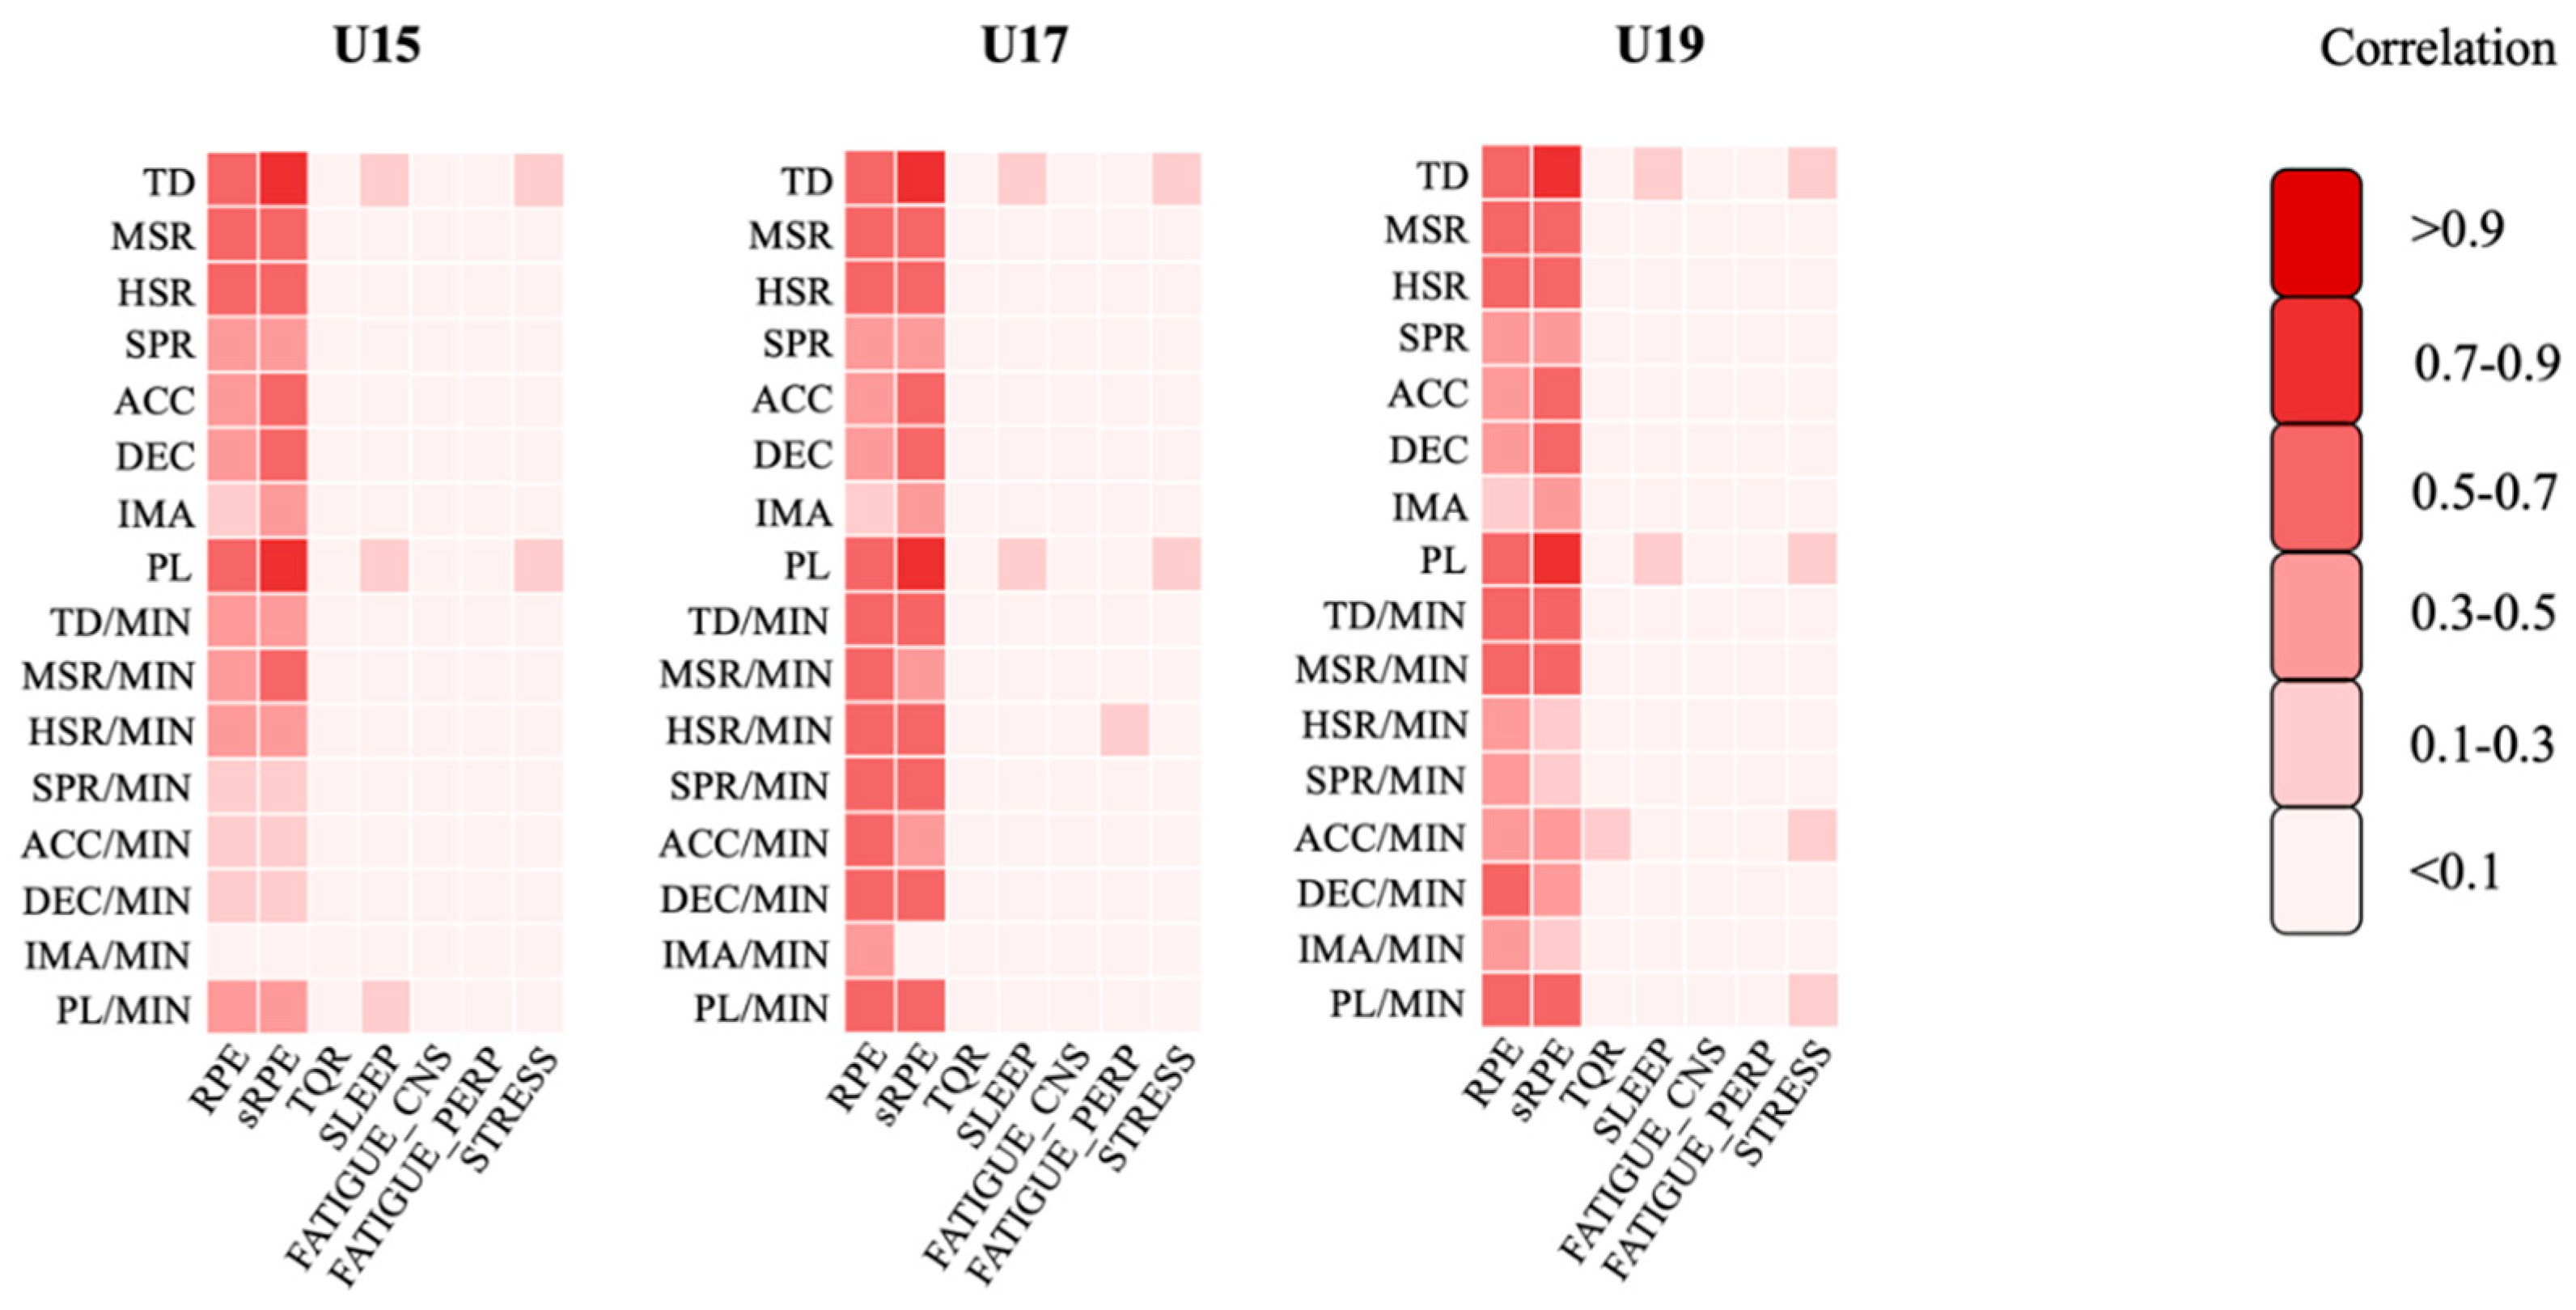
Figure 2.
The relationship between s-RPE, RPE and GPS-derived variables for U17 and U19 during training sessions.
Figure 2.
The relationship between s-RPE, RPE and GPS-derived variables for U17 and U19 during training sessions.
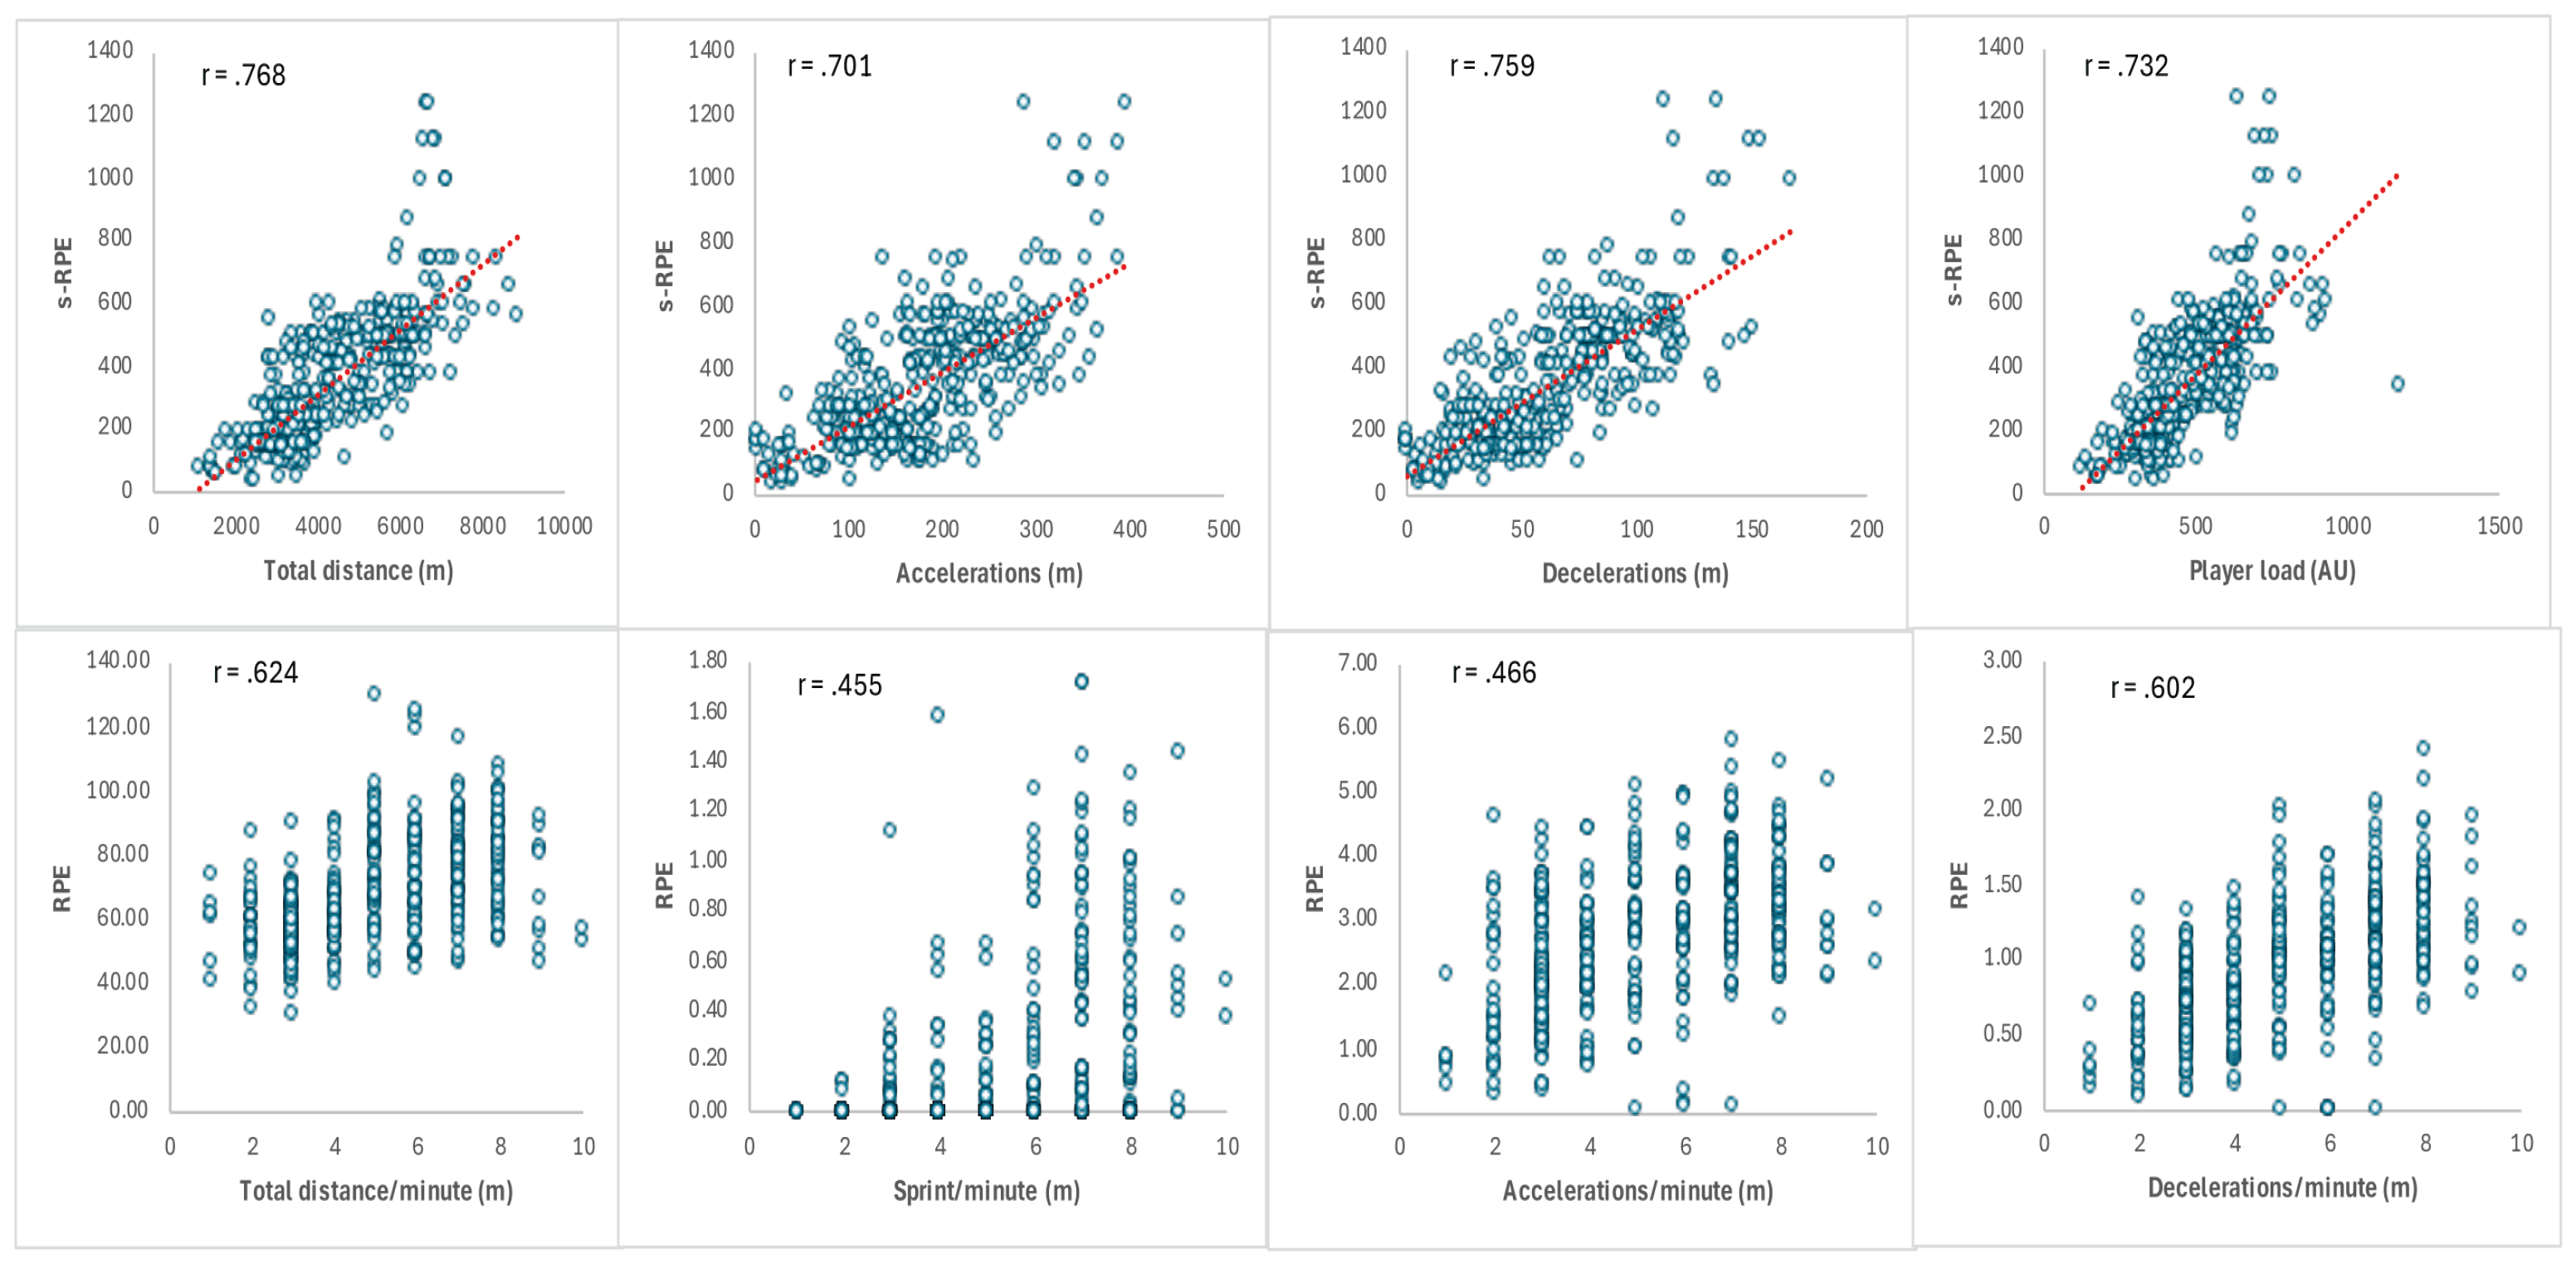
Table 2.
Descriptive statistics of collected GPS data.
| U15 | U17 | U19 | ||||
| Trainings | Matches | Trainings | Matches | Trainings | Matches | |
| mean ± sd | mean ± sd | mean ± sd | mean ± sd | mean ± sd | mean ± sd | |
| TD | 4517.64 ± 1186.71 | 8529.77 ± 986.16 | 4413.30 ± 1517.78 | 9766.66 ± 901.89 | 4359.11 ± 1497.82 | 9648.29 ± 1068.61 |
| MSR | 400.21 ± 214.35 | 1295.45 ± 366.36 | 365.57 ± 269.91 | 1421.92 ± 277.11 | 385.17 ± 262.13 | 1372.12 ± 298.46 |
| HSR | 133.01 ± 97.30 | 450.67 ± 130.68 | 101.47 ± 96.24 | 484.24 ± 152.20 | 134.20 ± 93.68 | 500.24 ± 158.18 |
| SPR | 24.22 ± 36.48 | 66.18 ± 41.22 | 16.74 ± 29.18 | 104.75 ± 62.12 | 41.52 ± 67.40 | 153.15 ± 97.38 |
| ACC | 185.73 ± 57.75 | 286.96 ± 75.32 | 178.56 ± 83.33 | 347.66 ± 59.75 | 201.76 ± 87.24 | 366.47 ± 90.62 |
| DEC | 67.66 ± 24.02 | 119.55 ± 37.12 | 63.35 ± 33.79 | 137.34 ± 24.89 | 66.36 ± 30.91 | 135.56 ± 33.77 |
| IMA | 411.31 ± 111.47 | 464.12 ± 173.01 | 416.58 ± 187.09 | 601.82 ± 138.97 | 253.83 ± 101.70 | 384.44 ± 132.08 |
| PL | 504.34 ± 127.39 | 927.18 ± 133.95 | 477.54 ± 158.58 | 997.07 ± 116.84 | 465.66 ± 161.03 | 974.41 ± 168.24 |
| TD/min | 68.06 ± 13.11 | 93.85 ± 6.49 | 68.45 ± 16.69 | 107.53 ± 9.07 | 67.71 ± 16.60 | 106.58 ± 9.47 |
| MSR/min | 5.96 ± 2.84 | 12.17 ± 3.16 | 5.63 ± 5.41 | 15.70 ± 3.18 | 2.06 ± 1.51 | 5.58 ± 1.89 |
| HSR/min | 1.98 ± 1.37 | 4.06 ± 1.17 | 1.47 ± 1.51 | 5.35 ± 1.73 | 0.53 ± 0.94 | 1.54 ± 0.96 |
| SPR/min | 0.36 ± 0.56 | 0.59 ± 0.37 | 0.21 ± 0.35 | 1.17 ± 0.72 | 9.47 ± 22.02 | 15.55 ± 21.57 |
| ACC/min | 2.79 ± 0.80 | 3.16 ± 0.73 | 2.72 ± 1.11 | 3.83 ± 0.66 | 3.09 ± 1.07 | 4.06 ± 1.03 |
| DEC/min | 1.01 ± 0.31 | 1.29 ± 0.34 | 0.95 ± 0.44 | 1.52 ± 0.30 | 1.01 ± 0.40 | 1.50 ± 0.40 |
| IMA/min | 6.21 ± 1.52 | 6.27 ± 2.02 | 6.48 ± 2.63 | 6.63 ± 1.54 | 5.88 ± 2.17 | 6.66 ± 2.48 |
| PL/min | 7.58 ± 1.34 | 10.74 ± 1.19 | 7.42 ± 1.84 | 10.98 ± 1.32 | 7.22 ± 1.80 | 10.78 ± 1.81 |
sd: standard deviation, TD: Total Distance; MSR: Medium-Speed Running; HSR: High-Speed Running; SPR: Sprint distance, ACC: Acceleration; DEC: Deceleration; IMA: Inertial Movement Analysis; PL: Player Load; RPE: Rating of Perceived Exertion; s-RPE = session-RPE.
Table 3.
Relationship between s-RPE, RPE and different GPS-derived variables expressed in volume and per minute regarding training sessions. Value represents correlation coefficients between corresponding variables respectively.
Table 3.
Relationship between s-RPE, RPE and different GPS-derived variables expressed in volume and per minute regarding training sessions. Value represents correlation coefficients between corresponding variables respectively.
| s-RPE / RPE | U15 | U17 | U19 | ||||||
| Value | 95% CI | p | Value | 95% CI | p | Value | 95% CI | p | |
| TD | 0.5160.246 | 0.398-0.5980.106-0.340 | < 0.001 | 0.7680.659 | 0.739-0.7930.605-0.704 | < 0.001 | 0.6130.362 | 0.552-0.6470.255-0.422 | < 0.001 |
| MSR | 0.4130.294 | 0.258-0.4910.144-0.368 | < 0.001 | 0.5370.599 | 0.448-0.6280.550-0.645 | < 0.001 | 0.5520.398 | 0.487-0.6240.328-0.475 | < 0.001 |
| HSR | 0.4160.380 | 0.281-0.5000.276-0.452 | < 0.001 | 0.6410.590 | 0.574-0.6940.529-0.632 | < 0.001 | 0.4930.458 | 0.425-0.5540.374-0.505 | < 0.001 |
| SPR | 0.2290.243 | 0.101-0.3430.245-0.431 | < 0.001 | 0.6210.506 | 0.513-0.7020.421-0.580 | < 0.001 | 0.3380.372 | 0.169-0.3730.305-0.497 | < 0.001 |
| ACC | 0.3910.246 | 0.298-0.4610.142-0.327 | < 0.001 | 0.7010.506 | 0.646-0.7610.547-0.701 | < 0.001 | 0.5940.391 | 0.536-0.6610.342-0.477 | < 0.001 |
| DEC | 0.4300.256 | 0.317-0.5250.138-0.362 | < 0.001 | 0.7590.470 | 0.727-0.8140.640-0.764 | < 0.001 | 0.6080.435 | 0.548-0.6840.370-0.525 | < 0.001 |
| IMA | 0.3950.190 | 0.307-0.4720.083-0.282 | < 0.001 | 0.5130.630 | 0.402-0.6150.350-0.579 | < 0.001 | 0.4250.233 | 0.365-0.4880.136-0.301 | < 0.001 |
| PL | 0.4960.188 | 0.415-0.5840.068-0.270 | < 0.001 | 0.7320.708 | 0.668-0.7860.554-0.690 | < 0.001 | 0.6060.362 | 0.529-0.6450.263-0.419 | < 0.001 |
| TD/min | 0.0950.153 | -0.089-0.214-0.005-0.270 | 0.0740.040 | 0.2350.624 | 0.154-0.3580.373-0.533 | < 0.001 | 0.3200.332 | 0.225-0.3900.243-0.408 | < 0.001 |
| MSR/min | 0.2810.252 | 0.056-0.3290.097-0.326 | < 0.001 | 0.1550.369 | 0.058-0.3660.303-0.544 | < 0.001 | 0.3050.421 | 0.210-0.3780.344-0.482 | < 0.001 |
| HSR/min | 0.2240.345 | 0.134-0.3770.236-0.431 | < 0.001 | 0.2880.435 | 0.172-0.4600.361-0.557 | < 0.001 | 0.0970.261 | 0.012-0.2030.178-0.375 | 0.04< 0.001 |
| SPR/min | 0.1470.207 | 0.027-0.2520.100-0.302 | 0.005< 0.001 | 0.3990.455 | 0.323-0.4530.378-0.516 | < 0.001 | 0.3280.454 | 0.255-0.4330.387-0.525 | < 0.001 |
| ACC/min | 0.2300.146 | -0.071-0.0910.021-0.223 | 0.066< 0.001 | 0.3250.466 | 0.250-0.4110.395-0.552 | < 0.001 | 0.3480.360 | 0.263-0.4280.289-0.447 | < 0.001 |
| DEC/min | 0.0190.186 | 0.002-0.2200.071-0.291 | 0.025< 0.001 | 0.4580.602 | 0.392-0.5390.545-0.668 | < 0.001 | 0.3810.404 | 0.291-0.4690.323-0.497 | < 0.001 |
| IMA/min | -0.0500.064 | -0.016-0.054-0.045-0.150 | 0.3510.232 | 0.0930.249 | 0.025-0.1790.153-0.351 | 0.068< 0.001 | 0.1530.161 | 0.056-0.2160.058-0.230 | < 0.001 |
| PL/min | 0.0460.040 | -0.091-0.136-0.055-0.147 | 0.3620.165 | 0.1470.382 | 0.066-0.2720.299-0.474 | < 0.001 | 0.3130.329 | 0.203-0.3780.239-0.397 | < 0.001 |
sd: standard deviation, TD: Total Distance; MSR: Medium-Speed Running; HSR: High-Speed Running; SPR: Sprint distance, ACC: Acceleration; DEC: Deceleration; IMA: Inertial Movement Analysis; PL: Player Load; RPE: Rating of Perceived Exertion; s-RPE = session-RPE; CI: Confidence Interval.
Table 4.
Relationship between s-RPE, RPE and different GPS-derived variables expressed in volume and per minute regarding matches. Value represents correlation coefficients between corresponding variables respectively.
Table 4.
Relationship between s-RPE, RPE and different GPS-derived variables expressed in volume and per minute regarding matches. Value represents correlation coefficients between corresponding variables respectively.
| s-RPE / RPE | U15 | U17 | U19 | ||||||
| Value | 95% CI | p | Value | 95% CI | p | Value | 95% CI | p | |
| TD | 0.5300.128 | 0.419-0.661-0.074-0.346 | < 0.0010.335 | 0.4150.119 | 0.181-0.598-0.194-0.382 | 0.0010.361 | 0.5880.314 | 0.427-0.6980.115-0.467 | < 0.0010.007 |
| MSR | 0.1420.007 | 0.055-0.393-0.118-0.262 | 0.1420.958 | 0.0710.032 | -0.170-0.296-0.262-0.284 | 0.5880.809 | 0.3050.286 | 0.124-0.4280.089-0.447 | 0.0090.015 |
| HSR | 0.026-0.073 | -0.197-0.270-0.301-0.222 | 0.8450.585 | 0.0950.170 | -0.194-0.278-0.179-0.399 | 0.4660.191 | 0.1500.293 | -0.133-0.4160.051-0.547 | 0.2070.012 |
| SPR | 0.0640.050 | -0.280-0.268-0.301-0.222 | 0.6290.626 | -0.0480.029 | -0.287-0.290-0.202-0.296 | 0.7160.826 | -0.0980.003 | -0.366-0.123-0.214-0.234 | 0.4150.979 |
| ACC | 0.061-0.097 | -0.197-0.338-0.261-0.162 | 0.6450.464 | 0.3520.320 | 0.060-0.497-0.055-0.502 | 0.0050.012 | 0.2750.274 | -0.053-0.475-0.085-0.435 | 0.0190.020 |
| DEC | -0.052-0.112 | -0.288-0.157-0.361-0.129 | 0.6950.399 | 0.1650.262 | -0.106-0.412-0.040-0.467 | 0.2050.041 | 0.1940.239 | -0.128-0.483-0.104-0.488 | 0.1030.044 |
| IMA | 0.049-0.116 | -0.206-0.385-0.340-0.175 | 0.7110.380 | 0.1260.059 | -0.134-0.358-0.283-0.321 | 0.3340.652 | 0.5370.433 | 0.401-0.6490.162-0.577 | < 0.001 |
| PL | 0.4360.125 | 0.302-0.595-0.096-0.372 | 0.0010.346 | 0.2920.084 | -0.061-0.506-0.214-0.342 | 0.0220.521 | 0.4550.423 | 0.301-0.6270.275-0.583 | < 0.001 |
| TD/min | 0.1660.057 | -0.017-0.367-0.180-0.305 | 0.2090.671 | 0.1660.057 | -0.583- -0.089-0.453-0.150 | 0.2090.671 | -0.1360.059 | -0.255-0.079-0.115-0.285 | 0.2550.624 |
| MSR/min | 0.024-0.037 | -0.153-0.236-0.206-0.247 | 0.8580.780 | 0.024-0.037 | -0.499-- 0.059-0.367-0.177 | 0.8580.780 | -0.0990.180 | -0.415-0.214-0.096-0.468 | 0.4080.130 |
| HSR/min | -0.137-0.108 | -0.377-0.133-0.347-0.210 | 0.3020.416 | -0.137-0.108 | -0.378-0.094-0.126-0.334 | 0.3020.416 | -0.238-0.049 | -0.472-0.021-0.257-0.182 | 0.0450.684 |
| SPR/min | -0.0050.067 | -0.344-0.220-0.263-0.274 | 0.9680.612 | -0.0050.067 | -0.401-0.2040.256-0.278 | 0.9680.612 | -0.020-0.011 | -0.219-0.225-0.272-0.183 | 0.8670.928 |
| ACC/min | -0.134-0.186 | -0.358-0.146-0.361-0.069 | 0.3100.158 | -0.134-0.186 | -0.308-0.152-0.123-0.445 | 0.3100.158 | -0.0420.145 | -0.422-0.235-0.250-0.370 | 0.7240.224 |
| DEC/min | -0.211-0.161 | -0.474--0.014-0.211-0.109 | 0.1090.224 | -0.211-0.161 | -0.422--0.013-0.150-0.339 | 0.1090.224 | 0.3550.371 | -0.450-0.231-0.260-0.384 | 0.0020.001 |
| IMA/min | -0.090-0.167 | -0.366-0.361-0.090-0.500 | 0.5000.205 | -0.090-0.167 | -0.386-0.132-0.318-0.223 | 0.5000.205 | -0.1200.106 | 0.187-0.4830.093-0.504 | 0.3150.377 |
| PL/min | 0.0960.063 | -0.109-0.356-0.187-0.353 | 0.4690.633 | 0.0960.063 | -0.595--0.031-0.365-0.107 | 0.4690.633 | -0.0020.251 | -0.174-0.2400.093-0.470 | 0.9860.033 |
sd: standard deviation, TD: Total Distance; MSR: Medium-Speed Running; HSR: High-Speed Running; SPR: Sprint distance, ACC: Acceleration; DEC: Deceleration; IMA: Inertial Movement Analysis; PL: Player Load; RPE: Rating of Perceived Exertion; s-RPE = session-RPE; CI: Confidence Interval.
Disclaimer/Publisher’s Note: The statements, opinions and data contained in all publications are solely those of the individual author(s) and contributor(s) and not of MDPI and/or the editor(s). MDPI and/or the editor(s) disclaim responsibility for any injury to people or property resulting from any ideas, methods, instructions or products referred to in the content. |
© 2025 by the authors. Licensee MDPI, Basel, Switzerland. This article is an open access article distributed under the terms and conditions of the Creative Commons Attribution (CC BY) license (http://creativecommons.org/licenses/by/4.0/).
Copyright: This open access article is published under a Creative Commons CC BY 4.0 license, which permit the free download, distribution, and reuse, provided that the author and preprint are cited in any reuse.


