Submitted:
12 August 2025
Posted:
13 August 2025
You are already at the latest version
Abstract
The black pine (Pinus nigra Arn.) is among the most preferred tree species for afforestation in Türkiye. This study aims to examine the effects of afforestation carried out in 1968, 1973, 1985, 1996, and 2002 on soil properties, especially soil organic carbon (SOC) and Nitrogen (N) in a semi-arid region of Türkiye. Soil texture, electrical conductivity (EC), reaction (pH), cation exchange capacity (CEC), calcium carbonate (CaCO3) intensity, N, and inorganic-organic C contents were determined for each afforestation site. Although afforestation significantly increases SOC and TN stocks, the stand age did not affect the dynamics of SOC stocks. But early stages of afforestation increased N stocks by more than 500-600% compared to older ones. Our results show that afforestation combined with soil preparation increases the SOC and N contents, and soil tilling without plantation acceler-ates this process in the initial stages of afforestation. Rather than planting only one tree species, a plantation that mixes broad leaves and conifers with other annual and perenni-al plants may be more suitable for long-term C sequestration and use of assisted natural succession in revegetation of degraded arid and semi-arid regions, as an alternative to large-scale afforestation, should be paid more attention in the future.
Keywords:
afforestation
; inner Anatolia
; C and N stocks
; forest soils
; semi-arid regions
1. Introduction
According to the UNCCD (2024), 2.3 billion people lived in drylands, which comprised almost a third of all people on Earth in 2020, representing a two-fold increase from 1990. Most of these people reside in Asia and Africa [1]. These arid regions cover 41% of terrestrial ecosystems [2], store approximately 27% of all SOC [3] and are marked by chronic water scarcity, drought, significant climatic variability, and land degradation, which includes desertification and biodiversity loss [2]. As land degradation is a major challenge in these ecosystems [4], afforestation becomes one of the most essential forestry activities to restore these degraded areas [5]. The sustainability of livelihood in these regions is threatened by a complex and interrelated range of social, economic, and ecological changes that cause challenges to researchers, policymakers, and, above all, rural land users [4]. Large-scale and time-spanning ecological restorations, such as afforestation, can change entire ecosystems and their services [5,6]. Using afforestation for ecological restoration changes the soil characteristics over time, soil fertility increases in parallel with the amount of organic matter entering the system, and as a result, soil fauna and soil respiration also change [7,8]. Scientific detection and measurement of these changes are of great importance in the sustainable management of these ecosystems.
The pressure of mankind on forest areas for centuries has caused the world's forest cover to decrease, and the increasing pressure of the Industrial Revolution has caused a rapid decline since the 1800s [9]. These anthropogenic disturbances become a lack of nutrients and carbon in forest ecosystems [10]. For instance conversion of forests to agricultural lands in the Western Black Sea Region of Türkiye, 22% of the soil carbon, approximately 1/3 of the nitrogen, was lost in the first three years, and 45% of the soil carbon ten years later [11], and the physical and chemical structure of the soil deteriorated. Soil fertility and production capacities decrease due to vegetation disturbances in arid and semi-arid areas. Since the disturbance of the structure and functions of ecosystems jeopardizes the sustainability of the services they provide to society, the structure of fragile ecosystems and the restoration of disturbed ecosystems have become one of the most critical concerns of natural resource managers [8]. Moreover, these regions play an essential role on the global C cycle and have strong potential for C sequestration [3,12]. At the 12th Conference of the Parties to the United Nations Convention to Combat Desertification (UNCCD COP12); it was decided to determine the Land Degradation Neutrality (LDN) targets that countries have voluntarily stated until 2030, towards the United Nations Sustainable Development Goal 15.3, and to monitor the work carried out and land degradation trends [13]. The rehabilitation, restoration, and reforestation studies to be carried out will contribute to the carbon accumulation [14].
Türkiye is in the Mediterranean region and is one of the most vulnerable countries against climate change [15,16,17,18,19]. Semi-arid and arid areas constitute 35% of Türkiye's surface area. However, when semi-humid areas prone to desertification are added, this figure increases to 60%. However, continuing long-term anthropogenic disturbances like intensive cultivation, overgrazing and land misuse by thousands of years over large terrestrial ecosystems, the naturally occurring plant cover has partially or totally disappeared [5,20]. Therefore, it is revealed that more than half of the country's surface area is at risk of desertification [21,22]. Considering that large land areas of Türkiye are affected by drought and that most potential afforestation areas, including the study areas, are in these areas, it becomes clear that the scope of the study is parallel to the objectives of many action plans and R&D studies in Türkiye.
Black pine has a wide distribution area in the Mediterranean Basin, and Türkiye has an important share [23,24]. Türkiye has approximately 23.36 million hectares of forest area, and black pine is the 3rd most widespread tree species after oak (Quercus spp.) and red pine (Pinus brutia), with a spread area of 4.1 million hectares, 1.26 million hectares of which are designated as degraded areas [25]. Afforestation has an important share in all forestry activities [25], and black pine is among the most used species from the past [26] to present [27,28,29] in Türkiye. According to the statistics kept by the General Directorate of Forestry in degraded areas, approximately 9.7 million hectares of afforestation were carried out between 1946 and 2023. Black pine has a large place in these afforestation activities, and approximately 1 billion black pine saplings were produced and planted in the fields between 2009 and 2016 [25].
Afforestation in degraded areas of arid and semi-arid regions causes changes in soil physical and chemical properties, including texture, pH, CEC, soil carbon, and nitrogen, in both the short- and long-term. Various studies emphasize that afforestation increases soil organic carbon (SOC) and Nitrogen (N) content and decreases high soil pH over time [5,6,30,31,32,33,34,35,36,37,38,39,40]. Most afforestation studies in arid and semi-arid regions of Türkiye focus on survival rates and growth data; limited data are available about changes in soil properties [5,6]. Therefore, this study aims to examine the soil properties, especially soil organic carbon (SOC) and Nitrogen (N) changes, with the chronological order of black pine afforestation carried out at different years in the Nallıhan Region, which is a semi-arid transitional region between the humid Black Sea Region and the arid Central Anatolia Region. The assessed alterations in soil characteristics, soil organic carbon (SOC), and nitrogen accumulation supply some of the missing data and enable future afforestation, restoration, and rehabilitation efforts to be guided more scientifically within this framework.
2. Materials and Methods
2.1. Study Area and Sampling
The study sites (Figure 1) are in Ankara Province, Nallıhan District, Nallıhan Forest Management Directorate, Nallıhan Forest Management Chiefship Office, and Uluhan Forest Management Chiefship (40°00’28’’- 40°19’22’’N 31°17’55’’- 31 45’04’’ E), which has an approximately 81623.6 ha area, 31455 ha forested and 50168 ha non-forested [41,42]. Experimental sites were selected from the black pine (Pinus nigra Arn.) afforestation areas (Table 1) within the boundaries of Nallıhan Forest Management Directorate and Uluhan Forest Management Directorate above Atça Village, within the scope of green belt afforestation works of Ankara Regional Directorate of Forestry in 1968, 1973, 1985, 1996, 2002. Calcareous soils dominate the area, and soil preparation is required in all afforestation sites. Thus, the topsoil (0-30cm) is plowed, and the subsoil (30-80cm) is ripped with a three-shank ripper using a 4 × 4 rubber-tired tractor to prepare the site for planting [41,42,43]. This area is in the transition zone between the Euxine subflora section of the European-Siberian flora region and the Iran-Turan flora region, and a transition zone between the humid Black Sea climate and the arid Continental climate [44,45]. The elevation of these sites varies between 900 and 1500 meters, and according to Thornthwaite climate indices, it is in a semi-arid area under the influence of an effective drought, especially in the summer months [46]. The mean annual temperature is 12.4 ℃, and the mean annual precipitation is 360 mm [41,42]. 80 percent of the study areas consist of andesite, lava, and tuff bedrock of volcanic origin formed in the 3rd geological period. The erosion period started after the Neogene, the valleys deepened, and the accumulation of lime, clay, sand, marl, and gravel on the lake and sea floors formed Neogene plateaus in the region, and has preserved its continental form until today, with the withdrawal of the sea in the Oligocene [41,42]. Black pine forests in the region are generally widespread on soils over limestone, andesite, and marl [47]. Soil depth ranges from 50-70 cm, measured on 25 soil profiles in the current study. The soil type is loam; it varies from place to place between clay, clayey loam, and sandy loam. These soils are brown forest soils according to the old European and American classification [47,48], and so-called calcic cambisols, xerosols, and calcisols in the FAO soil map [49]. Inceptisol soils are dominant in the area, and being in a transitional region, aridisols are present in the south, and alfisols in the west, according to the USDA soil taxonomy [50]. Black pine consists of 30.2% of the forest area in the region, and 10.3% consists of red pine, and the rest is a mixture of other broad-leaved species [41,42]. Understory plants are Juniper (Juniperus oxycedrus L. subsp. oxycedrus), astragalus (Astragalus schizopterus Boiss.), alyssum (Alyssum minus (L.) Rothm. Var. minus), poisonous clover (Dorycnium pentaphyllum subsp. anatolicum), windgrass (Apera spica-venti), campanula (Campanula lyrata Ssp. lyrata), Broomleaf toadflax (Linaria genistifolia Subsp. linifolia), Italian catchfly (Silene italica), rough bluegrass (Poa trivialis L.) [47].
The study was carried out in black pine afforestation sites established in five different years (1968, 1973, 1985, 1996, and 2002) and within/adjacent soil-tilled sites (will be used as tilled from now on) in the same year but not planted (Figure 2). All sites were fenced, and the fences remained in place until the seedlings gained biological independence. Three plots, each with an area of 20 m × 20 m, were randomly created for each site (i.e., blocks) in 2015. Litter, humus, and needles were collected from afforestation sites and were not present in the soil-tilled sites. Three replicated litter and humus samples were collected within 30×30cm quadrats from three randomly determined locations in each sampling plot, and then it was calculated as Mg ha-1. Needle samples were collected from randomly selected 5 trees in each sampling plot. Three soil pits were excavated through bedrock in each plot, and two sets of soil samples were taken from the soil surface to 50 cm at every 10 cm depth. One for bulk density, taken with a 100 cm3 cylinder (AMS Soil Core Sampler), and the other for soil physical and chemical analyses, 1 kg in weight, taken with a hand shovel.
Collected soil samples were analyzed for soil bulk density, coarse fraction (dry screening Ø > 2 mm) texture, lime content, pH, salinity, CEC, organic carbon (SOC), and total nitrogen (TN). The Bouyoucos hydrometer technique was used to measure the soil texture [52,53,54]. The acidity and electrical conductivity (EC) of the air-dry soil samples (<2 mm) were determined in a pure water mixture using a pH meter and an EC meter [55,56]. Soil Inorganic Carbon (SIOC) was calculated from the Lime content determined via a Scheibler Calcimeter [57,58,59]. An NH4OAc extraction was used for the determination of the CEC [60]. CN concentration of soil (TSC), litter, humus, and needles was analyzed using the dry combustion method in a LECO CN analyzer [61,62]. The amount of Soil C and N was calculated in Mg ha-1 by multiplying the C and N concentrations by the soil amount obtained from soil bulk density. The C and N amount of litter and humus was calculated by multiplying the C and N concentrations by litter and humus in Mg ha-1.
2.2. Data Analysis
Soil properties and the other variables for each species were compared for five different afforestation years, and a block design was used for data analysis. A comparison of soil, litter, and humus variables was carried out between afforestation and tilled sites within the same year and among the same treatments within different years. The measured parameters were evaluated using analyses of variance (ANOVA). The SAS software was used in the statistical analysis of the data, and the results were considered significant at a level of α=0.05. The Tukey mean separation test was performed at a significance level of α=0.05 to permit separation of the means.
3. Results
3.1. Soil Cation Exchange Capacity (CEC), pH, EC, and Total Lime (CaCO3) Concentrations
When cation exchange capacities are examined in afforestation and tilled sites in different years according to depth levels, no statistically significant difference is observed. The values vary between 18.74-42.58 Cmolc kg-1 in afforestation sites and 18.32-38.60 Cmolc kg-1 in tilled sites. However, when compared among afforestation sites within different years, topsoil (0-10 and 10-20 cm soil depth) CEC increased by approximately 50% from 1968 to 1996 but then decreased to lower than initial levels in 2002 (Table 2), and the same trend was observed for tilled sites. The soil pH (Table 2) is alkaline, and while pH was 7.36-7.68 in the afforestation sites, it was 7.18-7.70 in the tilled sites, and does not differ between afforestation and tilled sites within the same year until 1996. Then, it decreased at a very low rate in 0-10 cm and 10-20 cm soil depth among afforestation sites and tilled sites between 1996 (2,6%-3.3%) and 2002 (1,2%-1.6%). A similar trend of pH was observed for total lime concentrations and EC (Table 2). Lime concentration increased in 1968 and 1973 tilled sites at 0-10 cm, by 25% and 8%, respectively, and 10-20 cm soil depth, by 28% and 9%, respectively, compared to the same year afforestation sites. It decreased by 85%, 38%, and 25% at 0-10 cm soil depth in 1985, 1996, and 2002 tilled sites, respectively, and it decreased by 82%, 47%, and 12% at 10-20 cm soil depth in 1985, 1996 and 2002 tilled sites, respectively compared to do same year afforestation sites. While the highest total lime concentration for all soil depths was in the 1968 and 1973 afforestation and tilled sites, it decreased dramatically for the following years (Table 2). EC was lower than 4000 μS cm-1 for all sites, and thus, there was no salinity problem. It increased in 1968 (202.75 μS cm-1) and 1973 (154.55 μS cm-1) tilled sites at 0-10 cm, by 30%, and 33%, respectively, and 10-20 cm soil depth, by 20%, and 24%, respectively, compared to the same year afforestation sites (Table 2). However, it decreased by 34%, 33%, and 16% at 0-10 cm soil depth in 1985, 1996, and 2002 tilled sites, respectively, and it decreased by 34%, 32%, and 13% at 10-20 cm soil depth in 1985, 1996 and 2002 tilled sites, respectively compared to do same year afforestation sites.
3.2. Soil Texture (Sand, Clay, and Silt Concentrations) and Bulk Density (g cm-3)
Soil texture varied from sandy loam to clay loam, and the dominant soil type was sandy clay loam in 1968, 1973, and 1985, and it was sandy loam in 1996 and 2002 in all sites. Sand, clay, and silt concentrations differed in afforestation and tilled sites within the same year, and the dramatic decrease was determined for the clay content, which decreased by 60 to 70% in 1996 tilled sites. Furthermore, the clay content decreased by approximately 50% in 2002 compared to previous years' afforestation and tilled sites (Table 3). As the area ages, the clay content increases, and afforestation sites contain more clay than tilled sites. Different treatments did not change the soil bulk density for the same year (Table 3). However, in the afforestation and tilled areas of 2002, the soil bulk density for all soil depth levels, especially topsoil (0-10cm, 10-20cm soil depth), was ~1.4-1.5 g cm-3 and higher than in previous years. The soil bulk density gradually decreases as the years go back.
3.3. Soil Carbon and Nitrogen
Although the SOC concentration was higher in the topsoil of the 1968 and 1973 afforestation sites compared to tilled sites, the opposite was true for the subsequent years. The SOC concentrations in afforestation sites at 0-10 cm were 35% and 54% lower, and at 10-20 cm soil depth were 31% and 69% lower in 1985 and 1996 afforestation sites, respectively, than in the same year's tilled sites (Table 4). It decreased by 89% and 93% at 20-30 cm and 30-40 cm soil depth in 1996 afforestation sites compared to the same year tilled sites, respectively. Although there were no statistical differences among afforestation sites of various years at the same depth level, the SOC concentrations were 160% and 220% higher at 0-10 cm and 10-20cm soil depths in tilled sites in 1996 than in other tilled sites.
Quite the opposite of SOC concentrations, the SIOC and TSC concentrations of topsoil increase as the treatment year goes back (Table 4). The highest SIOC and TSC concentrations were in tilled sites in 1973. While the SOIC concentration was lower in afforestation sites in 1968 and 1973 than in tilled sites, it was more in 1985 and 1996. The SOIC concentration was 20% and 7% less at 0-10 cm, 22% and 8% less at 10-20 cm soil depth in 1968 and 1973 afforestation sites, and was 565% and 61% more at 0-10 cm, 465% and 90% more at 10-20 cm soil depth in 1985 and 1996 afforestation sites than the same year tilled sites. The TSC concentration was 15% and 31% less at 10-20 cm, and 5% and 42% less at 10-20 cm soil depth in 1985 and 1996 afforestation sites, and in 1996 at 20-30 and 30-40 cm soil depth was 63% and 82% less than the same year tilled sites.
The only soil N concentration difference with the highest value was in 1996 tilled sites for five soil depth levels from surface to bottom (Table 4), and it was ~ 875%, 840%, 1145%, 2310%, and 1730% higher than the same year's afforestation sites, respectively. Furthermore, the N concentrations of 2002 afforestation sites at 0-10 and 10-20 cm soil depths were ~ 630% and 525% higher than those of 1968, 1973, 1985, and 1996 afforestation sites (Table 4). On the other hand, the N concentrations of both 1996 and 2002 tilled sites at all soil depth levels were higher than those of the previous years' tilled sites. It was ~ 1285%, 1520%, 1740%, 1970% and 1790% more in 2002 tilled sites, and ~600%, 620%, 875%, 760% and 920% more in 1996 tilled sites at five soil depth levels from top to bottom, respectively, than in 1968, 1973, and 1985 (Table 4).
The amount of SOC was 24% and 61% less at 0-10 cm soil depth in afforestation sites of 1985 and 1996, 72% less in afforestation sites of 1996 at 10-20 cm soil depth, and 140% and 190% less in afforestation sites of 1968 and 1996 at 40-50 cm soil depth than the same year tilled sites (Figure 3). Although there were no statistical differences for SOC amount among afforestation sites at the same depth level, it was ~140% and 180% higher for the 0-10 cm and 10-20 cm soil depths of tilled sites in 1996 than in 1968, 1973, 1985, and 2002 (Figure 3). The amount of SIOC at 0-10 cm and 10-20 cm soil depths in 1985 was ~90% less than both in 1968 and 1973 afforestation and tilled sites, it was ~ 676% and 581% more in afforestation sites than tilled sites (Figure 3). It did not change after 1985 and was less than in previous years. The TSC amount gradually decreased from 1968 to 2002 for all treatments at all soil depth levels, and it did not differ among treatments except in 1968 and 1996 (Figure 3). The TSC amount was ~ 37% and 13% less at 0-10cm in afforestation sites of 1968 and 1996, and ~ 44% less at 10-20cm soil depths in afforestation sites of 1985 than in the same year tilled sites. The amount of SOIC was ~ 750% to 1400% more in 1973 and ~ 350% to 600% more in 1968, TSC was ~ 400% to 700% more in 1973, ~ 180% to 400% more in 1968 afforestation sites at all soil depths than those of 1985, 1996 and 2002 afforestation sites. The amount of SOIC in tilled sites was ~ 2600 to 4000% more in 1973, ~ 2000% to 2300% in 1968, TSC was ~ 500 to 800% more in 1973, ~ 300% to 500% more in 1968 at all soil depths than those of 1985, 1996 and 2002 tilled sites.
While the amount of soil N was 34% less in afforestation sites than tilled sites at 0-10cm soil depth in 1968, it did not differ till 1996 (Figure 4). It was ~ 1045%, 900%, 1050%, 1225%, and 1040% more, respectively, at five soil depth levels from surface to bottom in 1996 tilled sites than in the same year at afforestation sites. There were no differences between treatments in 2002. The amount of N was ~ 790%, 715%, 420%, 345%, and 900% more in afforestation sites in 2002 at all soil depths from surface to bottom than those of 1968, 1973, and 1985 afforestation sites, and 750%, 815%, 910%, 730% and 930% more in tilled sites in 2002 at all soil depths from surface to bottom than those of 1968, 1973 and 1985 in tilled sites. Furthermore, N was ~ 1250%, 1430%, 1370%, 1140%, and 1100% more in tilled sites in 1996 at all soil depths from surface to bottom than those of 1968, 1973, and 1985 tilled sites.
In the first 50 cm depth of soil in 1968, 1973, 1985, 1996, and 2002 afforestation sites, the amount of IOC was estimated at 129, 248, 26, 23, and 24 Mg ha-1, OC was 33, 14, 25, 16 and 28 Mg ha-1 and N was 15, 8, 7, 9 and 62 Mg ha-1, respectively (Figure 5). The amount of SOC and N at 50 cm soil depth in 1996 tilled sites was 320% and 830% more than the same year afforestation site (Figure 5). There were no differences for other years treatments for SOC. The highest N amount in afforestation and tilled sites was in tilled sites of 1996, and tilled and afforested sites of 2002. And it was ~660% more than the rest of the treatments (Figure 5).
3.3. Carbon and Nitrogen Contents of Tree Needles, Litter and Humus
The C concentration of needles of trees did not change among afforestation sites, but N concentration was ~40% more in 1996 and 2002 than in 1968, 1973, and 1985 (Figure 6). The highest amount of litter (7.8 Mg ha-1) and humus (46 Mg ha-1) was in 1968 afforestation sites, and litter was 79% more than that in 1973, 1985, 1996, and 2002, humus was 484% more than that in 1973, 1985, and 1996. While the mean C concentration of litter for all afforestation sites was ~ 47%, the C concentration of humus decreased from this level in 1968 to 33%, 30%, and 15% in 1973, 1985, and 1996, respectively (Table 5). The highest N concentration of litter and humus was 1.7% and 1.1% in 1968 afforestation sites (Table 5). Litter N concentration was ~276% higher in 1968 than in 1973, 1985, 1996, and 2002. The N concentration of Humus was ~125%, 270%, and 4681% more in 1968 than in 1973, 1985, and 1996, respectively. The carbon amount of litter per hectare in 1968 was 72% more than that in 1973, 1985, 1996, and 2002, and the carbon amount of humus per hectare was 490% more than that in 1973, 1985, and 1996 (Figure 7). The litter N amount per hectare was ~700% more in 1968 than in 1973, 1985, and 1996. The N amount of humus was ~290%, 1330%, and 16250% more in 1968 than in 1973, 1985, and 1996, respectively (Figure 7).
4. Discussion
The aim of afforestation efforts in arid regions is to improve ecological services, including soil conservation and biodiversity enhancement. Due to the better maximization of the carbon-water ratio, pine species are increasingly selected for forestry plantations in areas with higher drought risk [63]. Thus, black pine is a common [5,64,65] and recommended [23,63,66,67,68] species used for afforestation in arid and semi-arid regions of Türkiye based on its water-use efficiency and successfully grows in the area [5,64,65]. It is reported that seedling survival rates for black pine in arid region of Türkiye were 30% [65], 30%, 25% and 20% [5] at the end of the 3rd, 10th, 15th, and 30th year, respectively. Although there is a decline in the mortality rate with stand age, it slows down after 20 years and grow faster than other species used in afforestation sites [5]. However, long-term regional data on effects of afforestation on soil properties are scarce in Türkiye [5].
Degradation frequently coexists with a decline in soil fertility, which is necessary for trees to grow properly. Afforestation practices not only change the vegetation but also soil properties[9]. Soil texture and OM are among the most important parameters determining both the physical and chemical properties of soil [6,69,70]. Using heavy machinery in afforestation operations can affect both soil texture and bulk density and can cause compaction in the topsoil [5,6,69,71], while deep tillage with implements like rippers can have the opposite effect by increasing soil porosity [5,65,67,72]. The soil bulk density for all soil depth levels, especially topsoil (0-10cm, 10-20cm soil depth), was higher than in previous years in 2002 and it gradually decreases as the years go back. Clay can be illuviated into lower horizons by this increased soil porosity and the sand content in young stands may be higher due to clay illuviation by deep soil ripping. Current study showed that clay content increased as the sites aged and afforestation sites had more clay content than tilled but not afforested sites. CEC increased by approximately 50% from 1968 to 1996 afforestation sites but then decreased to lower than initial levels in 2002, and the same trend was observed for tilled sites. This shows soil tillage in degraded lands in arid region of Türkiye decrease the CEC at the beginning, than it increases for 10-20 years and slightly decreases, and stays stable for the following years [48,60]. While the highest total lime and SOIC concentrations, and EC values for all soil depths were in 1968 and 1973 afforestation and tilled sites, it decreased for the following years. This might be happened as explained before deep tillage with implements like rippers might have increased soil porosity at the initial stages of afforestation [5,65,67,72] and this might have caused carbonates and salts to leach easier than compacted soils. As the vegetation covers the area over time, it might have slowed down leaching [5,73].
It is stated that salinity problems occur in the soil at values greater than 4 ds m-1 (4000 μS cm-1) [74,75]. EC was lower than 4000 μS cm-1 for all sites, and thus, there was no salinity problem in the current study areas. Decreased lime concentration also affected the soil pH and although the soil pH did not differ between afforestation and tilled sites within the same year until 1996, it decreased at a very low rate in 0-10 cm and 10-20 cm soil depth among afforestation sites and tilled sites between 1996 (2,6%-3.3%) and 2002 (1,2%-1.6%). A similar trend was observed in a study in adjacent arid areas of inner Anatoli and while the EC increased 15-20 years after, the soil pH at the first 30 cm had decreased by 0.15 units for the 25–27 year period compared to more recent afforestation periods [5]. Also black pine afforestation in Central Anatolia Region of Turkey in Gölbaşı/Ankara province, where is very close to current study areas, decreased the soil pH both in top- and subsoil [70]. A study of 33- and 45-year results from Picea crassifolia afforestation sites (limestone bedrock, 400 mm of rainfall) in the Gansu region of northwest China revealed a drop in soil pH at a depth of 70 cm compared to neighboring steppe areas [32]. In another study of afforestation in India, soil pH declined by around 0.6 units (from 9.7 to 9.08) in the afforested region compared to the control areas [76]. Black pine afforestation in Central Anatolia Region of Turkey in Gölbaşı/Ankara province, where is very close to current study areas, decreased the soil pH both in top- and subsoil [70].
The SOC concentrations were higher in the topsoil of the 1968 and 1973 afforestation sites compared to tilled sites, the opposite was true for the subsequent years. Although there were no statistical differences among the SOC concentrations of afforestation sites of various years at the same depth level, the N concentrations of 2002 afforestation sites at 0-10 and 10-20 cm soil depths were ~ 630% and 525% higher than those of 1968, 1973, 1985, and 1996 afforestation sites. The only soil N concentration difference with the highest value was in 1996 tilled sites for five depth levels and it was higher than the same year's afforestation sites. However, the SOC and N concentrations reached the highest level in the topsoil of 1996 tilled sites and were higher than in previous and subsequent (2002) tilled sites. If we take 2015 as a reference point from the earliest afforestation and soil tillage in 2002, the SOC concentration at 20 cm soil depth in tilled sites doubles in approximately 20 years, then falls back to previous levels in 30 years and maintains these levels 50+ years. No differentiation occurs for the SOC in afforestation sites. Moreover, the N concentration in tilled sites doubles in approximately 20 years at 50 cm soil depth, a dramatic drop occurs for the following years, and this dramatic drop starts ~10 years earlier than tilled sites in the afforestation sites. Our results show that afforestation combined with soil preparation increases the SOC and N contents, and soil tilling without plantation accelerates this process in the initial stages of afforestation. As mentioned before, although afforestation significantly increases SOC and TN stocks in arid and semi-arid regions, the plantation age did not affect the dynamics of SOC stocks [33], but early stages of afforestation, 20 years in the current study, increased the N stocks by more than 500-600% compared to older ones [33,77]. Because the highest amounts were in 1968, and there were no significant differences from 1973 to 2022. The increase in soil nitrogen was also determined in needles in young stands and was 40% higher than in old stands. Afforestation in a similar area close to the current study also increased the SOC and N concentration at the first 30-cm depth by 2.5 times after 10 years and approximately 0.3 times after 17 years, respectively, compared to the open area, and did not change in the afforestation sites for the following years [5]. It is well known that depending on the management system of a terrestrial ecosystem, the seral stages of ecological succession can be reduced, eliminated or increased [5,7,8,78] and this can alter the soil properties. Soil preparation before afforestation might have accelerated pioneer species colonization on current site. These fast-growing pioneers might have a significant impact on the chemistry of the soil and produce more litter during the early stages of forest formation [7]. For example, using a systematic arrangement of grass, shrubs, young regenerated forest, and closed forest on karst landforms receiving about 900 mm annual precipitation in Yunnan, S.W. China increased soil N and lowered high pH as a result of forest restoration [79]. But using only one climax species, black pine in our study, increases the SOC and N concentration at the initial stages but do not change for the following years of afforestation. A meta-analyses on soil C and N stocks after afforestation in arid and semi -arid regions support our results; although afforestation significantly increase SOC and TN stocks in arid and semi-arid regions, the plantation age had no effect on dynamics of SOC and TN stocks after afforestation [33]. They also concluded afforestation with broadleaf trees resulted in a significant increase in SOC stock, while afforestation with pines generally had no effect on SOC stock [33]. Afforestation created using a variety of plant species may result in variations in the chemistry of the soil [5,78,80]. For this reason, rather than planting only coniferous trees, a plantation that mixes broad leaves with other trees may be more suitable for long-term C sequestration [9,33,77,81]. By first choosing pioneer species with a high success rate, restoration initiatives for species at the advanced stage of succession in arid locations may be improved and this assisted natural succession can be applied to greatly accelerate the revegetation [80]. Dense tree cover may suppress the productivity of understory plant species. Consequently, employing low-density forestry systems may be preferable to closed-canopy forestry systems, as it diminishes ecosystem complexity and reduces the diversity and richness of plant species [82]. By doing this, the fertile soil conditions required for climax plants in the mid and late seral stages of succession [8,83,84,85,86] could be provided. R-strategic like light-dependent herb species (e.g., N-fixers) can exploit the high source of light before the closure of the canopy [81,87,88]. Consequently, a significant number of ruderals extant in ground vegetation during the initial phases of succession (stand development) may have enhanced the productivity of the soil in these previously degraded lands [7,8,89].
Not only the soil chemistry and physical properties changed, the amount of litter and humus was also altered depends on the afforestation year, and the highest amount of litter (7.8 Mg ha-1) and humus (46 Mg ha-1) was in 1968 afforestation sites, and litter was 79% more than that in 1973, 1985, 1996, and 2002, humus was 484% more than that in 1973, 1985, and 1996. Similarly, in an afforestation project established in the inner Anatolian region, which receives an annual average rainfall of ~300 mm, the amount of litter was found to increase in parallel with the afforestation age regardless of species[5]. Initial land use of afforestation sites is one of the most important factors affecting litter and humus accumulation. Degraded areas in arid and semi-arid regions, like in inner Anatolia of Türkiye, are generally barren lands and have sparse vegetation coverage and poor soil conditions. So SOC and N could be rapidly accumulated after afforestation with soil tillage because of an increase in SOM input from litterfall, root biomass and colonization of annual and perennial herbs [33,38,40]. The increase in litter and humus amount in old stands also affected the amount of C and N in litter and humus, and the older the stand, the more C and N were measured. It was observed that the amount of litter and humus stays at the same level ~ 40-50 years and then increases 80% more than the previous years.
While the highest N concentration of soil and needle was in young stands, it was vice versa for litter and humus. The top-soil N concentrations of 2002 afforestation sites were higher than those of 1968, 1973, 1985, and 1996 afforestation sites. The significant increase in soil nitrogen in 2002 also increased plant nitrogen uptake, and consequently, the nitrogen content of needles in afforested areas that same year was also high. Over time, soil nitrogen decreased, and with litterfall, nitrogen in the soil surface (litter and humus layers) increased. This demonstrated a biogeochemical nitrogen cycle [7,8,90], although not ecologically long-term. On the other hand, it should not be overlooked that the nitrogen content in afforestation sites decreases much faster than in areas where only soil tillage is done. Thus, it supports the idea of assisted natural succession can be applied to greatly accelerate the revegetation, plant nutrition and successful restoration [80].
5. Conclusions
In general, the results of this study indicated that afforestation combined with the topsoil (0-30cm) plowing, and the subsoil (30-80cm) ripping significantly increased the SOC and N stocks, CEC, and clay content. Although stand age did not affect the dynamics of SOC, early stages of afforestation, 20 years in the current study, had 500-600% more N stocks compared to older ones. However, soil tillage without afforestation doubled the SOC concentration in approximately 20 years, then fell back to previous levels in 30 years and maintained these levels for 50+ years. The SOC concentrations were higher in the topsoil of the oldest afforestation sites compared to soil tillage without afforestation, and the opposite was true for more recent years. Moreover, the N concentration in tilled sites doubles in approximately 20 years, a dramatic drop occurs for the following years, and this drop starts ~10 years earlier in the afforestation sites. Our results show that afforestation combined with soil preparation increases the SOC and N contents, and soil tilling without plantation accelerates this process in the initial stages of afforestation. For this reason, rather than planting only one tree species, a plantation that mixes broad leaves and conifers with other annual and perennial plants may be more suitable for long-term C sequestration and use of assisted natural succession in revegetation of degraded arid and semi-arid regions, as an alternative to large-scale afforestation, should be paid more attention in the future. Furthermore, the assessed alterations in soil characteristics, especially soil organic carbon (SOC), and nitrogen accumulation may supply some of the missing data and enable future afforestation, restoration, and rehabilitation efforts to be guided more scientifically.
Author Contributions
Conceptualization, Murat Sarginci and Adem Seçilmiş.; methodology, Murat Sarginci and Adem Seçilmiş.; software, Murat Sarginci and Adem Seçilmiş.; validation Murat Sarginci and Adem Seçilmiş; formal analysis, Murat Sarginci and Adem Seçilmiş; investigation, Murat Sarginci and Adem Seçilmiş; resources, Murat Sarginci and Adem Seçilmiş; data curation, Murat Sarginci and Adem Seçilmiş; writing—original draft preparation, Murat Sarginci and Adem Seçilmiş; writing—review and editing, Murat Sarginci and Adem Seçilmiş; visualization, Murat Sarginci and Adem Seçilmiş; supervision, Murat Sarginci; project administration, Murat Sarginci; funding acquisition, Murat Sarginci and Adem Seçilmiş. All authors have read and agreed to the published version of the manuscript.
Funding
This research was funded by Düzce University Scientific Research and Projects Coordination Office (DÜBAP) as a master thesis project, grant number 2016.02.02.509.
Data Availability Statement
Data is available upon request from the authors.
Acknowledgments
We thank, Nallıhan Forest Management Directorate, Nallıhan Forest Management Chiefship crew, and Uluhan Forest Management Chiefship crew for their valuable help while field work.”
Conflicts of Interest
The authors declare no conflicts of interest.
References
- Vicente-Serrano, S.M., N. G. Pricope, A. Toreti, E. Morán-Tejeda, J. Spinoni, A. Ocampo-Melgar, and A.D. E. Archer, T. Mesbahzadeh, N. H. Ravindranath, R. S. Pulwarty and S. Alibakhshi The Global Threat of Drying Lands: Regional and global aridity trends and future projections. A Report of the Science-Policy Interface. United Nations Convention to Combat Desertification (UNCCD). 2024: Bonn, Germany.
- Rundel, P.W., et al., Arid and Semi-Arid Ecosystems, in The Physical Geography of South America. 2007, Oxford University Press. p. 0.
- Li, C., et al., Carbon stock and its responses to climate change in C entral A sia. Global change biology, 2015. 21(5): p. 1951-1967.
- Zerga, B., Rangeland degradation and restoration: A global perspective. Point Journal of Agriculture and Biotechnology Research, 2015. 1(2): p. 37-54.
- Yıldız, O.; Eşen, D.; Sargıncı, M.; Çetin, B.; Toprak, B.; Dönmez, A.H. Restoration success in afforestation sites established at different times in arid lands of Central Anatolia. For. Ecol. Manag. 2022, 503. [Google Scholar] [CrossRef]
- Yildiz, O.; Esen, D.; Karaoz, O.M.; Sarginci, M.; Toprak, B.; Soysal, Y. Effects of different site preparation methods on soil carbon and nutrient removal from Eastern beech regeneration sites in Turkey's Black Sea region. Appl. Soil Ecol. 2010, 45, 49–55. [Google Scholar] [CrossRef]
- Odum, E.P. and G.W. Barrett, Fundamentals of ecology. 5 ed. 2005: Thomson-Brooks/Cole.
- Odum, E.P. and G.W. Barrett, Fundamentals of ecology. 1971: Thomson-Brooks/Cole.
- McAlpine, C., et al., Integrating plant-and animal-based perspectives for more effective restoration of biodiversity. Frontiers in Ecology and the Environment, 2016. 14(1): p. 37-45.
- Yıldız, O., D. Eşen, and M. Sargıncı, Orman yangınlarının besin elementleri ve ekosistem verimliliğine etkileri. Tabiat ve İnsan,(3-4), 2004: p. 56-63.
- O. Yıldız, D.E., M. Sarginci, and B. Toprak, Batı Karadeniz Bölgesi'nde orman açmalarının toprak karbonu ve makro-besin yoğunluğuna etkisi (Effects of forest clearings on soil carbon and macronutrient density in the Western Black Sea Region), in IX. Ulusal Ekoloji ve Çevre Kongresi (IX: National Ecology and Environment Congress). 2009: Nevşehir, Türkiye. p. 81.
- Rotenberg, E.; Yakir, D. Contribution of Semi-Arid Forests to the Climate System. Science 2010, 327, 451–454. [Google Scholar] [CrossRef] [PubMed]
- UNCCD, Report of the Conference of the Parties on its twelfth session. 12-23 October 2015: Ankara, Türkiye.
- Tolunay, D. and A. Çömez, Orman topraklarında karbon depolanması ve Türkiye’deki durum (Carbon sequestration in forest soils and the sitiuation in Türkiye), in Küresel İklim Değişimi ve Su Sorunlarının Çözümünde Ormanlar Sempozyumu (Forests in the Solution of Global Climate Change and Water Problems Symposium). 13-14 December 2007: İstanbul, Türkiye.
- Penuelas, J.; Sardans, J.; Filella, I.; Estiarte, M.; Llusià, J.; Ogaya, R.; Carnicer, J.; Bartrons, M.; Rivas-Ubach, A.; Grau, O.; et al. Impacts of Global Change on Mediterranean Forests and Their Services. Forests 2017, 8, 463. [Google Scholar] [CrossRef]
- Azzopardi, B., et al., Climate and environmental change in the Mediterranean basin–current situation and risks for the future. First Mediterranean assessment report. 2020.
- Gumus, B.; Oruc, S.; Yucel, I.; Yilmaz, M.T. Impacts of Climate Change on Extreme Climate Indices in Türkiye Driven by High-Resolution Downscaled CMIP6 Climate Models. Sustainability 2023, 15, 7202. [Google Scholar] [CrossRef]
- Weatherall, A., et al., Defining climate-smart forestry. Climate-Smart Forestry in Mountain Regions, 2022: p. 35-58.
- Diaz, J., et al., Climate and Environmental Change in the Mediterranean Basin-Current Situation and Risks for the Future. Climate and Environmental Change in the Mediterranean Basin–Current Situation and Risks for the Future. First Mediterranean Assessment Report, 2020.
- epel, N., Yokettiğimiz ormanlarımız kayboılan fonksiyonel değerler ve zamanımızn orman ölümleri [Forests we eradicated, functional values we lost and current forest diebacks]. 1995: TEMA Vakfı.
- Turkes, M., Vulnerability of Turkey to desertification with respect to precipitation and aridity conditions. Turkish Journal of Engineering and Environmental Science, 1999. 23(5): p. 363-80.
- Türkeş, M., BM Çölleşme İle Savaşım Sözleşmesi’nin İklim, İklim Değişikliği ve kuraklık açısından çözümlenmesi ve Türkiye’deki uygulamalar (Analysis of the UN Convention to Combat Desertification with respect to the Climate, Climate Change and Drought, and Applications in Turkey)’. Çölleşme İle Mücadele Sempozyumu Tebliğler Kitabı, 2010: p. 17-18.
- Vacek, Z.; Cukor, J.; Vacek, S.; Gallo, J.; Bažant, V.; Zeidler, A. Role of black pine (Pinus nigra J. F. Arnold) in European forests modified by climate change. Eur. J. For. Res. 2023, 142, 1239–1258. [Google Scholar] [CrossRef]
- Viñas, R.A., et al., Pinus pinea in Europe: distribution, habitat, usage and threats. European atlas of forest tree species, 2016: p. 204.
- GDF), R.o.T.M.o.A.a.F.G.D.o.F. Forestry Statistics 2023.zip. [Zip file] 2023 [cited 2025 03.06]; Available from: https://www.ogm.gov.tr/en/e-library/official-statistics.
- Saatçioğlu, F., Türkiye Silvikültüründe Yapraklı Ağaç Türleri Meselesi. Journal of the Faculty of Forestry, Istanbul University, 1969.
- Karaçam, ed. B.T. Orhan Sevgi, Taner Okan. 2022, Tuna Caddesi No: 5/8 Kızılay-Ankara: Türkiye Ormancılar Derneği (The Foresters’ Association of Turkey).
- Güner, D. and K. Özkan, Türkiye’deki karaçam ağaçlandırma alanlarında besin stoklarının belirlenmesi. Ormancılık Araştırma Dergisi, 2019. 6(2): p. 192-207.
- Bulut, S., Günlü, and S. Keles, Assessment of the interactions among net primary productivity, leaf area index and stand parameters in pure Anatolian black pine stands: A case study from Türkiye. Forest Systems, 2023. 32(1): p. e003-e003.
- Hong, S.; Yin, G.; Piao, S.; Dybzinski, R.; Cong, N.; Li, X.; Wang, K.; Peñuelas, J.; Zeng, H.; Chen, A. Divergent responses of soil organic carbon to afforestation. Nat. Sustain. 2020, 3, 694–700. [Google Scholar] [CrossRef]
- Korkanç, S.Y. Effects of afforestation on soil organic carbon and other soil properties. CATENA 2014, 123, 62–69. [Google Scholar] [CrossRef]
- Chen, L.-F.; He, Z.-B.; Zhu, X.; Du, J.; Yang, J.-J.; Li, J. Impacts of afforestation on plant diversity, soil properties, and soil organic carbon storage in a semi-arid grassland of northwestern China. CATENA 2016, 147, 300–307. [Google Scholar] [CrossRef]
- Liu, X.; Yang, T.; Wang, Q.; Huang, F.; Li, L. Dynamics of soil carbon and nitrogen stocks after afforestation in arid and semi-arid regions: A meta-analysis. Sci. Total. Environ. 2018, 618, 1658–1664. [Google Scholar] [CrossRef]
- Dong, X.; Tariq, A.; Graciano, C.; Zhang, Z.; Gao, Y.; Keyimu, M.; Cong, M.; Zhao, G.; Yan, J.; Wang, W.; et al. Afforestation-driven soil organic carbon stabilization in a hyper-arid desert: nonlinear dynamics and microbial drivers across a 22-year chronosequence. Environ. Res. 2025, 282, 121989. [Google Scholar] [CrossRef]
- Cao, J.; Wei, C.; Adamowski, J.F.; Zhou, J.; Liu, C.; Zhu, G.; Dong, X.; Zhang, X.; Zhao, H.; Feng, Q. Could arid and semi-arid abandoned lands prove ecologically or economically valuable if they afford greater soil organic carbon storage than afforested lands in China’s Loess Plateau? Land Use Policy 2020, 99. [Google Scholar] [CrossRef]
- Segura, C.; Jiménez, M.; Nieto, O.; Navarro, F.; Fernández-Ondoño, E. Changes in soil organic carbon over 20 years after afforestation in semiarid SE Spain. For. Ecol. Manag. 2016, 381, 268–278. [Google Scholar] [CrossRef]
- Jia, X.; Wang, X.; Hou, L.; Wei, X.; Zhang, Y.; Shao, M.; Zhao, X. Variable response of inorganic carbon and consistent increase of organic carbon as a consequence of afforestation in areas with semiarid soils. Land Degrad. Dev. 2019, 30, 1345–1356. [Google Scholar] [CrossRef]
- Li, X., et al., Recovery of soil carbon and nitrogen stocks following afforestation with xerophytic shrubs in the Tengger Desert, North China. Catena, 2022. 214: p. 106277.
- Gelfand, I.; Grünzweig, J.M.; Yakir, D. Slowing of nitrogen cycling and increasing nitrogen use efficiency following afforestation of semi-arid shrubland. Oecologia 2011, 168, 563–575. [Google Scholar] [CrossRef] [PubMed]
- Li, X.; Yang, H.; Shi, W.; Li, Y.; Guo, Q. Afforestation with xerophytic shrubs accelerates soil net nitrogen nitrification and mineralization in the Tengger Desert, Northern China. CATENA 2018, 169, 11–20. [Google Scholar] [CrossRef]
- General Directorate of Forestry, Ankara Forest Regional Directorate, Nallıhan Forest Enterprise Directorate Nallıhan Forest Enterprise Chiefship, Functional Forest Management Plan 2012-2031. 2012.
- General Directorate of Forestry, Ankara Forest Regional Directorate, Nallıhan Forest Enterprise Directorate Uluhan Forest Enterprise Chiefship, Functional Forest Management Plan 2012-2031. 2012.
- Dostbil, Y., Ağaçlandırma Çalışmalarının Uygulama Tekniği (Application technics of Plantation Activities), in Ağaçlandırma (Plantation), İ. Özkahraman, Editor. 1986, T.C. Tarım Orman ve Köyişleri Bakanlığı Orman Genel Müdürlüğü Ağaçlandırma ve Silvikültür Dairesi (Republic of Turkey Ministry of Agriculture, Forestry and Rural Affairs, General Directorate of Forestry, Department of Afforestation and Silviculture) Gelişim Press: Ankara. p. 25-40.
- Atalay, I. and R. Efe, Structural and distributional evaluation of forest ecosystems in Turkey. Journal of Environmental Biology, 2010. 31(1): p. 61.
- Atalay, I.; Efe, R.; Öztürk, M. Ecology and Classification of Forests in Turkey. Procedia - Soc. Behav. Sci. 2014, 120, 788–805. [Google Scholar] [CrossRef]
- Turkish Climate According to Thornthwaite. Ministry of Environment, Urbanisation and Climate Change, Turkish State Meteorological Service [Image of Turkish Climate According to Thornthwaite] [cited 2025 07.06.2025]; Available from: https://www.mgm.gov.tr/iklim/iklim-siniflandirmalari.aspx.
- Aksoy, N., Karakiriş Dağı (Seben-Nallıhan) florası (Flora of Karakiriş Mountain (Seben-Nallıhan)). Düzce Üniversitesi Ormancılık Dergisi, 2009. 5(2): p. 104-125.
- Kantarcı, M.D., Toprak İlmi (Soil Science). 2 ed. 2000, İstanbul, Türkiye: İstanbul Üniversitesi Orman Fakültesi Yayınları Yayın No: 4261.
- FAO. Soil Map of The World - Europe. [PDF] 1992 [cited 2025 22 June]; Food and Agriculture Organization of the United Nations]. Available from: https://www.fao.org/fileadmin/user_upload/soils/docs/Soil_map_FAOUNESCO/acrobat/Europe_V.pdf.
- USDA. Soil Taxonomy. A Basic System of Soil Classification for Making and Interpreting Soil Surveys. [PDF] 1999 [cited 2025 22 June]; United States Department of Agriculture Natural Resources Conservation Service]. Available from: https://www.nrcs.usda.gov/sites/default/files/2022-06/Soil%20Taxonomy.pdf.
- Isajev, V., B. Fady, H. and S.a.V. Andonovski, EUFORGEN Technical Guidelines for genetic conservation and use for European black pine (Pinus nigra). 2004: International Plant Genetic Resources Institute, Rome, Italy.
- Day, P.R., Particle fractionation and particle-size analysis. Methods of soil analysis: part 1 physical and mineralogical properties, including statistics of measurement and sampling, 1965. 9: p. 545-567.
- Sparks, D.L., et al., Methods of soil analysis, part 3: Chemical methods. 2020: John Wiley & Sons.
- Gee, G.W. and J.W. Bauder, Particle-size analysis. Methods of soil analysis: Part 1 Physical and mineralogical methods, 1986. 5: p. 383-411.
- Thomas, G.W., Soil pH and soil acidity. Methods of soil analysis: part 3 chemical methods, 1996. 5: p. 475-490.
- Rhoades, J., Salinity: Electrical conductivity and total dissolved solids. Methods of soil analysis: Part 3 Chemical methods, 1996. 5: p. 417-435.
- Loeppert, R.H. and D.L. Suarez, Carbonate and gypsum. Methods of soil analysis: Part 3 chemical methods, 1996. 5: p. 437-474.
- Hamid, Y., Determine CaCO3 in different soil horizons using the Scheibler's Calcimeter. 2007.
- Gorbov, S.N.; Minaeva, E.N.; Tagiverdiev, S.S.; Skripnikov, P.N.; Nosov, G.N.; Besuglova, O.S. Comparison of Different Carbonate Methods for Determining Calcic Chernozems. Biol. Bull. 2024, 51, S384–S394. [Google Scholar] [CrossRef]
- Sumner, M.E. and W.P. Miller, Cation exchange capacity and exchange coefficients. Methods of soil analysis: Part 3 Chemical methods, 1996. 5: p. 1201-1229.
- Nelson, D.W. and L.E. Sommers, Total carbon, organic carbon, and organic matter. Methods of soil analysis: Part 2 chemical and microbiological properties, 1982. 9: p. 539-579.
- Nelson, D.W. and L.E. Sommers, Total carbon, organic carbon, and organic matter. Methods of soil analysis: Part 3 Chemical methods, 1996. 5: p. 961-1010.
- Gentilesca, T.; Battipaglia, G.; Borghetti, M.; Colangelo, M.; Altieri, S.; Ferrara, A.M.S.; Lapolla, A.; Rita, A.; Ripullone, F. Evaluating growth and intrinsic water-use efficiency in hardwood and conifer mixed plantations. Trees 2021, 35, 1329–1340. [Google Scholar] [CrossRef]
- Kantarcı, M., et al., An assessment on the adaptation of 6 tree species to steppe habitat during Konya-Karapinar sand-dune afforestations. 2011.
- Yildiz, O.; Altundağ, E.; Çetin, B.; Güner, Ş.T.; Sarginci, M.; Toprak, B. Experimental arid land afforestation in Central Anatolia, Turkey. Environ. Monit. Assess. 2018, 190, 355. [Google Scholar] [CrossRef]
- Ayan, S., C. Yücedag, and B. Simovski, A major tool for afforestation of semi-arid and anthropogenic steppe areas in Turkey: Pinus nigra JF Arnold subsp. pallasiana (Lamb.) Holmboe. Journal of Forest Science, 2021. 67(10): p. 449-463.
- ALIŞKAN, S. and M. Boydak, Afforestation of arid and semiarid ecosystems in Turkey. Turkish Journal of Agriculture and Forestry, 2017. 41(5): p. 317-330.
- Kaya, Z. and A. Temerit, Genetic structure of marginally located Pinus nigra var pallasiana populations in central Turkey. Silvae Genetica, 1994. 43(5): p. 272-276.
- Yildiz, O.; Sarginci, M.; Eşen, D.; Cromack, K. Effects of vegetation control on nutrient removal and Fagus orientalis, Lipsky regeneration in the western Black Sea Region of Turkey. For. Ecol. Manag. 2007, 240, 186–194. [Google Scholar] [CrossRef]
- Hacisalihoglu, S. Semi-Arid Plantation by Anatolian Black Pine and Its Effects on Soil Erosion and Soil Properties. Turk. J. Agric. - Food Sci. Technol. 2018, 6, 500–507. [Google Scholar] [CrossRef]
- Batey, T., Soil compaction and soil management–a review. Soil use and management, 2009. 25(4): p. 335-345.
- Kara, O.; Babur, E.; Altun, L.; Seyis, M. Effects of afforestation on microbial biomass C and respiration in eroded soils of Turkey. J. Sustain. For. 2016, 35, 385–396. [Google Scholar] [CrossRef]
- Cai, L.; Chen, X.; Huang, R.; Smettem, K. Runoff change induced by vegetation recovery and climate change over carbonate and non-carbonate areas in the karst region of South-west China. J. Hydrol. 2022, 604. [Google Scholar] [CrossRef]
- Choudhary, O. and V.K. Kharche, Soil salinity and sodicity. Soil science: an introduction, 2018. 12: p. 353-384.
- Sumner, M.E. Sodic soils—New perspectives. Soil Res. 1993, 31, 683–750. [Google Scholar] [CrossRef]
- Singh, K.; Pandey, V.C.; Singh, B.; Singh, R. Ecological restoration of degraded sodic lands through afforestation and cropping. Ecol. Eng. 2012, 43, 70–80. [Google Scholar] [CrossRef]
- Li, D.; Niu, S.; Luo, Y. Global patterns of the dynamics of soil carbon and nitrogen stocks following afforestation: a meta-analysis. New Phytol. 2012, 195, 172–181. [Google Scholar] [CrossRef]
- Dhiedt, E.; Verheyen, K.; De Smedt, P.; Ponette, Q.; Baeten, L. Early Tree Diversity and Composition Effects on Topsoil Chemistry in Young Forest Plantations Depend on Site Context. Ecosystems 2021, 24, 1638–1653. [Google Scholar] [CrossRef]
- Shen, Y.; Yu, Y.; Lucas-Borja, M.E.; Chen, F.; Chen, Q.; Tang, Y. Change of soil K, N and P following forest restoration in rock outcrop rich karst area. CATENA 2020, 186. [Google Scholar] [CrossRef]
- Huebner, L.; Al-Quraishi, A.M.F.; Branch, O.; Gaznayee, H.A.A. New approaches: Use of assisted natural succession in revegetation of inhabited arid drylands as alternative to large-scale afforestation. SN Appl. Sci. 2022, 4, 1–10. [Google Scholar] [CrossRef]
- Hamberg, J.; Robinson, D.T.; Trant, A.J.; Richardson, P.J.; Murphy, S.D. Direct topsoil transfer to already planted reforestation sites increases native plant understory and not ruderals. Restor. Ecol. 2024, 32. [Google Scholar] [CrossRef]
- Stavi, I. Seeking Environmental Sustainability in Dryland Forestry. Forests 2019, 10, 737. [Google Scholar] [CrossRef]
- Swanson, M.E.; Franklin, J.F.; Beschta, R.L.; Crisafulli, C.M.; DellaSala, D.A.; Hutto, R.L.; Lindenmayer, D.B.; Swanson, F.J. The forgotten stage of forest succession: early-successional ecosystems on forest sites. Front. Ecol. Environ. 2011, 9, 117–125. [Google Scholar] [CrossRef]
- Prach, K.; Tichý, L.; Lencová, K.; Adámek, M.; Koutecký, T.; Sádlo, J.; Bartošová, A.; Novák, J.; Kovář, P.; Jírová, A.; et al. Does succession run towards potential natural vegetation? An analysis across seres. J. Veg. Sci. 2016, 27, 515–523. [Google Scholar] [CrossRef]
- West, D.C., H.H. Shugart, and D. Botkin, Forest succession: concepts and application. 2012: Springer Science & Business Media.
- Steele, R., The role of succession in forest health, in Assessing forest ecosystem health in the inland west. 2018, Routledge. p. 183-190.
- Bonser, S.P.; Ladd, B. The evolution of competitive strategies in annual plants. Plant Ecol. 2011, 212, 1441–1449. [Google Scholar] [CrossRef]
- Wallace, H.L.; Good, J. Effects of afforestation on upland plant communities and implications for vegetation management. For. Ecol. Manag. 1995, 79, 29–46. [Google Scholar] [CrossRef]
- M Fadhil Al-Quraishi, A., New approaches: Use of assisted natural succession in revegetation of inhabited arid drylands as alternative to large-scale aforestation. SN Applied Sciences, 2022.
- Moro, M.J.; Domingo, F.; Escarré, A. Organic Matter and Nitrogen Cycles in a Pine Afforested Catchment with a Shrub Layer ofAdenocarpus decorticansandCistus laurifoliusin South-eastern Spain. Ann. Bot. 1996, 78, 675–685. [Google Scholar] [CrossRef]
Figure 1.
Distribution map of black pine [51] and study area in Türkiye.
Figure 1.
Distribution map of black pine [51] and study area in Türkiye.
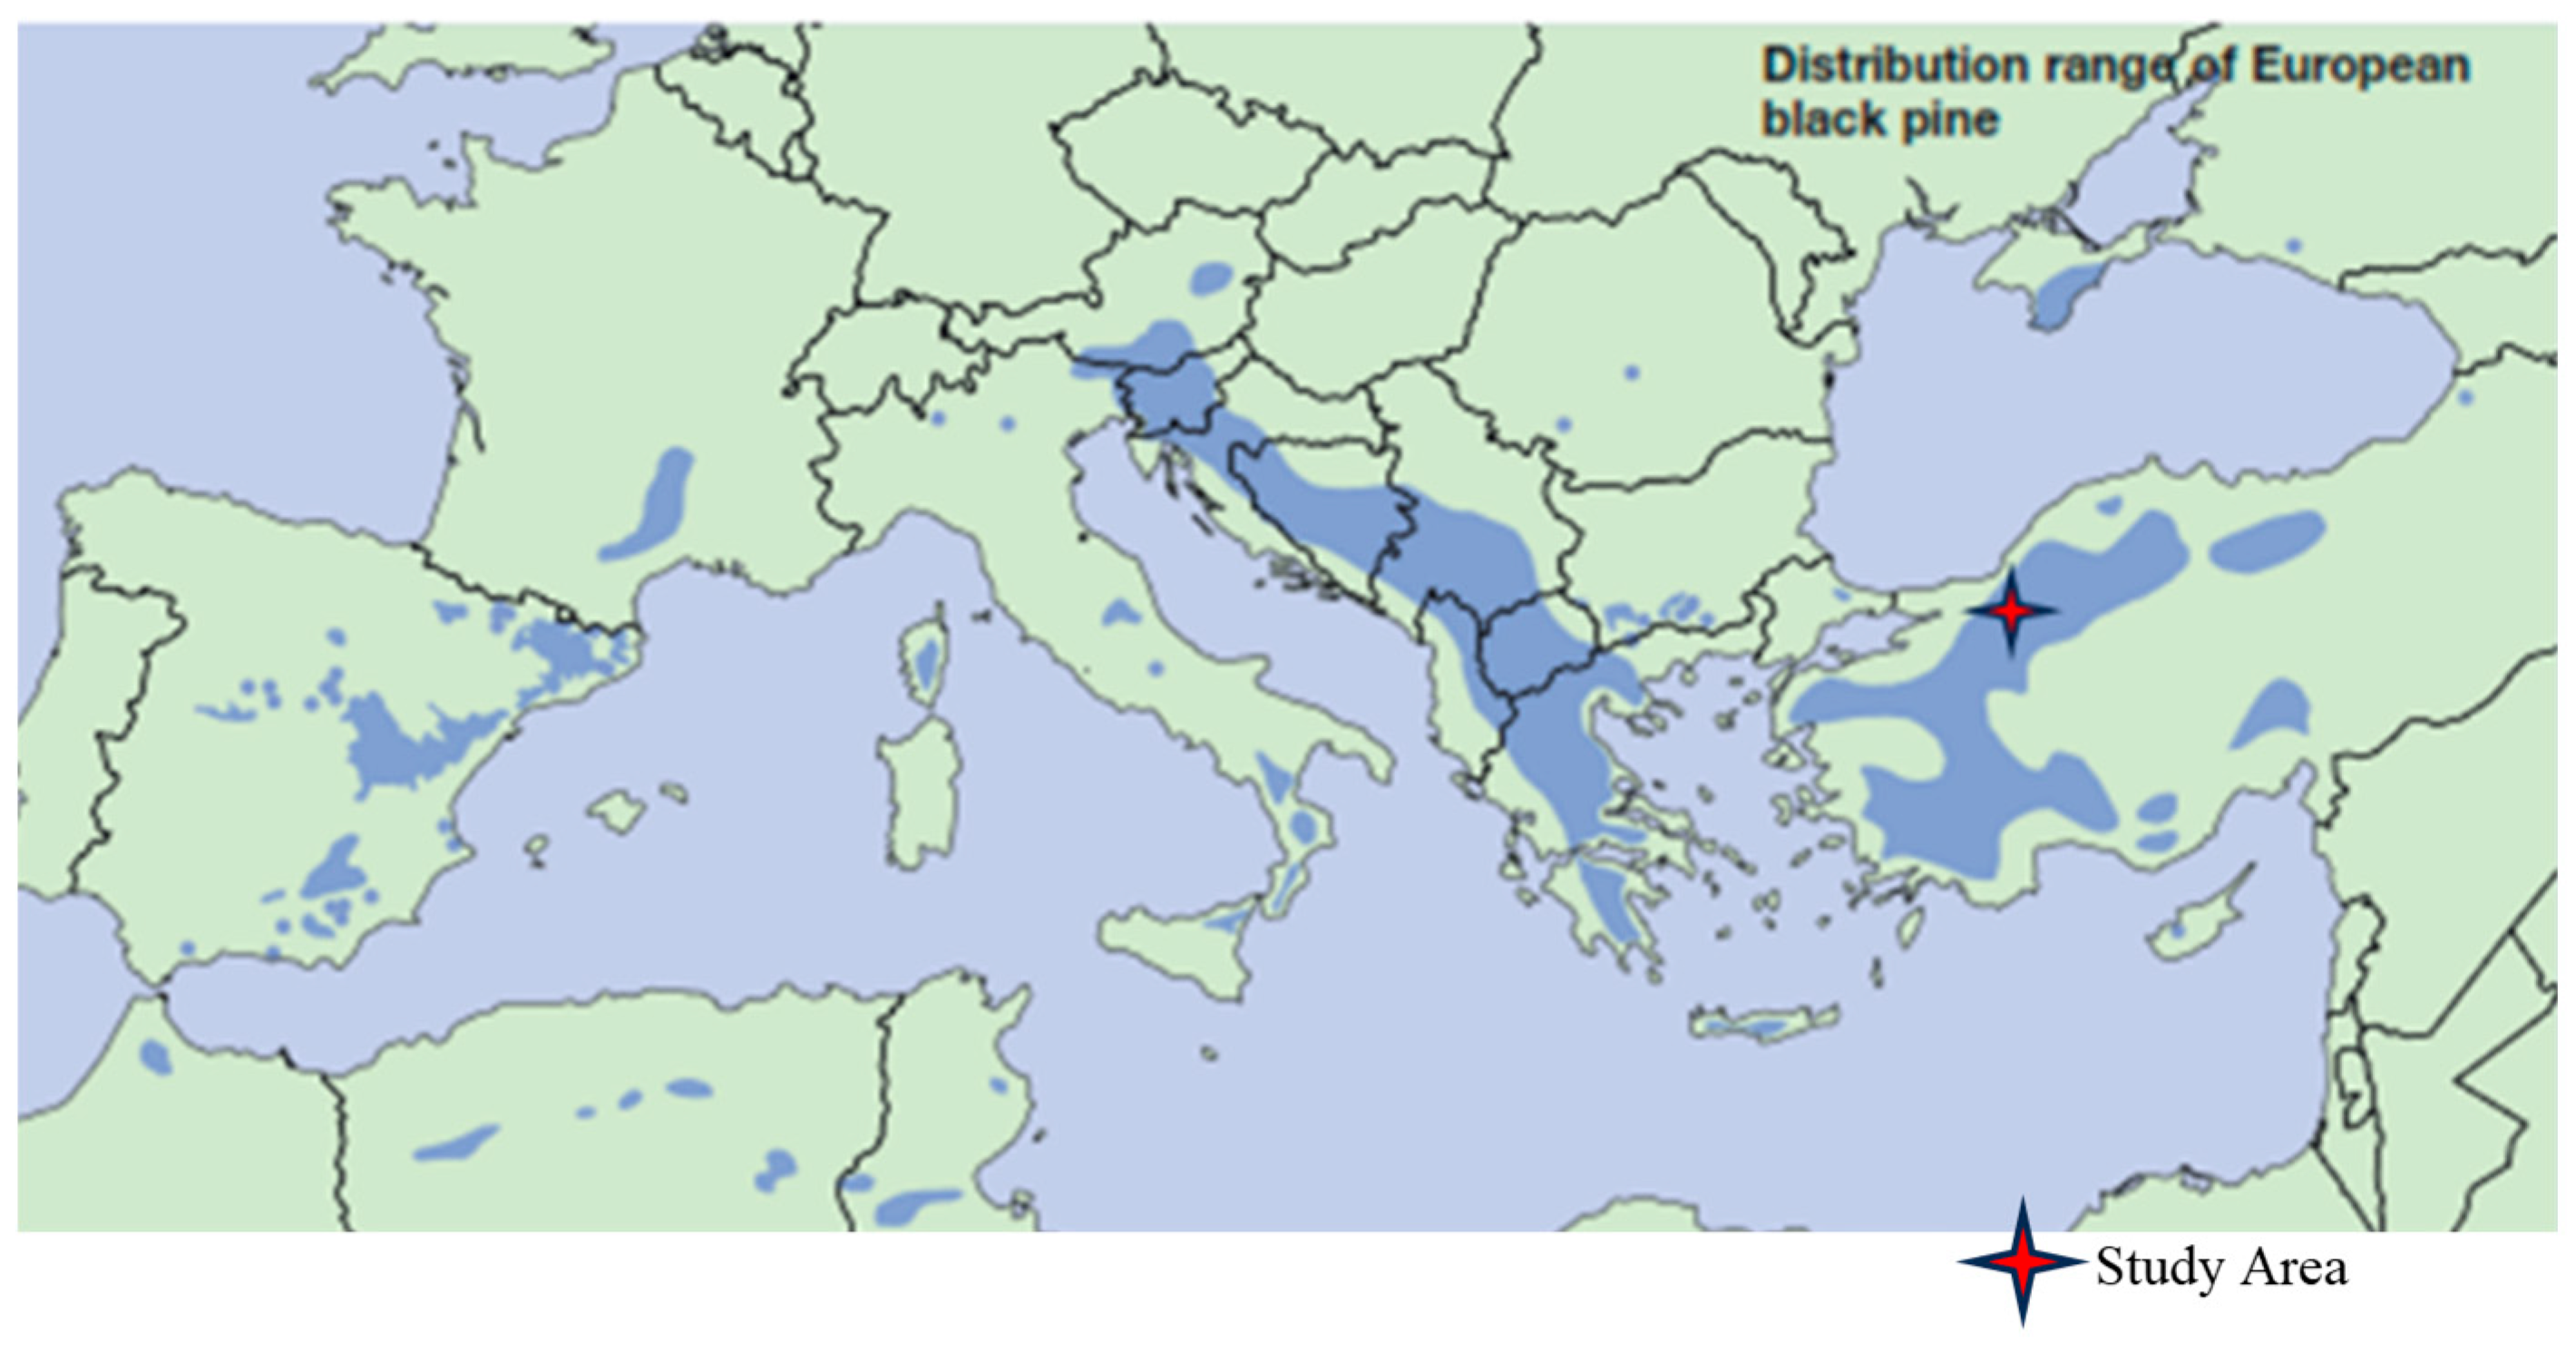
Figure 2.
Sampling design.
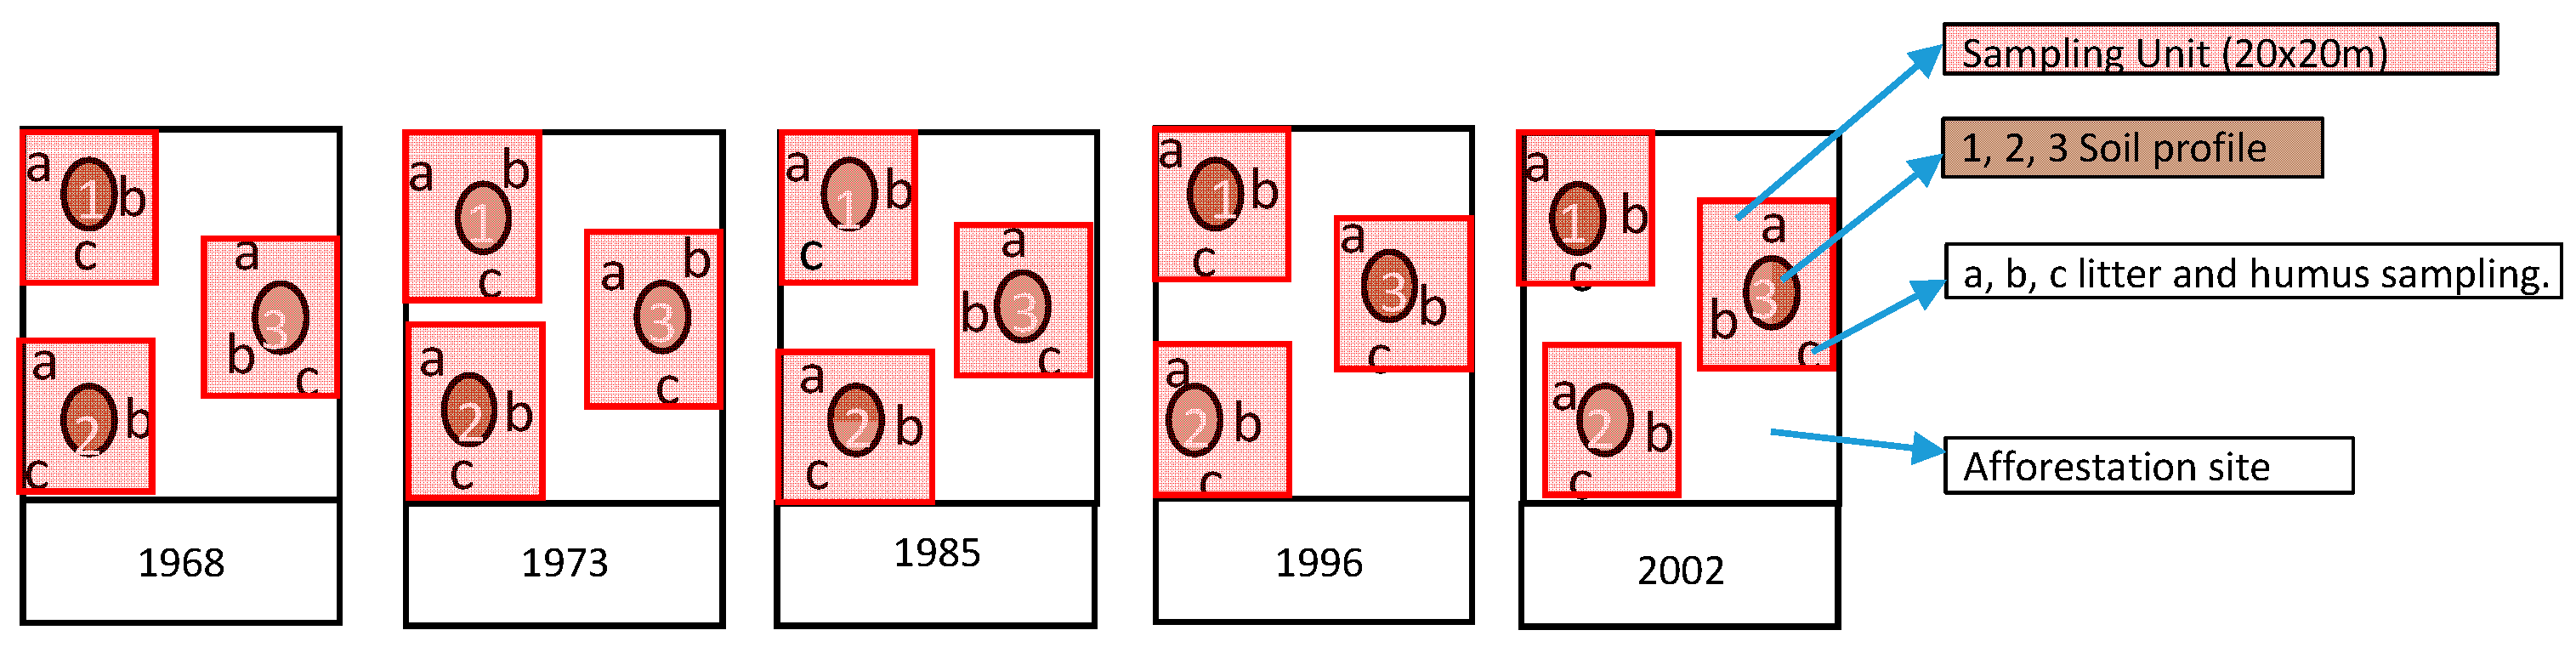
Figure 3.
Soil Organic Carbon (a), Soil Inorganic Carbon (b), and Total Soil Carbon (c) amounts in a hectare of afforestation sites established in various years and adjacent nonplanted soil-tilled sites. Note: Values are the mean ± standard error. Within the different treatments in the same year for the same depth level, means with a common lowercase letter are not significantly different at p = 0.05. Within the same treatment for different years for the same depth level, means with a common uppercase letter are not significantly different at p = 0.05. “Affor” is Afforestation, and “Tilled” is nonplanted soil-tilled sites. Dept levels are the soil depths where 1: 0-10 cm, 2: 10-20 cm, 3: 20-30 cm, 4: 30-40 cm, 5: 40-50cm.
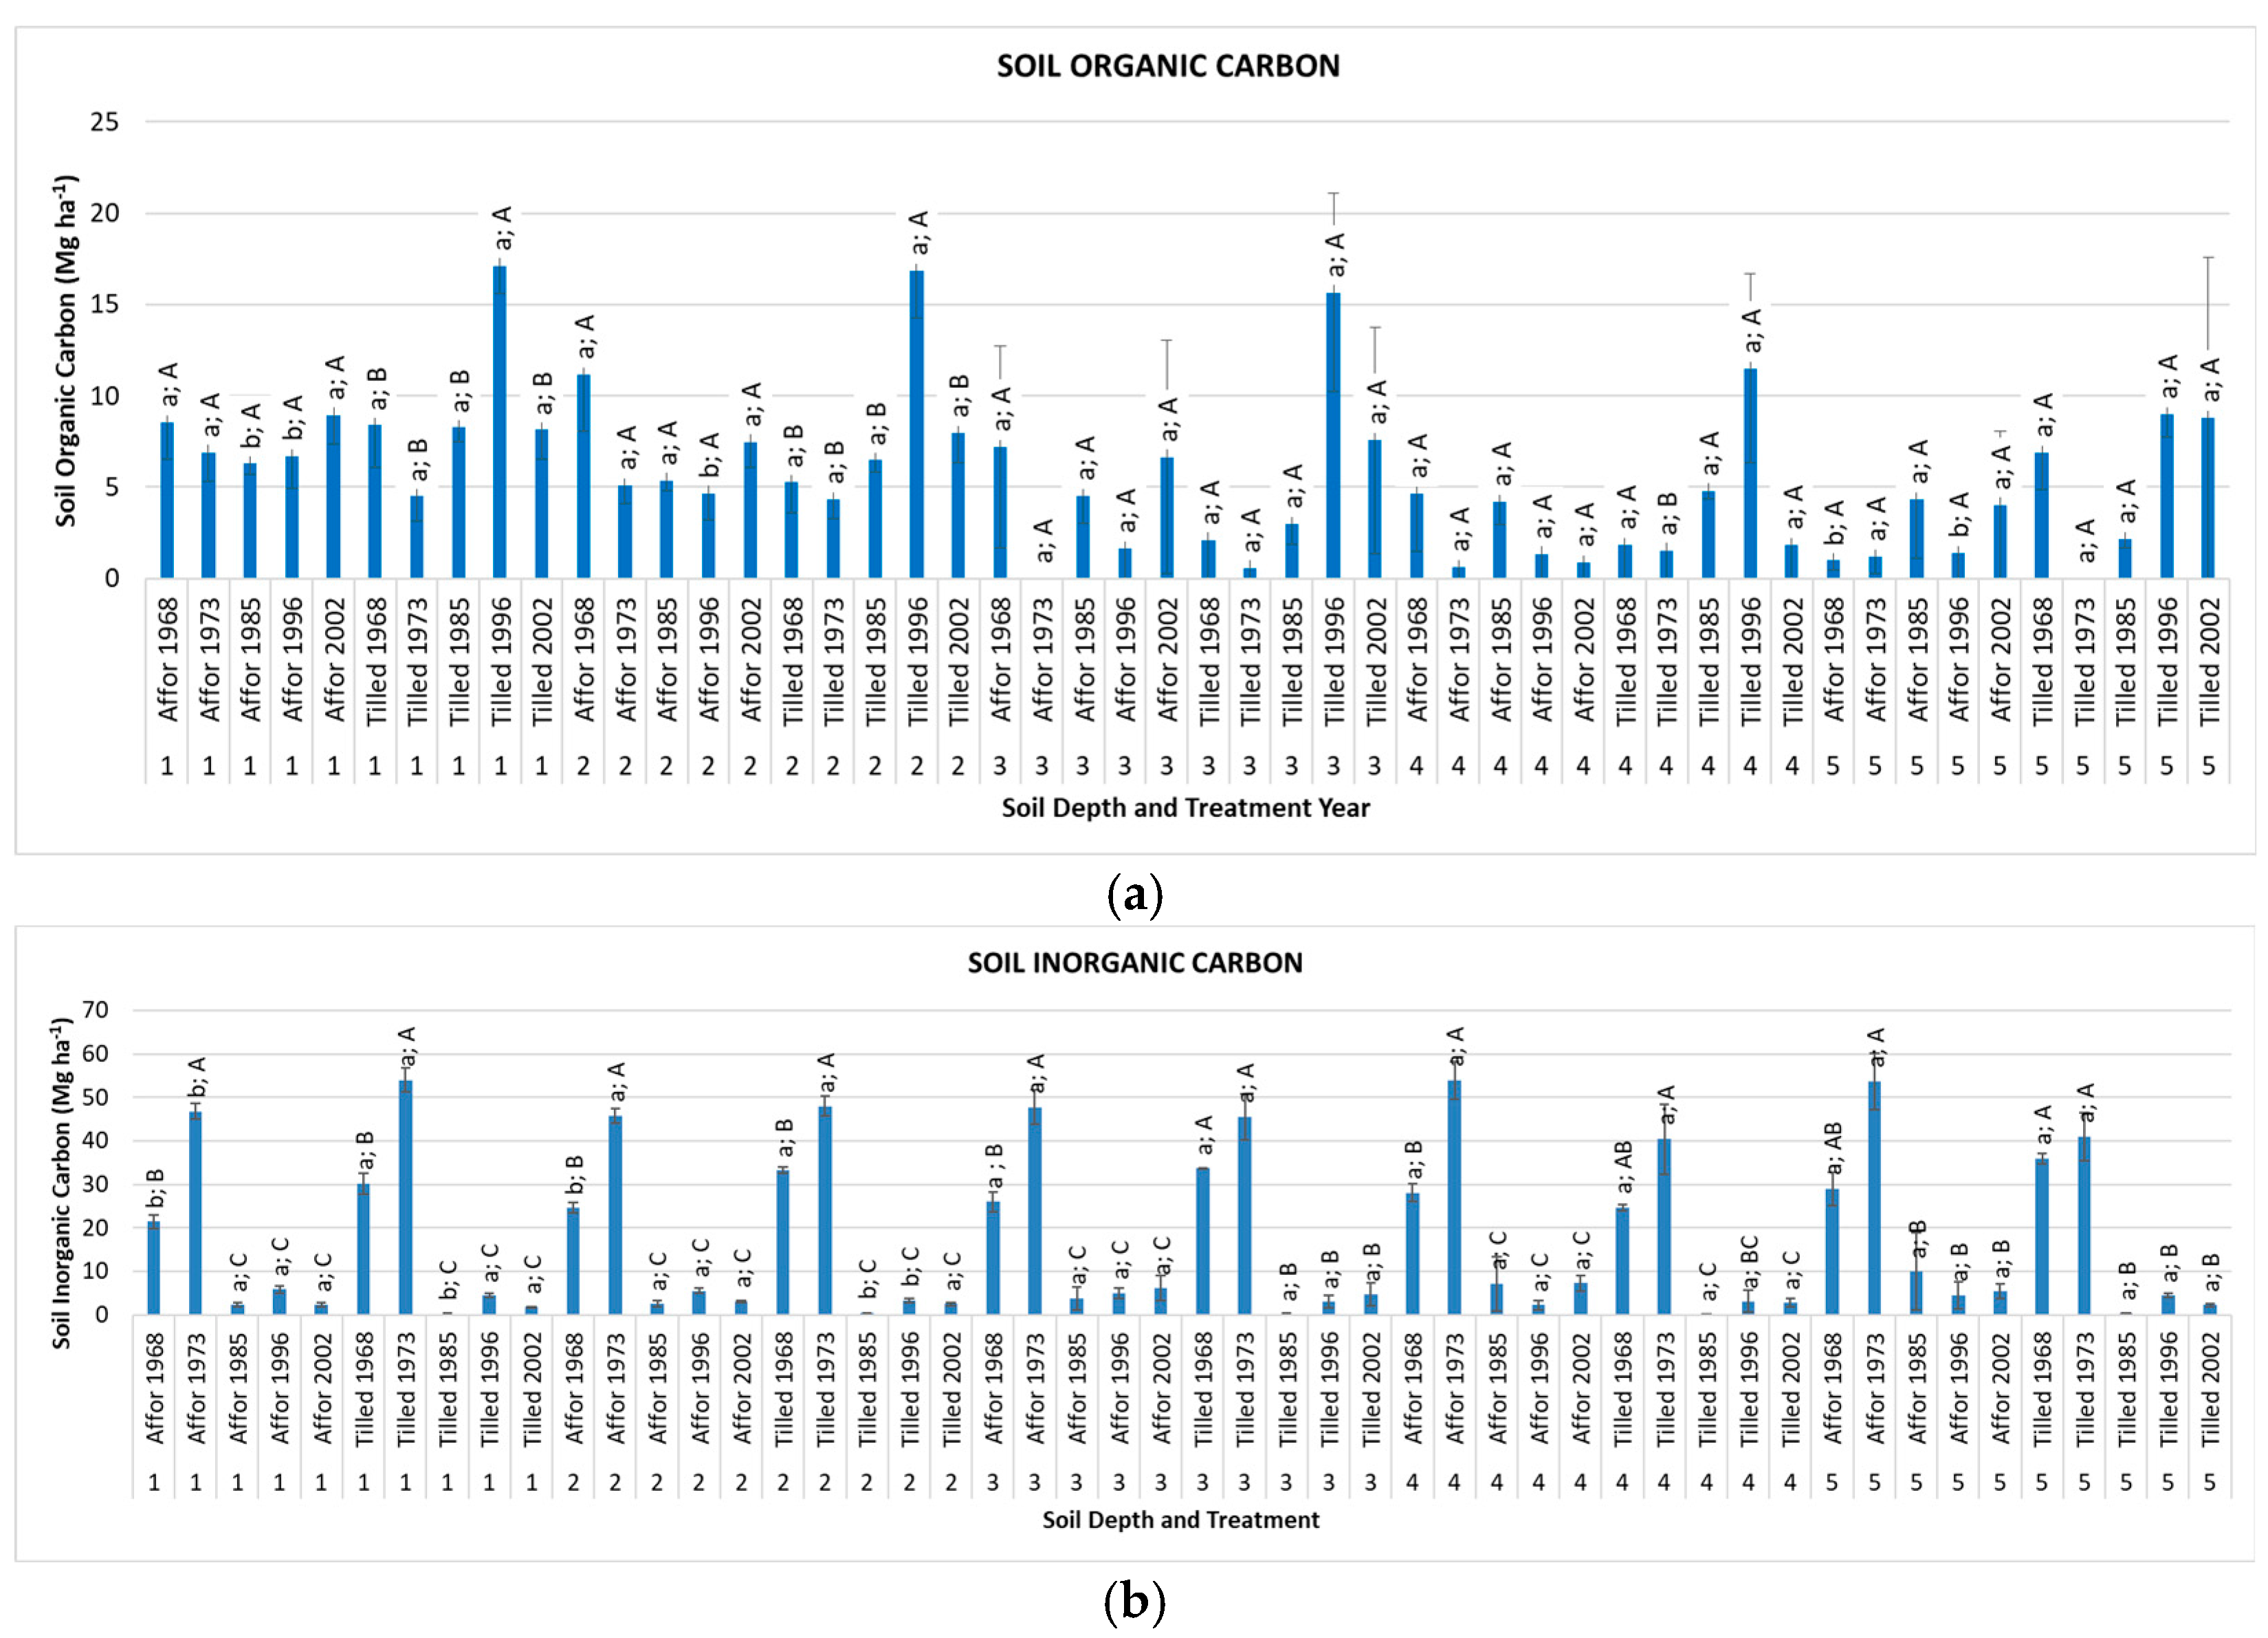
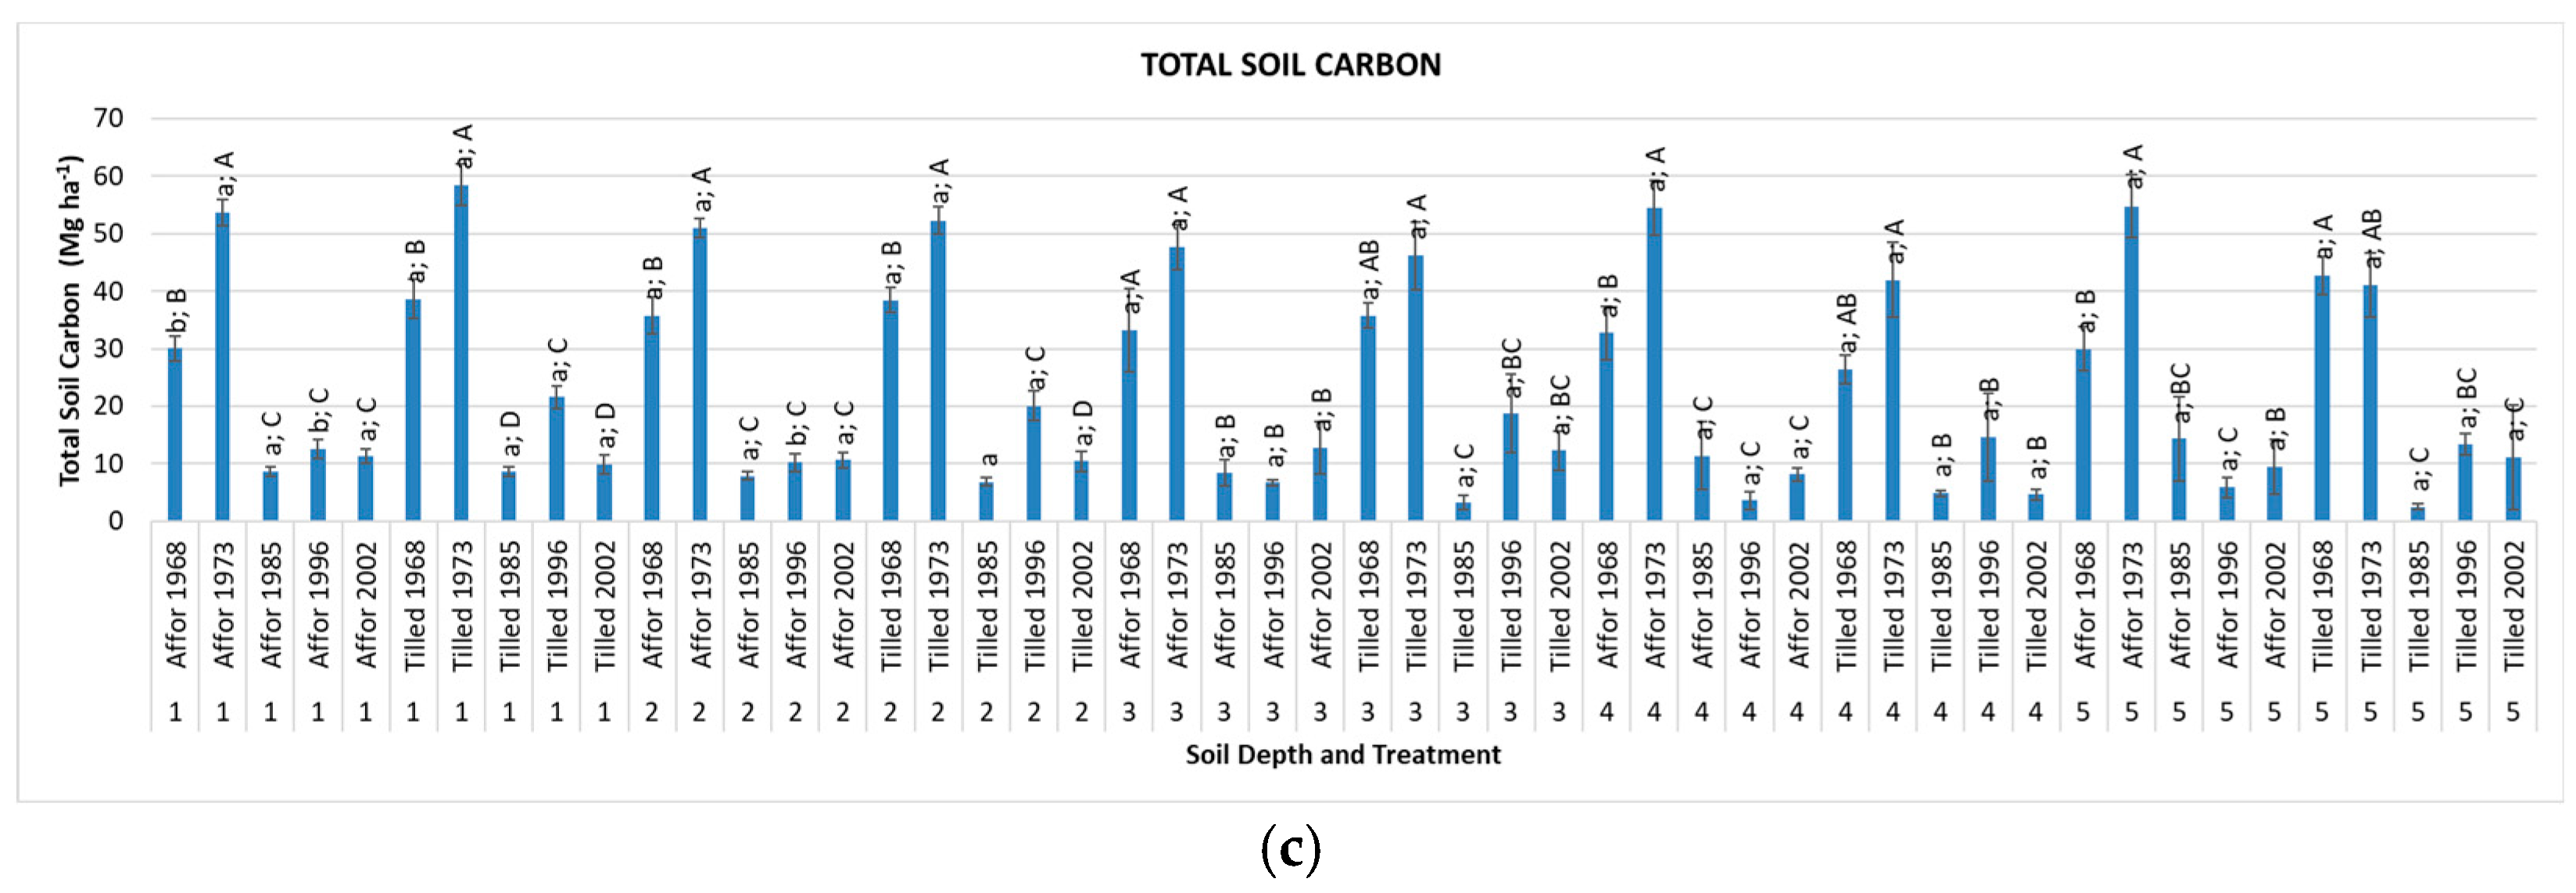
Figure 4.
Soil Nitrogen (N) amounts in a hectare of afforestation sites established in various years and adjacent nonplanted soil-tilled sites. Note: Values are the mean ± standard error. Within the different treatments in the same year for the same depth level, means with a common lowercase letter are not significantly different at p = 0.05. Within the same treatment for different years for the same depth level, means with a common uppercase letter are not significantly different at p = 0.05. “Affor” is Afforestation, and “Tilled” is nonplanted soil-tilled sites. Dept levels are the soil depths where 1: 0-10 cm, 2: 10-20 cm, 3: 20-30 cm, 4: 30-40 cm, 5: 40-50cm. .
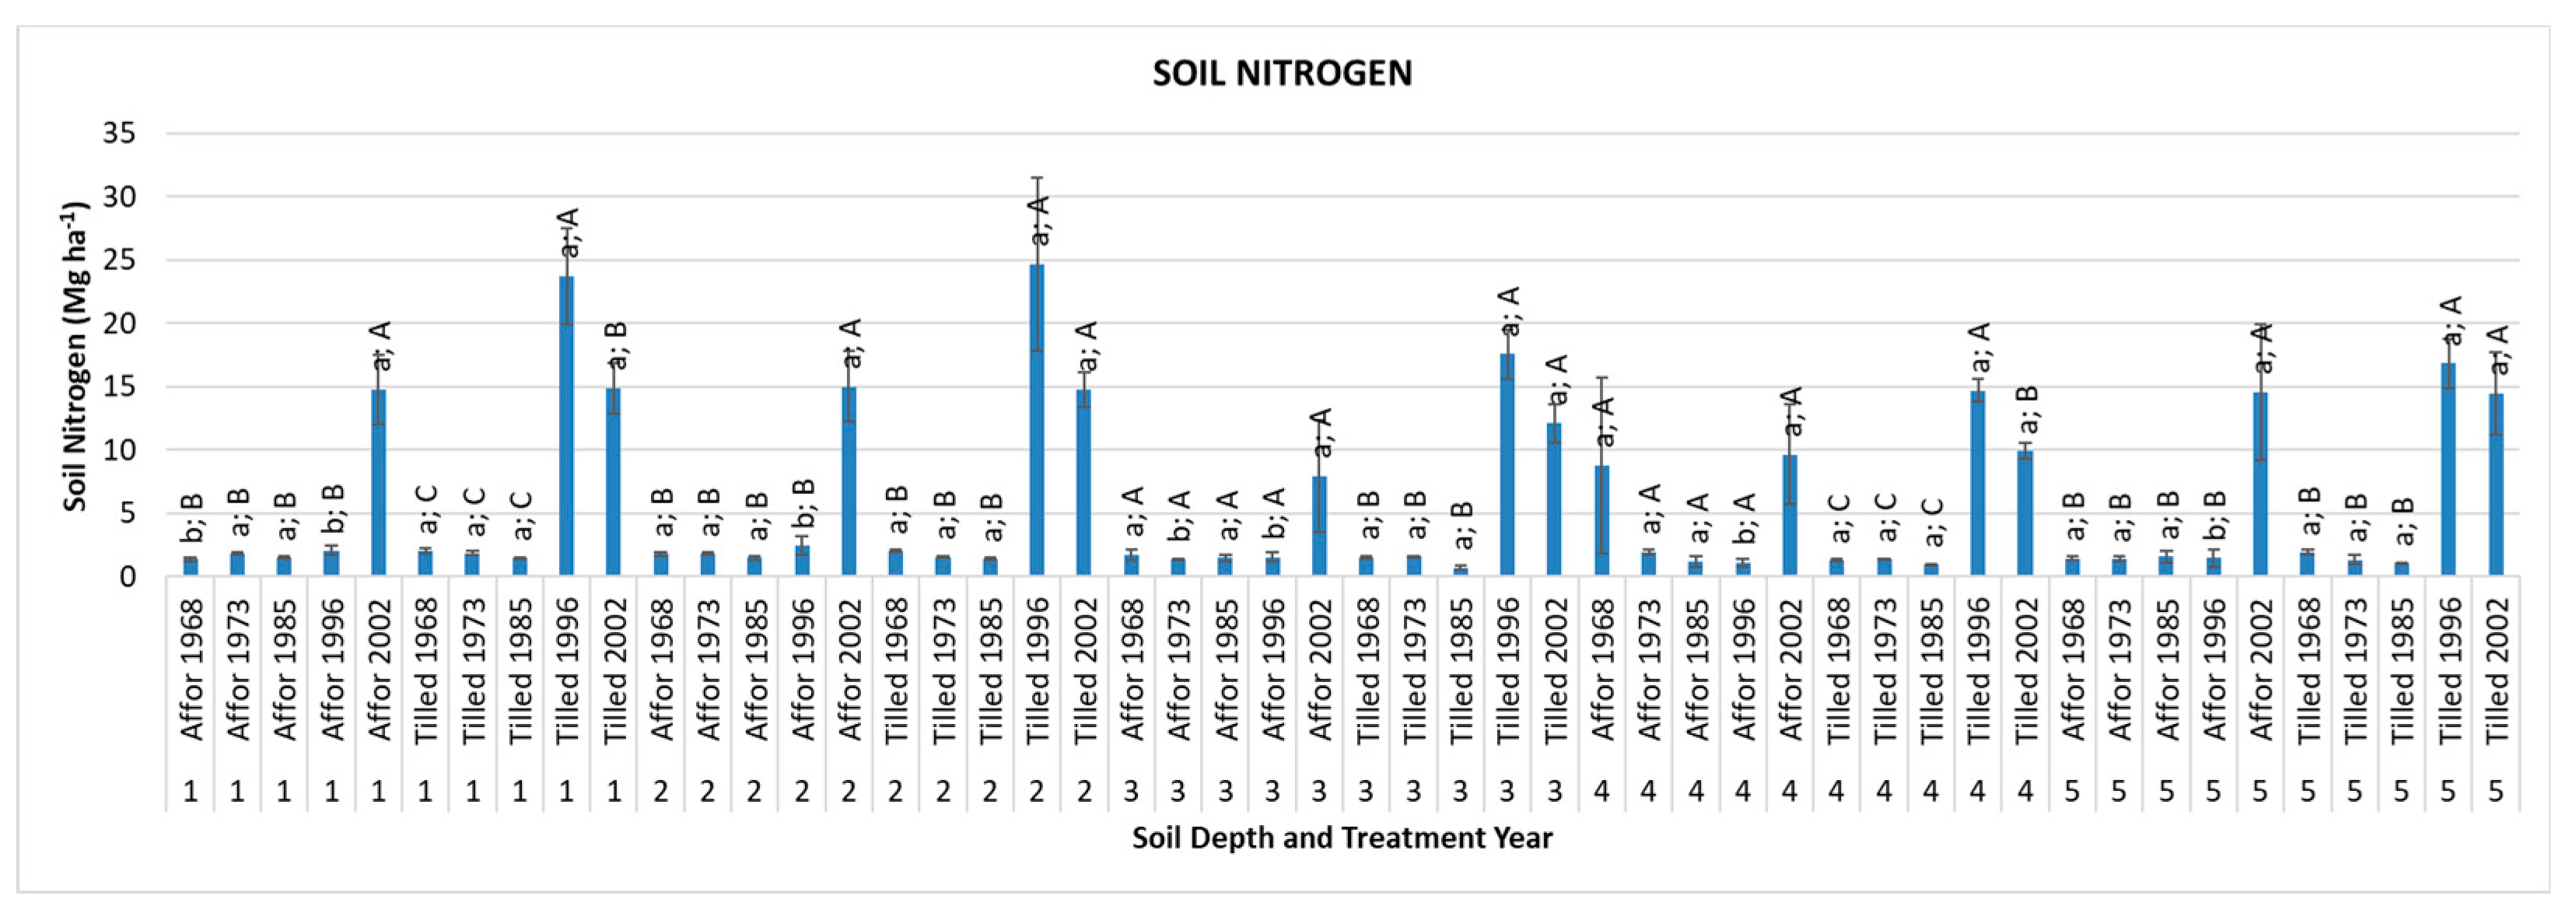
Figure 5.
Soil Organic Carbon (SOC), Soil Inorganic Carbon (SIOC), Soil Total Carbon (STC) (a), and Soil Nitrogen (N) (b) amount in a hectare at 50 cm soil depth of afforestation sites established in various years and adjacent nonplanted soil-tilled sites. Note: Values are the mean ± standard error. Within the different treatments in the same year, means with a common uppercase letter are not significantly different at p = 0.05. Within the same treatment for different years, means with a common lowercase letter are not significantly different at p = 0.05. “A” is Afforestation sites, and “T” is nonplanted soil-tilled sites.
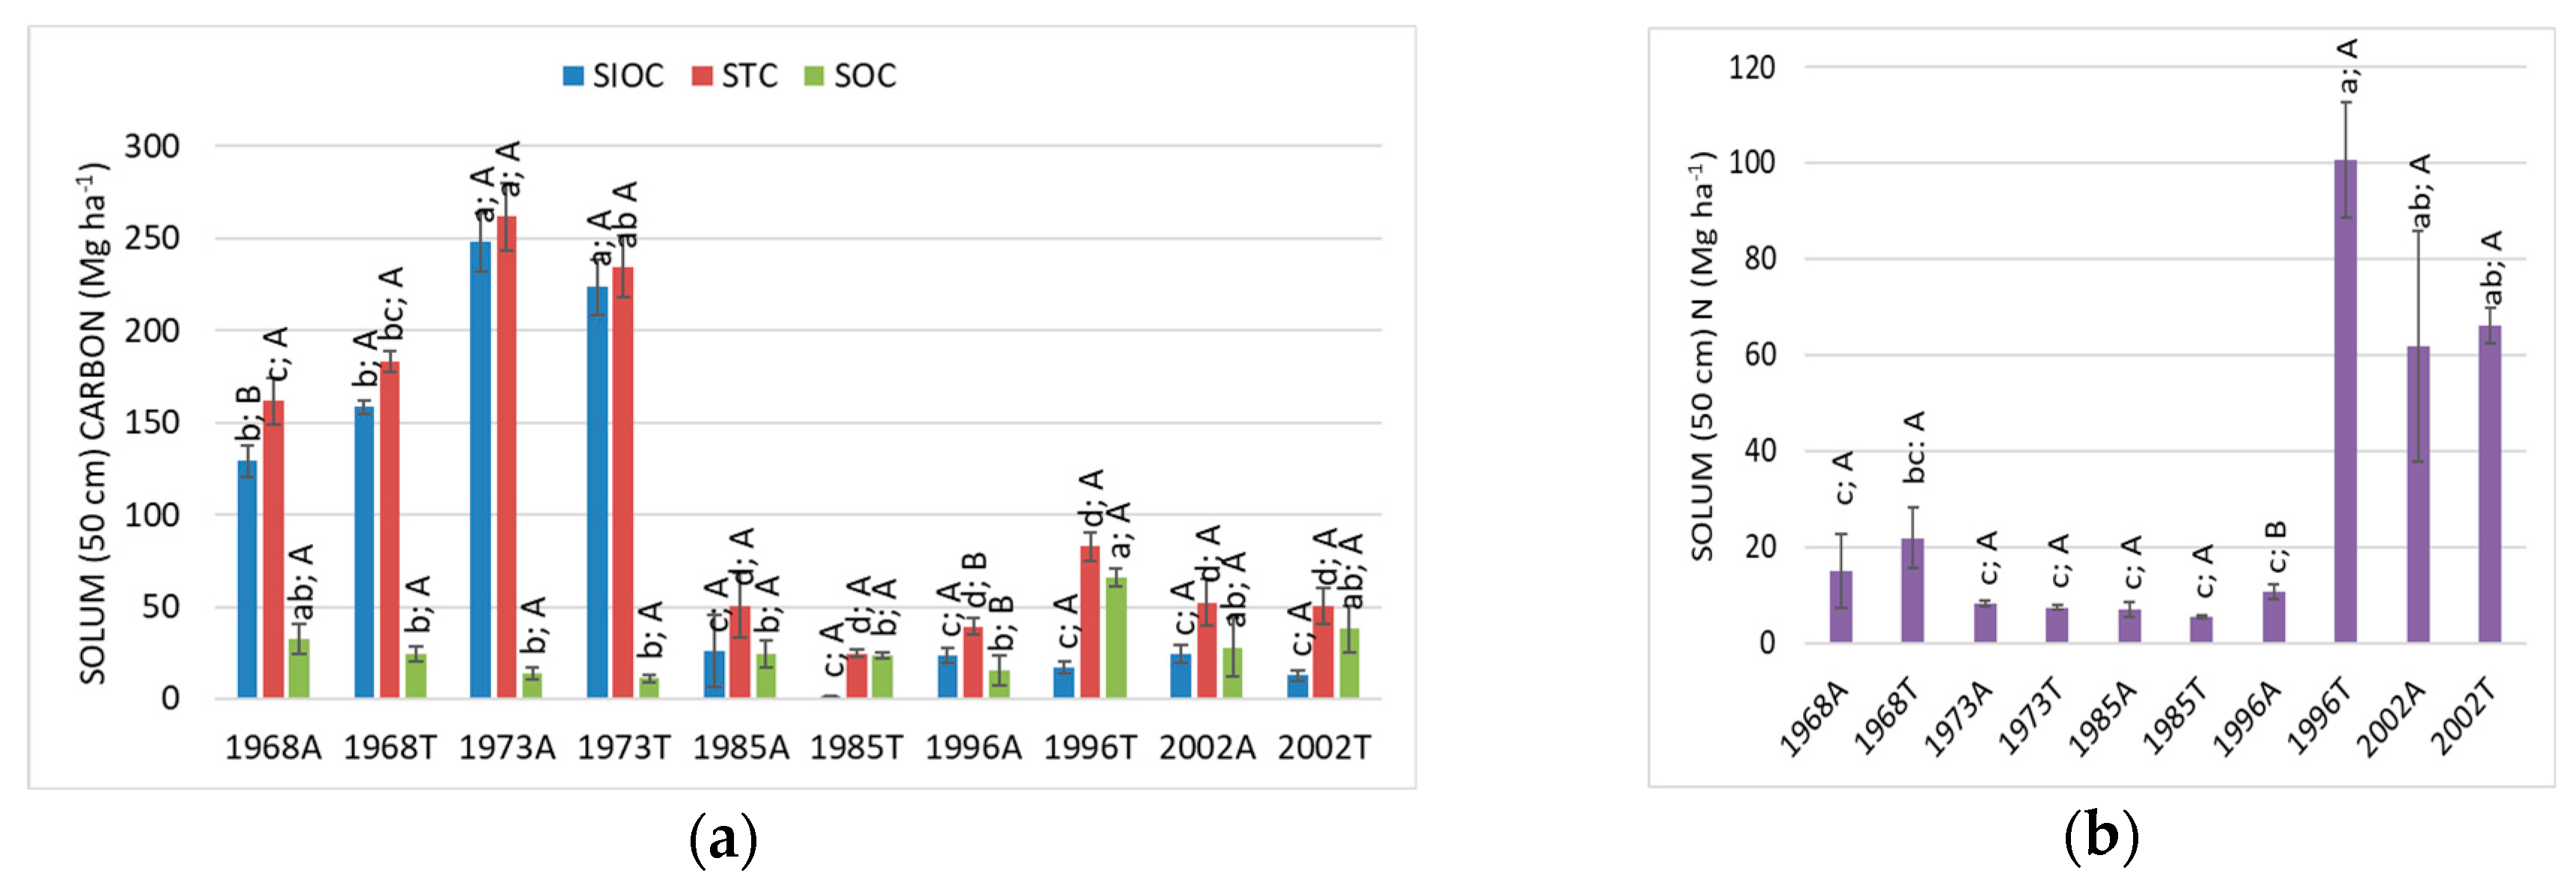
Figure 6.
Carbon (a) and Nitrogen (b) concentrations of needles in afforestation sites established in various years. Note: Values are the mean ± standard error. Within the same treatments for different years, means with a common lowercase letter are not significantly different at p = 0.05. “Affor” is Afforestation sites.
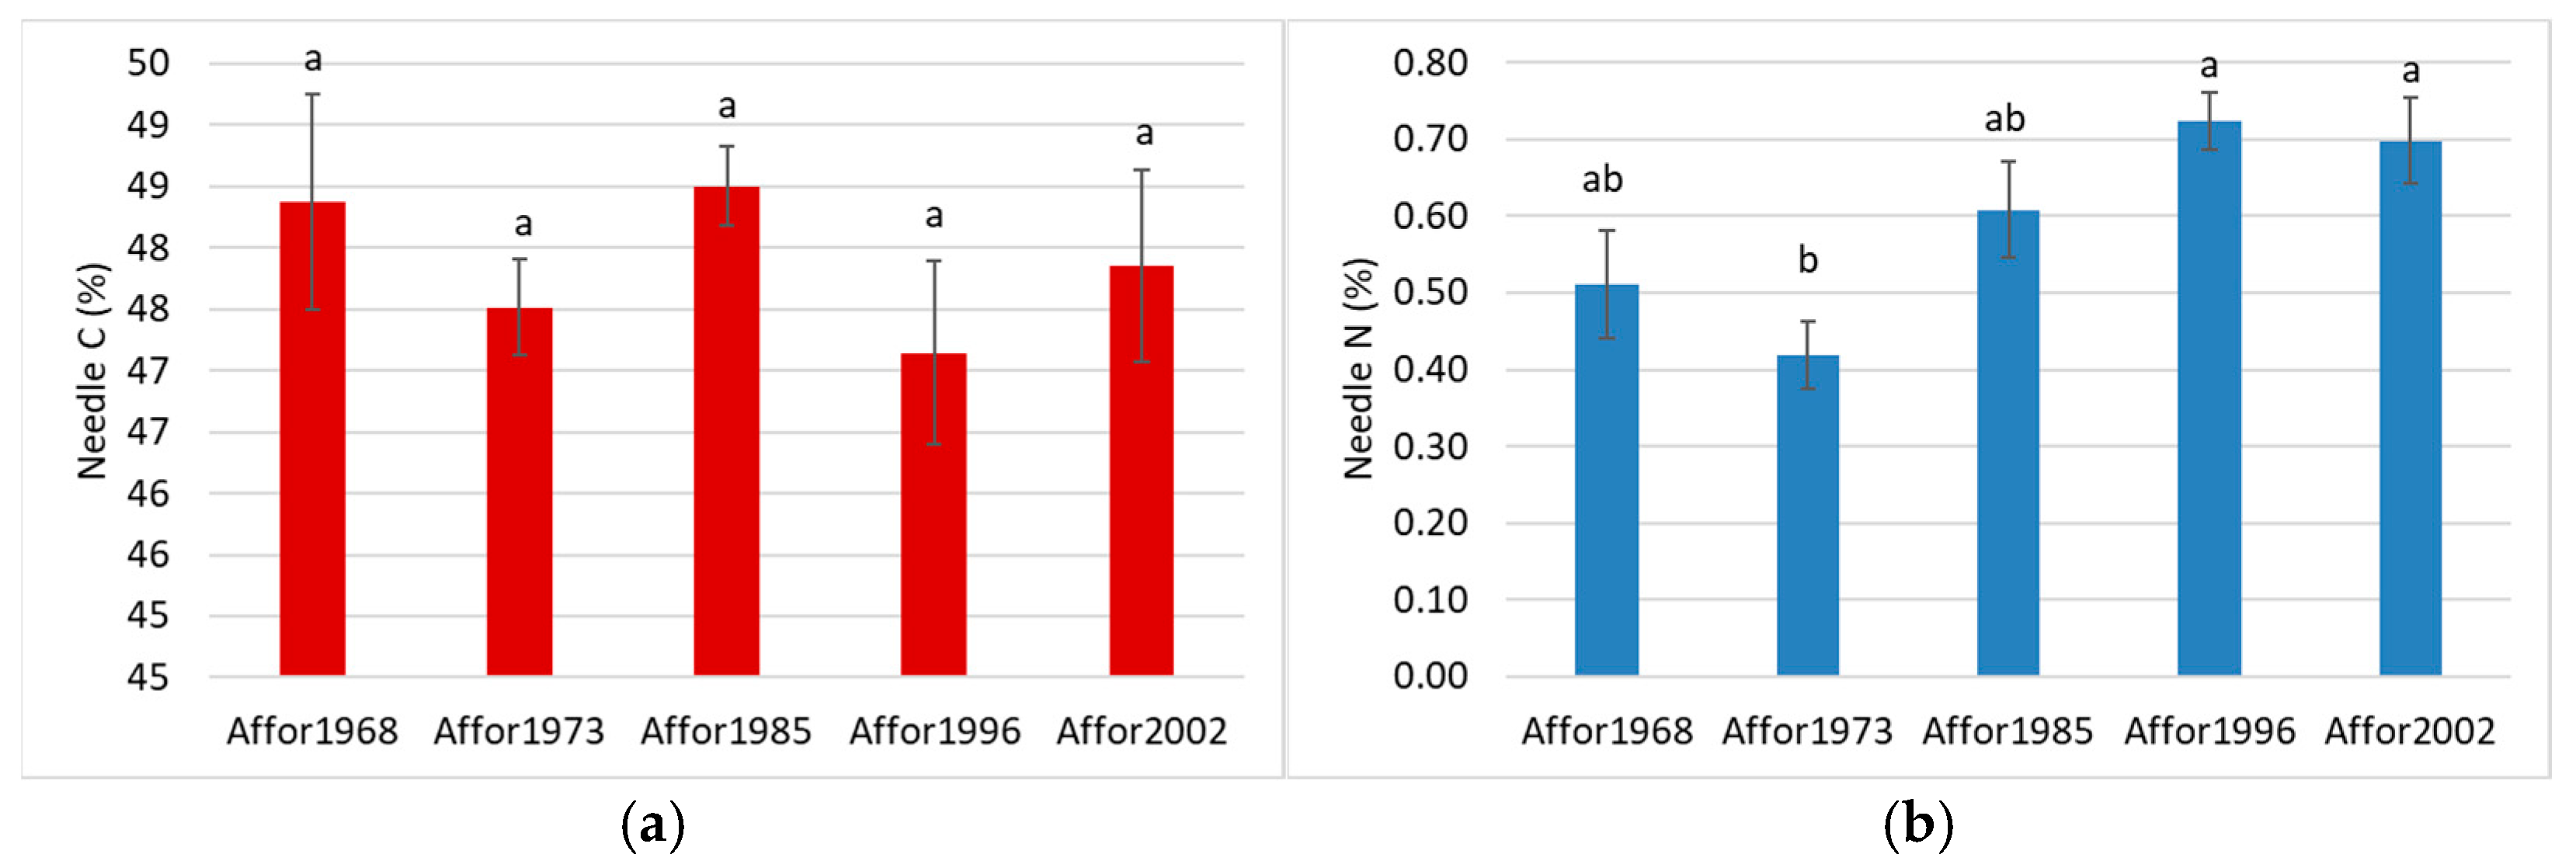
Figure 7.
The Carbon (Mg ha-1) and Nitrogen (kg ha-1) amounts of litter (a, b) and humus (c, d) in afforestation sites established in various years. Note: Values are the mean ± standard error. Within the same treatments for different years, means with a common lowercase letter are not significantly different at p = 0.05. “Affor” is Afforestation sites.
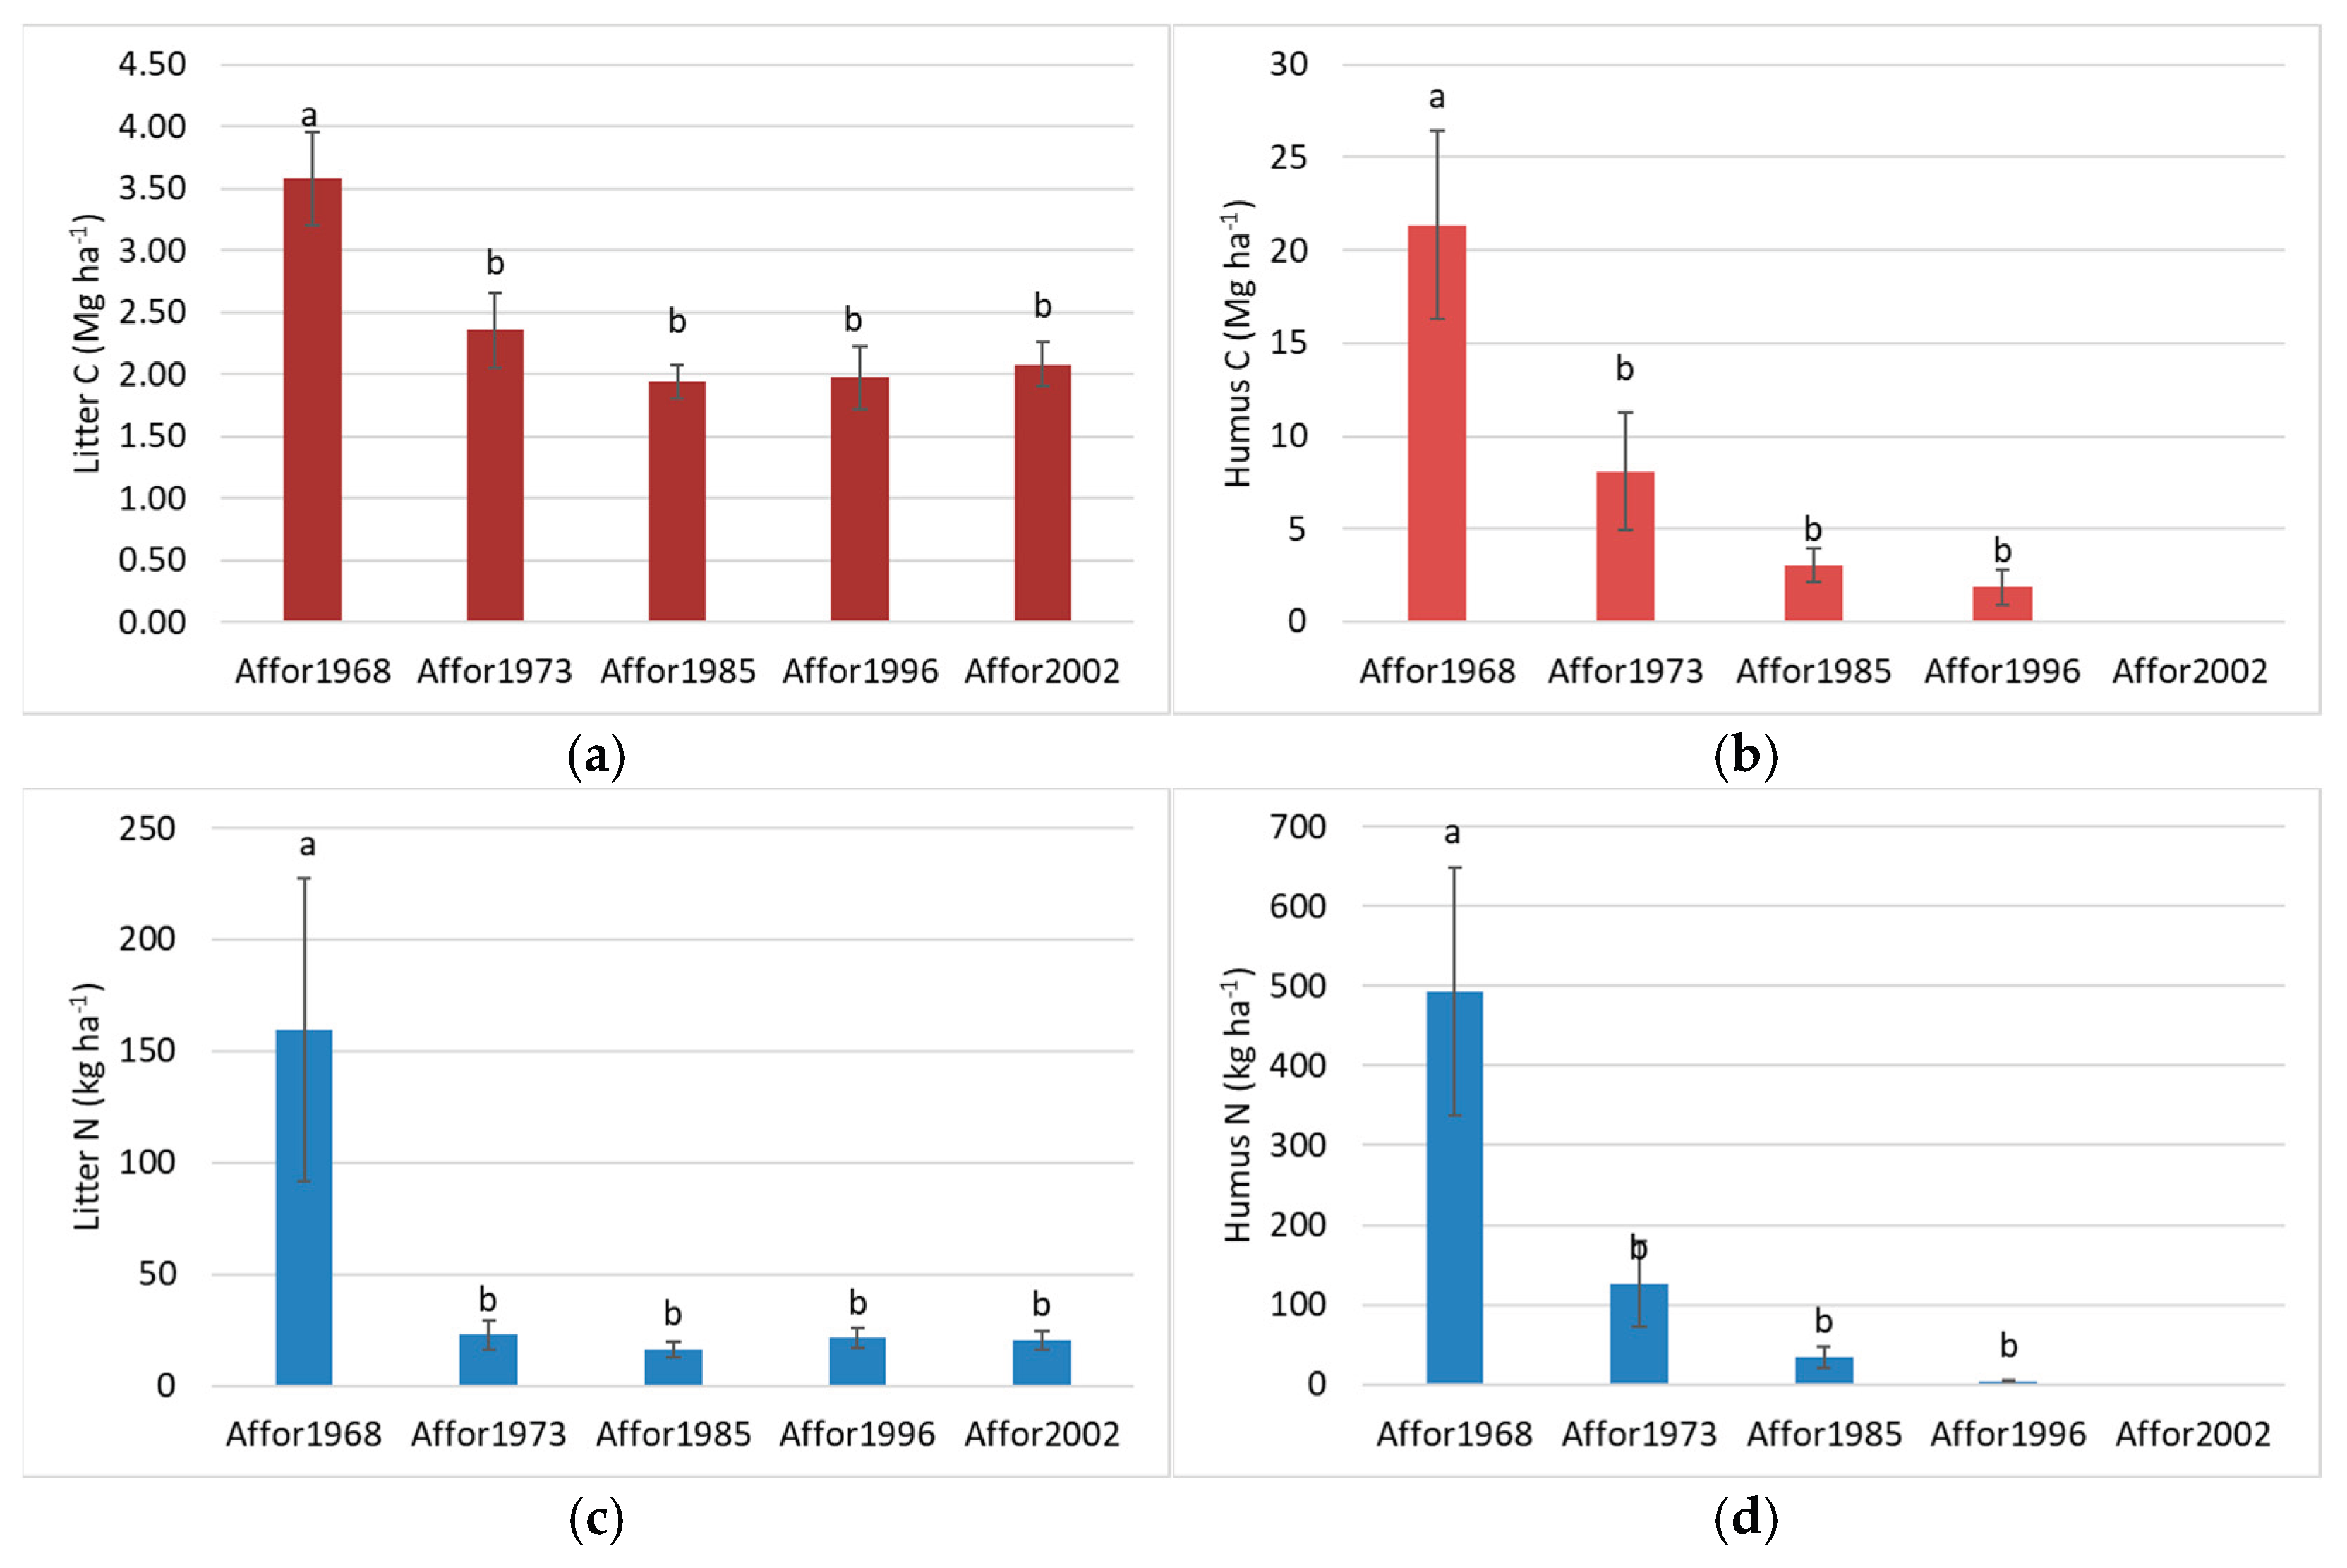

Table 1.
Afforestation sites.
| Afforestation Year | Stand Age (~) | Solum (cm) | Coordinates (UTM) | Elevation (m) |
| 1968 | 47 | 100 | 343763 4461477 | 926 |
| 47 | 100 | 343745 4461549 | 950 | |
| 47 | 100 | 343771 4461653 | 944 | |
| 1973 | 42 | 100 | 379463 4454728 | 1086 |
| 42 | 100 | 379499 4454664 | 1077 | |
| 42 | 100 | 379496 4454622 | 1074 | |
| 1985 | 30 | 50 | 380702 4454140 | 1168 |
| 30 | 60 | 380711 4454140 | 1164 | |
| 30 | 50 | 380698 4454204 | 1163 | |
| 1996 | 19 | 50 | 382765 4453174 | 1193 |
| 19 | 80 | 382746 4453165 | 1184 | |
| 19 | 50 | 382724 4453119 | 1180 | |
| 2002 | 13 | 70 | 378729 4458427 | 1422 |
| 13 | 50 | 378781 4458462 | 1429 | |
| 13 | 50 | 378807 4458476 | 1430 |
Table 2.
Soil CEC, pH, EC, and Total Lime (CaCO3) Concentration ± Std. Err. in afforestation sites established in various years and adjacent nonplanted soil-tilled sites.
Table 2.
Soil CEC, pH, EC, and Total Lime (CaCO3) Concentration ± Std. Err. in afforestation sites established in various years and adjacent nonplanted soil-tilled sites.
| Depth Level | Treatment | CEC (cmolc kg-1) | PH | EC (µS cm-1) | Total Lime (CaCO3%) |
| 1 | Affo1968 | 22.2 ± 1.37aDC | 7.54 ± 0.04aAB | 155.8 ± 9.66bA | 22.62 ± 1.13bB |
| 1 | Affo1973 | 28.75 ± 0.9aBC | 7.5 ± 0.02aAB | 129.04 ± 4.21bB | 46.19 ± 1.16bA |
| 1 | Affo1985 | 33.69 ± 0.84aAB | 7.38 ± 0.09aB | 116.68 ± 8.54aBC | 2.62 ± 0.58aD |
| 1 | Affo1996 | 36.05 ± 3.02aA | 7.61 ± 0.05aA | 138.58 ± 3.24aAB | 7.55 ± 0.91aC |
| 1 | Affo2002 | 18.96 ± 1.06aD | 7.43 ± 0.02aAB | 94.12 ± 2.6aC | 2.07 ± 0.32aD |
| 1 | Tilled 1968 | 22.22 ± 0.67aCD | 7.59 ± 0.05aA | 202.75 ± 6.99aA | 28.35 ± 1.27aB |
| 1 | Tilled 1973 | 26.22 ± 1.2aBC | 7.55 ± 0.04aA | 154.55 ± 11.38aB | 49.9 ± 0.77aA |
| 1 | Tilled 1985 | 36.9 ± 1.81aA | 7.34 ± 0.07aB | 76.75 ± 6.56bC | 0.39 ± 0.07bD |
| 1 | Tilled 1996 | 31.39 ± 0.91aB | 7.41 ± 0.06bAB | 92.93 ± 5.34bC | 4.7 ± 0.38bC |
| 1 | Tilled 2002 | 18.32 ± 1.5aD | 7.34 ± 0.03bB | 78.95 ± 1.92bC | 1.55 ± 0.17aD |
| 2 | Affo1968 | 21.5 ± 1.82aCD | 7.58 ± 0.03aA | 128.63 ± 3.9bAB | 23.55 ± 1.1bB |
| 2 | Affo1973 | 28.45 ± 1.47aBC | 7.49 ± 0.02bA | 127.85 ± 2.62bAB | 45.73 ± 0.89bA |
| 2 | Affo1985 | 34.25 ± 0.88aAB | 7.44 ± 0.07aA | 114.79 ± 10.17aB | 2.76 ± 0.7aD |
| 2 | Affo1996 | 36.38 ± 3.14aA | 7.61 ± 0.04aA | 136.52 ± 3.65aA | 7.36 ± 0.95aC |
| 2 | Affo2002 | 20.72 ± 1.07aD | 7.46 ± 0.03aA | 89.84 ± 1.66aC | 2.6 ± 0.21aD |
| 2 | Tilled 1968 | 22.5 ± 0.53aDC | 7.67 ± 0.06aA | 171.01 ± 3.85aA | 30.21 ± 0.76aB |
| 2 | Tilled 1973 | 27.16 ± 0.99aBC | 7.57 ± 0.02aAB | 158.31 ± 12.52aA | 49.63 ± 1.4aA |
| 2 | Tilled 1985 | 34.02 ± 1.46aA | 7.28 ± 0.04aC | 75.48 ± 7.85bB | 0.49 ± 0.08bD |
| 2 | Tilled 1996 | 30.44 ± 1.77aAB | 7.36 ± 0.08bBC | 93.48 ± 3.13bB | 3.9 ± 0.51bC |
| 2 | Tilled 2002 | 19.44 ± 1.56aD | 7.34 ± 0.04bC | 78.18 ± 4.2bB | 2.28 ± 0.51aDC |
| 3 | Affo1968 | 19.45 ± 3.9aA | 7.51 ± 0.09aA | 112.5 ± 4.9bA | 26.25 ± 1.73aB |
| 3 | Affo1973 | 26.49 ± 2.09aA | 7.56 ± 0.06aA | 121.3 ± 4.11aA | 51.04 ± 2.45aA |
| 3 | Affo1985 | 35.05 ± 1.79aA | 7.36 ± 0.19aA | 106.17 ± 16.48aA | 5.17 ± 3.9aC |
| 3 | Affo1996 | 42.58 ± 11.86aA | 7.66 ± 0.06aA | 131.43 ± 11.65aA | 6.48 ± 1.59aC |
| 3 | Affo2002 | 18.92 ± 1.17aA | 7.43 ± 0.03aA | 89.93 ± 4.65aA | 5.47 ± 2.33aC |
| 3 | Tilled 1968 | 21.48 ± 1.99aA | 7.62 ± 0.05aA | 149.7 ± 0.3aA | 31.77 ± 0.04aA |
| 3 | Tilled 1973 | 28.65 ± 2.26aA | 7.61 ± 0.03aA | 146.1 ± 33.2aA | 46.84 ± 6.22aA |
| 3 | Tilled 1985 | 38.6 ± 12.78aA | 7.27 ± 0.03aA | 54.6 ± 11.9aA | 0.29 ± 0.21aB |
| 3 | Tilled 1996 | 31.93 ± 0.11aA | 7.32 ± 0.26aA | 88.2 ± 13.3aA | 3.73 ± 0.92aB |
| 3 | Tilled 2002 | 19.32 ± 0.15aA | 7.37 ± 0.11aA | 82.2 ± 14.3aA | 5.78 ± 4.01aB |
| 4 | Affo1968 | 19.51 ± 3.9aA | 7.54 ± 0.08aA | 108 ± 6.18bA | 27.19 ± 1.36aB |
| 4 | Affo1973 | 25.9 ± 2.99aA | 7.55 ± 0.02aA | 114.13 ± 5.28aA | 51.6 ± 4.5aA |
| 4 | Affo1985 | 33.18 ± 1.13aA | 7.44 ± 0.21aA | 108.7 ± 16.08aA | 9.69 ± 8.54aBC |
| 4 | Affo1996 | 27.01 ± 8.23aA | 7.65 ± 0.11aA | 120.03 ± 6.61aA | 2.89 ± 1.71aC |
| 4 | Affo2002 | 19.56 ± 1.71aA | 7.48 ± 0.06aA | 86.7 ± 1.88aA | 7.29 ± 2.42aBC |
| 4 | Tilled 1968 | 21.62 ± 0.73aA | 7.62 ± 0.06aA | 156.45 ± 5.05aA | 26.1 ± 2.67aB |
| 4 | Tilled 1973 | 30.08 ± 3.11aA | 7.6 ± 0.05aA | 139.85 ± 30.35aA B | 45.66 ± 4.84aA |
| 4 | Tilled 1985 | 32.28 ± 0.26aA | 7.21 ± 0.01aA | 59.8 ± 11.6aB | 0.21 ± 0.12aC |
| 4 | Tilled 1996 | 33.35 ± 5.53aA | 7.41 ± 0.29aA | 99.75 ± 12.85aA B | 4.44 ± 2.71aC |
| 4 | Tilled 2002 | 24.67 ± 2.78aA | 7.4 ± 0.07aA | 81.8 ± 12.3aA B | 3.84 ± 1.98aC |
| 5 | Affo1968 | 18.74 ± 3.4aA | 7.5 ± 0.06aA | 103.7 ± 1.38bA | 27.84 ± 2.1aAB |
| 5 | Affo1973 | 24.43 ± 2.84aA | 7.53 ± 0.05aA | 82.57 ± 35.6aA | 53.56 ± 3.93aA |
| 5 | Affo1985 | 34.31 ± 0.76aA | 7.53 ± 0.22aA | 122.97 ± 18.36aA | 12.39 ± 11.4aB |
| 5 | Affo1996 | 23.3 ± 13.28aA | 7.68 ± 0.15aA | 116.55 ± 1.85aA | 4.49 ± 2.73aB |
| 5 | Affo2002 | 22 ± 3.61aA | 7.39 ± 0.09aA | 84.4 ± 4.87aA | 5.11 ± 1.71aB |
| 5 | Tilled 1968 | 20.19 ± 0.07aC | 7.7 ± 0.1aA | 146.9 ± 3.2aA | 31.56 ± 2.1aB |
| 5 | Tilled 1973 | 34.54 ± 3.92aAB | 7.59 ± 0.03aA | 146.35 ± 32.95aA | 43.49 ± 1.41aA |
| 5 | Tilled 1985 | 32.2 ± 3.45aABC | 7.18 ± 0.01aB | 59.55 ± 12.45aA | 0.42 ± 0.08aD |
| 5 | Tilled 1996 | 36.6 ± .aA | 7.66 ± .aA | 111.5 ± .aA | 7.35 ± .aC |
| 5 | Tilled 2002 | 21.95 ± 1.23aB C | 7.31 ± 0.03aB | 87.4 ± 4.3aA | 2.44 ± 0.25aCD |
Note: Values are the mean ± standard error. Within the different treatments at the same time, means with a common lowercase letter are not significantly different at p = 0.05. Within the same treatment for different years, means with a common uppercase letter are not significantly different at p = 0.05. Treatments Affo is Afforestation, Tilled is nonplanted soil-tilled sites. Dept levels are the soil depths where 1: 0-10 cm, 2: 10-20 cm, 3: 20-30 cm, 4: 30-40 cm, 5: 40-50cm.
Table 3.
Soil Texture (Sand, Clay, and Silt Concentrations) and bulk density ± Std. Err. of afforestation sites established in various years and adjacent nonplanted soil-tilled sites.
Table 3.
Soil Texture (Sand, Clay, and Silt Concentrations) and bulk density ± Std. Err. of afforestation sites established in various years and adjacent nonplanted soil-tilled sites.
| Depth Level | Treatment | Sand % | Clay % | Silt %. | Soil Bulk Density (g cm-3) |
| 1 | Affo1968 | 53.75 ± 3.01aBC | 21.59 ± 1.69aB | 24.66 ± 3.27aA | 1.21 ± 0.03aB |
| 1 | Affo1973 | 58.84 ± 2.13aABC | 28.8 ± 1.17aA | 12.36 ± 1.61aB | 1.05 ± 0.02aC |
| 1 | Affo1985 | 63.06 ± 3.29aAB | 19.4 ± 3.13aBC | 17.54 ± 2.08aAB | 1.04 ± 0.03aC |
| 1 | Affo1996 | 48.87 ± 2.33aC | 28.8 ± 0.98bA | 22.32 ± 1.72aA | 0.98 ± 0.03aC |
| 1 | Affo2002 | 66.97 ± 1.41aAB | 12.72 ± 0.53aC | 20.32 ± 1.14aAB | 1.38 ± 0.03aA |
| 1 | Tilled 1968 | 66.49 ± 5.26bA | 26.09 ± 4.51aA | 7.41 ± 1.81bB | 1.21 ± 0.04aB |
| 1 | Tilled 1973 | 52.35 ± 1.73bB | 22.63 ± 1.89bA | 25.02 ± 1.73bA | 1.14 ± 0.04aB |
| 1 | Tilled 1985 | 49.28 ± 1.14bB | 27.84 ± 0.5bA | 22.89 ± 0.91aA | 1.04 ± 0.05aB |
| 1 | Tilled 1996 | 70.02 ± 2.19bA | 9.2 ± 0.85aB | 20.78 ± 1.69aA | 1.1 ± 0.04bB |
| 1 | Tilled 2002 | 64.87 ± 1.35aA | 13.16 ± 0.55aB | 21.97 ± 1.16aA | 1.45 ± 0.07aA |
| 2 | Affo1968 | 53.45 ± 3.92aB | 22.82 ± 2.27aBC | 23.73 ± 3.29aA | 1.28 ± 0.03aB |
| 2 | Affo1973 | 51.64 ± 2.09aB | 34.05 ± 1.37aA | 14.31 ± 1.45aC | 1.09 ± 0.03aC |
| 2 | Affo1985 | 64.4 ± 3.53aA | 20.04 ± 3.09aDC | 15.55 ± 1.87aBC | 1.05 ± 0.03aC |
| 2 | Affo1996 | 47.43 ± 1.45aB | 29.51 ± 0.92aAB | 23.05 ± 1.16aAB | 1.05 ± 0.02aC |
| 2 | Affo2002 | 67.56 ± 1.14aA | 12.97 ± 0.64aD | 19.47 ± 1.27aABC | 1.46 ± 0.05aA |
| 2 | Tilled 1968 | 67.84 ± 3.35bA | 25.76 ± 3.1aA | 6.4 ± 1.06bB | 1.29 ± 0.04aB |
| 2 | Tilled 1973 | 47.4 ± 2.51aB | 27.85 ± 2.31bA | 24.75 ± 1.3bA | 1.1 ± 0.03aC |
| 2 | Tilled 1985 | 46.27 ± 1.28bB | 28.81 ± 0.7bA | 24.92 ± 1.06bA | 1.01 ± 0.04aC |
| 2 | Tilled 1996 | 69.25 ± 2.54bA | 10.14 ± 1.07bB | 20.61 ± 1.87aA | 1.14 ± 0.04aBC |
| 2 | Tilled 2002 | 66.44 ± 1.59aA | 12.87 ± 0.67aB | 20.69 ± 1.05aA | 1.5 ± 0.06aA |
| 3 | Affo1968 | 52.94 ± 12.33aA | 24.71 ± 6.94aAB | 22.35 ± 7.32aA | 1.22 ± 0.12aA |
| 3 | Affo1973 | 41.95 ± 2aA | 38.87 ± 2.33aA | 19.18 ± 1.58aA | 1.09 ± 0.07aA |
| 3 | Affo1985 | 72.16 ± 5.22aA | 10.98 ± 3.05aB | 16.87 ± 2.6aA | 1.05 ± 0.07aA |
| 3 | Affo1996 | 51.44 ± 8.04aA | 25.43 ± 5.98aAB | 23.13 ± 3.46aA | 1.02 ± 0.03aA |
| 3 | Affo2002 | 73.59 ± 1.72aA | 10.69 ± 1.03aB | 15.71 ± 1.25aA | 1.36 ± 0.06aA |
| 3 | Tilled 1968 | 61.6 ± 6.17aA | 26.03 ± 2.35aA | 12.36 ± 3.82aA | 1.19 ± 0.04aA |
| 3 | Tilled 1973 | 65.23 ± 8.12bA | 16.94 ± 1.17bAB | 17.83 ± 9.3aA | 1.08 ± 0.03aA |
| 3 | Tilled 1985 | 46.49 ± 2.48bA | 26.05 ± 2.83bA | 27.46 ± 5.31aA | 1.07 ± 0.02aA |
| 3 | Tilled 1996 | 66.13 ± 4.06aA | 10.59 ± 0.08aB | 23.28 ± 4.14aA | 1.07 ± 0.13aA |
| 3 | Tilled 2002 | 69.81 ± 2.05aA | 12.27 ± 2.3aB | 17.92 ± 0.25aA | 1.4 ± 0.07aA |
| 4 | Affo1968 | 56.43 ± 15.96aA | 22.93 ± 7.3aAB | 20.65 ± 8.9aA | 1.23 ± 0.06aAB |
| 4 | Affo1973 | 50.77 ± 6.34aA | 38.66 ± 1.85aA | 10.58 ± 4.49aA | 1.14 ± 0.07aAB |
| 4 | Affo1985 | 65.97 ± 5.84aA | 18.33 ± 6.1aAB | 15.71 ± 2.64aA | 0.94 ± 0.08aB |
| 4 | Affo1996 | 61.74 ± 6.29aA | 19 ± 3.64aA B | 19.25 ± 2.67aA | 1.1 ± 0.01aB |
| 4 | Affo2002 | 74.71 ± 2.39aA | 8.92 ± 1.52aB | 16.37 ± 0.88aA | 1.61 ± 0.2aA |
| 4 | Tilled 1968 | 69.4 ± 3.64aA | 26.18 ± 2.57aAB | 4.42 ± 1.07aB | 1.04 ± 0.04aB |
| 4 | Tilled 1973 | 54.58 ± 7.51aA | 16.92 ± 1.29bBC | 28.49 ± 6.21aA | 1 ± 0.08aB |
| 4 | Tilled 1985 | 48.79 ± 2.68aA | 30.07 ± 1.42aA | 21.13 ± 4.1aAB | 1.01 ± 0.01aB |
| 4 | Tilled 1996 | 70.21 ± 0.24aA | 9.28 ± 1.21aC | 20.52 ± 1.45aAB | 1.26 ± 0.08aAB |
| 4 | Tilled 2002 | 73.62 ± 5.98aA | 11.12 ± 3.69aC | 15.26 ± 2.28aAB | 1.46 ± 0.11aA |
| 5 | Affo1968 | 57.27 ± 10.42aAB | 22.88 ± 6.67aAB | 19.85 ± 4.44aA | 1.28 ± 0.07aAB |
| 5 | Affo1973 | 43.06 ± 5.76aB | 38.72 ± 3.29aA | 18.22 ± 3.69aA | 1.09 ± 0.08aB |
| 5 | Affo1985 | 65.11 ± 6.45aAB | 21.14 ± 5.5aAB | 13.76 ± 1.07aA | 1.09 ± 0.09aB |
| 5 | Affo1996 | 58.92 ± 10.48aAB | 20.4 ± 2.12aAB | 20.68 ± 12.6aA | 1.1 ± 0.01aB |
| 5 | Affo2002 | 75.52 ± 2.75aA | 8 ± 0.7aB | 16.48 ± 2.1aA | 1.53 ± 0.1aA |
| 5 | Tilled 1968 | 73.32 ± 2.66aA | 20.92 ± 2.67aAB | 5.76 ± 0.01aC | 1.21 ± 0.02aAB |
| 5 | Tilled 1973 | 51.83 ± 2.72aA | 19.43 ± 1.28bAB | 28.74 ± 1.44aA | 1.06 ± 0.09aB |
| 5 | Tilled 1985 | 56.79 ± 7.97aA | 24.85 ± 3.82aA | 18.35 ± 4.15aAB | 1.09 ± 0.1aB |
| 5 | Tilled 1996 | 70.02 ± .aA | 8.01 ± .aB | 21.97 ± .aA B | 1.14 ± .aB |
| 5 | Tilled 2002 | 77.25 ± 4.81aA | 8.52 ± 3.56aB | 14.23 ± 1.25aBC | 1.55 ± 0.02aA |
Note: Values are the mean ± standard error. Within the different treatments in the same year for the same depth level, means with a common lowercase letter are not significantly different at p = 0.05. Within the same treatment for different years for the same depth level, means with a common uppercase letter are not significantly different at p = 0.05. Treatments: “Affor” is Afforestation, and “Tilled” is nonplanted soil-tilled sites. Dept levels are the soil depths where 1: 0-10 cm, 2: 10-20 cm, 3: 20-30 cm, 4: 30-40 cm, 5: 40-50cm.
Table 4.
Soil Inorganic Carbon (SIOC), Total Soil Carbon (TSC), Soil Organic Carbon (SOC) and Nitrogen (N) concentrations ± Std. Err. of afforestation sites established in various years and adjacent nonplanted soil-tilled sites.
Table 4.
Soil Inorganic Carbon (SIOC), Total Soil Carbon (TSC), Soil Organic Carbon (SOC) and Nitrogen (N) concentrations ± Std. Err. of afforestation sites established in various years and adjacent nonplanted soil-tilled sites.
| Depth Level | Treatment | SIOC (%) | TSC (%) | SOC (%). | N (%) |
| 1 | Affo1968 | 2.71 ± 0.14aB | 3.82 ± 0.22aB | 1.1 ± 0.25aA | 0.17 ± 0.02aB |
| 1 | Affo1973 | 5.54 ± 0.14aA | 6.36 ± 0.21aA | 0.82 ± 0.2aA | 0.21 ± 0.01aB |
| 1 | Affo1985 | 0.31 ± 0.07aD | 1.18 ± 0.09aC | 0.86 ± 0.06aA | 0.2 ± 0.01aB |
| 1 | Affo1996 | 0.91 ± 0.11aC | 1.91 ± 0.23aC | 1.01 ± 0.26aA | 0.32 ± 0.05bB |
| 1 | Affo2002 | 0.25 ± 0.04aD | 1.23 ± 0.15aC | 0.98 ± 0.18aA | 1.61 ± 0.29aA |
| 1 | Tilled 1968 | 3.4 ± 0.15bB | 4.38 ± 0.34aB | 0.98 ± 0.27aB C | 0.23 ± 0.02aC |
| 1 | Tilled 1973 | 5.99 ± 0.09bA | 6.47 ± 0.11aA | 0.48 ± 0.13aC | 0.2 ± 0.01aC |
| 1 | Tilled 1985 | 0.05 ± 0.01bD | 1.38 ± 0.12aD | 1.33 ± 0.12bB | 0.23 ± 0.01bC |
| 1 | Tilled 1996 | 0.56 ± 0.05bC | 2.78 ± 0.18bC | 2.22 ± 0.15bA | 3.08 ± 0.51aA |
| 1 | Tilled 2002 | 0.19 ± 0.02aD | 1.02 ± 0.14aD | 0.84 ± 0.13aB C | 1.56 ± 0.18aB |
| 2 | Affo1968 | 2.83 ± 0.13aB | 4.1 ± 0.35aB | 1.27 ± 0.34aA | 0.2 ± 0.02aB |
| 2 | Affo1973 | 5.49 ± 0.11aA | 6.11 ± 0.13aA | 0.62 ± 0.12aA | 0.21 ± 0.01aB |
| 2 | Affo1985 | 0.33 ± 0.08aD | 1.08 ± 0.08aC | 0.75 ± 0.07aA | 0.2 ± 0.01aB |
| 2 | Affo1996 | 0.88 ± 0.11aC | 1.61 ± 0.25aC | 0.73 ± 0.23aA | 0.36 ± 0.1aB |
| 2 | Affo2002 | 0.31 ± 0.03aD | 1.06 ± 0.12aC | 0.75 ± 0.14aA | 1.48 ± 0.25aA |
| 2 | Tilled 1968 | 3.63 ± 0.09bB | 4.18 ± 0.15aB | 0.55 ± 0.17aB | 0.22 ± 0.01aB |
| 2 | Tilled 1973 | 5.96 ± 0.17bA | 6.49 ± 0.14aA | 0.54 ± 0.13aB | 0.19 ± 0.01aB |
| 2 | Tilled 1985 | 0.06 ± 0.01bD | 1.14 ± 0.12aD | 1.08 ± 0.12bB | 0.22 ± 0.01aB |
| 2 | Tilled 1996 | 0.47 ± 0.06bC | 2.8 ± 0.26bC | 2.33 ± 0.27bA | 3.41 ± 0.75bA |
| 2 | Tilled 2002 | 0.27 ± 0.06aD C | 1.12 ± 0.24aD | 0.84 ± 0.2aB | 1.51 ± 0.13aB |
| 3 | Affo1968 | 3.15 ± 0.21aB | 3.88 ± 0.29aB | 0.73 ± 0.49aA | 0.2 ± 0.02aA |
| 3 | Affo1973 | 6.12 ± 0.29aA | 6.12 ± 0.29aA | 0 ± 0aA | 0.18 ± 0.01aA |
| 3 | Affo1985 | 0.62 ± 0.47aC | 1.24 ± 0.39aC | 0.62 ± 0.15aA | 0.2 ± 0.02aA |
| 3 | Affo1996 | 0.78 ± 0.19aC | 1.03 ± 0.09aC | 0.25 ± 0.25aA | 0.23 ± 0.05aA |
| 3 | Affo2002 | 0.66 ± 0.28aC | 1.38 ± 0.48aC | 0.72 ± 0.69aA | 0.82 ± 0.43aA |
| 3 | Tilled 1968 | 3.81 ± 0aA | 4.05 ± 0.24aA B | 0.24 ± 0.24aB | 0.17 ± 0.01aB |
| 3 | Tilled 1973 | 5.62 ± 0.75aA | 5.69 ± 0.82aA | 0.07 ± 0.07aB | 0.2 ± 0aB |
| 3 | Tilled 1985 | 0.03 ± 0.02aB | 0.55 ± 0.23aC | 0.51 ± 0.21aA B | 0.12 ± 0.02aB |
| 3 | Tilled 1996 | 0.45 ± 0.11aB | 2.79 ± 0.42bB C | 2.34 ± 0.31bA | 2.92 ± 0.96bA |
| 3 | Tilled 2002 | 0.69 ± 0.48aB | 1.52 ± 0.13aC | 0.83 ± 0.62aA B | 1.55 ± 0.11aA B |
| 4 | Affo1968 | 3.26 ± 0.16aB | 3.81 ± 0.52aA B | 0.54 ± 0.36aA | 0.95 ± 0.73aA |
| 4 | Affo1973 | 6.19 ± 0.54aA | 6.26 ± 0.55aA | 0.06 ± 0.06aA | 0.22 ± 0.02aA |
| 4 | Affo1985 | 1.16 ± 1.02aB C | 1.82 ± 0.95aB C | 0.65 ± 0.1aA | 0.18 ± 0.04aA |
| 4 | Affo1996 | 0.35 ± 0.21aC | 0.51 ± 0.22aC | 0.16 ± 0.16aA | 0.15 ± 0.05aA |
| 4 | Affo2002 | 0.88 ± 0.29aB C | 0.94 ± 0.22aC | 0.07 ± 0.07aA | 1.09 ± 0.54aA |
| 4 | Tilled 1968 | 3.13 ± 0.32aB | 3.38 ± 0.57aB | 0.25 ± 0.25aB | 0.16 ± 0aA |
| 4 | Tilled 1973 | 5.48 ± 0.58aA | 5.71 ± 0.35aA | 0.23 ± 0.23aB | 0.18 ± 0.01aA |
| 4 | Tilled 1985 | 0.03 ± 0.01aC | 0.98 ± 0.22aC | 0.96 ± 0.21aB | 0.19 ± 0.02aA |
| 4 | Tilled 1996 | 0.53 ± 0.33aC | 2.86 ± 0.5bB C | 2.33 ± 0.17bA | 3.7 ± 1.62bA |
| 4 | Tilled 2002 | 0.46 ± 0.24aC | 0.68 ± 0.02aC | 0.21 ± 0.21aB | 1.54 ± 0.44aA |
| 5 | Affo1968 | 3.34 ± 0.25aA B | 3.47 ± 0.32aB | 0.13 ± 0.07aA | 0.16 ± 0.01aB |
| 5 | Affo1973 | 6.43 ± 0.47aA | 6.58 ± 0.39aA | 0.16 ± 0.12aA | 0.16 ± 0.02aB |
| 5 | Affo1985 | 1.49 ± 1.37aB | 1.96 ± 1.16aB | 0.47 ± 0.31aA | 0.19 ± 0.03aB |
| 5 | Affo1996 | 0.54 ± 0.33aB | 0.75 ± 0.12aB | 0.21 ± 0.21aA | 0.18 ± 0.06aB |
| 5 | Affo2002 | 0.61 ± 0.2aB | 1.11 ± 0.61aB | 0.5 ± 0.5aA | 1.68 ± 0.68aA |
| 5 | Tilled 1968 | 3.79 ± 0.25aB | 4.52 ± 0.49aA B | 0.73 ± 0.24aA | 0.2 ± 0.03aC |
| 5 | Tilled 1973 | 5.22 ± 0.17aA | 5.22 ± 0.17aA | 0 ± 0aA | 0.17 ± 0.03aC |
| 5 | Tilled 1985 | 0.05 ± 0.01aD | 0.38 ± 0.13aC | 0.33 ± 0.12aA | 0.16 ± 0.02aC |
| 5 | Tilled 1996 | 0.88 ± .aC | 2.66 ± .aB C | 1.78 ± .aA | 3.32 ± .bA |
| 5 | Tilled 2002 | 0.29 ± 0.03aC D | 1.16 ± 0.84aC | 0.87 ± 0.87aA | 1.79 ± 0.05aB |
Note: Values are the mean ± standard error. Within the different treatments in the same year for the same depth level, means with a common lowercase letter are not significantly different at p = 0.05. Within the same treatment for different years for the same depth level, means with a common uppercase letter are not significantly different at p = 0.05. “Affor” is Afforestation, and “Tilled” is nonplanted soil-tilled sites. Dept levels are the soil depths where 1: 0-10 cm, 2: 10-20 cm, 3: 20-30 cm, 4: 30-40 cm, 5: 40-50cm.
Table 5.
Carbon (C) and Nitrogen (N) concentrations ± Std. Err. of Litter and Humus in afforestation sites established in various years.
Table 5.
Carbon (C) and Nitrogen (N) concentrations ± Std. Err. of Litter and Humus in afforestation sites established in various years.
| Sample | Treatment | N (%) ± Std. Err. | C (%) ± Std. Err. |
| Litter | Affor1968 | 1.67 ± 0.65a | 45.41 ± 0.78a |
| Litter | Affor1973 | 0.41 ± 0.09b | 48.25 ± 1.21a |
| Litter | Affor1985 | 0.4 ± 0.09b | 47.9 ± 1.22a |
| Litter | Affor1996 | 0.51 ± 0.08a b | 46.68 ± 1.24a |
| Litter | Affor2002 | 0.46 ± 0.09a b | 47.58 ± 0.85a |
| Humus | Affor1968 | 1.12 ± 0.36a | 46.2 ± 0.78a |
| Humus | Affor1973 | 0.5 ± 0.13a b | 32.94 ± 8.33a b |
| Humus | Affor1985 | 0.3 ± 0.09b | 29.95 ± 7.52a b |
| Humus | Affor1996 | 0.02 ± 0.02b | 14.79 ± 7.4b c |
| Humus | Affor2002 | - | - |
Note: Values are the mean ± standard error. Within the same treatments for different years, means with a common lowercase letter are not significantly different at p = 0.05. “Affor” is Afforestation sites.
Disclaimer/Publisher’s Note: The statements, opinions and data contained in all publications are solely those of the individual author(s) and contributor(s) and not of MDPI and/or the editor(s). MDPI and/or the editor(s) disclaim responsibility for any injury to people or property resulting from any ideas, methods, instructions or products referred to in the content. |
© 2025 by the authors. Licensee MDPI, Basel, Switzerland. This article is an open access article distributed under the terms and conditions of the Creative Commons Attribution (CC BY) license (http://creativecommons.org/licenses/by/4.0/).
Copyright: This open access article is published under a Creative Commons CC BY 4.0 license, which permit the free download, distribution, and reuse, provided that the author and preprint are cited in any reuse.


