Submitted:
12 August 2025
Posted:
13 August 2025
You are already at the latest version
Abstract
Most ovarian cancer (OC) tumors are P53-mutant with some mutant P53 proteins possesses an oncogenic activity in OC development. Glycogen synthase kinase 3β (GSK3β), an enzyme closely relates to OC development was found to regulate P53 abundance in several cancer cells, however, whether GSK3β regulates P53 protein expression in OC is unknown. We initially aimed to address this issue, which led to identify a novel signaling axis involved in DNA damage repair in OC cell lines. We found GSK3β reversely regulated P53 signaling across ovarian OC cell lines. Inhibition of GSK3β impeded the homogenous recombination (HR) signaling pathway for DNA damage repair thus caused DNA damage, which was responsible for the raised P53 expression in the HR-proficient OC cells. The raised P53, whether mutated or not, attenuated DNA damage caused by GSK3β inhibition. We further confirmed PLK1/Aurora A axis was governed by GSK3β. Inhibition of GSK3β activated PLK1 via Aurora A in ovarian cancer cells and activation of PLK1 related to DNA damage repair. Double inhibition of GSK3β and PLK1 had a synergistic effect on inducing DNA damage and cell apoptosis in OC cells, which stands as a promising therapeutic strategy for OC.
Keywords:
ovarian cancer
; DNA damage
; GSK3β
; PLK1
; apoptosis
1. Introduction
Ovarian cancer (OC) accounts for approximately 5% of female cancer-related mortality globally [1]. It is the most lethal malignancy in gynecology with less than 20% 5-year overall survival in advance stage [2]. OC is characterized by high frequent mutation of TP53, a well-known tumor suppressor. For high-grade serous ovarian cancer (HGSC), over 96% of patients were found to carry TP53 gene mutations [3]. Mutant P53 (mtP53) proteins are associated with either loss tumor-suppressive function (loss-of-function, LOF) or acquire oncogenic activities (gain-of-function, GOF), relating to tumor progress [4]. Therefore, P53 became a hot target for HGSC treatment and intensive efforts have been made to restore wild type P53 (wtP53) activity for OC therapy [5,6,7].
As a potent anti-cancer natural compound, Arctigenin (ATG) suppresses a number of cancer types [8]. However, its biological effects on OC are barely reported. Initially, we aimed to study the effect of ATG on OC cell proliferation, and found ATG inhibited OC cells proliferation depending on low glucose condition. Then we studied the influence of ATG on P53 expressions using several OC cell lines. Surprisingly, ATG treatment reversely regulated P53 expression across these cell lines. To reveal the underlying mechanism of P53 regulation by ATG, we systematically analyzed its activities involved in human diseases treatments [9] and validated glycogen synthase kinase 3β (GSK3β) accounted for the ATG-mediated P53 regulations.
In early stage, GSK3β was considered as a driving force in OC progress [10]. However, its exact biofunction in OC is now a matter of controversial debate. It exerts both tumor-promoting and tumor-suppressing effects on OC [11], indicating GSK3β could not be defined as a simple tumor-promotor or tumor-suppressor for OC. In anti-tumor side, GSK3β inhibits cancer development via impeding multiple tumor biological process, such as cell proliferation, apoptosis, invasion and therapy resistance [12]. A recent study showed its anti-tumor potential also involved DNA damage repair (DDR) pathway [13]. In this study, we not only showed the role of GSK3β in P53 regulation, but also confirmed its activity in homogenous recombination (HR) pathway for DNA damage repair. Moreover, we uncovered GSK3β governed the Aurora A (Aur-A)/PLK1 axis which closely related to DDR and P53 expression and further validated the synergistic anti-OC effects via double inhibition of GSK3β and PLK1.
2. Materials and Methods
2.1. Cell Lines
A2780 (RRID:CVCL_0134), ES-2 (RRID:CVCL_3509), OVCAR-8 (RRID:CVCL_1629), Hey (RRID:CVCL_0297) , OVCAR-3 (RRID:CVCL_0465) and Kuramochi (RRID:CVCL_1345) cells were purchased from Immocell Biotechnology company (Xiamen, China). All cell lines were authenticated using short tandem repeat profiling by ATCC or the Roswell Park Core. Cells were cultured as recommended by the instructions from ATCC.
2.2. Chemicals and Antibodies
MK2206 (A3010, APExBIO, USA), Pifithrin-α (A4206, APExBIO, USA), KU-55933 (A4605, APExBIO, USA), Bleomycin sulfate (A8331, APExBIO, USA), Etoposide (A1971, APExBIO, USA) were obtained from APExBIO Technology. TWS-119 (601514-19-6, Tsbiochem, USA) was obtained from TargetMol Chemicals. Alisertib (S80032, MedMol, China) was obtained from Shanghai yuanye Bio-Technology. GSK461364 (929095-18-1, MCE, USA) was obtained from MedChemExpress LLC. The following antibodies were used for immunoblotting: β-actin (811115-1-RR, Proteintech, China), p-PLK1 (Thr210) (AB155095, Abcam, UK), PLK1 (4513, Cell Signaling Technology, USA), GAPDH (60004-1-Ig, Proteintech, China), p-GSK3β (Ser9) (5558, Cell Signaling Technology, USA), GSK3β (12456, Cell Signaling Technology, USA), P53 (10442-1-AP, Proteintech, China), p-AKT (Ser473) (9271, Cell Signaling Technology, USA), AKT (9272, Proteintech, China), Aurora A (14475, Cell Signaling Technology, USA), p-H2AX (Ser139) (9718, Cell Signaling Technology, USA), Cleaved Caspase-3 (ASP175) (9661, Cell Signaling Technology, USA), P53 (2524, Cell Signaling Technology, USA), FLAG (DDDK-tag) (AB1162, Abcam, UK).
2.3. CCK-8 Assay
Cells were seeded onto 96-well plates at a density of 1104/well for 24 hours, and then cell culture medium was renewed and agents were added to treat cells. 48 hours later, cell proliferation was determined by cell counting kit-8 assay (CK04-100T, Dojindo, Japan). Data were obtained by measuring the optical density at 450 nm with a microplate reader (Cytation5, Biotek, USA).
2.4. Construct
cDNAs encoding full-length ORFs of GSK3β was amplified by PCR using total RNA of OVCAR-8 cell and cloned into NotI and XhoI restriction site of pEF-BOS using In-fusion cloning (638910, TaKaRa, Japan). A Flag tag sequence was inserted between the start codon and the N-terminus of GSK3β.
2.5. Lentiviral Transduction
pLKO.1 puro lentiviral vector (8453, Addgene, USA) was used to express short hairpin RNA (shRNA). GSK3β shRNAs are targeting the following sequences: 5′-CATGAAAGTTAGCAGAGACAA-3′ (shRNA.1) and 5′-GTGTGGATCAGTTGGTAGAAA-3′ (shRNA.2). An shRNA with the nontargeting sequence 5′-TTCTCCGAACGTGTCACGTAA-3′ was used as a negative control.
Cancer cell lines and were transduced with a multiplicity of infection (MOI) of 10. 48 hours after transduction, cells were selected with puromycin (3 mg/ml) for 3 days.
2.6. RNA Isolation, RT-qPCR and RNA-seq
RNA was isolated using a RNeasy Plus Mini kit (Qiagen, 74134) and then used for cDNA synthesis (6210A, Takara, Japan). Quantitative real-time PCR was performed using a SYBR Green master mix (MQ10401S, Monad, China) and β-actin was used as a housekeeping gene. The following primer pairs were used: β-actin forward CAGAGCCTCGCCTTTGCCGATC and reverse CATCCATGGTGAGCTGGCGGCG;P53 forward AAGTCTGTGACTTGCACGTACTCC and reverse GTCATGTGCTGTG-ACTGCTTGTAG; MDM2 forward GGGAGTGATCAAAAGGACCT and reverse CC-AAATGTGAAGATGAAGGTTTC; CDKN1A forward CTTGTACCCTTGTGCCTCGC and reverse GCGTTTGGAGTGGTAGAAATCTGT; PIDD1 forward CTCACCCACCT-GTACGCAC and reverse CAGAGCGATGAGGTTCACAC. Total RNA was isolated from cells using TRIzol Reagent (15596026, Thermo Scientific, USA) following the manufacturer's recommended protocol. For library preparation, total RNA was used as input for RNA sequencing library preparation utilizing the KCTM mRNA Library Prep Kit (Seqhealth Tech, Wuhan, China), according to the manufacturer's instructions. The library preparation included the enrichment of PCR products corresponding to fragments ranging from 200 to 500 base pairs. The enriched libraries were quantified and sequenced on a DNBSEQ-T7 platform (MGI, China) using the PE150 sequencing mode to generate paired-end reads.
2.7. Immunoblotting
Cells were harvested with RIPA buffer (AR0102, BOSTER, China) with protease inibitor mixtures (P8340, Sigma, USA). Samples were separated on 8-12.5% SDS PAGE and transferred to PVDF membranes (88520, Thermo Fisher, USA), which were subsequently blocked with skim milk (D8340, Solarbio, China) for 60 minutes. Afterwards, membranes were probed with the primary antibodies, followed by incubation with HRP-conjugated goat anti-mouse (SA00012-1, Proteintech, China) or anti-rabbit (SA00001-2, Proteintech, China) secondary antibody diluted 1:5000-10000. The intensity of protein bands was quatified by Image Lab (ChemiDoc MP, BioRad, USA) and data were analyzed by ImageJ (SCR_003070, USA).
2.8. Flow Cytometry
Apoptotic cells were identified by an annexin V and PI staining kit Annexin V-FITC/PI apoptosis kit (KGA108, KeyGen Biotech, China) according to manufacturer’s instructions. Percentages of cells in different phases of cell cycle analyzed by a cell cycle analysis kit (KGA511) were detected by flow cytometer (CytoFLEX, Beckman, USA) and data were processed using FlowJo 10.0.7 (FlowJo LLC, USA).
2.9. Immunofluorescence Staining
A DNA damage detection kit (Dojindo, DK02) were utilized for visualizing γH2AX staining. Cells were seeded onto confocal dishes (20mm, NEST) at a density of 2.5105/well and fixed for 15 min in 4% paraformaldehyde. Dishes were washed with PBS for three times. Permeabilization was performed for 5 min with 0.1% Triton in PBS. After washing the dishes with PBS for 3 times, cells were blocked with 1% BSA for 20 min. Cells were incubated with anti-γH2AX (1:50) antibody for 1 hour at dark, and subsequently incubated with the secondary antibody staining solution for 1 hour. Afterwards, nuclei were counterstained with DAPI for 5 min (Beyotime, China), the fluorescence signal was visualized using a fluorescence microscope (Leica DMi8, Wetzlar, Germany)
2.10. Statistical Analysis
GraphPad Prism software version 9 (SCR_002798, USA) was used to conduct statistical analyses and produce graphs. Data are presented as mean ± SEM. Unpaired t-tests, Mann-Whitney and one-way ANOVA were used for the comparison of significant differences between groups.
2.11. Data Availability
All raw data are available upon request from the corresponding author.
3. Results
3.1. ATG Discrepantly Regulates P53 Protein Expressions Among OV Cell Lines
We studied the cytotoxicity of ATG in OC cells and found ATG inhibited proliferations of A2780 and HEY cells depending on low glucose condition (Figure 1A-C). To explain the glucose concentration-dependent cytotoxicity of ATG, we assumed ATG induced P53 in low glucose condition based on the following reasons: (i) Deficiency of cellular glucose frequently led to AMP-activated protein kinase (AMPK) activation [14]; (ii) AMPK was able to phosphorylate and activate P53 [15]; (iii) ATG was a potent activator of AMPK [9]. However, contrary to our expectation, ATG decreased P53 expression in A2780 cells cultured in both high- and low-glucose mediums (Figure 1D). Similar result was obtained in HEY cells in which P53 protein was sharply reduced after exposure to ATG (Figure 1E). In stark contrast, ATG raised P53 protein level in OVCAR-8 cells (Figure 1E). We noticed OVCAR-8 cells carried a mutated P53 (p.Y126_splicing) gene, and wondered whether ATG upregulated P53 in mutant P53-expressing OC cells. We included another two P53-mutant OC cell lines (ES-2 and OVCAR-3) for study, however, ATG treatment did not upregulate P53 in these two cell lines (Figure 1F). Then we were aware that OVCAR-8 was a homologous recombination deficient (HRD) cell line [16], which differed with the homologous recombination proficient (HRP) cell lines (A2780, ES-2 and OVCAR-3) [16,17]. Therefore, we selected Kuramochi cells for study which was reported to be a HRD cell type [18]. Similar to OVCAR-8, ATG treatment increased the P53 protein expression in Kuramochi cells (Figure 1F). At this stage, we have confirmed ATG upregulated P53 in two HRD cells (OVCAR-8 and Kuramochi) while downregulated P53 in two HRP cells (A2780 and ES-2).
3.2. ATG-Mediated P53 Regulation is GSK3-β-Dependent
Since P53 proteins are discrepantly regulated by ATG among OC cells, the underlying mechanisms should be respectively explored. For A2780 and ES-2 cells, first, we excluded the ATG-mediated P53 downregulation was proteasomal degradation-dependent because MG132, a proteasome inhibitor, failed to rescue the decreased P53 amount caused by ATG (Figure 2A). Then we took cellular reactive oxygen species (ROS) into consideration, as it was an important source of P53 activation and upregulation and ATG could modulate cellular ROS [19,20]. Nevertheless, our data showed ATG treatment increased cellular ROS level in A2780 cells, which was not in line with the decreased P53 protein (Figure 2B). To search for more clues, we systematically reviewed the molecular mechanisms of ATG treatments for human diseases and found inhibition of PI3K/AKT pathway was a pivotal molecular activity of ATG [9]. First, we validated ATG treatment inactivated AKT in A2780 cells (Figure 2C). Then we tested whether ATG-mediated P53 regulation depended on AKT inhibition by a specific AKT inhibitor (MK2206). MK2206 functioned similarly to ATG, which increased P53 in OVCAR-8 while decreased P53 in A2780 cells (Figure 2D). These data suggested ATG-mediated P53 alteration related to AKT signaling, and then we went further to search for the key protein downstream of AKT and focused on GSK3β, a kinase frequently phosphorylated and inactivated by AKT [21]. GSK3β was reported to regulate P53 expression in cancer cells [22,23]. In consistent with AKT inhibition by ATG, downstream GSK3-β was activated in OVCAR-8 and A2780 cells (Figure 2E). Depletion of GSK3β by lentiviral shRNA downregulated P53 in OVCAR-8 while upregulated P53 in A2780 cells (Figure 2F). In addition, enforced GSK3β expression led to P53 upregulation in OVCAR-8 cells (Figure 2G). Reversely, using a specific GSK3β inhibitor (TWS-119) for treatment, P53 amounts were increased in A2780 and ES-2 cells while decreased in OVCAR-8 and Kuramochi cells (Figure 2H). Interestingly, ATG and TWS-119 counteracted each other in P53 regulation (Figure 2I). Taken together, our data strongly built the critical role of GSK3β in P53 regulation across OC cell lines.
3.3. DNA Damage Caused by Inhibition of GSK3β Leads to Upregulation of P53
With regard to GSK3β-mediated P53 regulation, although previous studies have identified some mechanisms [22,24], the inverse P53 expression changes caused by GSK3β showed the effects of GSK3β on P53 regulation were cell type-dependent. DNA damage was a major source of P53 activation, which employed ATM/ATR kinases for P53 activation [25]. Importantly, GSK3β also played a role in DNA damage repair (DDR) pathway [26]. Thus, we wondered whether GSK3β-mediated P53 upregulation related to DNA damage. γH2A, a biomarker of DNA damage, was measured by immunofluorescence analysis. Treatment of TWS-119 exacerbated DNA damage in four OC cell lines, which was evidenced by increased γH2AX-positive cell rates (Figure 3A and C). Depletion of endogenous GSK3β also induced DNA damages in A2780 and OVCAR-8 cells (Figure 3B and D). Gene set enrichment analysis (GSEA) showed TWS-119 treatment impoverished relevant DNA repair-related biological processes, including “Homologous recombination (HR)” and “Regulation of response to DNA damage” (Figure 3E) in A2780 cells. Heatmap showed the differentiated expressions of genes relative to HR signaling pathway (Supplementary Figure S1A). Furthermore, the upregulation of P53 caused by TWS-119 treatment was completely blocked by KU-55933, an ATM kinases inhibitor, in A2780 and ES-2 cells, which supported the GSK3β-mediated P53 upregulation was caused by DNA damage (Figure 3G).
3.4. P53 Alleviated DNA Damage Induced by GSK3β Inhibition
Since P53 was selectively upregulated in two HRP OC cells upon GSK3β inhibition, we wondered whether the P53 activity could alleviate DNA damages in these cells. Base on KEGG and GO term analysis data, two P53 activity-related signaling pathways were enriched, “P53 signaling” and “DNA damage response pathways by P53 class mediate” (Figure 4A). Three overlapped genes (MDM2, PIDD1 and CDKN1A) between these two signaling pathways were identified (Figure 4B). By RT-qPCR, we confirmed P53, CDKN1A and PIDD1 were upregulated in A2780 cells. However, no genes except P53 was upregulated in ES-2 cells (Figure 4D and E). The result in ES-2 cells might be due to the dominant-negative effect of mutant p53 in ES-2 cells which failed to upregulate its target genes. To test whether P53 activity protected cells from DNA damage, we used Pifithrin-α, an inhibitor of P53-DNA binding, to inhibit P53 activity. We confirmed it exacerbated DNA damage induced by TWS-119 in both A2780 and ES-2 cells (Figure 4C). This data indicated either wtP53 or mtP53 could alleviate DNA damage and suggested the transcriptional activity of P53 was not indispensable for its DNA damage repair activity. A previous study showed recruitment of P53 to the DNA damage sites was essential for DNA damage repair [27]. We also confirmed the colocalization of P53 and DNA damage sites in both A2780 and ES-2 cells following TWS-119 treatment (Figure 4F). The data showed upregulation of P53 activity in OC cells helped to alleviate DNA damage.
3.5. GSK3β Inhibition Triggers Aurora A/PLK1 Axis
To seek for the mechanism of GSK3β-mediated P53 regulation in OVCAR-8 cells, dual issues need to be addressed. First, why GSK3β inhibition-induced DNA damage could not upregulate P53 as in A2780 cells. We tested the P53 response to DNA damage using exogenous DNA damage-inducing agents. As shown in Supplementary (Supplementary Figure S1B), both Etoposide and Bleomycin induced DNA damage in OVCAR-8 cells, accompanied by upregulation of P53, indicating P53 could response to DNA damage in OVCAR-8 cells although less sensitive than A2780 cells. A marked biological function of GSK3β is inducing cell arrest at G2/M phase [28]; some cell cycle regulators which promote G2/M phase entry also regulate DDR, such as Aurora A (Aur-A) and Polo-like kinase 1 (PLK1) [29]. We then tested whether GSK3β-mediated P53 regulation was cell cycle-dependent. First, we validated TWS-119 treatment significantly arrested A2780 and OVCAR-8 cells at G2/M phase (Figure 5A). Then we tested the effects of Aur-A and PLK1 on P53 expression by specific inhibitors (Alisertib for Aur-A, GSK461364 for PLK1). P53 was increased by Alisertib, while decreased by GSK461364 (Figure 5B). This data was in line with previous findings that P53 was degraded by Aur-A [30] and destabilized by PLK1 [31] and also demonstrated G2/M phase arrest did not necessarily lead to P53 downregulation. It is noteworthy that GSK3β, Aur-A and PLK1 interact with each other. GSK3β targets Aur-A for degradation [32] and Aur-A is essential for PLK1 activation [33], thus GSK3β possibly relates to PLK1 activity via Aur-A. As shown in Figure 5C, In OVCAR-8 cells, inhibition of GSK3β by TWS-119 increased Aur-A while activation of GSK3β by ATG decreased Aur-A. MG132 treatment blocked Aur-A decrease by ATG, further supporting the degradation of Aur-A by GSK3β was proteasome-dependent (Figure 5D). Consistently, PLK1, which was activated by Aur-A, was promoted and inhibited by TWS-119 and ATG respectively (Figure 5E). Similar to OVCAR-8, chemical inhibition of GSK3β increased Aur-A and activated PLK1 in A2780 cells (Figure 5F). Inhibition of GSK3β also led to PLK1 activation in Kuramochi and ES-2 cells (Supplementary Figure S1C). In OVCAR-8 cells, the PLK1 activation induced by GSK3β inhibition was completely blocked by Aur-A inhibition, indicating GSK3β activated PLK1 via Aur-A. These data collectively established a functional GSK3β/Aur-A/PLK1 axis in OC cells (Figure 5G). To note, inhibition of Aur A by Alisertib could not reverse the P53 downregulation caused by TWS-119 at all, putting GSK3β in the first place of GSK3β/Aur-A/PLK1 axis for P53 regulation. (Figure 5G). For comparison, we found both Aur-A and PLK1 inhibition increased P53 in A2780 cells, which indicated the GSK3β/Aur-A/PLK1 axis differently shaped P53 expressions among OC cells. (Figure 5G). In addition, based on human primary OV cells data, GSK3β positively correlates with P53 at mRNA level, suggesting the regulation of P53 by GSK3β is dominantly positive (Supplementary Figure S1D).
3.6. Double Inhibition of GSK3-β and PLK1 Synergistically Exacerbates DNA Damage and Induces Cell Apoptosis
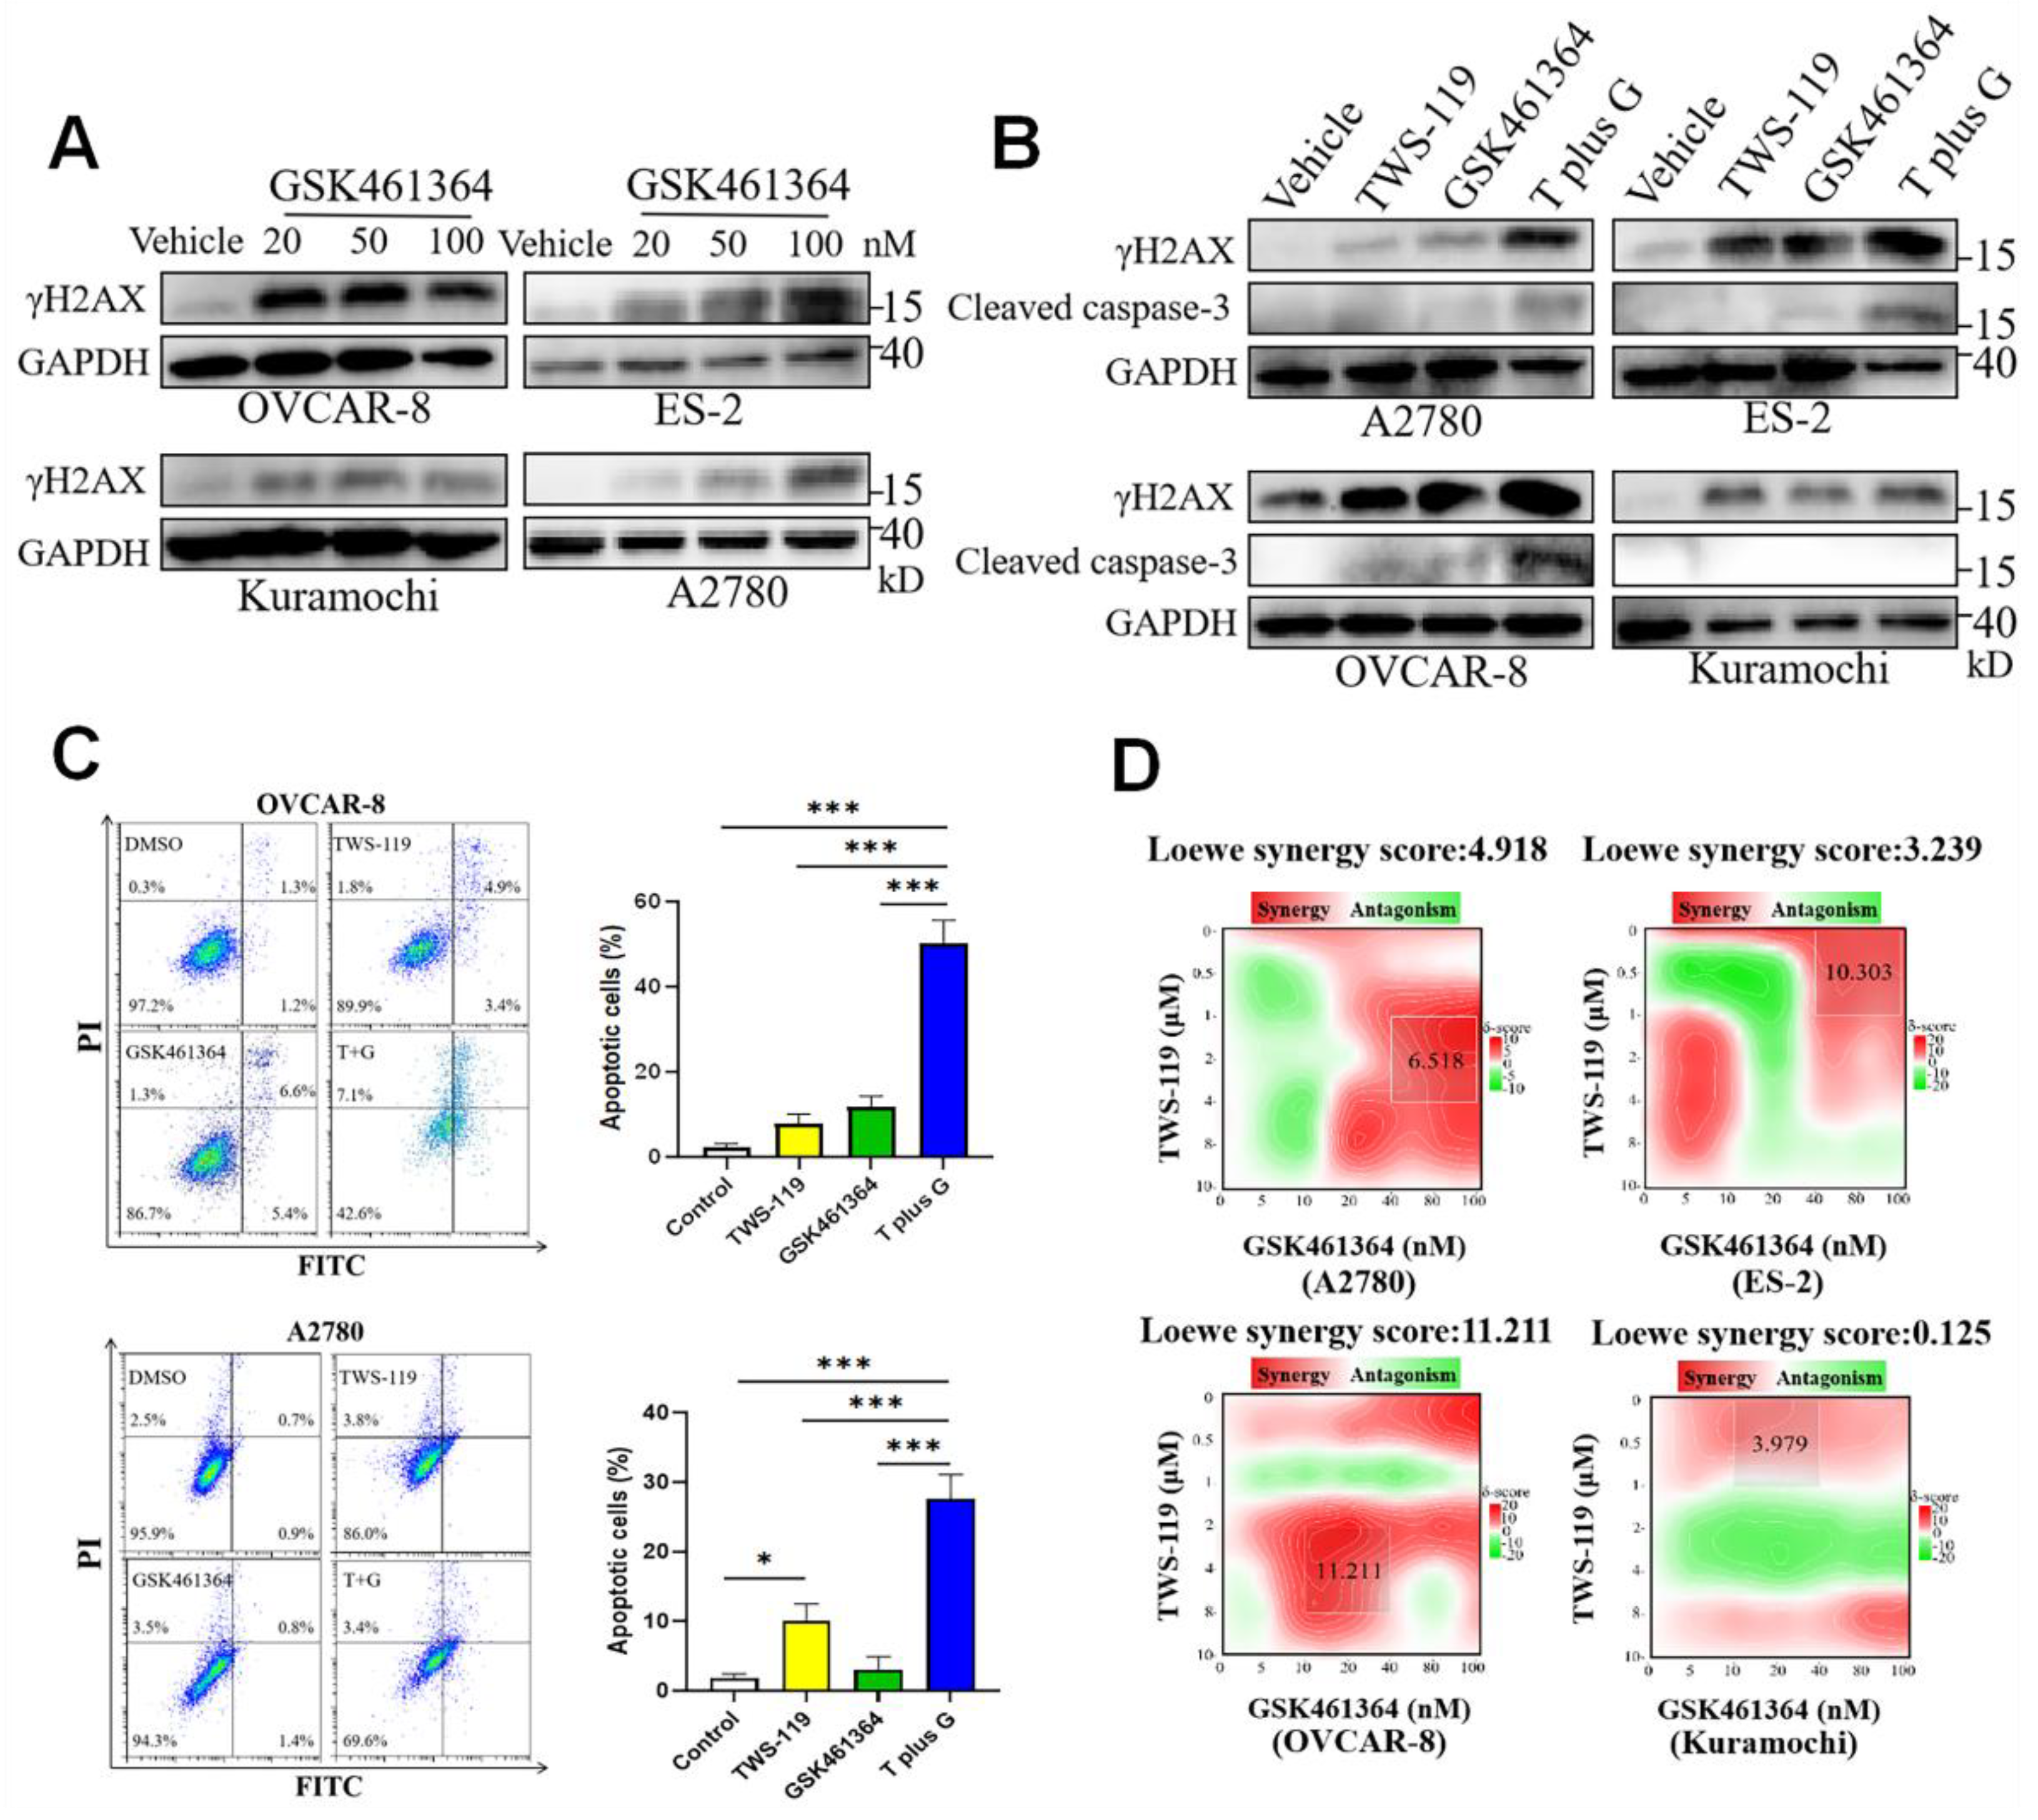
PLK1 has recently emerged as a key factor involved in DDR pathway [34]. We confirmed PLK1 inhibition induced DNA damages in four OC cell lines (Figure 6A). As GSK3-β inhibition caused DNA damage and led to PLK1 activation, it made sense that PLK1 might serve as a compensation for repairing the impaired DDR pathway and maintaining DNA integrity. Consistent with our expectation, combination of PLK1 and GSK-β inhibitors induced more severe DNA damage than either drug alone, and higher level of DNA lesion was accompanied by increased cell apoptosis in all cell lines except Kuramochi, which was evidenced by the expression of cleaved-caspase 3, a molecular mark of apoptosis (Figure 6B). The Annexin/PI double staining assay also showed double inhibition of PLK1 and GSKβ induced more cell apoptosis than either alone (Figure 6C). To test the drug synergy between inhibitors of PLK1 and GSKβ, a panel of combinations of PLK1 and GSK-β inhibitors with indicated concentration were used to treat OC cells. Synergetic effects were validated in all cell lines except Kuramochi (Figure 6D).
4. Discussion
In this study, we tried to explain the differentiated regulation of P53 by ATG in OC cells and revealed the vital role of GSK3β in P53 regulation. We focused on P53 because it had broad roles in OC malignancy and gained enduring attentions on target therapy grounded in it [7]. Initially, we studied the P53 expression profiles in OC cells following ATG treatment and found the inverse effects of GSK3β on P53 regulation. To explore the underlying mechanisms, we put forward some hypotheses and obtained some findings. Importantly, we confirmed GSK3β inhibition induced DNA damages in all OC cells (Figure 3A and B). Comparative transcriptomics between control and TWS-119-treated groups in A2780 cells showed HR pathway was significantly impaired by GSK3β inhibition (Figure 3F). Errors during DNA replication frequently causes endogenous DNA damages giving rise to double-strand break (DSB) which requires HR pathway for high-fidelity repair [35]. Therefore, the impaired HR pathway by GSK3β could impede repairing for DSB and inevitably increased DNA damage. Ataxia telangiectasia mutated (ATM) responses to DSB repair and activates downstream P53 signaling [36]. A specific ATM kinase inhibitor completely blocked the upregulated P53 by GSK3β inhibition in both A2780 and ES-2 cells (Figure 3G), demonstrating the GSK3β-mediated P53 upregulation pertained to DDR pathway.
For OVCAR-8 and Kuramochi cells, it was surprising that although DNA damages were markedly induced following GSK3β inhibition, P53 was downregulated (Figure 1E and F). P53 activity had a role in protection against DNA damage, as shown in A2780 and ES-2 cells (Figure 4C). To test whether P53 failed to response to DNA damage in OVCAR-8 cells, we used some exogenous DNA damage-inducing agents for treating cells. P53 responses to these agents in OVCAR-8 cells were markedly less sensitive than A2780 cells (Supplementary Fig. S1B), indicating the DNA damage-mediated P53 signaling was faint but still alive in OVCAR-8 cells. However, facing the DNA damage caused by GSK3β inhibition, OVCAR-8 and Kuramochi cells decided to downregulate P53 expression and the underlying biological significance remains to be investigated. Here, we validate GSK3β have dual effects on P53 regulation and the correlation between GSK3β and P53 could be either positive or negative. In human primary OV cells, GSK3β and P53 are positively correlated, suggesting the positive regulation of P53 by GSK3β is dominant in human primary OV cells (Supplementary Fig. S1D). Regretfully, our efforts failed to disclosed the mechanism underlying the GSK3β-mediated P53 downregulation. In this sense, our work could be defined as more descriptive than explanative. Nevertheless, our study generated some interesting and valuable findings. we identified the GSK3β/Aur-A/PLK1 axis functioning in DDR pathway, which was previously unreported, to best of our knowledge. Double inhibition of GSK3β and PLK1 cooperatively induce DNA damage and cell apoptosis in some OC cells, which provided a novel therapy strategy for OC. As drug synergy effect was not evident in Kuramochi cells, one explanation is Kuramochi cells proliferates more slowly than other OC cells (data not shown). As fast DNA replication inevitably brings about DNA damage [37], cells of low proliferation rate could have more opportunity for dealing with DNA damage thus reducing its accumulation.
Targeting GSK3β for OC therapy has been intensively studied and some inhibitors specific to GSK3β were applied for clinical studies [11]. However, the role of GSK3β in OV development aroused a controversy and some researchers believed activation of GSK3β helped to impede OV progress [11]. This disagreement revealed that for better use of GSK3β inhibitors for OC treatment, its overall effects should be comprehensively considered. Our findings demonstrated activated PLK1 was activated upon GSK3β suppression. Considering PLK1 is overexpressed and associated with poor prognosis in many cancers [38], double inhibition of GSK3β and PLK1 could be reasonable if their in-vivo drug toxicities were tolerable. Moreover, given the GOF function of some mtP53s in OC progress such as R172H and R248 [39,40] and a majority of OC samples were determined as P53-mutant [7], to lower down mtP53 level in OC cells by GSK3β might have benefits for therapy. Taken together, our study favored the GSK3β inhibitor for OV therapy and highlighted the GSK3β/Aur-A/PLK1 axis in DDR pathway. We believe double inhibition of GSK3β and PLK1 could be a promising therapeutic intervention for OC and plan to validate its in-vivo anti-tumor effect in future.
5. Conclusions
The GSK3β-mediated P53 protein expression regulation in OC cells is cell type-dependent. GSK3β is both involved in HR signaling pathway for DNA damage protection and P53 expression regulation in OC cells. The up-regulated P53 following GSK3β inhibition alleviates DNA damage in some HRP OC cells. Moreover, GSK3β inhibition activates Aurora A/PLK1 axis, which contributes to DNA damage repair. Double inhibition of GSK3β and PLK1 synergistically induce DNA damage and cell apoptosis in OC cells.
Author Contributions
Conceptualization, G.-M.W. and L.-J.C.; Writing–original draft, G.-M.W. and T.-Y.L.; Investigation, G.-M.W., L.G. and L.-J.C..; Formal analysis, L.-Y.L. and J.L; writing—review and editing, J.L. and L.-J.C.; Validation: T.-Y.L. and L.-Y.L; Funding acquisition, G.-M.W., L.G. and L.-J.C. All authors have read and agreed to the published version of the manuscript.
Funding
This work was jointly funded by Scientific Startup Foundation of Introducing Talent of Fujian University of Traditional Chinese Medicine (grant no. X2021005-Talent), Fujian Provincial Natural Science Foundation Project (grant no. 2021J01131577), The Science and Technology Plan Project of the Fujian Provincial Health Commission, (grant no. 2021zylc27), Fujian Provincial Natural Science Foundation Project (grant no. 2024J011075) and Clinical Research Center for Precision Treatment of Gynecological Malignancies of Fujian Province (grant no. 2022Y2015).
Institutional Review Board Statement
Not applicable.
Informed Consent Statement
Not applicable.
Data Availability Statement
The raw data used and analyzed during the current study are available from the corresponding author on reasonable request.
Conflicts of Interest
No competing interests declared.
References
- Webb, P.M.; Jordan, S.J. Global epidemiology of epithelial ovarian cancer. Nat Rev Clin Oncol 2024, 21, 389–400. [Google Scholar] [CrossRef]
- Huang, J.; Chan, W.C.; Ngai, C.H.; Lok, V.; Zhang, L.; Lucero-Prisno, D.E.; Xu, W.; Zheng, Z.; Elcarte, E.; Withers, M. , et al. Worldwide Burden, Risk Factors, and Temporal Trends of Ovarian Cancer: A Global Study. Cancers 2022, 14, 2230. [Google Scholar] [CrossRef]
- Integrated genomic analyses of ovarian carcinoma. Nature 2011, 474, 609–615. [CrossRef] [PubMed]
- Kim, M.P.; Lozano, G. Mutant p53 partners in crime. Cell Death Differ 2018, 25, 161–168. [Google Scholar] [CrossRef] [PubMed]
- Mohell, N.; Alfredsson, J.; Fransson, Å.; Uustalu, M.; Byström, S.; Gullbo, J.; Hallberg, A.; Bykov, V.J.N.; Björklund, U.; Wiman, K.G. APR-246 overcomes resistance to cisplatin and doxorubicin in ovarian cancer cells. Cell Death Dis 2015, 6, e1794. [Google Scholar] [CrossRef]
- Raab, M.; Kostova, I.; Peña Llopis, S.; Fietz, D.; Kressin, M.; Aberoumandi, S.M.; Ullrich, E.; Becker, S.; Sanhaji, M.; Strebhardt, K. Rescue of p53 functions by in vitro-transcribed mRNA impedes the growth of high-grade serous ovarian cancer. Cancer Communications 2024, 44, 101–126. [Google Scholar] [CrossRef] [PubMed]
- Wallis, B.; Bowman, K.R.; Lu, P.; Lim, C.S. The Challenges and Prospects of p53-Based Therapies in Ovarian Cancer. Biomolecules 2023, 13, 159. [Google Scholar] [CrossRef]
- He, Y.; Fan, Q.; Cai, T.; Huang, W.; Xie, X.; Wen, Y.; Shi, Z. Molecular mechanisms of the action of Arctigenin in cancer. Biomed Pharmacother 2018, 108, 403–407. [Google Scholar] [CrossRef]
- Wang, G.; Ge, L.; Liu, T.; Zheng, Z.; Chen, L. The therapeutic potential of arctigenin against multiple human diseases: A mechanistic review. Phytomedicine 2023, 110, 154647. [Google Scholar] [CrossRef]
- Li, D. GSK-3β as a driving force in ovarian cancer. Cell Res 2006, 16, 609. [Google Scholar] [CrossRef]
- Glibo, M.; Serman, A.; Karin-Kujundzic, V.; Bekavac Vlatkovic, I.; Miskovic, B.; Vranic, S.; Serman, L. The role of glycogen synthase kinase 3 (GSK3) in cancer with emphasis on ovarian cancer development and progression: A comprehensive review. Bosnian J Basic Med 2020, 21, 5–18. [Google Scholar] [CrossRef] [PubMed]
- Domoto, T.; Uehara, M.; Bolidong, D.; Minamoto, T. Glycogen Synthase Kinase 3β in Cancer Biology and Treatment. Cells-Basel 2020, 9, 1388. [Google Scholar] [CrossRef]
- Zhang, N.; Tian, Y.; Zhou, L.; Li, M.; Chen, H.; Song, S.; Huan, X.; Bao, X.; Zhang, A.; Miao, Z. , et al. Glycogen synthase kinase 3β inhibition synergizes with PARP inhibitors through the induction of homologous recombination deficiency in colorectal cancer. Cell Death Dis 2021, 12, 183. [Google Scholar] [CrossRef]
- Zhou, Y.; Liu, F. Coordination of the AMPK, Akt, mTOR, and p53 Pathways under Glucose Starvation. Int J Mol Sci 2022, 23, 14945. [Google Scholar] [CrossRef]
- He, G.; Zhang, Y.; Lee, J.; Zeng, S.X.; Wang, Y.V.; Luo, Z.; Dong, X.C.; Viollet, B.; Wahl, G.M.; Lu, H. AMP-Activated Protein Kinase Induces p53 by Phosphorylating MDMX and Inhibiting Its Activity. Mol Cell Biol 2014, 34, 148–157. [Google Scholar] [CrossRef] [PubMed]
- Gomez, M.K.; Illuzzi, G.; Colomer, C.; Churchman, M.; Hollis, R.L.; O Connor, M.J.; Gourley, C.; Leo, E.; Melton, D.W. Identifying and Overcoming Mechanisms of PARP Inhibitor Resistance in Homologous Recombination Repair-Deficient and Repair-Proficient High Grade Serous Ovarian Cancer Cells. Cancers 2020, 12, 1503. [Google Scholar] [CrossRef]
- Xu, J.; Shen, Y.; Wang, C.; Tang, S.; Hong, S.; Lu, W.; Xie, X.; Cheng, X. Arsenic compound sensitizes homologous recombination proficient ovarian cancer to PARP inhibitors. Cell Death Discovery 2021, 7, 259. [Google Scholar] [CrossRef]
- Siddiqui, A.; Tumiati, M.; Joko, A.; Sandholm, J.; Roering, P.; Aakko, S.; Vainionpää, R.; Kaipio, K.; Huhtinen, K.; Kauppi, L. , et al. Targeting DNA Homologous Repair Proficiency With Concomitant Topoisomerase II and c-Abl Inhibition. Front Oncol 2021, 11, 733700. [Google Scholar] [CrossRef]
- Hsieh, C.; Kuo, P.; Hsu, Y.; Huang, Y.; Tsai, E.; Hsu, Y. Arctigenin, a dietary phytoestrogen, induces apoptosis of estrogen receptor-negative breast cancer cells through the ROS/p38 MAPK pathway and epigenetic regulation. Free Radical Bio Med 2014, 67, 159–170. [Google Scholar] [CrossRef] [PubMed]
- Liu, X.; Wang, J.; Dou, P.; Zhang, X.; Ran, X.; Liu, L.; Dou, D. The Ameliorative Effects of Arctiin and Arctigenin on the Oxidative Injury of Lung Induced by Silica via TLR-4/NLRP3/TGF-β Signaling Pathway. Oxid Med Cell Longev 2021, 2021, 5598980. [Google Scholar] [CrossRef]
- Hermida, M.A.; Dinesh Kumar, J.; Leslie, N.R. GSK3 and its interactions with the PI3K/AKT/mTOR signalling network. Advances in Biological Regulation 2017, 65, 5–15. [Google Scholar] [CrossRef]
- Zhang, M.; Zhang, J.; Chen, X.; Cho, S.; Chen, X. Glycogen synthase kinase 3 promotes p53 mRNA translation via phosphorylation of RNPC1. Gene Dev 2013, 27, 2246–2258. [Google Scholar] [CrossRef]
- Kulikov, R.; Boehme, K.A.; Blattner, C. Glycogen Synthase Kinase 3-Dependent Phosphorylation of Mdm2 Regulates p53 Abundance. Mol Cell Biol 2005, 25, 7170–7180. [Google Scholar] [CrossRef]
- Watcharasit, P.; Bijur, G.N.; Song, L.; Zhu, J.; Chen, X.; Jope, R.S. Glycogen Synthase Kinase-3β (GSK3β) Binds to and Promotes the Actions of p53. J Biol Chem 2003, 278, 48872–48879. [Google Scholar] [CrossRef]
- Thomas, A.F.; Kelly, G.L.; Strasser, A. Of the many cellular responses activated by TP53, which ones are critical for tumour suppression? Cell Death & Differentiation 2022, 29, 961–971. [Google Scholar] [CrossRef]
- Lin, J.; Song, T.; Li, C.; Mao, W. GSK-3β in DNA repair, apoptosis, and resistance of chemotherapy, radiotherapy of cancer. Biochimica et Biophysica Acta (BBA) - Molecular Cell Research 2020, 1867, 118659. [Google Scholar] [CrossRef]
- Wang, Y.; Ho, T.L.F.; Hariharan, A.; Goh, H.C.; Wong, Y.L.; Verkaik, N.S.; Lee, M.Y.; Tam, W.L.; van Gent, D.C.; Venkitaraman, A.R. , et al. Rapid recruitment of p53 to DNA damage sites directs DNA repair choice and integrity. Proceedings of the National Academy of Sciences 2022, 119, e2113233119. [Google Scholar] [CrossRef] [PubMed]
- Yin, Y.; Kizer, N.; Thaker, P.; Chiappinelli, K.; Trinkaus, K.; Goodfellow, P.; Ma, L. Glycogen Synthase Kinase 3β Inhibition as a Therapeutic Approach in the Treatment of Endometrial Cancer. Int J Mol Sci 2013, 14, 16617–16637. [Google Scholar] [CrossRef]
- Huang, A.; Yang, X.; Chung, W.; Dennison, A.R.; Zhou, J. Targeted therapy for hepatocellular carcinoma. Signal Transduction and Targeted Therapy 2020, 5, 146. [Google Scholar] [CrossRef] [PubMed]
- Wu, C.; Yang, T.; Yu, C.R.; Phan, L.; Ivan, C.; Sood, A.K.; Hsu, S.; Lee, M. p53 negatively regulates Aurora A via both transcriptional and posttranslational regulation. Cell Cycle 2012, 11, 3433–3442. [Google Scholar] [CrossRef] [PubMed]
- Dias, S.S.; Hogan, C.; Ochocka, A.; Meek, D.W. Polo-like kinase-1 phosphorylates MDM2 at Ser260 and stimulates MDM2-mediated p53 turnover. Febs Lett 2009, 583, 3543–3548. [Google Scholar] [CrossRef]
- Kwon, Y.; Kim, I.; Wu, D.; Lu, J.; Stock, W.A.; Liu, Y.; Huang, Y.; Kang, H.C.; DelRosario, R.; Jen, K. , et al. Pten Regulates Aurora-A and Cooperates with Fbxw7 in Modulating Radiation-Induced Tumor Development. Mol Cancer Res 2012, 10, 834–844. [Google Scholar] [CrossRef]
- Joukov, V.; De Nicolo, A. Aurora-PLK1 cascades as key signaling modules in the regulation of mitosis. Sci Signal 2018, 11, r4195. [Google Scholar] [CrossRef]
- Peng, B.; Shi, R.; Bian, J.; Li, Y.; Wang, P.; Wang, H.; Liao, J.; Zhu, W.; Xu, X. PARP1 and CHK1 coordinate PLK1 enzymatic activity during the DNA damage response to promote homologous recombination-mediated repair. Nucleic Acids Res 2021, 49, 7554–7570. [Google Scholar] [CrossRef]
- Kimble, M.T.; Sane, A.; Reid, R.J.D.; Johnson, M.J.; Rothstein, R.; Symington, L.S. Repair of replication-dependent double-strand breaks differs between the leading and lagging strands. Mol Cell 2025, 85, 61–77. [Google Scholar] [CrossRef] [PubMed]
- Khamidullina, A.I.; Abramenko, Y.E.; Bruter, A.V.; Tatarskiy, V.V. Key Proteins of Replication Stress Response and Cell Cycle Control as Cancer Therapy Targets. Int J Mol Sci 2024, 25, 1263. [Google Scholar] [CrossRef] [PubMed]
- Pack, L.R.; Daigh, L.H.; Meyer, T. Putting the brakes on the cell cycle: mechanisms of cellular growth arrest. Curr Opin Cell Biol 2019, 60, 106–113. [Google Scholar] [CrossRef]
- Iliaki, S.; Beyaert, R.; Afonina, I.S. Polo-like kinase 1 (PLK1) signaling in cancer and beyond. Biochem Pharmacol 2021, 193, 114747. [Google Scholar] [CrossRef] [PubMed]
- Ren, Y.A.; Mullany, L.K.; Liu, Z.; Herron, A.J.; Wong, K.; Richards, J.S. Mutant p53 Promotes Epithelial Ovarian Cancer by Regulating Tumor Differentiation, Metastasis, and Responsiveness to Steroid Hormones. Cancer Res 2016, 76, 2206–2218. [Google Scholar] [CrossRef]
- Lee, J.; Ahn, J.; Jin Kim, T.; Ho Lee, J.; Choi, J. Mutant p53 promotes ovarian cancer cell adhesion to mesothelial cells via integrin β4 and Akt signals. Sci Rep-Uk 2015, 5, 12642. [Google Scholar] [CrossRef]
Figure 1.
ATG differently shapes P53 protein abundance across OV cell lines. (A) OVCAR-8 and (B) A2780 cells were cultured in DMEM low glucose (1.0g/L) or DMEM high glucose (4.5g/L) and treated by ATG (5-50 μM) for 48 hours, and then cell viability was determined by CCK-8 assay with control group (0 μM ATG, low glucose) normalized as 1. (C) A2780 and OVCAR-8 cells were cultured in DMEM high glucose culture (4.5g/L glucose) and treated by ATG (5-50 μM) for 24 hours. Cell viability was determined by CCK-8 assay with each control groups (0 μM ATG) were normalized as 1. Cell viability was presented as mean ± SEM (n = 3). *, P < 0.05, unpaired Student t test, compared with viability controls. (D) Western blot of P53 in A2780 cells exposed to ATG (5-50 μM) for 24 hours under low and high glucose conditions. (E) Western blot of P53 in OVCAR-8 and HEY cells exposed to ATG for 24 hours. (F) Western blot of P53 in ES-2, OVCAR-3 and Kuramochi cells exposed to ATG for 24 hours.
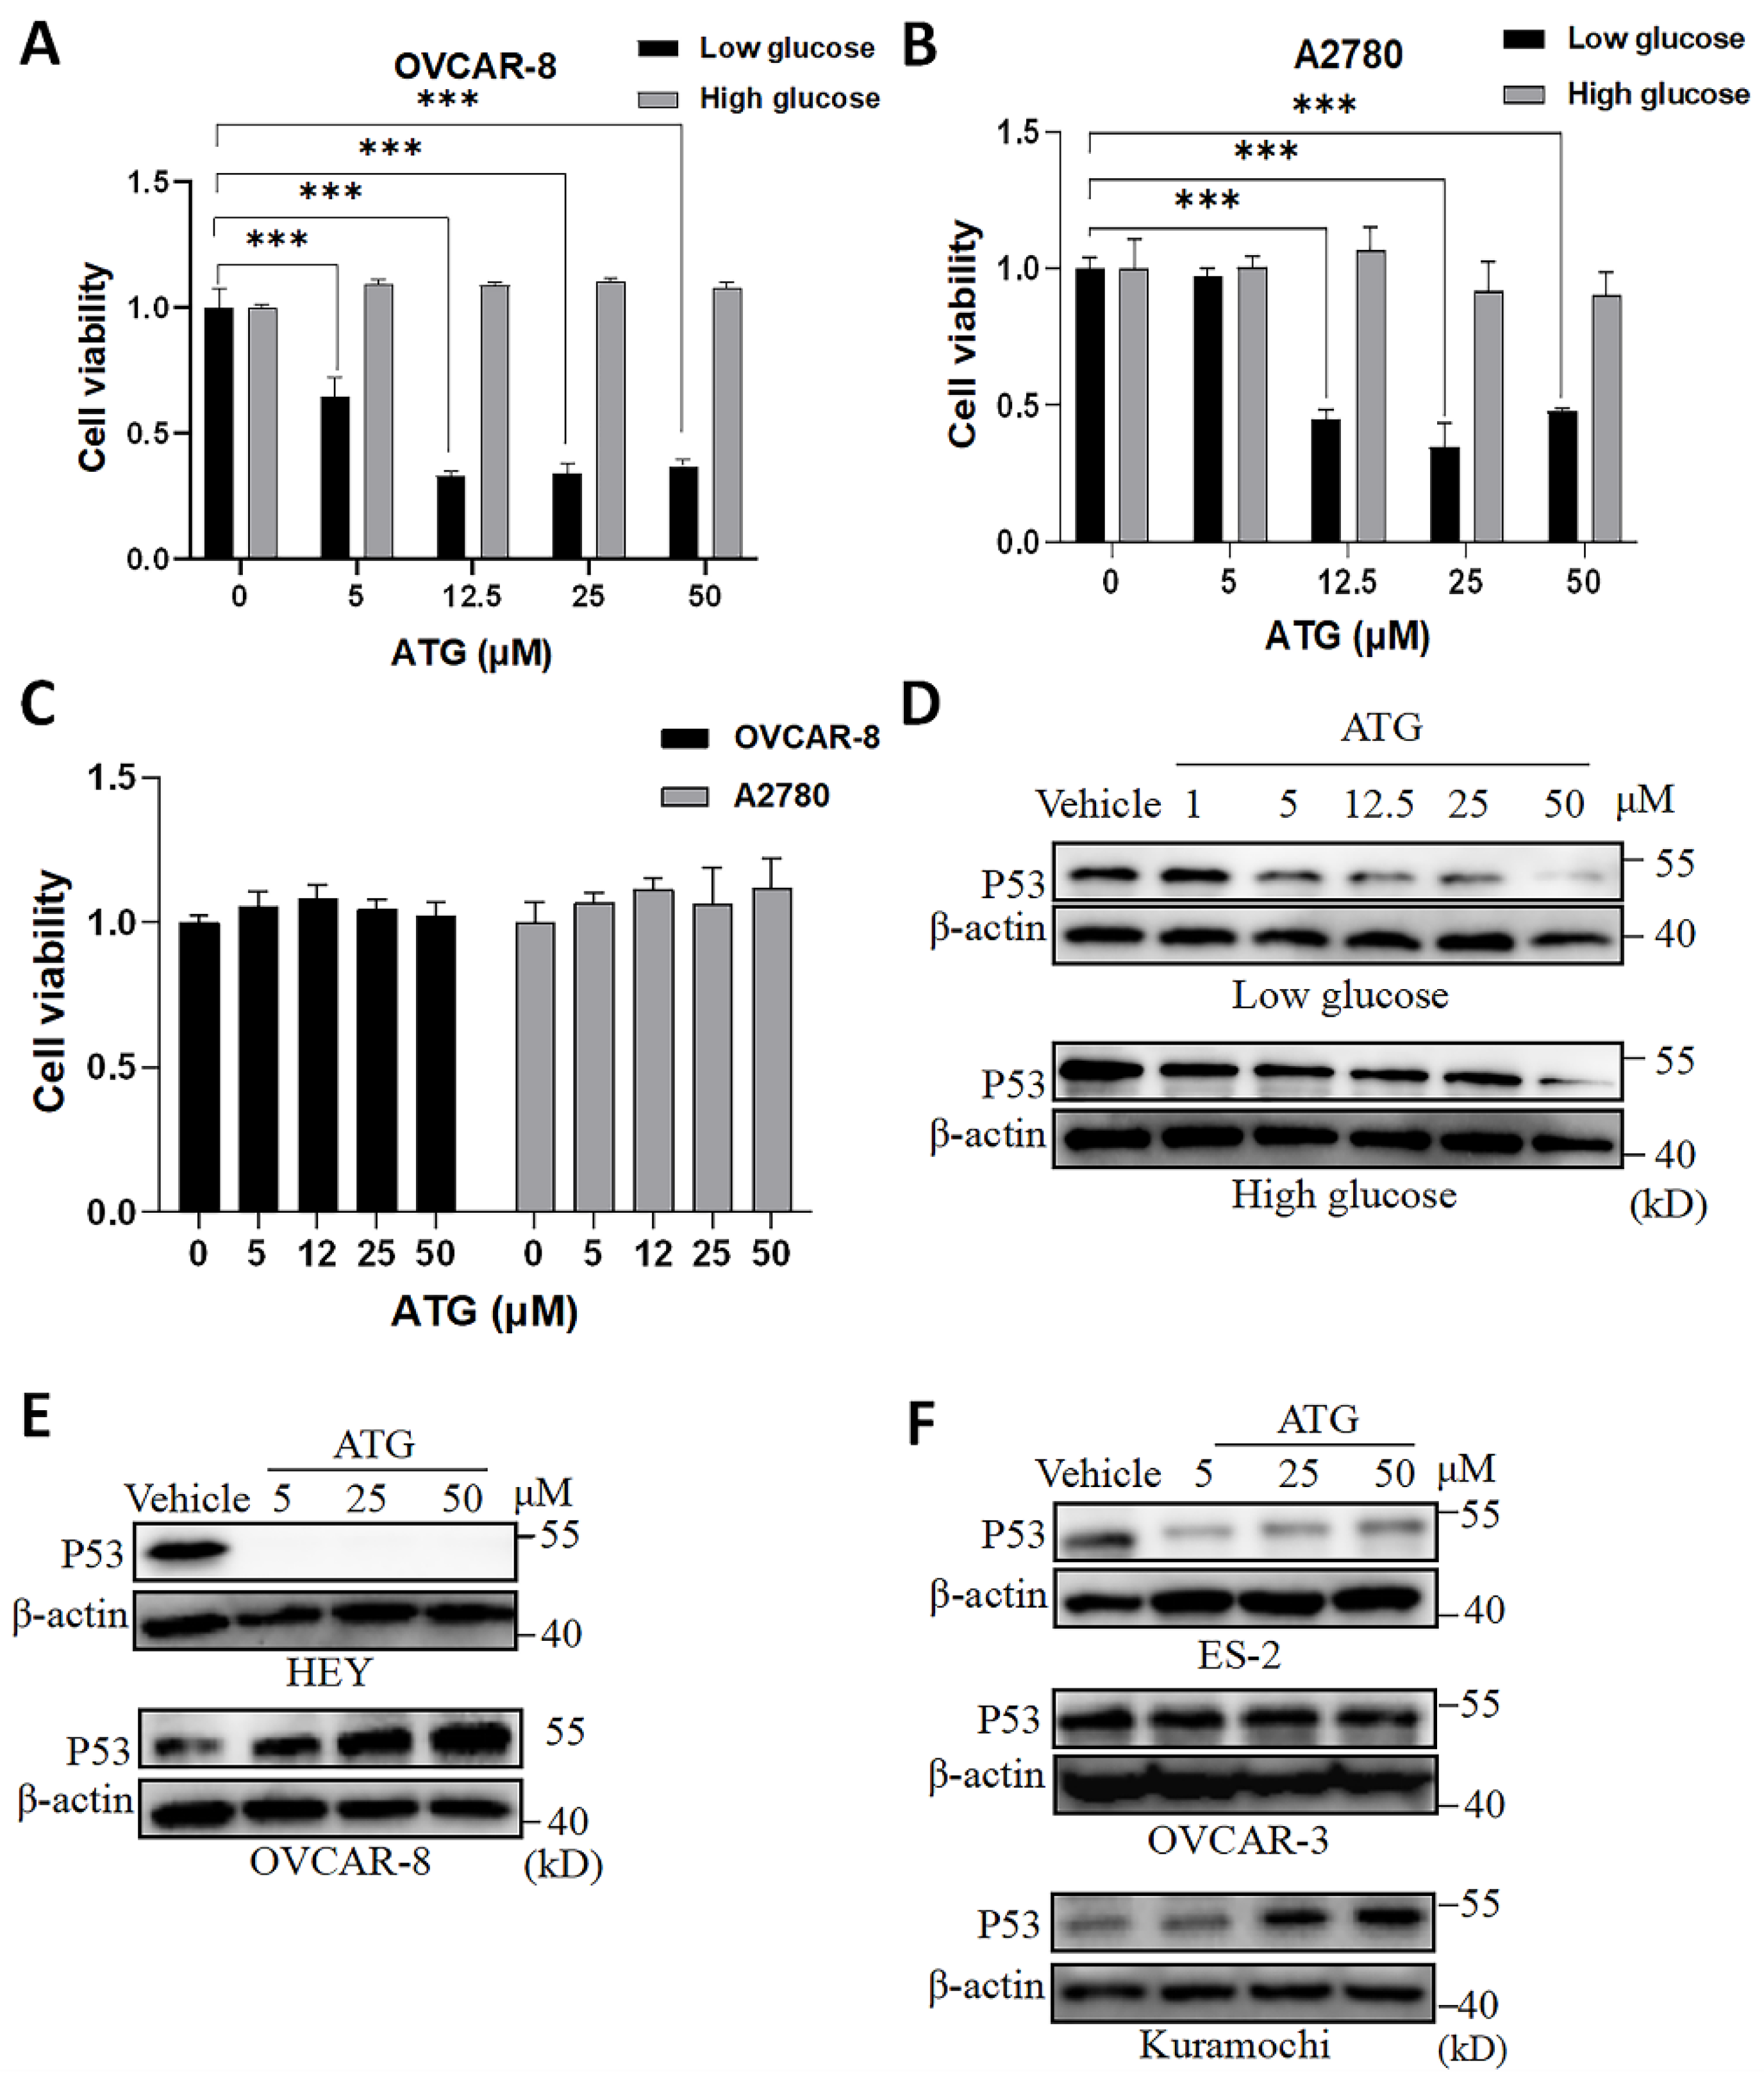
Figure 2.
GSK-3β regulates P53 protein in OV cells. (A) Western blot of P53 in A2780 and HEY cells exposed to ATG (50 μM) for 24 hours. MG132 (10 μM) was supplemented 6 hours prior to cell harvest. (B) A2780 cell were treated by ATG (50 μM) for 24 hours, and then stained by DCFH-DA according to manuscription. ROS level was assessed by flow cytometry. (C)Western blot of phospho-AKT (ser473) and AKT in A2780 after exposure to ATG (5-50 μM) for 24 hours. (D) Western blot of phospho-GSK3β (ser9), GSK3β in OVCAR-8 and A2780 cells exposed to ATG (50 μM). (E) Western blot of P53 and GSK3β in OVCAR-8 and A2780 cells transfected with lentivirus-shCtrl (control shRNA) or shGSK3β (1# and 2#). (F) OVCAR-8 cells (5×10⁵ cells/group) were transfected with vector control or GSK3β-FLAG-expressing vector (0.5-2μg) for 24 hours and then P53, FLAG-GSK3β expressions were detected by western blot. (G) Western blot of P53 in A2780 exposed to MK2206 (1-20 μM) for 24 hous. (H) Western blot of P53 in A2780, ES-2, OVCAR-8 and Kuramochi cells exposed to TWS-119 (5 μM) for 24 hours. (I) Western blot of P53 in A2780 and OVCAR-8 cells exposed to ATG (50 μM), TWS-119 (5 μM) alone or combination of ATG (50 μM) and TWS-119 (5 μM) for 24 hours. A, ATG. T, TWS-119.
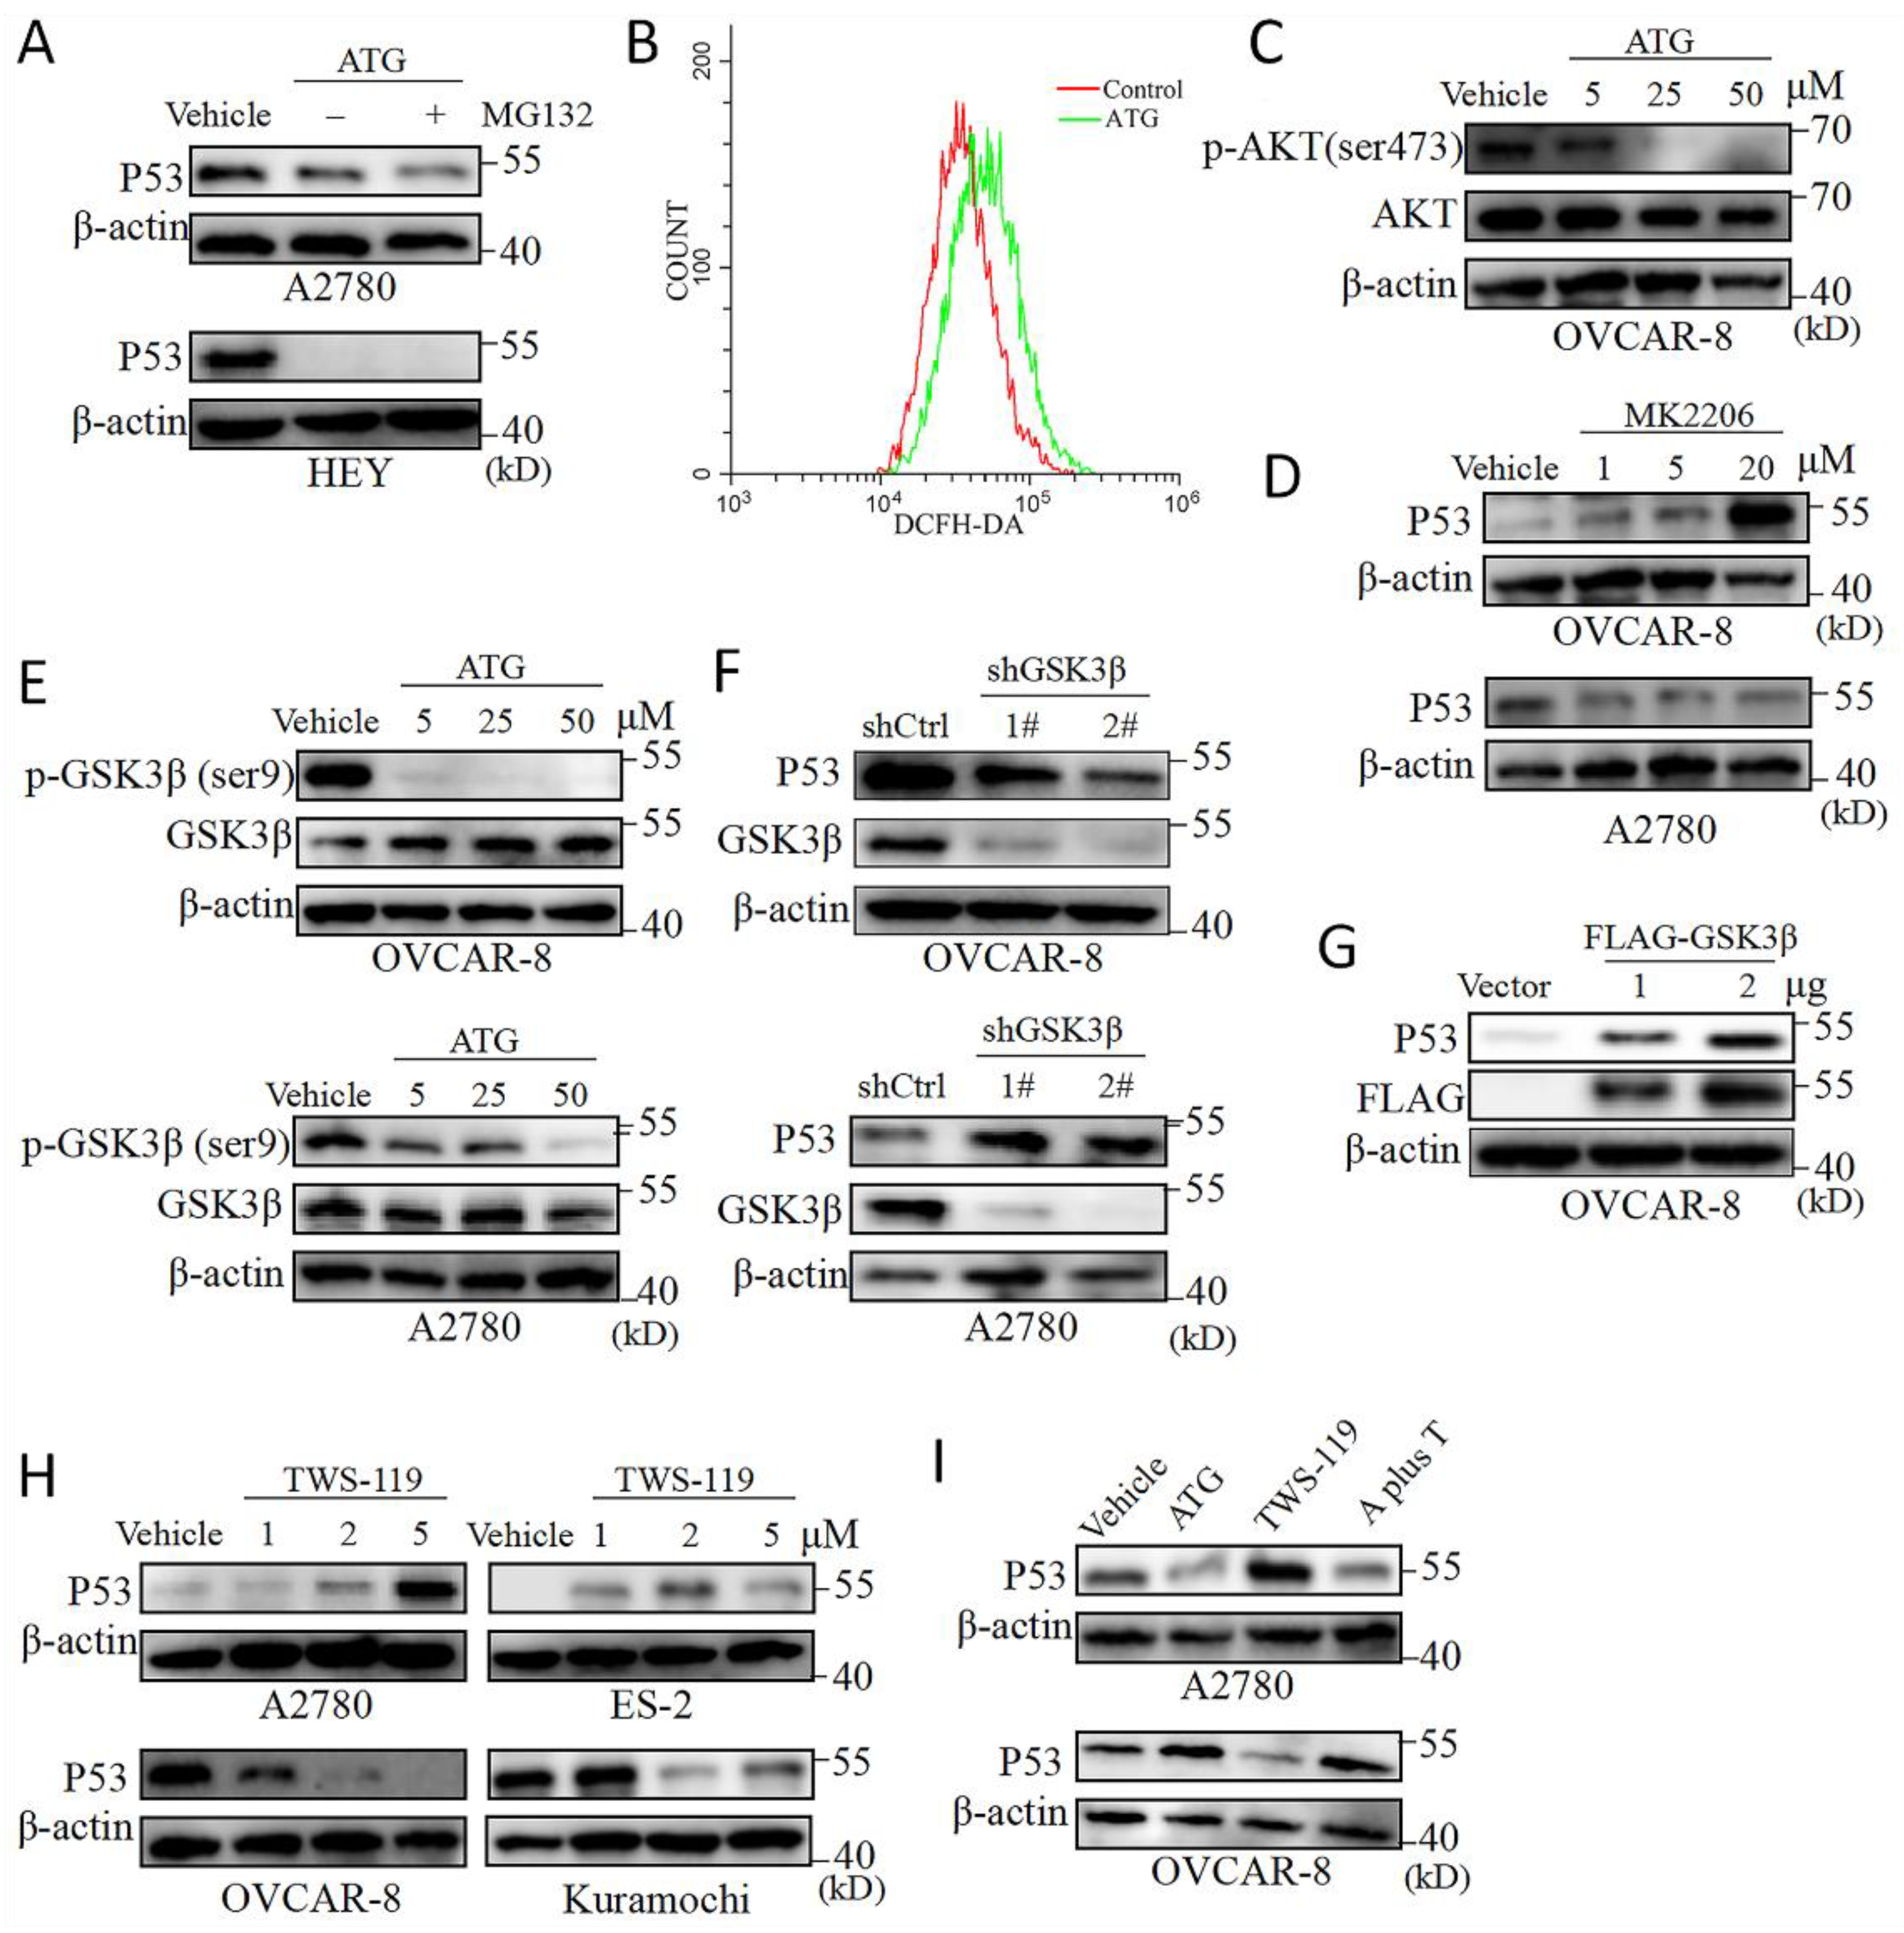
Figure 3.
DNA damage caused by GSK3β inhibition leads to increase P53 expression in A2780 and ES-2 cells. (A) Cells were exposed to DMSO or TWS-119 (5 μM) for 24 hours and then γH2AX foci was visualized by immunofluorescence staining in A2780, ES-2, OVCAR-8, and Kuramochi cells. Scale bar, 100 μM. (B) Comparison of γH2AX expression between GSK3β knockdown and control groups derived from OVCAR-8 and A2780 cells. (C) *P < 0.05; ** P < 0.01 vs. vehicle. n = 3, Mann-Whitney test for A, (D) *P < 0.05; ** P < 0.01 vs. shControl. n = 3, Mann-Whitney test for (B). (E) GSEA of genes related to homologous recombination and regulation of response to DNA damage across genes ranked according to their expression level in A2780 cells treated by TWS-119 (5 μM) for 24 hours vs Vehicle. (F) Western blot of P53 in A2780 and ES-2 cells exposed to DMSO, TWS-119 (5 μM) or TWS-119 (5 μM) plus Ku-55933 for 24 hours.
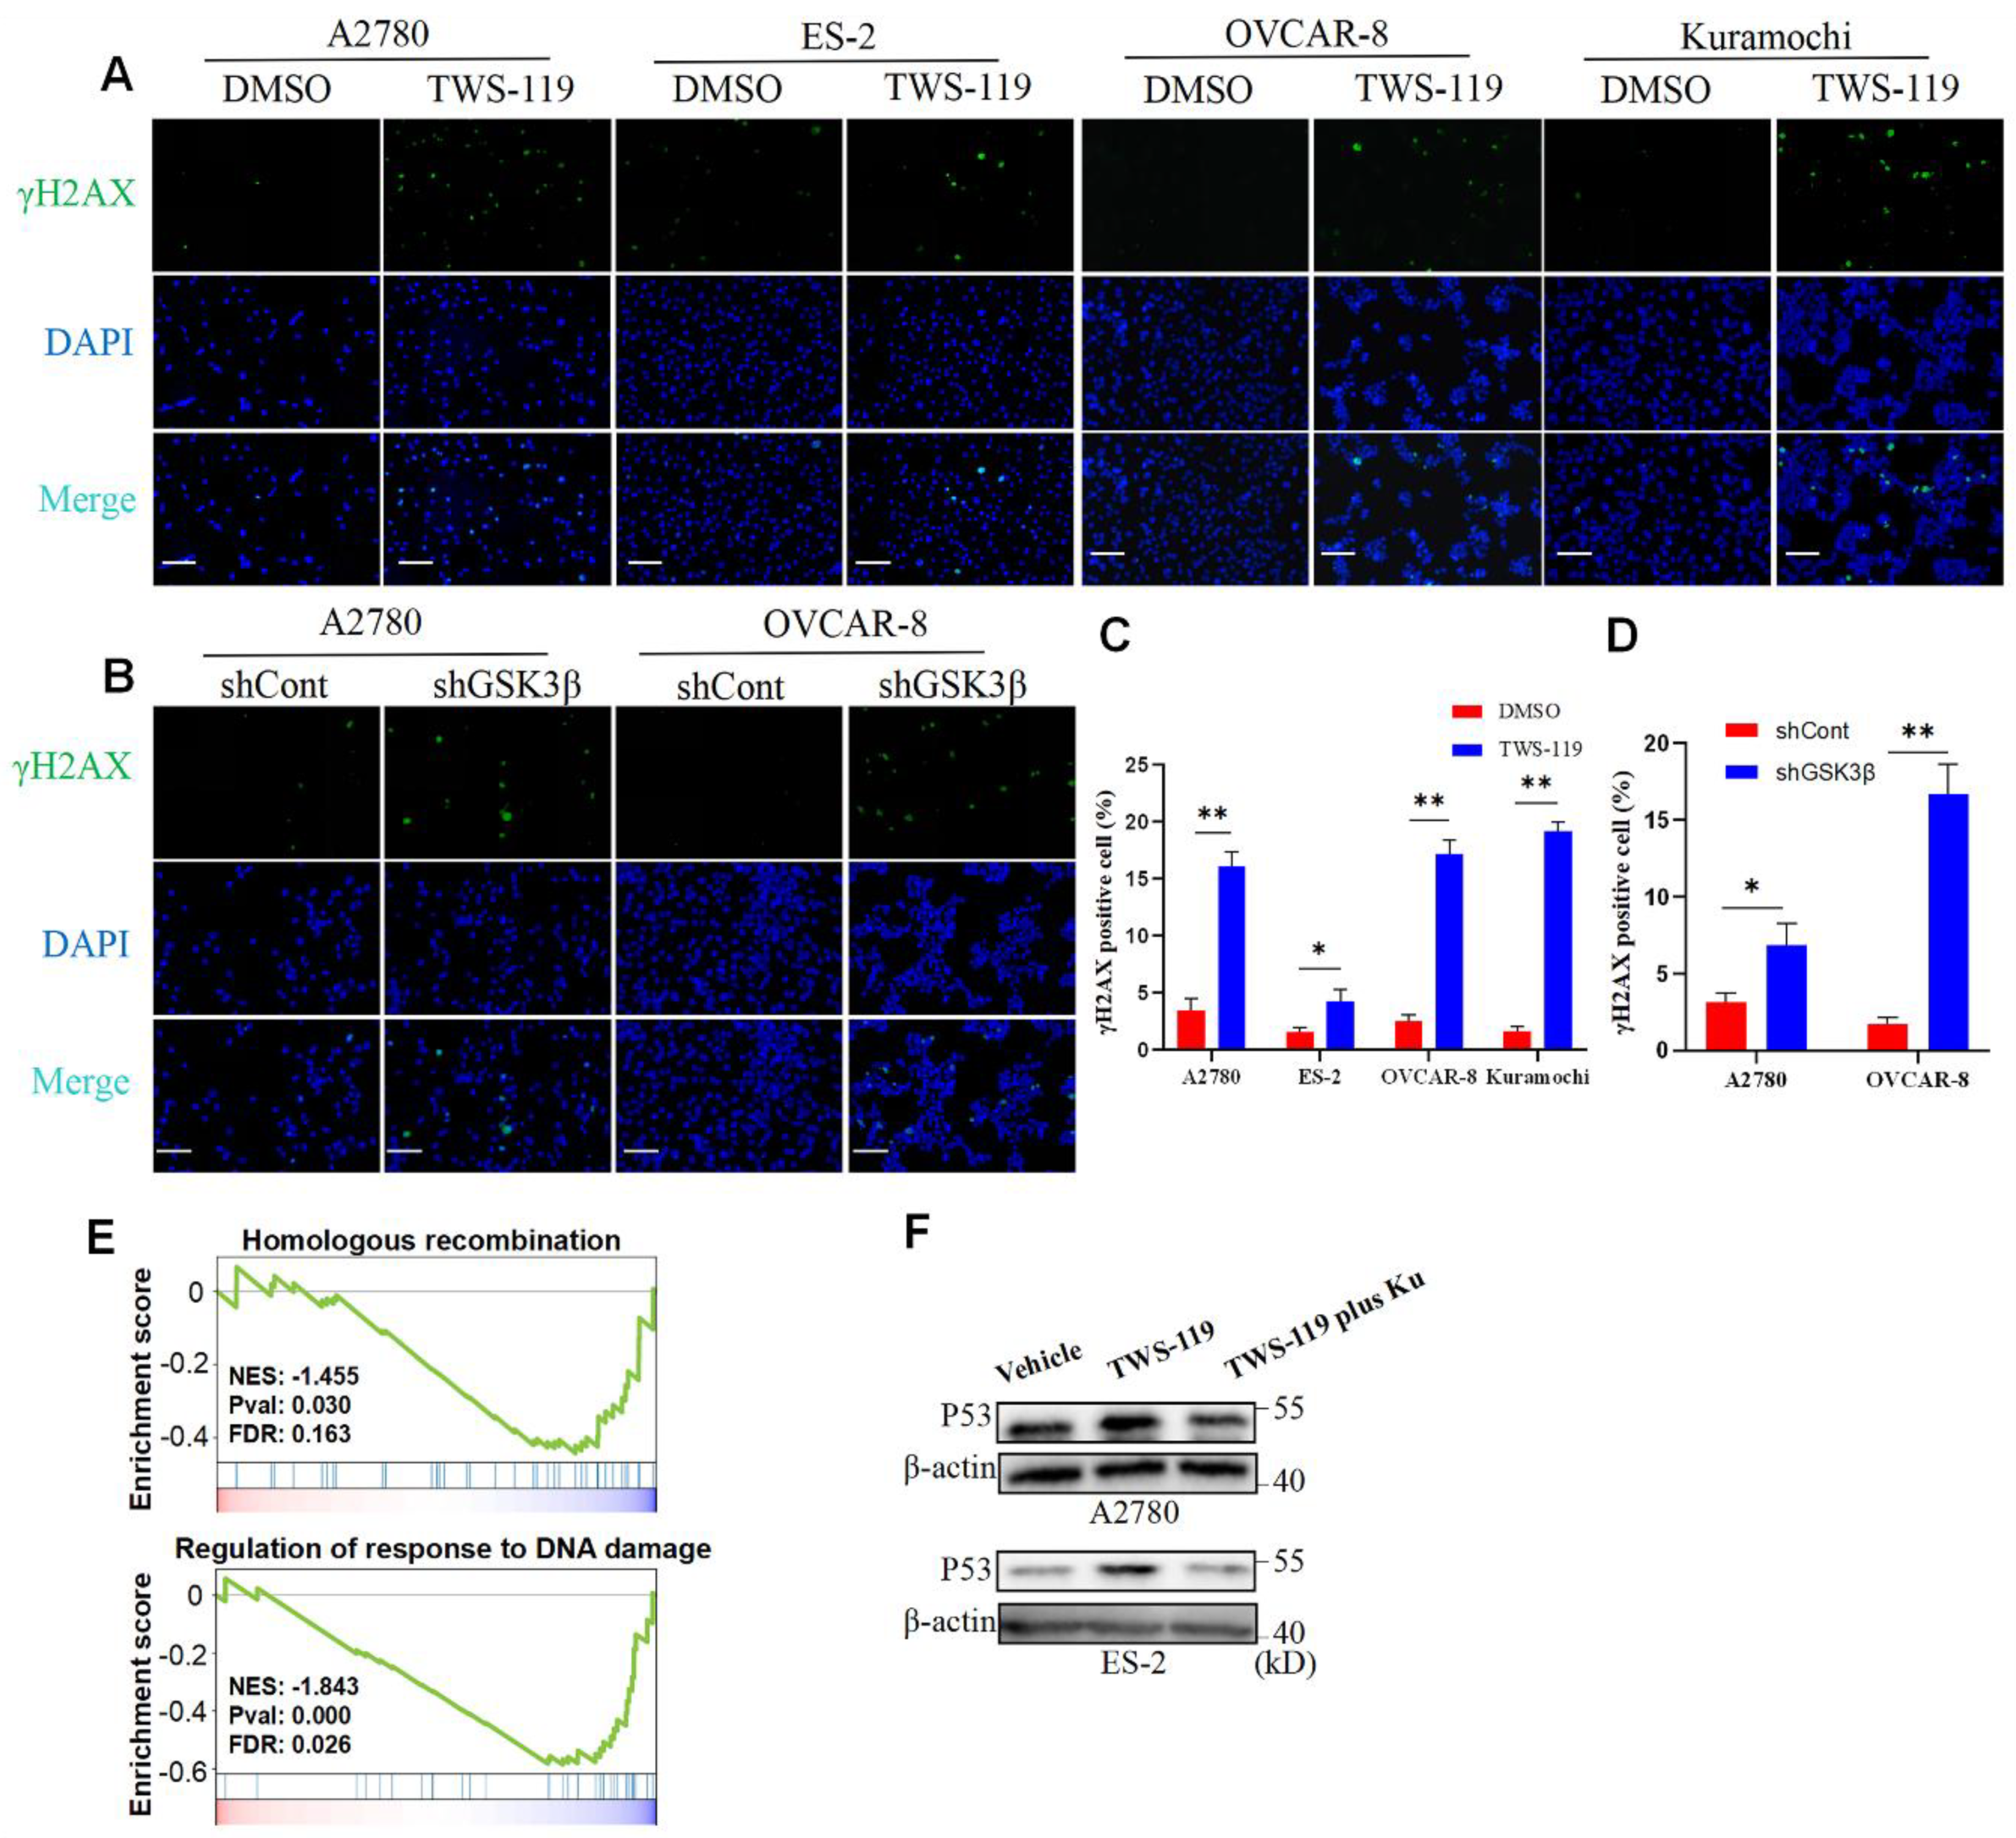
Figure 4.
P53 alleviates DNA damage caused by GSK3β inhibition in A2780 and ES-2 cells. (A) Bubble plot of top 12 items of biological process based on GO analysis of the upregulated genes in TWS-119-treated A2780 cells. (B) Venn diagram of the upregulated genes in TWS-119-treated A2780 cells relating to P53 signaling pathway and biological procession of DNA damage response by P53 class mediate. (C) Western blot of γH2AX in A2780 and ES-2 cells treated by Pifithrin-α (20 μM), TWS-119 (5 μM) or Pifithrin-α combined with TWS-119 for 24 hours. (D) and (E), Effects of TWS-119 on the mRNA levels of P53, MDM2, CDKN1A and PIDD1 in A2780 and ES-2 cells. qRT-PCR assay was performed with each gene in control group normalized as 1. Cells were treated by TWS-119 (5 μM) for 24 hours. Fold changes was presented as mean ± SEM (n = 3). *, P < 0.05, **, P < 0.01, unpaired Student t test, compared with controls. (F) A2780 and ES-2 cells treated by TWS-119 (5 μM) for 24 hours were labeled by DAPI and specific antibodies against P53, γH2AX for confocal microscopy analysis. Scale bar, 10 μM.
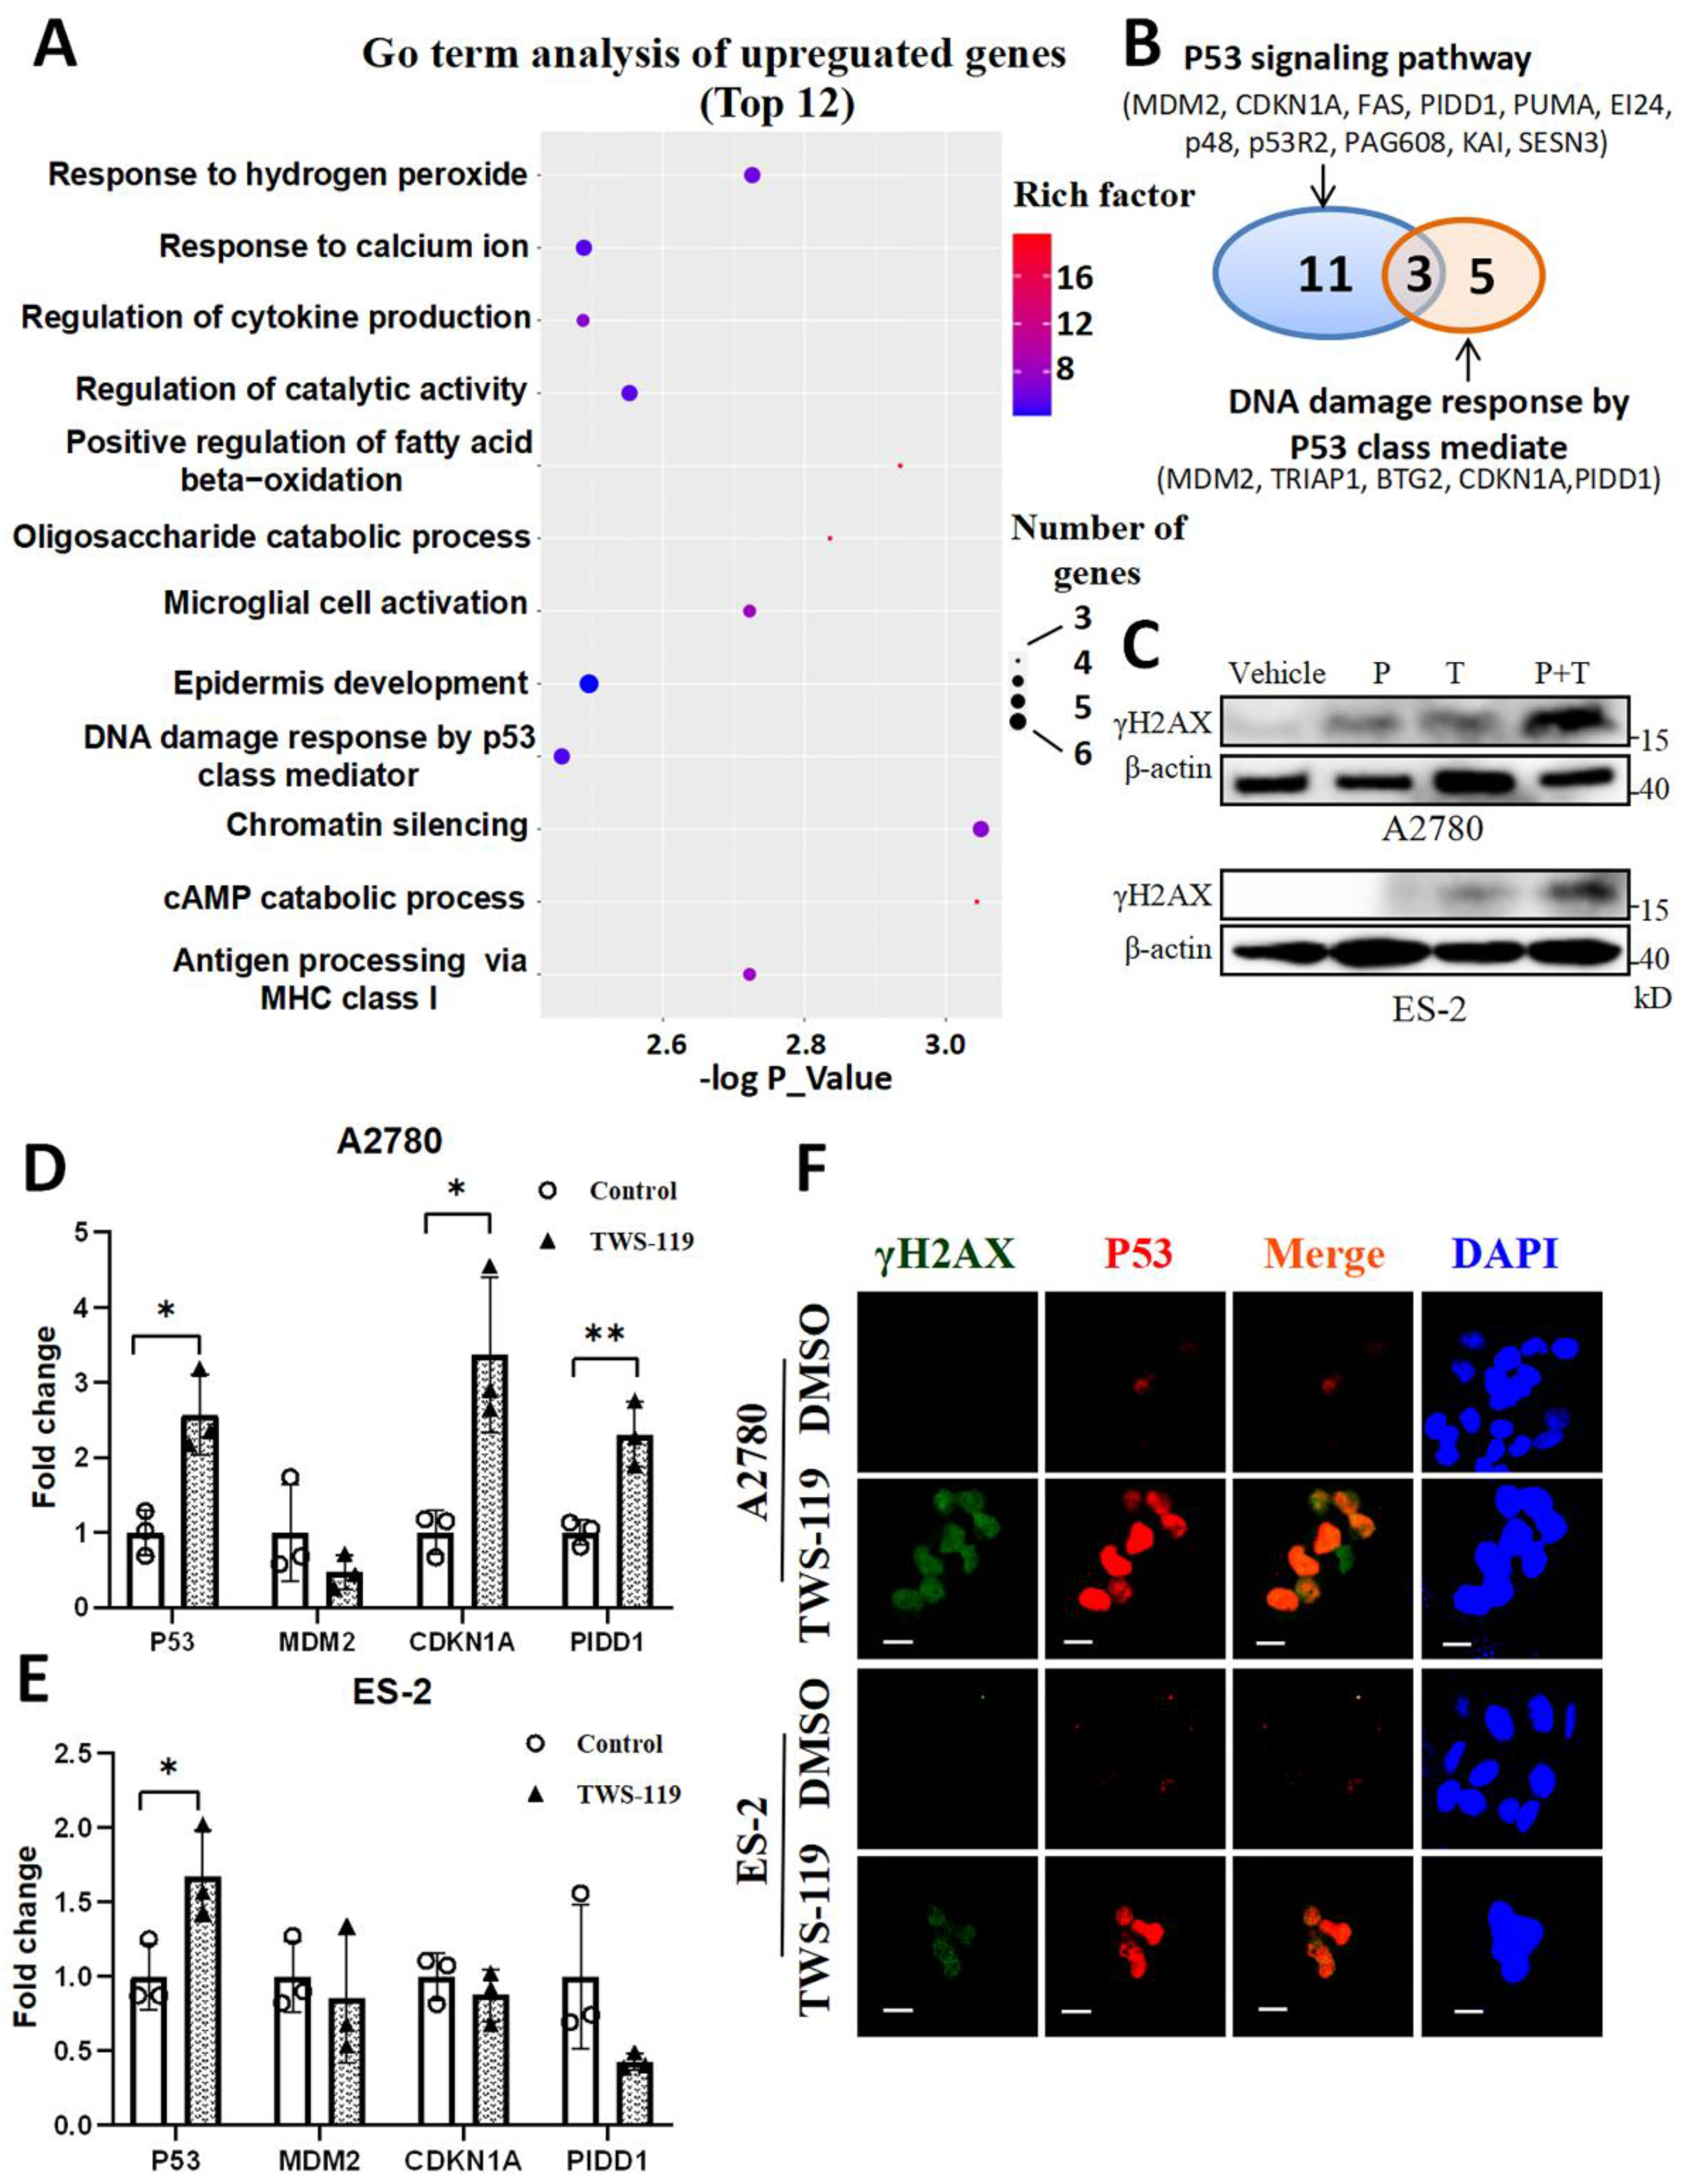
Figure 5.
GSK3β triggers Aurora A/PLK1 axis which regulates P53 expressions in OV cells. (A) OVCAR-5 was treated by TWS-119 (5 μM) or vehicle for 24 hours prior to detection of cell cycle distribution by flowcytometry. Percentages of cells at G1 and G2/M phases was determined by FlowJo software. (B) Western blot of P53 in OVCAR-8 cells exposed to Alisertib (1-5 μM) or GSK461364 (1-5 μM) for 24 hours. (C) Western blot of Aurora A in OVCAR-8 cells exposed to TWS-119 (1-5 μM) or ATG (5-50 μM) for 24 hours. (D) Western blot of Aurora A in OVCAR-8 cells exposed to TWS-119 (5 μM) in the presence or absence of MG132 (10 μM). MG132 was supplemented to cell culture 6 hours prior to cell harvest. (E) Western blot of Phospho-PLK1 (Thr210) and total PLK1 in OVCAR-8 cells exposed to TWS-119 (5 μM) for 24 hours. (F) Western blot of Phospho-PLK1 (Thr210), total PLK1 and P53 in OVCAR-8 cells exposed to TWS-119 (5 μM), Alisertib (5 μM), or TWS-119 combined with Alisertib for 24 hours. (G) Western blot of Phospho-PLK1 (Thr210) and total PLK1 in A2780 cells exposed to TWS-119 (5 μM) for 24 hours. (H) Western blot of P53 in A2780 cells exposed to Alisertib (1-5 μM) or GSK461364 (1-5 μM) for 24 hours.
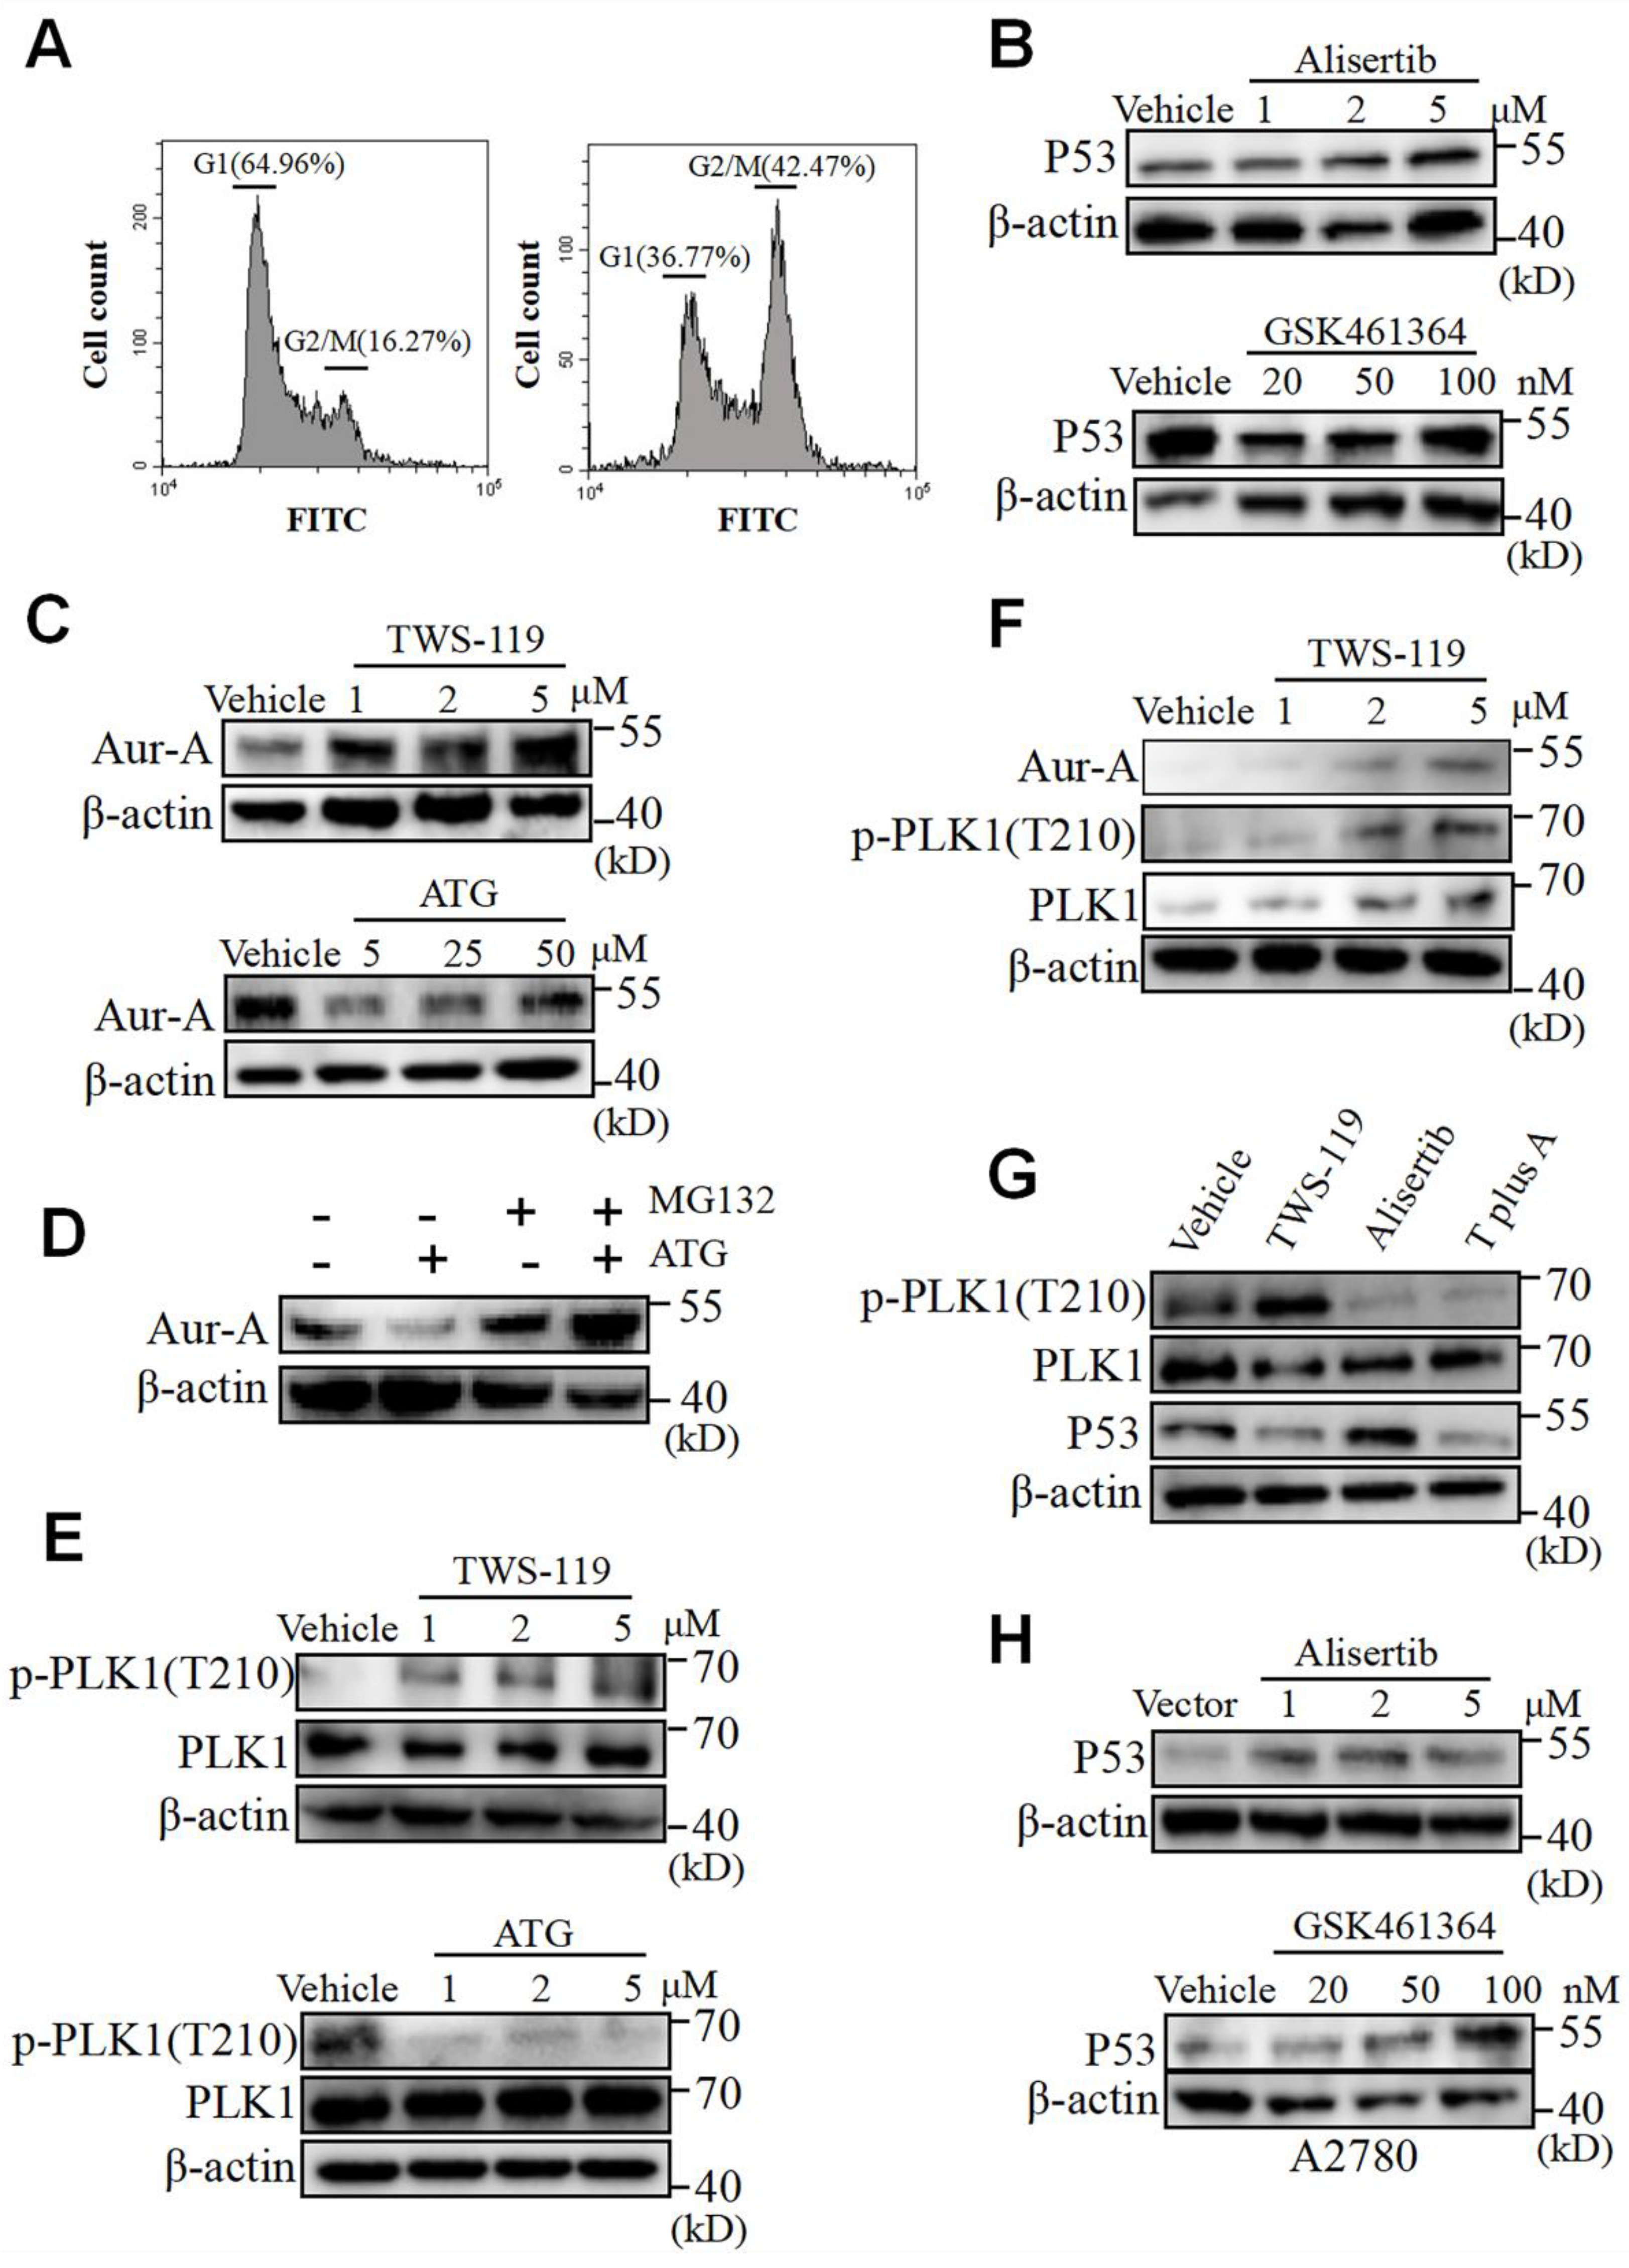
Figure 6.
Double inhibition of PLK1 and GSK3β lead to synthetic lethality in OV cells. (A) Western blot of γH2AX in OVCAR-8, ES-2, Kuramochi and A2780 cells exposed to GSK461364 (20-100 nM) for 24 hours. (B) Western blot of γH2AX and Cleaved caspase-3 in OVCAR-8, ES-2, Kuramochi and A2780 cells exposed to TWS-119 (5 μM), GSK461364 (100 nM) or combination of TWS-119 (5 μM) and GSK461364 (100 nM) for 24 hours. (C) Cells were treated by TWS-119 (5 μM), GSK461364 (100 nM) or combination of TWS-119 (5 μM) and GSK461364 (100 nM) for 36 hours prior to double staining with Annexin V and propidium iodide (PI). Percentages of apoptotic cells were presented as mean ± SEM (n = 3). *, P < 0.05; *** P < 0.001, n = 3, one-way ANOVA. (D) the landscapes of the combination responses for TWS-119 and GSK461364 based on loewe model.
Disclaimer/Publisher’s Note: The statements, opinions and data contained in all publications are solely those of the individual author(s) and contributor(s) and not of MDPI and/or the editor(s). MDPI and/or the editor(s) disclaim responsibility for any injury to people or property resulting from any ideas, methods, instructions or products referred to in the content. |
© 2025 by the authors. Licensee MDPI, Basel, Switzerland. This article is an open access article distributed under the terms and conditions of the Creative Commons Attribution (CC BY) license (https://creativecommons.org/licenses/by/4.0/).
Copyright: This open access article is published under a Creative Commons CC BY 4.0 license, which permit the free download, distribution, and reuse, provided that the author and preprint are cited in any reuse.


