
Submitted:
08 August 2025
Posted:
12 August 2025
You are already at the latest version
Abstract
Background: Polytrauma is a leading cause of mortality and disability worldwide. Despite a decline in trauma-related deaths over recent decades, the specific factors driving this trend remain unclear. Traumatic brain injury (TBI) is the primary cause of death and long-term disability among polytraumatized patients, making it a key determinant in outcomes. Methods: This retrospective observational study analyzed a prospectively collected trauma registry over a 25-year period (1993–2018) at Gregorio Marañón University General Hospital (Madrid, Spain). The study included adult patients with polytrauma and associated TBI. Epidemiological, clinical, and outcome data were analyzed globally and across four time periods to assess trends. Results: Among 768 patients with PTBI, the mean age was 43 years (±20), with 71% being male. Most had closed TBIs (96%) and severe injuries to the head, chest, and extremities (median ISS/NISS: 27/34). Emergency surgery was required in 51% of cases, and 84% were admitted to intensive care units. Over time, patient age, comorbidities, and prehospital care increased, while ISS/NISS scores and early mortality decreased. Mortality dropped significantly—especially deaths within the first 24 hours—primarily due to improved hemorrhage control. However, TBI-related mortality remained stable at 28%. Conclusions: The incidence of polytrauma declined over time, notably due to fewer traffic-related injuries—likely reflecting ad-vances in safety legislation and prevention. Despite an aging and more comorbid patient population, overall mortality decreased, highlighting the impact of improved trauma care. TBI continues to be the leading cause of death and a persistent clinical challenge.
Keywords:
trauma epidemiology
; traumatic brain injury
; trauma mortality
1. Introduction
Trauma is a major global public health issue and one of the leading causes of death worldwide [1], responsible for over 5.8 million deaths annually and a significant proportion of fatalities in people under 45 [2] According to the WHO, the main causes include road traffic accidents, suicides, and homicides [3]. In Spain, it remains common, mainly due to traffic accidents, falls, and high-energy impacts, though these trends have changed over time [4].
Although the global epidemiological landscape of health issues was significantly impacted by the COVID-19 pandemic [5], declines in morbidity and mortality patterns had already been observed prior to its onset [6]. These improvements were largely due to medical advances and the centralization of trauma care in specialized centers [1,7]. In addition, legal and technical interventions—particularly those aimed at reducing traffic-related injuries—may have contributed to a downward trend in trauma incidence and its associated morbimortality [8,9]. All this highlights the importance of examining how the clinical and epidemiological profile of severe trauma patients have evolved in specialized centers over the long term.
Effective management of severe polytrauma requires evaluating trauma severity, physiological impact, and injury distribution using tools like the Glasgow Coma Scale (GCS), the Abbreviated Injury Score (AIS), the Injury Severity Score (ISS), and the New Injury Severity Score (NISS) among others [10,11,12,13]. Traumatic brain injury (TBI) is recognized as the primary determinant of both mortality and long-term disability, making its thorough assessment essential [14,15,16]. Early diagnosis, hemorrhage control, and multidisciplinary care in specialized centers has shown to significantly improve patient outcomes [17,18,19,20], although precise and updated data from lon-term series are still lacking. This study examines the incidence, causes, and prognostic factors of severe polytrauma with TBI (PTBI) based on data collected from 1993 to 2018 at a level I trauma reference hospital in Madrid, Spain.
2. Materials and Methods
Study Design and Methods
This is a retrospective study using prospectively collected data over a 25-year period prior to the COVID-19 pandemic. It includes adult patients with severe traumatic brain injury (TBI), either as isolated trauma or as part of polytrauma, treated at the Emergency Department of Hospital General Universitario Gregorio Marañón (HGUGM) between June 1993, and October 2018.
Inclusion Criteria
- Adults with severe trauma (ISS>15) with TBI
- Treated at HGUGM
- Trauma occurring between 1993 and 2018
- Accessible data
Variables Analyzed
Epidemiological, clinical, prehospital and in-hospital course, initial treatment, intensive care unit (ICU) admission, hospitalization, mortality, and complications. The study initially evaluates the entire cohort and then subdivides it into four equal-duration groups (73.25 months) to assess temporal trends (1993-1999; 1999-2005; 2005-2012; 2011-2018).
Specific Variables Included:
- Epidemiological: age, sex, trauma date
- Medical history and trauma characteristics: type (blunt/penetrating), intent (accidental/self-inflicted/assault)
- Trauma cause: traffic accidents (car, motorcycle, pedestrian), falls, assaults, others
- Severity indicators and protective factors: seatbelt/helmet use, fall height, prehospital vital signs, care by emergency medical teams (SAMUR-061), initial shock, cardio-pulmonary resuscitation (CPR), intubation, lactate, fluid resuscitation
- In-hospital: vital signs, emergency surgery, transfusions, injury location and severity (AIS, ISS, NISS)
- Outcomes: ICU admission, complications, and mortality (day 1, 30-day, overall), including preventable deaths
Statistical Analysis
Continuous variables were expressed as mean ± standard deviation for normally distributed data, or as median and interquartile range for non-normally distributed data. Categorical variables were analyzed using Pearson’s Chi-square test with odds ratios (OR) and 95% confidence intervals (CI), or Fisher’s exact test when appropriate. Quantitative variables were compared using Student’s t-test for parametric data and the Kruskal-Wallis test for non-parametric data. Binary logistic regression was employed for multivariate analysis. Survival analysis was performed using Kaplan–Meier survival curves, and Cox regression models were used to estimate hazard ratios (HR) with 95% confidence intervals. All analyses were conducted using IBM® SPSS® Statistics version 29, with statistical significance set at p < 0.05.
3. Results
A total of 2,816 polytraumatized patients who met the study’s inclusion criteria were reviewed. They had a median ISS of 21 and an overall mortality rate of 17%, with traumatic brain injury being the leading cause of death (45%). From this group, only patients with associated polytrauma and traumatic brain injury (PTBI) were selected—768 cases—and the study variables were analyzed accordingly.
3.1. General Analysis
The annual incidence of PTBI was heterogeneous (Figure 1), as were the causes of trauma. Road traffic accidents (RTAs) were the leading overall cause (58%). However, the frequency and type of RTAs varied over time, with car accidents predominating in the earlier years and pedestrian injuries becoming more frequent towards the end of the study period (p < 0.001). These trends were associated with different patterns of protective measures (e.g., seatbelt and helmet use), which are described later. The remaining PTBI cases were due to falls from height (29%), suicide attempts (5%), assaults without weapons (4%), and assaults involving sharp or firearm weapons (3%).
Regarding patient characteristics, summarized in Table 1, the mean age of the 768 PTBI cases was 43 years (±20), with a predominance of male patients (71%). Most TBIs were closed injuries (96%). A substantial number of patients (53%) had no relevant medical history, while 19% had one significant pre-existing condition, and 21% had two or more.
Most patients presented with severe associated injuries to the head, chest, and extremities as disclosed in AIS scores, with median ISS and NISS scores of 27 and 34, respectively. Of these, 51% required emergency surgery—half of which involved the central nervous system (CNS). Additionally, 84% were admitted to intensive care units, with a median stay of 8 days, providing evidence that most patients presented with severe or life-threatening conditions.
As for complications, 50% of patients did not develop clinically significant complications and only 9% required reoperation. The overall mortality rate was 34%. Mortality occurred in 8% upon arrival and in 19% within the first 24 hours, with a median time to death of 14 days. The distribution of causes of death shows brain injury as the most common etiology (28%) followed by exsanguination (5%).
3.2. Initial Care
Regarding prehospital care, 94% of patients were treated by 061-SAMUR emergency teams. Endotracheal intubation was required in 64% of cases, and CPR was performed in 5%. Initial shock was observed in 18% of patients, mainly due to CNS injury or hemorrhage (Table 1). Despite this, most patients arrived at the hospital in hemodynamically stable condition, although with severe neurological impairment: the median GCS score was 7; 52% of patients presented with a GCS below 8 upon initial assessment, and 17% exhibited pupillary abnormalities.
3.3. Period-Base Analysis
Patient characteristics were then analyzed across four equal time periods (Table 2). A progressive increase in mean age was observed from 38 to 54 years (p < 0.001), along with a higher proportion of female patients, from 25% to 37% (p = 0.014), and a significant rise in comorbidities, from 21% to 61% (p < 0.001). In addition to the previously mentioned variation in the incidence of RTA (p < 0.001), there was an increase in suicide attempts, from 0% to 13% (p < 0.001), and in the proportion of patients treated by prehospital emergency services, rising from 89% to 96% (p=0.016).
Initial assessment data showed improved neurological status over time, with the median GCS increasing from 3 to 11 (p < 0.001), and better systemic condition, as reflected by decreasing median ISS/NISS scores: from 34/41 in the first period to 25/29 in the last (p < 0.001), (Figure 2). In contrast, there were no significant changes in the rates of emergency surgery, reinterventions, or ICU admissions.
Table 3 presents a detailed analysis by the most frequent causes of PTBI, highlighting differences depending on the injury mechanism. The study shows a progressive decline in car accidents as a cause of polytrauma admissions (from 52 to 12 cases per period), alongside increased referred use of safety measures—likely attributable to legislation and technological advancements. However, in-hospital mortality among these patients remained similar (33%). More notably, motorcycle-related trauma cases remained relatively stable in frequency (from 24 to 18), but there was a marked increase in helmet use providing a greater cerebral protection, as reflected by an improvement in median GCS at admission in these patients (from 4 to 11) and by a significant reduction in mortality, as described below.
3.3. Mortality Rates
Overall mortality in this series declined significantly from 1993 to 2018 (p=0.039), including early mortality upon arrival (p<0.001), mainly due to a decrease in deaths from exsanguination and distributive shock. Mortality related to central nervous system injury remained stable at 28%. Likewise, a progressive reduction in mortality was observed across the different analyzed time periods. These data are illustrated for selected variables in Figure 3, based on Kaplan-Meier survival analysis and summarized in Table 4.
Subgroups with the highest statistically significant mortality rates, summarized in Table 5, included patients of advanced age (p<0.001), those with a history of ischemic heart disease (p=0.017), mechanisms such as falls from height (p=0,005) or fire weapon (p<0.001), higher ISS/NISS scores, penetrating injuries (p<0.004), pupillary abnormalities (p<0.001), and markers of severe systemic compromise such as hypotension, intubation, shock, or the need of CPR (p<0.001). Similarly, patients requiring chest tube (p<0.001) and abdominal emergent surgery (p=0.002) showed increased mortalities rates.
Although there was a downward trend in hemorrhage-related mortality and among patients requiring non-neurosurgical emergency procedures, mortality related to CNS injury remained unchanged (Figure 3). In fact, this type of mortality remained stable across all analyzed time periods.
4. Discussion
Polytrauma is defined as injury affecting multiple body regions, resulting in two or more major lesions [21,22,23]. A trauma is considered “major” when the ISS or NISS score exceeds 15, the two main scoring systems currently used to assess trauma severity, both of which correlate directly with the risk of mortality [21,24]. Trauma holds critical significance as it represents one of the major causes of morbidity and mortality, particularly among individuals under 40 years of age, and is the third most common cause of death worldwide [1].
However, it is essential to determine whether major trauma involves TBI, as this is the leading cause of death in these cases [15,20,24,25,26]. It is also crucial to analyze the causal mechanism (accidents, suicide attempts, assaults) and the patient’s physiology [3,14,27,28], as well as the prioritized, specialized care provided in trauma centers [29,30,31], since patients with similar ISS or NISS scores can show very different mortality rates [10,12,13]. Recent studies have proposed new prognostic models (TRISS, CRASH, IMPACT) with stronger correlations to mortality, although they involve more complex analyses and are beyond the scope of this study [11,12,32,33].
Mortality after severe trauma has been significantly reduced in the last decades [2,7,21], especially due to early, protocolized treatment of massive hemorrhage—the foremost preventable cause of death in approximately 40% of cases [6,18,19,34,35]. However, mortality due to TBI remains high. TBI affects an estimated 50 million people annually [14,15,16,20]. Beyond its lethality, it is the principal source of acquired brain injury in young populations. Its prognosis worsens with hypotension and hemorrhagic injuries, making high-quality care essential to reduce its impact. The origins and prognosis of TBI have evolved in recent decades, thanks to mandatory preventive measures [9,36,37] and improved clinical protocols for stabilizing polytraumatized patients [2,18,20,38].
This study analyzes the incidence, causes, prognosis, and long-term variability of PTBI. Its value lies in the extensive database collected over a 25-year period, allowing us to contribute new, robust data on polytrauma in our setting. This is of significant scientific relevance, as it underscores the current lack of comprehensive, multidisciplinary data on the management of severely polytraumatized patients in Spain. Previous study in this setting is from Chicote et al from 2016 in a pilot phase [39].
The results hereby presented confirm prior epidemiological findings on the incidence of PTBI: it primarily affects middle-aged patients (mean age ~40) and is more frequent in males. RTA remain the most common cause, although falls from height and suicides are increasing as leading causes of major trauma [9,21,23,24,39].
The period-based analysis reveals the temporal evolution of key variables, comparable in scope to the Scottish series by Hamill et al. (1974–2012) [25]. As in that study, we observed a steady increase in the average age of patients, from 38 to 54 years, likely reflecting changes in injury mechanisms and the progressive aging of the population. Although men continue to represent most cases, the gender disparity has gradually diminished over time.
We also observed a gradual increase in relevant comorbidities, even considering missing data from early years. These conditions are known to influence physiological responses to trauma and were associated with higher mortality in our series as well as in previous studies in the literature [2,27]. Nonetheless, contrary to global trends, substance abuse rates remained stable throughout the study period [23,28].
In terms of injury mechanisms, a decline in both car and motorcycle accidents was noted, from 28% to 6%, likely reflecting national legislation (speed limits, mandatory seatbelt and helmet use, enforcement measures) [8,9,40]. In contrast, pedestrian injuries showed a progressive rise—particularly among the elderly and in urban settings—and various strategies are currently under evaluation to address this trend [41]. Notably, suicide-related trauma increased significantly in recent years, increasing till 13% at the final period of the series. This emphasizes a severe public health problem confirmed by suicide rates in Spain reaching 7.906 per 100,000 inhabitants in 2017. These cases demand targeted preventive strategies, as emphasized by national and international agencies (WHO) [42,43].
Over time, nearly all patients received specialized prehospital care, which contributed to improved physiological status upon hospital arrival (evidenced by better trauma scores at admission). Hospital outcomes were favorable in this cohort, likely due to the level I trauma center setting. Specialized center experience has been previously linked to better results, as in the study by Schubert et al., between 2010 and 2015, describing a reduced mortality in American trauma certified centers [1]. Similar results were shown in the series by Moore et al., in Canadian trauma centers, with an 18.2% relative decrease in risk-adjusted mortality in 2012 compared to 2006 [6].
A significant decline in mortality was observed in this study and may be attributed to improved hemorrhage control, modern transfusion strategies, and advanced treatment techniques (e.g., surgical, endovascular, and hybrid room interventions) [2,17,19,35]. As a result, exsanguination-related deaths decreased. Yet, mortality due to CNS injury remained the determinant cause of death and even increased slightly in recent years, likely due to the reduction of other causes—highlighting it as a persistent clinical challenge [15,20,24,26].
Limitations of this study include its retrospective design, although nearly all TBI patients treated at HGUGM between 1993 and 2018 were included, minimizing selection bias. Additionally, missing data were more frequent in the early years due to changes in data collection practices. Another limitation lies in the variability and heterogeneity of trauma scoring systems, some of which focus solely on anatomical criteria and are often replaced by newer models in contemporary studies.
5. Conclusions
In conclusion, polytrauma frequency has declined over time in the reviewed series here presented, particularly due to the decrease in traffic accidents. Technical protective advances and legislation may have played an important role in this epidemiological shift. Nonetheless, TBI remains the primary cause of death, albeit with a lower incidence than in earlier years. Despite the trend toward older and more comorbid polytrauma patients, mortality has decreased thanks to significant improvements in both prehospital and hospital trauma care.
Author Contributions
All authors contributed to this manuscript. Conceptualization, Methodology, software, validation, formal analysis, OMS, RB, AT, AM; investigation, resources, data curation DPD, CR, AM, OMS.; writing, writing—review and editing, visualization, supervision, all authors. All authors have read and agreed to the published version of the manuscript.
Institutional Review Board Statement
The study was conducted in accordance with the Declaration of Helsinki. Ethical review and approval were not required, as the database is historical and patient identification or follow-up is no longer possible.
Informed Consent Statement
Not applicable.
Data Availability Statement
No new data were created.
Conflicts of Interest
The authors declare no conflicts of interest.
Abbreviations
| AIS | Abbreviated Injury Scale |
| CNS | Central nervous system |
| CRASH | Corticosteroid Randomisation After Significant Head Injury |
| GCS | Glasgow Coma Score |
| HDUDM | Hospital General Universitario Gregorio Marañon |
| IMPACT | International Mission for Prognosis and Analysis of Clinical Trials in TBI |
| ICU | Intensive Care Unit |
| ISS | Injury Severity Score |
| NISS | New Injury Severity Score |
| PTBI | Polytrauma with Traumatic Brain Injury |
| RTA | Road Traffic Accidents |
| SAMUR-061 | Madrid Emergency Medical Service |
| TBI | Traumatic Brain Injury |
| TRISS | Trauma and Injury Severity Score |
| WHO | World Health Organization |
References
- F.D. Schubert, L. J. Gabbe, M. A. Bjurlin, and A. Renson, “Differences in trauma mortality between ACS-verified and state-designated trauma centers in the US,”. Injury 2019, 50, 186–191. [CrossRef]
- D.R. Spahn, B. Bouillon, V. Cerny, J. Duranteau, D. Filipescu, and B. J. Hunt, “Guia europea sangrado y coagulación,”. Crit Care 2019, 23, 1–74. [CrossRef]
- World Health Organization, “The global burden of disease : 2004 update,” WHO overview. Accessed: Aug. 07, 2025. [Online]. Available: https://www.who.int/publications/i/item/9789241563710.
- M.Chico-Fernández et al., “Epidemiología del trauma grave en Espa ˜ na. REgistro,” . Med Intensiva, 2015, 40. [CrossRef]
- E.C. Clark, S. Neumann, S. Hopkins, A. Kostopoulos, L. Hagerman, and M. Dobbins, “Changes to Public Health Surveillance Methods Due to the COVID-19 Pandemic: Scoping Review,”. JMIR Public Health Surveill 2024, 10, e49185. [CrossRef]
- L. Moore et al., “Trends in Injury Outcomes Across Canadian Trauma Systems,”. JAMA Surg 2017, 152, 168. [Google Scholar] [CrossRef]
- K.Scarborough, “Reduced Mortality at a Community Hospital Trauma Center,”. Archives of Surgery 2008, 143, 22. [CrossRef]
- Ministerio de Sanidad-Asuntos Sociales-Igualdad, “Lesiones en España Análisis de la legislación sobre prevención de lesiones no intencionales,” Ministerio de Sanidad, Asuntos Sociales e Igualdad. Accessed: Aug. 07, 2025. [Online]. Available: https://www.sanidad.gob.es/areas/promocionPrevencion/lesiones/legislacion/docs/LESIONES_Espana.pdf.
- M.-A. R. Pineda-Jaramillo J, Barrera-Jimenez H, “Unveiling the relevance of traffic enforcement cameras on the severity of vehicle-pedestrian collisions in an urban environment with machine learning models,” . J Safety Res 2022, 81, 225–238. [CrossRef]
- L. Aharonson-Daniel et al., “Different AIS triplets: Different mortality predictions in identical ISS and NISS,”. Journal of Trauma - Injury, Infection and Critical Care 2006, 61, 711–717. [Google Scholar] [CrossRef]
- L. Serviá et al., “Machine learning techniques for mortality prediction in critical traumatic patients: anatomic and physiologic variables from the RETRAUCI study,” . BMC Med Res Methodol 2020, 20, 1–12. [Google Scholar] [CrossRef]
- H.M. Lossius, M. Rehn, K. E. Tjosevik, and T. Eken, “Calculating trauma triage precision: effects of different definitions of major trauma,” . J Trauma Manag Outcomes 2012, 6, 1. [CrossRef]
- Q.Deng et al., “Comparison of the ability to predict mortality between the injury severity score and the new injury severity score: A meta-analysis,” . Int J Environ Res Public Health 2016, 13, 1–12. [CrossRef]
- L. A.Santiago, B. C. Oh, P. K. Dash, J. B. Holcomb, and C. E. Wade, “A clinical comparison of penetrating and blunt traumatic brain injuries,”. Brain Inj 2012, 26, 107–125. [Google Scholar] [CrossRef]
- A.A. Hyder, C. A. Wunderlich, P. Puvanachandra, G. Gururaj, and O. C. Kobusingye, “The impact of traumatic brain injuries: A global perspective,” . NeuroRehabilitation 2007, 22, 341–353. [CrossRef]
- I.R. Maas et al., “The Lancet Neurology Commission Traumatic brain injury: integrated approaches to improve prevention, clinical care, and research Executive summary The Lancet Neurology Commission,” . Lancet Neurol 2017, 16, 987–1048.
- D.Benz and Z. J. Balogh, “Damage control surgery: Current state and future directions,”. Curr Opin Crit Care 2017, 23, 491–497. [CrossRef]
- J.B. Holcomb et al., “Damage control resuscitation: Directly addressing the early coagulopathy of trauma,” . ournal of Trauma - Injury, Infection and Critical Care 2007, 62, 307–310. [CrossRef]
- A.M. Hynes et al., “Staying on target: Maintaining a balanced resuscitation during damage-control resuscitation improves survival,” . J Trauma Acute Care Surg 2021, 91, 841–848. [CrossRef]
- E.Picetti et al., “WSES consensus conference guidelines: Monitoring and management of severe adult traumatic brain injury patients with polytrauma in the first 24 hours,”. World Journal of Emergency Surgery 2019, 14, 1–9. [CrossRef]
- H.C. Pape and L. Leenen, “Polytrauma management - What is new and what is true in 2020 ?,”. J Clin Orthop Trauma 2021, 12, 88–95. [CrossRef]
- H.-C. Pape et al., “The definition of polytrauma revisited: An international consensus process and proposal of the new ‘Berlin definition’.,”. J Trauma Acute Care Surg 2014, 77, 780–786. [CrossRef]
- J.R. Border, J. LaDuca, and R. Seibel, “Priorities in the management of the patient with polytrauma.,” . Prog Surg, 1975, 14, 84–120. [CrossRef]
- M. Hardy, N. Enninghorst, K. L. King, and Z. J. Balogh, “The most critically injured polytrauma patient mortality: should it be a measurement of trauma system performance?,” Eur J Trauma Emerg Surg 2024, 50, 115–119. [CrossRef]
- V.Hamill, S. J. E. Barry, A. McConnachie, T. M. McMillan, and G. M. Teasdale, “Mortality from head injury over four decades in Scotland,” . J Neurotrauma 2015, 32, 689–703. [CrossRef]
- K.Menon and C. Zahed, “Prediction of outcome in severe traumatic brain injury,”. Curr Opin Crit Care 2009, 15, 437–441. [CrossRef]
- K. Y. Ahmed N, “Prediction of Trauma Mortality Incorporating Pre-injury Comorbidities into Existing Mortality Scoring Indices. Am Surg 2022, 2. [CrossRef]
- J. M. Beaulieu E, Naumann RB, Deveaux G, Wang L, Stringfellow EJ, Lich KH, “Impacts of alcohol and opioid polysubstance use on road safety: Systematic review,”. Accid Anal Prev 2022, 173, 106713. [CrossRef]
- F. Hildebrand et al., “Management of polytraumatized patients with associated blunt chest trauma: a comparison of two European countries.,”. Injury 2005, 36, 293–302. [CrossRef]
- T. Brinck, M. Heinänen, T. Söderlund, R. Lefering, and L. Handolin, “Does arrival time affect outcomes among severely injured blunt trauma patients at a tertiary trauma centre?,”. Injury 2019, 50, 1929–1933. [CrossRef]
- J. MacKenzie and F. P. Rivara, “A National Evaluation of the Effect of Trauma-center Care on Mortality,” Journal of Trauma Nursing 2006, 13, 150. [CrossRef]
- Y. J. Larkin EJ, Jones MK, Young SD, “Interest of the MGAP score on in-hospital trauma patients: Comparison with TRISS, ISS and NISS scores. Injury 2022. [CrossRef]
- O. Salehi, S. A. T. Dezfuli, S. S. Namazi, M. D. Khalili, and M. Saeedi, “A new injury severity score for predicting the length of hospital stay in multiple trauma patients,”. Trauma Mon 2016, 21, 1–5. [CrossRef]
- W. Kirkpatrick and S. K. D’Amours, “The RAPTOR: Resuscitation with angiography, percutaneous techniques and operative repair. Transforming the discipline of trauma surgery,” Canadian Journal of Surgery 2011, 54. [CrossRef]
- Carver, A. W. Kirkpatrick, S.D’Amours, S. M. Hameed, J. Beveridge, and C. G. Ball, “A Prospective Evaluation of the Utility of a Hybrid Operating Suite for Severely Injured Patients: Overstated or Underutilized?,”. Ann Surg 2020, 271, 958–961. [Google Scholar] [CrossRef]
- S. e I. M. Sanidad, “Lesiones en España Análisis de la legislación sobre prevención de lesiones no intencionales,” Ministerio de Sanidad, Asuntos Sociales e Igualdad.
- Spain. Ministerio de Sanidad y Consumo., Revista española de salud pública., vol. 79, no. 2. Ministerio de Sanidad y Consumo, 2005. Accessed: Jun. 04, 2020. [Online]. Available: http://scielo.isciii.es/scielo.php?script=sci_arttext>pid=S1135-57272005000200005>lng=es>nrm=iso>tlng=es. 1135.
- Q. Yuan et al., “Coagulopathy in Traumatic Brain Injury and Its Correlation with Progressive Hemorrhagic Injury: A Systematic Review and Meta-Analysis,” . J Neurotrauma 2016, 33, 1279–1291. [CrossRef]
- M. Chico-Fernández et al., “Epidemiology of severe trauma in Spain. Registry of trauma in the ICU (RETRAUCI). Pilot phase.,”. Med Intensiva 2016, 40, 327–347. [CrossRef]
- Ministerio de Presidencia, “RD 1428/2003 para aprobación de la ley sobre tráfico, circulación de vehículos a motor y seguridad vial,” Madrid, Dec. 2003. Accessed: Aug. 07, 2025. [Online]. Available: https://www.boe.es/buscar/act.php?id=BOE-A-2003-23514.
- Ministerio del Interior, “Real Decreto Legislativo 6/2015, de 30 de octubre, por el que se aprueba el texto refundido de la Ley sobre Tráfico, Circulación de Vehículos a Motor y Seguridad Vial,” BOE. Accessed: Aug. 07, 2025. [Online]. Available: https://www.boe.es/buscar/act.php?id=BOE-A-2015-11722.
- Blanco, “El suicidio en España. Respuesta institucional y social,” Revista de Ciencias Sociales, DS-FCS 2020, 33, 79–106. [CrossRef]
- World Health Organization, “Preventing suicide,” WHO Library Cataloguing-in-Publication Data 2014, 89.
Figure 1.
Distribution of the patient series over the 25-year study period. Top: Annual number of total PTBI cases (bars) and proportion attributed to road traffic accidents (line). Bottom: Breakdown of traffic accident types by year. Colors represent specific mechanisms: blue = car accidents, orange = motorcycle, gray = pedestrian (run-over), yellow = bicycle.
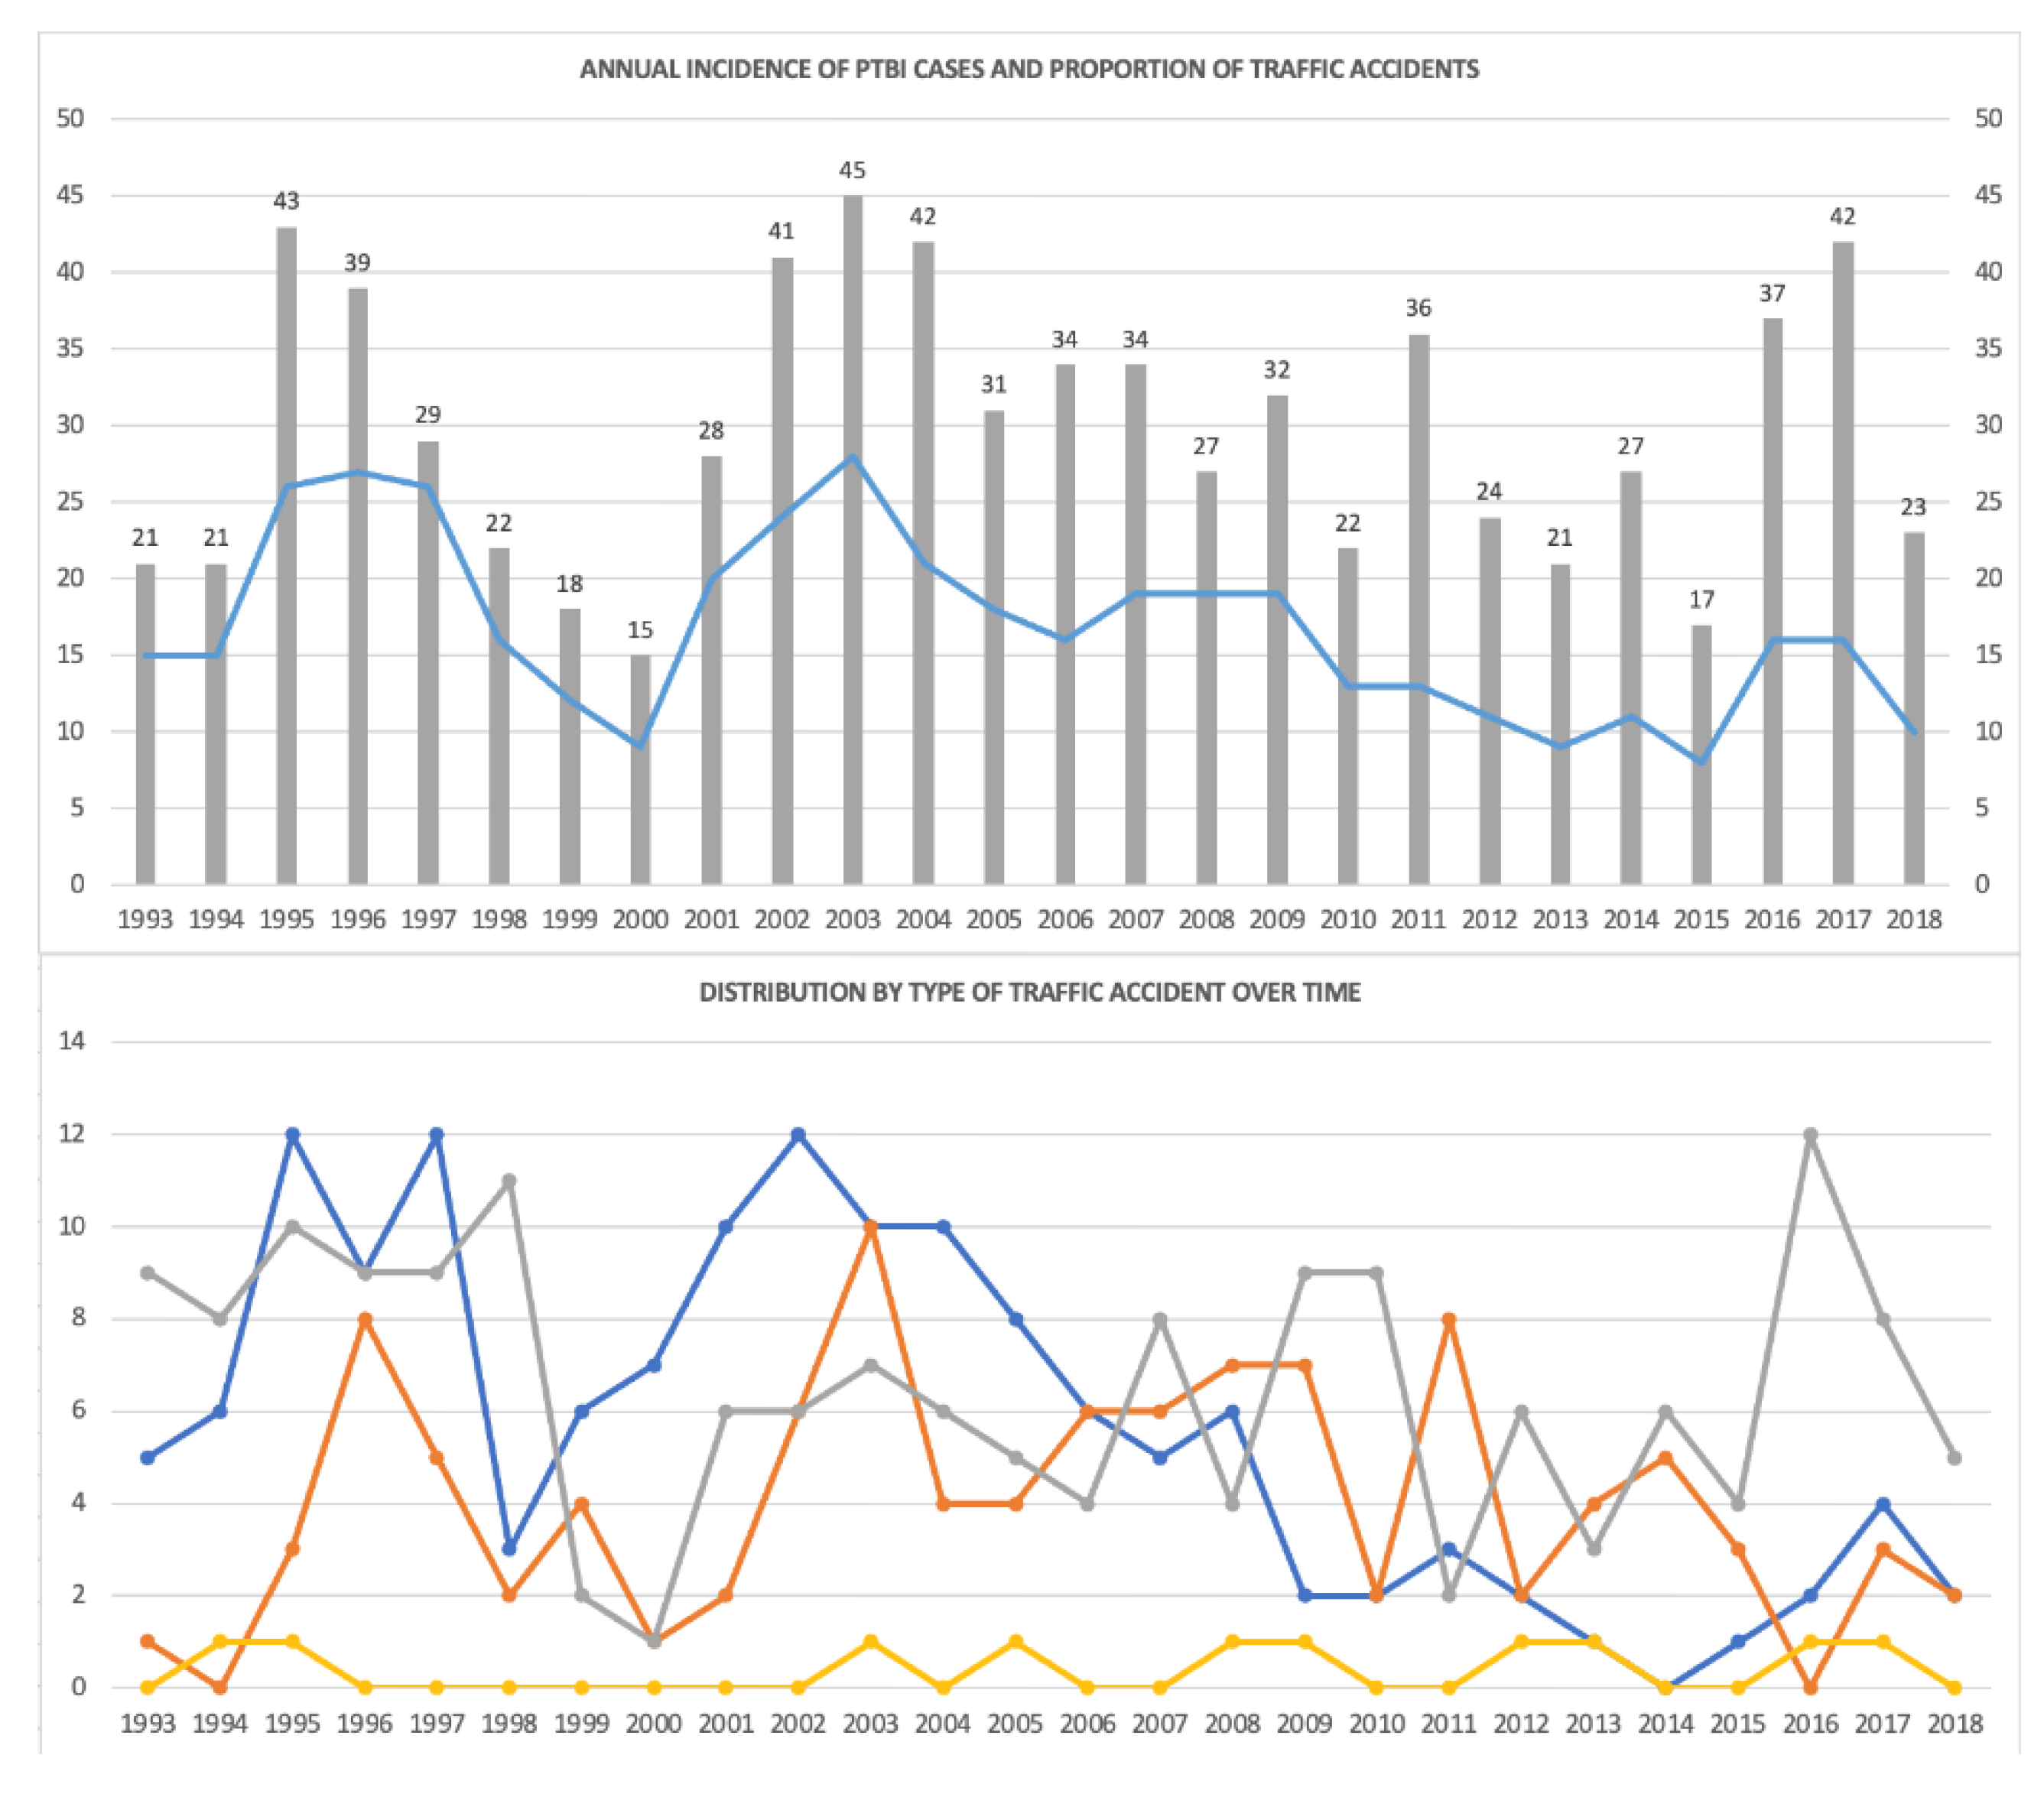
Figure 2.
Distribution of ISS values on the left and NISS values on the right across the four evolutionary periods of the study. Colors represent specific mechanisms: blue = car accidents, orange = motorcycle, gray = pedestrian (run-over), yellow = bicycle.
Figure 2.
Distribution of ISS values on the left and NISS values on the right across the four evolutionary periods of the study. Colors represent specific mechanisms: blue = car accidents, orange = motorcycle, gray = pedestrian (run-over), yellow = bicycle.
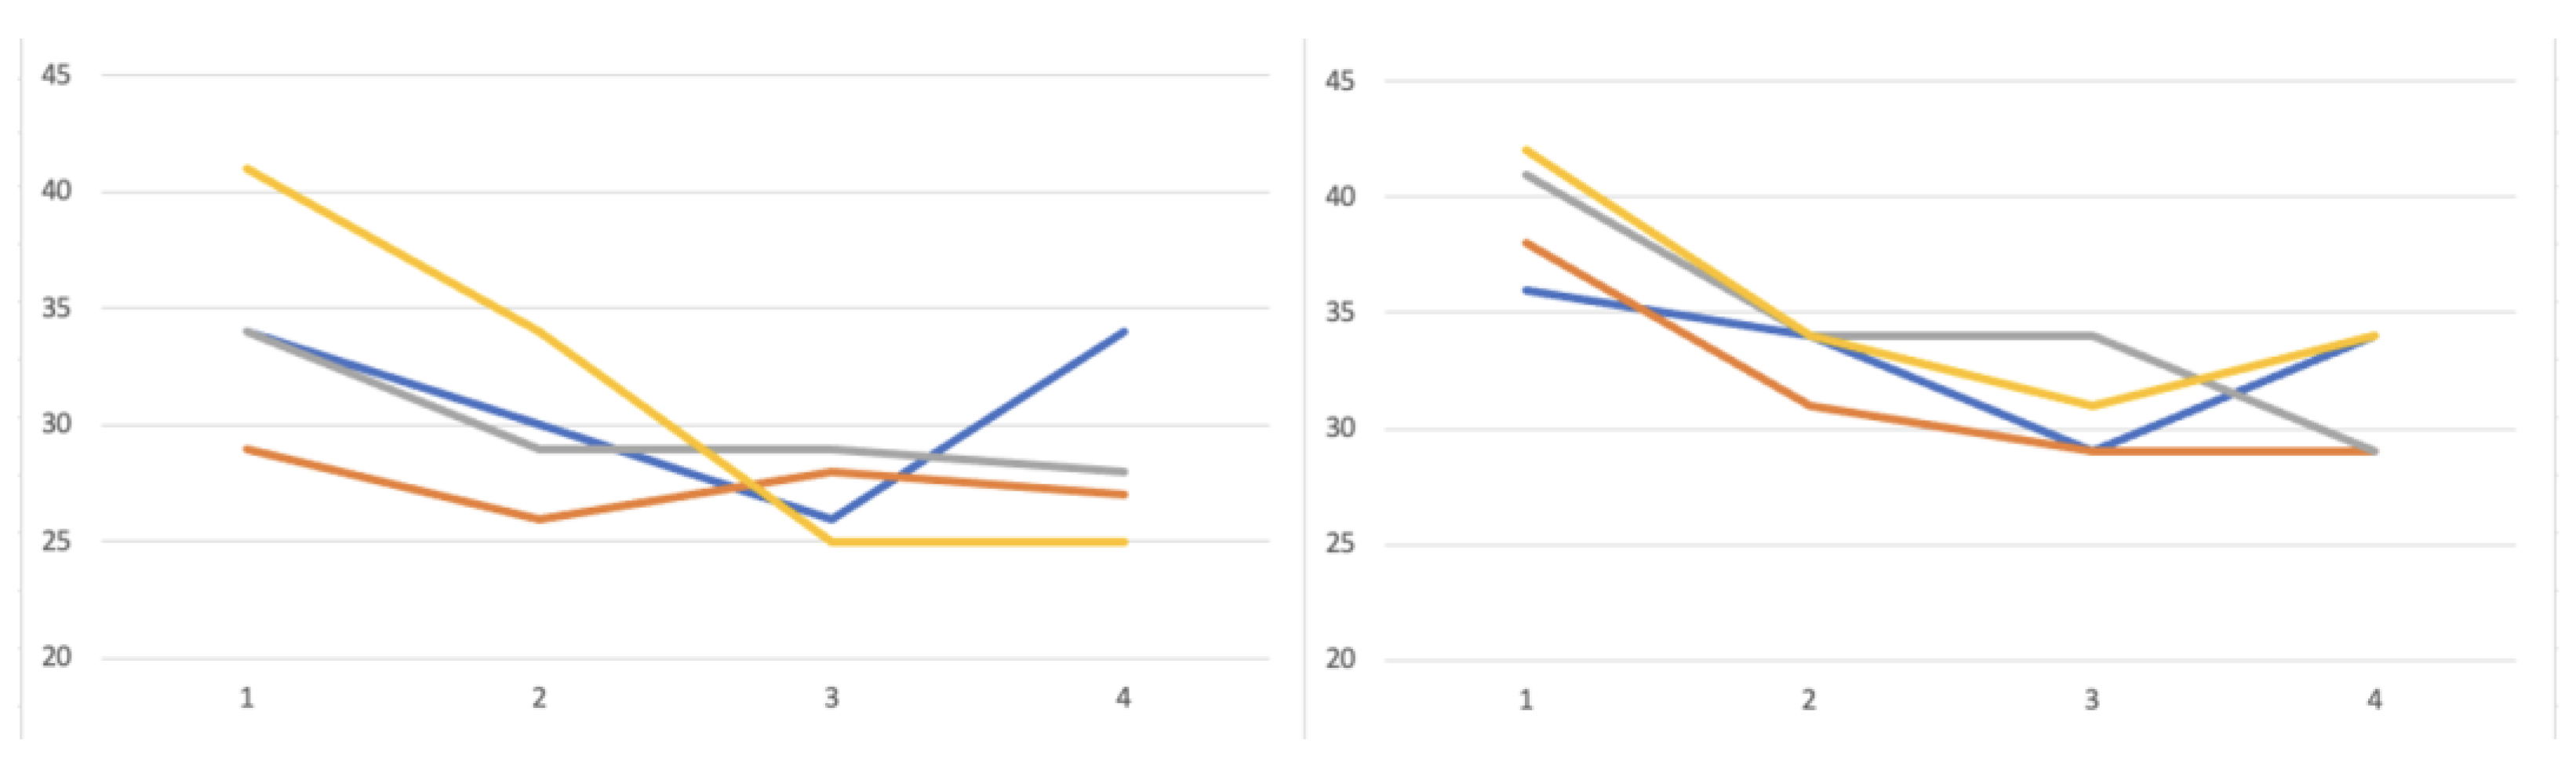
Figure 3.
Mortality data according to several variables analyzed. Patient comorbidities as ischemic heart disease, penetrating trauma, pupillary disorder and CNS injury showed an increased mortality rate as depicted through Kaplan-Meier survival function.
Figure 3.
Mortality data according to several variables analyzed. Patient comorbidities as ischemic heart disease, penetrating trauma, pupillary disorder and CNS injury showed an increased mortality rate as depicted through Kaplan-Meier survival function.
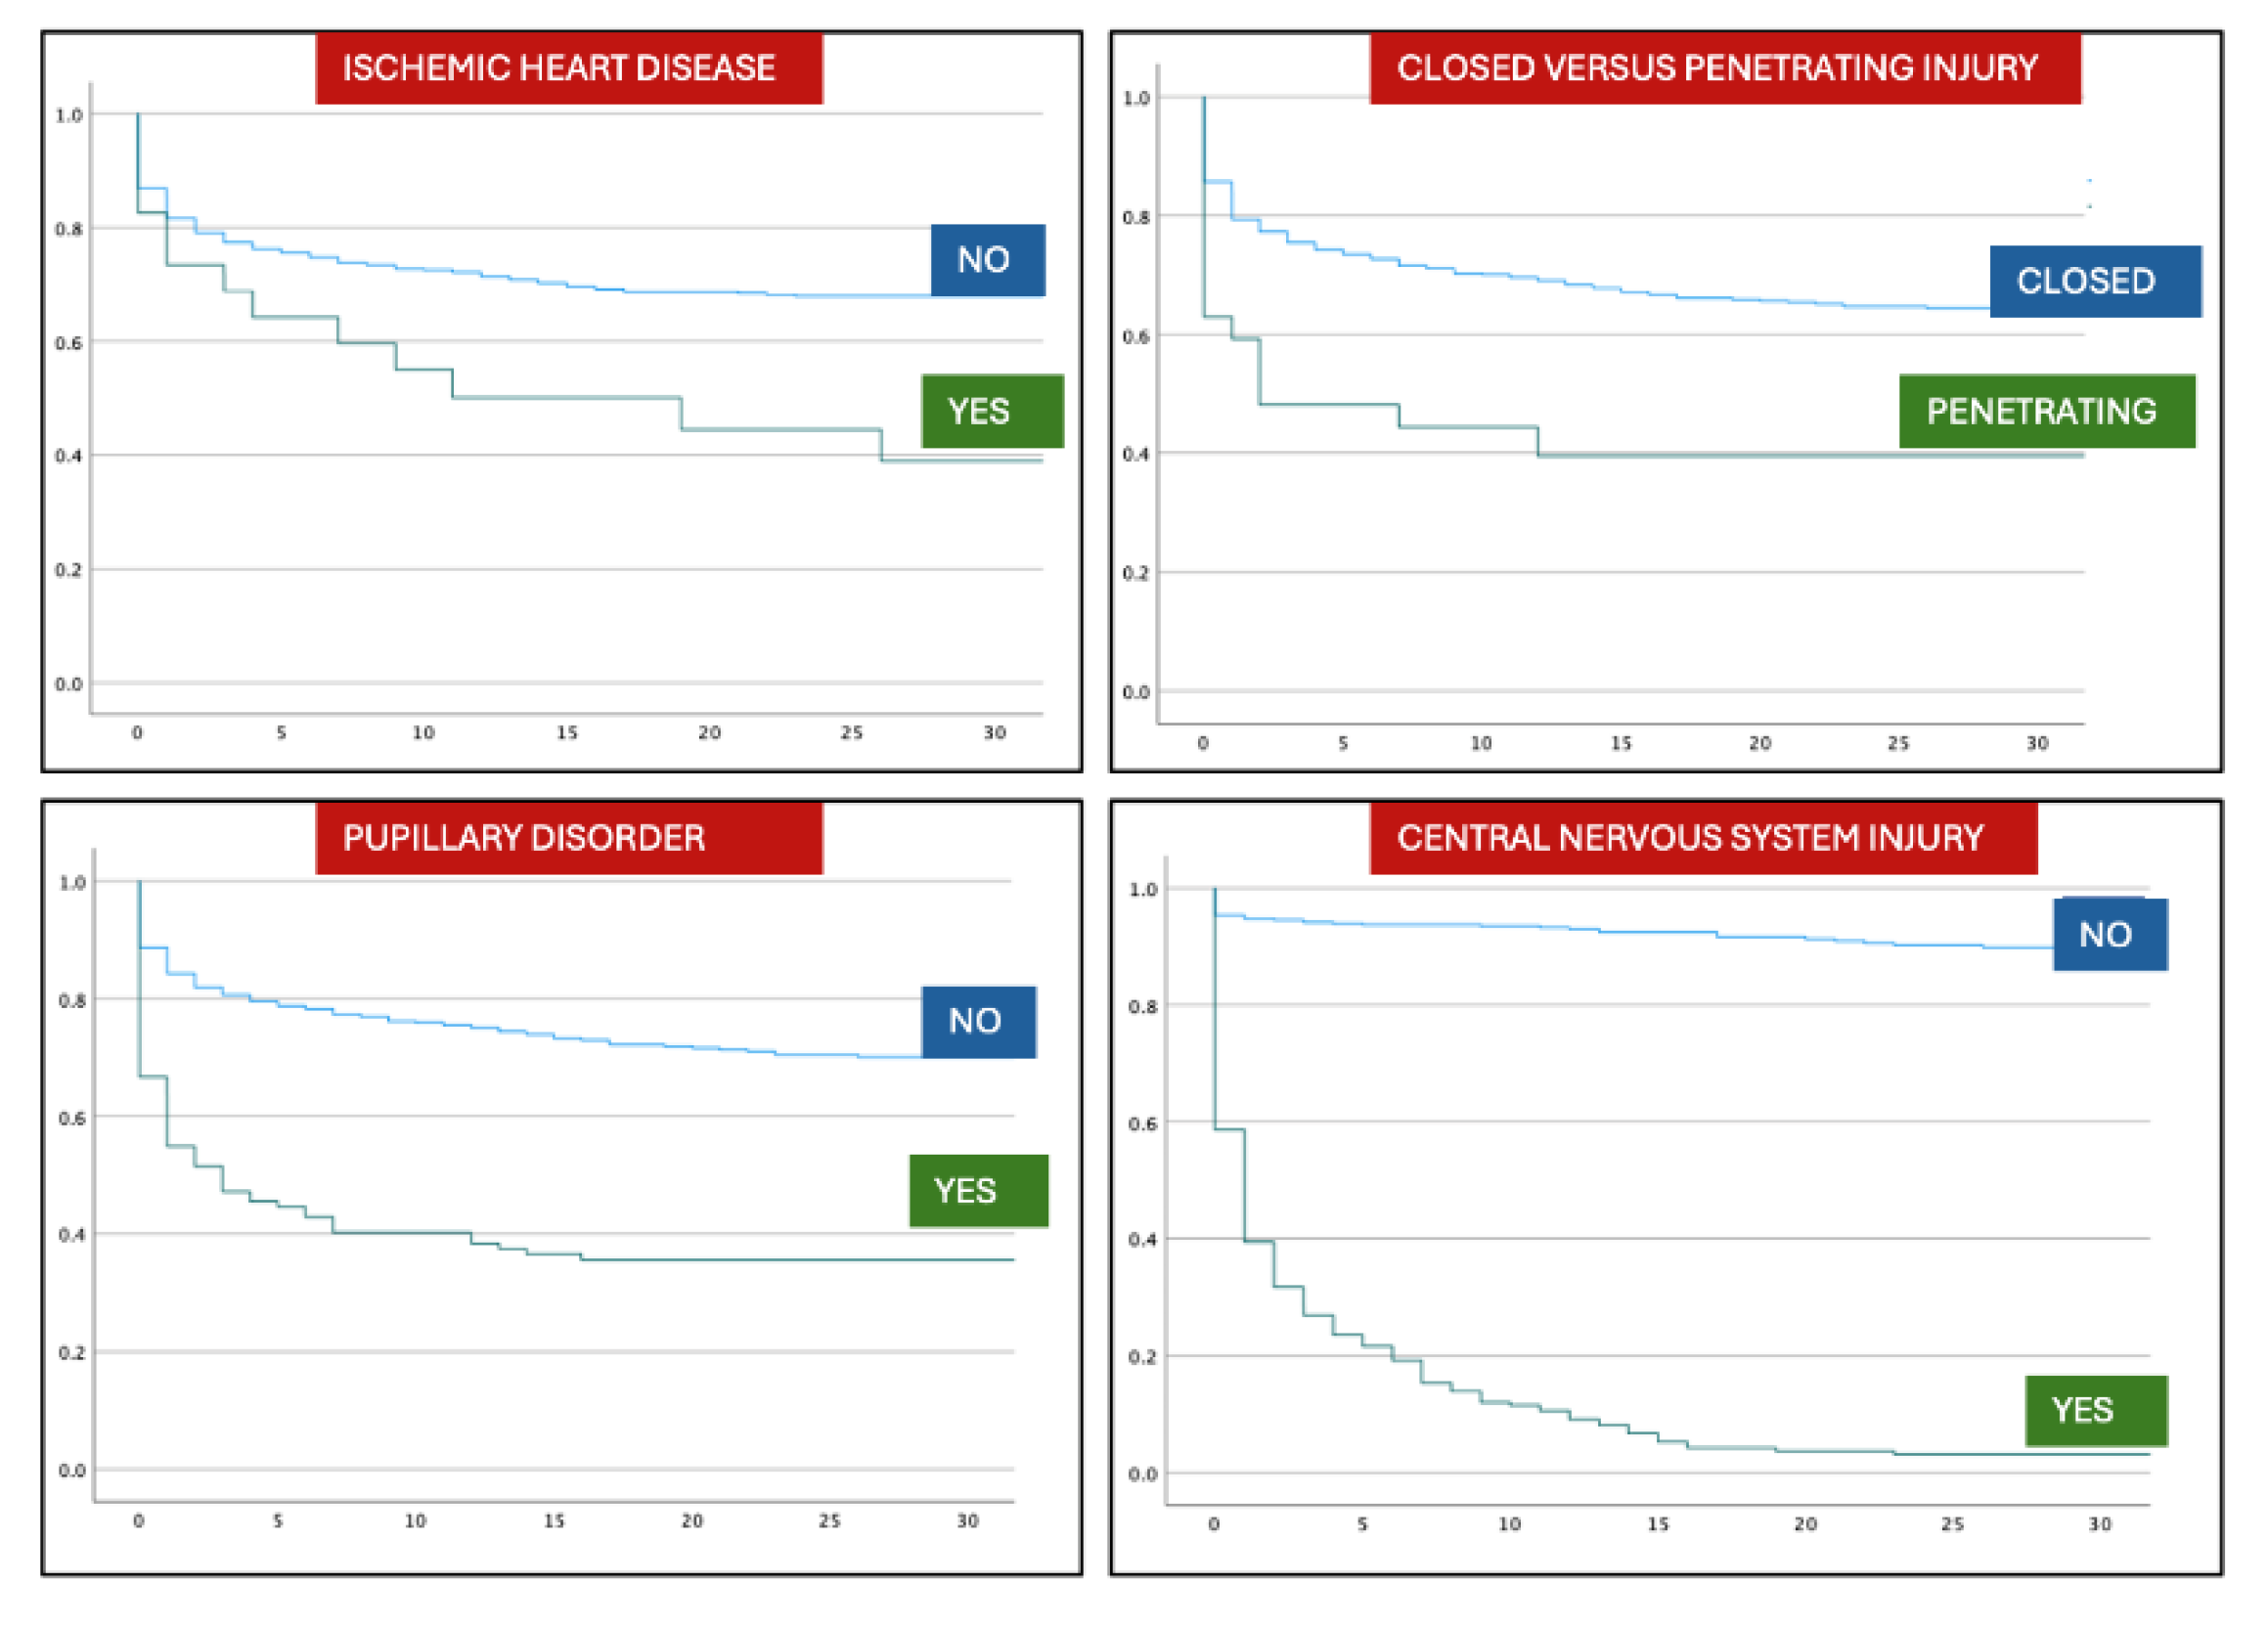

Table 1.
General characteristics of the patient cohort. SD: standard deviation; CPR: cardiopulmonary resuscitation; IQR: interquartile range; AIS: Abbreviated Injury Scale.
Table 1.
General characteristics of the patient cohort. SD: standard deviation; CPR: cardiopulmonary resuscitation; IQR: interquartile range; AIS: Abbreviated Injury Scale.
| PATIENTS (n/%) | INITIAL NEUROLOGICAL ASSESSMENT | ||||
|---|---|---|---|---|---|
| Age in years (mean, SD) | 43 | 20 | Pupillary disfunction (n/%) | 129 | 17 |
| Male | 548 | 71 | Deficit (n/%) | 52 | 7 |
| Female | 220 | 29 | INJURIES BY REGION AND SEVERITY (median, IQR) | ||
| Number of comorbidities | Head AIS | 4 | 3-5 | ||
| 0 | 409 | 53 | Face AIS | 0 | 0 |
| 1 | 145 | 19 | Thorax AIS | 2 | 0-3 |
| ≥2 | 158 | 28 | Abdomen AIS | 0 | 0-2 |
| Type of comorbidities | Extremities AIS | 2 | 0-3 | ||
| Hypertensión | 65 | 9 | Skin AIS | 0 | 0-1 |
| Cardiopathy | 23 | 3 | ISS | 27 | 19-38 |
| Ischemic heart disease | 23 | 3 | NISS | 34 | 24-41 |
| Diabetes | 32 | 4 | INITIAL SURGERIES (n/%) | ||
| Anticoagulation | 33 | 4 | Chest tube | 169 | 22 |
| Substance abuse | 38 | 5 | Emergent surgery | 388 | 51 |
| Alcoholism | 32 | 4 | Neurosurgery | 193 | 25 |
| Psychiatric disorder | 61 | 8 | MORTALITY (n/%) | ||
| INITIAL MANAGEMENT (n/%) | Total deaths | 262 | 34 | ||
| 061-SAMUR team | 722 | 94 | Death upon arrival | 64 | 8 |
| Prehospital status | Death on first day | 137 | 19 | ||
| Intubation | 488 | 64 | CAUSE OF DEATH (n/%) | ||
| CPR | 36 | 5 | CNS injury | 212 | 28 |
| Apnea | 115 | 15 | Exanguination | 40 | 5 |
| Shock | 136 | 9 | Sepsis | 13 | 2 |
| CAUSES OF SHOCK AT ADMISSION (n/%) | Multiorgan failure | 13 | 2 | ||
| CNS | 36 | 26 | Distributive shock | 5 | 0.7 |
| Multiple | 26 | 19 | Cardiorrespiratory injury | 14 | 2 |
| Hemoperitoneum | 20 | 15 | COMPLICATIONS (n/%) | ||
| Fractures | 12 | 9 | 1 | 252 | 33 |
| Other | 42 | 31 | >1 | 14 | 2 |
Table 2.
Evolution of patient characteristics and causes of trauma along the series. SD: standard deviation.
Table 2.
Evolution of patient characteristics and causes of trauma along the series. SD: standard deviation.
| STUDY PERIODS | 1 | 2 | 3 | 4 |
| n | 184 | 206 | 191 | 187 |
| Age (mean, +/- SD) | 38 (+/- 17) | 38 (+/- 17) | 42 (+/-21) | 54 (+/-22) |
| Sex | ||||
| Male | 137 (75%) | 151 (73%) | 143 (75%) | 117 (63%) |
| Female | 47 (25%) | 55 (27%) | 48 (25%) | 70 (37%) |
| COMORBIDITY | ||||
| No history | 145 (79%) | 101 (49%) | 91 (48%) | 72 (39%) |
| Hypertension | 0 | 6 (3%) | 20 (10%) | 39 (21%) |
| Cardiopathy | 0 | 3 (1%) | 6 (3%) | 14 (7%) |
| Ischemic heart disease | 0 | 7 (3%) | 6 (3%) | 10 (5%) |
| Diabetes | 0 | 6 (3%) | 6 (3%) | 20 (11%) |
| Anticoagulation | 0 | 6 (3%) | 5 (3%) | 22 (12%) |
| Substance abuse | 6 (3%) | 16 (8%) | 8 (4%) | 8 (4%) |
| Alcoholism | 5 (3%) | 14 (7%) | 8 (4%) | 5 (3%) |
| Psychiatric disorder | 5 (3%) | 16 (8%) | 17 (9%) | 24 (13%) |
| CAUSE OF TRAUMA | ||||
| Car | 52 (28%) | 59 (29%) | 24 (13%) | 12 (6%) |
| Motorcycle | 24 (13%) | 31(15%) | 37 (19%) | 18 (10%) |
| Bicycle | 2 (1%) | 2 (1%) | 2 (1%) | 5 (3%) |
| Pedestrian | 59 (32%) | 32 (16%) | 49 (26%) | 59 (32%) |
| Fall | 40 (22%) | 36 (17%) | 53 (28%) | 68 (36%) |
| Suicide | 0 | 6 (3%) | 10 (5%) | 25 (13%) |
| Firearm | 4 (2%) | 7 (3%) | 5 (3%) | 3 (2%) |
| Sharp weapon | 1 (0,5%) | 2 (1%) | 4 (2%) | 1 (0,5%) |
Table 3.
Main epidemiological changes in PTBI caused by traffic accidents.
| TRAUMA BY CAR ACCIDENT | TRAUMA BY MOTORCYCLE ACCIDENT | |||||||
| Period | 1 | 2 | 3 | 4 | 1 | 2 | 3 | 4 |
| n | 52 | 59 | 24 | 12 | 24 | 31 | 37 | 18 |
| Age (mean +/- SD) | 34 (+/- 14) | 34 (+/- 14) | 26 (+/-8) | 41 (+/-21) | 24 (+/-6) | 29 (+/-12) | 33 (+/-13) | 37 (+/-14) |
| Seat-belt/Helmet n/%(n/%) | 7 (13%) | 18 (31%) | 12 (50%) | 9 (75%) | 8 (33%) | 11 (35%) | 21 (57%) | 16 (89%) |
| Scales | ||||||||
| •GCS | 5 (3-9) | 8 (5-12) | 7 (3-14) | 6 (4-15) | 4 (3-10) | 6 (3-11) | 7 (3-13) | 11 (6-15) |
| •IIS | 34 (24-50) | 30 (19-38) | 26 (20-34) | 34 (26-36) | 29 (22-42) | 26 (20-36) | 28 (22-24) | 27 (18-34) |
| •NISS | 36 (25-50) | 34 (25-43) | 29 (26-41) | 34 (29-41) | 38 (25-47) | 31 (25-41) | 29 (22-37) | 29 (22-34) |
| Mortality | ||||||||
| •Total | 17 (32%) | 18 (33%) | 4 (15%) | 4 (33%) | 5 (20%) | 9 (30%) | 4 (11%) | 2 (11%) |
| •On arrival | 3 (6%) | 1 (2%) | 1 (4%) | 0 | 0 | 0 | 1 (3%) | 0 |
| •CNS injury | 13 (24%) | 13 (24%) | 4 (16%) | 4 (33%) | 3 (12%) | 9 (30%) | 4 (11%) | 2 (11%) |
Table 4.
Evolution of mortality along the study periods. GCS: Glasgow Coma Scale; ISS: Injury Seerity Score; NISS: New Injury Severity Score; ICU: Intensive Care Unit; CNS: Central Nervous System.
Table 4.
Evolution of mortality along the study periods. GCS: Glasgow Coma Scale; ISS: Injury Seerity Score; NISS: New Injury Severity Score; ICU: Intensive Care Unit; CNS: Central Nervous System.
| PERIODS | 1 | 2 | 3 | 4 |
| n | 184 | 206 | 191 | 187 |
| TRAUMA SCORES | ||||
| GCS | 3 (3-9) | 8 (3-12) | 7 (3-13) | 11 (6-15) |
| ISS | 34 (25-50) | 27 (17-36) | 25 (19-34) | 25 (16-34) |
| NISS | 41 (29-50) | 32 (22-41) | 29 (24-38) | 29 (22-38) |
| INJURY DISTRIBUTION PER REGION (AIS) | ||||
| Head | 5 (4-5) | 4 (3-4) | 4 (3-4) | 4 (3-5) |
| Face | 0 | 0 (0-1) | 0 (0-2) | 0 (0-2) |
| Thorax | 3 (0-4) | 3 (0-4) | 1 (0-3) | 0 (0-3) |
| Abdomen | 0 (0-2) | 0 | 0 (0-2) | 0 (0-2) |
| Extremities | 2 (0-3) | 2 (0-3) | 0 (0-3) | 0 (0-3) |
| Skin | 0 | 0 (0-1) | 0 (0-1) | 0 |
| INITIAL SURGERIES | ||||
| Chest tube | 43 (23%) | 44 (21%) | 39 (20%) | 43 (23%) |
| Emergent surgery | 95 (52%) | 114 (55%) | 99 (52%) | 80 (43%) |
| Neurosurgery | 27(15%) | 58 (28) | 57 (30%) | 34 (18%) |
| ICU ADMITTANCE | ||||
| ICU | 146 (79%) | 181 (88%) | 167 (87%) | 147 (79%) |
| MORTALITY | ||||
| Total | 75 (41%) | 73 (35%) | 58 (30%) | 57 (30%) |
| On arrival | 29 (16%) | 10 (5%) | 15 (8%) | 10 (5%) |
| First day | 61 (33%) | 53 (26%) | 26 (14%) | 27 (14%) |
| CAUSE OF DEATH | ||||
| CNS injury | 52 (28%) | 61 (30%) | 47 (25%) | 52 (28%) |
| Exsanguination | 9 (5%) | 14 (7%) | 14 (7%) | 3 (2%) |
| Sepsis | 2 (1%) | 6 3%) | 4 (2%) | 1 (0,5%) |
| Multiorgan failure | 3 (2%) | 8 (4%) | 1 (0,5%) | 1 (0,5%) |
| Cardio-respiratory | 2 (1%) | 8 (4%) | 3 (1%) | 3 (2%) |
| Distributive shock | 1 (0,5%) | 2 (1%) | 2 (1%) | 0 |
Table 5.
Statistical analysis of mortality rates based on different variables. HR: Hazar Ratio; CI: Confidence Interval; CPR: Cardiopulmonary resuscitation; GCS: Glasgow Coma Scale; ISS: Injury Severity Score; NISS: New Injury Severity Score.
Table 5.
Statistical analysis of mortality rates based on different variables. HR: Hazar Ratio; CI: Confidence Interval; CPR: Cardiopulmonary resuscitation; GCS: Glasgow Coma Scale; ISS: Injury Severity Score; NISS: New Injury Severity Score.
| VARIABLE | p | HR | CI 95% |
| PATIENTS | |||
| Advanced age | <0,001 | 1,01 | 1,004 - 1,016 |
| Period 4 | <0,001 | 0,806 | 0,717 - 0,906 |
| Ischemic heart disease | 0,017 | 1,977 | 1,128 - 3,463 |
| TYPE OF TRAUMA | |||
| Penetrating trauma | <0,004 | 2,118 | 1,276 - 3,517 |
| Motorcycle RTA | <0,001 | 0,457 | 0,289 - 0,721 |
| Fall from height | 0,005 | 1,458 | 1,124 - 1,892 |
| Fire weapon | <0,001 | 2,549 | 1,457 - 4,457 |
| INITIAL ASSISTANCE | |||
| Intubation | <0,001 | 2,677 | 1,950 - 3,674 |
| CPR | <0,001 | 6,323 | 4,344 - 9,202 |
| Initial Shock | <0,001 | 2,808 | 2,161 - 3,648 |
| Fixed pupil | <0,001 | 2,851 | 2,180 - 3,728 |
| GCS | <0,001 | 0,82 | 0,790 - 0,851 |
| Normal systolic pressure | <0,001 | 0,988 | 0,984 - 0,991 |
| ISS | <0,001 | 1,055 | 1,045 - 1,064 |
| NISS | <0,001 | 1,058 | 1,049 - 1,067 |
| INITIAL SURGERY | |||
| Chest tube | <0,001 | 1,544 | 1,185 - 2,011 |
| Emergent surgery | <0,001 | 0,394 | 0,303 - 0,511 |
| Limb surgery | <0,001 | 0,133 | 0,071 - 0,252 |
| Abdominal surgery | 0,002 | 1,785 | 1,231 - 2,588 |
Disclaimer/Publisher’s Note: The statements, opinions and data contained in all publications are solely those of the individual author(s) and contributor(s) and not of MDPI and/or the editor(s). MDPI and/or the editor(s) disclaim responsibility for any injury to people or property resulting from any ideas, methods, instructions or products referred to in the content. |
© 2025 by the authors. Licensee MDPI, Basel, Switzerland. This article is an open access article distributed under the terms and conditions of the Creative Commons Attribution (CC BY) license (http://creativecommons.org/licenses/by/4.0/).
Copyright: This open access article is published under a Creative Commons CC BY 4.0 license, which permit the free download, distribution, and reuse, provided that the author and preprint are cited in any reuse.


