
Submitted:
08 August 2025
Posted:
11 August 2025
You are already at the latest version
Abstract
This study aimed to compare the anthropometric and performance characteristics of U16 and U18 male basketball players to better understand post-peak height velocity (PHV) developmental differences. A total of 31 athletes from the local international basketball academy participated in the research—15 from the U16 category (15.25 ± 0.86 years) and 16 from the U18 category (17.46 ± 0.34 years). Measurements included body composition, sprinting (with and without the ball), agility, and jump performance. The results revealed significant between-group differences in most anthropometric variables (p < 0.001), including body mass, BMI, skeletal muscle mass, fat-free mass, total body water, and segmental muscle mass. However, there were no significant differences in body height and body fat percentage. Performance comparisons showed that U18 players outperformed U16 players in agility (p = 0.026), 10m and 20m sprint (p = 0.045 and p = 0.016, respectively), and 20m dribbling sprint (p = 0.011), while no significant differences were observed in jumping ability. These findings suggest that physical maturation strongly influences anthropometric parameters and partially affects performance characteristics. The results highlight the importance of age-appropriate training strategies that consider biological development stages in youth basketball.
Keywords:
team sports
; post – PHV
; anthropometry
; body composition
1. Introduction
Basketball is a physically demanding sport characterized by short, intense bouts of activity, often performed at medium to high frequency [1,2]. Players are required to execute repeated sprints, jumps, acceleration and deceleration, and rapid changes in direction throughout the game [3,4]. These actions place significant demands on both aerobic and anaerobic energy systems, which must be well-developed to maintain high-intensity performance [5]. Consequently, the ability to perform intermittent high-intensity actions is essential for success in basketball [6].
Athletic performance, particularly in basketball, is highly influenced by physical characteristics. Although the physical and performance characteristics in senior basketball players are well documented [7,8,9], younger athletes’ characteristics can vary significantly based on the maturational stage and body size [10,11,12]. Maturation has a notable influence on growth and physical performance, with substantial differences observed between various age groups [13,14]. As players progress through developmental stages, structural and functional body changes occur, affecting their athletic performance [11]. This relationship highlights the importance of maturation in shaping physical capabilities and sports performance metrics [11,13].
A key indicator of maturational progress is peak height velocity (PHV), a growth spurt typically occurring around the age of 14 in boys [15]. PHV marks a period of rapid growth, followed by a gradual decline until adult stature is reached. This growth phase is often used to assess an athlete's stage of maturation, providing insights into their developmental trajectory. Additionally, some authors previously stated that the period around the age of 14 (chronological) years is a critical period for training-related physiological development in youth [16,17,18]. Although PHV occurs around the age of 14, motor skills and morphological development continue to progress, albeit at a slower pace, throughout late adolescence.
Despite increasing interest in the physical and technical development of youth basketball players [13,19,20] and talent identification processes [10], limited research has focused on comparing performance metrics between specific age categories, such as U16 and U18 [21]. Therefore, “post-PHV” comparisons are critical for understanding how motor abilities evolve during crucial developmental years. Such analyses can upgrade training program design process, thus, ensuring that interventions are tailored to the unique physical and performance demands of each age group.
The aim of this study is to compare performance and anthropometric characteristics between U16 and U18 male basketball players in order to examine how they evolve during the post-PHV developmental phase. By identifying age-related differences in key performance and morphology variables, this study seeks to provide evidence-based insights that can inform age-appropriate training program design and support effective long-term athlete development strategies.
2. Materials and Methods
2.1. Participants
Thirty-one male basketball players who were selected from international basketball “KK Bosna” academy volunteered to participate in the present research, from which 15 athletes (age: 15.25 ± 0.86 (yrs ± SD)) were competing at the U16 and 16 athletes (age: 17.46 ± 0.34 (yrs ± SD)) were competing at the U18 competition level. All participants had experience in national-level competitions within the past two years and were consistently engaged in a weekly training regimen that comprises five 120-minute basketball practice sessions and one game. All participants, including their parents and coaches, were thoroughly briefed on the objectives and experimental methods of the study and provided their informed consent to participate. All athletes were medically cleared by the sports medicine team to participate in team activities. No athlete indicated any musculoskeletal injuries that might restrict or hinder testing procedures. The testing procedures carried out in this study adhered to the Declaration of Helsinki.
2.2. Measurements
All the measurements were performed by experienced personnel from the Institute of Sport at Faculty of Sport and Physical Education, University of Sarajevo. The testing protocols used in this study included body composition assessment, followed by the measurement of performance indicators such as sprinting, dribbling sprint, agility, and jumping performance. The testing was conducted on the same day during the pre-season competitive period on a first day of international basketball academy. Both groups of athletes were tested at the approximately same time of the day (i.e., 09:00–12:00 h).
2.2.1. Anthropometric measurement
Standing height was measured using a digital stadiometer (InBody BSM 370; Biospace Co., Ltd., Seoul, Republic of Korea). Body weight, fat-free mass (FFM), body fat percentage (PBF), skeletal muscle mass (SMM), total body water (TBW), and FFM for the left arm, right arm, left leg, right leg, and trunk were measured using a direct segmental high-frequency bioelectrical impedance scale (InBody 720; Biospace Co., Ltd., Seoul, Republic of Korea). The system's reliability and validity have been previously documented [22]. All subjects were barefoot and wearing only underwear during the test session. BMI was calculated as fraction of body weight and a square of the standing height (kg/m2).
2.2.2. Speed (without and with the ball)
The assessment of running speed involved participants performing 20-meter maximal sprints, with the passage at 5 and 10 meters (with and without the ball). Each sprint began from a stationary standing position, with the athlete's lead foot positioned 20cm behind the initial photocell. Four photocells (Witty, Microgate, Bolzano, Italy) were used to measure 5m, 10m and 20m maximal sprint times (in seconds). Photocells were placed at height of 120 cm. Each participant completed two attempts. In the case of a failed attempt (dropping the ball), the participants retook the test following a suitable recovery interval (two to three minutes pause). The best result was used for analysis.
2.2.3. Agility
The ability to quickly change direction without the ball was assessed using the Lane Agility Drill. Players began at the left corner of the extended free-throw line, where the timing sensors were positioned (Photocells, Witty, Microgate, Bolzano, Italy). The timer started as soon as the player moved from the set stance. They sprinted forward to the baseline cone (5.79 m), then side shuffled to the right to reach the next cone (4.87 m), backstepped to the top of the free-throw line (5.79 m), and side shuffled to the left to return to the starting point (4.87 m). This sequence was repeated in reverse order (shuffle right, sprint forward, shuffle left, run backward). The clock automatically stopped once the player returned to the starting position. Test time was recorded in seconds, and each player was allowed two attempts. The best result was used for analysis.
2.2.4. Jumping Performance
For assessment of the jumping performance, countermovement jump (CMJ) and countermovement jump free arms (CMJ free arms) were performed. Each jump was performed two times and measured with the Optojump Next system (Microgate, Bolzano, Italy), whose validity and reliability have been confirmed in previous studies [23]. Players began in an upright standing position with feet shoulder-width apart and hands placed on their hips to prevent arm swing for CMJ and hands next to the body for arm swing for CMJ free arms. Then, they performed a countermovement to a self-selected depth by bending at the hips and knees, followed by an immediate extension of the hips and knees to execute a vertical jump. After the jump, the players returned to their initial position. The best result from the two trials was used for analysis. A trial was deemed invalid if knee flexion occurred upon landing or if arm swing was detected (for CMJ).
2.3. Statistical analysis
Descriptive statistics, mean (standard deviation) were calculated for each variable. The normality of data distribution was checked for all variables using the Kolmogorov–Smirnov test, while Levene’s test was used to check the homogeneity of variance. Independent t-test was used to analyze significant differences between U16 and U18 in all performance and anthropometric variables. Effect sizes (ES) were calculated and interpreted based on Cohen’s d thresholds of > 0.2 - small, > 0.5 – moderate, > 0.8 – large and > 1.3 very large [24]. Statistical significance was set a priori to p < 0.05. All statistical analyses were completed with SPSS (Version 21.0; IBM Corp., Armonk, NY, USA).
3. Results
The Levene’s and Kolmogorov – Smirnov tests indicated that homogeneity and normality of data distribution were adequate for all tests.
3.1. Anthropometric measures
The results showed significant differences in all anthropometric variables (Table 1) except body height and body fat percentage (PBF%). For U18 players body mass (kg) was 18.3 ± 1.1% higher (p = 0.001; ES = 1.69) than in U16 players, BMI (kg/m2) for 13.9 ± 5.3% (p = 0.001; ES = 1.58), Skeletal muscle mass (SMM (kg)) for 18. 8± 7.0% (p = 0.001; ES = 2.34), Fat free mass (FFM(kg)) for 17.2 ± 7.0% (p = 0.001; ES = 2.20), Total body water (TBW (l)) for 17.0 ± 7.0% (p = 0.001; ES = 2.13), left and right arm FFM for 21.4 ± 9.0% (p = 0.001; ES = 2.06) and 23.1 ± 10.0% (p = 0.001; ES = 2.36), left and right leg FFM for 11.6 ±10.2% (p = 0.001; ES =1.19) and 11.9 ± 10.0% (p = 0.001; ES = 1.22) as well as FFM of Trunk (kg) for 17.7 ± 7.8% (p = 0.001; ES = 2.24), respectively.
3.2. Sprint, agility and jumping
Furthermore, there were fewer significant differences in performance variables (Table 2). For 5m both sprint and dribbling, 10m with dribbling time as well as for CMJ and CMJ free arms jump height no significant differences were observed (p>0.05) between U16 and U18 players. For U18 players 10m sprint, 20m sprint, 20m dribbling sprint and Lain agility times were significantly lower (3.3 ± 0.3% (p = 0.045; ES = 0.78), 3.5 ± 0.3% (p = 0.016; ES = 0.95), 6.0 ± 0.7% (p = 0.011; ES = 1.03) and 5.2 ± 0.6% (p = 0.026; ES = 0.90) compared to U16 players, respectively.
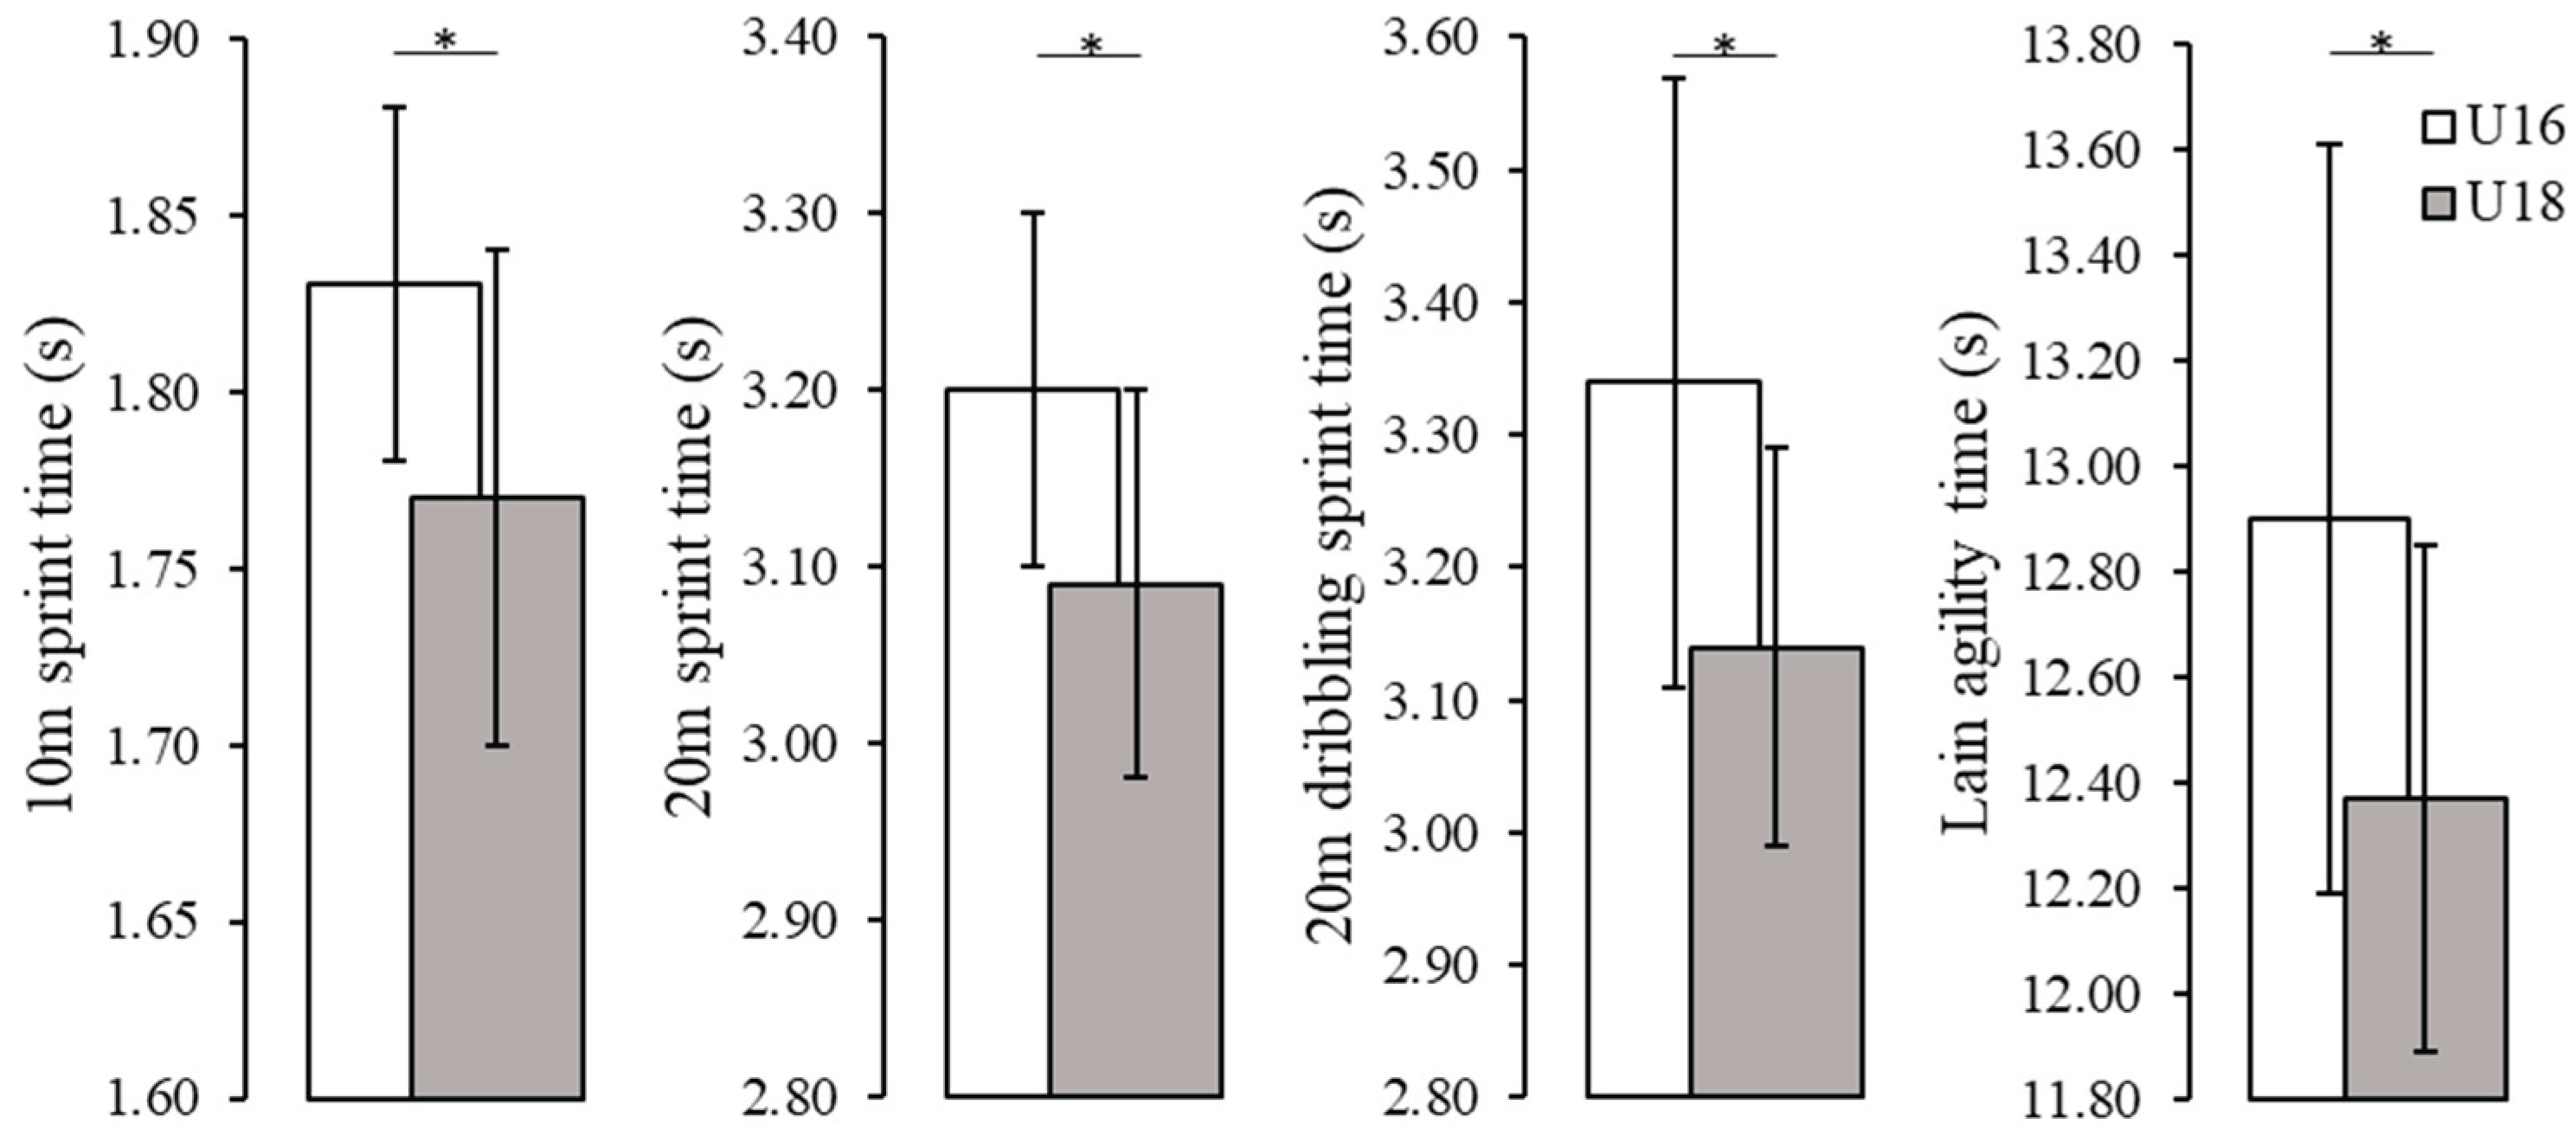
Figure 1.
Statistically significant differences in Speed and Agility Tests - U16 vs U18
4. Discussion
This study aimed to investigate the differences in a) performance and b) anthropometric measures between U16 and U18 male basketball players. The results showed U18 players were non significantly taller (but practically relevant) and had significantly more muscle and segmental fat free mass. They also outperform younger players in sprint (10m and 20m), dribbling (20m dribbling) and agility performance (Lain agility). No age-group differences were observed for body fat percentages and 5m sprint, 5 and 10m dribbling sprint as well as jump performance.
Observed results for anthropometric measures and performance were similar to those found by Drinkwater et al. [25] for National level players and Androutsopoulos et al. [26] for extended national roster. However, these authors had no between age group comparisons. To date, only Cabarkapa et al. [21] have compared U16 and U18 basketball players, however, their study focused exclusively on female athletes.
The findings of this study reveal no significant differences in body fat percentages between younger and older players. Similar results were reported by Cabarkapa et al. [21] in their study on female basketball players, where the authors attributed these differences to biological changes driven by variations in growth dynamics. Furthermore, the aforementioned researchers noted that muscle mass and segmental fat free mass did differ between two groups which is also the case in the present study. This indicates that gender does not affect the observed pattern of differences across these age groups.
The observed differences in body composition between U16 and U18 basketball players can be attributed to the natural physical and hormonal changes associated with male adolescence, as well as the increased training loads typically introduced during the later stages of puberty [21,27,28]. This also underlines the fact that this age period as important in male athletes’ development, namely because adolescent’s response and adaptation to training stimulus is increased.
Along with higher muscle mass, older players had better speed and agility performances, respectively. Quantity of muscle mass is related to better power abilities, possibly arising the determined differences for some sprint and agility tests between U16 and U18 players [21,25,29]. Furthermore, a significant correlation exists between players' ageing and increased playing time [29], likely contributing to performance improvements supported with already enhanced training load with age. Furthermore, chronologically older players were heavier and had more muscle mass which contributed to better sprinting, dribbling and agility performance. Since previous studies mainly investigated topic of talent ID based on anthropometrics [30,31] the findings of this study suggest performance indicators should be included in selection criteria development, talent identification and team composition, particularly since physical maturity often correlates with superior performance.
While studies on age-related differences in body size and performance may appear less relevant as the effects diminish with advancing age and higher playing levels, understanding these phenomena is essential due to several reasons. Firstly, detection of the differences is critical for talent identification, helping to differentiate early developers from late bloomers, minimize selection biases toward early-maturing athletes, and better evaluate long-term potential. Secondly, they enable performance benchmarking, allowing for the assessment of player progression, identification of contributing factors, monitoring of growth and maturation rates, sport-specific development, and training loads optimization.
This cross-sectional study is limited by its single-season sample and its reliance on “controlled” tests rather than on-court performance simulations or, additionally, power assessments such as force-platform jumps. Future longitudinal investigations should track athletes through puberty in order to distinguish growth- versus training-induced performance gains and adaptations.
5. Conclusions
In summary, the present study reveals that substantial differences exist between U16 and U18 male basketball players across a wide range of anthropometric, motor, and functional variables. The superior performance observed in the older U18 cohort can be primarily attributed to interrelated factors such as more advanced biological maturation, greater training experience, and increased exposure to competitive environments. U18 players demonstrated greater height, muscle mass, and superior sprint and agility performance compared to their U16 peers, while body fat percentage, short-distance dribbling, and jump capacities remained largely comparable. These findings underscore the importance of incorporating maturity-adjusted anthropometric data alongside performance testing, particularly for talent identification and for recognizing sensitive periods for strength and power development in young male athletes.
Acknowledging these developmental discrepancies enables coaches and practitioners to implement age-specific training programs that address the unique physiological and psychological needs of players during and after the peak height velocity (PHV) period. Strategically adapting training to these stages not only enhances athletic performance but also contributes to the long-term health, safety, and overall development of youth athletes by minimizing the risk of overuse injuries and burnout.
Author Contributions
Conceptualization, D.I.A., D.Č. and C.I.A.; methodology, D.Č., N.Č., C.I.A. and D.I.A.; software, D.Č., N.Č. and O.D..; validation, O.D., M.C.M., E.A., E.A.M. and C.I.A; formal analysis, D.Č., N.Č.; investigation, D.I.A., D.Č. and N.Č.; resources, M.C.M., O.D., C.I.A. and E.A.M; data curation, E.A.M., O.D. and E.A.; writing—original draft preparation, D.I.A., D.Č., N.Č. and E.A.M.; writing—review and editing, D.I.A., E.A., D.Č., C.I.A., E.A.M., N.Č., M.C.M. and O.D.; visualization, E.A.M., C.I.A., E.A. and M.C.M.; supervision, D.I.A., D.Č., and E.A.; project administration, D.I.A., D.Č. and M.C.M.; funding acquisition, O.D. and M.C.M. All authors have read and agreed to the published version of the manuscript.
Funding
This research received no external funding.
Institutional Review Board Statement
The study was conducted in accordance with the Declaration of Helsinki, and approved by the Ethics Committee of the Faculty of Sports and Physical Education, University of Sarajevo (0101-678-1/24 dated 20.01.2024).
Informed Consent Statement
Informed consent was obtained from all subjects involved in the study.
Data Availability Statement
The data presented in this study are available upon reasonable request from the corresponding author.
Acknowledgments
Dan Iulian Alexe and Cristina Ioana Alexe thank the “Vasile Alecsandri” University of Bacău, Romania, for their support and assistance.
Conflicts of Interest
The authors declare no conflicts of interest.
References
- Meckel Y, Gottlieb R, Eliakim A. Repeated sprint tests in young basketball players at different game stages. European journal of applied physiology. 2009 Oct;107:273-9. [CrossRef]
- Meckel Y, Machnai O, Eliakim A. Relationship among repeated sprint tests, aerobic fitness, and anaerobic fitness in elite adolescent soccer players. The Journal of Strength & Conditioning Research. 2009 Jan 1;23(1):163-9. [CrossRef]
- Gantois P, Aidar FJ, Dantas MP, Silva LM, Paes PP, Santana EE, Dantas PM, Cabral BG. Aerobic fitness is associated with improved repeated sprints ability of basketball players after six weeks of training during preseason. Revista Brasileira de Cineantropometria & Desempenho Humano. 2018;20(1):114-24. [CrossRef]
- Pehar M, Sekulic D, Sisic N, Spasic M, Uljevic O, Krolo A, Milanovic Z, Sattler T. Evaluation of different jumping tests in defining position-specific and performance-level differences in high level basketball players. Biology of sport. 2017 Jan 1;34(3):263-72. [CrossRef]
- Gottlieb R, Shalom A, Calleja-Gonzalez J. Physiology of basketball–field tests. Review Article. Journal of human kinetics. 2021 Jan 30;77:159. [CrossRef]
- Abdelkrim NB, El Fazaa S, El Ati J. Time–motion analysis and physiological data of elite under-19-year-old basketball players during competition. British journal of sports medicine. 2007 Feb 1;41(2):69-75. [CrossRef]
- Rinaldo N. , Toselli S. , Gualdi-Russo E. , Zedda N. , & Zaccagni L.. Effects of anthropometric growth and basketball experience on physical performance in pre-adolescent male players. International Journal of Environmental Research and Public Health 2020;17(7):2196. [CrossRef]
- Jawabreh L. , Tounsi M. , Racil G. , Padulo J. , Migliaccio G. , Russo L. et al.. Specific physical performances of young male basketball players in palestine: an assessment by maturity status. Children 2025;12(1):64. [CrossRef]
- Alemdaroğlu U. The relationship between muscle strength, anaerobic performance, agility, sprint ability and vertical jump performance in professional basketball players. Journal of human kinetics. 2012 Apr 3;31:149. [CrossRef]
- Čaušević, D.; Čović, N.; Abazović, E.; Rani, B.; Manolache, G.M.; Ciocan, C.V.; Zaharia, G.; Alexe, D.I. Predictors of Speed and Agility in Youth Male Basketball Players. Appl. Sci. 2023, 13, 7796. [CrossRef]
- Barazetti L. , Varoni P. , Campos F. , Demarchi M. , Baumann L. , Teixeira A. et al.. Comparison of maturation and physical performance in basketball athletes of different playing positions. Revista Brasileira De Cineantropometria &Amp; Desempenho Humano 2019;21. [CrossRef]
- Gryko K. , Adamczyk J. , Kopiczko A. , Calvo J. , Calvo A. , & Mikołajec K.. Does predicted age at peak height velocity explain physical performance in u13–15 basketball female players?. BMC Sports Science, Medicine and Rehabilitation 2022;14(1). [CrossRef]
- Čović N, Čaušević D, Alexe CI, Rani B, Dulceanu CR, Abazović E, Lupu GS, Alexe DI. Relations between specific athleticism and morphology in young basketball players. Frontiers in Sports and Active Living. 2023 Oct 9;5:1276953. [CrossRef]
- García F, Castellano J, Reche X, Vázquez-Guerrero J. Average game physical demands and the most demanding scenarios of basketball competition in various age groups. Journal of Human Kinetics. 2021 Jul 28;79:165. [CrossRef]
- Monasterio X. , Gil S. , Bidaurrazaga-Letona I. , Lekue J. , Diaz-Beitia G. , Santisteban J. et al.. Peak height velocity affects injury burden in circa-phv soccer players. International Journal of Sports Medicine 2022;44(04):292-297. [CrossRef]
- Tsutsui T. , Iizuka S. , Sakamaki W. , Maemichi T. , & Torii S.. Growth until peak height velocity occurs rapidly in early maturing adolescent boys. Children 2022;9(10):1570. [CrossRef]
- Pineau J.. Prediction of male basketball players' adult stature from the age of 13 years using chronological age and maturity. The Journal of Sports Medicine and Physical Fitness 2019;59(4). [CrossRef]
- Retzepis N. , Avloniti A. , Kokkotis C. , Protopapa M. , Stampoulis T. , Gkachtsou A. et al.. Identifying key factors for predicting the age at peak height velocity in preadolescent team sports athletes using explainable machine learning. Sports 2024;12(11):287. [CrossRef]
- Fort-Vanmeerhaeghe A, Montalvo A, Latinjak A, Unnithan V. Physical characteristics of elite adolescent female basketball players and their relationship to match performance. Journal of human kinetics. 2016 Oct 15;53:167. [CrossRef]
- Guimarães E, Baxter-Jones AD, Williams AM, Tavares F, Janeira MA, Maia J. The role of growth, maturation and sporting environment on the development of performance and technical and tactical skills in youth basketball players: The INEX study. Journal of sports sciences. 2021 May 3;39(9):979-91. [CrossRef]
- Čabarkapa D. , Cabarkapa D. , Nagy D. , Szabó K. , Balogh L. , Sáfár S. et al.. Differences in anthropometric and vertical jump force-time characteristics between u16 and u18 female basketball players. Frontiers in Sports and Active Living 2024;6. [CrossRef]
- McLester CN, Nickerson BS, Kliszczewicz BM, McLester JR. Reliability and agreement of various InBody body composition analyzers as compared to dual-energy X-ray absorptiometry in healthy men and women. Journal of Clinical Densitometry. 2020 Jul 1;23(3):443-50. [CrossRef]
- Glatthorn J. , Gouge S. , Nussbaumer S. , Stauffacher S. , Impellizzeri F. , & Maffiuletti N.. Validity and reliability of optojump photoelectric cells for estimating vertical jump height. Journal of Strength and Conditioning Research 2011;25(2):556-560. [CrossRef]
- Carson C. The effective use of effect size indices in institutional research. In31st Annual conference proceedings 2012 (Vol. 41, pp. 41-48).
- Drinkwater EJ, Hopkins WG, McKenna MJ, Hunt PH, Pyne DB. Modelling age and secular differences in fitness between basketball players. Journal of sports sciences. 2007 Jun 1;25(8):869-78. [CrossRef]
- Androutsopoulos P, Blantas I, Papadopoulos K, Lapsanis K, Eleftheriadis G, Alexopoulos P. Physiological Profile of Speed, Agility and Jumping Ability of Elite U16 Basketball Players. International Journal of Basketball Studies. 2022 Dec 8;1(2):64-73. [CrossRef]
- Ribeiro BG, Mota HR, Sampaio-Jorge F, Morales AP, Leite TC. Correlation between body composition and the performance of vertical jumps in basketball players. J. Exerc. Physiol. Online. 2015 Oct 1;18:69-79.
- Sansone P, Makivic B, Csapo R, Hume P, Martínez-Rodríguez A, Bauer P. Body fat of basketball players: a systematic review and meta-analysis. Sports Medicine-Open. 2022 Dec;8(1):26. [CrossRef]
- Arrieta H, Torres-Unda J, Gil SM, Irazusta J. Relative age effect and performance in the U16, U18 and U20 European Basketball Championships. Journal of sports sciences. 2016 Aug 17;34(16):1530-4. [CrossRef]
- Blantas I, Androutsopoulos P, Papadopoulos K, Lapsanis K, Eleftheriadis G, Alexopoulos P. Physiological and Anthropometric Measurements of Young Basketball Players: Selection Criteria in National Teams. Journal of Modern Education Review. 2021;11(10):1077-88. [CrossRef]
- Ibáñez SJ, Mazo A, Nascimento J, García-Rubio J. The Relative Age Effect in under-18 basketball: Effects on performance according to playing position. PloS one. 2018 Jul 9;13(7):e0200408. [CrossRef]

Table 1.
Descriptive statistics and between group comparisons of anthropometric characteristics.
| Variables | U16 | U18 | p value | ES | ||
| Mean | SD | Mean | SD | |||
| Age (years) | 15.25 | 0.86 | 17.46 | 0.34 | - | - |
| Body height (cm) | 191.29 | 7.66 | 195.52 | 5.86 | 0.097 | 0.64 |
| Body mass (kg) | 72.79 | 9.71 | 89.14 | 9.62 | 0.001 | 1.69 |
| BMI (kg/m2) | 20.02 | 1.98 | 23.25 | 2.09 | 0.001 | 1.58 |
| SMM (kg) | 36.79 | 3.31 | 45.26 | 3.79 | 0.001 | 2.34 |
| PBF (%) | 9.80 | 4.48 | 11.23 | 3.64 | 0.347 | .356 |
| FFM (kg) | 65.30 | 5.81 | 78.86 | 6.36 | 0.001 | 2.20 |
| TBW (l) | 47.95 | 4.24 | 57.75 | 4.65 | 0.001 | 2.13 |
| FFM of Left Arm (kg) | 3.65 | 0.46 | 4.64 | 0.48 | 0.001 | 2.06 |
| FFM of Right Arm (kg) | 3.64 | 0.45 | 4.73 | 0.46 | 0.001 | 2.36 |
| FFM of Left Leg (kg) | 11.58 | 1.35 | 13.09 | 1.20 | 0.003 | 1.19 |
| FFM of Right Leg (kg) | 11.63 | 1.33 | 13.20 | 1.23 | 0.003 | 1.22 |
| FFM of Trunk (kg) | 28.40 | 2.71 | 34.48 | 2.70 | 0.001 | 2.24 |
BMI - body mass index; ES – effect size; FFM = fat free mass; PBF = body fat percentage; SD = standard deviation; SMM - skeletal muscle mass; TBW – total body water.
Table 2.
Descriptive statistics and between group comparisons for performance variables.
| Variables | U16 | U18 | p-value | ES | ||
| Mean | SD | Mean | SD | |||
| 5m sprint (s) | 1.08 | 0.05 | 1.03 | 0.07 | 0.186 | 0.50 |
| 10m sprint (s) | 1.83 | 0.06 | 1.77 | 0.07 | 0.045 | 0.78 |
| 20m sprint (s) | 3.20 | 0.10 | 3.09 | 0.11 | 0.016 | 0.95 |
| 5m dribbling sprint (s) | 1.05 | 0.11 | 1.04 | 0.12 | 0.797 | 0.09 |
| 10m dribbling sprint (s) | 1.85 | 0.11 | 1.82 | 0.10 | 0.511 | 0.24 |
| 20m dribbling sprint (s) | 3.34 | 0.23 | 3.14 | 0.15 | 0.011 | 1.03 |
| Lain agility (s) | 12.90 | 0.71 | 12.37 | 0.48 | 0.026 | 0.90 |
| CMJ (cm) | 36.24 | 5.93 | 38.02 | 6.03 | 0.431 | 0.29 |
| CMJ free arms (cm) | 44.36 | 5.93 | 45.11 | 4.17 | 0.687 | 0.15 |
CMJ - countermovement jump.
Disclaimer/Publisher’s Note: The statements, opinions and data contained in all publications are solely those of the individual author(s) and contributor(s) and not of MDPI and/or the editor(s). MDPI and/or the editor(s) disclaim responsibility for any injury to people or property resulting from any ideas, methods, instructions or products referred to in the content. |
© 2025 by the authors. Licensee MDPI, Basel, Switzerland. This article is an open access article distributed under the terms and conditions of the Creative Commons Attribution (CC BY) license (http://creativecommons.org/licenses/by/4.0/).
Copyright: This open access article is published under a Creative Commons CC BY 4.0 license, which permit the free download, distribution, and reuse, provided that the author and preprint are cited in any reuse.


