
Submitted:
09 August 2025
Posted:
11 August 2025
You are already at the latest version
Abstract
This study presents an effective route for producing functionally graded metal matrix composites with enhanced abrasion wear resistance by incorporating ex situ Fe–WC preforms into austenitic stainless-steel castings. The preforms, produced by cold-pressing mixed WC and Fe powders, were positioned in the desired locations in sand molds and reacted in situ with the molten steel during casting. This process generated a metallurgically bonded reinforcement zone with a continuous microstructural and compositional gradient, characteristic of a Functionally Graded Material (FGM). Near the surface, the microstructure consisted of a martensitic matrix with WC particles and (W,Fe,Cr)₆C carbides, while towards the base metal it transitioned to austenitic dendrites with an interdendritic network of Cr and W rich carbides, including (W,Fe,Cr)₆C, (Fe,Cr,W)₇C₃, and (Fe,Cr,W)₂₃C₆. Vickers hardness measurements revealed surface-adjacent values (969 ± 72 HV 30) approximately six times higher than those of the base alloy, and micro abrasion tests demonstrated a 70% reduction in micro-abrasion wear rate in the reinforced zones. These findings show that WC dissolution during casting enables tailored hardness and abrasion wear performance, offering an accessible manufacturing solution for high-demand mechanical environments.
Keywords:
abrasion wear resistance
; austenitic stainless steel
; carbide precipitation
; casting fabrication
; functionally graded material (FGM)
; hardness gradient
; metal matrix composite (MMC)
; microstructure
; surface reinforcement
; tungsten carbide (WC)
1. Introduction
Austenitic stainless steels are the most widely used type of stainless steel, primarily due to their excellent corrosion resistance in both aqueous and high-temperature environments. These materials are extensively employed in industries such as marine, petrochemical, chemical, nuclear, biomedical, pharmaceutical, and food processing, where superior corrosion resistance, mechanical strength, toughness, conformability, and weldability are crucial for performance [1,2,3]. Specific grades of austenitic stainless steel are suitable for pressure-containing components operating at temperatures exceeding 500 °C, even in aggressive environments such as sulfuric acid exposure [4].
Despite their remarkable corrosion resistance and mechanical properties, austenitic stainless steels exhibit poor wear resistance, which restricts their use in applications requiring high corrosion and wear resistance. In such cases, martensitic stainless steels are typically preferred, which limits their applicability in components subjected to both mechanical and corrosive wear. An alternative method to improve the wear resistance of austenitic stainless-steel components involves locally reinforcing the surface with hard metal matrix composites (MMCs), in particular those incorporating tungsten carbide (WC) particles. This technique offers the advantage of producing components with complex geometries while maintaining superior corrosion and wear resistance [5,6].
Several methods have been investigated to reinforce stainless steel with WC particles, including physical and chemical vapor deposition, laser cladding, plasma cladding, arc welding, and brazing [7,8,9]. Although these techniques enhance surface wear resistance, they typically involve multiple processing steps and require expensive equipment, which increases both production costs and time. An alternative approach involves integrating WC-reinforced zones directly into cast stainless steel components. Previous studies have investigated pressure-driven infiltration processing, lost model techniques, and centrifugal casting, while recent efforts have shown the successful incorporation of Fe-WC preforms using an ex situ powder metallurgy-based technique [10,11,12,13]. More recently, Purwadi et al. [14] studied the direct use of WC–Co tool tip scraps as ex situ reinforcements during casting, proving the formation of graded microstructures and enhanced wear resistance in Hadfield steels. These studies further settle the potential of cast WC-based reinforcements as cost-effective and efficient solutions for functional surface engineering.
Recent research has proved that MMCs produced via casting or additive manufacturing can achieve functionally graded designs, where the composition and hardness vary gradually in depth. For instance, studies using laser-based powder deposition (DED, LPBF) with WC reinforcement in stainless steels reveal gradients in phase formation and mechanical performance, aligning with the assumptions of FGMs [15,16,17]. Centrifugally cast FGMs composed of WC-reinforced low carbon steel show spatial variation in properties and tribological behavior [16]. FGMs are designed to minimize residual stress, improve bonding, and specific local performance, making them ideal for critical wear applications. Experimental studies on WC-based MMCs produced by casting and laser-based techniques have confirmed that graded microstructures significantly enhance mechanical integrity and wear performance under service conditions [15,16,17].
This study investigates the behavior of cast austenitic stainless-steel specimens locally reinforced with WC particles using the ex situ technique. This study aims to correlate the observed microstructural and hardness gradients with the mechanical and abrasion wear performance of the material. The composite microstructure was characterized via scanning electron microscopy with energy-dispersive spectroscopy (SEM/EDS), while Vickers hardness and ball-cratering micro-abrasion tests were used to evaluate the mechanical behavior. A detailed understanding of the relationship between phase hardness and micro-abrasion wear behavior is essential for improving the design and manufacturing of reinforced stainless-steel parts intended for demanding industrial applications.
2. Materials and Methods
Cylindrical specimens (45 mm diameter) with parallelepiped reinforcements measuring approximately 31 mm × 12 mm × 6 mm were produced by pressureless sand casting. A schematic of one specimen is presented in Figure 1. To produce the powder compacts, WC (=78 µm, 99.0 wt.% purity) and Fe (=10 µm, 99.0 wt.% purity) powders (from Alfa Aesar, ThermoFisher (Kandel, Germany) GmbH) were weighed and mixed for seven hours in a volume ratio of 40:60 (WC:Fe). This composition was selected based on literature data. The mixture was then cold-pressed in a metallic mold at approximately 230 MPa. Then, the powder compacts were placed in the desired positions of the mold cavity, and the austenitic stainless steel (0.06 wt.% C, 0.79 wt.% Si, 0.80 wt.% Mn, 18.30 wt.% Cr, 11.07 wt.% Ni, 2.41 wt.% Mo, 0.31 wt.% Cu, and balance Fe) was poured at 1620 °C. The chemical analysis of the molten metal was performed by optical emission spectrometry (MAXx LMM05, Spectro, Kleve, Germany). After casting, the cross-sectioned specimens were solution heat-treated at 1075 °C for two hours and water quenched to suppress undesirable precipitation.
Metallographic specimens were prepared and etched with 10% oxalic acid reagent. The microstructure of the base metal, composite zone, and bonding interface was characterized by scanning electron microscopy (SEM) using a FEI QUANTA 400 FEG (FEI Company, Hillsboro, OR, USA) with an energy-dispersive detector (EDS). SEM images were obtained with backscattered electron (BSE) and secondary electron (SE) detectors. The volume percentage of carbides in the composite zone was determined using ImageJ (V.1.53, NIH, USA) in conjunction with EDS maps at 500× magnification, as the OM and BSE-SEM images lacked sufficient contrast to differentiate between the carbides and matrix. Phase characterization was further supported by X-ray diffraction (XRD, Cu Kα radiation, Bruker D8 Discover; 2θ range: 20°–100°) and electron backscatter diffraction (EBSD).
Mechanical characterization of the reinforced specimens was accomplished using Vickers hardness testing and ball-cratering micro-abrasion tests. Bulk hardness was measured using Vickers hardness testing with a nominal load of 294.2 N, performed on a DuraVision 20 universal hardness tester (EMCO-TEST Prüfmaschinen GmbH, Kuchl, Austria). To assess hardness variation between each composite zone and the base metal, hardness profiles were obtained using a nominal load of 19.6 N. Seven measurements were taken for every reinforced sample and designated zone. Ten microhardness tests were conducted on each composite zone using a nominal load of 0.098 N to investigate its characteristics. Ball-cratering tests were performed using a Plint TE66 micro-scale abrasion tester (Plint & Partners Ltd., Newbury, England). A steel bearing ball (25 mm diameter, 60 HRC) was used as the counter body. The abrasive slurry consisted of a 0.35 g∙cm⁻³ suspension of SiC particles (4.5–6.5 µm), delivered to the sample at a constant rate of 3.5 mL∙min⁻¹ via a peristaltic pump. The rotation speed was set at 80 rpm with a constant load of 0.25 N. Additionally, specimens 5 mm thick were tested under sliding distances of 7.9, 15.7, 23.6, and 31.4 m, corresponding to 100, 200, 300, and 400 revolutions of the steel ball. The mean diameter of the micro-abrasion wear craters was measured using optical microscopy (OM) and processed with ImageJ (v1.53). The worn surfaces were further analyzed by scanning electron microscopy (SEM). The volume of worn material (V, in mm³) was then calculated, and the abrasive wear rate (K, in mm³·N⁻¹·mm⁻¹) was found using the Archard wear equation.
3. Results and Discussion
The microstructure of the formed composite and its bonding interface are shown in the SEM images presented in Figure 2. The figures reveal that the composite exhibits a multi-zonal microstructure comprising three distinct regions: CZ1 (nearest the surface), CZ2 (intermediate), and CZ3 (next to the base metal). The gradual variation in microstructural features along the reinforcement depth is characteristic of a Functionally Graded Material (FGM), where the structure changes continuously to balance surface hardness with internal toughness. The formation of this graded structure results from the partial dissolution of WC particles and subsequent carbide precipitation during solidification. Additionally, the absence of defects or discontinuities at the interface (Figure 2d) indicates a strong metallurgical bonding between the composite and the base metal.
CZ1 is characterized by a high amount of gray particles and several agglomerates of lighter particles, some of which exhibit a polygonal shape. The EDS maps in Figure 3 indicate that the lighter particles, usually found in the center of the agglomerates, are rich in W, suggesting that they are a type of W-carbide. These particles are rarely observed in the CZ2 zone. In CZ1, some of the gray particles also exhibit polygonal morphology, while in CZ2, they appear more prominently as plate-like structures. These features seem to be enriched in W and Fe, as indicated by the EDS maps in Figure 3c–f. The CZ3 zone is characterized by a dual-phase network located within the interdendritic regions (Figure 2c). EDS maps (Figure 3d,f,h) confirm the presence of particles enriched in W, Fe, and Cr.
XRD analysis (Figure 4) showed the presence of austenite (γ), martensite (α′), WC, M₆C, M₇C₃, and M₂₃C₆ phases within the composite zone. When combined with EDS results, the XRD data confirm that the surface-adjacent region (CZ1) contains carbides of WC and M₆C stoichiometry, where M represents W, Fe, and Cr. Their distribution in the microstructure is further proved in the SEM images shown in Figure 5. These results point to the fact that (W,Fe,Cr)₆C carbides formed due to the partial dissolution of WC particles in the molten metal, followed by carbide precipitation during cooling [8,9]. In addition, Figure 5b shows the presence of martensite in the matrix after chemical etching. This transformation is possible due to austenite destabilization caused by the precipitation of Cr-containing carbides, which reduce the C and Cr content in the matrix [2,4]. EBSD analysis of CZ1 (Figure 6) further confirms the presence of martensite and irregularly shaped (W,Fe,Cr)₆C precipitates observed near WC particles.
As shown in Figure 5c,d, extensive dissolution of WC particles occurred in the intermediate composite zone (CZ2). This dissolution led to the formation of irregular and plate-shaped (W,Fe,Cr)₆C precipitates, resulting from local enrichment of the matrix in carbon and tungsten. In this region, (Fe,Cr,W)₇C₃ carbides also formed. In some areas adjacent to these carbides, the presence of (Fe,Cr,W)₂₃C₆ was observed, suggesting a possible transformation from (Fe,Cr,W)₇C₃ to (Fe,Cr,W)₂₃C₆ (Figure 5c). A similar transformation has been reported in cast austenitic stainless steel exposed to service temperatures between 750-1000 °C [18]. Figure 7 displays the indexed Kikuchi patterns for the phases present in CZ2, that is, austenite (γ), (Fe,Cr,W)₇C₃, and (W,Fe,Cr)₆C. These phases were also presented in the XRD analysis shown in Figure 4.
The CZ3 composite zone, located adjacent to the base metal, is characterized by austenitic dendrites surrounded by a multiphase interdendritic network consisting of (Fe,Cr,W)₇C₆, (Fe,Cr,W)₂₃C₆, and (Fe,W,Cr)₆C carbides, as showed in Figure 5e,f and Figure 8a,b. Closer to the base metal, this network evolves into an almost dual-phase structure, predominantly composed of (Fe,Cr,W)₂₃C₆ and (Fe,W,Cr)₆C carbides (Figure 8b). In addition, thin plate-like (W,Fe,Cr)₆C carbides were seen precipitating within the austenitic matrix (Figure 5f). Figure 8 presents the indexed Kikuchi patterns of the phases shown in CZ3, including austenite (γ), (Fe,Cr,W)₇C₃, (Fe,Cr,W)₂₃C₆, and (Fe,W,Cr)₆C. These phases were also confirmed by the XRD results shown in Figure 4.
Quantifying the number of precipitated carbides in each composite zone (CZ) is essential for understanding the mechanical behavior of the reinforced alloy. Figure 9 summarizes the carbide volume fractions measured in each CZ. CZ1 exhibited the highest carbide content, with 39% comprising WC and (W,Fe,Cr)₆C carbides, and an average hardness of 969 ± 72 HV 30 — approximately six times higher than the base metal (Figure 10a). CZ2 showed a similar total carbide content, consisting of 32% WC and (W,Fe,Cr)₆C, and 7% of (Fe,Cr,W)₇C₃ and (Fe,Cr,W)₂₃C₆. CZ3 presented the lowest carbide fraction (29%), including 18% (Fe,W,Cr)₆C and 11% of (Fe,Cr,W)₇C₃ and (Fe,Cr,W)₂₃C₆. These results indicate a progressive decrease in W-rich carbides from the surface (CZ1) toward the interior (CZ3), accompanied by a corresponding increase in Cr-rich carbides. This compositional change results in a graded decrease in hardness, as shown in Figure 10b, with CZ1 displaying a hardness of 945 ± 49 HV 2 compared to 161 ± 6 HV 2 in the base metal.
The gradual transition in the type and distribution of carbides across the composite thickness confirms the functionally graded nature of the produced material. The change from WC and (W,Fe,Cr)₆C carbides near the surface to Cr-rich carbides such as (Fe,Cr,W)₇C₃ and (Fe,Cr,W)₂₃C₆ in the inner zones reveals a well-defined microstructural gradient. This behavior is characteristic of a Functionally Graded Material (FGM), where compositional and microstructural evolution is intentionally engineered to optimize local performance. The combined presence of microstructural and hardness gradients across the composite, combined with a smooth transition interface between CZ3 and the base metal (BM), is expected to significantly reduce localized stresses and enhance the structural integrity of the reinforced cast part.
Figure 11 compares the abrasive wear rates of the composite zone and the base metal. The wear rate (K) was calculated from the slope of the linear regression fitted to experimental data plotting the volume of worn material against sliding distance. The results show that the composite exhibits a wear rate approximately 70% lower than that of the base metal, showing significantly improved abrasion wear resistance. This performance exceeds previous results reported for WC-reinforced austenitic stainless steel, which showed a 45% reduction in micro-abrasion wear rate [19], as well as findings from other authors who observed a 40% decrease in high-chromium cast irons reinforced with 40 vol.% WC [20,21].
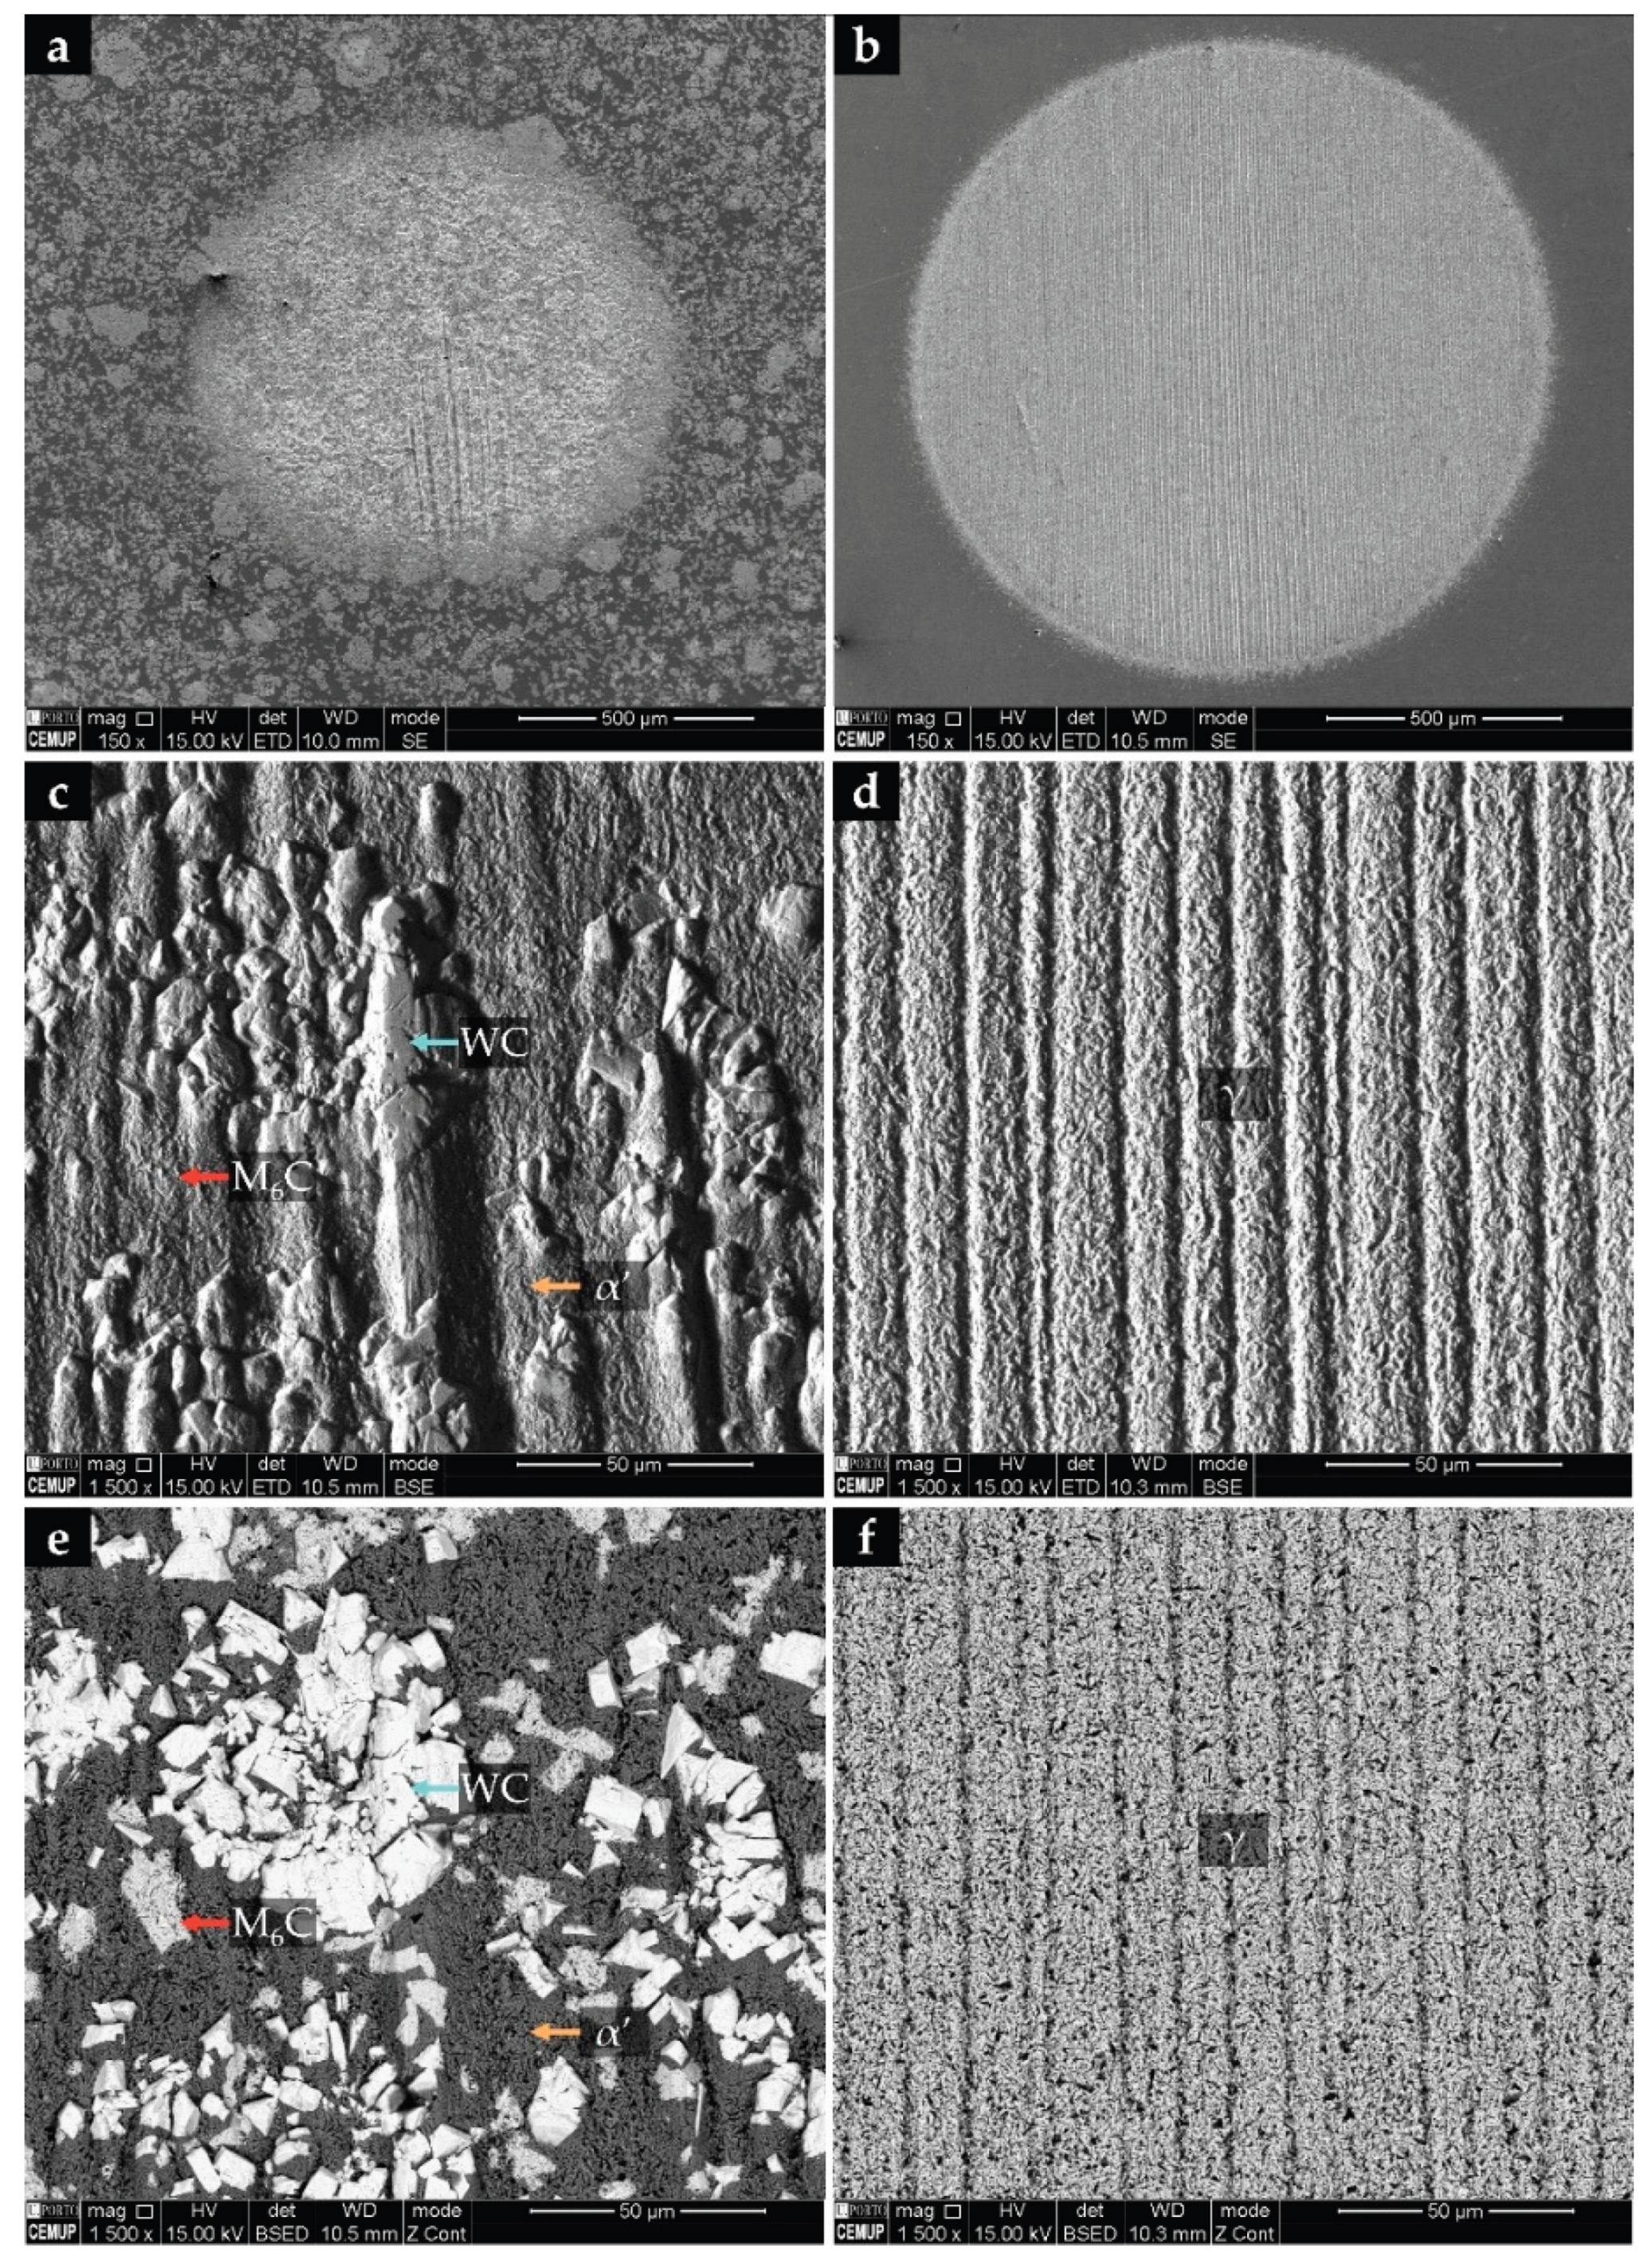
The worn surfaces of the CZ1 composite zone and the base metal were analyzed by SEM to investigate the morphology of the wear craters. Figure 12a,b show low-magnification images of the craters produced after a sliding distance of 31.4 m. The crater from CZ1 is significantly smaller than that from the base metal, which is attributed to the WC particles' resistance to the micro-cutting action of the abrasive SiC, thus improving the abrasion wear resistance of the stainless steel. Figure 12c,e reveal shallow grooves and well-retained WC particles, proving their protective role. This effect has been reported in prior studies on grey cast iron and high-chromium white cast iron [20,21,22,23,24,25]. In contrast, (Fe,W,Cr)₆C particles exhibit lower wear resistance than WC, with some visible plastic deformation. The base metal surface (Figure 12d,f) displays more extensive damage, characterized by deeper grooves and severe plastic deformation, indicating lower wear performance.
4. Conclusions
Austenitic stainless-steel specimens locally reinforced with WC–metal matrix composites were successfully produced using an ex situ powder metallurgy-based casting technique. This process, which involved preparing and placing Fe–WC preforms within the mold cavity before casting, resulted in a defect-free interface between the reinforcement and the base metal, proving the effectiveness of the methodology.
The produced composite exhibited a well-defined compositional and microstructural gradient along with its thickness. The surface-adjacent region featured large polygonal WC particles embedded in a martensitic matrix with (W,Fe,Cr)₆C carbides. These carbides formed through reactions between the molten steel and the Fe–WC preforms, leading to austenite destabilization and martensite formation during cooling. In the inner zones, extensive WC dissolution led to the formation of a complex interdendritic network containing (Fe,Cr,W)₇C₃, (Fe,Cr,W)₂₃C₆, and (Fe,W,Cr)₆C carbides, which gradually diminished toward the base metal.
The microstructural gradient was reflected by a corresponding hardness profile, decreasing from 945 ± 49 HV 2 near the surface to 436 ± 30 HV 2 at the interface, with the reinforced surface achieving hardness values approximately six times higher than the base metal. The combined effects of microstructural and hardness gradients, along with the smooth, continuous transition between composite zones, are expected to reduce localized stresses and improve the integrity of the cast part.
In addition, the reinforced zones showed outstanding micro-abrasion wear resistance, achieving a 70% reduction in wear rate compared to the unreinforced base alloy. These findings confirm the viability of the ex situ Fe–WC insert technique as a cost-effective approach for producing locally reinforced stainless-steel castings with functionally graded properties. This method effectively combines surface hardness and core ductility, making it ideal for demanding mechanical applications.
Supplementary Materials
The following supporting information can be downloaded at the website of this paper posted on Preprints.org.
Author Contributions
Conceptualization, A.B.M.; formal analysis, L.M.M.R. and M.F.V.; funding acquisition, M.F.V.; investigation, A.B.M.; supervision, L.M.M.R. and M.F.V.; validation, L.M.M.R. and M.F.V.; writing—original draft, A.B.M.; writing—review and editing, L.M.M.R. and M.F.V. All authors have read and agreed to the published version of the manuscript.
Funding
This research was funded by national funds through FCT—Fundação para a Ciência e a Tecnologia, I.P., under project reference UIDB/50022/2020.
Data Availability Statement
The original contributions presented in this study are included in the article/supplementary material. Further inquiries can be directed to the corresponding author(s).
Acknowledgments
The authors are grateful to CEMUP (Centro de Materiais da Universidade do Porto) for knowledgeable assistance with SEM.
Conflicts of Interest
The authors declare no conflicts of interest.
Abbreviations
The following abbreviations are used in this manuscript:
| BM | Base metal |
| BSE | Backscattered electron |
| CZ | Composite zone |
| DED | Directed energy deposition |
| DOAJ | Directory of open access journals |
| EBSD | Electron backscatter diffraction |
| EDS | Energy-dispersive detector |
| FGM | Functionally graded material |
| LD | Linear dichroism |
| LPBF | Laser powder bed fusion |
| MDPI | Multidisciplinary Digital Publishing Institute |
| MMC | Metal matrix composite |
| SE | Secondary electron |
| SEM | Scanning electron microscopy |
| TLA | Three letter acronym |
| WC | Tungsten carbide |
| XRD | X-ray diffraction |
| α’ | Martensite |
| γ | Austenite |
References
- McGuire, M.F. Austenitic Stainless Steels. In Stainless Steels for Design Engineers; ASM International: Materials Park, OH, USA, 2008. [Google Scholar]
- Davis, J.R. ASM Specialty Handbook: Stainless Steels; ASM International: Materials Park, OH, USA, 1994; Volume 89. [Google Scholar]
- Farrar, J.C.M. Group E: Standard austenitic stainless steels. In The Alloy Tree: A Guide to Low-Alloy Steels, Stainless Steels and Nickel-Base Alloys; CRC Press: Boca Raton, FL, USA, 2004. [Google Scholar]
- Padilha, A.F.; Rios, P.R. Decomposition of austenite in austenitic stainless steels. ISIJ Int. 2002, 42, 325–327. [Google Scholar] [CrossRef]
- Straffelini, G. Friction and Wear: Methodologies for Design and Control; Springer: Cham, Switzerland, 2015. [Google Scholar] [CrossRef]
- Chawla, N.; Chawla, K.K. Processing. In Metal Matrix Composites, 2nd ed.; Springer: New York, NY, USA, 2013; pp. 55–97. [Google Scholar] [CrossRef]
- Totten, G.E. ASM Handbook-Friction, Lubrication, and Wear Technology; ASM International: Materials Park, OH, USA, 1992; Volume 18. [Google Scholar]
- Song, L.; Zeng, G.; Xiao, H.; Xiao, X.; Li, S. Repair of 304 stainless steel by laser cladding with 316L stainless steel powders followed by laser surface alloying with WC powders. J. Manuf. Process. 2016, 24, 116–124. [Google Scholar] [CrossRef]
- Anandan, S.; Pityana, S.; Majumdar, J.D. Structure–property-correlation in laser surface alloyed AISI 304 stainless steel with WC + Ni + NiCr. Mater. Sci. Eng. A 2012, 536, 159–169. [Google Scholar] [CrossRef]
- Li, Z.L.; Chen, Z.H.; Jiang, Y.H.; Zhou, R.; Shan, Q.; Song, Q.L. Influence of Addition of Tungsten-iron powder on Microstructure of WC/steel Composite Coatings. Adv. Mater. Res. 2012, 463–464, 394–398. [Google Scholar] [CrossRef]
- Shan, Q.; Li, Z.; Jiang, Y.; Zhou, R.; Sui, Y. Effect of Ni addition on microstructure of matrix in casting tungsten carbide particle reinforced composite. J. Mater. Sci. Technol. 2013, 29, 720–724. [Google Scholar] [CrossRef]
- Zhang, Z.; Chen, Y.; Zuo, L.; Zhang, Y.; Qi, Y.; Gao, K.; Liu, H.; Wang, X. An in situ synthesis of WC-reinforced iron surface composite was produced by spark plasma sintering and casting. Mater. Lett. 2018, 210, 227–230. [Google Scholar] [CrossRef]
- Zhang, G.-S.; Xing, J.-D.; Gao, Y.-M. Impact wear resistance of WC/Hadfield steel composite and its interfacial characteristics. Wear 2006, 260, 728–734. [Google Scholar] [CrossRef]
- Purwadi, A.; Siregar, J.P.; Natsir, H.; Syahputra, A.; Sembiring, M.A. An Evaluation of WC-Co Tool Tip Scraps Reinforcement in the Hadfield Austenitic Manganese Steel Fabricated In Situ Steel Casting. Eng. Solid Mech. 2024, 12(2), 121–129. [Google Scholar] [CrossRef]
- Benarji, K.; Ravi Kumar, Y.; Jinoop, A.N.; Paul, C.P.; Bindra, K.S. Effect of WC Composition on the Microstructure and Surface Properties of Laser Directed Energy Deposited SS 316-WC Composites. J. of Materi Eng and Perform 2021, 30, 6732–6742. [Google Scholar] [CrossRef]
- Chumanov, I.V.; Anikeev, A.N.; Chumanov, V.I. Fabrication of functionally graded materials by introducing wolframium carbide dispersed particles during centrifugal casting and examination of FGM’s structure. Procedia Eng. 2015, 129, 816–820. [Google Scholar] [CrossRef]
- Lin, C.-M. Functional composite metal for WC-dispersed 304L stainless steel matrix composite with alloying by direct laser: Microstructure, hardness and fracture toughness. Vacuum 2015, 121, 96–104. [Google Scholar] [CrossRef]
- Wen-Tai, H.; Honeycombe, R. Structure of centrifugally cast austenitic stainless steels: Part 1 HK 40 as cast and after creep between 750 and 1000 °C. Mater. Sci Technol. 1985, 1, 385–389. [Google Scholar] [CrossRef]
- Moreira, A.B.; Ribeiro, L.M.M.; Vieira, M.F. Cast Austenitic Stainless Steel Reinforced with WC Fabricated by Ex Situ Technique. Metals 2022, 12, 713. [Google Scholar] [CrossRef]
- Zhou, R.; Jiang, Y.; Lu, D. The effect of volume fraction of WC particles on erosion resistance of WC reinforced iron matrix surface composites. Wear 2003, 255, 134–138. [Google Scholar] [CrossRef]
- Moreira, A.B.; Ribeiro, L.M.M.; Lacerda, P.; Vieira, M.F. Characterization of Iron-Matrix Composites Reinforced by In Situ TiC and Ex Situ WC Fabricated by Casting. Metals 2021, 11, 862. [Google Scholar] [CrossRef]
- Li, Z.; Jiang, Y.; Zhou, R.; Lu, D.; Zhou, R. Dry three-body abrasive wear behavior of WC reinforced iron matrix surface composites produced by V-EPC infiltration casting process. Wear 2007, 262, 649–654. [Google Scholar] [CrossRef]
- Li, Y.; Gao, Y. Three-body abrasive wear behavior of CC/high-Cr WCI composite and its interfacial characteristics. Wear 2010, 268, 511–518. [Google Scholar] [CrossRef]
- Zheng, K.; Gao, Y.; Tang, S.; Li, Y.; Ma, S.; Yi, D.; Zhang, Z. Interface Structure and Wear Behavior of Cr26 Ferrous Matrix Surface Composites Reinforced with CTCp. Tribol. Lett. 2014, 54, 15–23. [Google Scholar] [CrossRef]
- Zhang, G.S.; Gao, Y.M.; Xing, J.D.; Wei, S.Z.; Zhang, X.L. Interfacial Characteristics and Wear Resistance of WCp/White-Cast-Iron Composites. Adv. Mater. Res. 2007, 26–28, 293–296. [Google Scholar] [CrossRef]
Figure 1.
Scheme of the produced specimens showing their respective dimensions (front and top views).
Figure 1.
Scheme of the produced specimens showing their respective dimensions (front and top views).
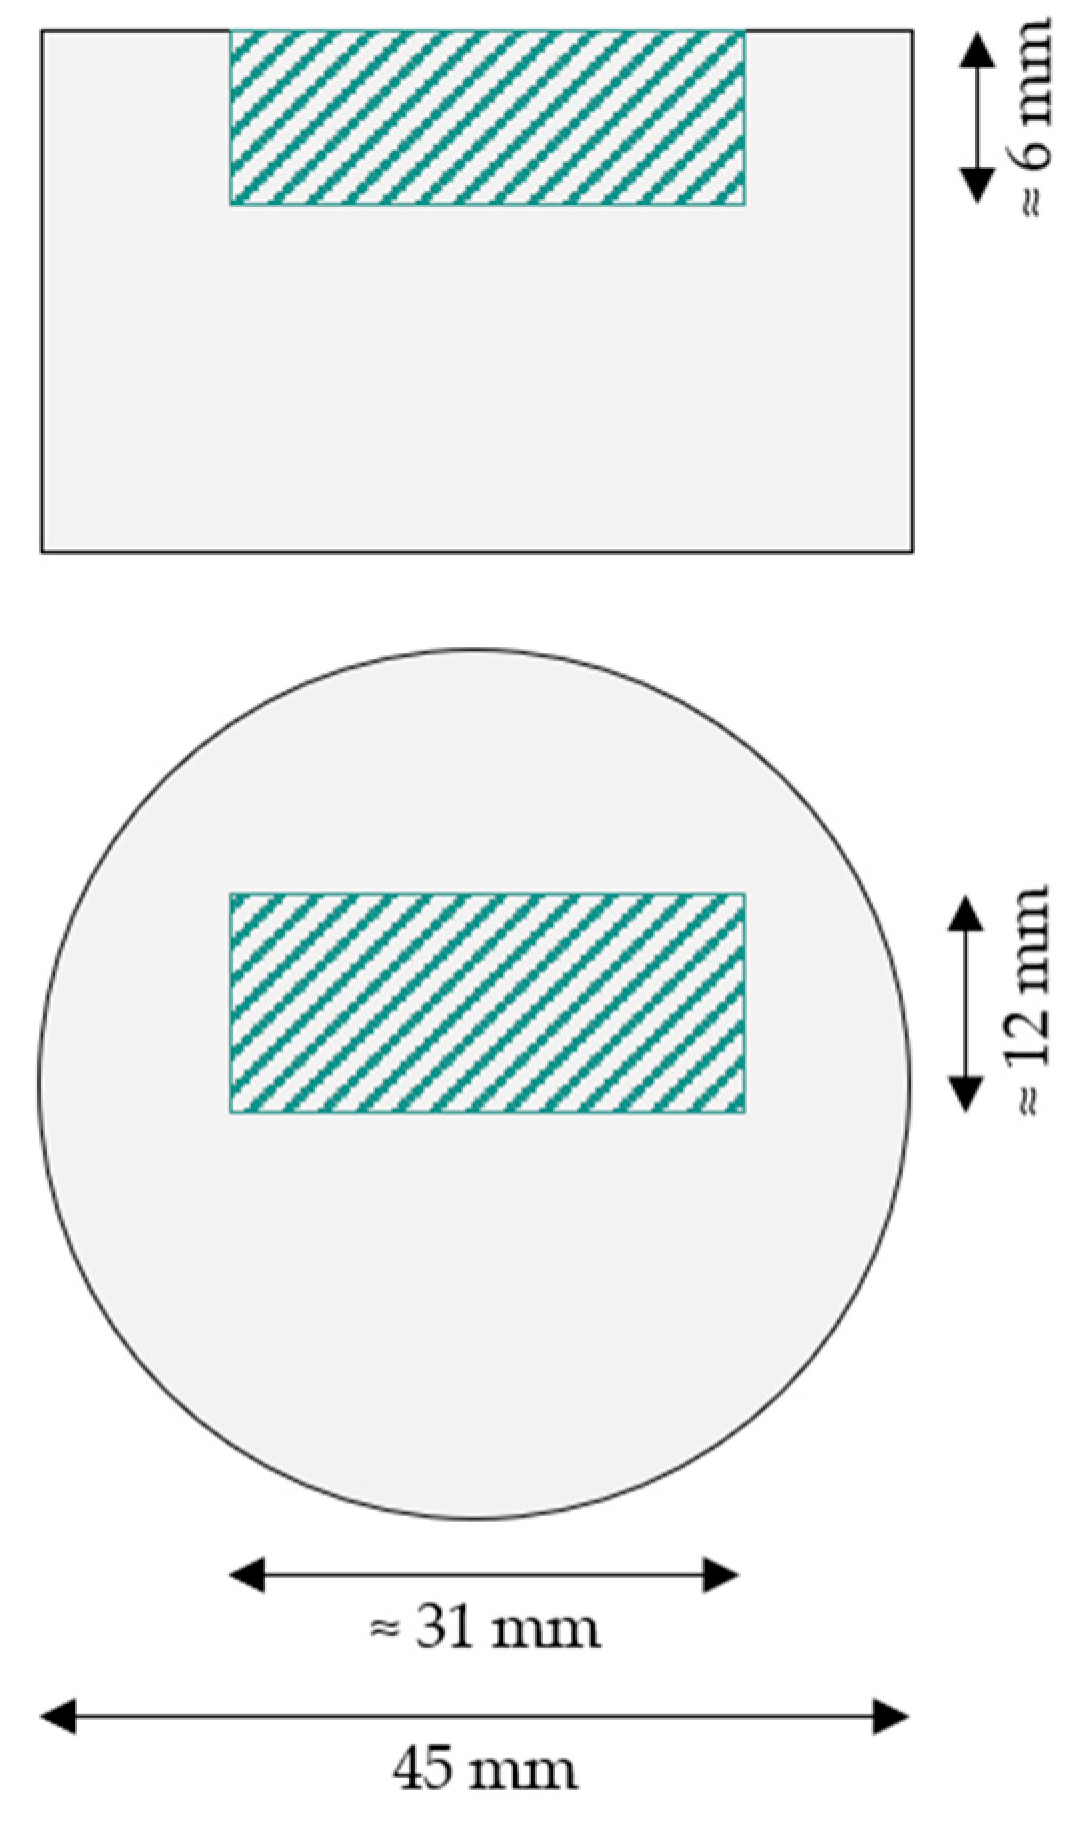
Figure 2.
SEM-BSE images of the microstructure of the reinforced specimen, indicating three zones: composite zone closest to the surface – CZ1 (a), intermediate composite zone – CZ2 (b), composite zone next to the base metal – CZ3 (c).
Figure 2.
SEM-BSE images of the microstructure of the reinforced specimen, indicating three zones: composite zone closest to the surface – CZ1 (a), intermediate composite zone – CZ2 (b), composite zone next to the base metal – CZ3 (c).
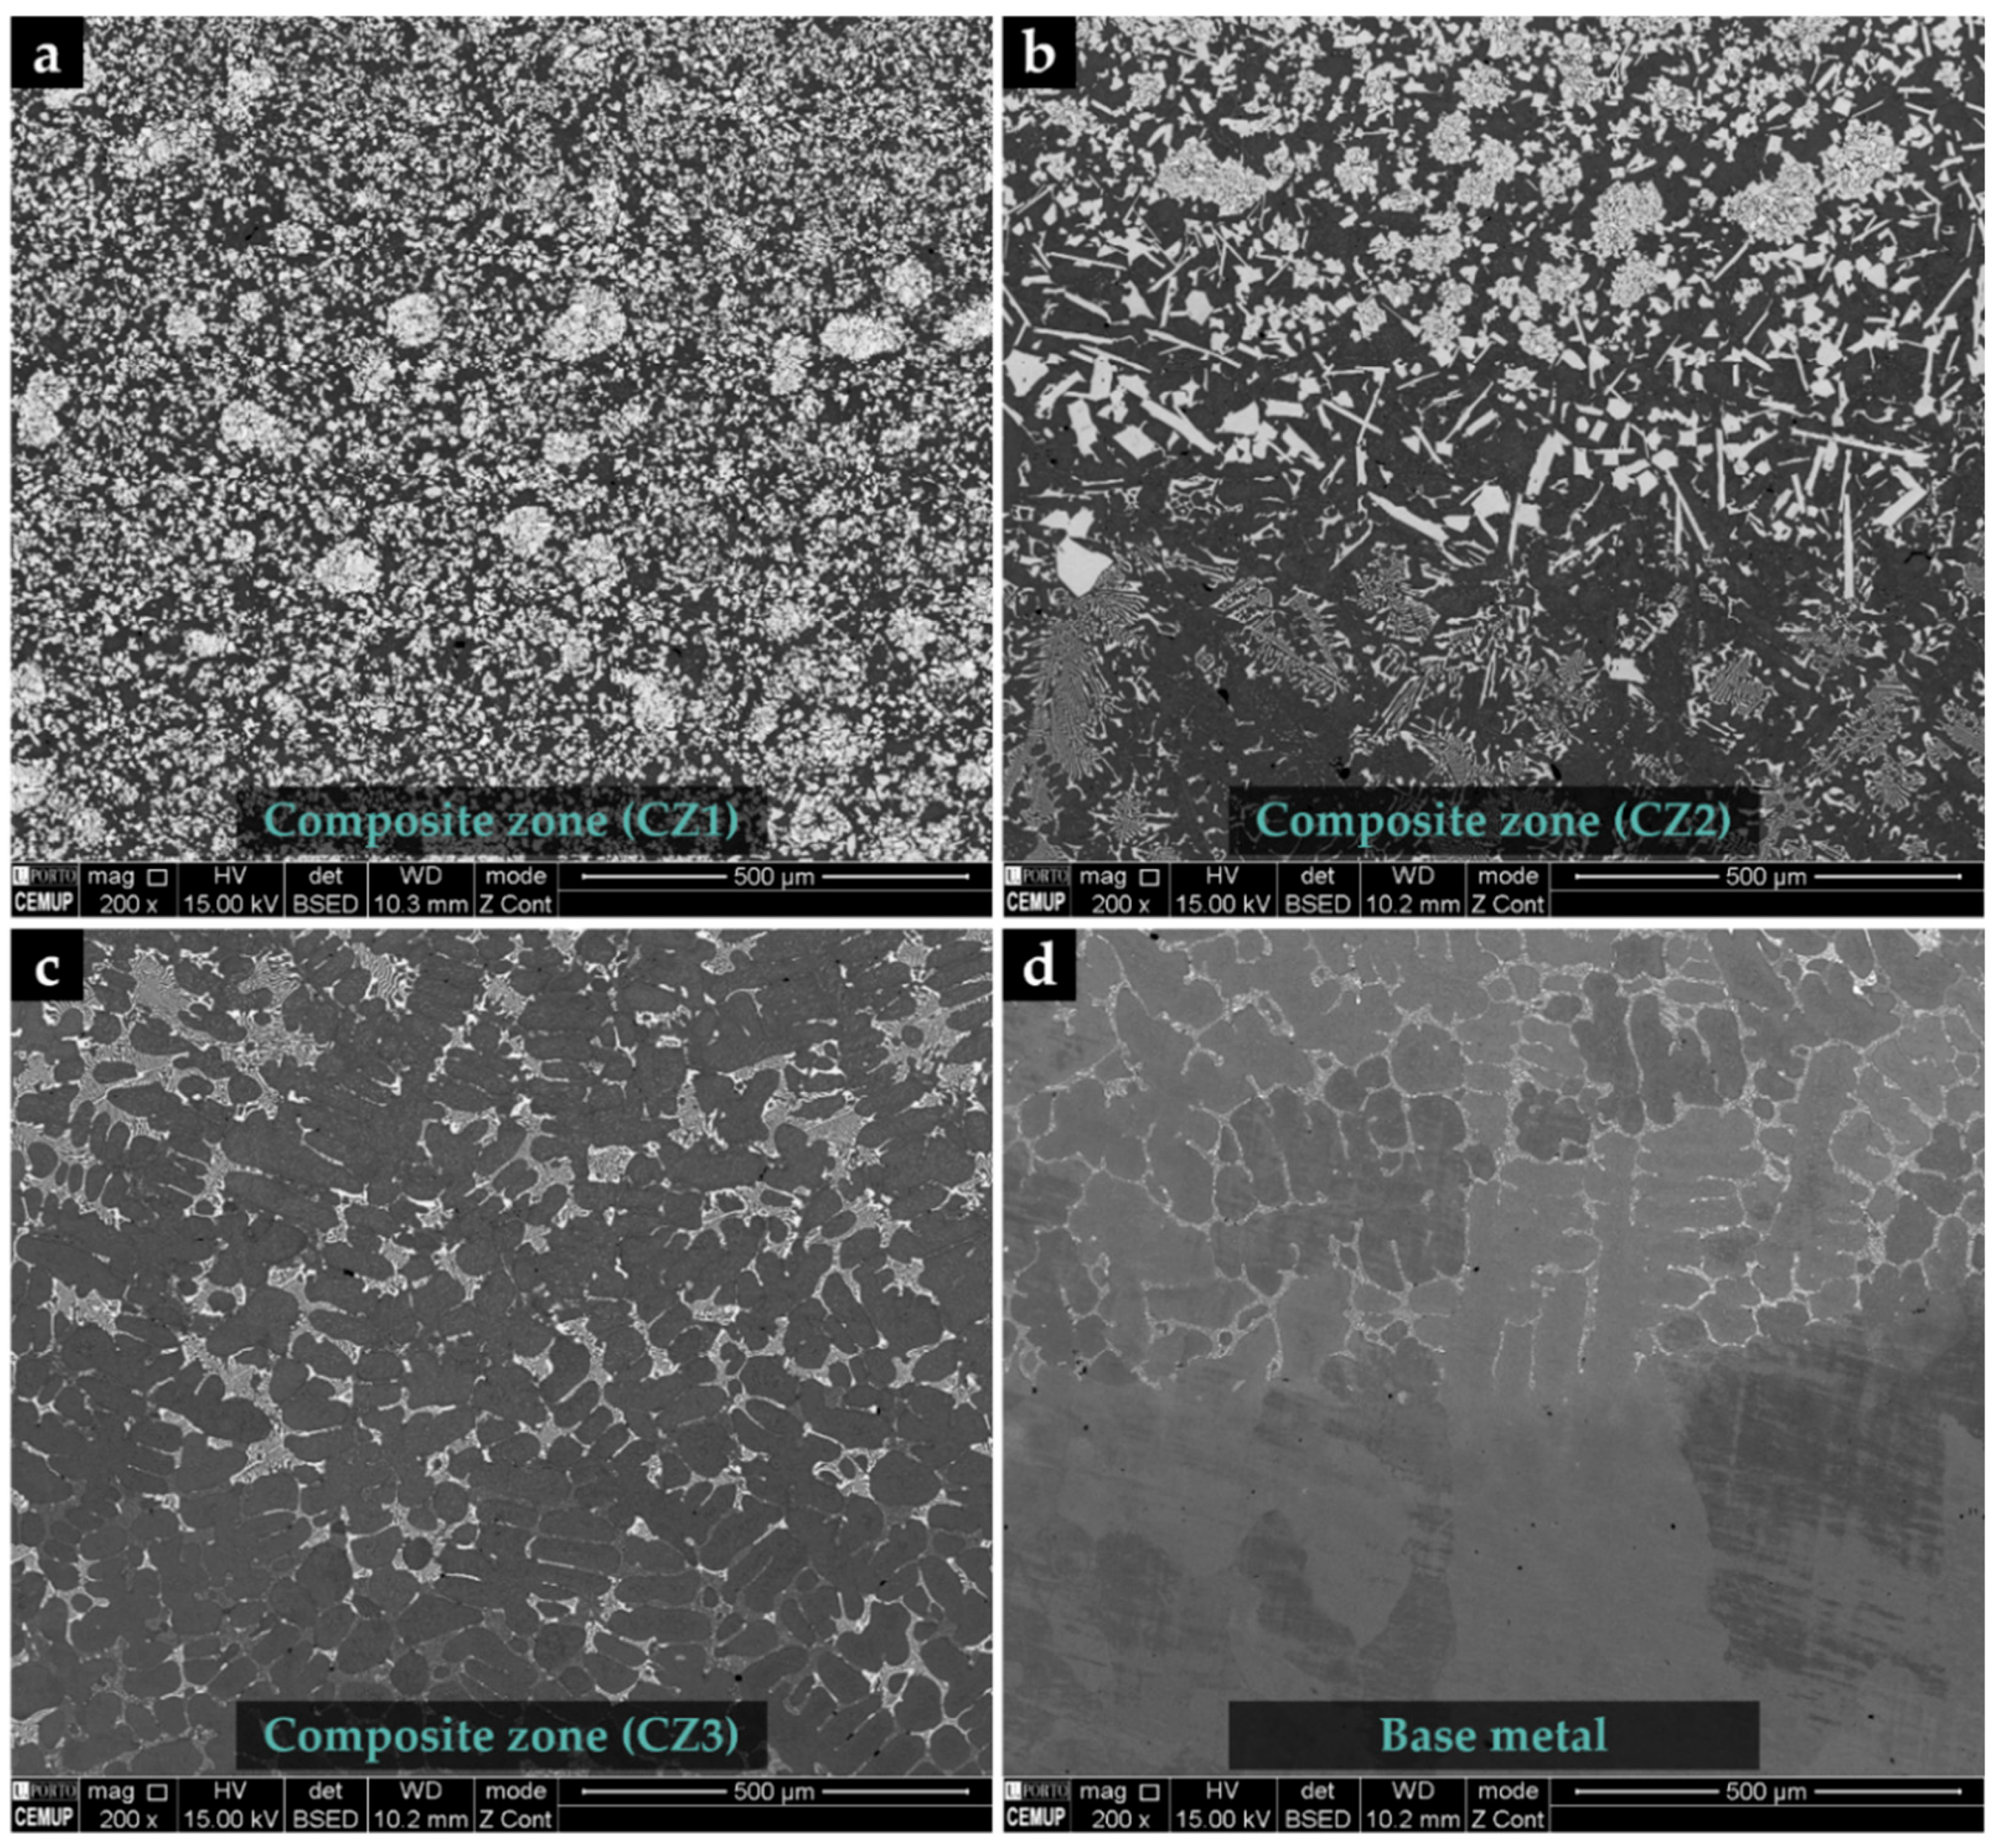
Figure 3.
SEM-BSE images of the microstructure of the CZ1 (a), CZ2 (b) and CZ3 (c). EDS elemental mapping (d-f) of W (red), Fe (blue), and Cr (pink) from each corresponding composite zone.
Figure 3.
SEM-BSE images of the microstructure of the CZ1 (a), CZ2 (b) and CZ3 (c). EDS elemental mapping (d-f) of W (red), Fe (blue), and Cr (pink) from each corresponding composite zone.
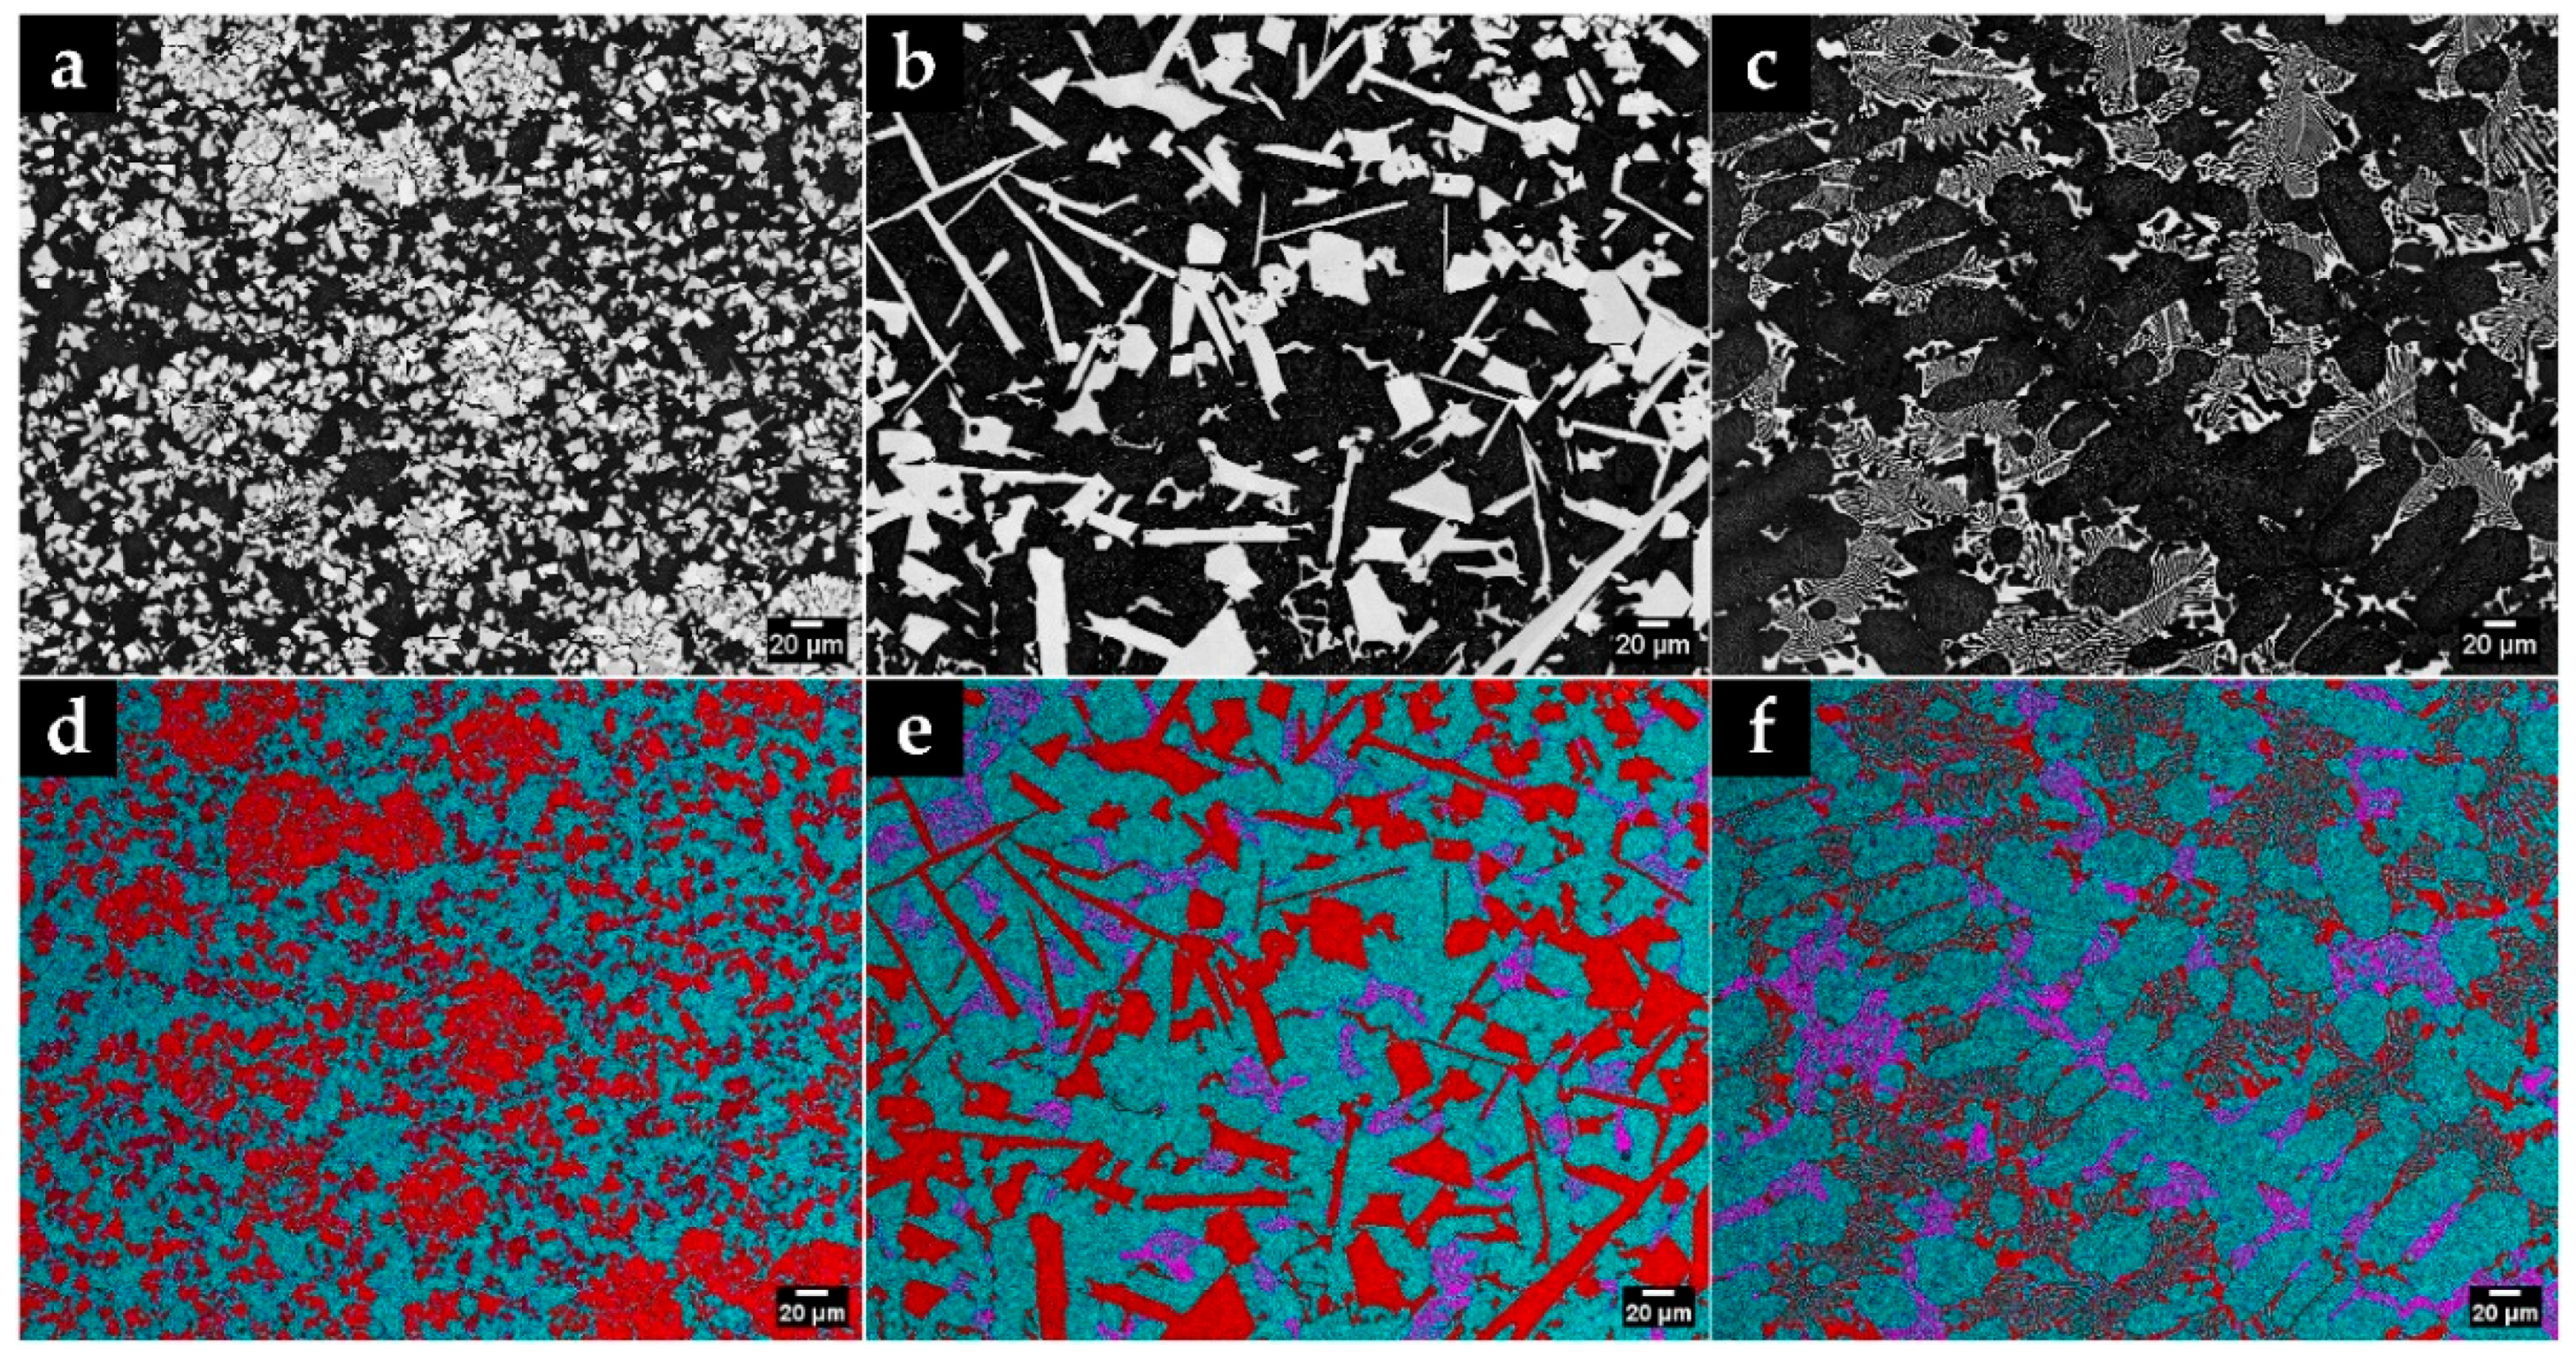
Figure 4.
XRD patterns of the base metal in the 2θ range of 30°–80° (a); and composite in the 2θ range of 30°–50° (b) and 60°–80° (c).
Figure 4.
XRD patterns of the base metal in the 2θ range of 30°–80° (a); and composite in the 2θ range of 30°–50° (b) and 60°–80° (c).
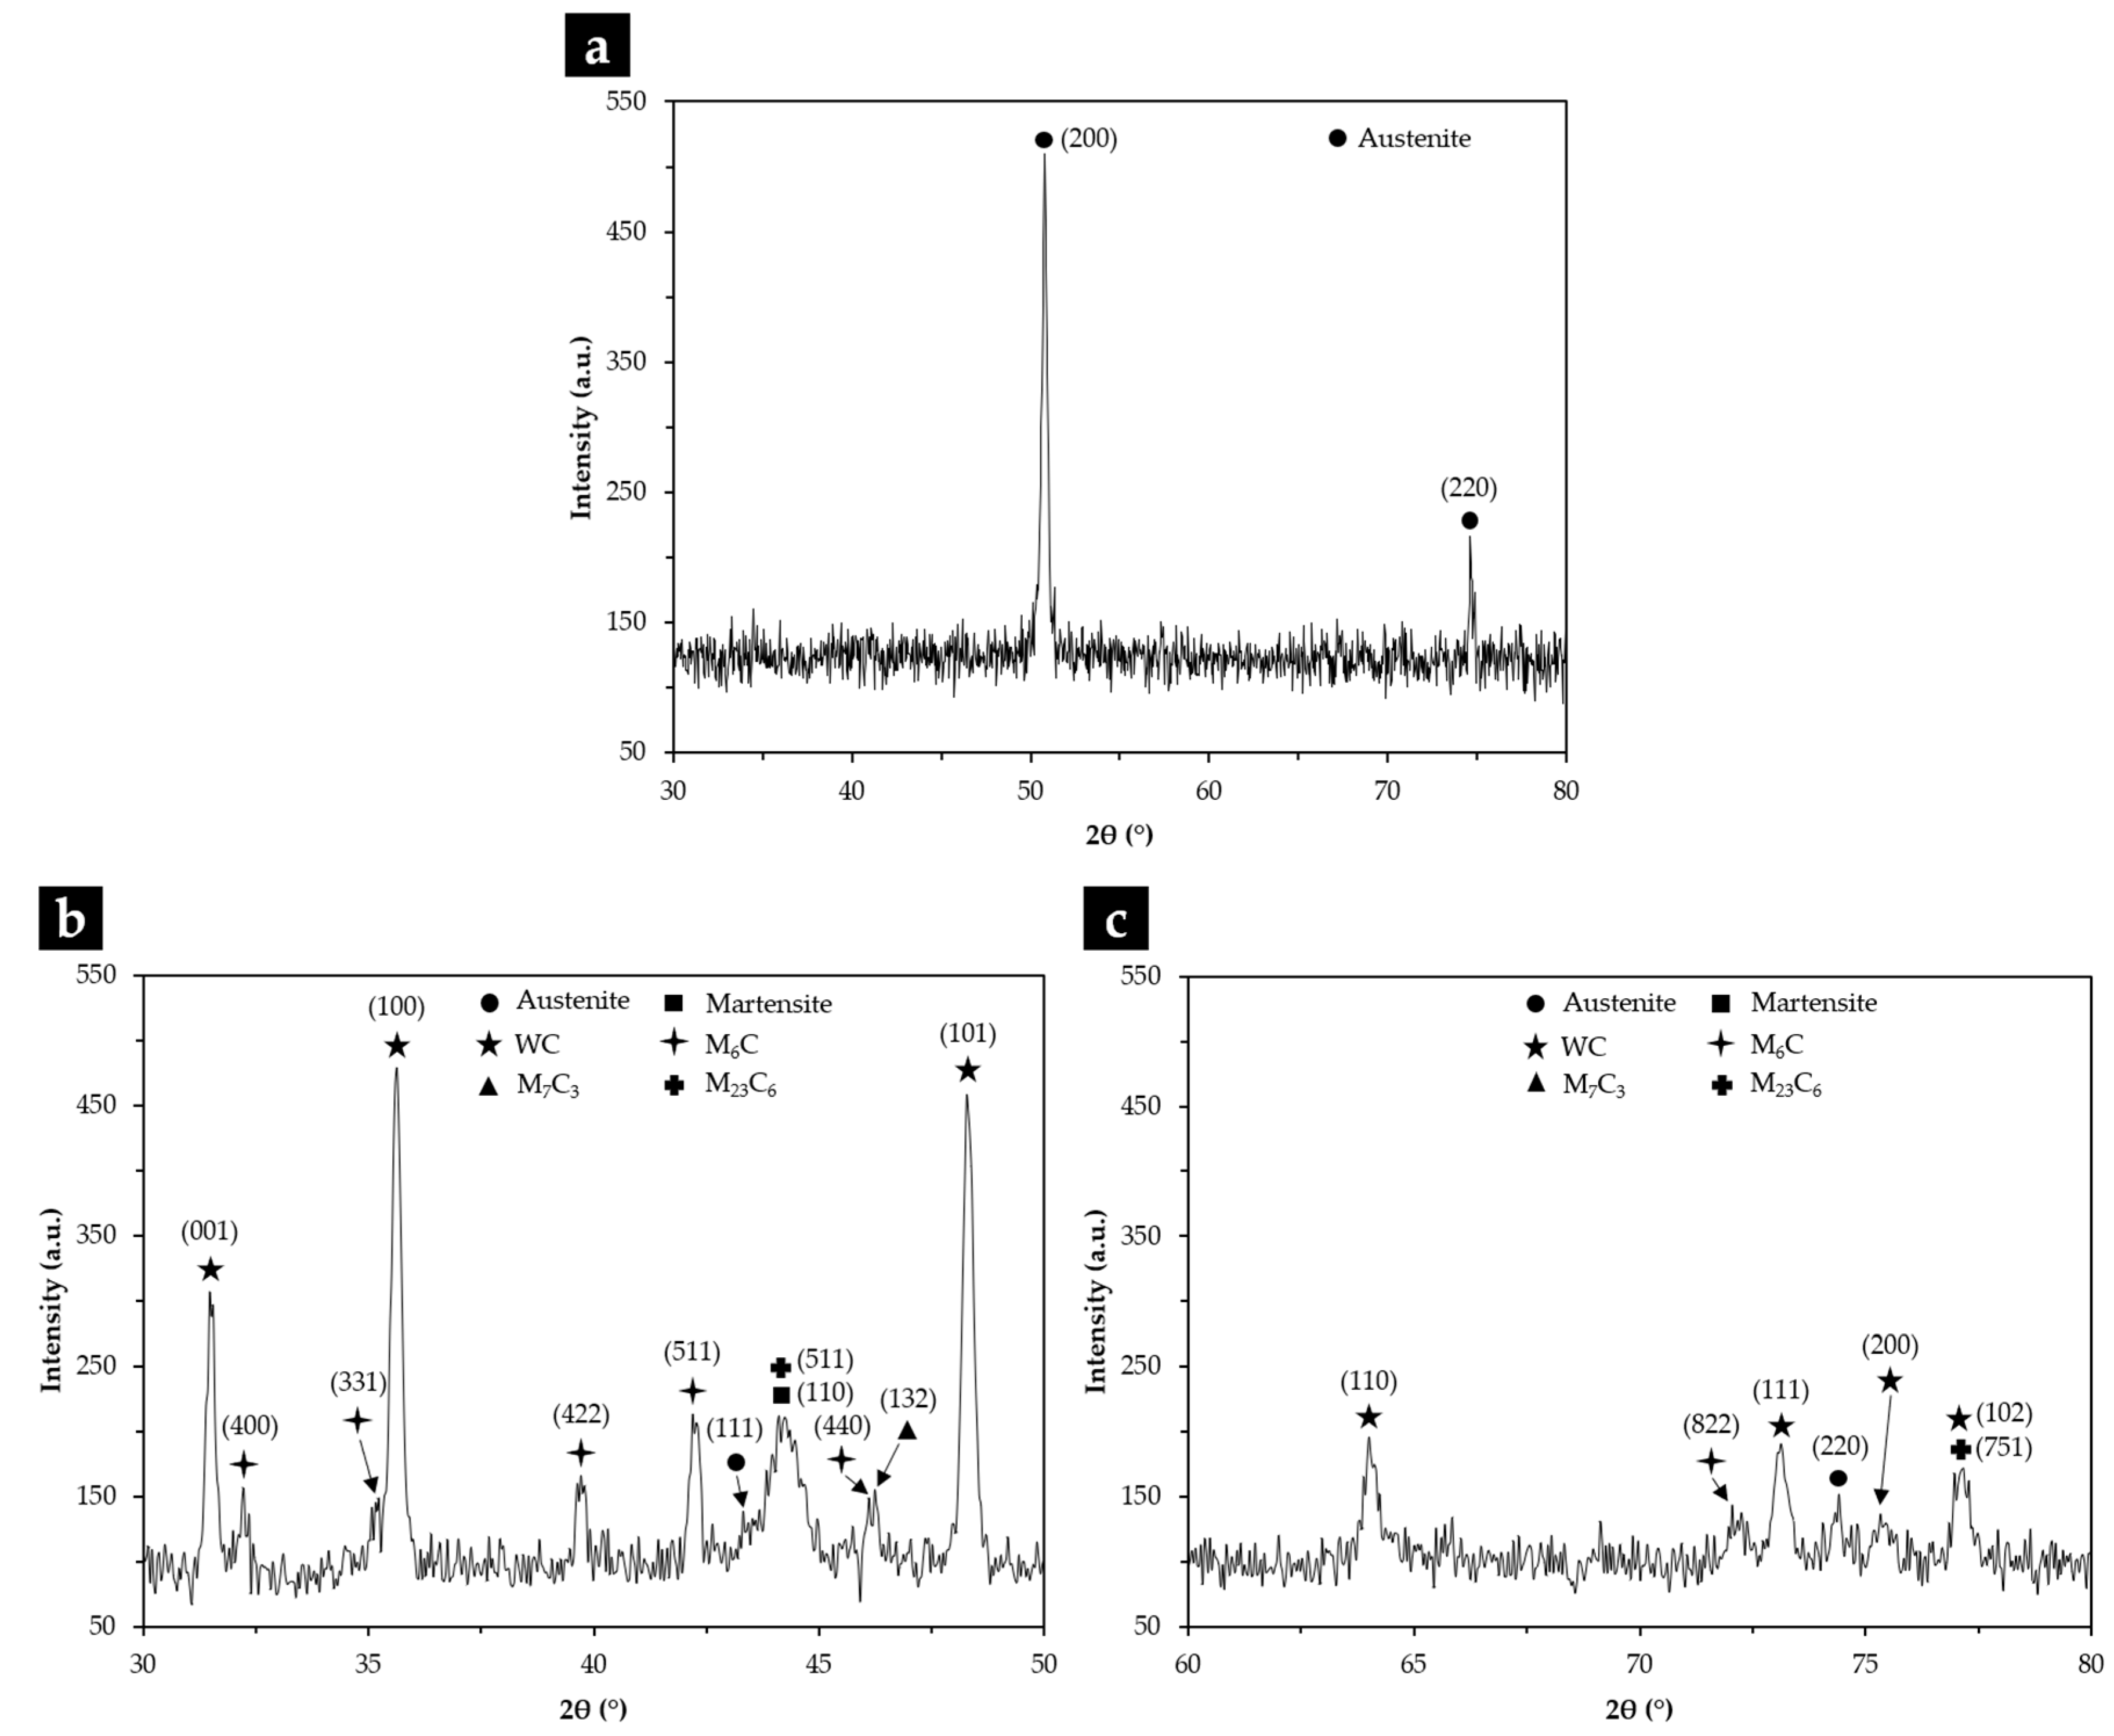
Figure 5.
SEM-BSE images of the microstructure of the composite zones: zone nearest to the surface – CZ1 (a,b), showing polygonal-shaped WC particles and several agglomerates and smaller precipitates of (W,Fe,Cr)6C, (b) higher magnification of (a), evidencing the α’ matrix; intermediate composite zone – CZ2 (c,d), showing irregular and plate-like shaped (W,Fe,Cr)6C particles in γ matrix and carbides with (Fe,Cr,W)7C3 and (Fe,Cr,W)23C6 stoichiometries, (d) higher magnification of (c), evidencing fine plate-like precipitation of (W,Fe,Cr)6; inner zone, next to the base metal – CZ3 (e,f), showing the interdendritic network of (Fe,Cr,W)23C6, and (Fe,W,Cr)6C, (f) higher magnification of (e), evidencing fine precipitates of (W,Fe,Cr)6C in the γ matrix.
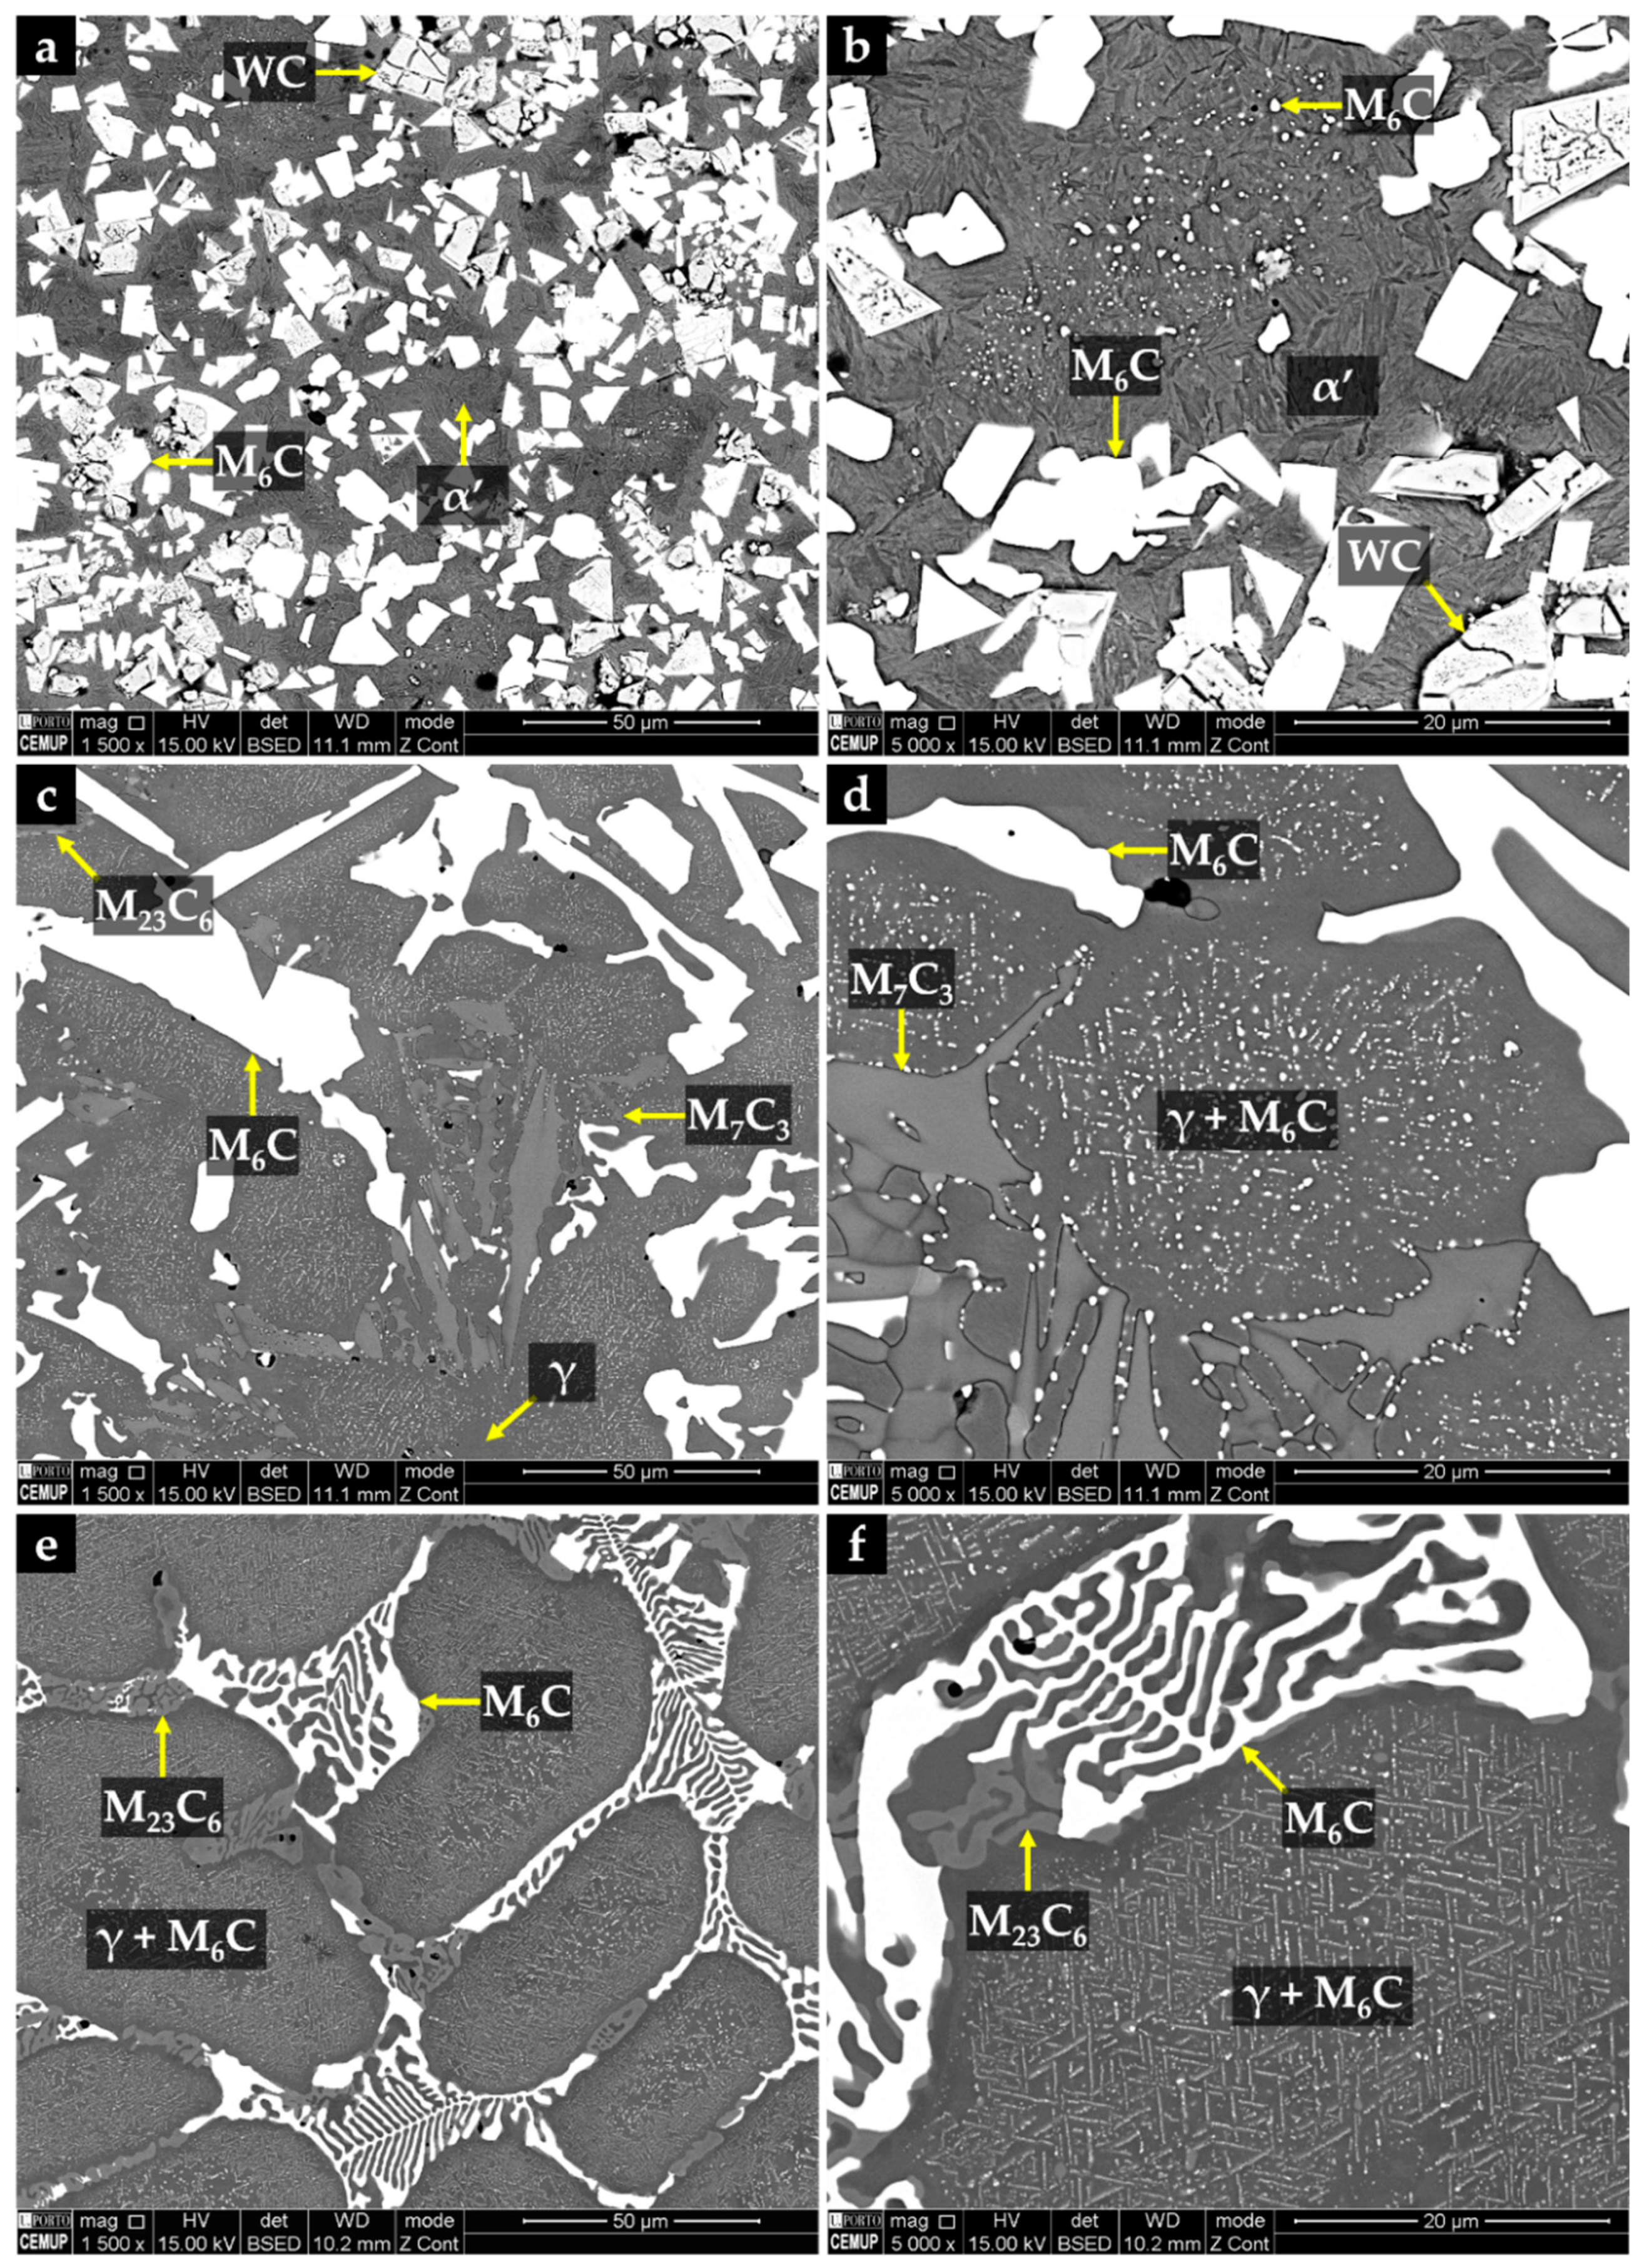
Figure 6.
SEM image from the EBSD area analyzed (a) and indexed EBSD patterns of the phases formed in CZ1 composite zone: α’ (b), WC (c), and (W,Fe,Cr)6C (d).
Figure 6.
SEM image from the EBSD area analyzed (a) and indexed EBSD patterns of the phases formed in CZ1 composite zone: α’ (b), WC (c), and (W,Fe,Cr)6C (d).
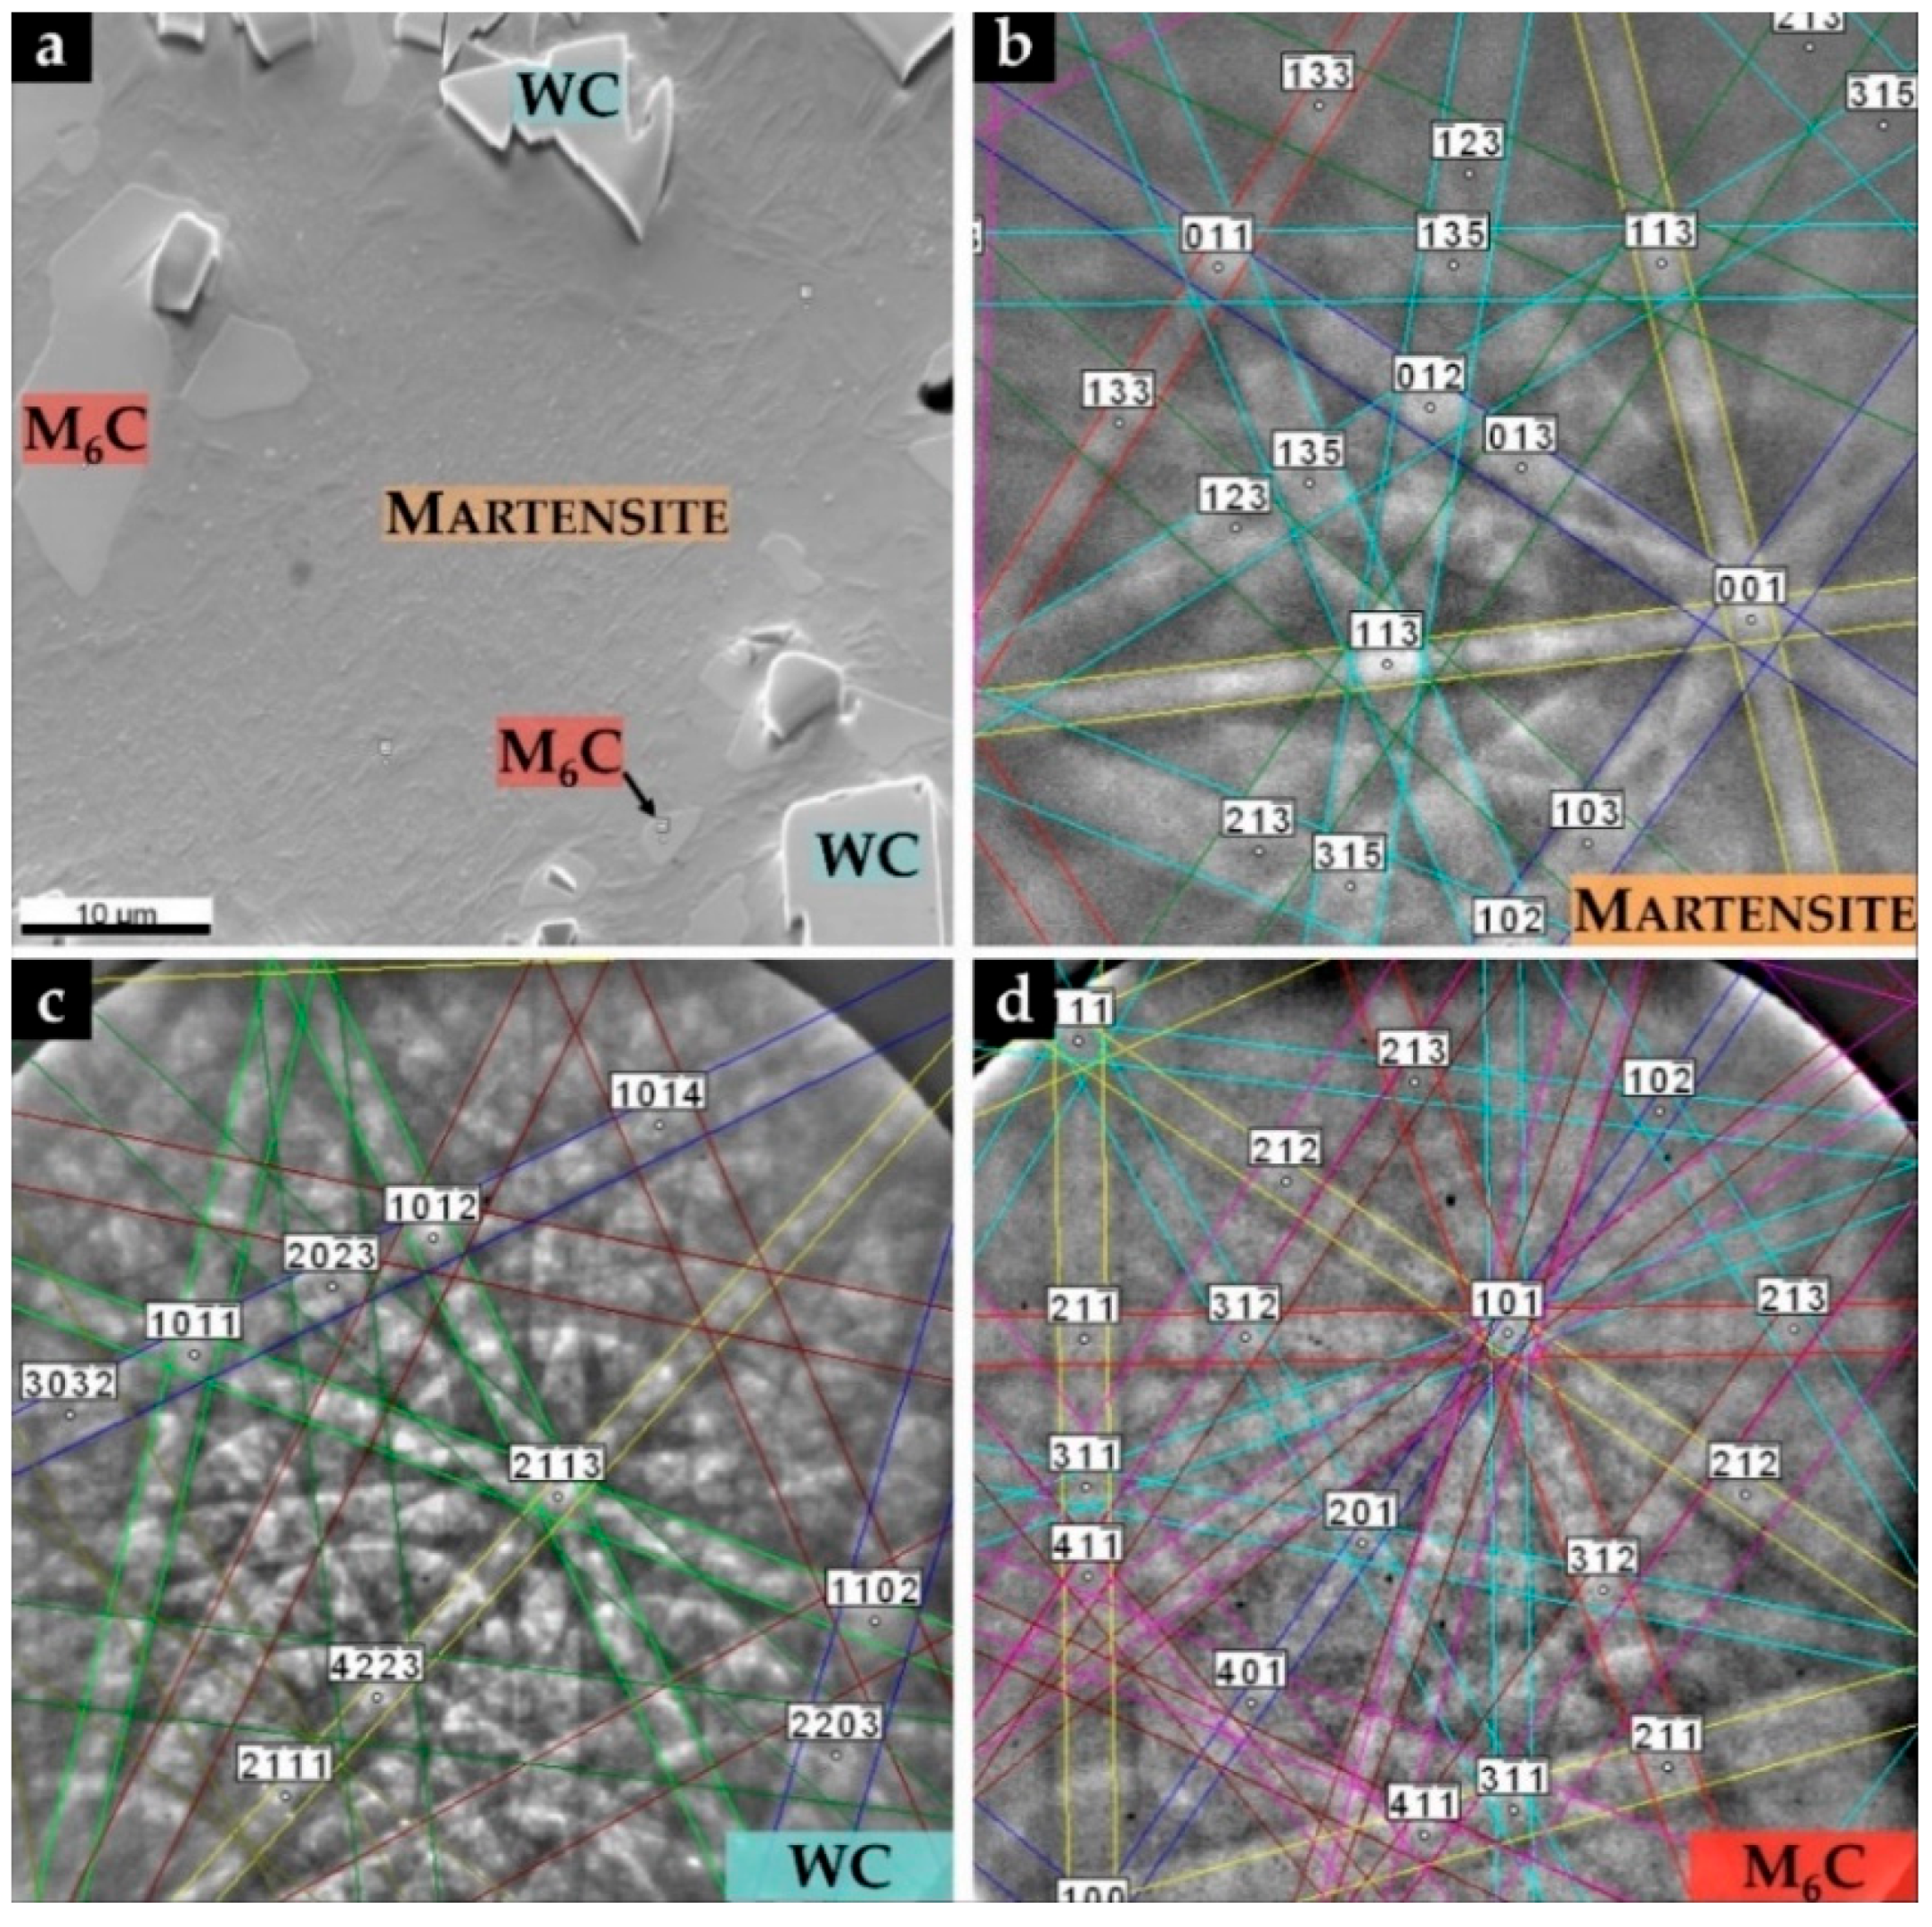
Figure 7.
SEM image from the EBSD area analyzed (a) and indexed EBSD patterns of the phases formed in CZ2 composite zone: γ (b), (Fe,Cr,W)7C3 (c), and (W,Fe,Cr)6C (d).
Figure 7.
SEM image from the EBSD area analyzed (a) and indexed EBSD patterns of the phases formed in CZ2 composite zone: γ (b), (Fe,Cr,W)7C3 (c), and (W,Fe,Cr)6C (d).
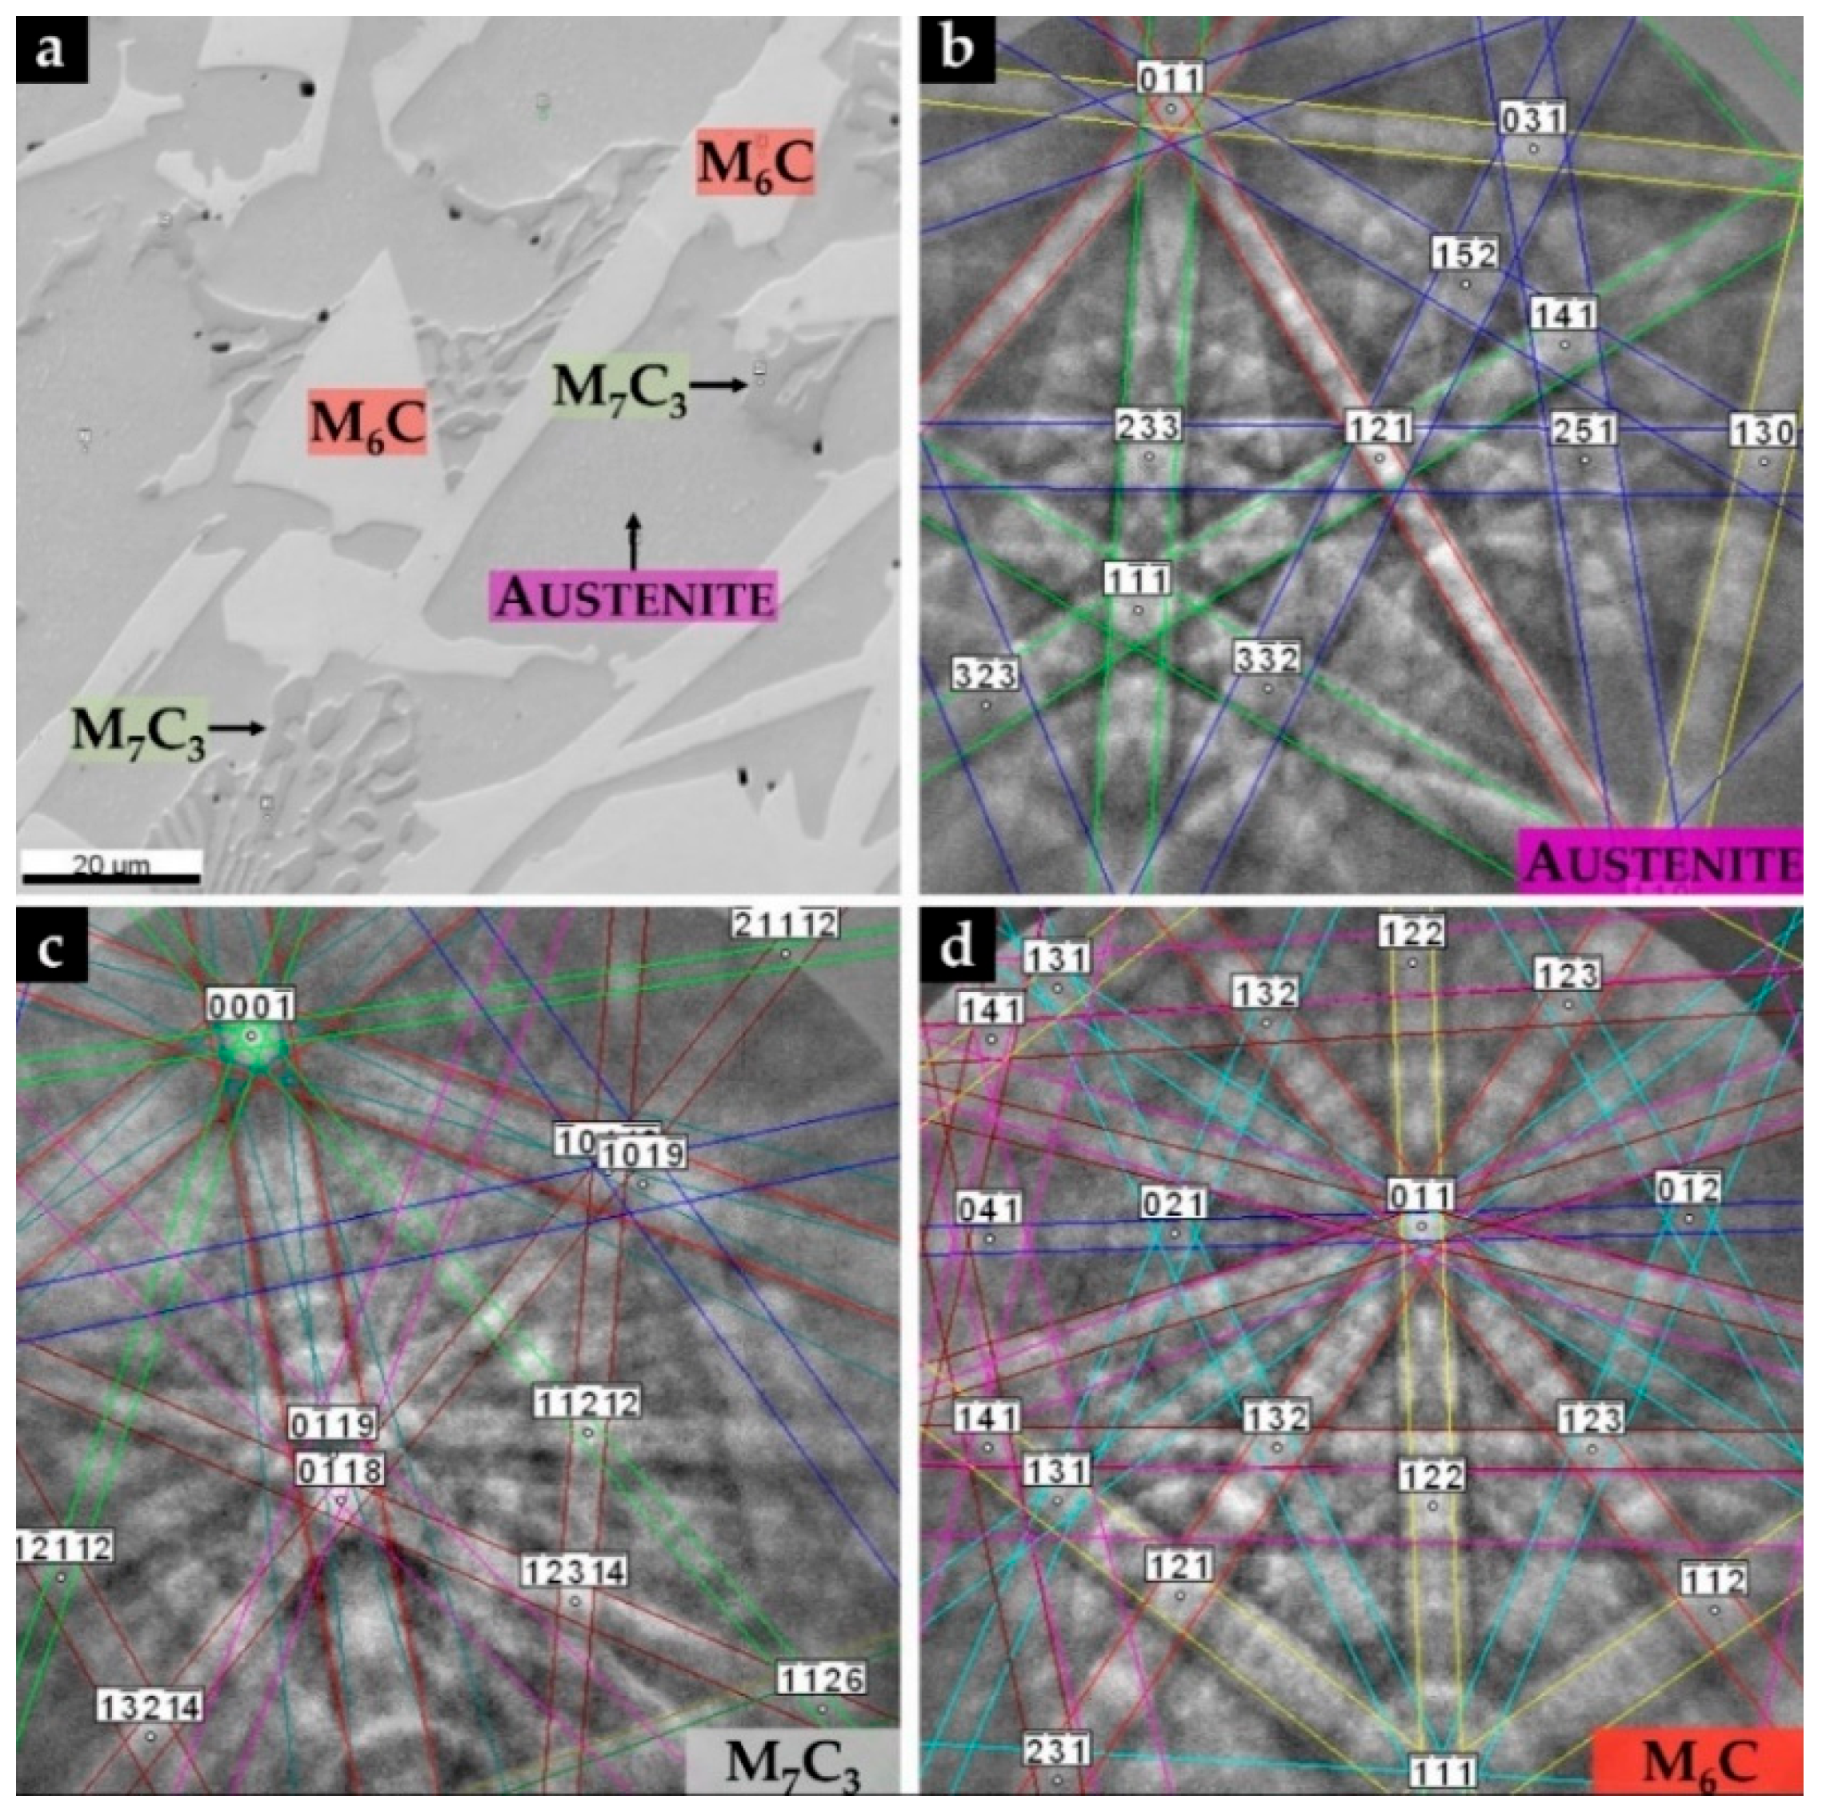
Figure 8.
SEM images from the EBSD areas analyzed (a,b) and indexed EBSD patterns of the phases formed in CZ3 composite zone: γ (c), (Fe,Cr,W)7C3 (d), (Fe,Cr,W)23C6, and (Fe,W,Cr)6C (f).
Figure 8.
SEM images from the EBSD areas analyzed (a,b) and indexed EBSD patterns of the phases formed in CZ3 composite zone: γ (c), (Fe,Cr,W)7C3 (d), (Fe,Cr,W)23C6, and (Fe,W,Cr)6C (f).
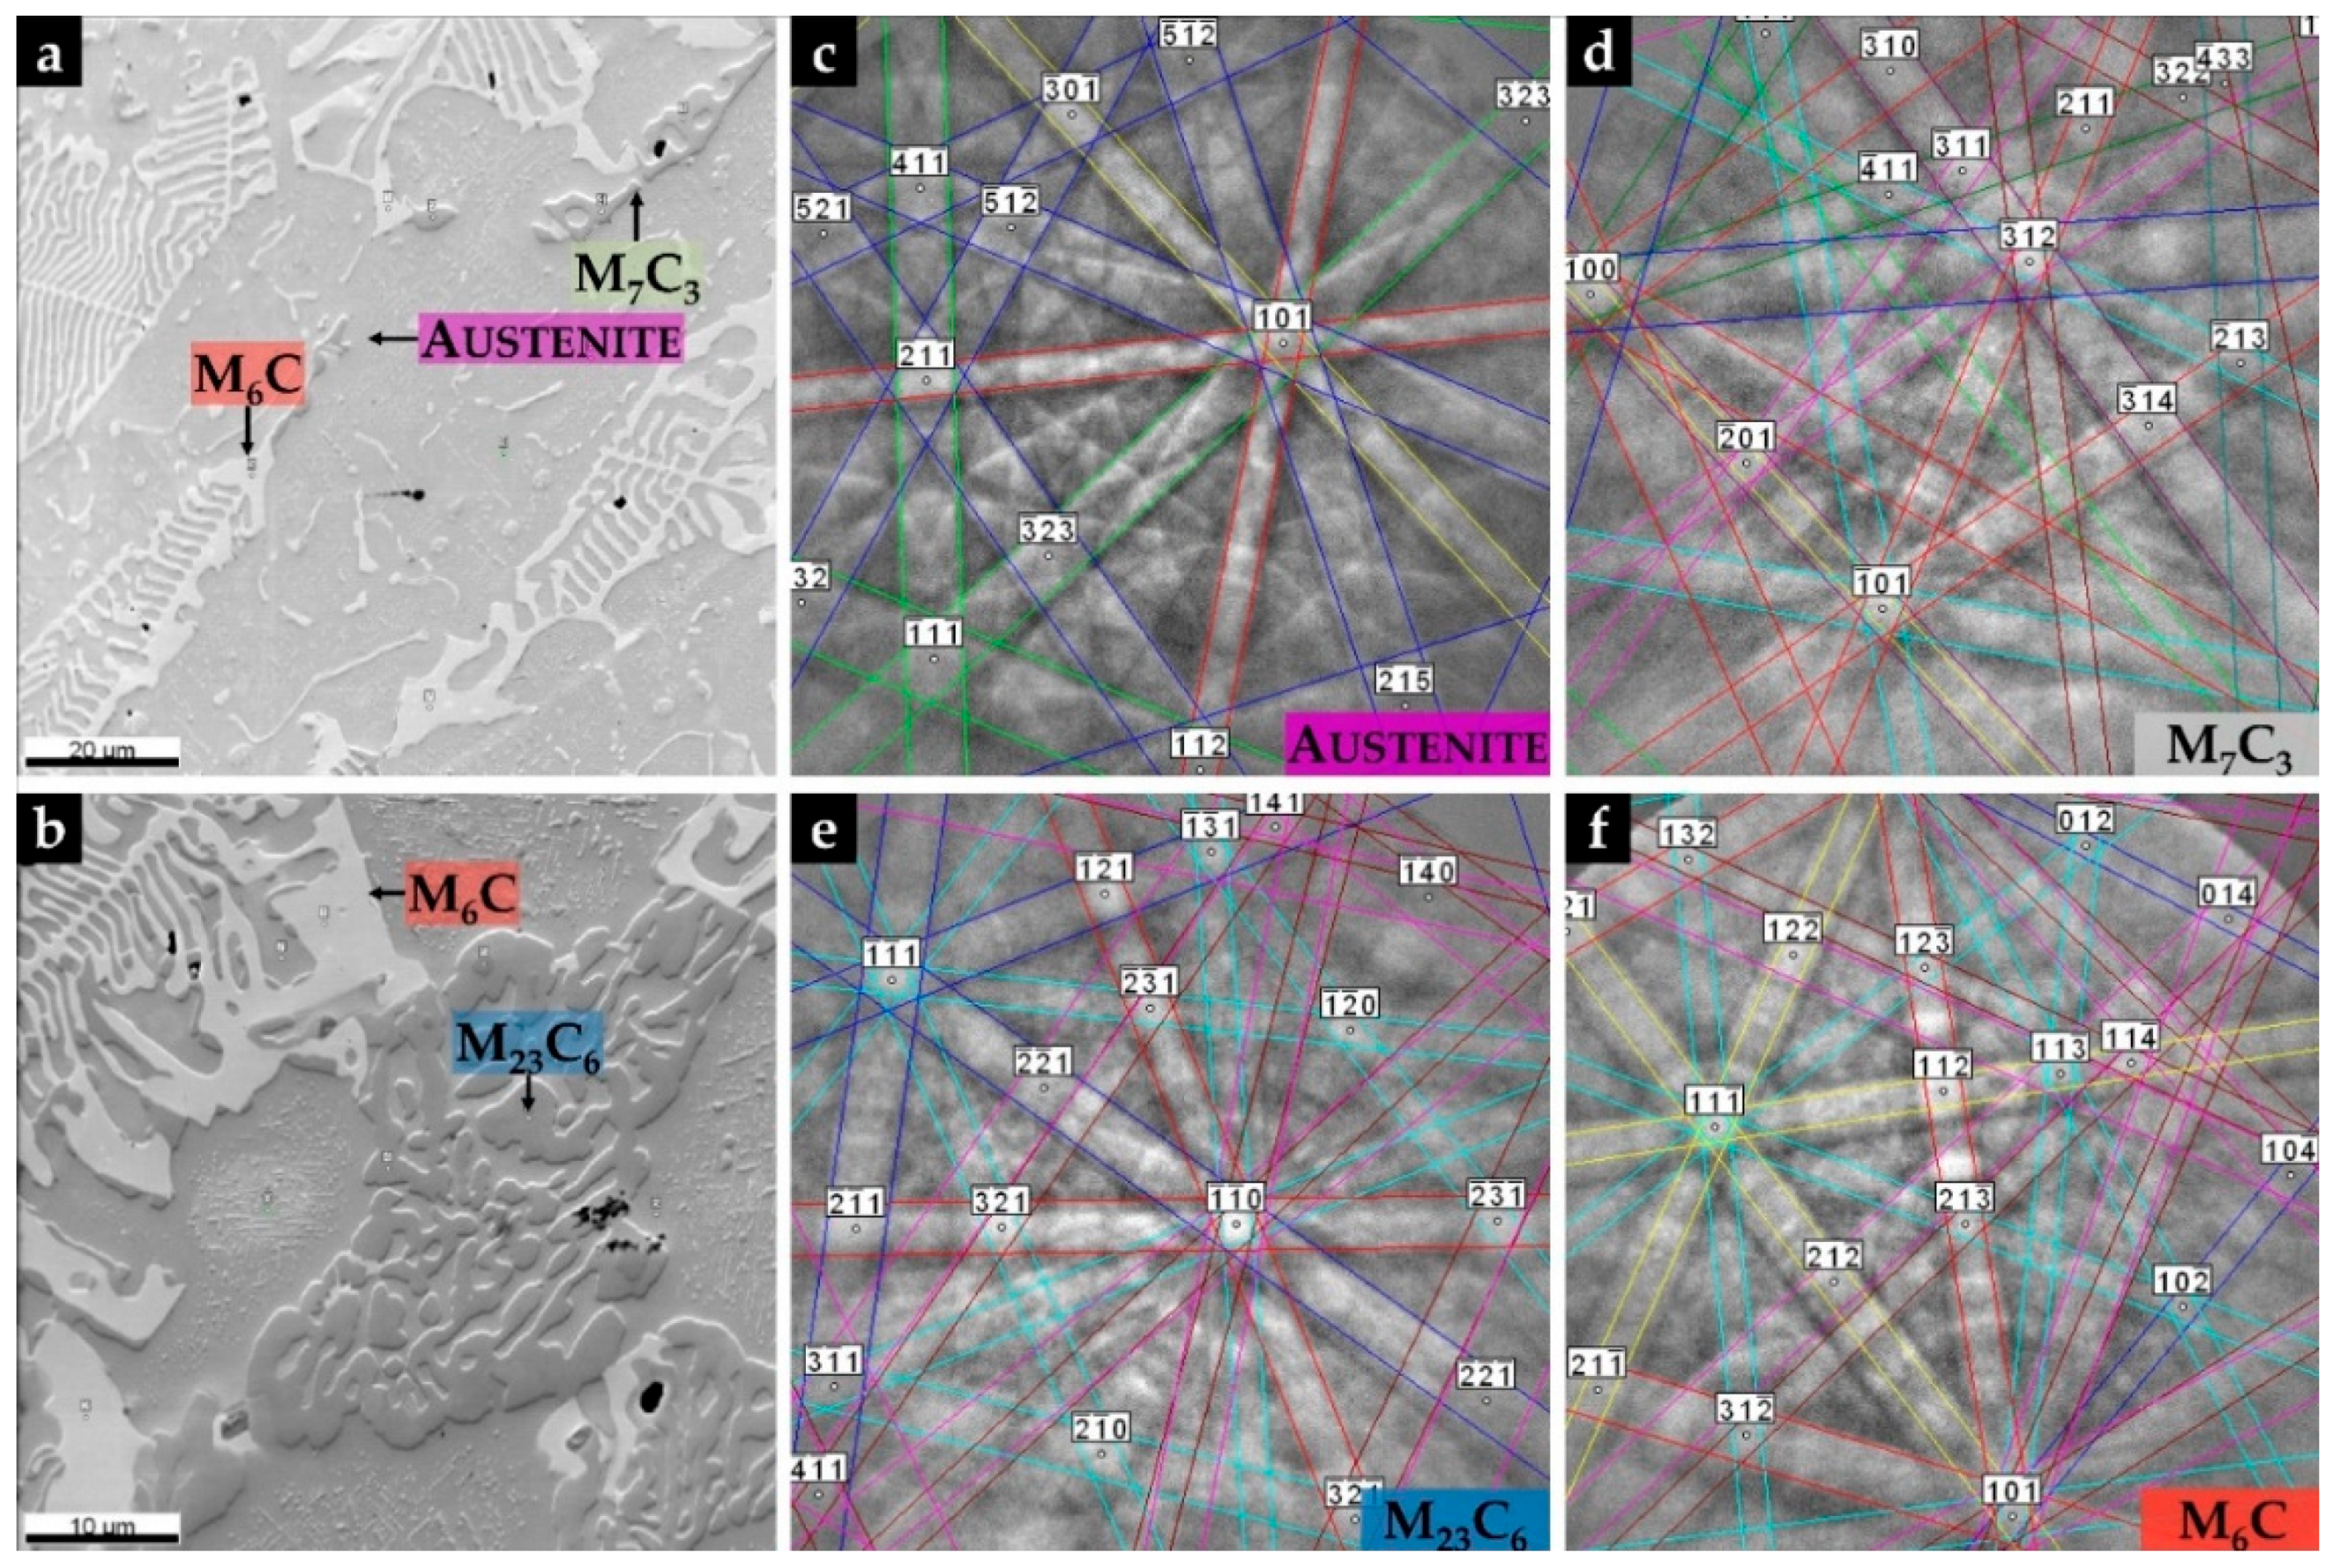
Figure 9.
Amount of carbides (%) present in each composite zone – CZ1, CZ2, and CZ3.
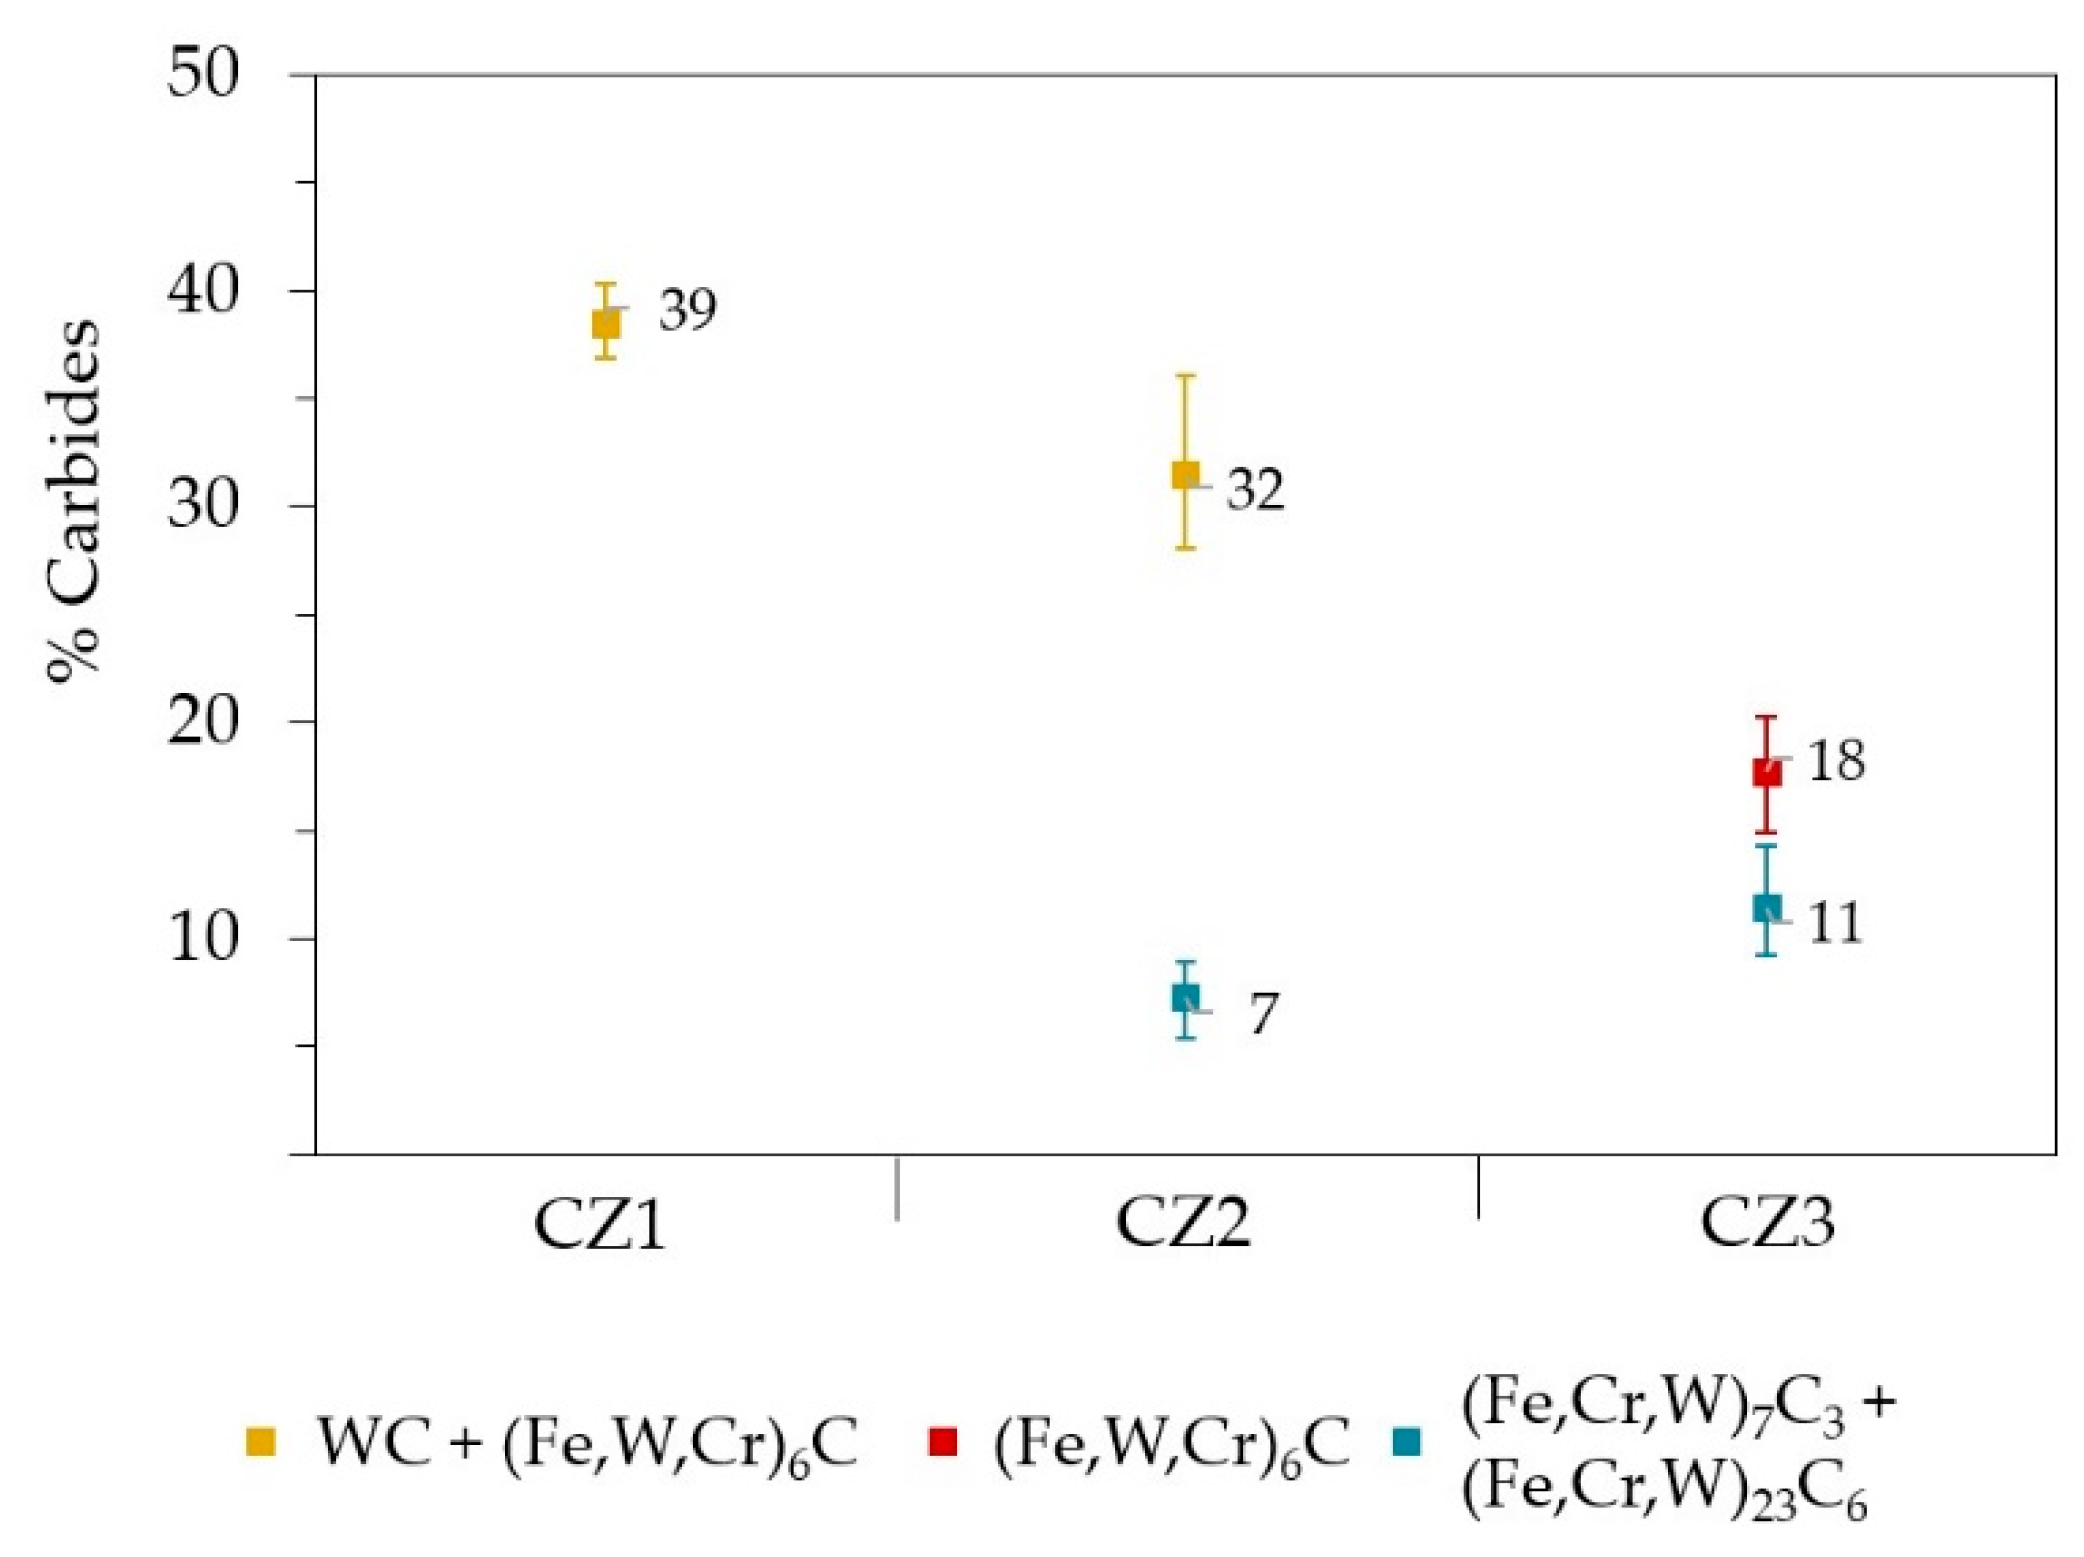
Figure 10.
Vickers hardness (HV 30) of the CZ1 composite zone and the base metal (BM) (a) and variation in Vickers hardness (HV 2) from CZ1 to the BM (b).
Figure 10.
Vickers hardness (HV 30) of the CZ1 composite zone and the base metal (BM) (a) and variation in Vickers hardness (HV 2) from CZ1 to the BM (b).
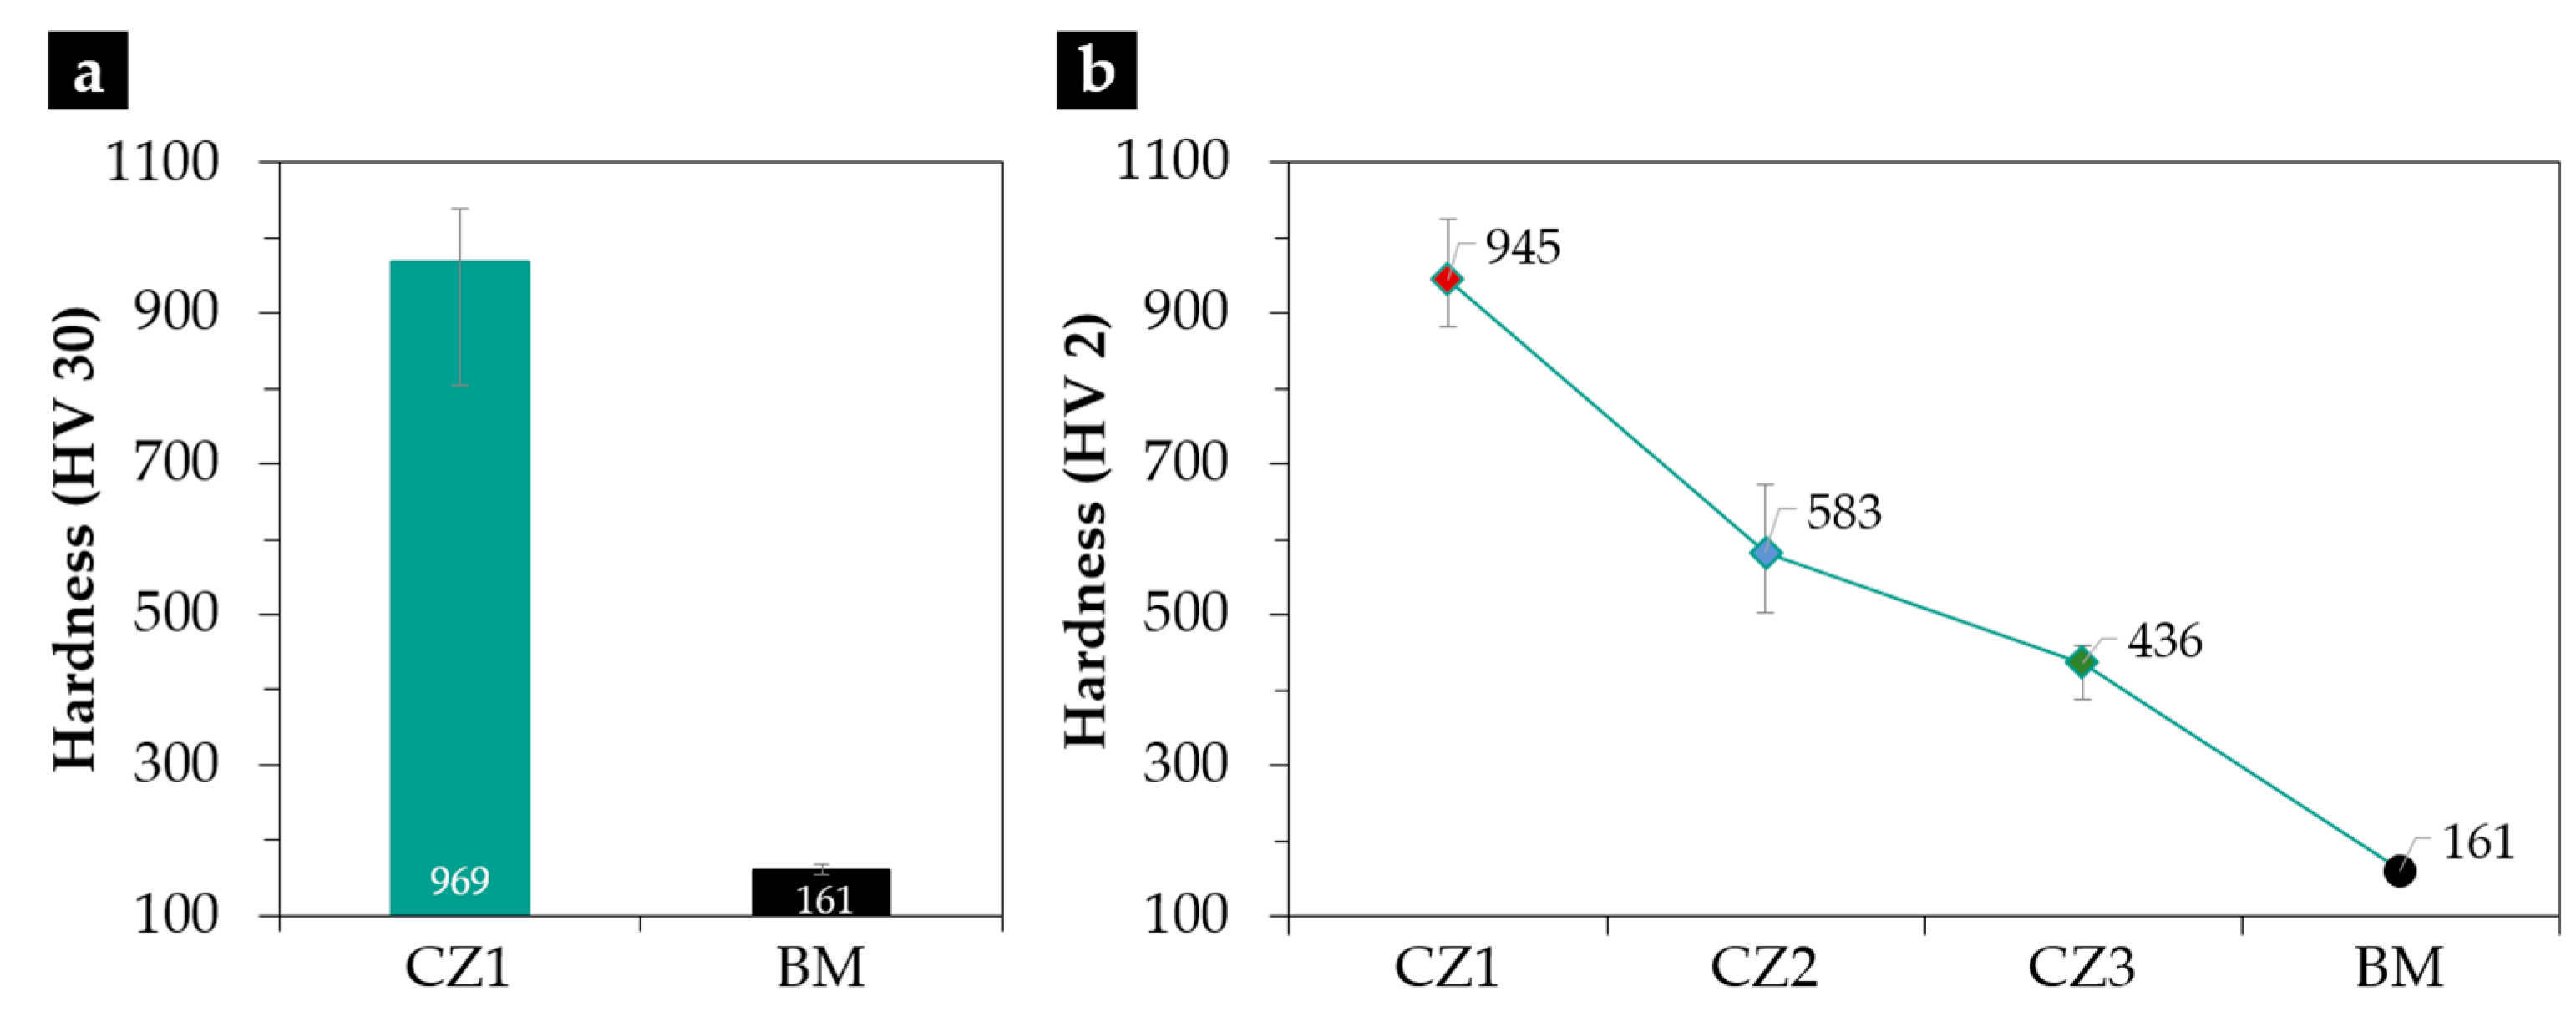
Figure 11.
Volume of worn material as a function of the sliding distance, using a constant load of 0.25 N, for the produced composite and base metal.
Figure 11.
Volume of worn material as a function of the sliding distance, using a constant load of 0.25 N, for the produced composite and base metal.
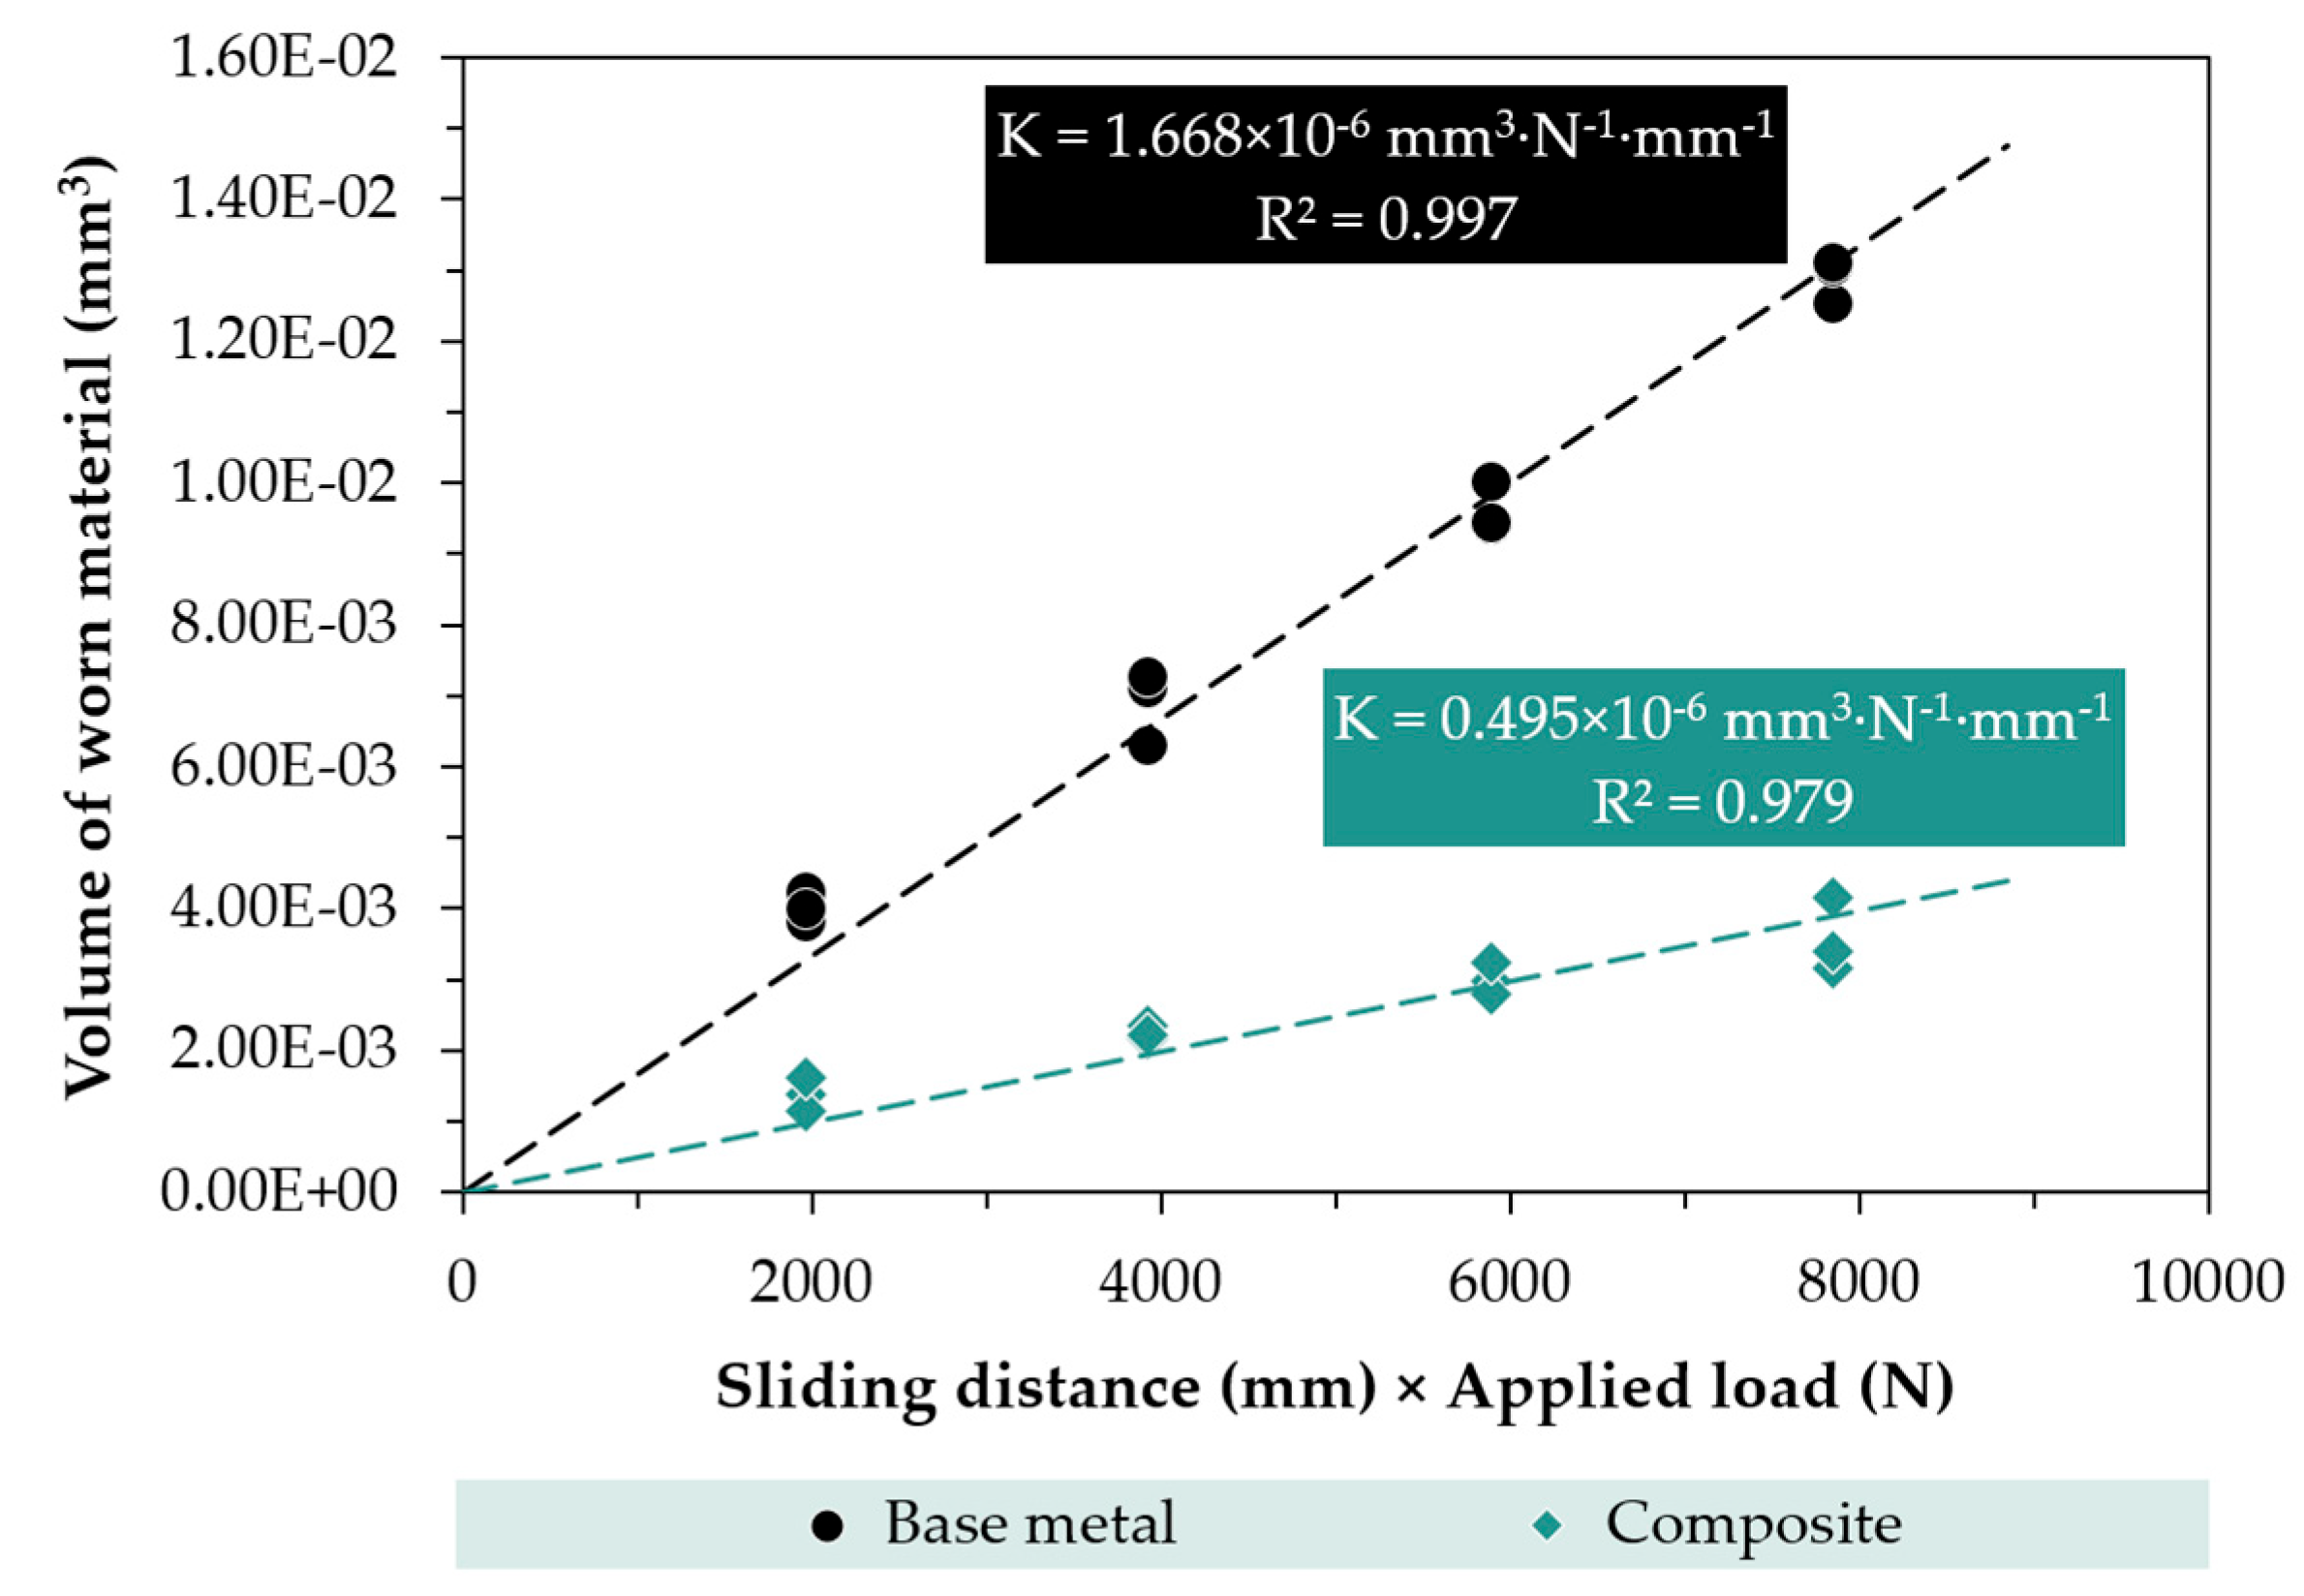
Figure 12.
SEM images of the craters after the micro-abrasion test with a sliding distance of 31.4 m: CZ1 composite zone (a,c,e) and base metal (b,d,f). Low magnification imaging (a,b). High magnification imaging with an Everhart–Thornley detector to enhance the topography of the worn crater (c,d), and using a backscattered detector in a Z contrast mode to analyze the wear of microstructural phases (e, f).
Disclaimer/Publisher’s Note: The statements, opinions and data contained in all publications are solely those of the individual author(s) and contributor(s) and not of MDPI and/or the editor(s). MDPI and/or the editor(s) disclaim responsibility for any injury to people or property resulting from any ideas, methods, instructions or products referred to in the content. |
© 2025 by the authors. Licensee MDPI, Basel, Switzerland. This article is an open access article distributed under the terms and conditions of the Creative Commons Attribution (CC BY) license (http://creativecommons.org/licenses/by/4.0/).
Copyright: This open access article is published under a Creative Commons CC BY 4.0 license, which permit the free download, distribution, and reuse, provided that the author and preprint are cited in any reuse.


