
Submitted:
06 August 2025
Posted:
07 August 2025
You are already at the latest version
Abstract
This paper aims to fill a critical cap in hybrid-electric propulsion (HEP) research by investigating the feasibility of its application on a 'large-cabin' business aircraft by 2040, for which key requirements are a long range of at least 6,297 km (3,400 nmi), and a cruise speed of Mach 0.85. Based upon a representative baseline 'large-cabin' aircraft, a time-stepping simulation for the distinct phases of an NBAA mission, consisting of takeoff, climb, cruise, landing, and a reserve segment is developed for turbofan, series, and parallel architectures. The simulation enables analysis of range, specific air range, battery weight, battery volume, and energy consumption for various degrees of hybridization and battery specific energy densities. The results find that while both series and parallel architectures are able to meet the requisite range targets, the parallel architecture is better suited as the overall drivetrain weight is lower. The parallel HEP architecture enables the aircraft to fly a maximum distance of 7,082 km (3,824 nmi), with a 5% energy hybridization. Over a typical 5,556 km (3,000 nmi) mission this equates to fuel savings of 847 kg compared to a turbofan. The HEP 'large-cabin' aircraft is viable provided battery technology reaches a specific energy density of at least 800 Wh/kg.
Keywords:
hybrid-electric aircraft
; business aircraft
; conceptual design
; hybrid architectures
; range estimation
1. Introduction
Amongst the key challenges facing the aviation industry today are with regards to environmental concerns and sustainability. While the entire general and commercial aviation industry contributes a mere 2.1% of total global CO2 emissions, it is subject to disproportionate scrutiny over its environmental impact [1]. In particular, the use of private and business jets by individuals is coming under increasingly vociferous criticism.
While no formal regulations specifically pertain to the reduction in greenhouse gas emissions for general and business aviation, the industry has pledged to reduce emissions through the Business Aviation Commitment. Manufacturers and operators, represented by the General Aviation Manufacturers Association (GAMA), National Business Aviation Association (NBAA), and the International Business Aviation Council (IBAC) support the International Civil Aviation Organization’s (ICAO) goals for 2050 through the commitment. A key target is the reduction in total CO2 emissions of 50% relative to 2005 levels [2].
One potential path to reducing emissions from aviation is through the adoption of electrified technologies such as hybrid-electric and fully-electric propulsion. The proliferation and relative success of hybrid and fully-electric automobiles have been drivers for similar developments in the aviation industry. While fully-electric propulsion technology is rapidly approaching viability for vehicles operating with short-range, high-frequency concepts of operation, it is currently impractical for heavier, longer-range aircraft [3]. This is due to the limitations of current battery energy density [3]. Even assuming battery energy density is able to improve by 7% annually, it would take in excess of 50 years for the energy density to match that of Jet A-1 [4]. Numerous other technological barriers would also need to be surmounted by 2050 for a viable long-range fully electric business aircraft [5].
In the interim, a potentially pragmatic solution to range is offered through the development of combustion-based hybrid-electric propulsion schemes (HEPS) which leverage the superior energy density of fuel. Energy density is of critical importance to business aircraft, for which the the concept of operations (ConOps) emphasizes high speed and long range at the vehicular level within the aircraft size and weight class. For ease of reference, Table 1 provides a summary of NBAA’s business jet classes, based on averages of the aircraft within the category.
This paper investigates the application of hybrid-electric propulsion specifically for the ’large-cabin’ class business aircraft. A typical mission profile of a large-cabin business jet is presented in Figure 1 and Table 2.
For the large-cabin mission profile depicted above, cruise speeds are usually between Mach 0.85 for long range and Mach 0.9 for high speed. In terms of range, ’large-jets’ are distinguished by the ability to operate inter-continental missions. The entry-level maximum range of large-cabin class aircraft begins approximately at the 6,297 km (3,400 nmi) mark, and extends to a maximum range of approximately 10,186 km (5,500 nmi) [6]. Figure 2 depicts range rings from Los Angeles and New York, two US cities with high volumes of business jet traffic. Also provided on the figures are the maximum ranges of the Embraer Legacy 600 and Dassault Falcon 6X. These jets receptively represent the lower and upper end of the large-cabin aircraft range spectrum [8,9].
Hybrid-electric propulsion schemes have been extensively researched and simulated for urban air mobility vehicles, short range aerial taxis and light general aviation aircraft. A few vehicles have even reached Technological Readiness Levels (TRL) of 6-7 [10]. Large aircraft manufacturers and research organizations continue to investigate the potential application of hybrid-electric propulsion (HEP) systems on regional transports and commercial passenger aircraft.
However, comparatively little published material investigates the feasibility of adopting a hybrid propulsion scheme for business jets. The unique ConOps of business aircraft impose additional considerations that may run contrary to traditional hybrid-electric research assumptions. Consequently, a dedicated investigation into the viability of a twin powerplant hybrid-electric ’large-cabin’ business aircraft is required. This paper aims to fill the large void in published research by determining the following:
- The range achievable with varying degrees of energy hybridization for series and parallel HEP architectures
- The weight and volume of the batteries required to achieve a given range with different architectures
- An optimal architecture for large-cabin business aircraft, enabling further research in the future
Finally, it must be noted that for the results of this study to be practically applicable, due consideration has been given to choices and decisions likely to be made by business aircraft designers. This includes limiting the number of individual powerplants to two, and assuming that manufacturers would leverage existing platforms for reasons of economics. Assumptions throughout the paper are based around a cutting-edge aircraft that would be designed and certified in approximately the next 15 years.
2. Background
Electrified propulsion systems encompass numerous plausible powerplant configurations and architectures that are broadly classified in one of three domains: 1. turboelectric, 2. fully-electric, and 3. hybrid-electric[11]. These domains are differentiated by energy source and powertrain arrangement. Turboelectric engines rely solely on fuel as the source of energy, converting the chemical energy entirely or partially into electric power. Fully-electric systems use energy stored in batteries or other electrical energy storage devices to power electric motors [3,12]. Hybrid-electric systems instead utilize multiple sources of energy, one of which necessarily relies on the storage of electrical energy. Common examples include fuel/electrochemical, or mechanical/electrochemical systems [11]. Utilization of energy sources in hybrid-electric systems may be individual or simultaneous. A breakdown of alternative electrified powerplant schemes based upon means of energy storage and powertrain configuration can be seen in Figure 3.
Hybrid-electric propulsion (HEP) using Jet A-1/battery is of primary interest in this study. Like other hybrid propulsion systems, HEP architectures can be split into three major groups: series, parallel and series/parallel.
2.1. Serial Architectures
Series hybrid-electric systems generate thrust through propulsors driven by electric motors. Electrical power is derived from a generator mechanically coupled to a gas turbine via a gearbox (turbogenerator) [3,13]. The AC current produced by the generator is converted to DC used by the electric motors through a power converter [13]. Depending on the power requirements of the mission phase, the batteries may be used to supplement or as an alternative to the generator-provided power [3]. In flight phases where maximum electrical power is not required, excess DC current from the power converter may be diverted to recharge the batteries. A simplified schematic of the hybrid system is produced below in Figure 4.
One of the primary advantages of a serial HEP system is that the arrangement allows for decoupling of the gas turbine from the propulsors due to power transmission occurring via an electrical bus. This enables high levels of efficiency to be achieved, as the gas turbine and propulsor can operate independently at their optimal speeds [11]. The electrical transmission of power also enables the use of distributed propulsion schemes [3]. However, series hybrid systems lose some energy in the conversion of power from mechanical to electric and back to mechanical. The requirement for high-capacity power electronics such as the power converter also imposes significant weight penalties [3].
2.2. Parallel Architectures
In conventional parallel HEP architectures, a thrust-producing gas turbine engine is mechanically coupled with an electric motor. The mechanical coupling is accomplished through a planetary gearbox, enabling power from the gas turbine engine spool and electric motor to be delivered either simultaneously or individually. During less power intensive mission phases, the turbine engine’s accessory generator may supply electrical power to recharge batteries [13,14]. Figure 5 depicts major components of a parallel hybrid-electric propulsion system.
Amongst the key advantages of a conventional parallel scheme is the ability to use a GTE with an electric motor in conjunction or in-lieu of each other [3,11]. Consequently, existing gas turbine engine technology can be supplemented by continually improving electric motor technology. With fewer components required than a series system, parallel configurations also save on weight [11,12]. Packaging of the parallel system can be accomplished by integrating the electric motor within the engine nacelle, enabling the outer mold lines of existing business jet configurations to be largely retained. The relative simplicity and high-potential offered by parallel architecture HEP has resulted in significant research and development within industry.
However despite the advantages of conventional parallel architectures, the mechanical coupling imposes complexity to the system. Additionally, it must be noted that hybrid-electric operation is especially limited by the required operating conditions of the turbofan engine. Under a fixed thrust requirement, the hybridized condition reduces power demand from the engine core. This in turn causes the the high pressure shaft to adopt a reduced operating speed while mass flow rate and fan speed remain constant, reducing surge-margin on the low pressure components [11,12,15]. Potential solutions for mitigating the margins include a variable-pitch fan controlled by a Full-Authority Digital Engine Controller (FADEC) [10].
2.3. Series/Parallel Architectures
The series/parallel hybrid-electric system combines a turbofan and dedicated electrically-driven propulsors. Electrical power for the motors is supplied by a generator connected to the turbofan, as well as batteries [3]. Conversion of AC-DC current and DC-DC current is accomplished through a power converter. A simplified schematic for the series/parallel system is produced in Figure 6.
One of the key advantages of the series/parallel architecture is the mechanical decoupling of the propulsors from the turbofan engine. This enables a distributed propulsion architecture to be used. The architecture also allows for thrust generation from the motor and turbofan simultaneously or individually. Consequently, the turbofan and electric motors can be operated in flight conditions optimal for the propulsion type.
While series/parallel architectures offer tremendous operational flexibility, it comes at a cost of added weight and significant complexity [10,13,16]. Incorporating a series/parallel hybrid-electric architecture into the confined volume of a business jet would prove difficult. As a result, manufacturers may need to use larger airframes to accomplish the missions currently served by ’large-cabin’ class aircraft, which would in turn reduce overall mission efficiency [16]. Additional complexity also leads to greater maintenance, reducing aircraft availability rates. This is particularly unenviable for business jet owners and operators, and is consequently unlikely to be adopted by manufacturers. Based on the inherent drawbacks and current technological levels of series/parallel systems compared to other hybrid-electric schemes, the architecture falls beyond this study’s aim of hybridizing business aviation in the near term.
2.4. Energy Storage Technology
One of the key enablers of hybrid-electric propulsion technology are energy storage devices capable of generating electric current upon discharge. The performance of these energy storage devices determine aircraft range and MTOW [11,17]. Amongst the key metrics for determining suitability of energy storage is specific energy (gravimetric energy density) in Wh/kg [18]. Jet A-1 has a specific energy of 11.95 kWh/kg [4,19]. Lower specific energy values would require additional mass of the energy storage medium to be carried, thereby adversely impacting performance. Additional considerations for energy storage devices include volumetric energy density (Wh/L), specific power (W/kg), and number of charge/discharge cycles [11].
Battery technology is the most promising energy storage technology for near-term hybrid-electric propulsion systems due to a high level of technology readiness, and the successful adoption in the automotive industry [11]. While batteries may not exhibit the highest values in terms of energy storage or power delivered, they offer a balance between specific energy, specific power, volumetric energy density and charge/discharge cycles [20,21]. Batteries also have the advantage of being able to respond quickly to changing power demands to meet peaking or load-leveling requirements [3].
Currently, lithium-based batteries demonstrate the greatest potential for aircraft application as it is the lightest metal, enabling higher specific energy density. Four lithium battery types are available - lithium-ion, lithium-polymer, lithium sulfur, and lithium-air/oxygen. A comparison of these batteries and their cell-level performance has been provided in Table 3. However, it must be noted that batteries at the pack level have specific energy is lower due to the weight added by current collectors, wire harness connections between individual cells, and the outer casing. Future performance projections are for the next 15 years. Superscripts denote the following publications: a-[22], b-[20], c-[3], d-[23], e-[24], f-[25], g-[26], and h-[11].
2.5. Power Electronics, Motor and Generator Technology
Power electronic systems are key technological enablers for practical hybrid-electric propulsion. In order to distribute power efficiently between the energy storage, power generation, and propulsive components, 1-3 kV class electrical systems are required [3,11]. Amongst the most critical power electronics systems for viable hybrid-electric propulsion are the power converters that convert AC current produced by the generator and DC current produced by the batteries to a single form used by the electric motors. Current power electronic systems suitable for aircraft application generally lag behind those used by other industries due to the limitations described by Paschen’s law [3]. However based on current trends, it is estimated that the specific power of power converters would reach 12 kW/kg and an efficiency of 98% to 99% within the next 15 years [3,27].
Given that all combustion-battery architectures utilize motors, technological improvements are vital for hybrid-electric propulsion. Current state-of-the-art motor technology yields SPs of around 2.2 kW/kg. The SP further reduces for motors more powerful than 3 MW due to the need for higher rotational speeds, which are made possible by more windings. Cooling requirements and thermal management are also important considerations for practical high-power motors. Sustained development over the next 15 years could however increase specific power up to 9 kW/kg, surpassing the 6.5 kW/kg threshold for feasible single aisle hybrid-electric transports [3,11,28]. Efficiency of MW-class electric motors is approximately 96% to 99% [10,29,30,31].
Along with improvements in motor technology, development of turbogenerators is also critical for enabling practical series hybrid-electric architectures. Current turbogenerators have specific powers on the order of 7.9 kW/kg [32]. Assuming sustained progress, the SP for turbogenerators is expected to rise to 13 kW/kg by 2035 [33,34]. Thermodynamic efficiency of turbogenerators is on the order of 47% [35].
3. Methodology
3.1. Baseline Aircraft Aerodynamic Model
In order to select a hybrid-electric architecture for a ’large-cabin’ business aircraft, a representative baseline aircraft-level aerodynamic model must be established. This model provides a common reference, enabling the comparison of aircraft performance with a turbofan, series HEP, and parallel HEP powerplant architecture. The major specifications for the baseline are provided in in Table 4, based-off typical ’large-cabin’ aircraft such as the Gulfstream G500 (GVII-G500), Dassault Falcon 6X and Bombardier Global 5000.
3.2. Performance Simulation
Based on these baseline parameters, a time-stepping point-mass flight performance simulation was developed on MATLAB. At each step, the aerodynamic parameters were recalculated based upon altitude, velocity and weight. The simulation is able to transition between climb and cruise for a given input cruising altitude. Descent is automatically initiated when the available fuel equals the descent requirements. The performance simulation allows the determination of two parameters of interest - overall drag during climb, and the cruise lift-to-drag ratio. The former enables a determination of power required, from which engine size and weight can be determined. The lift-to-drag ratio enables a determination of best rate-of-climb and maximizing aircraft range from the best altitude and airspeed combination. The simulation process is substantially based on the equations provided by [36].
Starting with an assumed maximum coefficient of lift , Ostwald efficiency and a Mach drag-divergence , a range of flyable velocities from to for the aircraft was determined. For velocities within the flyable range, the coefficient of lift was computed based on steady state assumptions for the instantaneous aircraft weight.
The aircraft profile drag buildup was conducted based upon the equations presented in Raymer’s Aircraft Design: A Conceptual Approach [37]. This methodology accounts for the velocity and altitude variation using Reynolds Number. Validation of the drag build-up method was accomplished by comparing known values for the ’ultra-long range’ class Gulfstream G550 (GVII-G550) against those provided by [38]. The build-up method yielded a difference of two drag counts (0.0002) or approximately 1% between the value found by [38] at a pressure altitude of 45,000 ft and Mach 0.8. The geometric input parameters for computation of zero-lift drag, of the subject aerodynamic baseline model are summarized in Table 5.
The determination of and of the baseline aircraft in turn enabled the determination of a parabolic model for coefficient of drag that consists of profile, induced, and wave drag sources. Using , the lift-to-drag ratio can be determined for a given altitude and Mach number. Power required as a function of Mach number is also determined through the drag coefficient.
Figure 7 presents net drag for the conceptual ’large-cabin’ class aircraft at different altitudes as a function of Mach number. Figure 8 presents the lift-to-drag ratio for the aerodynamic model.
Fuel/energy consumption was computed based on the thrust developed during the mission phase. Climb was conducted at a typical maximum continuous thrust of 90% of the sea-level takeoff rating to provide a maximum rate, climb. The cruise phase assumed level, unaccelerated flight such that the thrust equals drag. Descent was conducted at idle thrust to provide greater overall mission range. Aircraft weight is updated to reflect fuel burn.
3.3. Conventional Turbofan Performance
3.3.1. Power Curves
Using the simplified equation for thrust lapse rate for altitude corresponding to the pressure ratio presented in Eqn. 1, the available propulsive power curves for the baseline turbofan was generated [39]. A throttle ratio, optimized for a low-bypass turbofan in a high-speed application was used. With the drag for the aerodynamic model previously determined, the power required curve was also produced. This is overlaid onto the plot presented in Figure 9.
Based upon the propulsive power from the turbofan architecture, it becomes possible to size the hybrid-electric schemes. In order to match flight performance, three propulsive power conditions are of importance - sea level (SL) at , sea level at and ceiling at . These are presented in Table 6, and represent the delivered power. Additionally, single-engine performance of the hybrid schemes must match or exceed that of a turbofan for a given altitude. For hybrid-electric engines, matching the turbofan performance for a given altitude is generally not a significant challenge, as electric motor power does not lapse with altitude [40,41].
3.4. Turbofan Weight
The weight the turbofan engines was determined using Eqn. 2, a first-order statistical regression developed by [37]. Applying an input of kN thrust and a bypass ratio , each of the two engines was found to weigh 1,449 kg.
3.4.1. Turbofan Range
The range for the conventional turbofan model was determined using a Forward Euler time-stepping simulation method. For each point in time, the aircraft velocity, altitude, weight, fuel burn, and position is incrementally propagated forwards. Integrating the velocity over the climb, cruise and descent phases provides the overall mission range.
The set-up of the simulation automatically transitions between mission phases for a given altitude-Mach combination. After the the maximum rate () climb to an assigned altitude is complete, the simulation then consumes all the fuel available for cruise, before descending with enough fuel for a landing. Note that the turbofan simulation maintains approximately 1,451 kg of fuel for climb, sufficient for a missed approach and 45 minutes of IFR reserves. Since this methodology for range simulation makes similar assumptions as the NBAA IFR ranges, it enables comparison with typical business jet aircraft and missions.
From the lift-to-drag ratio plot provided above in Figure 8, the optimum cruising altitude for the aerodynamic model at Mach 0.85 is at 45,000 ft. Consequently, these values were selected for the simulation.
Validation of the simulation was once again conducted against known values for the G-550. The simulation shows a maximum range of 12,403 km (6,697 nmi) at a cruise altitude of 41,000 ft at Mach 0.8, whereas the published maximum range for the G-550 is 12,501 (6,750 nmi) [38,42]. A difference of 0.8% between the simulated and published maximum range is sufficiently small for the purposes of determining the effects on range from hybridization.
3.5. Hybrid-Electric Drivetrain Performance
In order to model the series and parallel hybrid-electric drivetrains, the degree of hybridization for each system must be established. Two parameters define the degree of hybridization of a HEP powerplant - energy hybridization () and propulsive power hybridization ().
3.5.1. Energy Hybridization
Energy hybridization represents the ratio of battery energy storage to the total, . In the case of a hybrid-electric propulsion scheme the energy hybridization ratio becomes:
Based upon this formula, conventionally powered aircraft would have a , whereas all electric aircraft would have . The hybridization ratio is a determinant of aircraft range amongst other performance parameters, as it dictates the total available energy for a fixed energy weight.
3.5.2. Motor Power Hybridization
Motor power hybridization represents the ratio of power supplied by the motor to total power, such that [11]. For a series configuration, , as the entirety of propulsive power is developed by the motor. Consequently, the power hybridization is more relevant to parallel schemes, since the turbofan and electric motor contribute simultaneously to the propulsive effort. For a combustion hybrid-electric scheme, the power hybridization is given by Eqn. 4. In this paper, the power hybridization uses a ratio of delivered power.
3.5.3. Hybrid-Electric Drivetrain Sizing & Weight
The single-engine delivered power requirement of 13,129 kW determined in Section 3.4 enables the sizing of series and parallel hybrid-electric architectures. However, since this is the power produced from thrust, the individual components of the hybrid-electric system must be enlarged to account for efficiency losses in the drivetrain. Table 7 presents the drivetrain efficiency paths for the series and parallel architectures based on the methodology proposed by [14]. Additional consideration must also be given to operation without battery energy, as recharging facilities may not be universally available at airfields. In practice, this translates into a requirement for the fuel to shaft path to be sized to deliver the requisite power without supplementary power from the battery to shaft path.
Specific values for component efficiencies are produced in Table 8 based upon the 15 year predictions presented in Section 2. Once the power of each component is calculated, the associated weight may also be determined using estimates of specific power for the same 15 year period. Component-wise specific powers are also presented in Table 8. Efficiency and specific power values for common components are assumed identical for both architectures.
For the series hybrid-electric configuration, the drivetrain was sized to match the sea level turbofan maximum continuous power for level-flight maximum speed . Component size and weight, and total architecture weight for the series configuration are produced in Table 9.
For the parallel configuration, a motor power ratio of 0.25 was used. This power ratio is in line with what other studies have explored and found to provide a quantum of fuel savings, whilst maximizing range [40,43]. While greater power hybridization improves overall powertrain efficiency, it comes at the cost of additional weight, as the specific power of electric motors is inferior to that of gas turbines.
The turbofan delivered power of 13,129 kW was retained to enable operation with discharged batteries. Weights for the parallel architecture components are produced in Table 10.
3.5.4. Hybrid-Electric Range
Given that the baseline aircraft has a fixed MTOW of 34,019 kg, and that the passenger and payload weights for the mission are identical between a conventionally powered and HEP aircraft, the additional engine weights of the series and parallel configurations must be subtracted from the available energy weight of 14,742 kg. The weight deltas between the HEP architectures and the turbofan are presented in Table 11.
To assess the range and energy consumption profiles of the hybrid-electric architectures, the turbofan time stepping simulation was then modified to account for the various drivetrain power consumption pathways and their respective efficiencies. Additionally, depleting fuel was prioritized over battery energy consumption to maximize range, since battery weight is fixed throughout the mission. For the series configuration, this results in the fuel-based energy conversion by the turbogenerator being primarily used during climb and cruise, followed by all-electric operation. For the parallel configuration, the electrified component cannot be used exclusively, as the electric motor is not individually capable of delivering the necessary power throughout the mission. Consequently, the turbofan must be used when the power required exceeds the capabilities of the electric motor. In order to accomplish the reserve mission missed approach procedure, a small reserve of fuel was kept based upon the battery weight.
Finally, the broad range of predicted battery specific energies must be accounted for. By sweeping the simulation across the range of Wh/kg, a minimum requirement for battery technology can be established for viable hybridization of a ’large-cabin’ business aircraft. Given that for a fixed energy weight different battery specific energies produce different energy hybridization ratios, the simulation parametrically sweeps across the range of . For each combination, the total energy weight carried on board the aircraft was constrained to the original 14,742 kg less the additional burden of the architecture powerplant weight. A summary of the methodology for the hybrid-electric simulation is presented in Figure 10.
4. Results & Discussion
One of the critical performance parameters in the ConOps for a ’large-cabin’ business aircraft is range. Typical ’large-cabin’ class aircraft have maximum ranges of between 6,297 km (3,400 nmi) and 10,186 km (5,500 nmi).
4.1. Turbofan Baseline Range
Using the simulation methodology described in Section 3.2, the mission profile for the conventional turbofan powered aerodynamic model was generated. Figure 11 presents the altitude-range plot for an aircraft starting at the MTOW with maximum fuel, climbing at the maximum rate, climb, cruising speed of Mach 0.85 at 45,000 ft and descending at the best glide ratio. The total NBAA range for the turbofan aircraft is 10,179 km (5,496 nmi), excluding the alternate airport mission and the mandated holding reserves of 45 minutes at 5,000 ft. This range tracks closely with contemporary ’large-cabin’ business aircraft such as the Embraer Legacy 650, Bombardier Global 5000, Dassault Falcon 6X, and Gulfstream G-500 (GVII-G500), consequently validating the aerodynamic model and simulation as a representative baseline.
4.2. Hybrid-Electric Performance
4.2.1. Range
Applying the series and parallel hybrid-electric simulations over a variety of energy hybridization ratios, , and battery specific energy densities enables a parametric sweep to be conducted. Using the MTOW of 34,019 kg, energy hybridization ratios of to , and battery specific energy densities of contour plots for both HEP architectures were produced. Figure 12 and Figure 13 respectively show the range-hybridization ratio-energy density contours for the series and parallel powertrains on the aerodynamic model in increments of 926 km (500 nmi).
As seen from the contour plots, increasing the energy hybridization ratio results in a significant reduction of overall range for both configurations when compared to the entirely fuel-based turbofan model. However, overall range is recovered by increasing battery specific energy density. The spacing of the contours demonstrates that sensitivity is biased towards battery specific energy density rather than hybridization ratio. For instance at the midpoint of the parametric sweep, at a 1% increase in results in a 0.20% increase in range for the series and parallel configurations. However, a 1% increase in approximately results in a 2.0% decrease in range. This is occurs because increasing the hybridization ratio for the given range of battery specific energies densities reduces total stored energy on the aircraft. Batteries with specific energy densities of 1,000 Wh/kg are still an order of magnitude less than jet fuel, which has an energy density of 11,950 Wh/kg. Consequently at the midpoint a 1% increase in hybridization replaces 2,231 kWh of fuel energy with 516 kWh of battery energy.
Based on the plots, it also becomes evident that current battery technological levels of less than 400 Wh/kh make for a difficult case for practical hybrid-electric propulsion systems with degrees of energy hybridization greater than 2.5%. However, assuming battery technology achieves the predicted specific energy of 1,000 Wh/kg in the next 15 years, longer ranges can still be achieved with meaningful levels of hybridization. Table 12 provides the range for the serial and parallel architectures for selected degrees of energy hybridization for the forecast 1,000 Wh/kg batteries. The range reduction percentages for each architecture are computed against the turbofan baseline range of 10,179 km (5,496 nmi).
From the contour lots and Table 12, it is seen that ranges in excess of the 6,297 km (3,400 nmi) threshold typically required of this class of aircraft are achievable with significant degrees of hybridization. For a series hybrid-electric scheme, a 6,297 km (3,400 nmi) range is accomplished with an energy hybridization ratio of up to 4.6%. The same is distance is reached with a hybridization ratio of 6.2% in the case of a parallel architecture.
4.3. Energy Consumption
In addition to obtaining the requisite range for of a typical ’large-cabin’ business aircraft, maximizing energy efficiency is also desirable. Using the simulation data, the energy specific air range (ESAR) can be used to determine boundaries for hybridization ratio and battery specific energy within the target range bracket. Figure 14 and Figure 15 respectively present plots for energy specific air range for the series and parallel configurations. It is to be noted that the ranges encompassed by the ESAR curves vary significantly. At low levels of hybridization and high battery specific energies, ranges are close to 9,075 km (4,900 nmi) and 9,630 km (5,200 nmi) for the series and parallel configurations respectively. At the extreme right of the plot and low energy densities, range is less than 111 km (60 nmi). Nonetheless, when accompanied by range data, the trends remain valuable in determining aircraft-level efficiency.
The ESAR plots indicate that at low hybridization ratios of less than 0.04, specific range of a hybrid configuration is inferior to that of the conventional baseline. This is because the weight imposed by hybrid-electric drivetrains result in a higher empty weight, taking away available energy mass. As hybridization increases, the superior efficiency of electrified propulsion architectures begins to improve the overall specific air range. This is however counteracted by increasing battery weight; weight that is not shed during the course of the flight. For battery energy densities of around 400 Wh/kg, ESAR drops to below that of the conventional turbofan at around 30% hybridization. The 200 Wh/kg and 300 Wh/kg batteries are unable to match turbofan specific air range performance at any degree of hybridization. Consequently for each nautical mile of distance covered, batteries under 300 Wh/kg would consume more energy than for a turbofan in the same distance. With increasing hybridization, the ESAR curves plateau near what would be the specific air range of an electric aircraft.
The contour and ESAR plots together demonstrate that mild hybridization levels of between 4% to 6% are optimal for ’large-cabin’ business aircraft operations using either of the examined hybrid-electric architectures. These hybridization ratios offer a balance between overall range and energy efficiency. Taking an intermediate point of 5% hybridization, Figure 16 presents the mission ranges for the series and parallel configurations at Wh/kg and Wh/kg. For the former case, range for the series and parallel configurations are 2,091 km (1,129 nmi), and 2,378 km (1,284 nmi) respectively. At 1,000 Wh/kg, the ranges are 6,271 km (3,386 nmi) and 7,082 (3,824 nmi), extremely close to the 6,297 km (3,400 nmi) threshold for a ’large-cabin’ business aircraft.
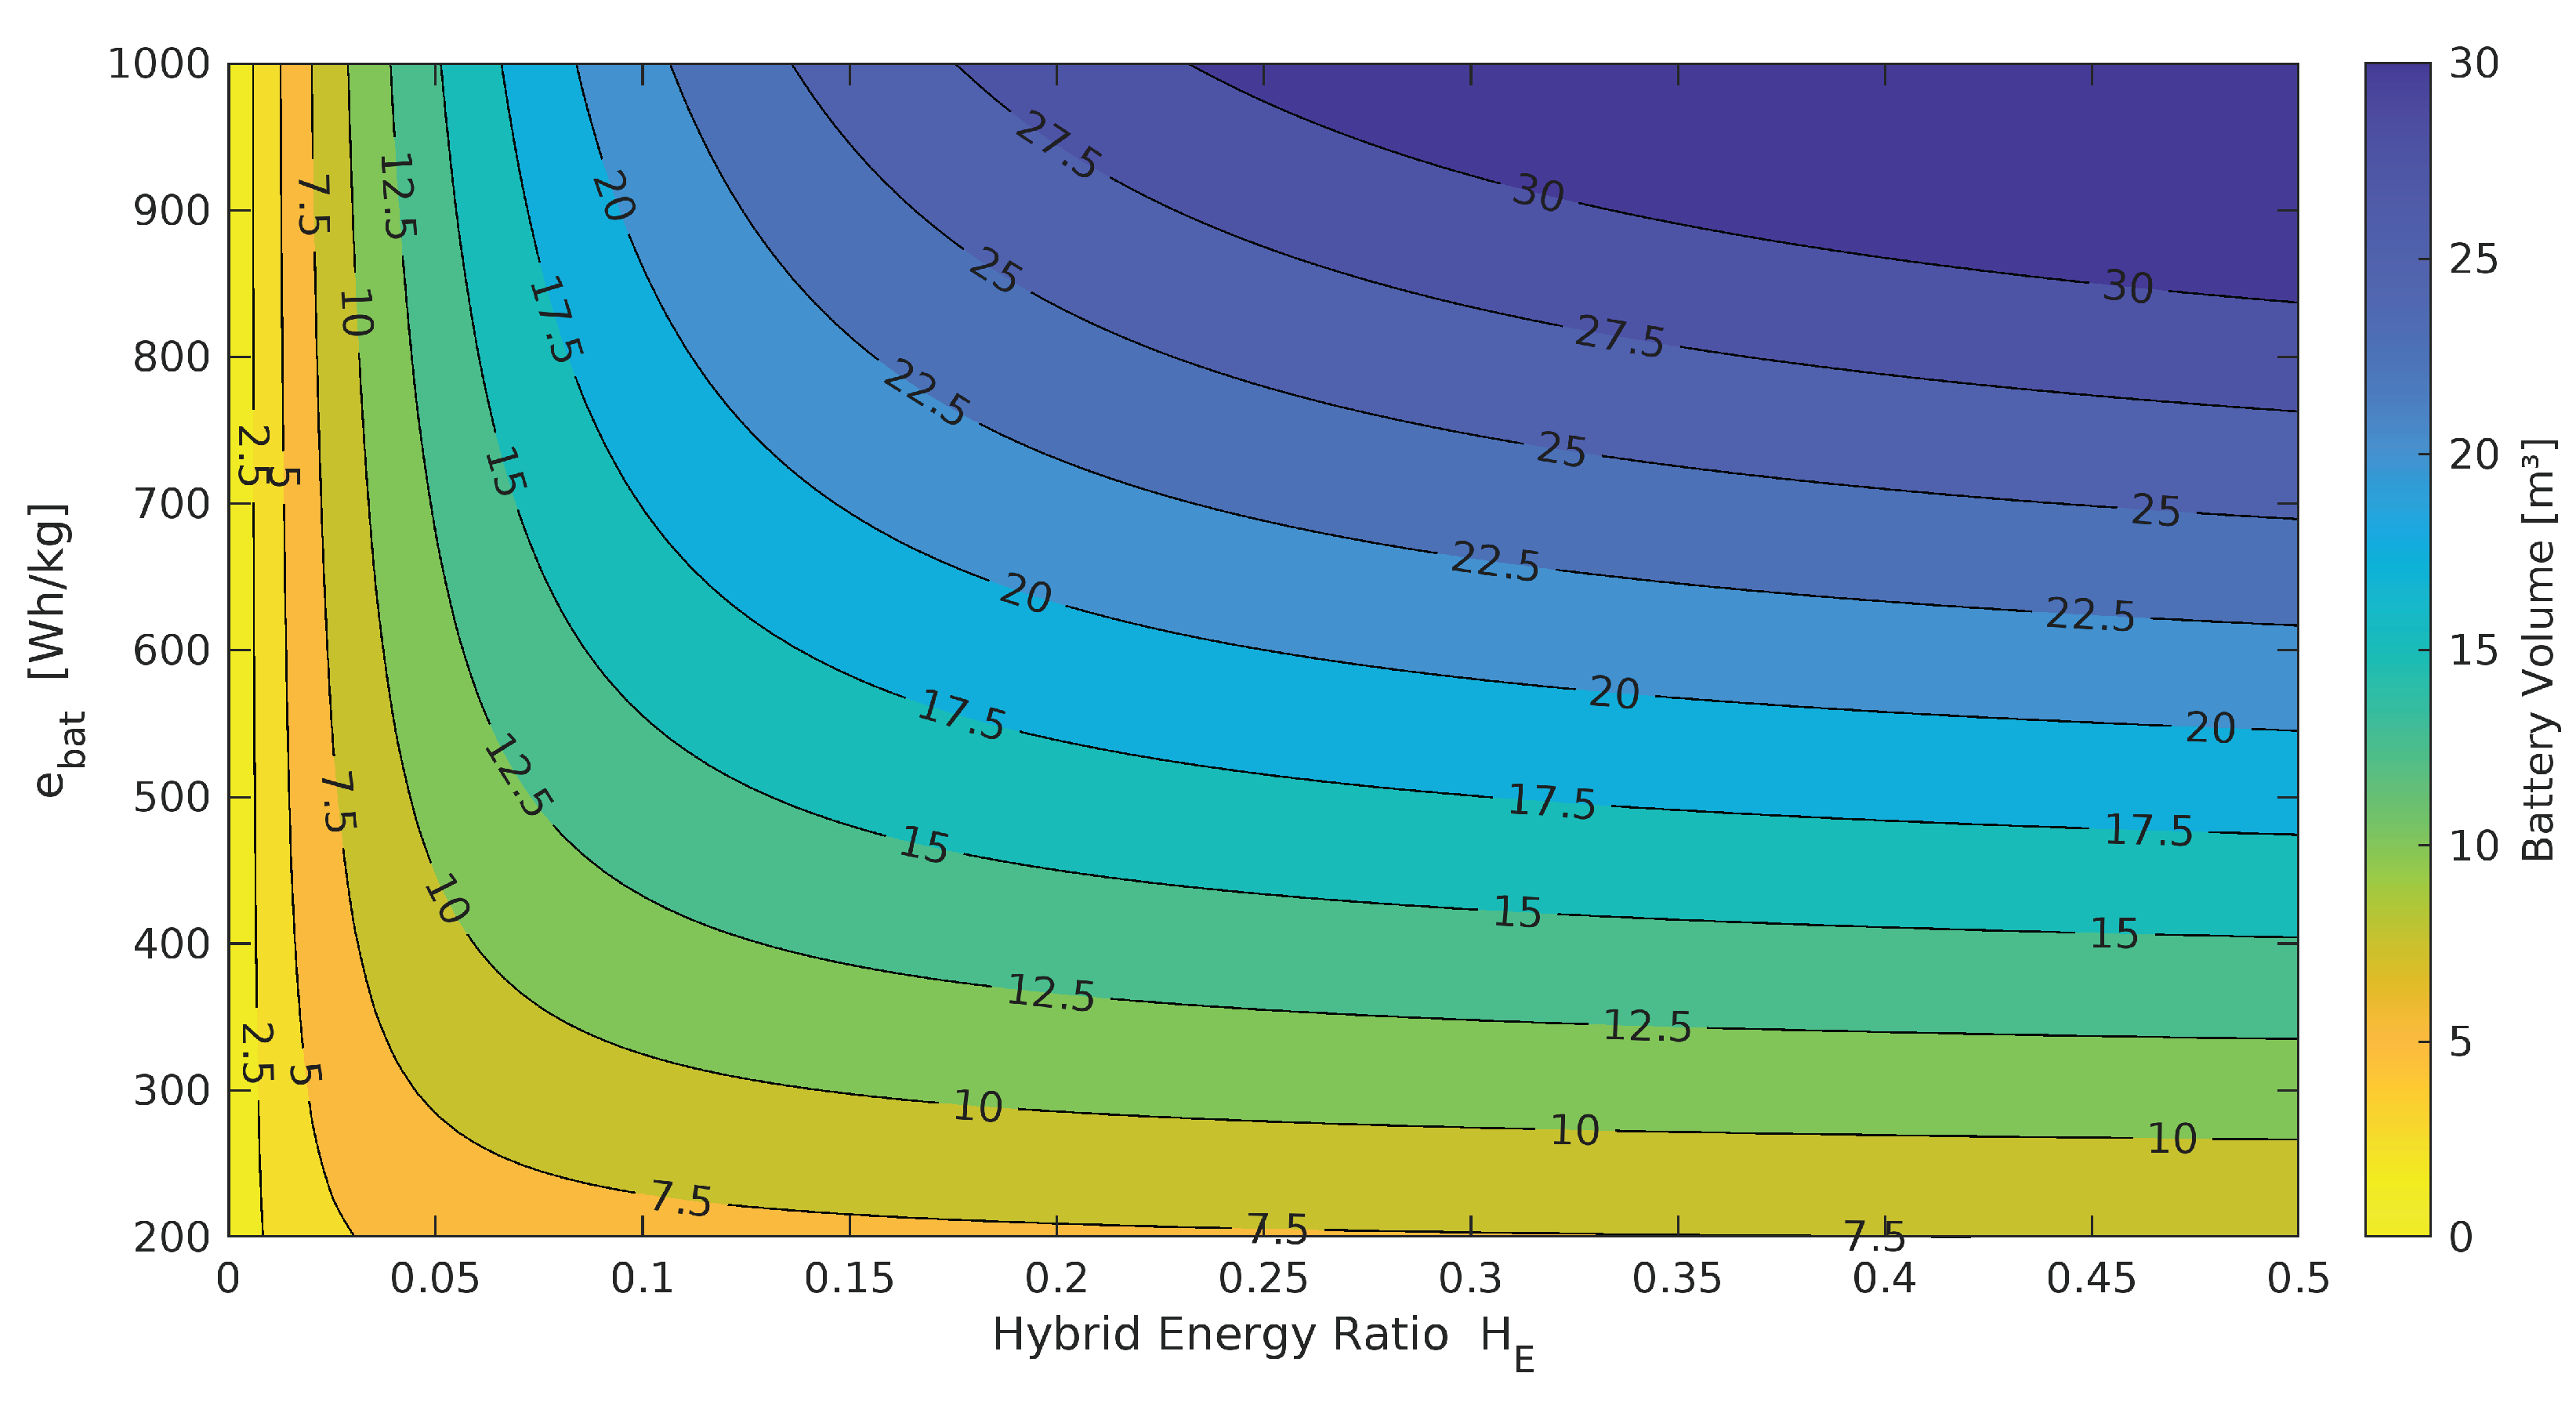
4.3.1. Battery Weight & Volume
While range and energy efficiency are key performance parameters for a hybrid-electric business aircraft, due consideration must be given to the physical constraints of the host airframe. Battery weight and volume are major limitations to greater hybridization. For the fixed energy masses of 11,689 kg and 13,813 of the series and parallel configurations, a battery weight contour is obtained by sweeping across hybridization ratio specific energy. Figure 17 and Figure 18 present the battery weights plots. For a hybridization ratio of 5% and an energy density of 1,000 Wh/kg, battery weights for the series and parallel configurations are respectively 4,499 kg and 5,317 kg. Similarly for volume, Figure 20 present the resulting volumes for the respective architectures. At the same combination of hybridization ratio specific energy, the minimum volume required to store the battery packs are 12.50 m3 and 14.77 m3 for the series and parallel architectures. Volumetric energy density was taken as 360 Wh/L at the battery pack level. Table 13 presents weights and volumes for both considered architectures. The volume is computed against a fuel storage volume of 14.63 m3.
Figure 17.
Battery Weight contour for the series configuration
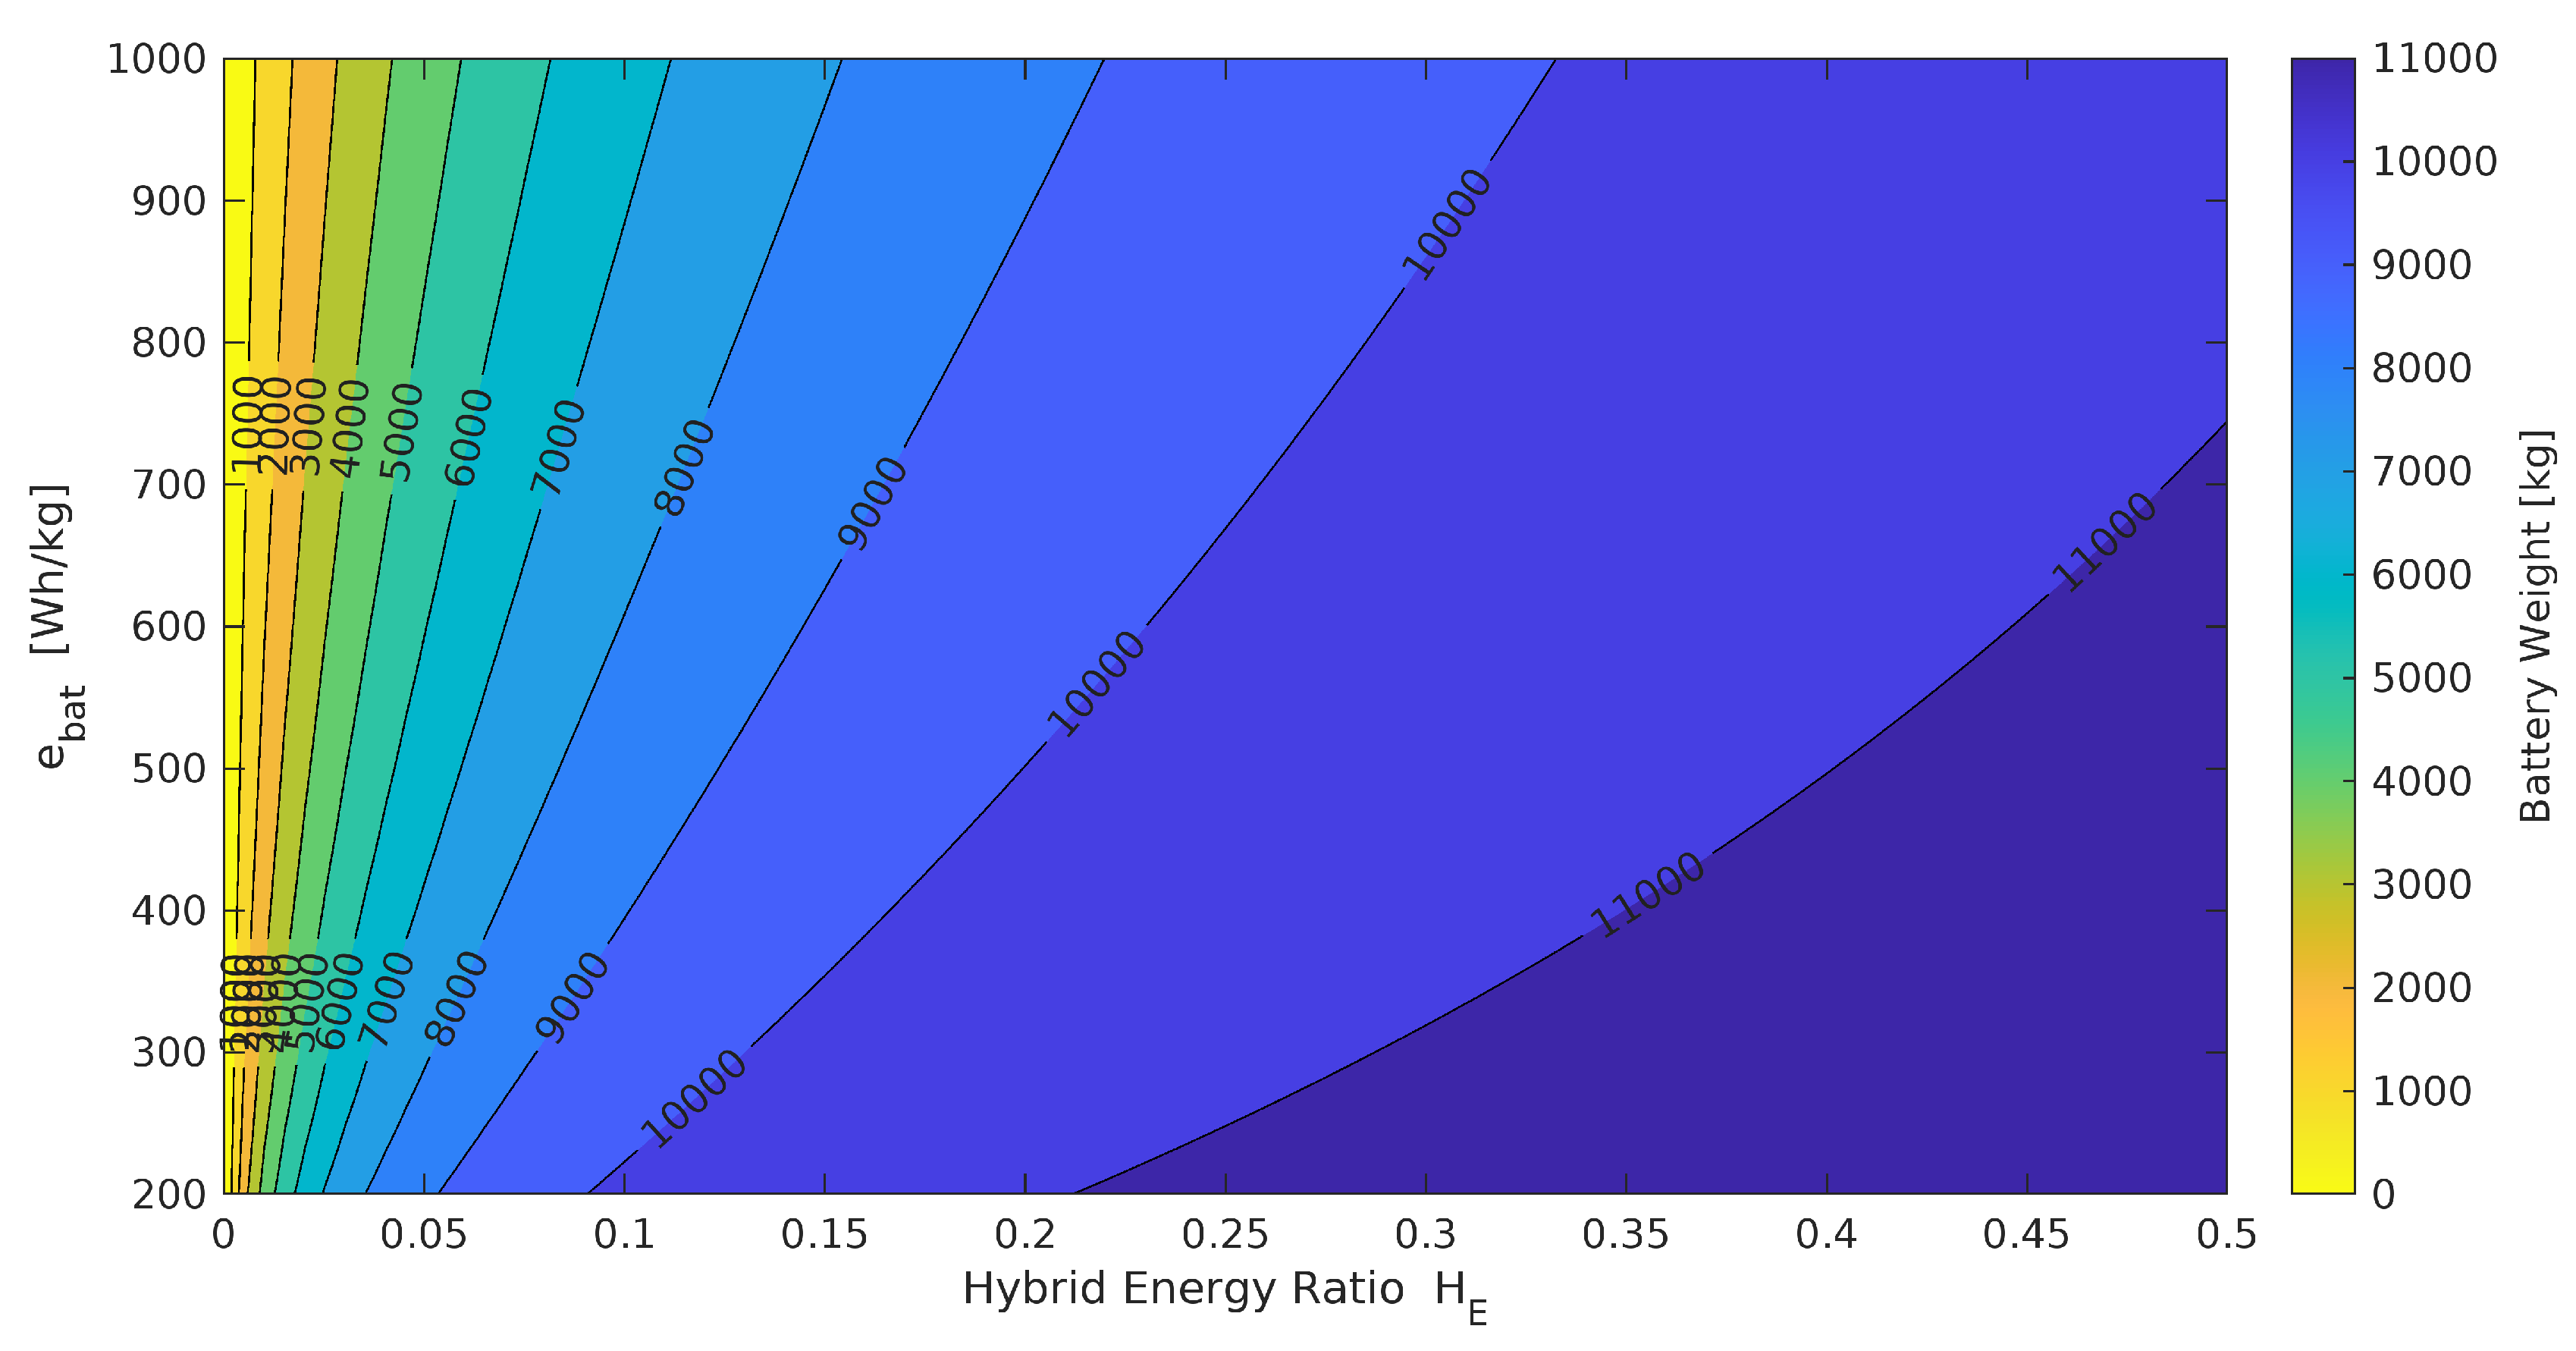
Figure 18.
Battery weight contour for the parallel architecture
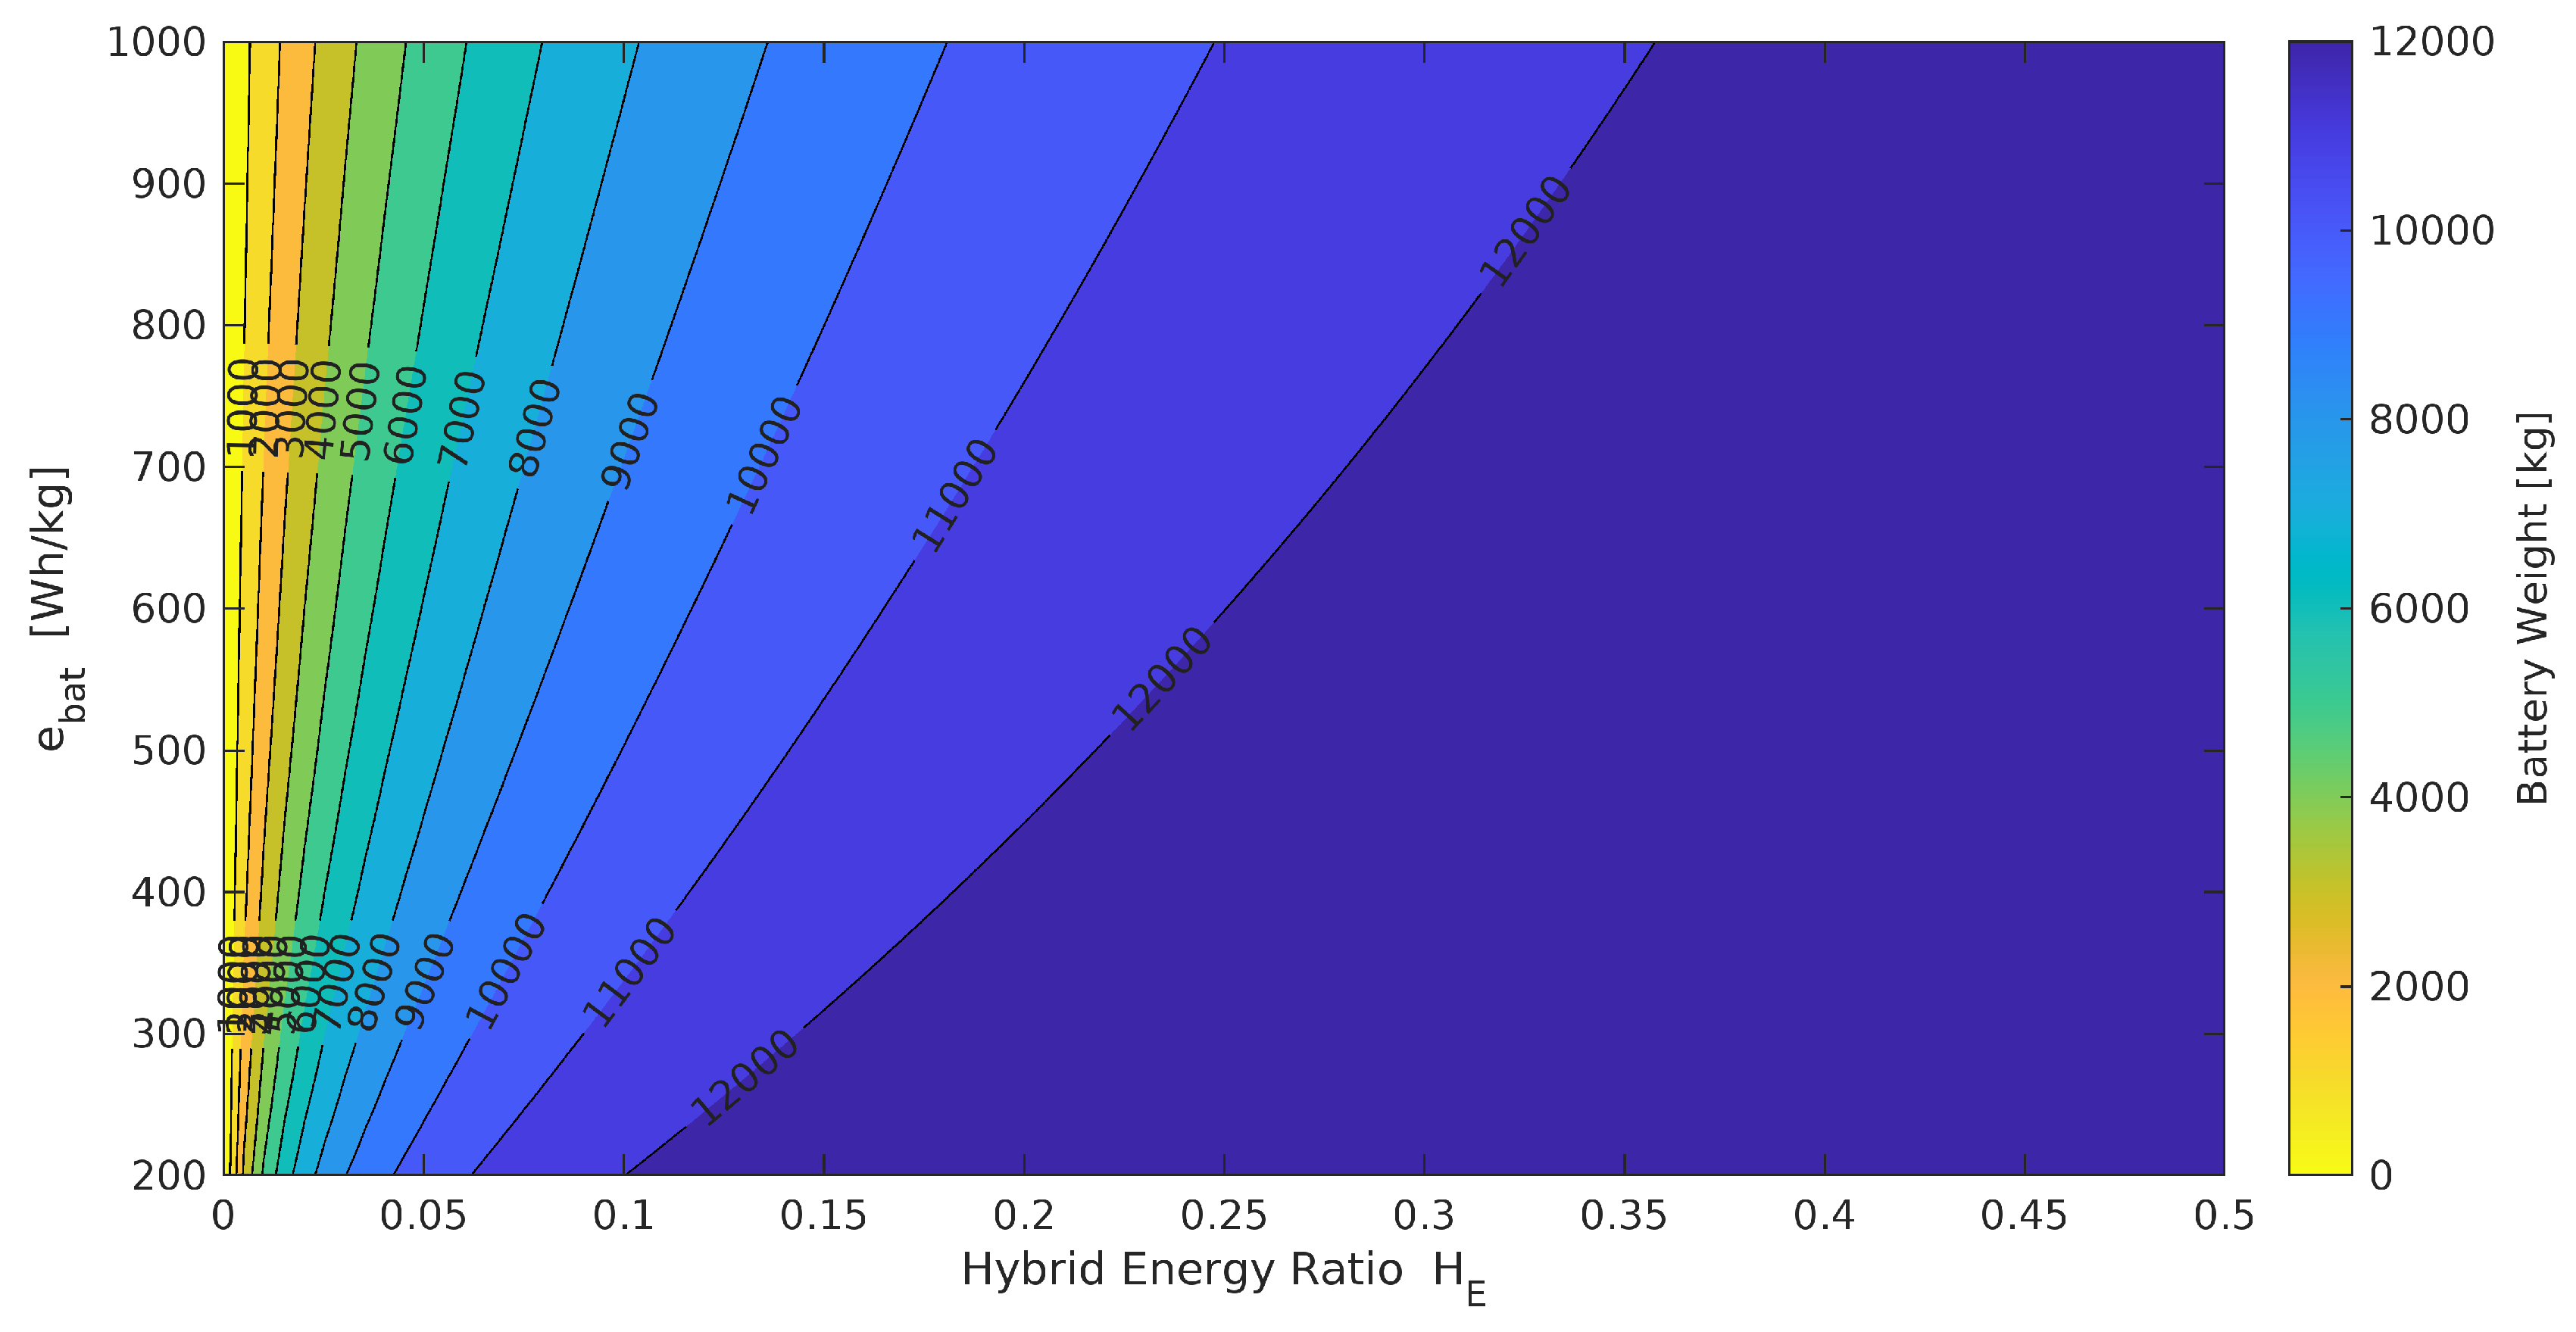
Figure 19.
Battery volume contour for the series architecture
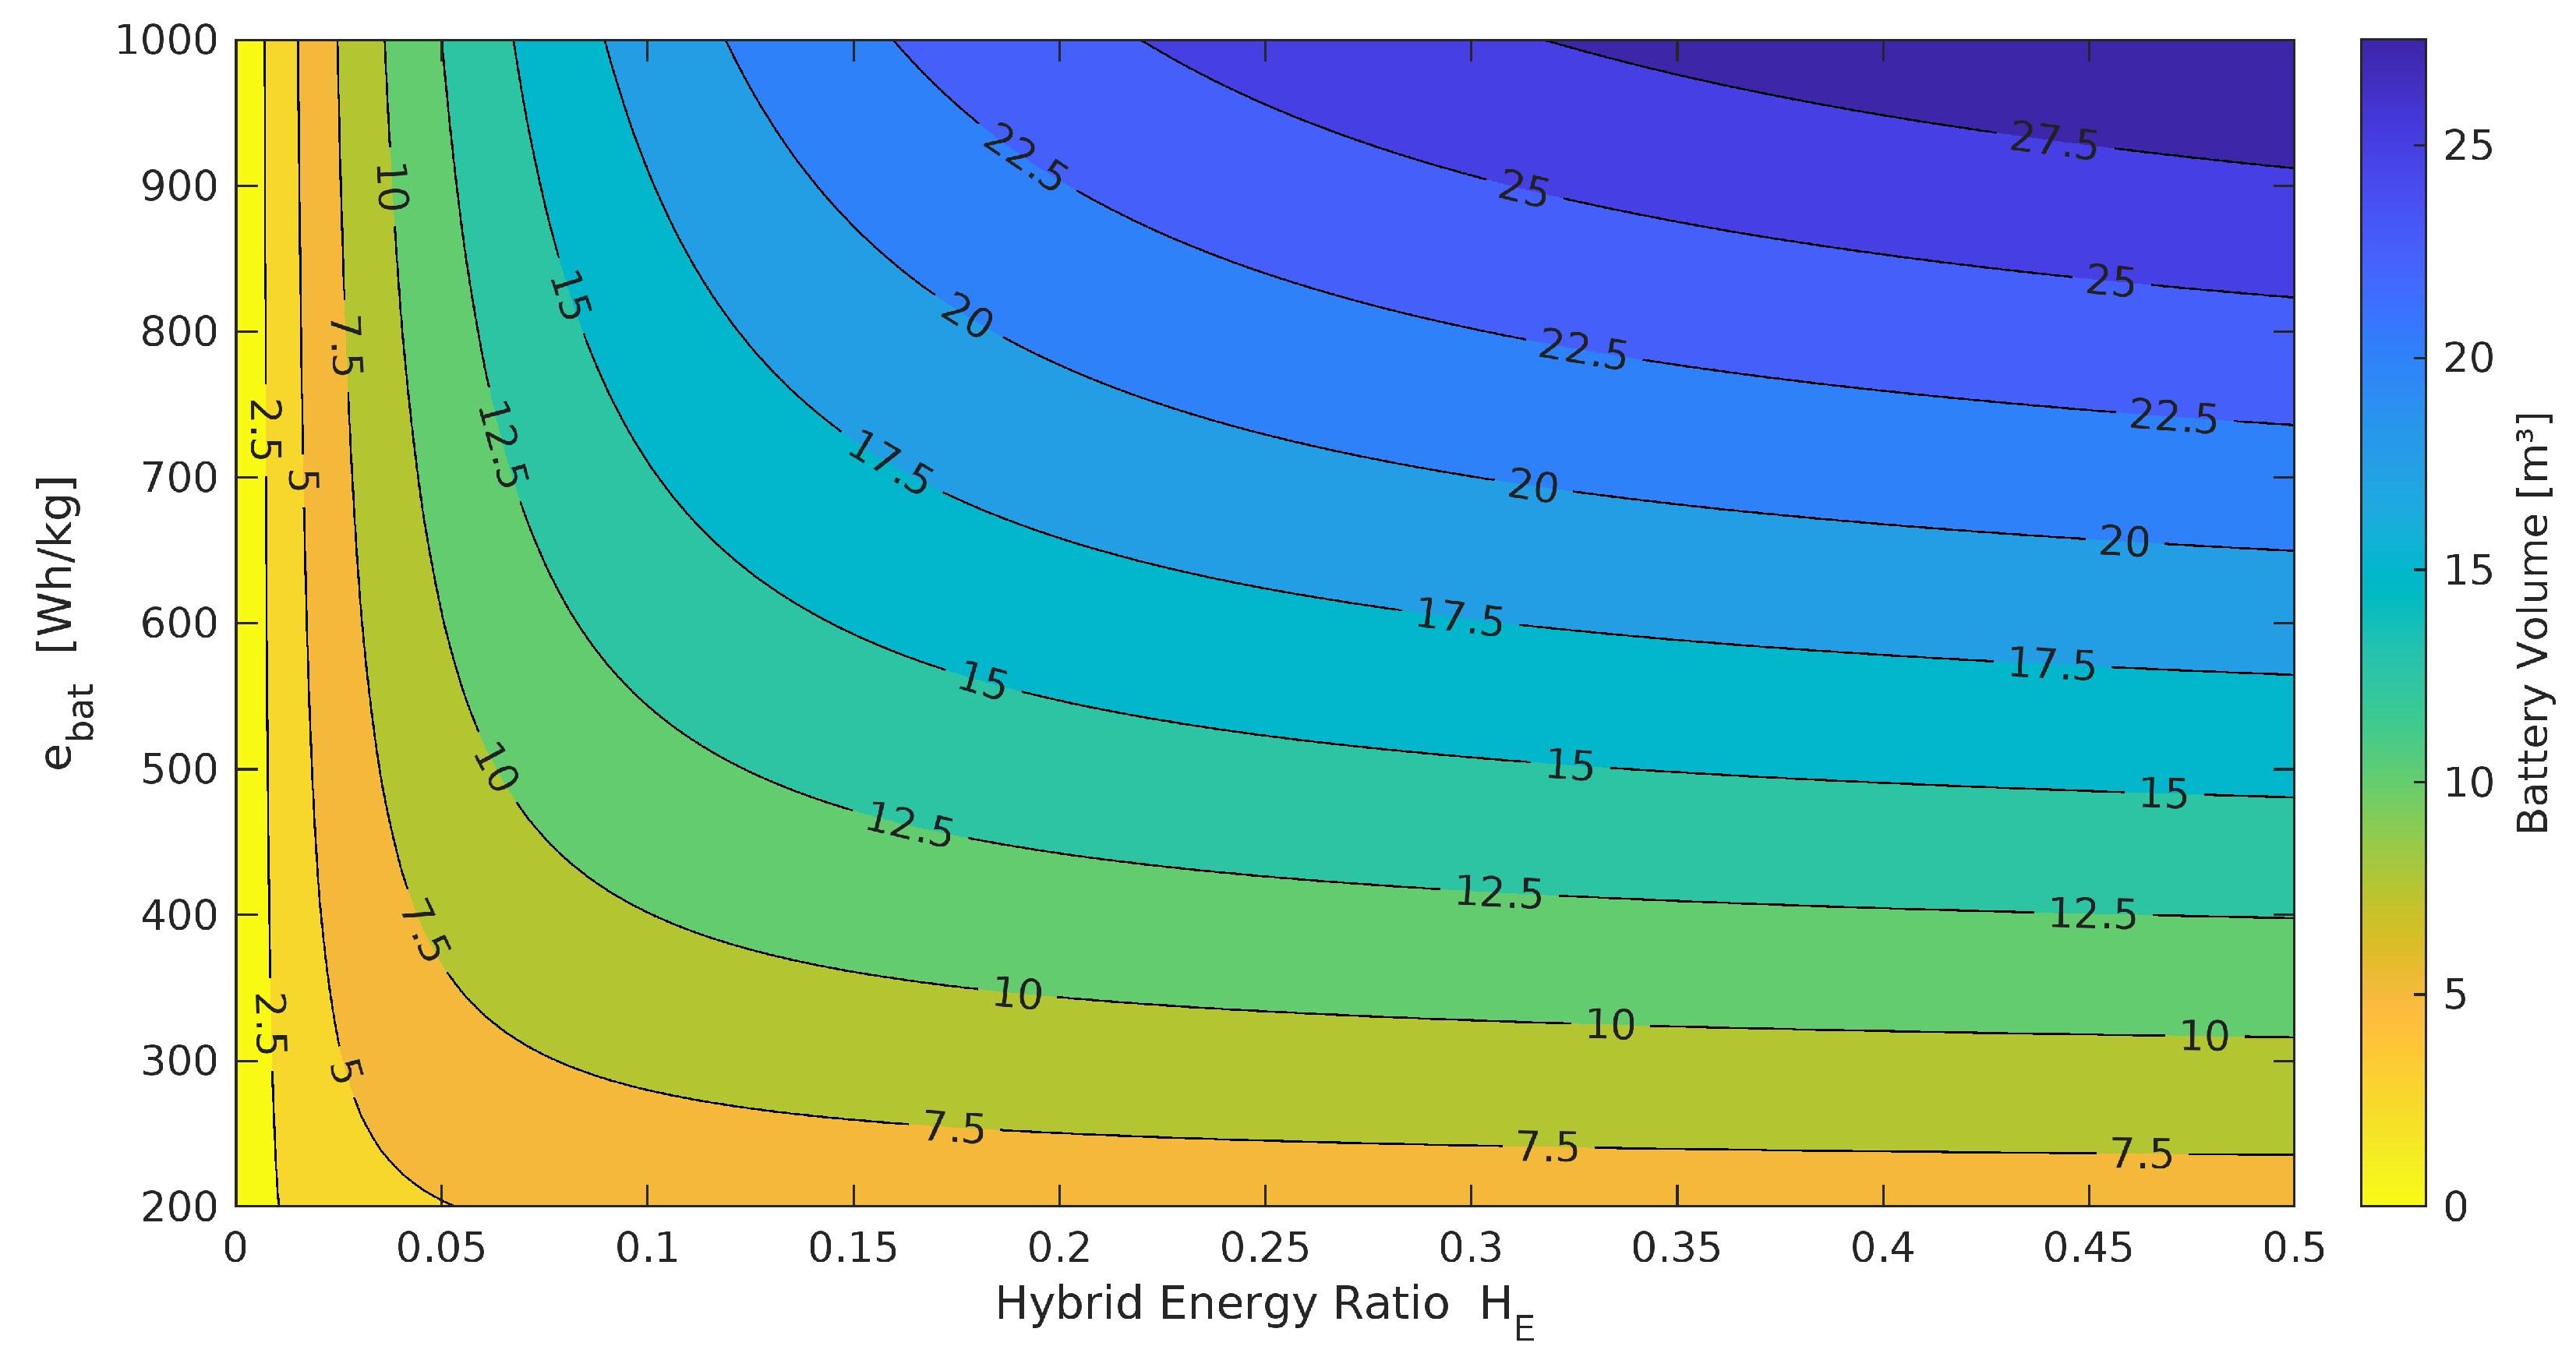
Figure 20.
Battery volume contour for the parallel architecture
From Table 13, it becomes evident that accommodating 5% hybridization is feasible, but nonetheless challenging. Unlike fuel weight which decreases and can be transferred between tanks, battery weight is constant and fixed in position. Consequently, the battery packs be distributed in a way that aircraft CG is still within controllable limits. Typical ’large-cabin’ business aircraft cabins volumes are between 42.48 m3 and 56.53 m3, with an additional 4.25 m3 to 4.96 m3 reserved for baggage storage. Some of this space will need to be utilized to store the battery packs. However given the shorter maximum range of hybrid configurations, the loss of space would not be as acutely detrimental as on a longer ranged aircraft.
4.4. Typical Mission
Based on the optimal hybridization ratio for range, energy consumption, weight, and volume, an average ’large-cabin’ class business aircraft example mission can be examined. Figure 21 and Table 14 present the fuel and battery energy consumption for a 5,556 km (3,000 nmi) flight in each of the three configurations. This range is equal to the great circle distances between New York City and London, or London and Dubai. The HEP architectures are for a 5% hybridized aircraft and 1,000 Wh/kg batteries.
The turbofan consumed approximately 7,281 kg of fuel to complete this mission, while the series HEP required 6,685 kg of fuel supplemented by 2,049 kWh of battery energy. The parallel HEP configuration demonstrates fuel consumption of 6,434 kg and 1,901 kWh of battery energy. Consequently, the series and parallel configurations offer fuel savings of 596 kg or 8.2% and 847 kg or 11.6% receptively. Overall energy savings are 5.8% and 9.4% for the corresponding architectures. Despite the relatively low level of hybridization, the fuel savings over the mission are substantial, demonstrating the drivetrain efficiency advantages of hybrid-electric propulsion architectures.
5. Conclusions
Based upon the results of the developed hybrid-electric simulation, it becomes evident that a HEP ’large-cabin’ business aircraft is viable in a 15-year timeframe provided certain technological levels are achieved. Assuming battery, motor, and power electronics technology improves at the predicted rate to reach a specific energy of 1,000 Wh/kg, the 6,297 km (3,400 nmi) range threshold can be met with substantial levels of hybridization of between 4% to 5% for either a series or parallel architecture. Additionally, the HEP architectures do not significantly impact maximum cruising speed of the aircraft, as the electric components do not suffer from performance decreases with altitude in the same way turbofans do. Finally, both series and parallel architectures demonstrate significant degrees of fuel savings, making the endeavor of hybridization worthwhile.
Nonetheless, the results demonstrate that a parallel architecture offers significant advantages in the short-term over the series, making it the preferred configuration. This is because parallel HEP schemes are generally lighter than series architectures, enabling more energy to be carried for a fixed maximum takeoff weight. The additional energy is particularly important since the weight of the battery packs do not reduce with flight, unlike with jet fuel. Consequently, at a hybridization ratio of 5%, the parallel architecture is able to fly a distance of 7,082 km (3,824 nmi) or 13% further than the 6,271 km (3,386 nmi) of the series configuration. The additional weight of the series configuration also means that greater aircraft empty weight is being flown over a fixed distance. Despite the series architecture being more efficient on the powertrain level, the additional weight means that at the mission level the series architecture is in fact less energy efficient per unit of flown distance. This is seen through the greater energy consumption of 81.5 MWh for the series configuration compared to the 78.4 MWh of the parallel configuration over a 5,556 km (3,000 nmi) mission. Finally, the parallel configuration is significantly easier to integrate given that it is largely based around extremely mature turbofan technology. The series configuration is more sensitive to technological progress in overall turbogenerator and electric motor power and specific power. Consequently, it is recommended that development future hybrid-electric ’large-cabin’ business is based upon a parallel architecture using a hybridization ratio of between 5% to 6.2%, with a battery specific energy of no less than 800 Wh/kg.
Funding
This research received no external funding.
Data Availability Statement
All relevant data are included as figures or tables in the main article. Further inquiries can be directed to the corresponding author
Acknowledgments
The author would like to thank Dr. Jason Merret, Dr. Phil Ansell and Dr. Leon Liebenberg of the University of Illinois Urbana-Champaign for their advice, suggestions and feedback.
Conflicts of Interest
The authors declare no conflicts of interest.
Abbreviations
The following abbreviations are used in this manuscript:
| AC | Alternating Current |
| BPR | Bypass Ratio |
| DC | Direct Current |
| ESAR | Energy Specific Air Range |
| FADEC | Full Authority Digital Engine Controller |
| GAMA | General Aviation Manufacturers Association |
| HEP | Hybrid-Eclectic Propulsion |
| IBAC | International Business Aviation Council |
| ICAO | International Civil Aviation Organization |
| MTOW | Maximum Takeoff Weight |
| NBAA | National Business Aviation Association |
| SP | Specific Power |
| TSFC | Thrust Specific Fuel Consumption |
| TR | Throttle Ratio |
References
- Contribution of the Global Aviation Sector to Achieving Paris Agreement Climate Objectives, United Nations Framework Convention on Climate Change - Climate Action Network (CAN) and International Coalition for Sustainable Aviation (ICSA), 2022. https://unfccc.int/sites/default/files/resource/156_CAN20ICSA20Aviation20TD20submission.pdf.
- Business Aviation Commitment on Climate Change, General Aviation Manufacturers Assosciation, 2020. https://gama.aero/wp-content/uploads/GAMA-IBAC-Joint-Position-on-Business-Aviation-Tackling-Climate-Change-1.pdf.
- National Academies of Sciences, E. ; Medicine. Commercial Aircraft Propulsion and Energy Systems Research: Reducing Global Carbon Emissions; The National Academies Press: Washington, DC, 2016. [Google Scholar] [CrossRef]
- Yeung, T.H. Optimal Battery Weight Fraction for Serial Hybrid Propulsion System in Aircraft Design. Master’s thesis, Embry-Riddle Aeronautical University, 2019.
- Vincent, R. JETNET IQ Pulse Issue # 41, 2022. https://www.jetnet.com/documents/iq-pulse/JETNET%20iQ%20Pulse%20-%20May%2012%202022.pdf.
- Shay, L.A.; McMillin, M.; Carey, B. Business & Commercial Aviation - Q2 2023, Aviation Week, 2023. https://aviationweek.com/sites/default/files/2023-05/BCA_2023_Q2.pdf.
- Spangler, T. Business Aviation Aircraft Categories, Jetcraft, 2021. https://www.jetcraft.com/jetstream/2021/11/business-aviation-aircraft-categories/, Last Accessed 2025. 1 June.
- Aircraft Guide - Private Jets, Aircraft Partner. https://www.airpartner.com/en/aircraft-guide/private-jets/, Last Accessed 2025. 1 July.
- Private Jet Comparison, Jet Advisors, 2022. https://jetadvisors.com/private-jet-comparison/, Last Accessed 2025. 1 July.
- Rendón, M.A.; Sánchez R., C. D.; Gallo M., J.; Anzai, A.H. Aircraft Hybrid-Electric Propulsion: Development trends, challenges and opportunities. Journal of Control, Automation and Electrical Systems 2021, 32, 1244–1268. [Google Scholar] [CrossRef]
- Sahoo, S.; Zhao, X.; Kyprianidis, K. A Review of Concepts, Benefits, and Challenges for Future Electrical Propulsion-Based Aircraft. Aerospace 2020, 7, 44. [Google Scholar] [CrossRef]
- Bowman, C. Establishing Electrified Aircraft Propulsion Concepts: How AATT identified viable propulsion concepts and established foundational technologies. In Proceedings of the ARMD Technical Seminar 2018, Aug 2018. [Google Scholar]
- Xie, Y.; Savvarisal, A.; Tsourdos, A.; Zhang, D.; Gu, J. Review of Hybrid Electric Powered Aircraft, its Conceptual Design and Energy Management Methodologies. Chinese Journal of Aeronautics 2021, 34, 432–450. [Google Scholar] [CrossRef]
- de Vries, R.; Hoogreef, M.F.; Vos, R. Range Equation for Hybrid-Electric Aircraft with Constant Power Split. Journal of Aircraft 2020, 57, 552–557. [Google Scholar] [CrossRef]
- Chapman, J.W. , Considering Turbofan Operability in Hybrid Electric Aircraft Propulsion System Design. In AIAA SCITECH 2023 Forum. [CrossRef]
- Gong, K. A Comparative Study on the Design and Challenges for All-Electric and Hybrid-Electric Aircraft. E3S Web of Conferences 2024, 553. [Google Scholar] [CrossRef]
- Ludowicy, J.; Rings, R.; Finger, D.; Braun, C. Sizing Studies of Light Aircraft with Serial Hybrid Propulsion Systems. 09 2018. [CrossRef]
- Bills, A.; Sripad, S.; Fredericks, W.; Singh, M.; Viswanathan, V. Performance Metrics Required of Next-Generation Batteries to Electrify Commercial Aircraft. ACS Energy Letters 2020, 5, 663–668. [Google Scholar] [CrossRef]
- Janovec, M.; Čerňan, J.; Škultéty, F.; Novák, A. Design of Batteries for a Hybrid Propulsion System of a Training Aircraft. Energies 2021, 15, 49. [Google Scholar] [CrossRef]
- Dever, T.; Duffy, K.P.; Provenza, A.; Loyselle, P.L.; Choi, B.B.; Morrison, C.R.; Lowe, A.M. Assessment of Technologies for Noncryogenic Hybrid Electric Propulsion. 2015.
- Christen, T.; Carlen, M.W. Theory of Ragone plots. Journal of Power Sources 2000, 91, 210–216. [Google Scholar] [CrossRef]
- Rheaume, J.M.; Lents, C. Energy storage for commercial hybrid electric aircraft. SAE Technical Paper Series 2016. [Google Scholar] [CrossRef]
- Misra, A. Summary of 2017 NASA Workshop on Assessment of Advanced Battery Technologies for Aerospace Applications. In Proceedings of the 2018 SciTech Forum, January 2018. [Google Scholar]
- Hepperle, M. Electric Flight - Potential and Limitations. In Proceedings of the Energy Efficient Technologies and Concepts of Operation, October 2012. [Google Scholar]
- Johnson, L. The Viability of High Specific Energy Lithium Air Batteries. In Proceedings of the Symposium on Research Opportunities in Electrochemical Energy Storage-Beyond Lithium Ion, October 2018. [Google Scholar]
- Nagata, H.; Chikusa, Y. All-Solid-State Lithium-Sulfur Battery with High Energy and Power Densities at the Cell Level. Energy Technology 2015, 4, 484–489. [Google Scholar] [CrossRef]
- Hall, C.; Pastra, C.L.; Burrell, A.; Gladin, J.; Mavris, D.N. Projecting Power Converter Specific Power Through 2050 for Aerospace Applications. In Proceedings of the 2022 IEEE Transportation Electrification Conference &, 2022, Expo (ITEC); pp. 760–765. [CrossRef]
- Hall, D.; Greitzer, E.; Dowdle, A.; Gonzalez, J.; Hoburg, W.; Lang, J.; Sabnis, J.; Spakovszky, Z.; Yutko, B.; Courtin, C.; et al. Feasibility of Electrified Propulsion for Ultra-Efficient Commercial Aircraft Final Report. Technical report, NASA, 2019.
- Zhang, X.; Bowman, C.L.; O’Connell, T.C.; Haran, K.S. Large electric machines for aircraft electric propulsion. IET Electric Power Applications 2018, 12, 767–779. [Google Scholar] [CrossRef]
- Granger, M.; Anderson, A.; Maroli, J.M.; Tallerico, T.; Scheidler, J.J. Combined Analysis of NASA’s High Efficiency Megawatt Motor and Its Converter. In Proceedings of the 2021 AIAA/IEEE Electric Aircraft Technologies Symposium (EATS); 2021; pp. 1–13. [Google Scholar] [CrossRef]
- Tallerico, T.; Scheidler, J.J.; Lee, D.; Haran, K.S. , Electromagnetic Redesign of NASA’s High Efficiency Megawatt Motor. In AIAA Propulsion and Energy 2020 Forum. [CrossRef]
- 1 Megawatt (MW) Power Gnerator, Honeywell, 2025. https://prod-edam.honeywell.com/content/dam/honeywell-edam/aero/en-us/products/power-and-propulsion/electric-power/honeywell-1-megawatt-mw-turbogenerator/documents/hon-aero-n61-2229-000-000-1mw-generator-brochure-en.pdf, Last Accessed 2025. 1 June.
- Spakovszky, Z.S.; Chen, Y.; Greitzer, E.M.; Cordero, Z.C.; Lang, J.H.; Kirtley, J.L.; Perreault, D.J.; Andersen, H.N.; Qasim, M.M.; Cuadrado, D.G.; et al. , Technology Demonstration of a Megawatt-Class Integrated Motor Drive for Aircraft Propulsion. In AIAA AVIATION 2023 Forum. [CrossRef]
- Jansen, R.; Bowman, C.; Jankovsky, A.; Dyson, R.; Felder, J. , Overview of NASA Electrified Aircraft Propulsion (EAP) Research for Large Subsonic Transports. In 53rd AIAA/SAE/ASEE Joint Propulsion Conference; [https://arc.aiaa.org/doi/pdf/10.2514/6.2017-4701]. [CrossRef]
- Al Khoury, J.; Bou Nader, W. Design and simulation of turbogenerators for series hybrid electric vehicles. Energy Conversion and Management 2021, 236, 114078. [Google Scholar] [CrossRef]
- McCormick, B.W. Aerodynamics, Aeronautics, and Flight Mechanics, 2 ed.; Wiley, 1995.
- Raymer, D.P. Aircraft design: A Conceptual Approach, 2 ed.; The American Institute of Aeronautics and Astronautics, Inc, 1992.
- Gulfstream G550 (GV-SP) Sample Analysis, 2022. https://www.lissys.uk/samp2/index.html, Last Accessed. 15 May.
- Gudmundsson, S. General Aviation Aircraft Design: Applied Methods and Procedures, 2 ed.; Elsevier, 2022.
- Wroblewski, G.E.; Ansell, P.J. Mission Analysis and Emissions for Conventional and Hybrid-Electric Commercial Transport Aircraft. Journal of Aircraft 2019, 56, 1200–1213. [Google Scholar] [CrossRef]
- Pornet, C.; Gologan, C.; Vratny, P.C.; Seitz, A.; Schmitz, O.; Isikveren, A.T.; Hornung, M. Methodology for sizing and performance assessment of Hybrid Energy Aircraft. Journal of Aircraft 2015, 52, 341–352. [Google Scholar] [CrossRef]
- Jackson, P.; Peacock, L.; Bushell, S.; Willis, D.; Winchester, J. Jane’s All the World’s Aircraft: Development and Production; 2018-2019, IHS Markit, 2018.
- Wroblewski, G.E.; Ansell, P.J. Mission analysis and emissions for conventional and hybrid-electric regional jet aircraft. 2018 AIAA/IEEE Electric Aircraft Technologies Symposium. [CrossRef]
Figure 1.
Typical NBAA cruise mission profile for a long-range business jet. Descriptions of the phases are provided below in Table 2.
Figure 1.
Typical NBAA cruise mission profile for a long-range business jet. Descriptions of the phases are provided below in Table 2.
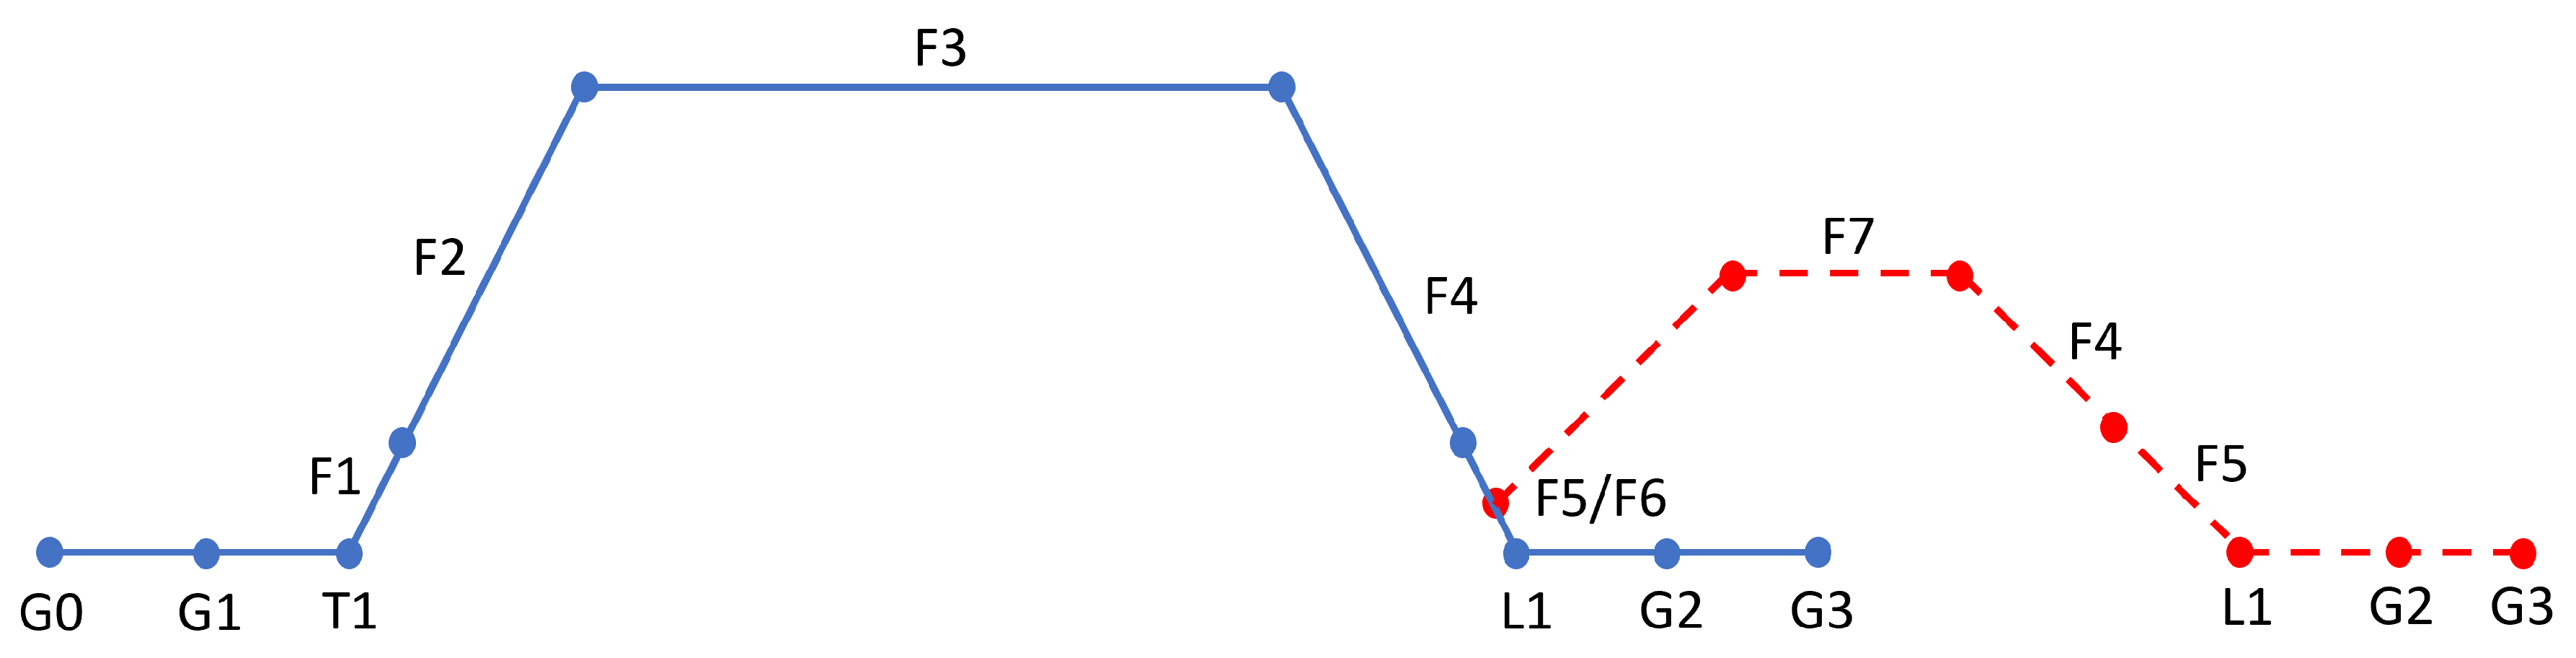
Figure 2.
Distances from US cities and maximum ranges of the Legacy 600 and Falcon 6X. The ranges are the NBAA maximum aircraft range in no-wind conditions. Maximum aircraft range typically includes four passengers. (a) When originating from from Teterboro near New York City. (b) Originating from Van Nuys in the greater Los Angeles area.
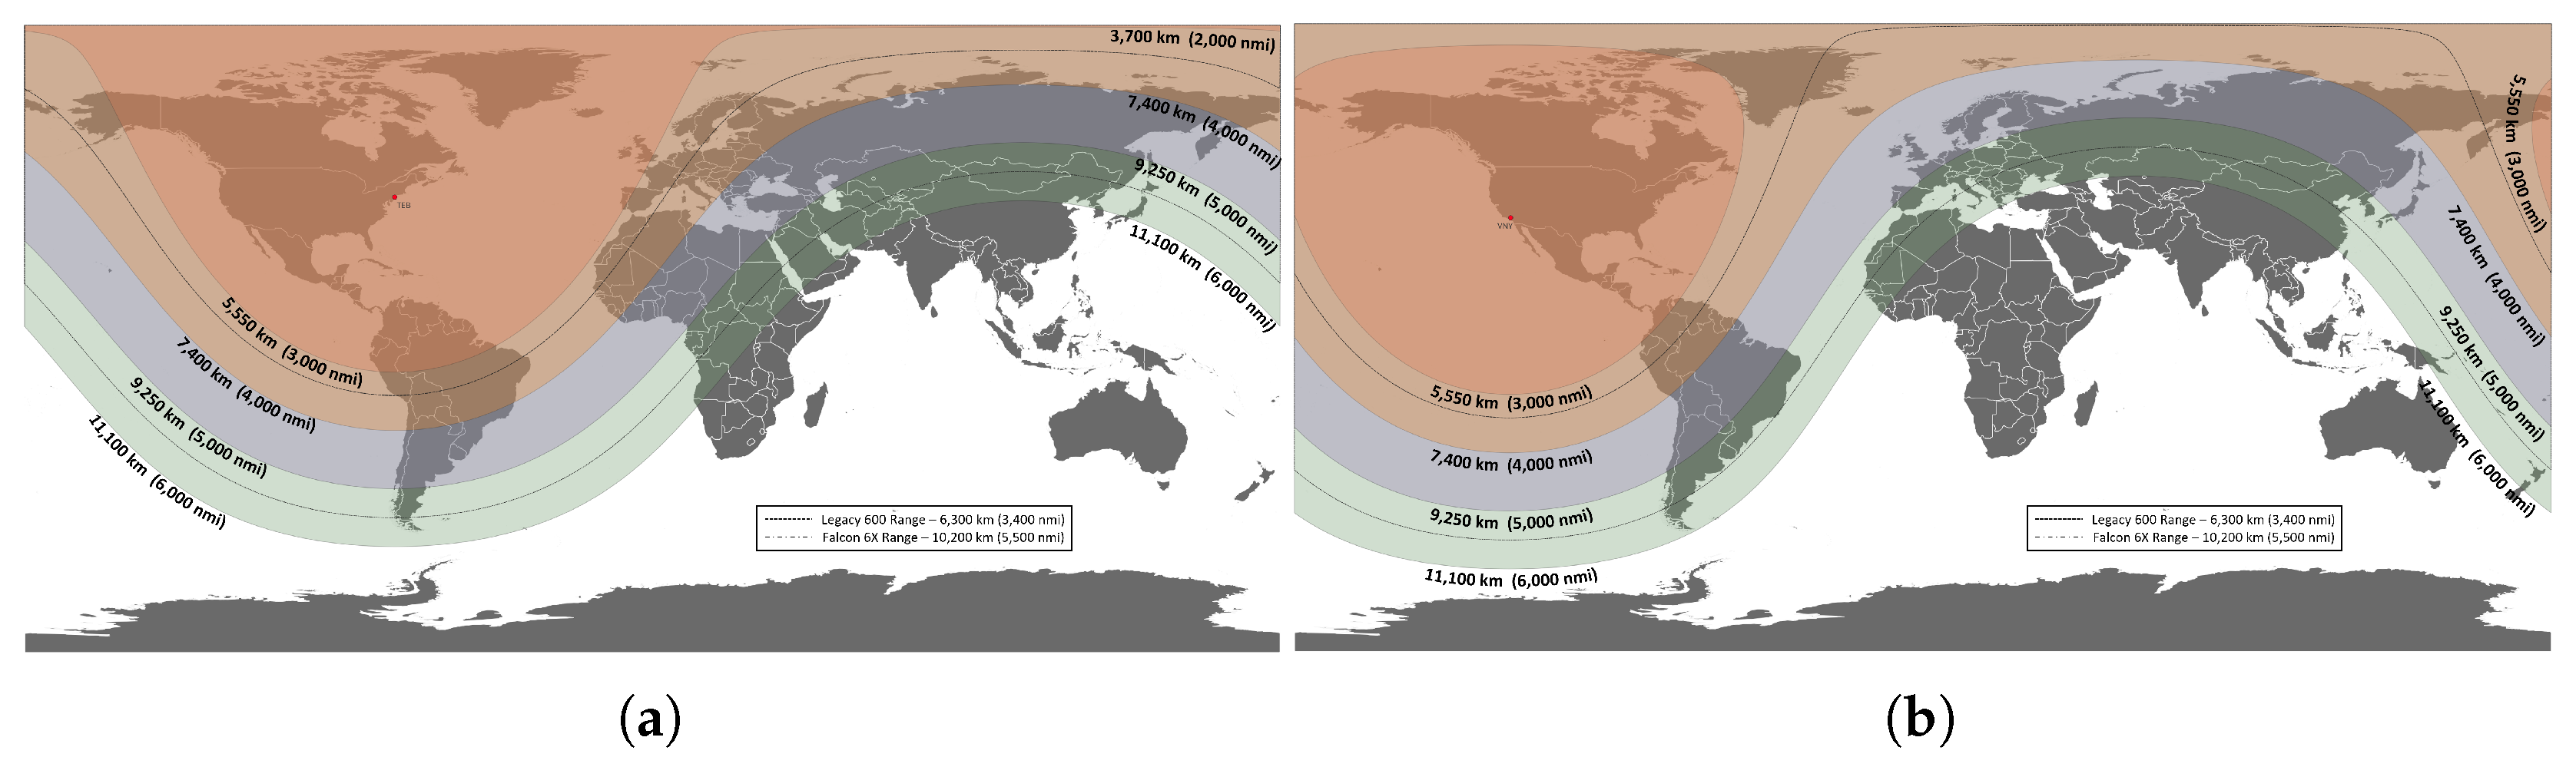
Figure 3.
Breakdown of electrified propulsion systems
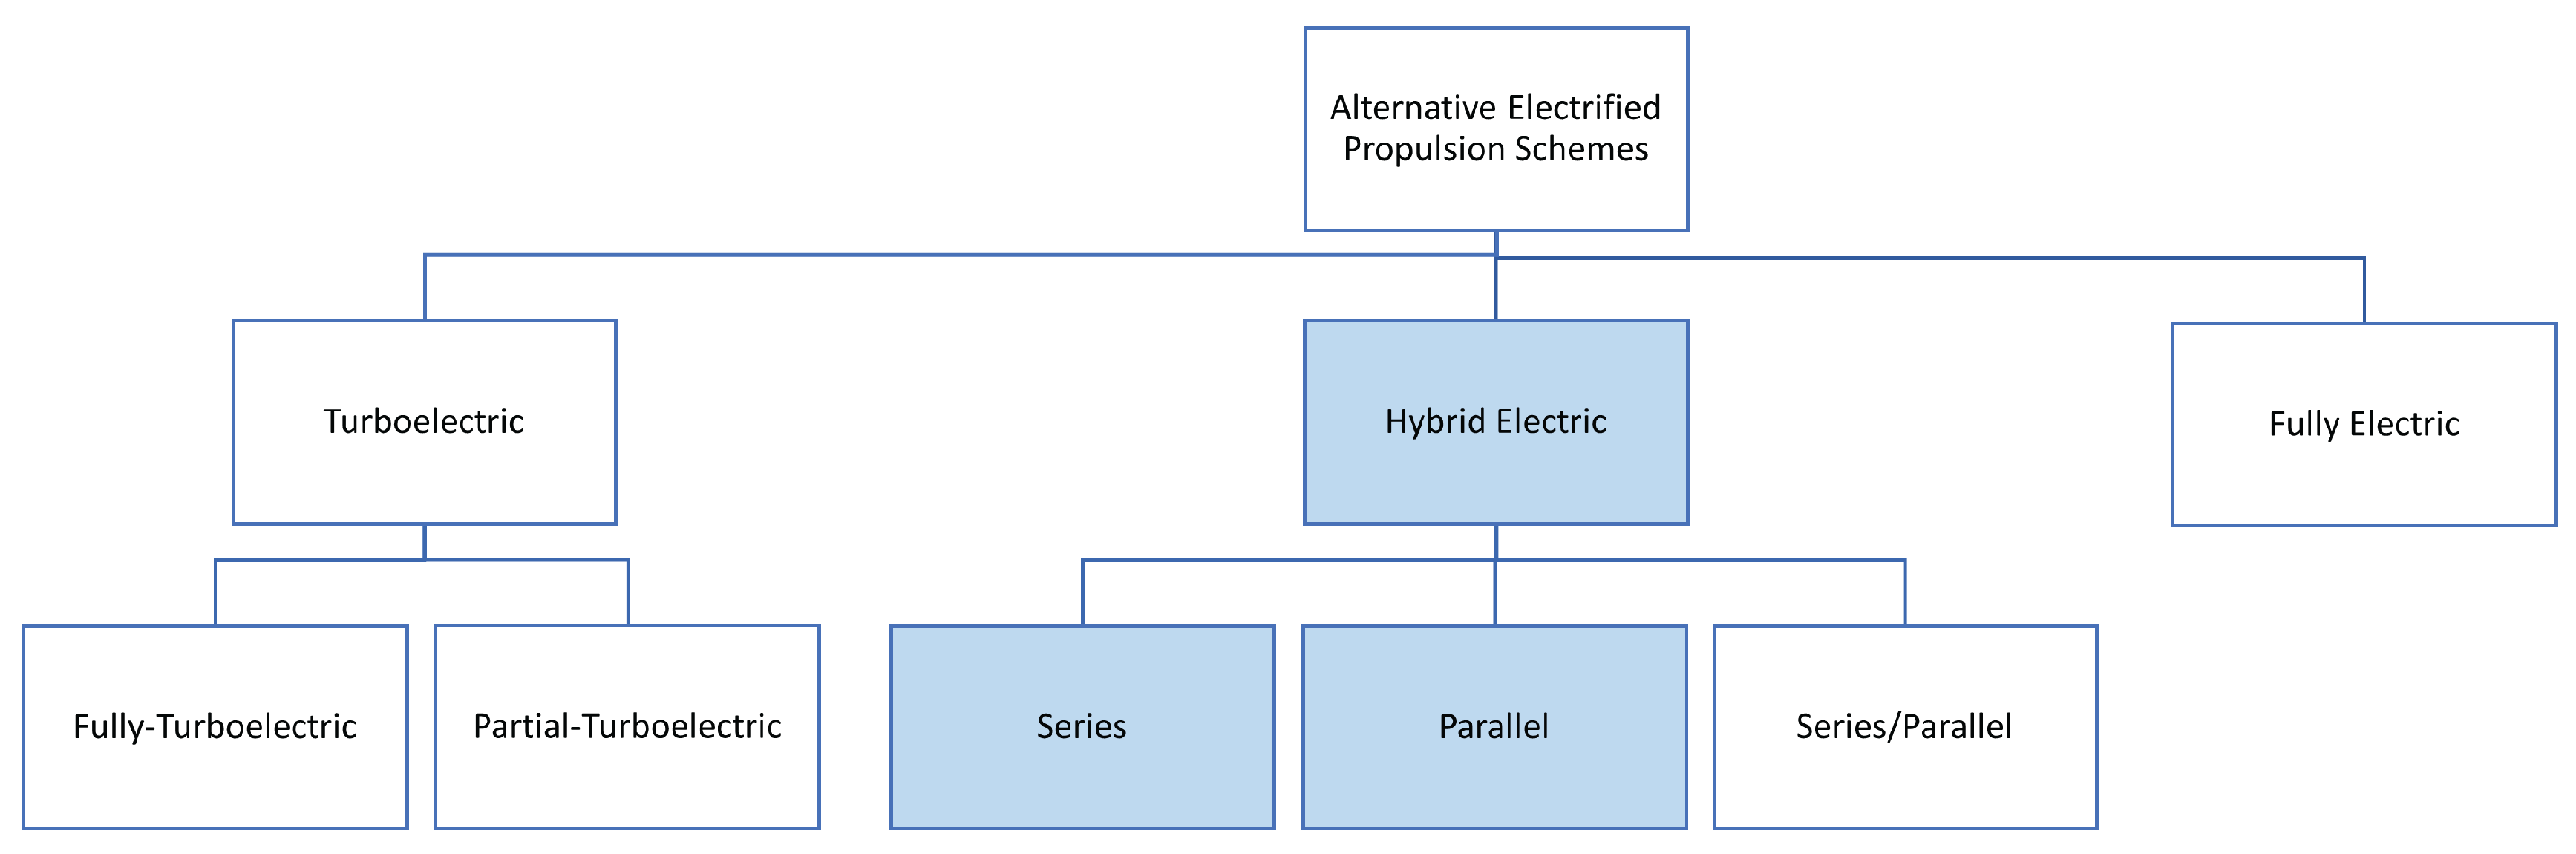
Figure 4.
Simplified diagram of series hybrid-electric architecture
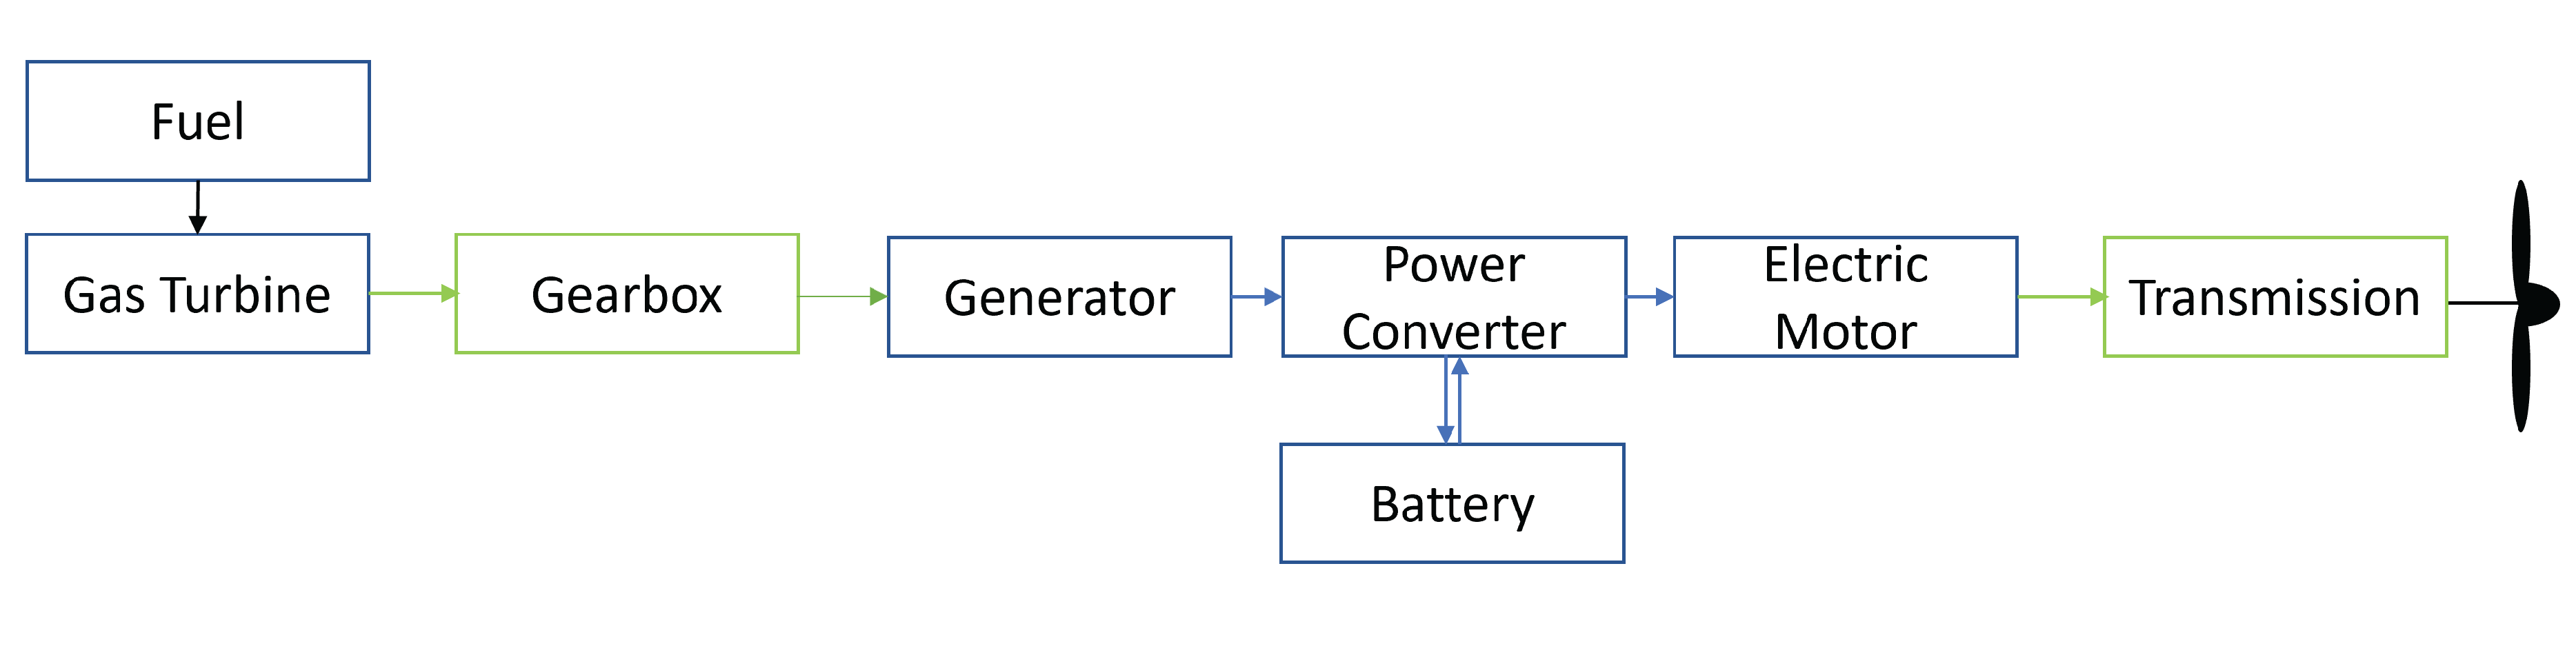
Figure 5.
Simplified diagram of parallel hybrid-electric architecture
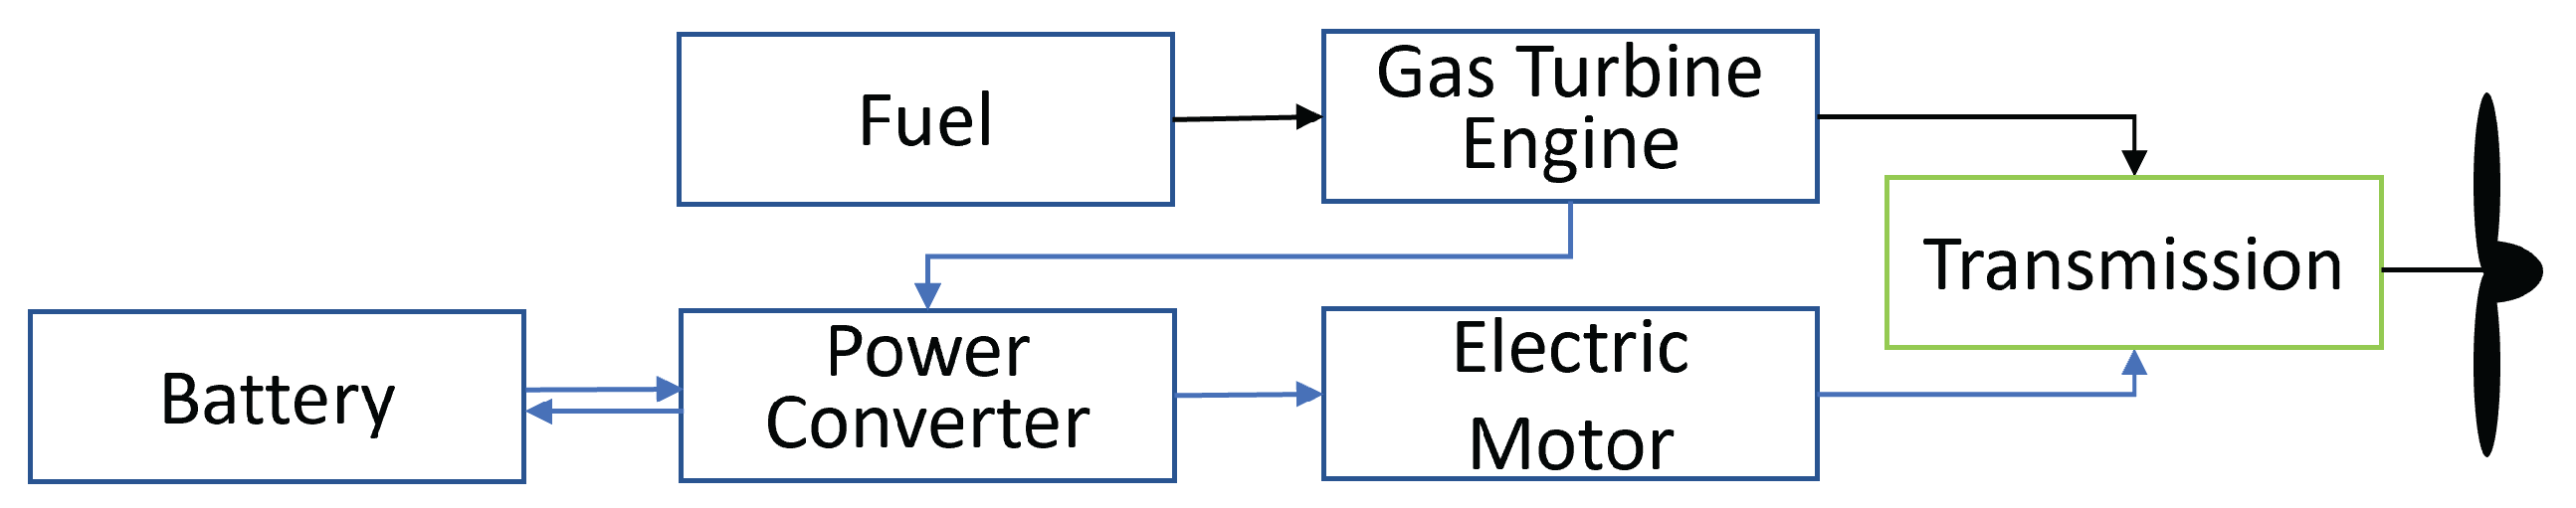
Figure 6.
Simplified diagram of series/parallel hybrid-electric architecture
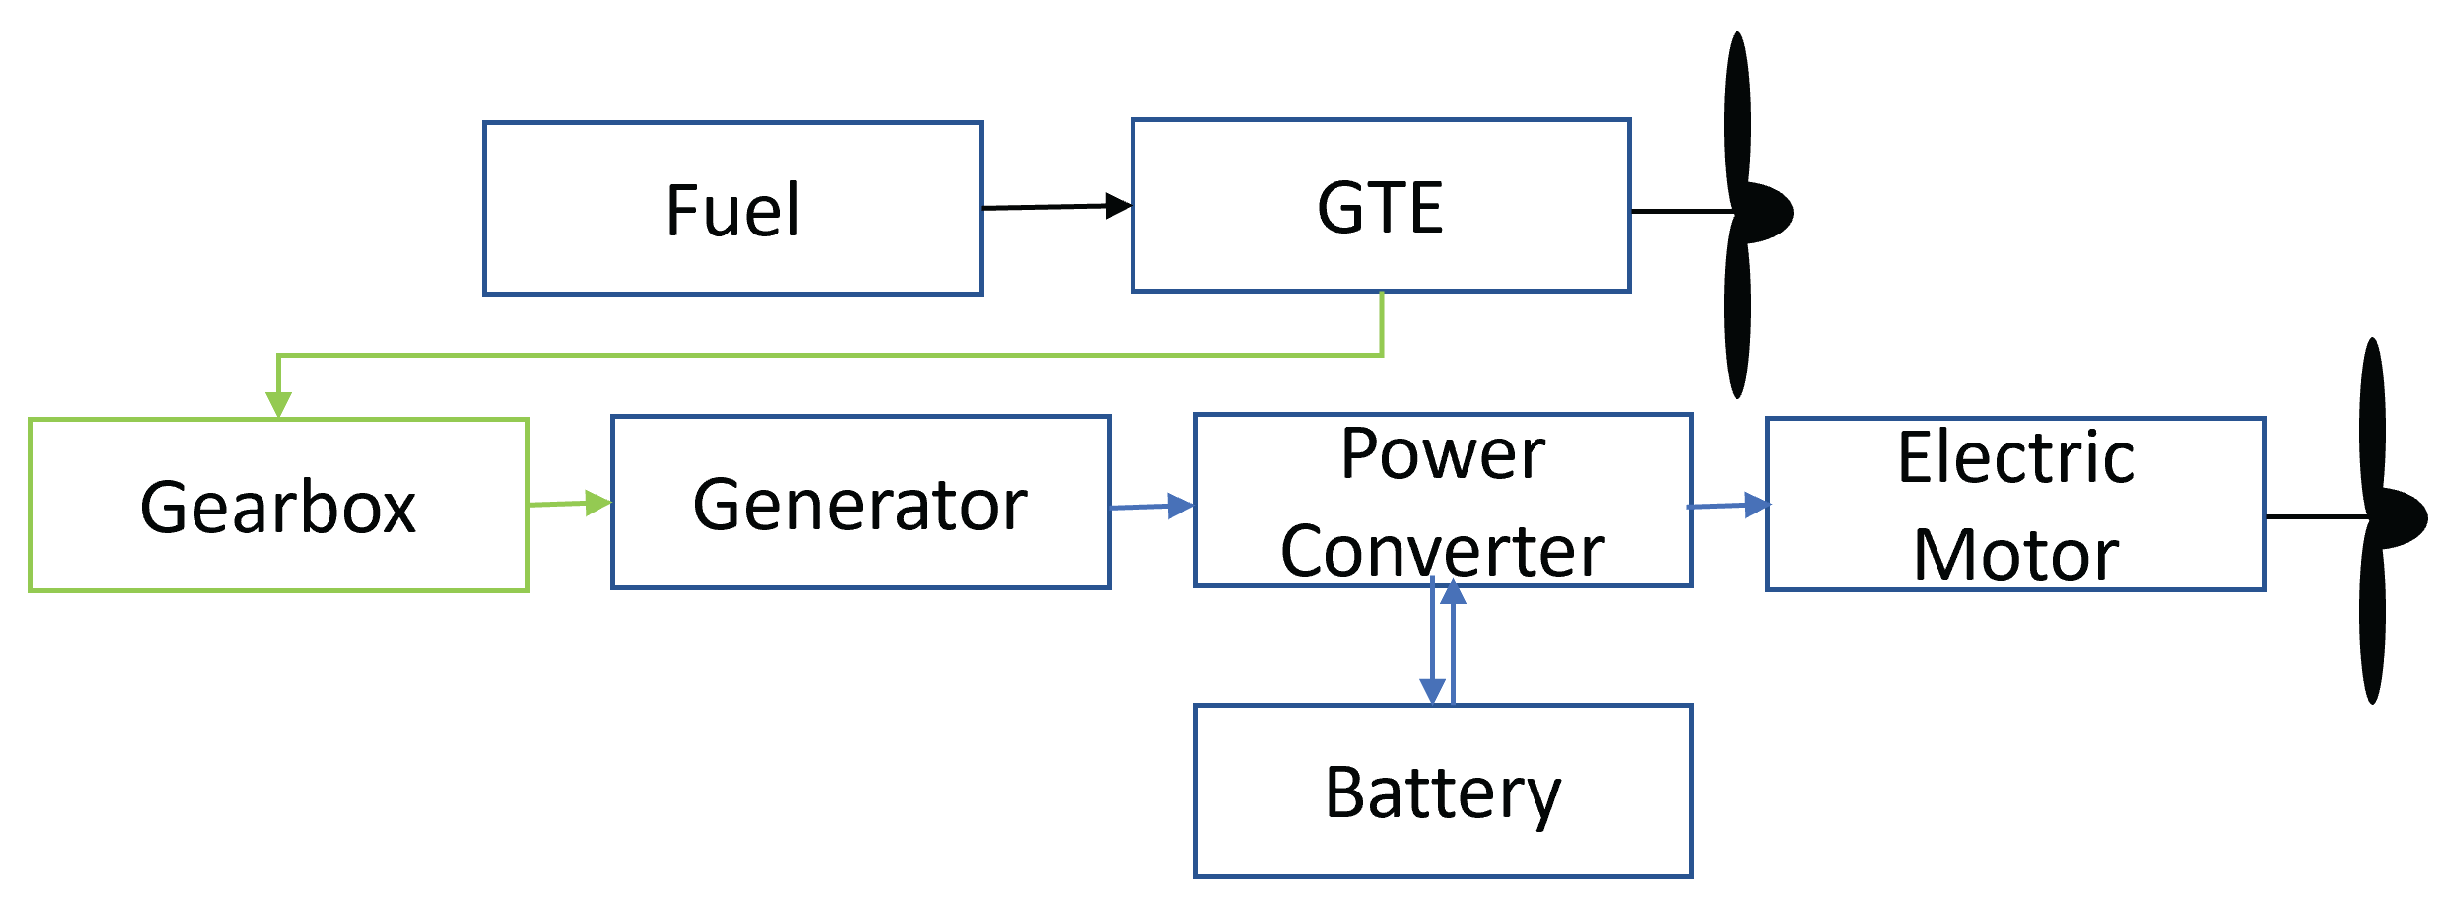
Figure 7.
Drag in kN plotted versus Mach for the aerodynamic model of a ’large-cabin’ business aircraft
Figure 7.
Drag in kN plotted versus Mach for the aerodynamic model of a ’large-cabin’ business aircraft
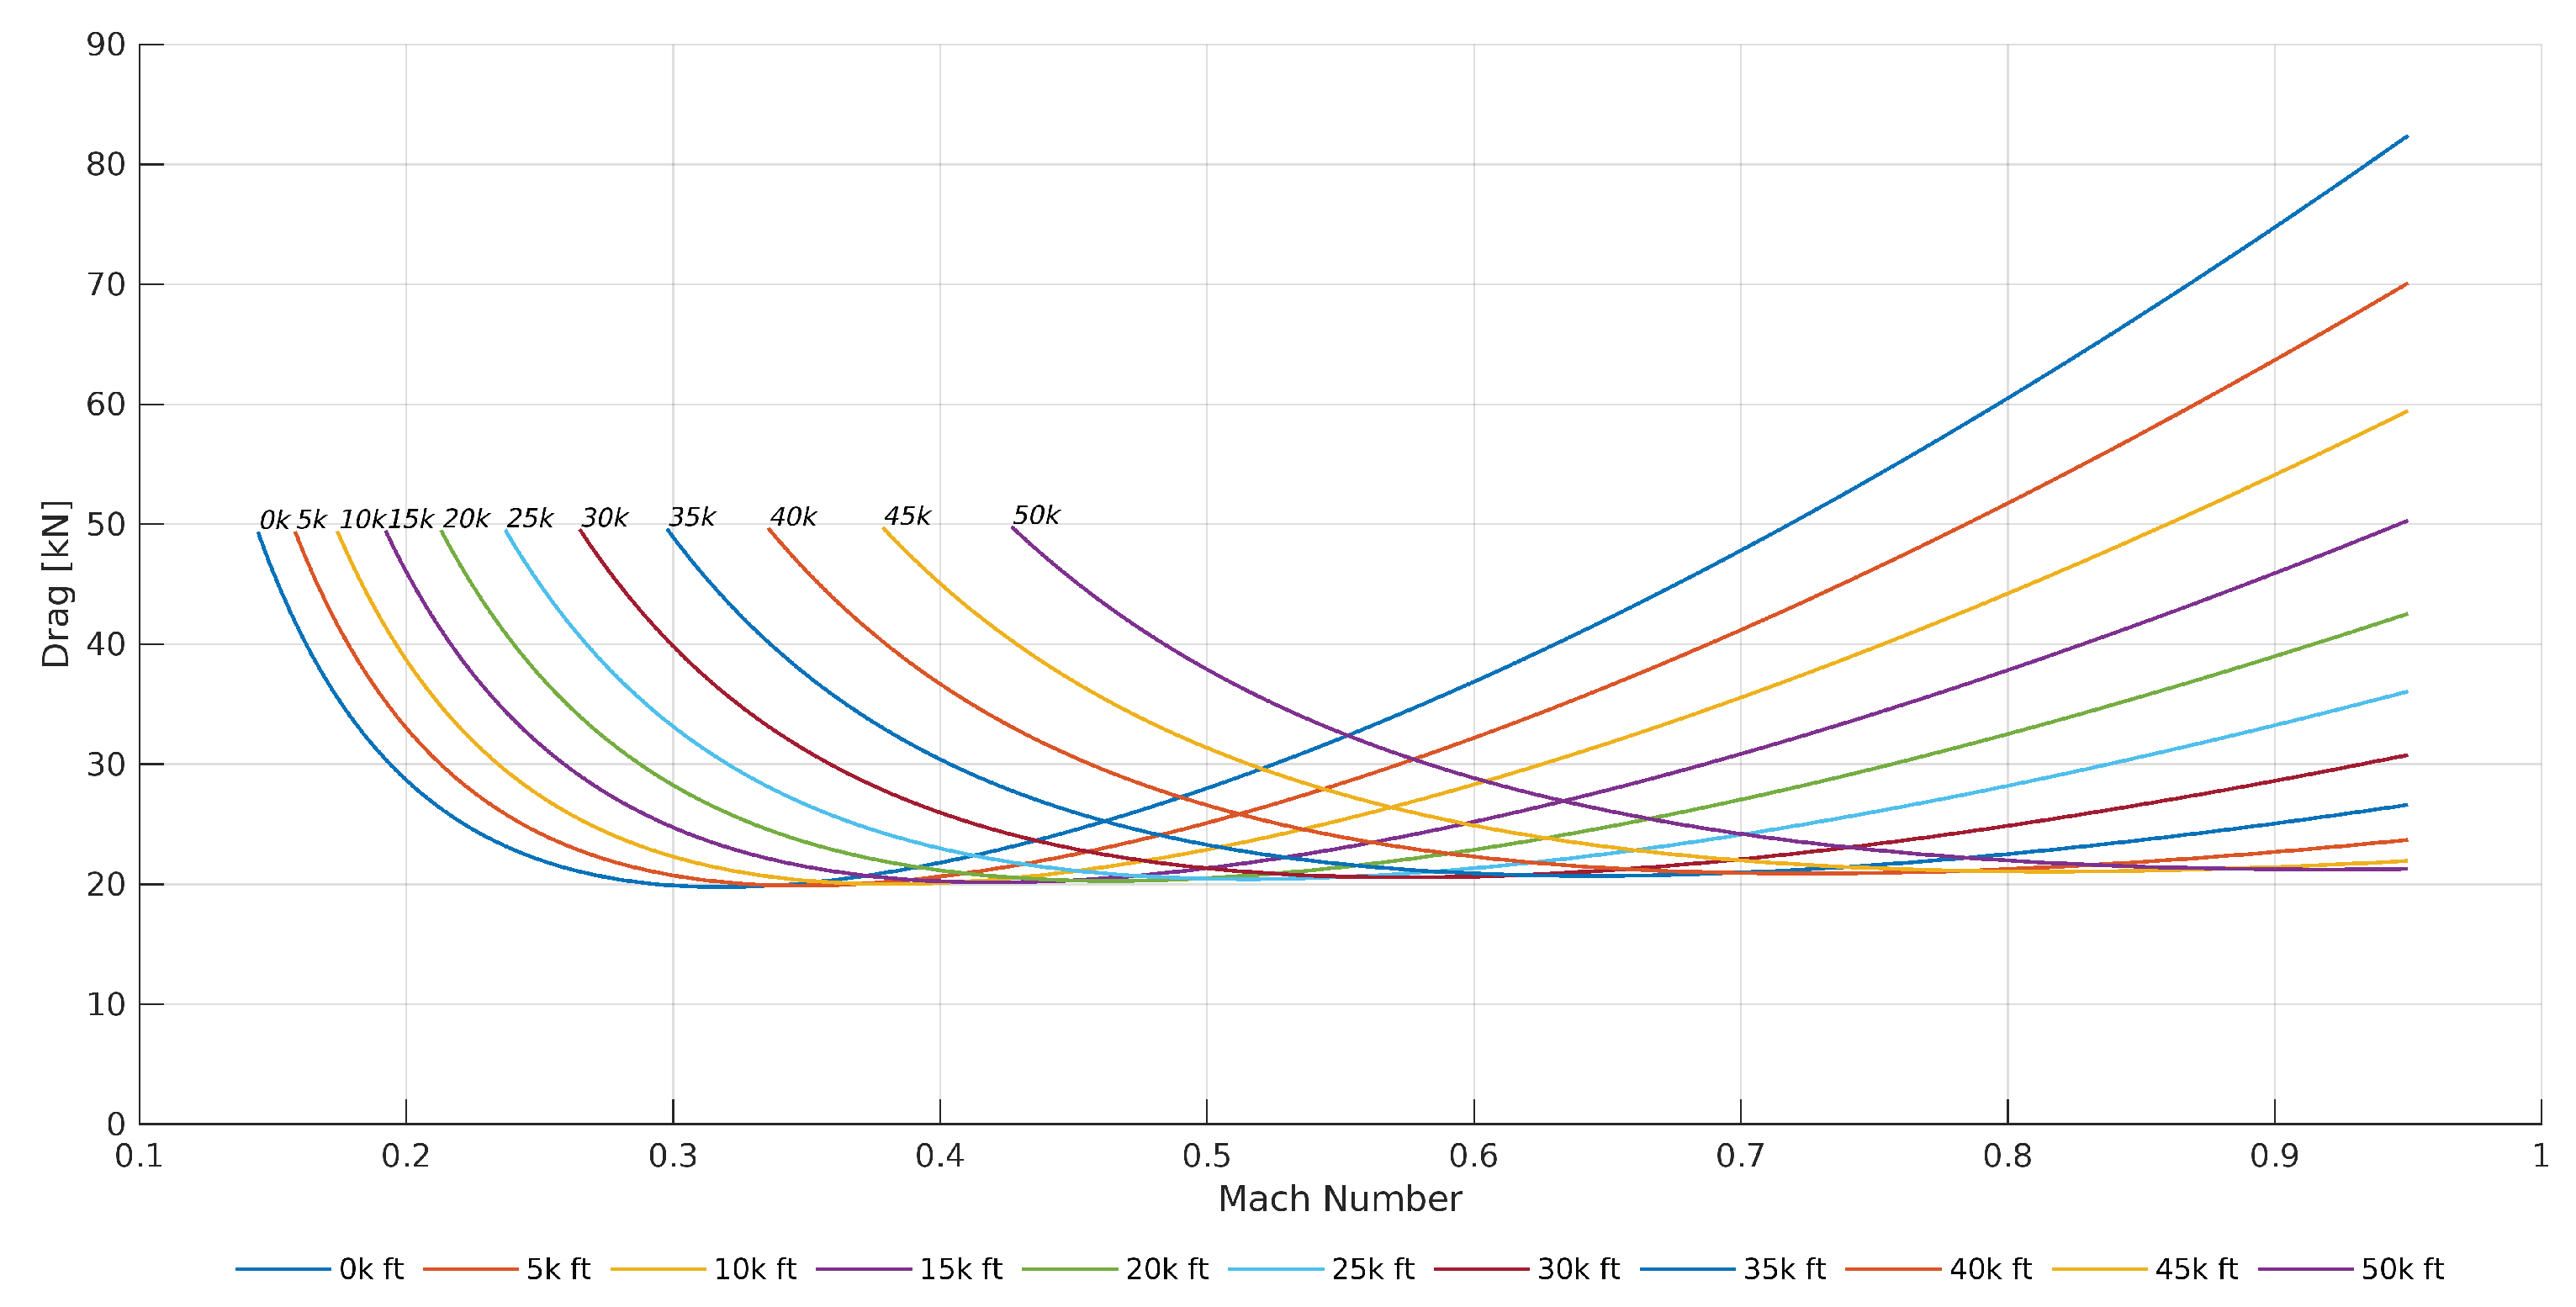
Figure 8.
Lift-to-drag ratio versus Mach for the aerodynamic model of a ’large-cabin’ business aircraft. At 45,000 ft and Mach 0.85, the lift-to-drag ratio is 17.92.
Figure 8.
Lift-to-drag ratio versus Mach for the aerodynamic model of a ’large-cabin’ business aircraft. At 45,000 ft and Mach 0.85, the lift-to-drag ratio is 17.92.
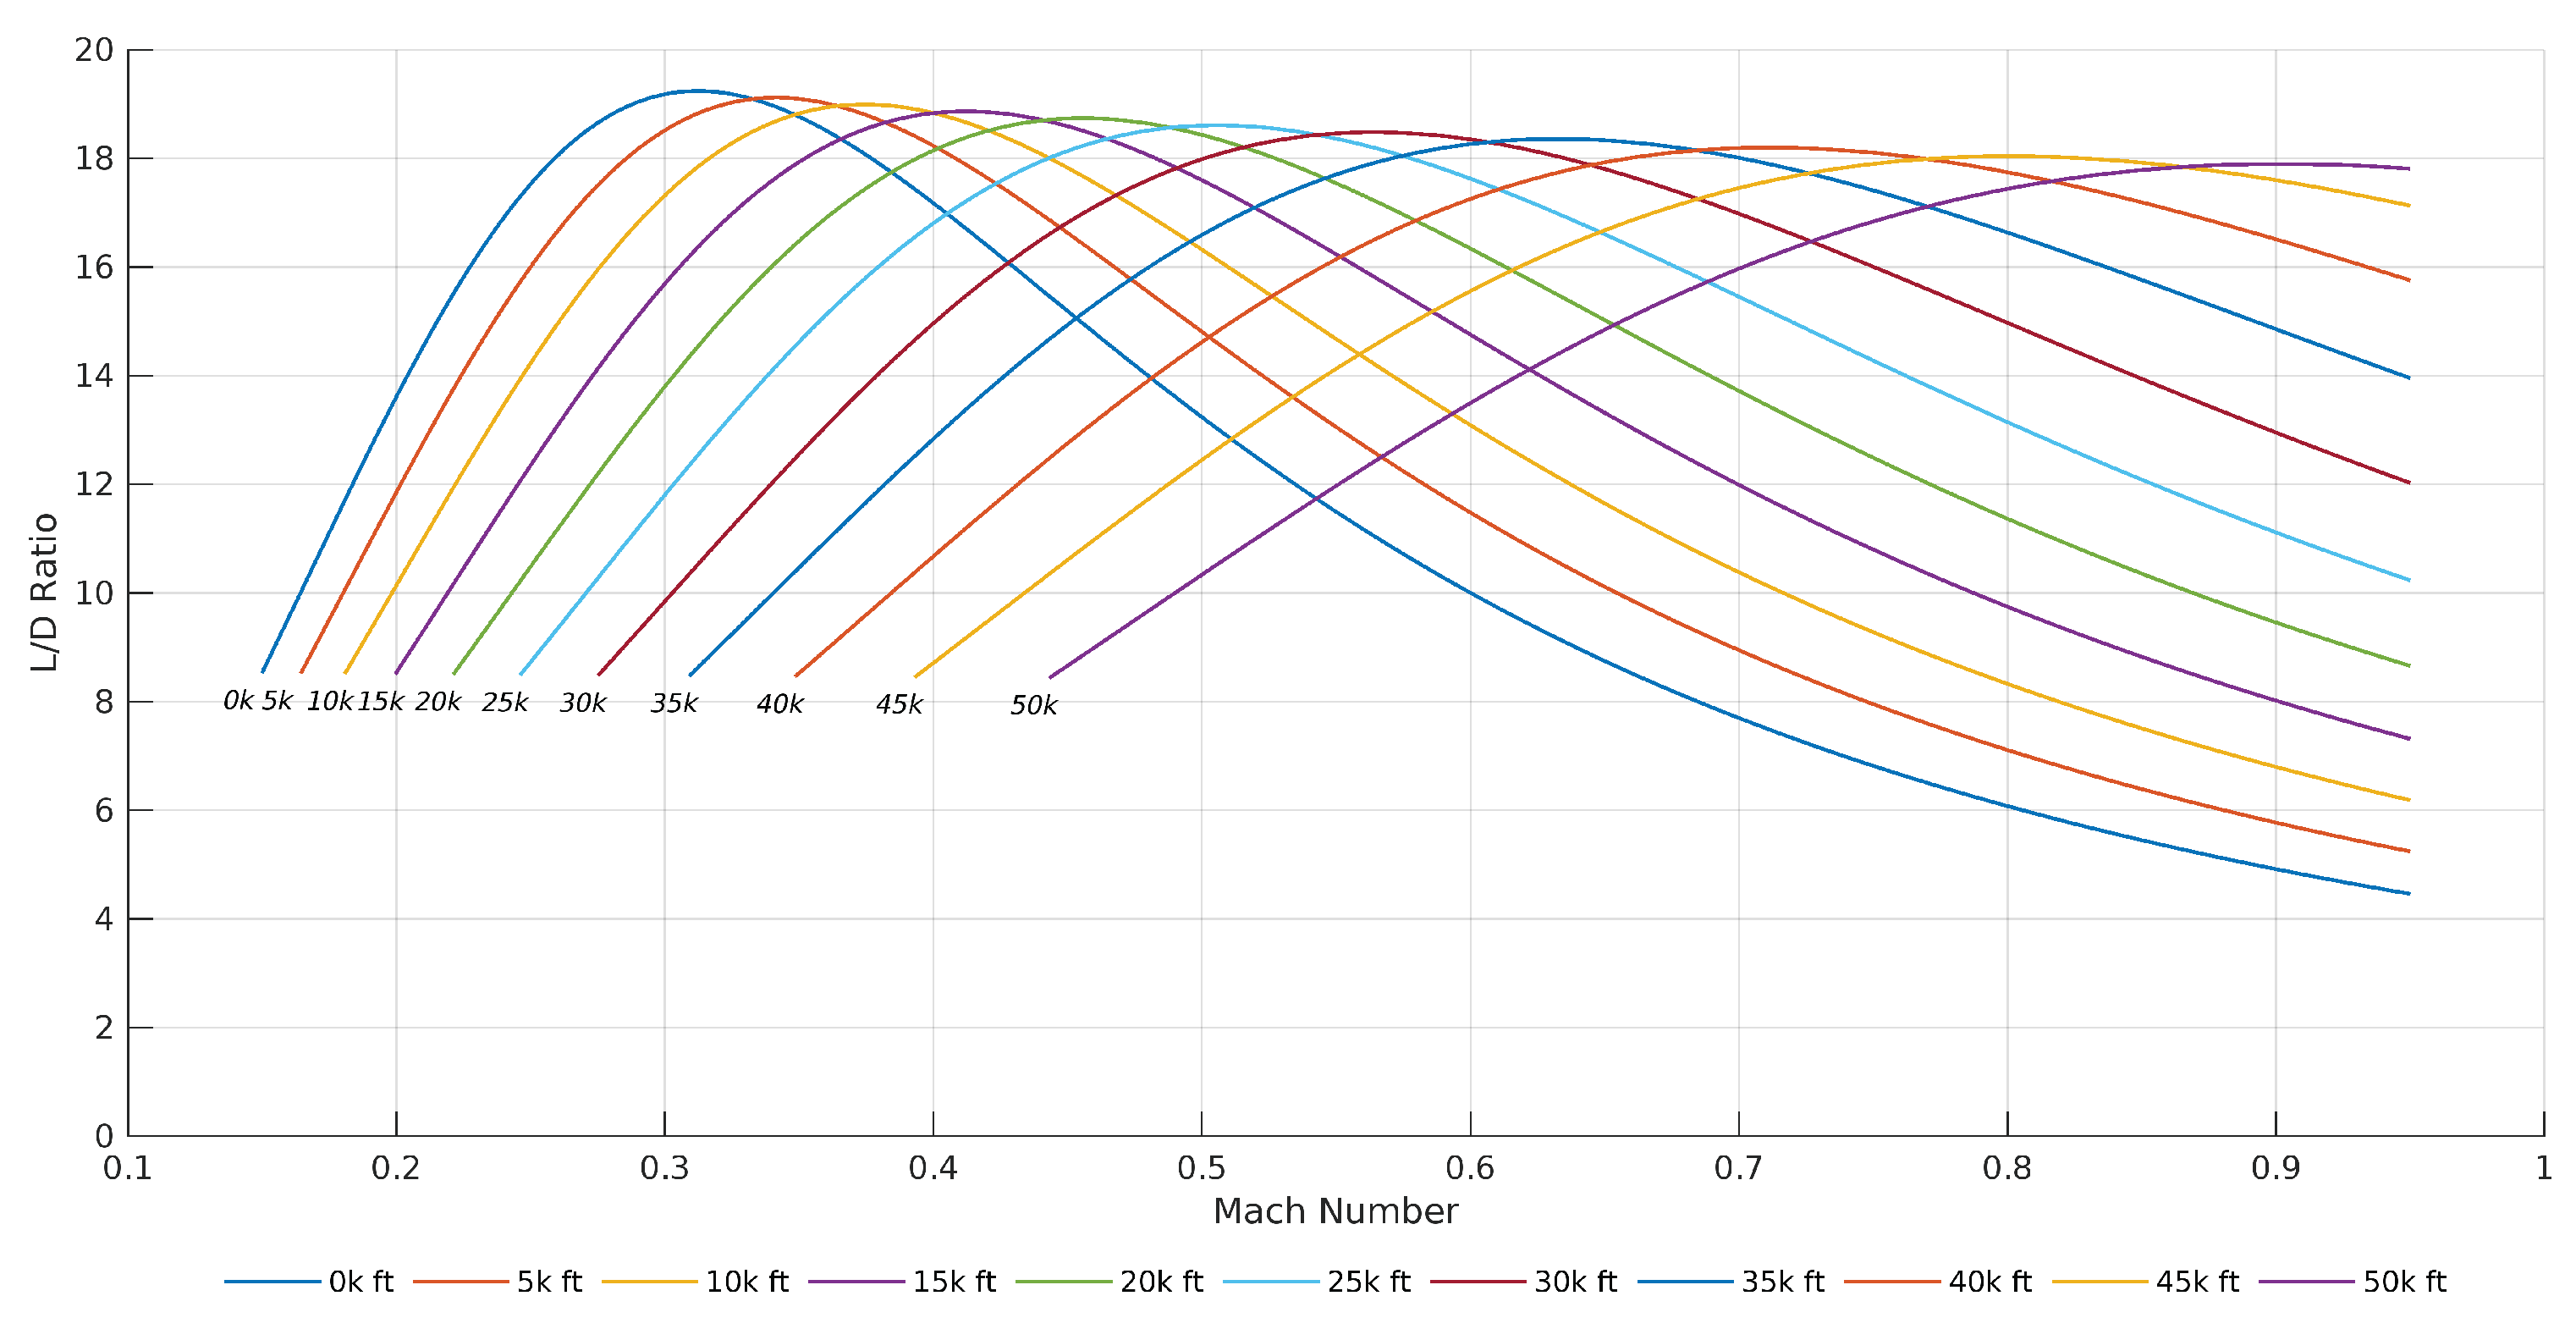
Figure 9.
Power required and power available curves versus Mach for the aerodynamic model of a ’large-cabin’ business aircraft powered by two 68.94 kN turbofan engines.
Figure 9.
Power required and power available curves versus Mach for the aerodynamic model of a ’large-cabin’ business aircraft powered by two 68.94 kN turbofan engines.
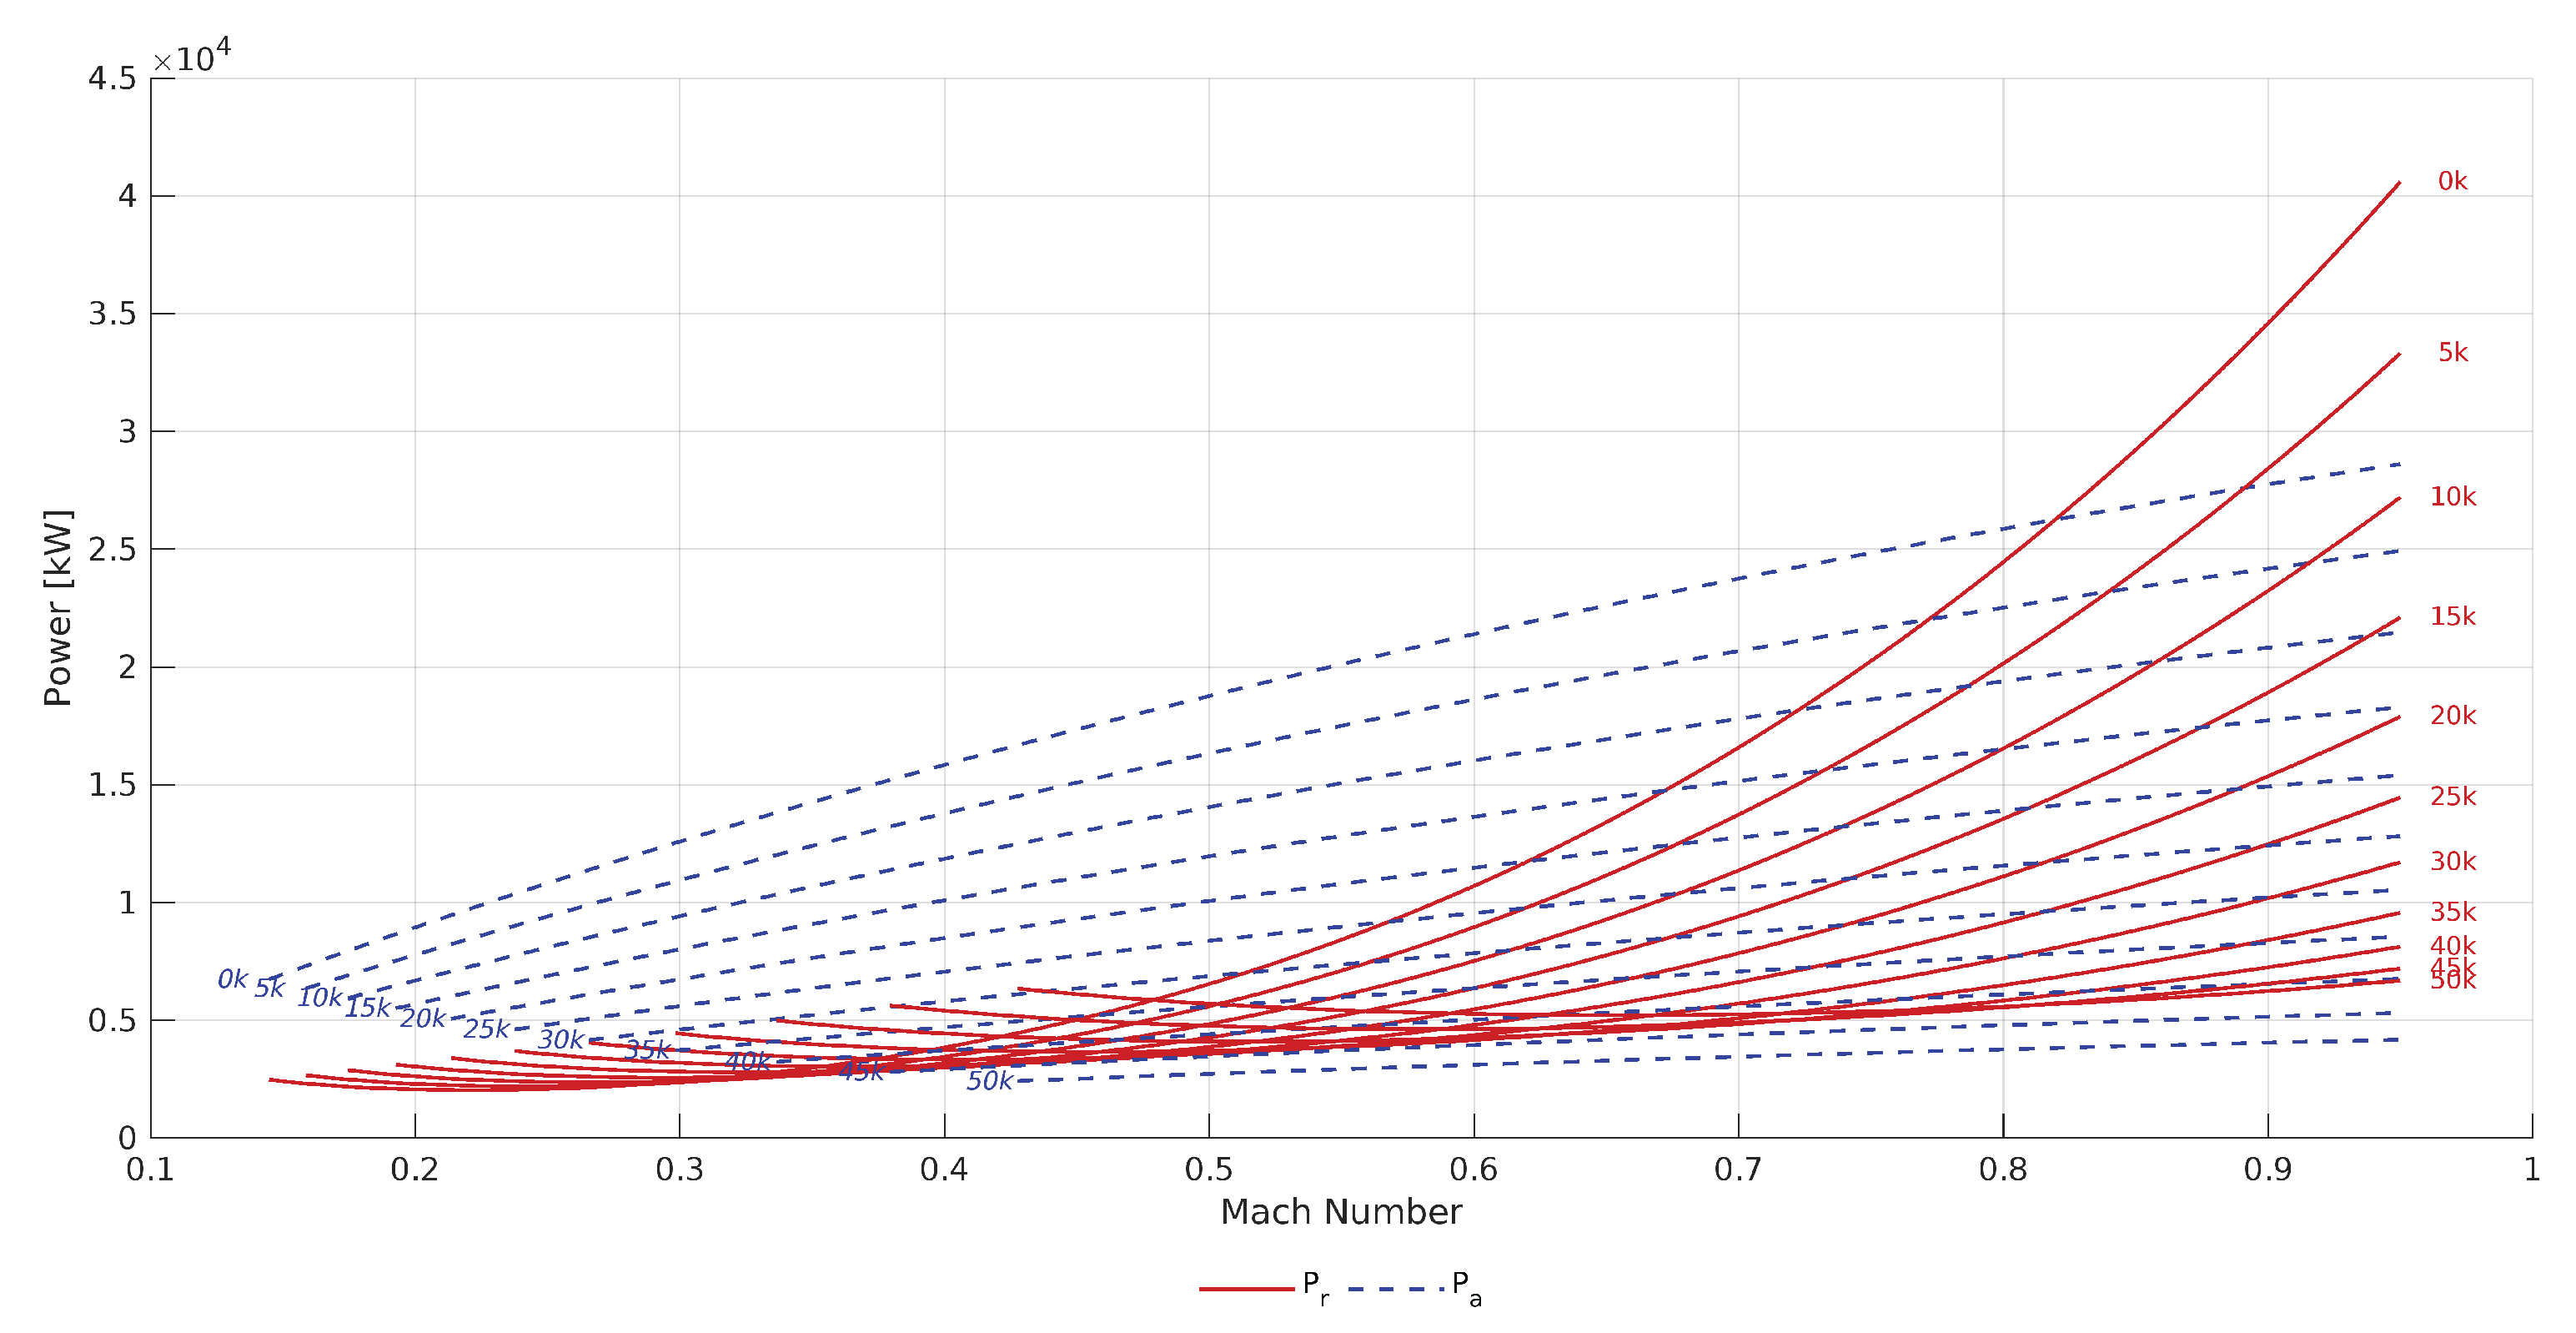
Figure 10.
Simplified model of the simulation loop process for the hybrid-electric architecture
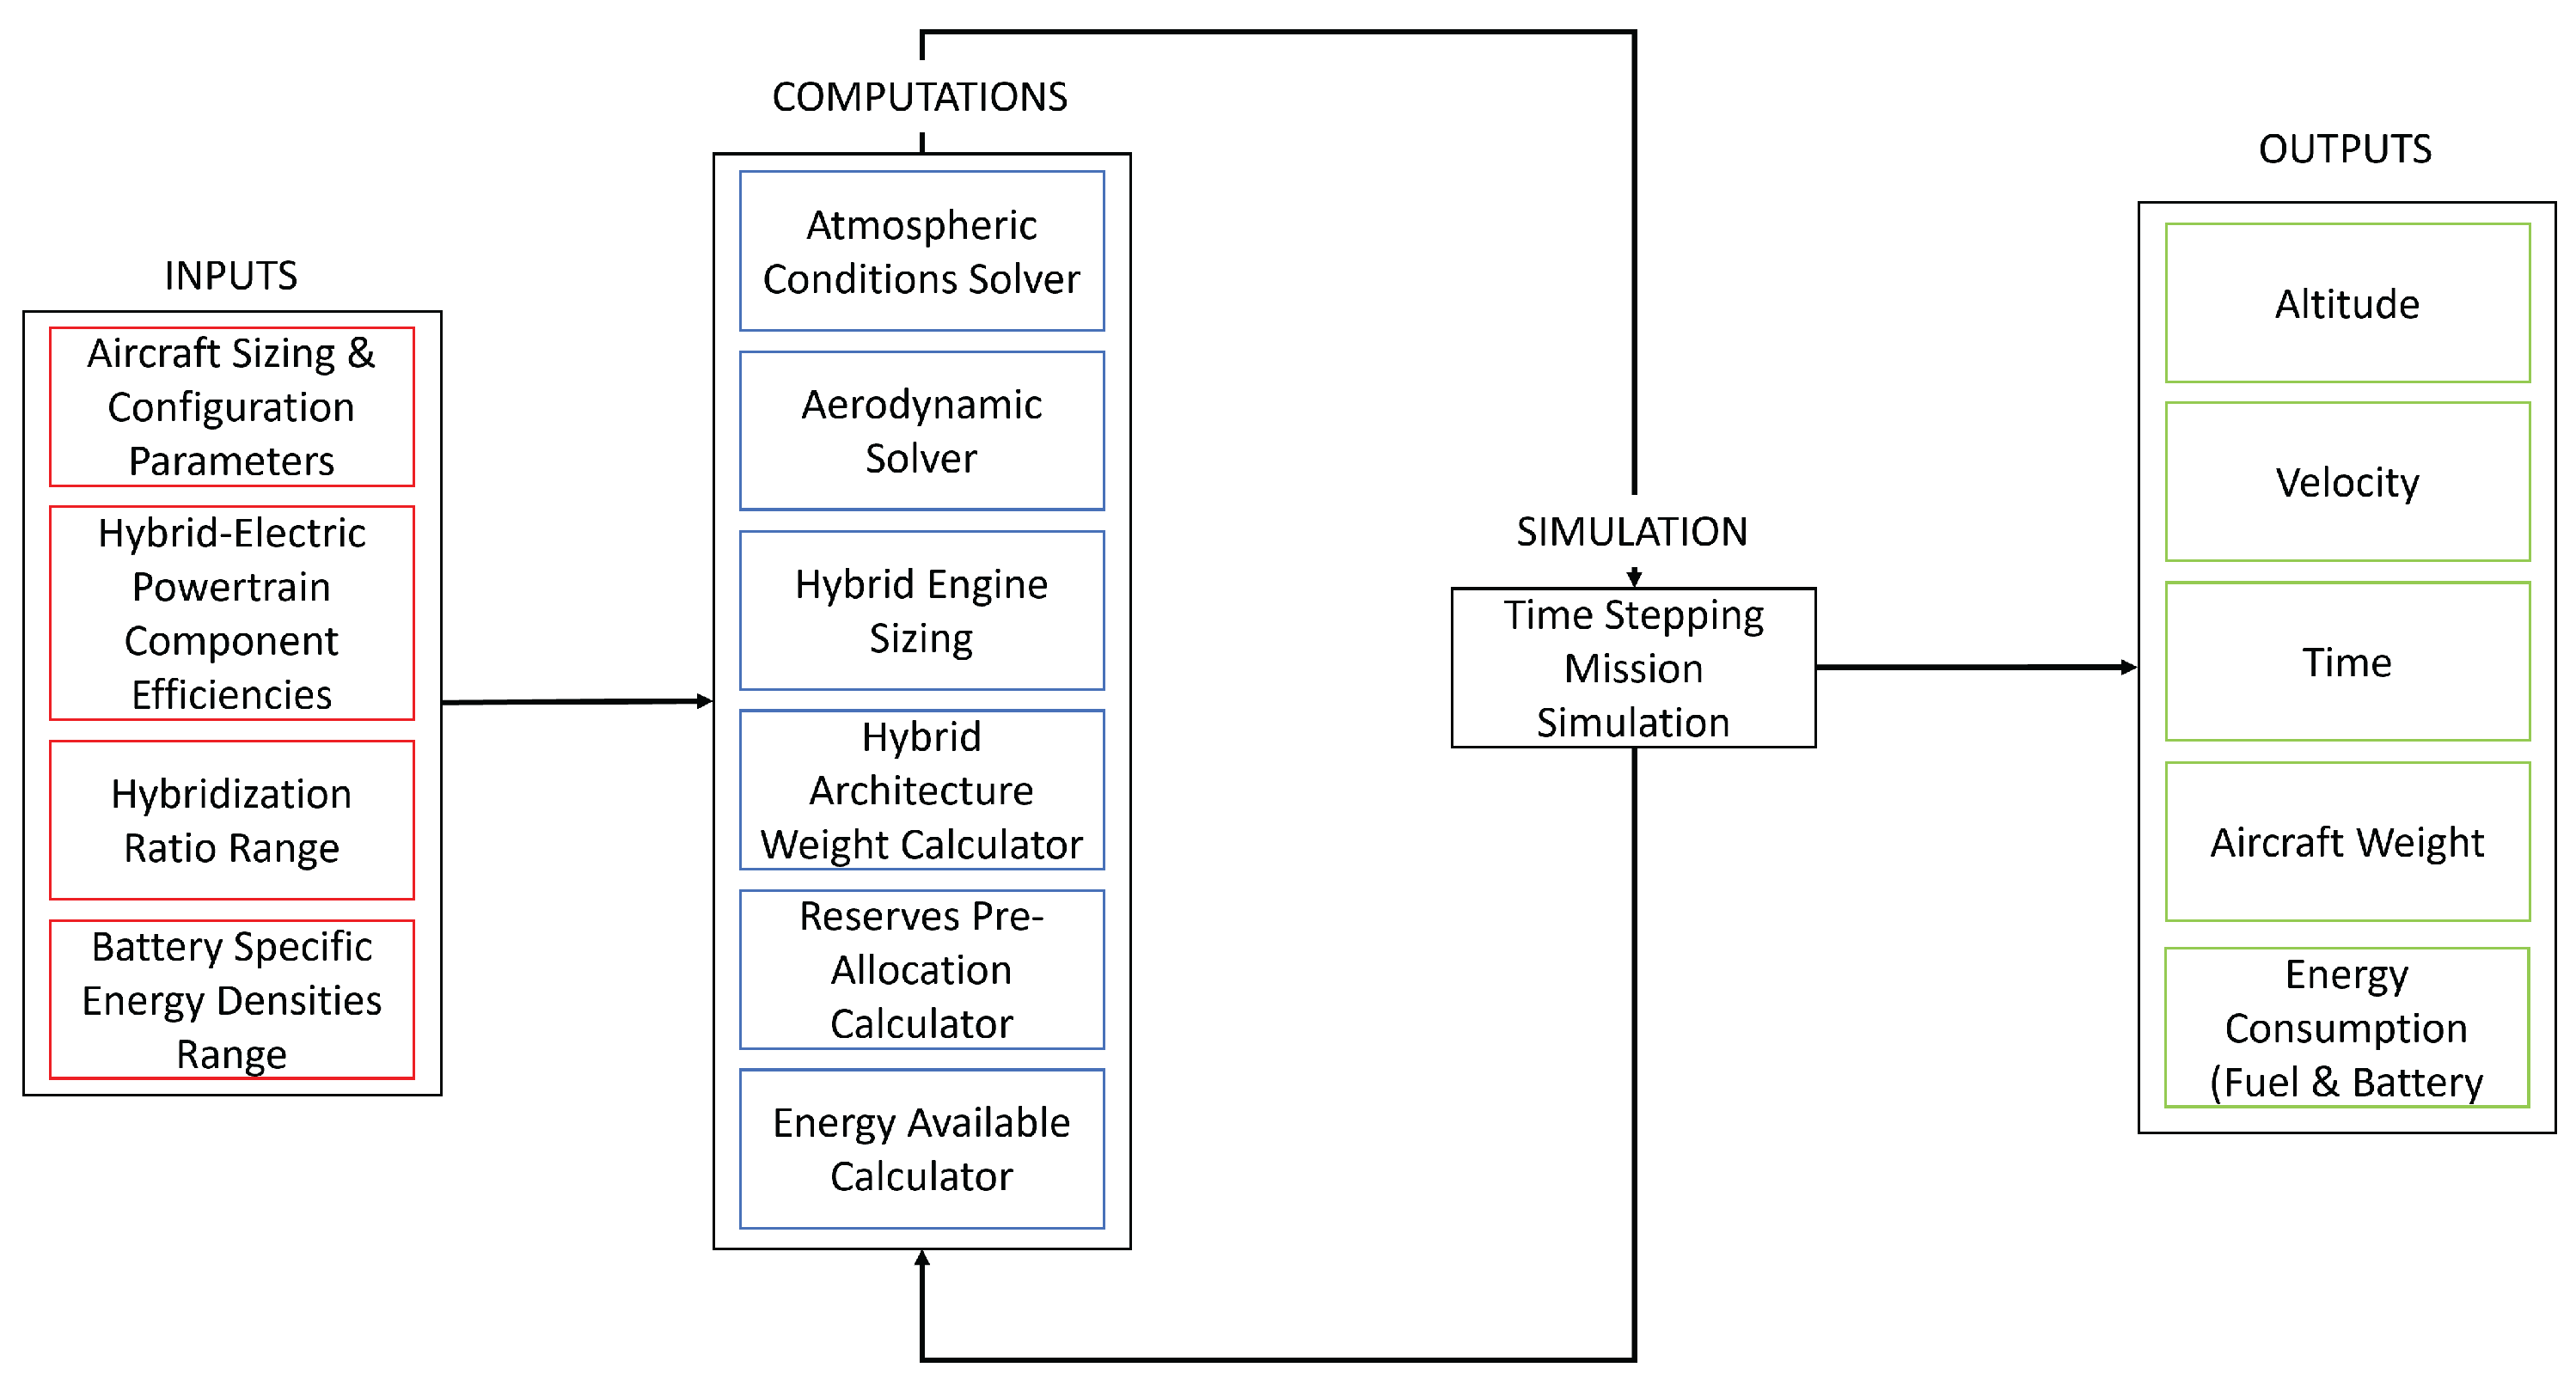
Figure 11.
Mission profile for the turbofan baseline. Maximum mission range, excluding reserves is 10,179 km (5,496 nmi). The reserve segment is 370 km (200 nmi).
Figure 11.
Mission profile for the turbofan baseline. Maximum mission range, excluding reserves is 10,179 km (5,496 nmi). The reserve segment is 370 km (200 nmi).
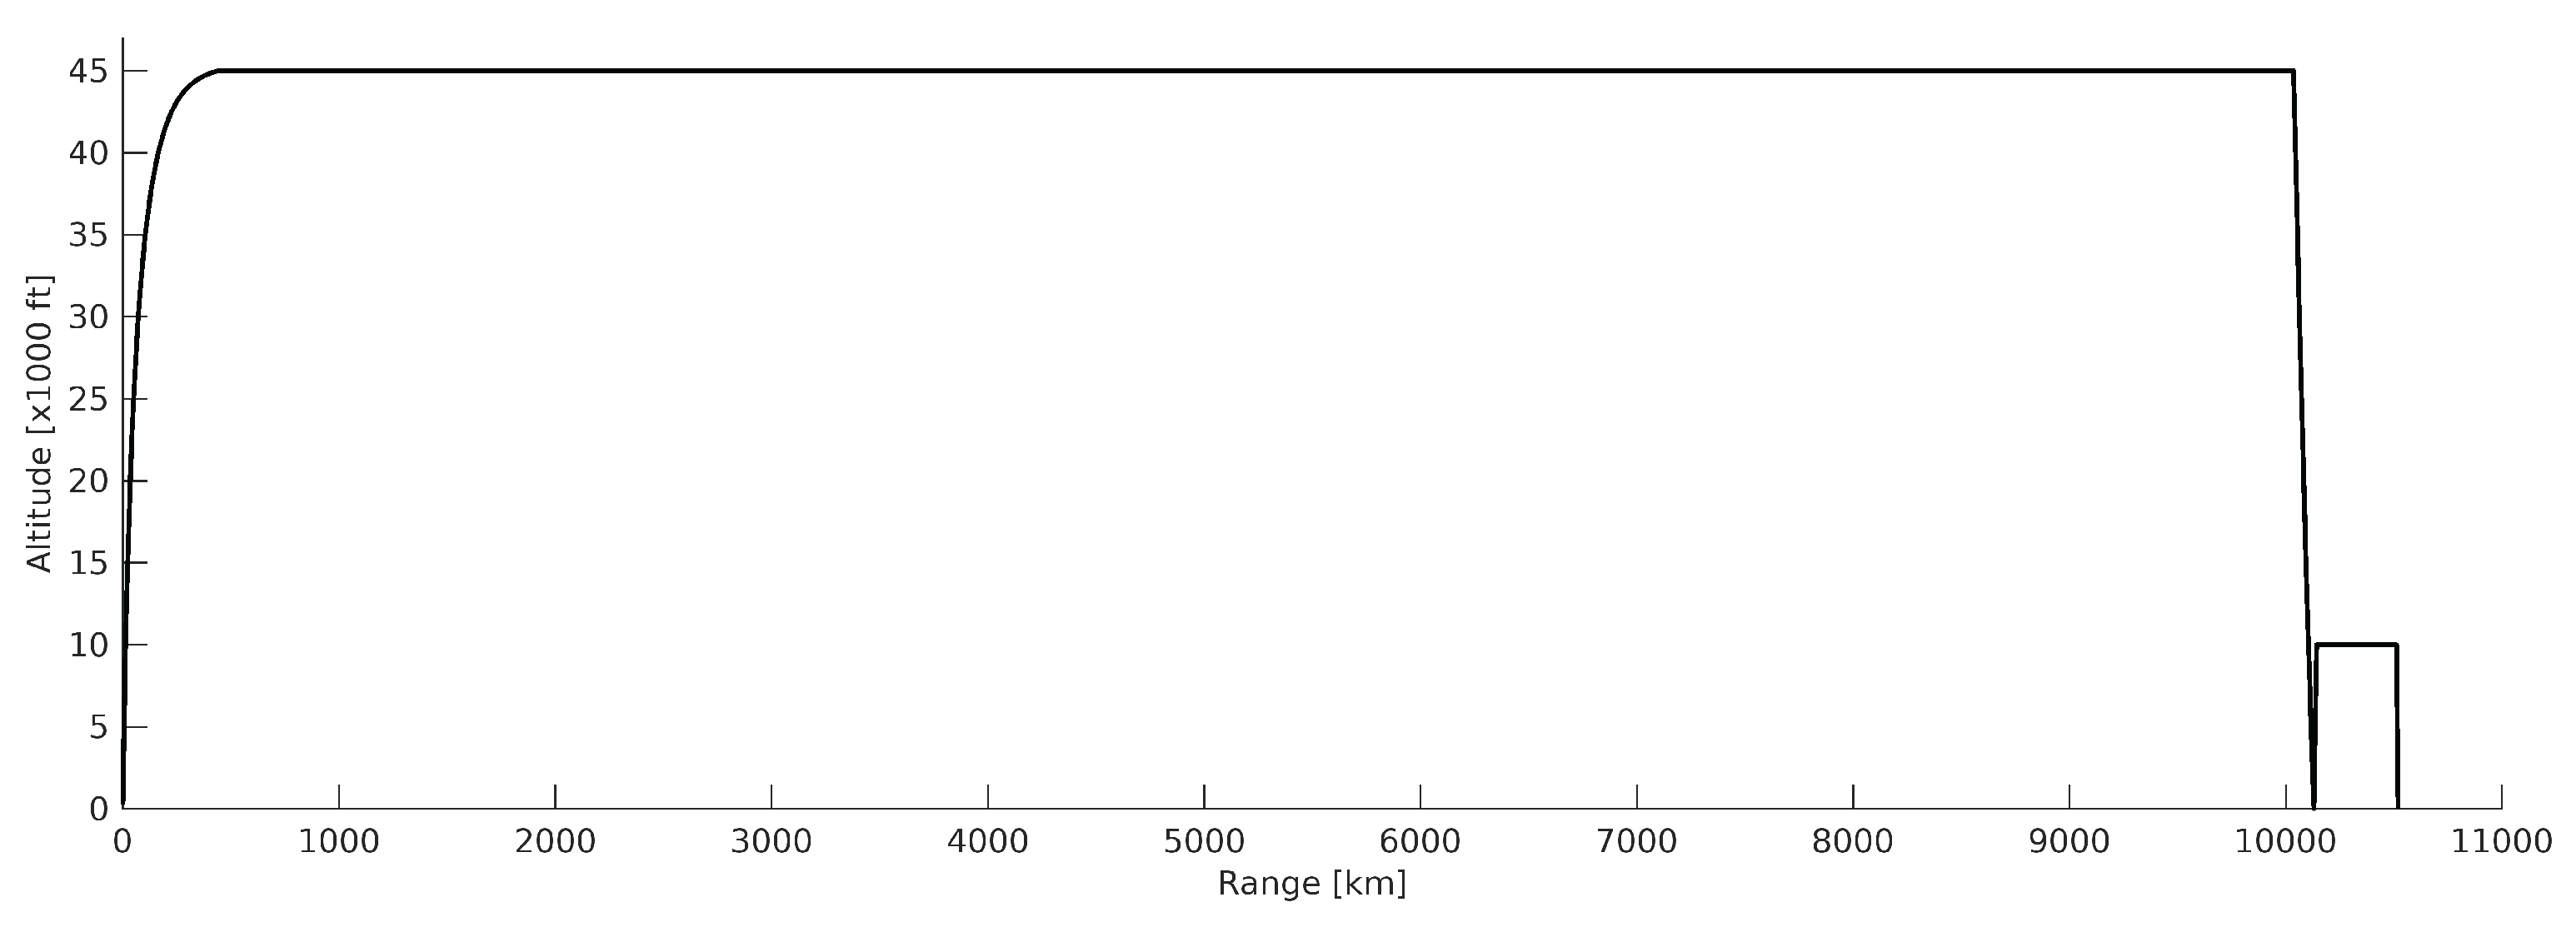
Figure 12.
Range contour plot for the series configuration
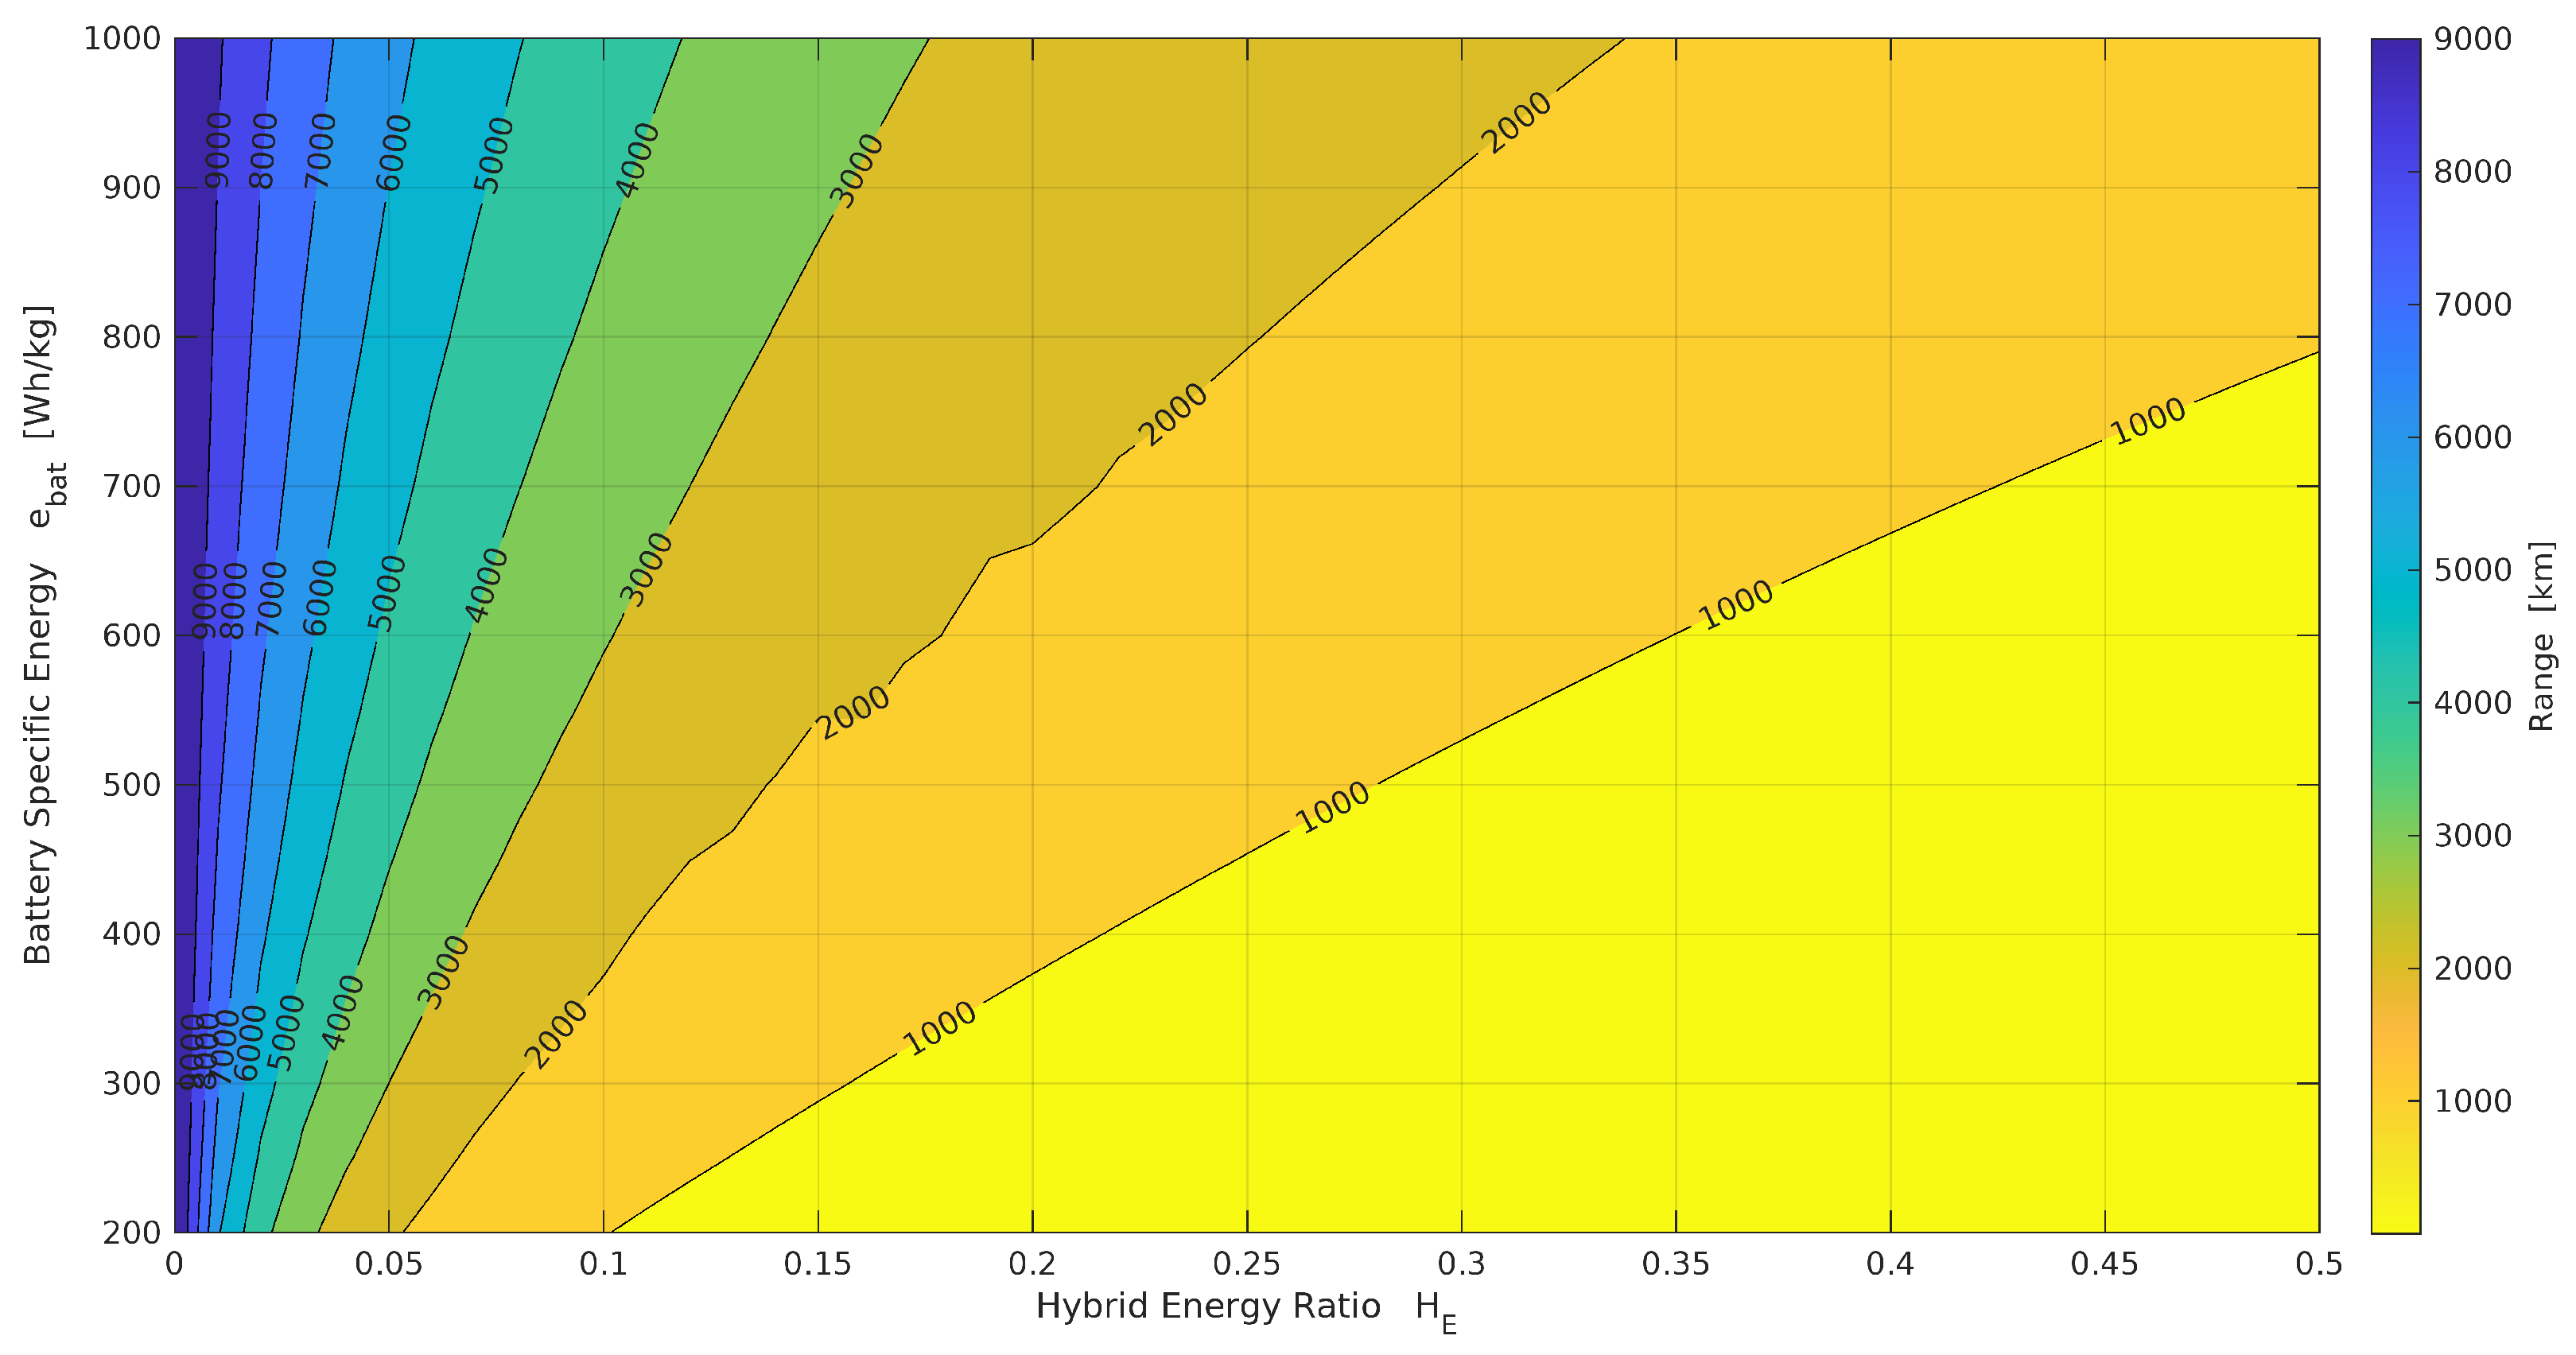
Figure 13.
Range contour for the parallel architecture
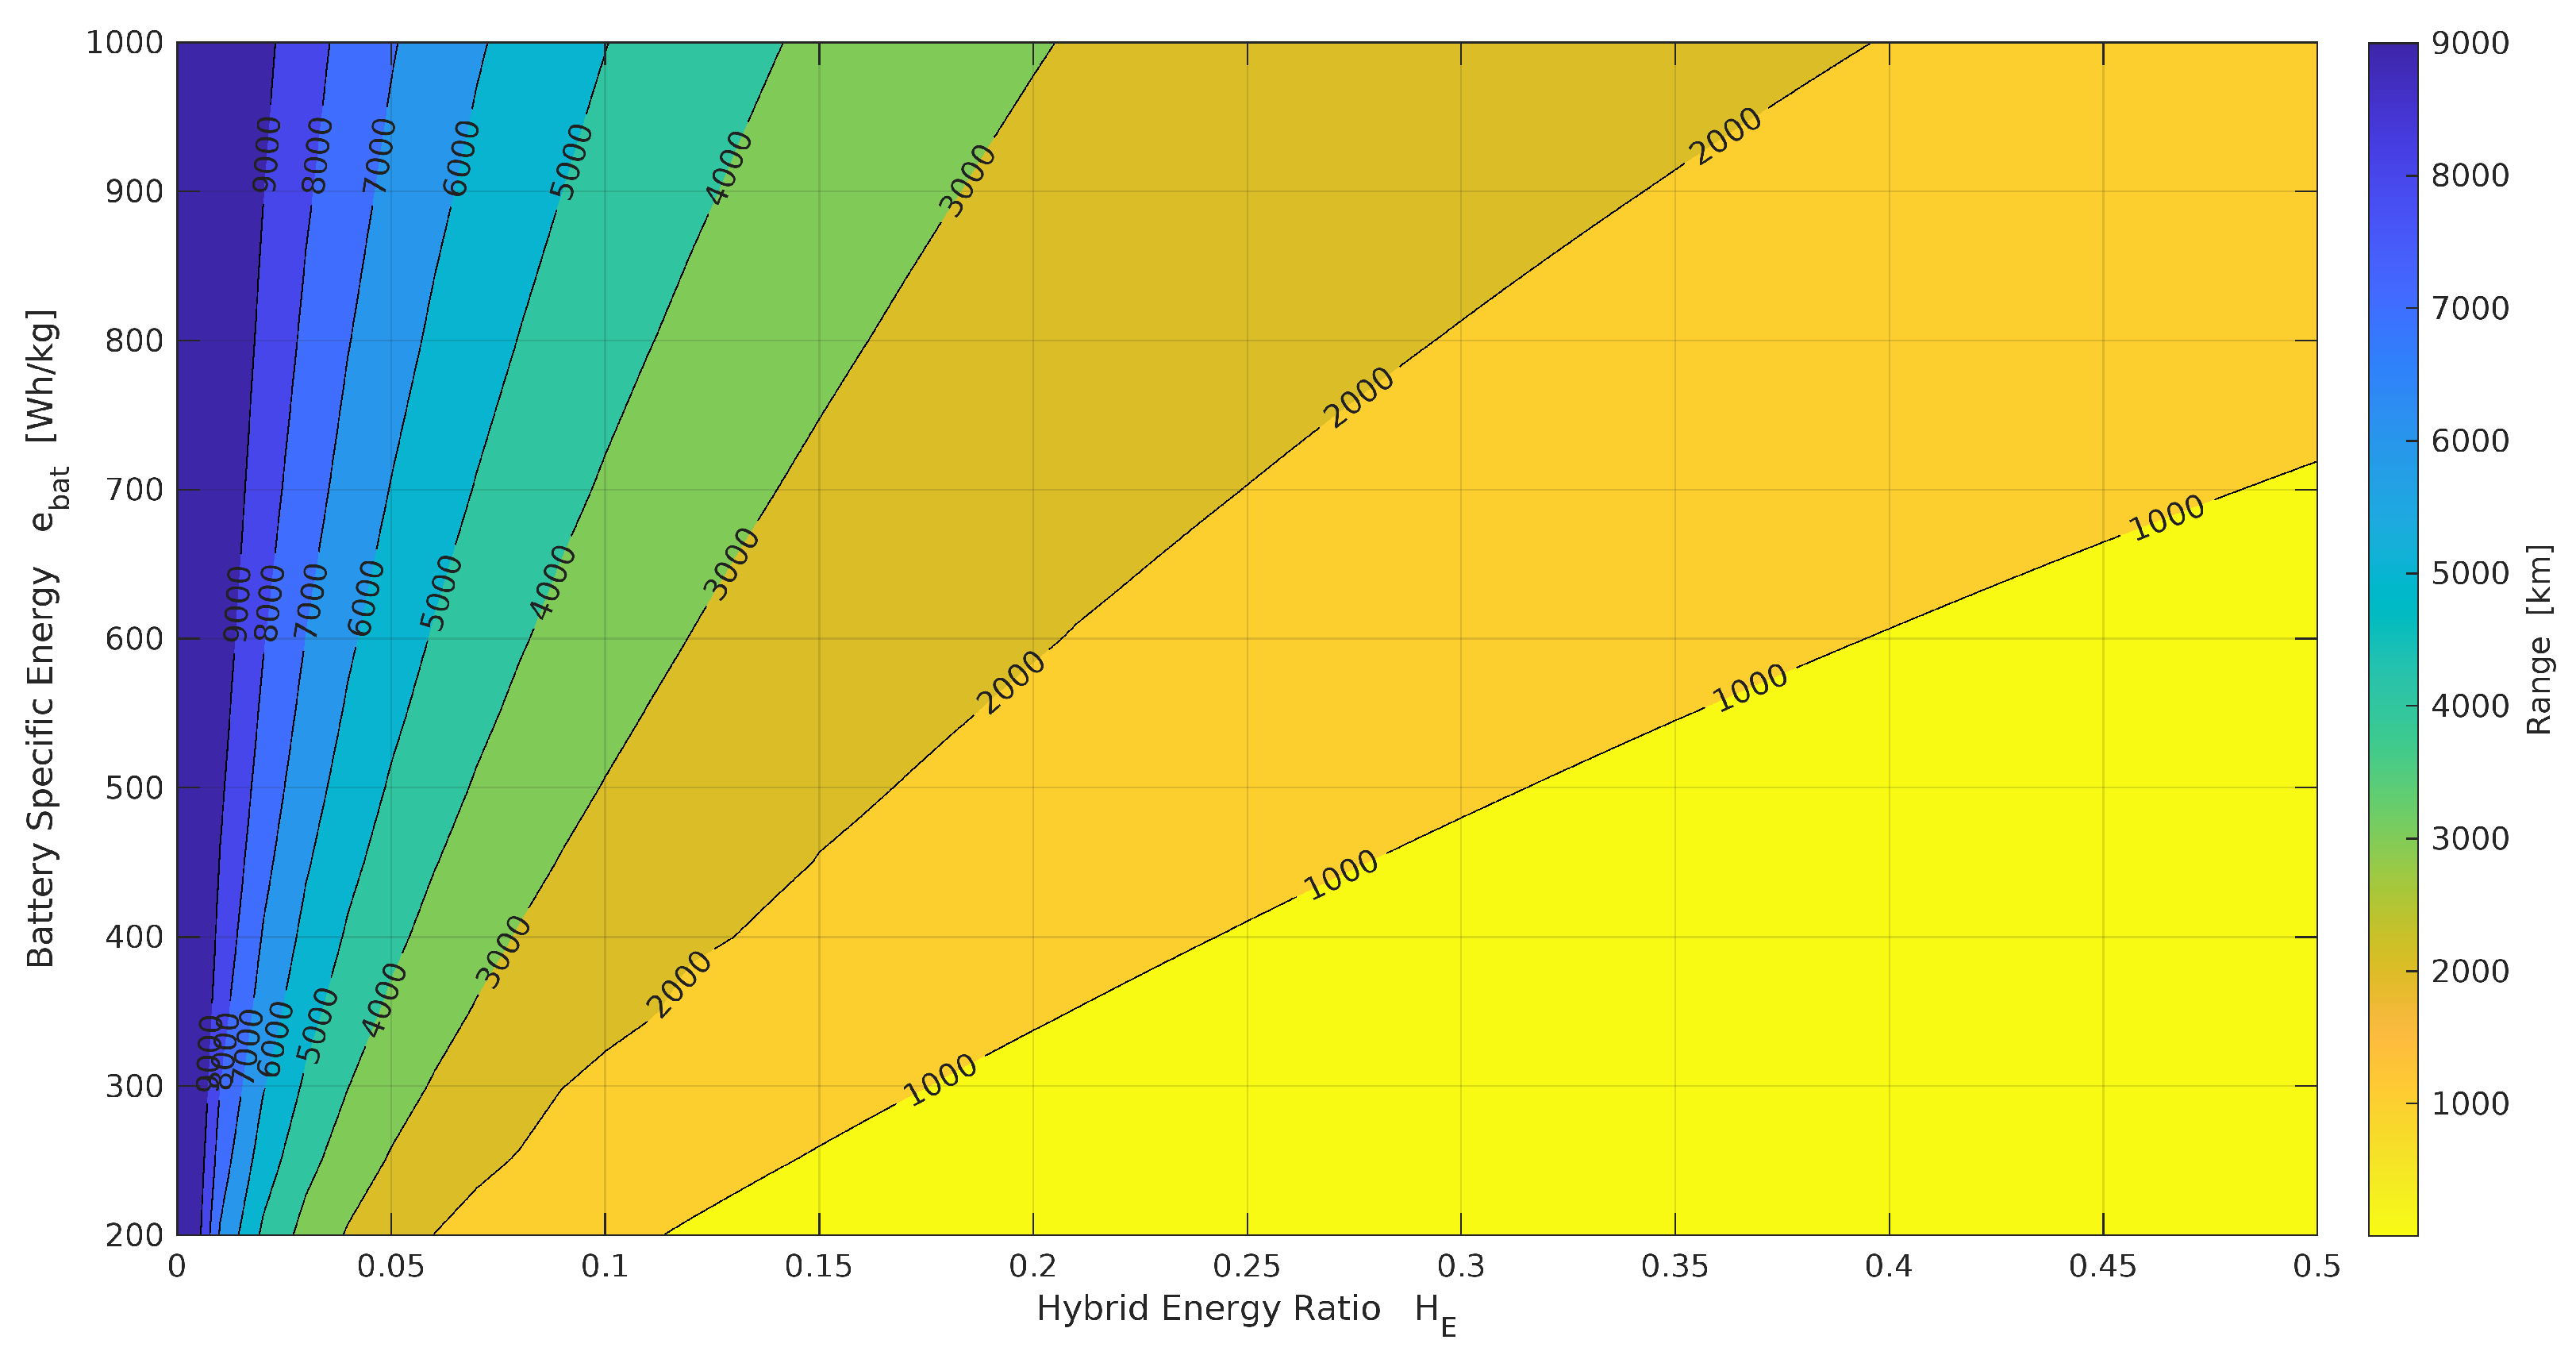
Figure 14.
Energy specific air range curves for the series powertrain
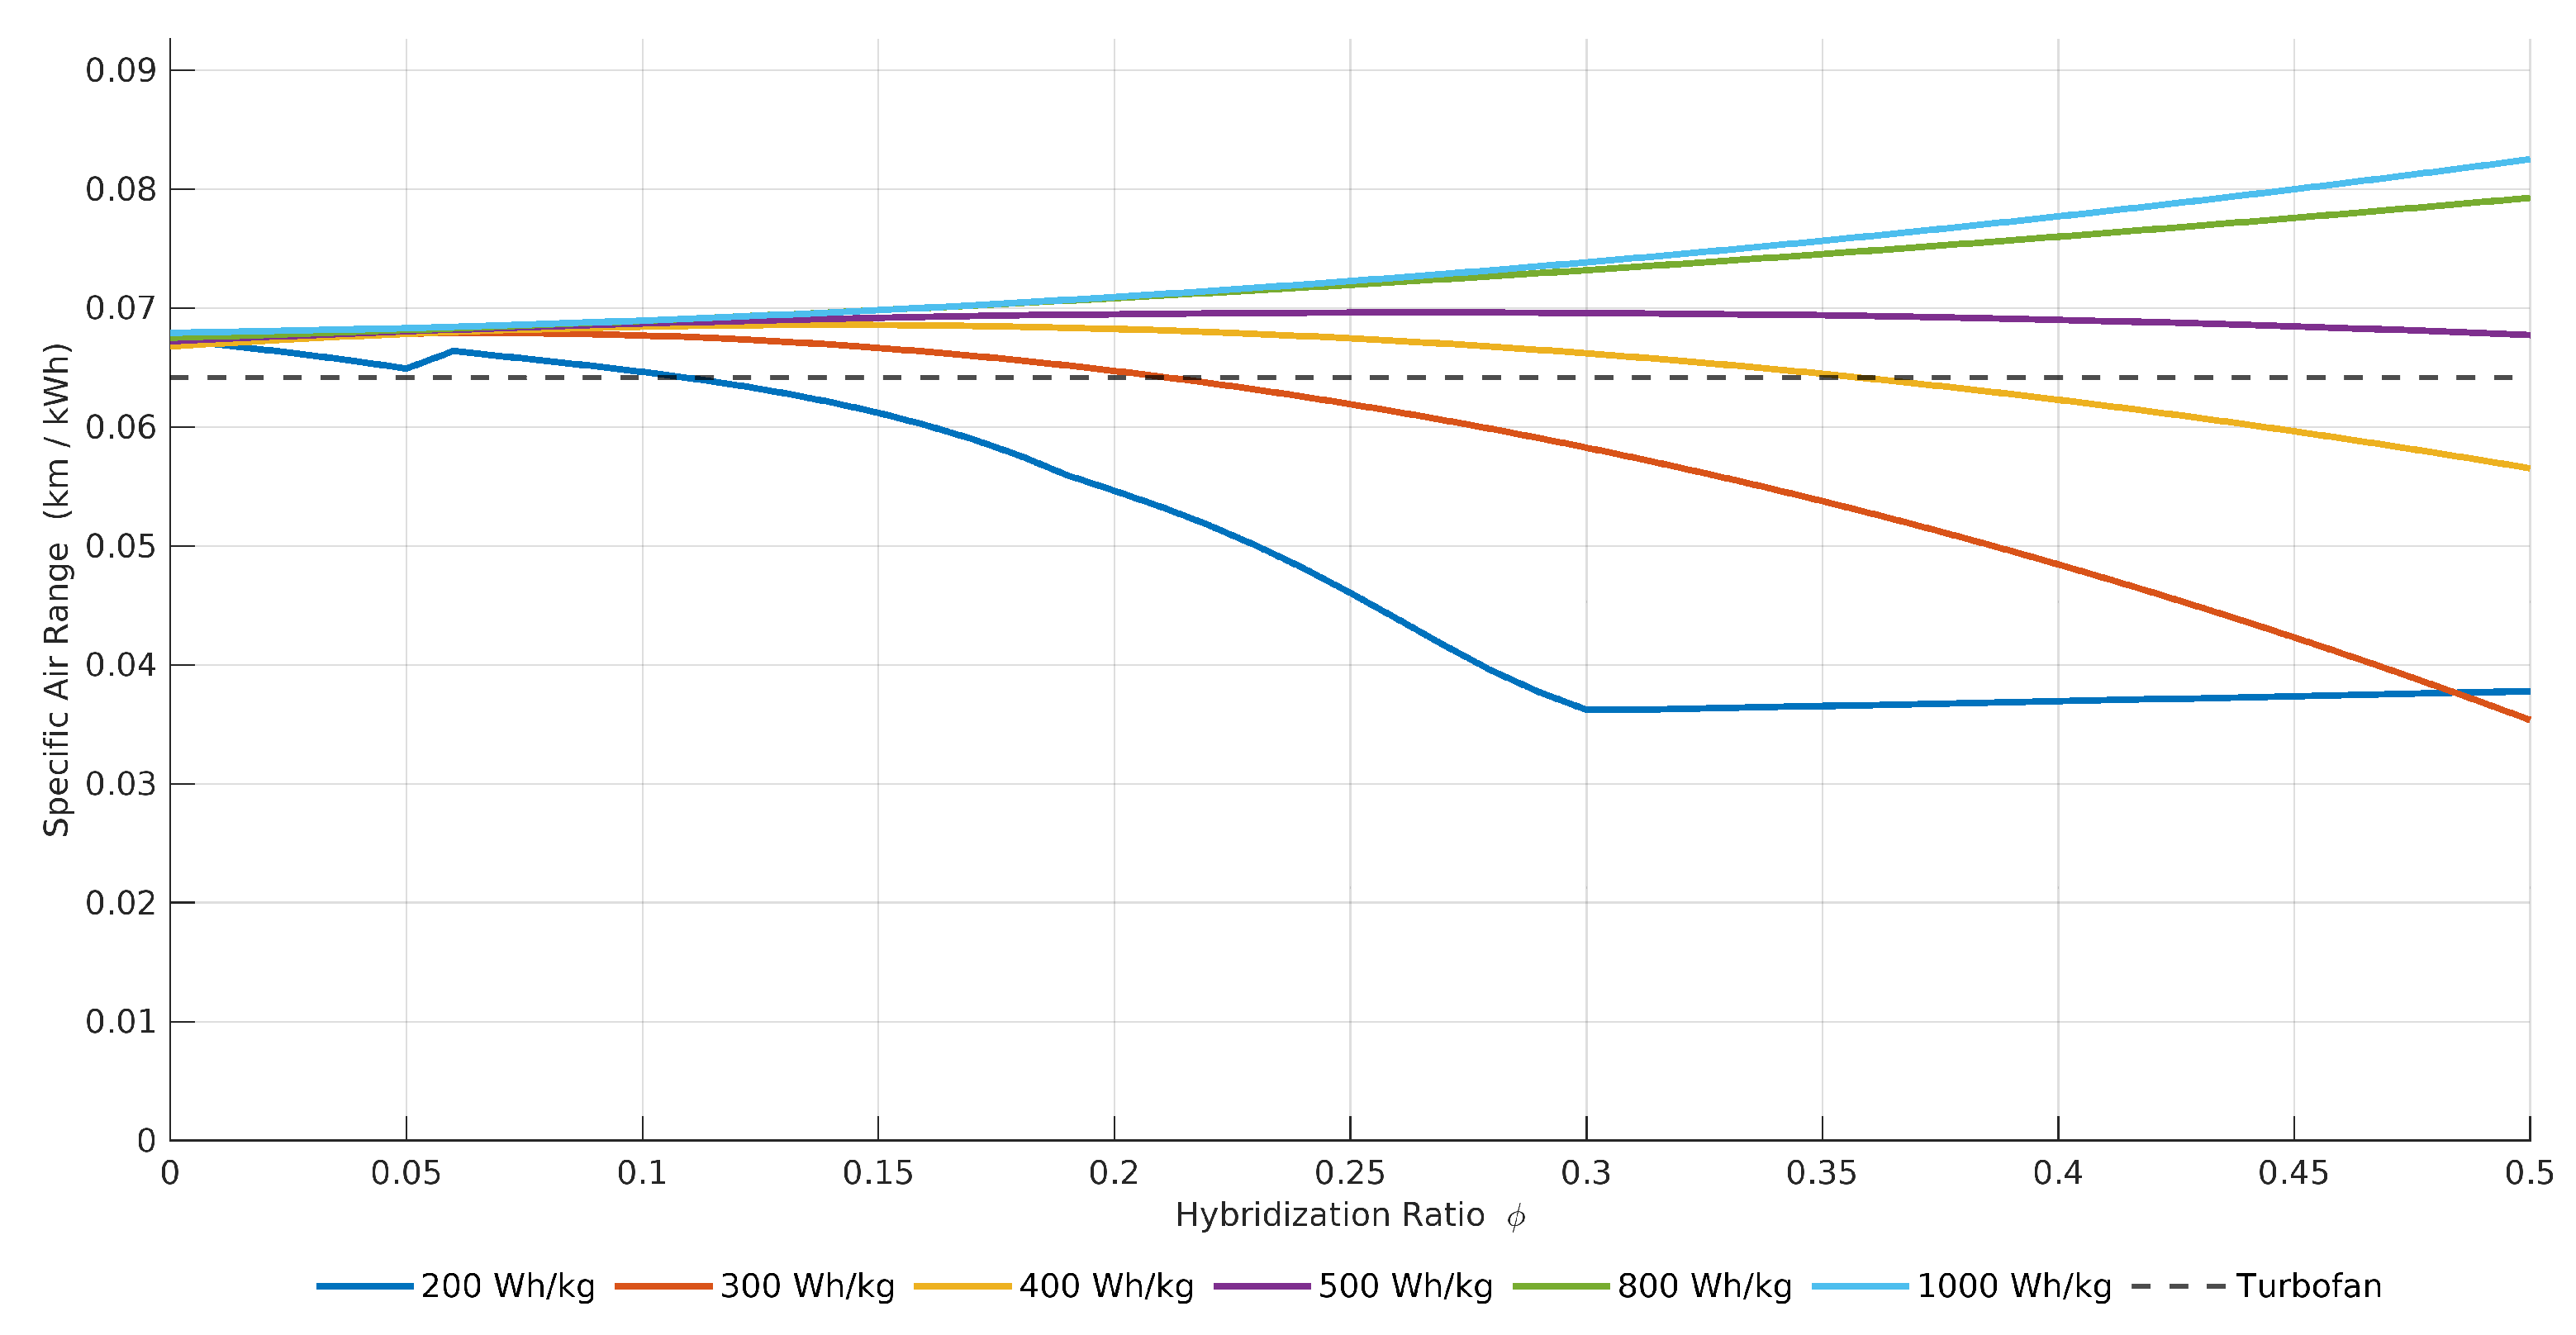
Figure 15.
Energy specific air range curves for the parallel powertrain
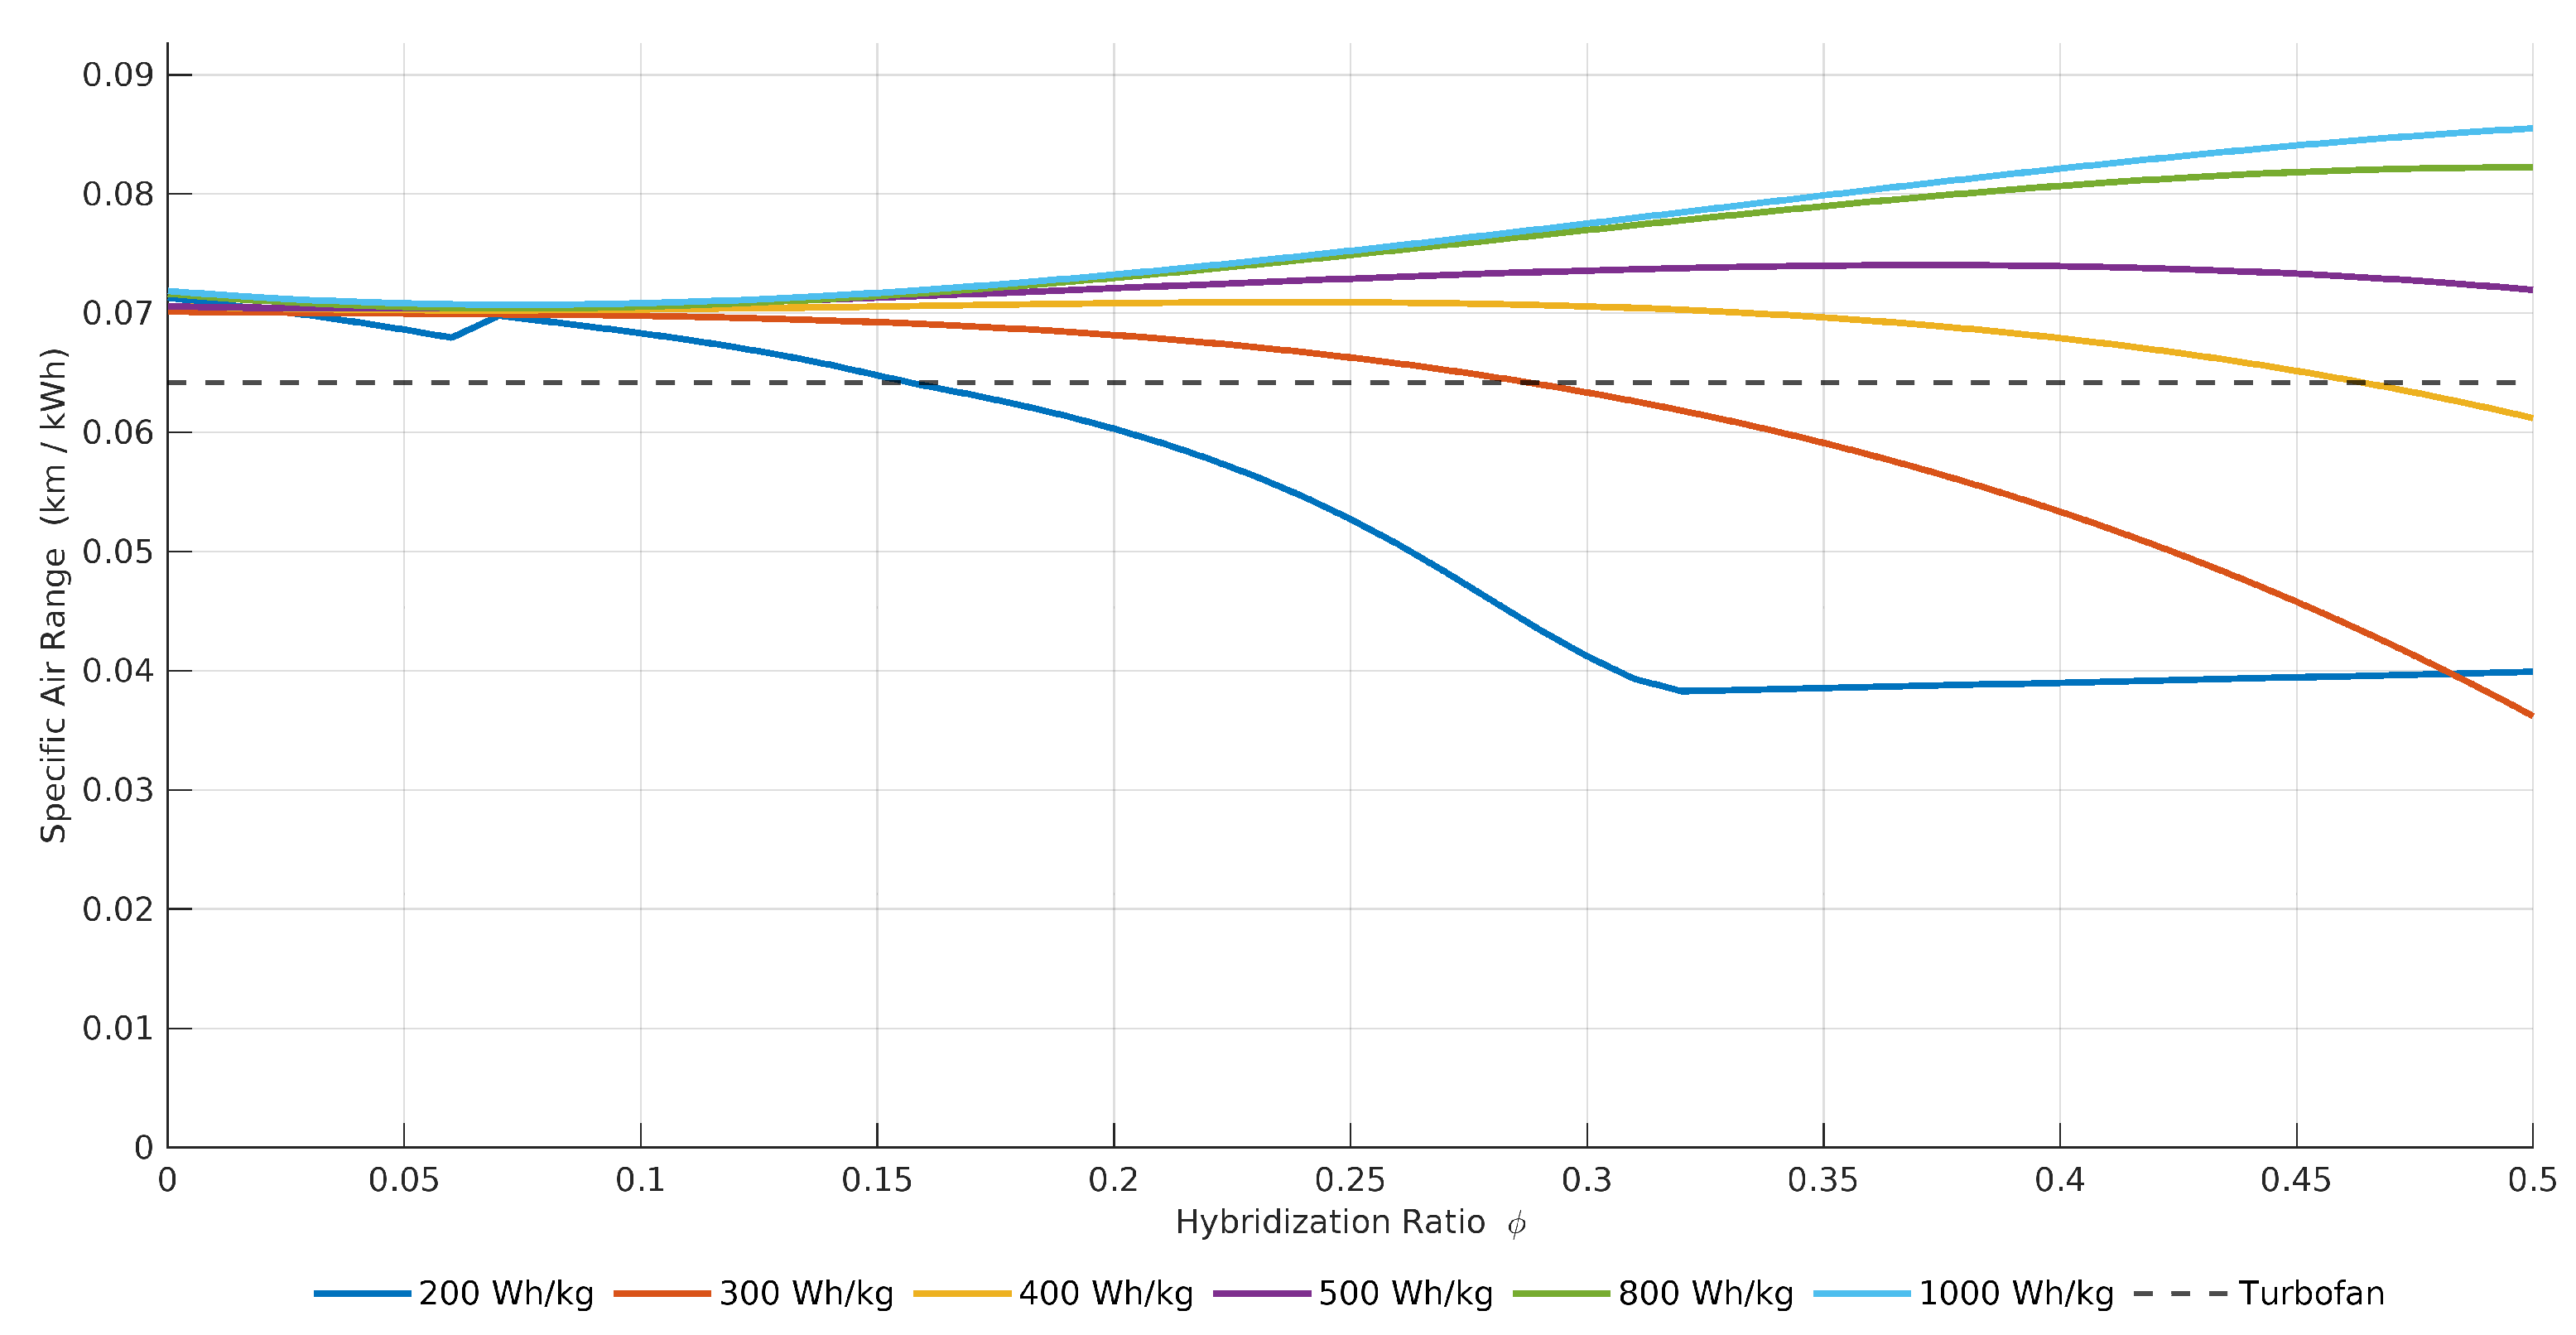
Figure 16.
Mission profile for the series and parallel HEP architectures against the turbofan baseline
Figure 16.
Mission profile for the series and parallel HEP architectures against the turbofan baseline

Figure 21.
Bar graph depicting energy consumption for the turbofan, series HEP, and parallel HEP. The left y-axis is fuel consumption in kg, while the right y-axis is the battery consumption in kWh
Figure 21.
Bar graph depicting energy consumption for the turbofan, series HEP, and parallel HEP. The left y-axis is fuel consumption in kg, while the right y-axis is the battery consumption in kWh
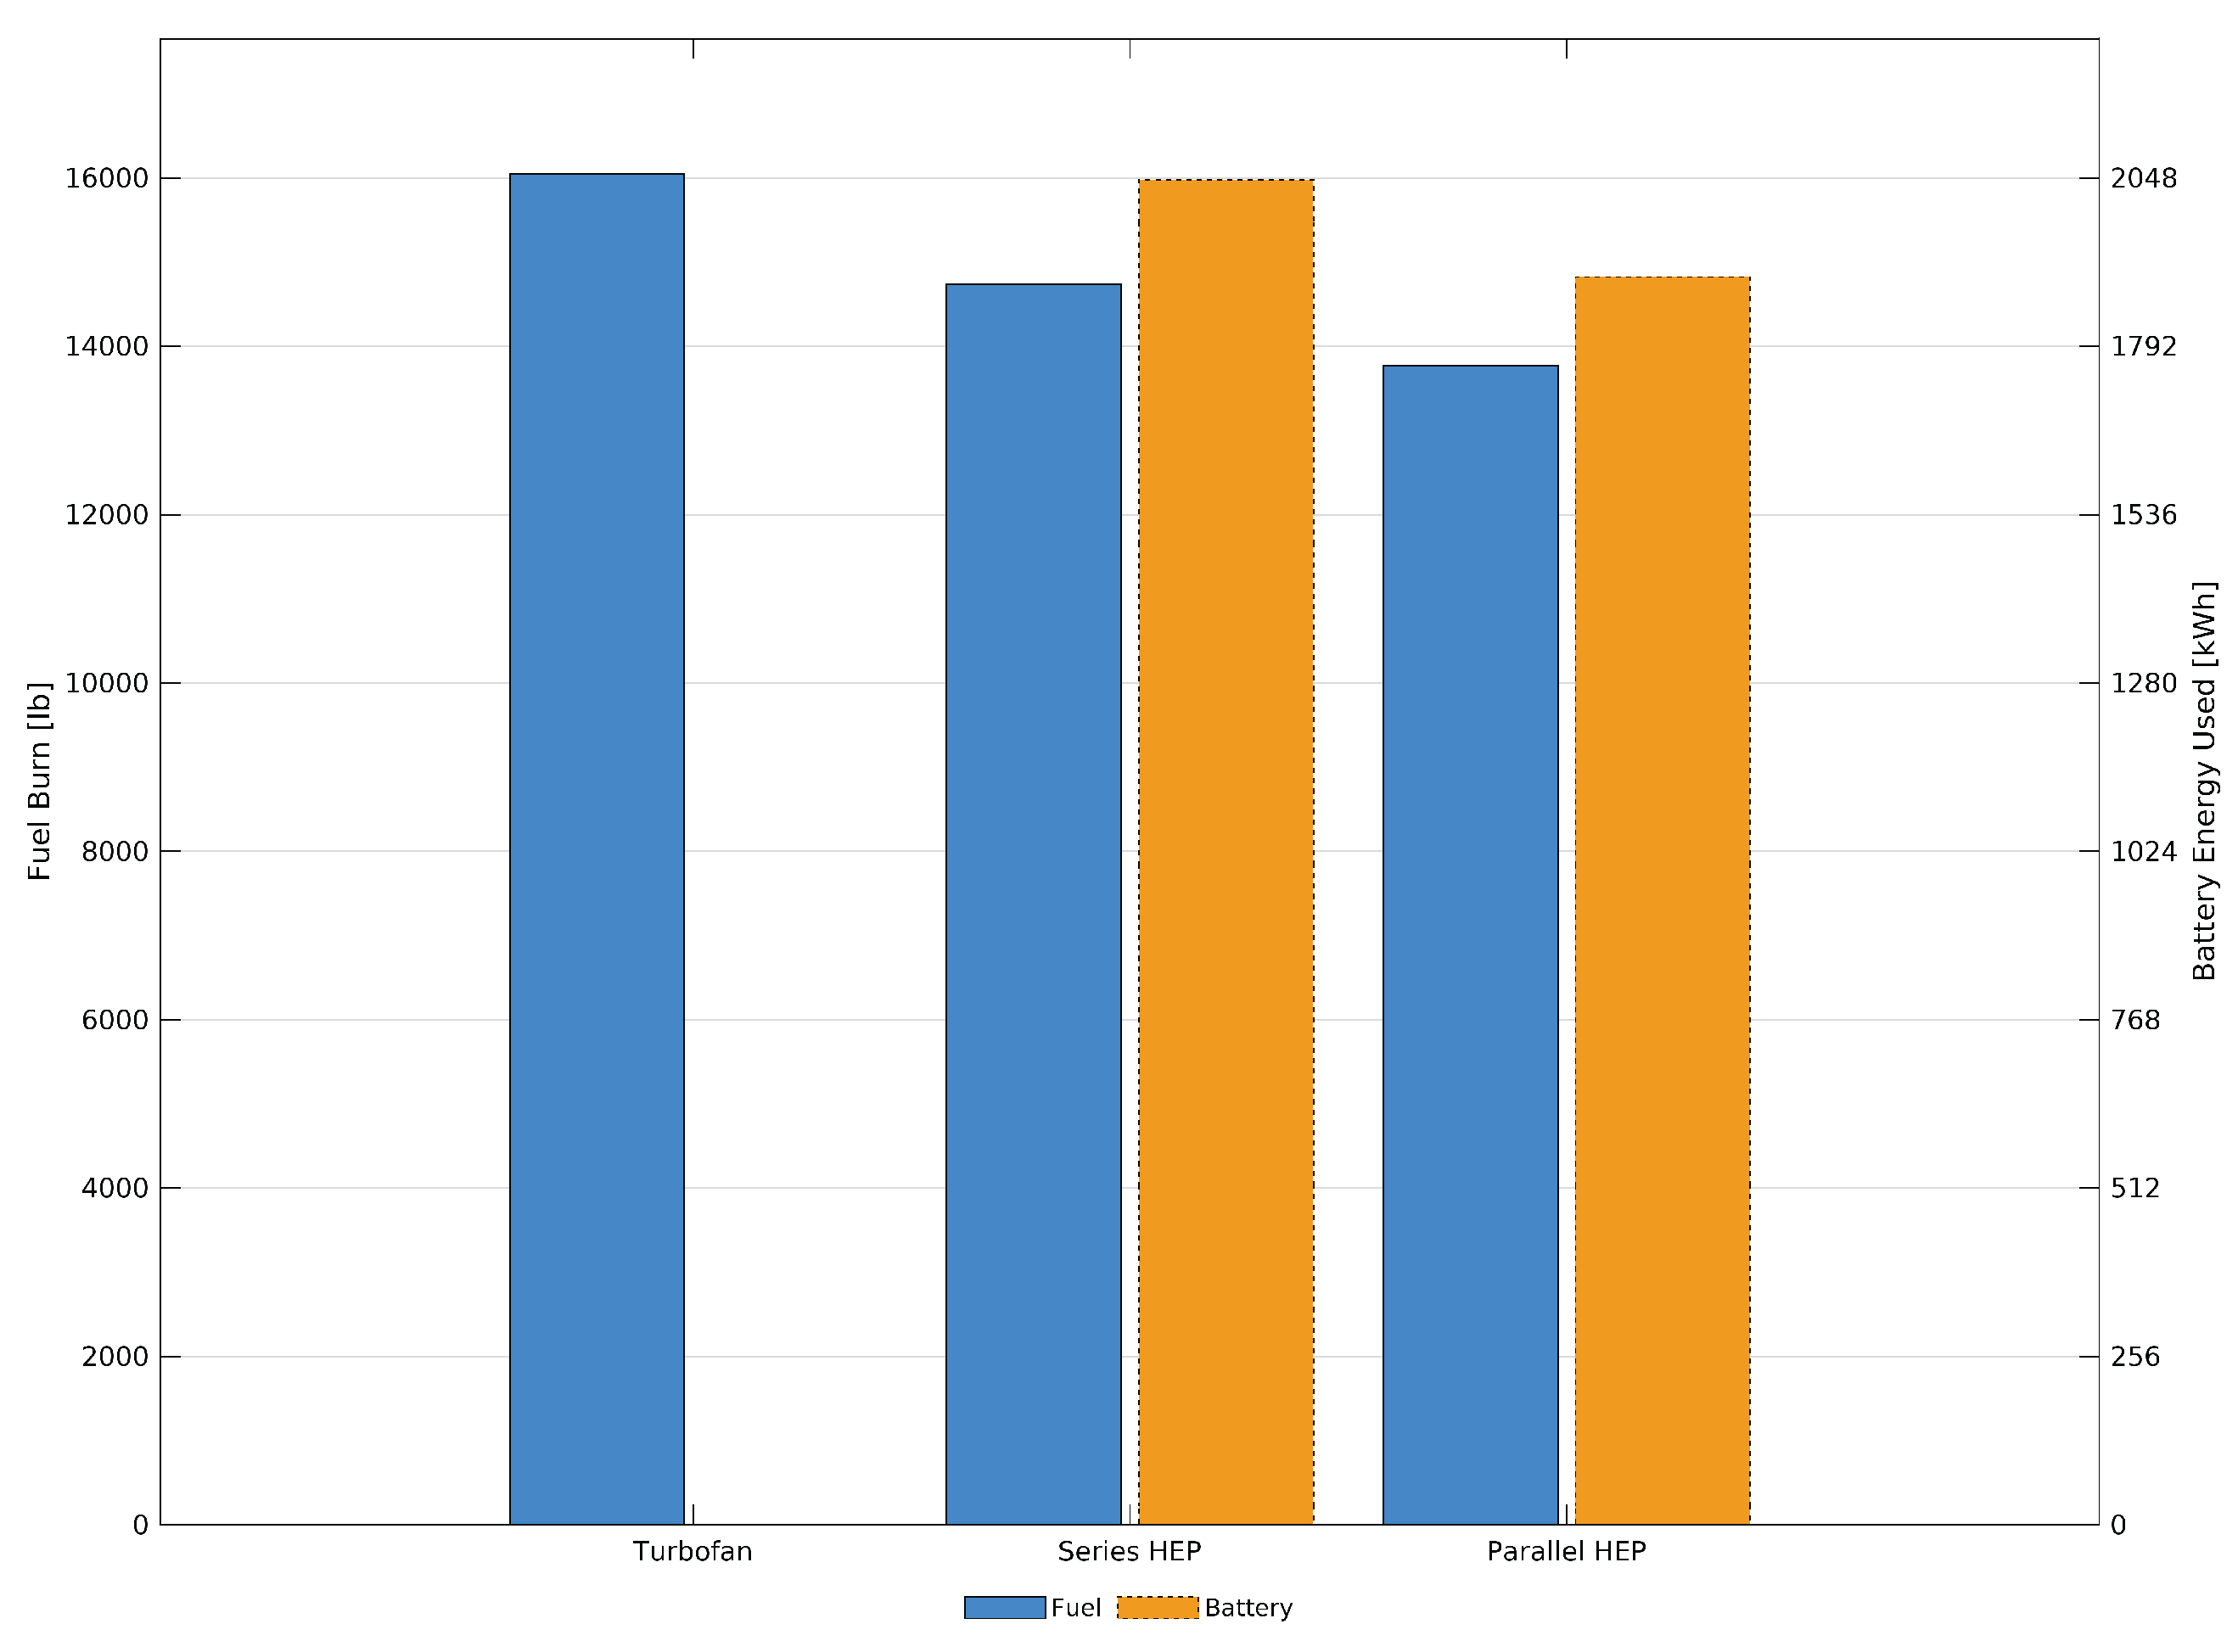

Table 1.
A Broad Definition of Business Jet Size Classes [6,7]. The NBAA Does Not Publish Exact Class Bounds.
| Jet Size Class | Max. MTOW | Avg. NBAA IFR Range | Pax. Seats |
|---|---|---|---|
| Very Light Jets | < 5,670 kg (12,500 lbs) | 1,852 km (1,000 nmi) | 4-6 |
| Light Jets | ≈ 9,072 kg (20,000 lbs) | 3,704 km (2,000 nmi) | 5-6 |
| Midsize Jets | ≈ 13,608 kg (30,000 lbs) | 4,630 km (2,500 nmi) | 7-8 |
| Super-Midsize Jets | ≈ 18,144 kg (40,000 lbs) | 5,556 km (3,000 nmi) | 8-10 |
| Large-Cabin Jets | ≈ 36,287 kg (80,000 lbs) | 8,334 km (4,500 nmi) | 10-18 |
| Ultra Long-Range Jets | > 41,957 kg (92,500 lbs) | 12,038 km (6,500 nmi) | 12-20 |
Table 2.
Typical Mission Profile of a Long-Range Business Aircraft
| Phase | Phase Name | Phase Description | Typical Values |
|---|---|---|---|
| G0 | Engine Start | Engine start | - |
| G1 | Taxi | Ramp to runway | 10 minutes at ground idle |
| T1 | Takeoff | Roll to rotation | Approximately 5,500 ft TOFL @ MTOW |
| F1 | Initial Climb | Climb to departure altitude | Surface to between 2,500 ft AGL & 4,500 ft MSL |
| F2 | Climb | Climb to cruise altitude | From 2,500/4,500 ft AGL to 30,000 ft MSL |
| F3 | Cruise | Cruise climb and cruise | 30,000 ft MSL to 50,000 ft MSL @ Mach 0.85 to Mach 0.9 |
| F4 | Descent | Descent to approach altitude | Cruise altitude to between 4,500 ft AGL & 2,500 ft AGL |
| F5 | Approach | Descent to runway threshold | From 4,500/2,500 ft AGL to approximately 50 ft AGL |
| L1 | Landing | Touchdown to full stop | Approximately 914 m (3,000 ft) LFL |
| G2 | Taxi | Taxi to ramp | - |
| G3 | Engine Shutoff | Engine Shutoff | - |
| F6 | Missed Approach | Missed approach procedure | Including 5 minutes of holding time |
| F7 | Cruise/Reserves | IFR reserves | Cruise 370 km (200 nmi) + reserves (VFR/IFR: 30/45 mins) |
Table 3.
Performance Projections of Battery Technologies Presented by Various Publications
| Energy Storage Type |
Specific Energy [Wh/kg] |
Specific Power [W/kg] |
Vol. Energy Density [Wh/L] |
Cycle Life [#] |
||
|---|---|---|---|---|---|---|
| Current | Future | Current | Future | Current | Current | |
| Jet A-1 | 11950 | 9500 | ||||
| Lead-Acid | 50a | 150-300a | 50-100a | 1200-1800a | ||
| Ni-Cd | 60a | 150-200a | 75-150a | 2000-3000a | ||
| Li-ion | 80-200a,h | 400b,c 300d 250e |
1800a | 200-300a | 3000a | |
| Li-po | 130-200a | 3000a | 250a | 1000+a | ||
| Li-air | 400-800a | 600-750b 900-1000d 800-1750e |
400-640f | 180-250a | 10-50a,b | |
| Li-S | 200-700a | 500-650b 600-700b 500-1250e |
750a | 1000g | 180-250a | 100a |
Table 4.
Aerodynamic Model Weight and Size Parameters
| Weights | Miscellaneous | |||
| Max. Take-Off Weight [kg] | 34019 | Installed Thrust (x2) [kN] | 68.95 | |
| Operating Empty Weight [kg] | 18461 | TSFC [g/kN-s] | 15.0 | |
| Max. Fuel Weight [kg] | 14742 | Bypass Ratio | 5.5 | |
| Max. Payload [kg] | 2722 | Ceiling [ft] | 50000 | |
| Payload at Max. Fuel [kg] | 816 | Cabin Volume [m3] | 49.55 | |
| Baggage Volume [m3] | 4.96 | |||
Table 5.
Geometric Parameters Used for the Determination of and
| Wings | Vertical Stabilizer | |||
| Wing Ref. Area, [m2] | 111.48 | V. Stab. Wet. Area, [m2] | 29.26 | |
| Wing Wet. Area, [m2] | 185.81 | Mean V. Stab. Chord, [m] | 3.81 | |
| Mean Wing Chord, [m] | 3.73 | Chordwise Max. Thick., | 0.50 | |
| Chordwise Max. Thickness, | 0.50 | Thickness to Chord Ratio, | 0.09 | |
| Thickness to Chord Ratio, | 0.10 | Max.-Thick. Line Sweep, [∘] | 33 | |
| Max.-Thick. Line Sweep, [∘] | 35 | |||
| Winglet Wet. Area, [m2] | 2.04 | Fuselage | ||
| Wing L.E. Sweep, [∘] | 38 | Fuselage Wet. Area, [m2] | 162.58 | |
| Wingspan [m] | 27.43 | Length, L [m] | 24.38 | |
| Aspect ratio, | 6.75 | Diameter, d [m] | 2.44 | |
| Horizontal Stabilizer | Single-Engine Nacelle | |||
| H. Stab. Wet. Area, [m2] | 48.77 | Nacelle Wet. Area, [m2] | 23.23 | |
| Mean H. Stab. Chord, [m] | 2.29 | Length, L [m] | 4.88 | |
| Chordwise Max. Thick., | 0.50 | Diameter, d [m] | 1.75 | |
| Thickness to Chord Ratio, | 0.095 | |||
Table 6.
Critical Single-Engine Propulsive Power Conditions
| Flight Condition | Power [kW] |
|---|---|
| Sea Level at | 3473 |
| Sea Level at | 13129 |
| Ceiling at | 2920 |
Table 7.
Drivetrain Efficiency Paths for the HEP Architectures
| Drivetrain Path | Series | Parallel |
|---|---|---|
| Fuel to Shaft, | ||
| Battery to Shaft, | ||
| Shaft to Thrust, |
Table 8.
Drivetrain Efficiencies and Specific Powers for Components of the HEP Architectures. Turbofan Specific Power has been Omitted as it can be Calculated Using Eqn. 2
Table 8.
Drivetrain Efficiencies and Specific Powers for Components of the HEP Architectures. Turbofan Specific Power has been Omitted as it can be Calculated Using Eqn. 2
| Component | Efficiency | Sp. Power [kW/kg] |
|---|---|---|
| Turbogenerator, | 0.49 | 13.0 |
| Turbofan, | 0.43 | * |
| Power Converter, | 0.99 | 12.0 |
| Electric Motor, | 0.98 | 9.0 |
| Gearbox, | 0.99 | 100.0 |
| Propulsor Fan, | 0.85 | 30.0 |
Table 9.
Weight Estimate of a Serial Architecture Hybrid-Electric Propulsion System
| Component | Power [kW] | Weight [kg] |
|---|---|---|
| Propulsor Fan | 13129 | 266 |
| Transmission Gearbox | 15445 | 94 |
| Electric Motor | 15601 | 1054 |
| Power Converter | 15919 | 807 |
| Turbogenerator | 16081 | 752 |
| Total Weight | - | 2973 |
Table 10.
Weight Estimate of a Parallel Architecture Hybrid-Electric Propulsion System
| Component | Power [kW] | Weight [kg] |
|---|---|---|
| Transmission Gearbox | 3281 | 67 |
| Electric Motor | 3315 | 224 |
| Power Converter | 3403 | 171 |
| Turbofan | 13129 | 1449 |
| Total Weight | - | 1911 |
Table 11.
Two Engine Weight Modification to the Available Energy Weight as a Result of Power Train Electrification
Table 11.
Two Engine Weight Modification to the Available Energy Weight as a Result of Power Train Electrification
| Architecture | Weight [kg] | Weight [kg] | Energy Weight [kg] |
|---|---|---|---|
| Turbofan | 2894 | 0 | 14742 |
| Series | 5947 | 3053 | 11689 |
| Parallel | 3823 | 929 | 13813 |
Table 12.
Range for HEP Architectures Against Hybridization Levels, with = 1,000 Wh/kg.
| Hybridization Ratio |
Series Range [km (nmi)] |
Reduction [%] |
Parallel Range [km (nmi)] |
Reduction [%] |
|---|---|---|---|---|
| 0.025 | 7819 (4222) | 23.17% | 8823 (4764) | 13.31% |
| 0.050 | 6271 (3386) | 38.39% | 7082 (3824) | 30.43% |
| 0.100 | 4443 (2399) | 56.36% | 5024 (2713) | 50.64% |
| 0.200 | 2700 (1458) | 73.48% | 3063 (1654) | 69.90% |
| 0.300 | 2211 (1194) | 78.28% | 2522 (1362) | 75.21% |
| 0.400 | 1729 (934) | 83.01% | 1982 (1070) | 80.52% |
| 0.500 | 1415 (764) | 86.10% | 1630 (880) | 83.99% |
Table 13.
Battery Weight and Volume for the Series and Parallel Architectures
| Parameter | Series | Parallel |
|---|---|---|
| Battery Weight [kg] | 4499 | 5317 |
| Fuel Weight [kg] | 7190 | 8496 |
| Battery Volume [m3] | 12.50 | 14.77 |
| Fuel Volume [m3] | 9.00 | 10.63 |
| Volume [m3] | 6.87 | 10.77 |
Table 14.
Energy Consumption for a 5,556 km (3,000 nmi) Mission with and Wh/kg
| Parameter | Turbofan | Series | Parallel |
|---|---|---|---|
| Fuel Mass Consumption [kg] | 7281 | 6685 | 6434 |
| Battery Energy Consumption [kWh] | - | 2049 | 1901 |
| Total Energy Consumption [kWh] | 86555 | 81524 | 78388 |
| Energy SAR [km/kWh] | 0.0642 | 0.0682 | 0.0709 |
Disclaimer/Publisher’s Note: The statements, opinions and data contained in all publications are solely those of the individual author(s) and contributor(s) and not of MDPI and/or the editor(s). MDPI and/or the editor(s) disclaim responsibility for any injury to people or property resulting from any ideas, methods, instructions or products referred to in the content. |
© 2025 by the authors. Licensee MDPI, Basel, Switzerland. This article is an open access article distributed under the terms and conditions of the Creative Commons Attribution (CC BY) license (http://creativecommons.org/licenses/by/4.0/).
Copyright: This open access article is published under a Creative Commons CC BY 4.0 license, which permit the free download, distribution, and reuse, provided that the author and preprint are cited in any reuse.


