Submitted:
06 August 2025
Posted:
07 August 2025
You are already at the latest version
Abstract
Objective: This study aims to evaluate the effects of creatine supplementation and glycogen loading on strength development, muscle hypertrophy, and adiposity in collegiate students. Methods: Twelve male students from the Central University of Punjab, Bathinda, were randomly assigned to three groups: creatine supplementation, glycogen loading, or control. Each group participated in a 6-week structured weight training program to assess its impact on strength, muscle hypertrophy, and adiposity. Results: One-way ANOVA revealed that the glycogen loading group exhibited significantly greater upper body strength gains compared to the creatine supplementation and control groups. Conversely, the creatine supplementation group demonstrated superior lower body strength improvements compared to the glycogen loading and control groups. No significant differences were observed in muscle hypertrophy or adiposity across the groups. Conclusion: Glycogen loading enhances upper body strength, while creatine supplementation improves lower body strength. Further research with a larger sample size or additional variables is warranted to validate these findings.
Keywords:
glycogen loading
; creatine supplementation
; resistance training
; muscle hypertrophy
; adiposity
; muscular strength
Introduction
Physical fitness is vital for human well-being and survival (Kumar et al., 2024). It offers numerous benefits, including enhanced physical and mental health, stronger immunity, improved metabolism, and greater stamina (Albrecht et al., 2023; Mr. Dinesh et al., 2024). Various physical activities and training can enhance fitness components (Mr. Dinesh et al., 2024; Physical Education and Sports, Hellenic Naval Academy, 2023). Nutritional health, reflected in physical appearance, depends on essential nutrients that protect against illness (Akhter Ali et al., 2017). Exercise and nutrition are critical for building fitness and strength. Weight training, which uses resistance to strengthen muscles, is a key method for improving overall fitness and health (Dinesh et al., 2024). It involves free weights, machines, or body weight to increase muscle strength, size, and endurance (Desai et al., 2024b; Tinôco et al., 2023). Carbohydrate loading, a strategy used by athletes, boosts muscle glycogen stores for energy during intense or prolonged exercise by consuming a diet high in carbohydrates (>80% of calories) (Forbes et al., 2023; Desai et al., 2024). Creatine supplementation, popular among athletes, supports performance by increasing ATP availability, enhancing muscle power, reducing fatigue, improving recovery, and boosting training capacity (Barranco-Gil et al., 2024; Deminice et al., 2013; Desai et al., 2024; Forbes et al., 2023).
Materials and Methods
Subjects in the Study
Twelve healthy male participants (age: 23.91 ± 0.41 years, weight: 70.16 ± 1.42 kg, height: 174.97 ± 1.41 cm) from the Central University of Punjab, Bathinda, India, were randomly selected for the study. None were engaged in regular physical activity. All participants provided written informed consent prior to inclusion.
Experimental Design
A pre-test and post-test randomized group design was used.
Procedure of Data Collection
The selected subjects was randomly assigned (using the online research randomizer tool available at http://www.random.org) to different groups, i.e., creatine monohydrate supplementation (CRE; n=4), a glycogen loading group (GLY; n=4), and a control group (CON; n=4). All three groups went through a 6-week structured weight training program along with interventions. During the training period, all 12 subjects (N=12) underwent a training period of 5 days a week, training for 6 weeks. The subjects were tested on selected variables before the commencement of the training program baseline at (0 weeks), and post-intervention (6 weeks).To measure the maximum strength of upper body muscle groups, a 1RM bench press is taken using a bench with safety, and to measure the maximum strength of lower body muscle groups 1RM squat is taken using a Squat rack with safety. The subjects were asked to do an adequate warm-up on their own. Under the supervision of the tester, subjects performed the maximum no. of repetitions until failure with the selected sub-maximum weight. The weight and number of repetitions performed by subjects were recorded, and scoring was done using Brzycki’s equation 1RM (Weight)÷ (102.78 - (2.78 x Reps).
Supplementation protocol
The Experimental Group 1, i.e., the creatine supplementation group, will receive a 3-gram micronised Creatine monohydrate supplement pre-workout, the second experimental group, i.e., the Glycogen (Carbohydrate) loading group, will consume 450 grams of boiled potatoes every day before dinner, and the control group will not receive any supplement and will go through weight training alone.
Variables and Tests Used

Table 2.
1. Instruments used for measuring Variables along with measuring Units.
| S. No | Variables | Test items | Unit of measurement |
| 1. | Maximum Strength of upper body | 1RM Bench Press | in Kg |
| 2. | Maximum Strength of Lower Body | 1RM Squat | in Kg |
| 3. | Muscle hypertrophy | % Skeletal mass | In % |
| 4. | Adiposity | % Body fat | In % |
Statistical Analysis
The data were analyzed using SPSS version 25, the Shapiro-Wilk test was applied to test the normality assumption of the data, and Levene's test was used to test the homogeneity of variance for the dependent variables between experimental and control groups. One-way ANOVA was used to compare the adjusted mean scores of dependent variables of experimental and control groups, and the post-hoc LSD test was applied at a 0.05 level of significance.
Results
The significant F-value (p = 0.012) suggests that at least one group has a significantly different upper body strength compared to the others. Table 3.2 involves post hoc analysis (LSD test) to identify which group differs.
Table 3.
1. Summary of One-Way Analysis of Variance (ANOVA) of Maximum Strength of Upper Body among different groups.
Table 3.
1. Summary of One-Way Analysis of Variance (ANOVA) of Maximum Strength of Upper Body among different groups.
| Source of variance |
df | SS | MS | f-Value | Sig. |
| Between Group | 2 | 351.167 | 175.583 | 7.616 | 0.012 |
| Within Group | 9 | 207.500 | 23.056 | ||
| Total | 11 | 558.667 |
Table 3.
2. Post Hoc LSD statistics of the Maximum Strength of the upper body of the three groups.
| Variable | Groups | Mean Difference | Std. Error | Sig. | |
|
Maximum Strength of Upper Body |
Creatine supplement | Glycogen loading | 9.5 | 3.40 | .020 |
| Glycogen Loading |
Control | 12.75 | 3.40 | .048 | |
| Creatine Supplement |
Control | 3.25 | 3.40 | .020 | |
*Significant at 0.05 level.
The one-way ANOVA revealed a statistically significant difference in upper body strength across groups (p = 0.012). Post-hoc analysis demonstrated the following: The Creatine Supplementation group exhibited significantly lower mean maximum upper body strength compared to the Glycogen Loading group (MD =9.50, p =0.020). The Glycogen Loading group showed significantly higher mean maximum strength relative to the Control group (MD = 12.75, p = 0.048). The Creatine Supplementation group had significantly higher mean maximum strength than the Control group (MD = 3.25, p = 0.020).
These findings indicate a hierarchical relationship in efficacy: Glycogen Loading > Creatine Supplementation > Control, with both intervention groups surpassing the control in enhancing upper body strength, though Glycogen Loading yielded superior outcomes compared to Creatine.
Figure 1.
pre-mean scores of 1RM bench press.
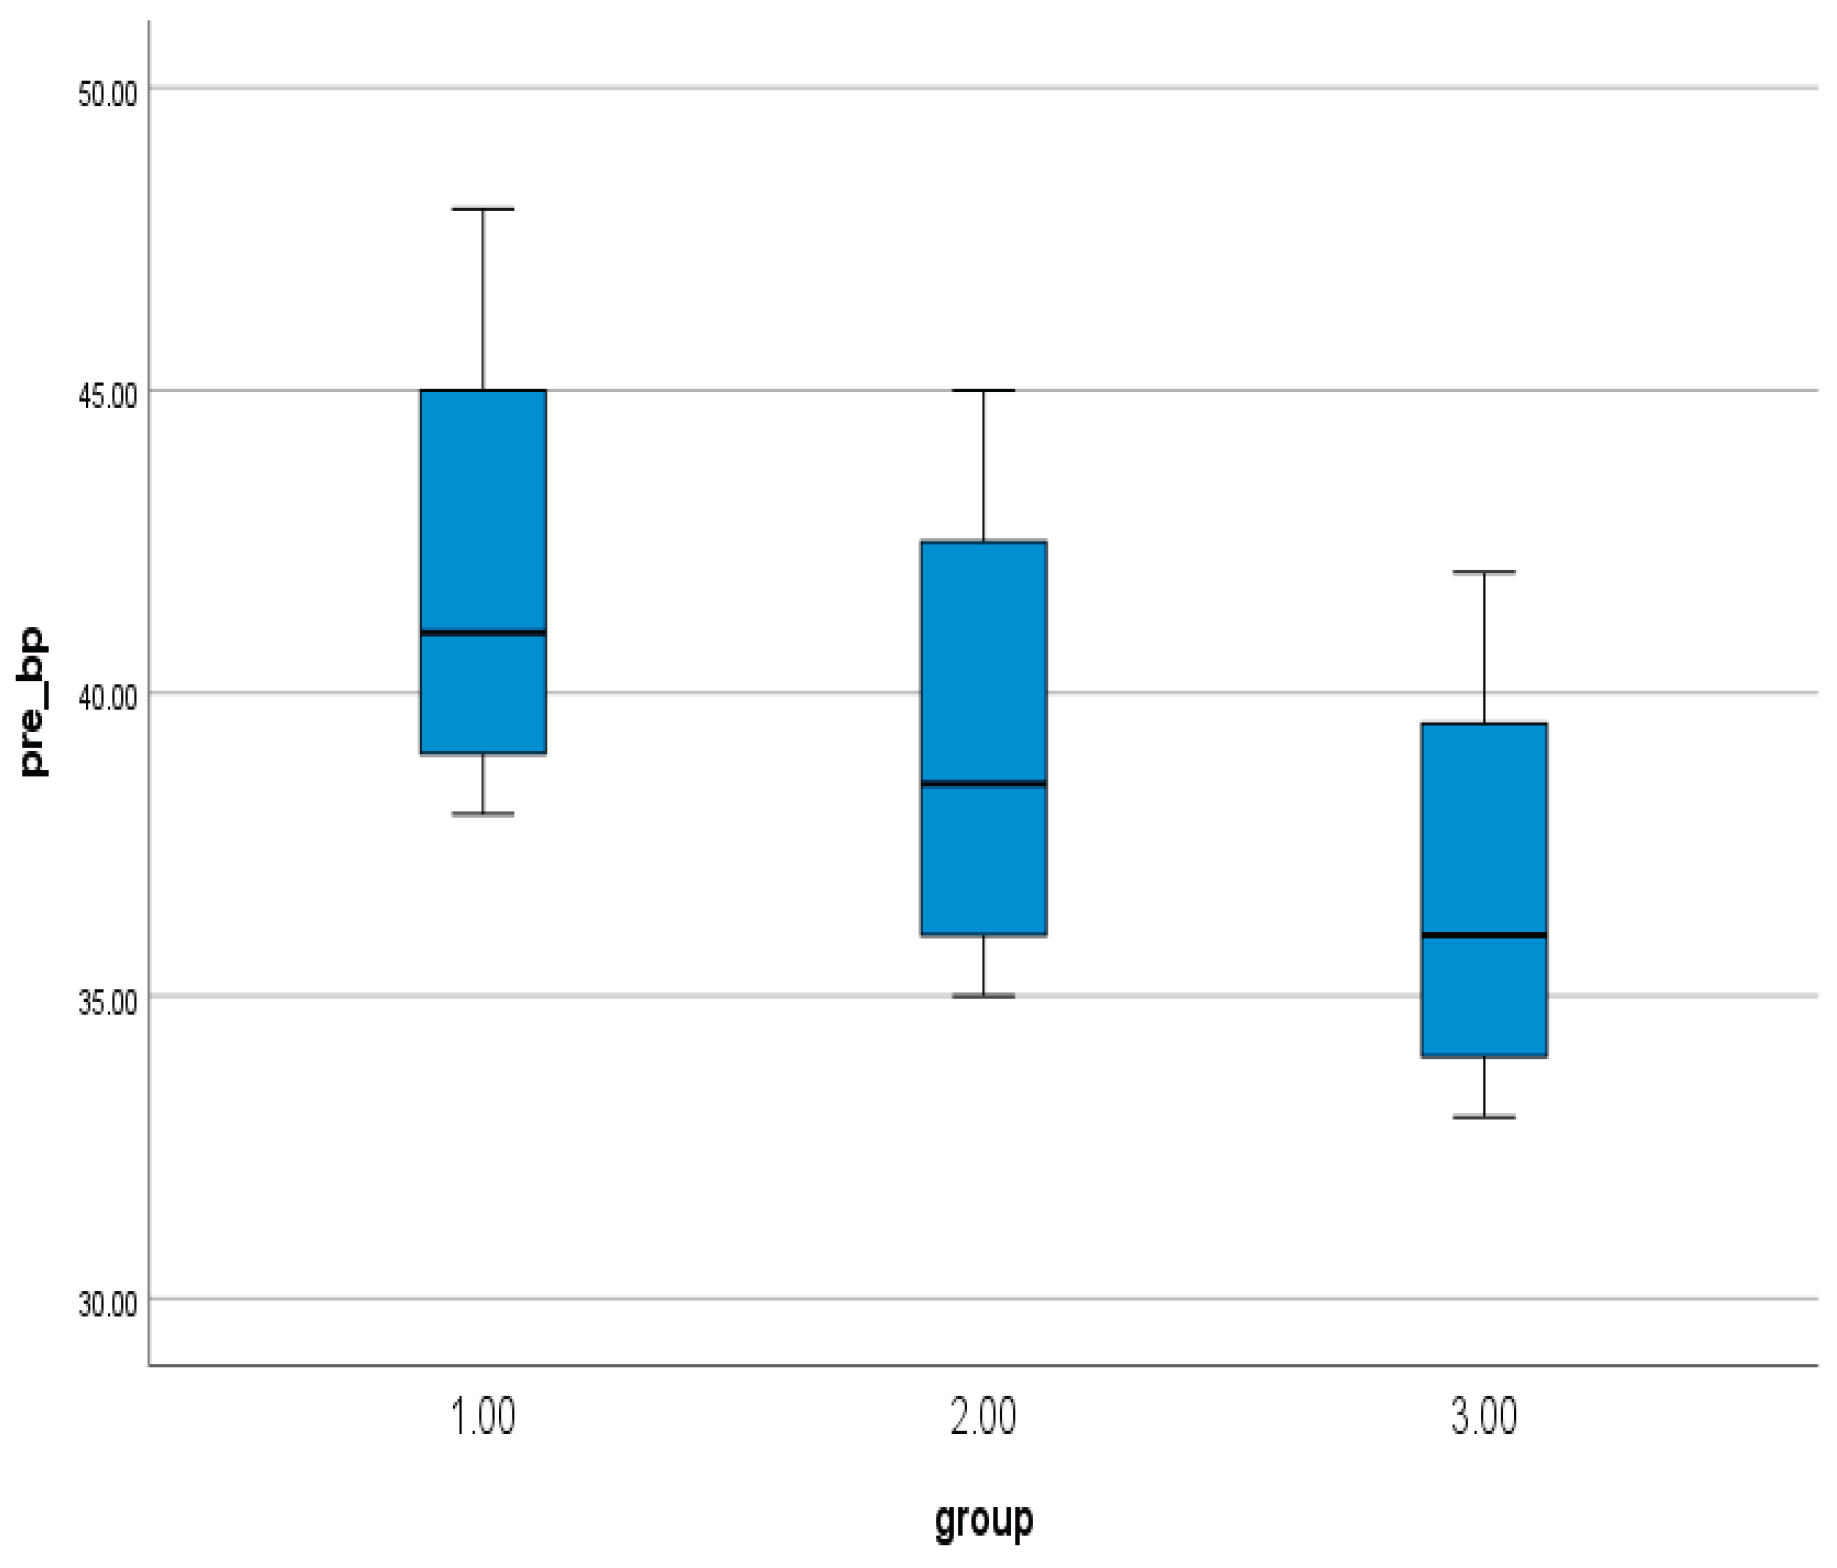
Figure 2.
post-mean scores of 1RM bench pre.
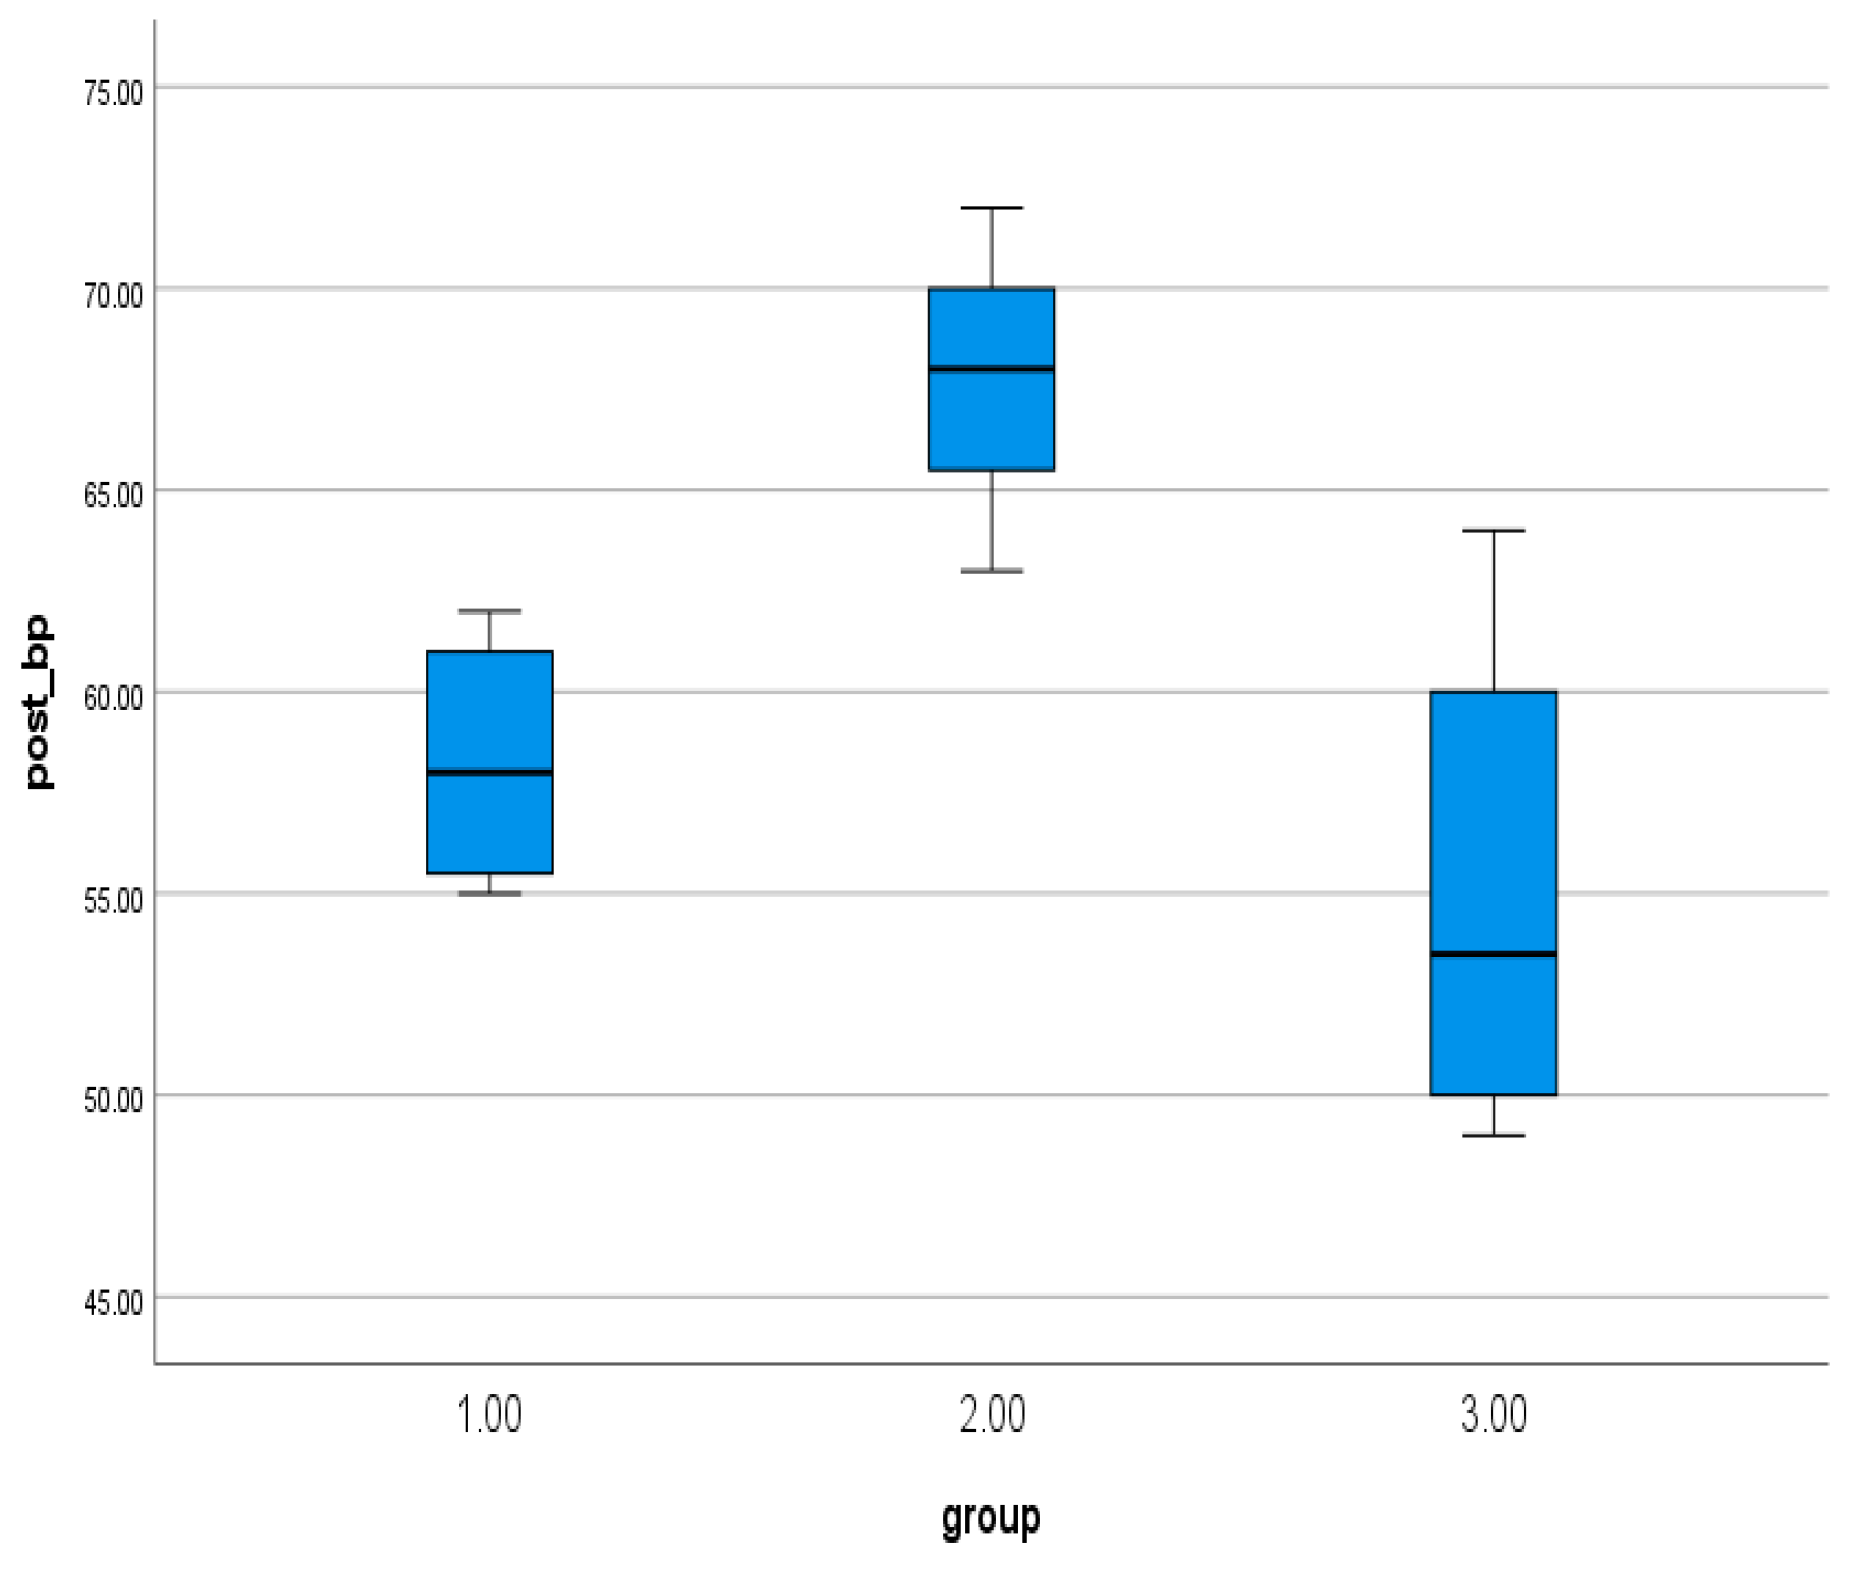
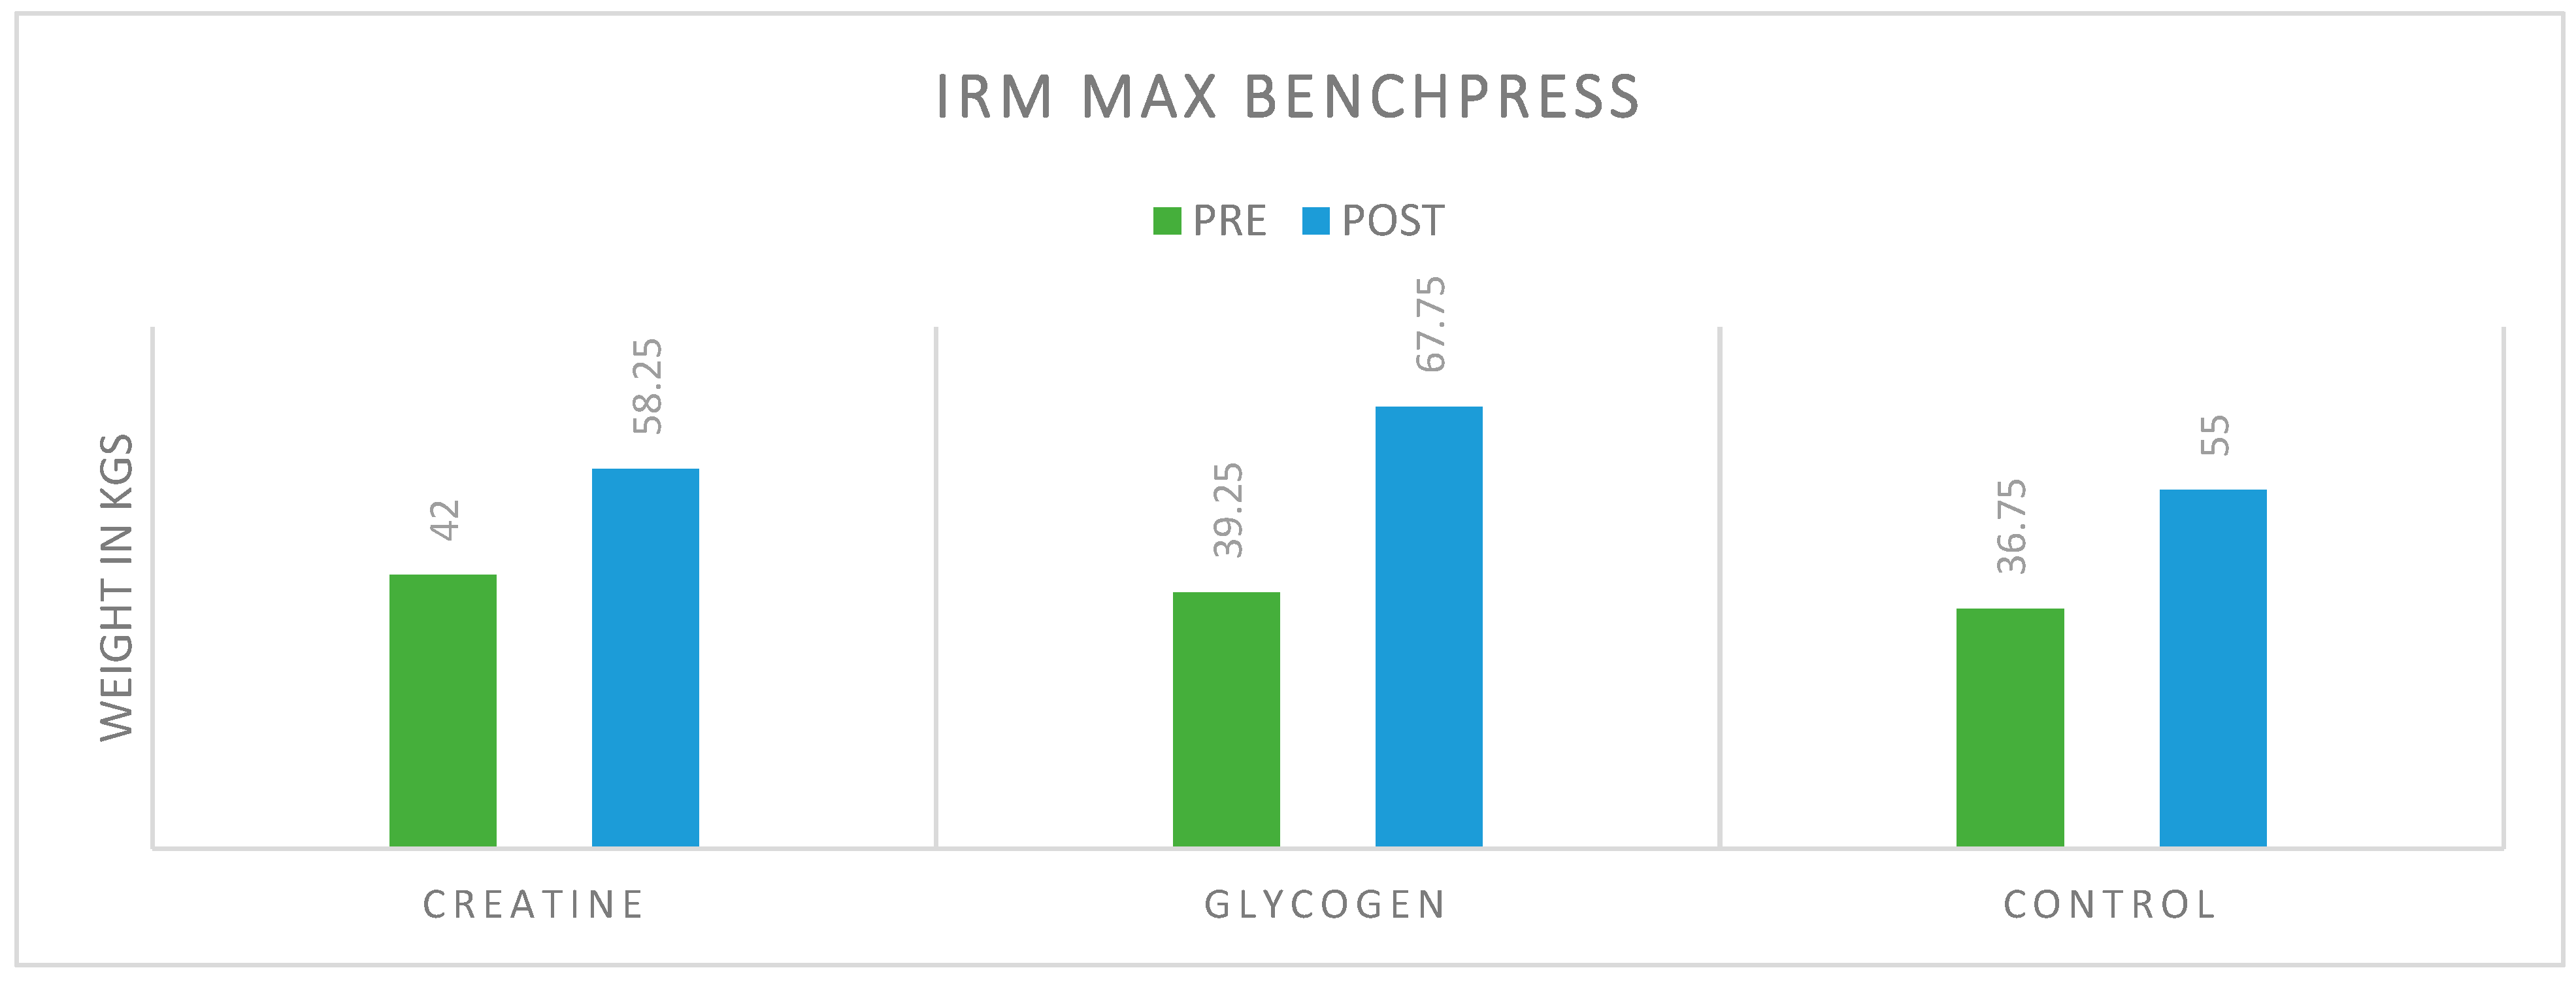
Figure 3.
Comparison of pre-post performance of 1RM Bench press.
Strength of Lower Body among different group
The results of the ANOVA Table 3.3 indicate a highly significant difference in upper body strength among the three groups. Table 3.4 involves post hoc analysis (LSD test) to identify which group differs.
Table 3.
3. Summary of One-Way Analysis of Variance (ANOVA) of Maximum.
| Source of variance |
df | SS | MS | f-Value | Sig. |
| Between Group | 2 | 4056.00 | 2028.00 | 31.18 | .000 |
| Within Group | 9 | 585.27 | 65.03 | ||
| Total | 11 | 4641.27 |
Table 3.
4. Post Hoc LSD Statistics of Maximum Strength of the Lower Body of three Groups.
| Variable | Groups | Mean Difference | Std. Error | Sig. | |
|
Maximum Strength of Lower Body |
Creatine Supplement |
Glycogen Loading |
22.28 | 4.31 | .000 |
| Glycogen Loading |
Control | 11.14 | 4.31 | .047 | |
| Creatine Supplement |
Control | 33.42 | 4.31 | .000 | |
*Significant at 0.05 level.
The one-way ANOVA revealed a statistically significant difference in lower body strength across groups (p = 0.000). Post-hoc analysis demonstrated the following: The Creatine Supplementation group exhibited significantly higher mean maximum upper body strength compared to the Glycogen Loading group (MD = 22.28, p = 0.000). The Glycogen Loading group showed significantly higher mean maximum strength relative to the Control group (MD = 11.14, p = 0.047). The Creatine Supplementation group had significantly higher mean maximum strength than the Control group (MD = 33.42, p = 0.000). These findings indicate a hierarchical relationship in efficacy: Creatine Supplementation > Glycogen Loading > Control, with both intervention groups surpassing the control in enhancing upper body strength, though the creatine group yielded superior outcomes compared to glycogen loading.
Figure 4.
pre-mean scores of 1RM Squat.
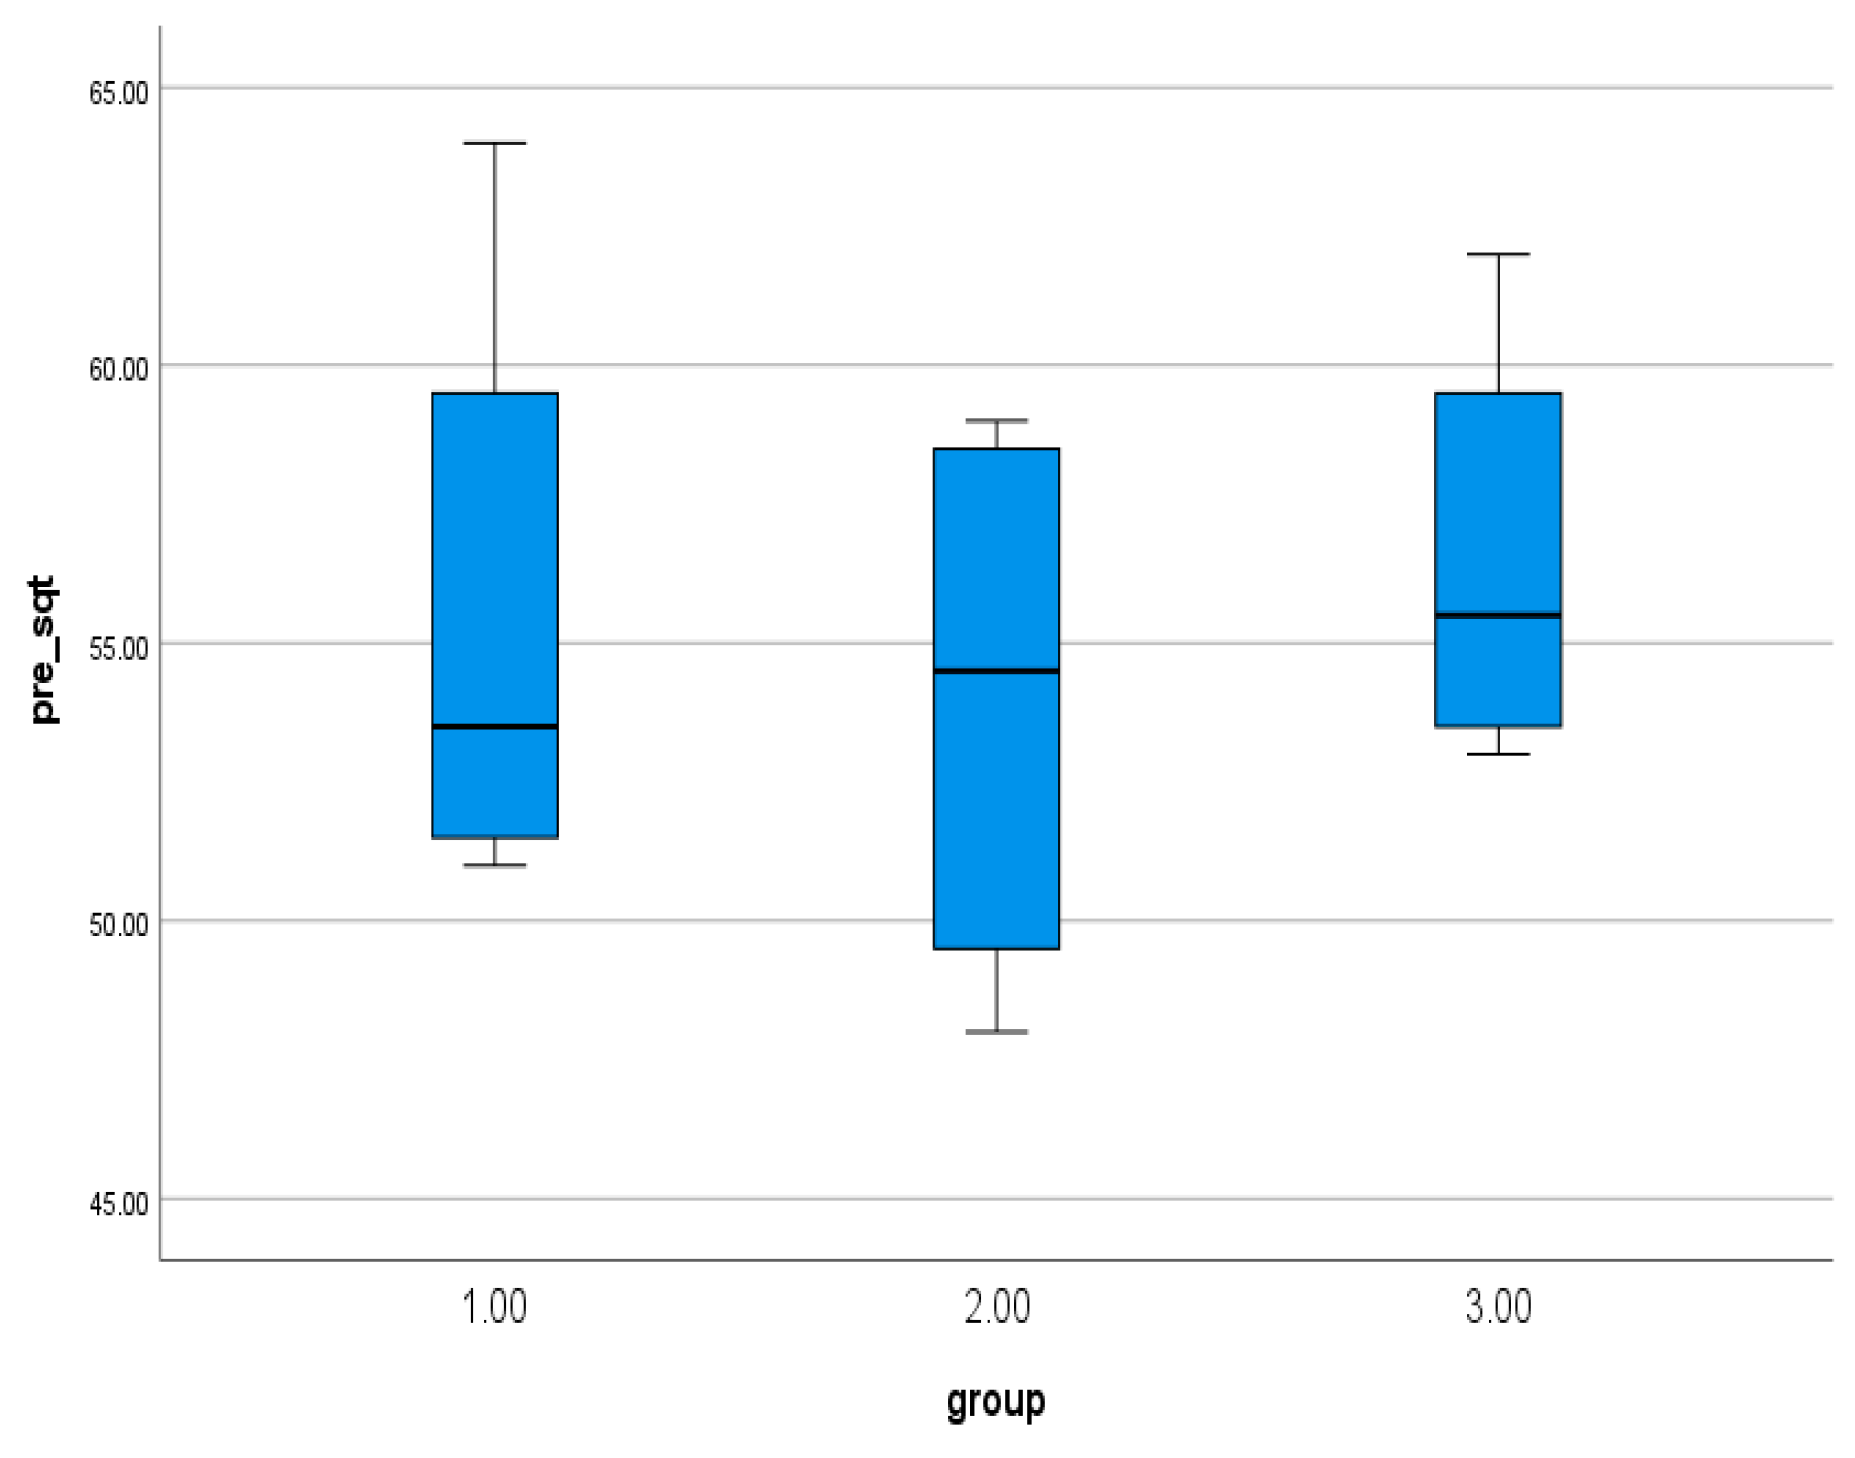
Figure 5.
post-mean scores of 1RM Squat.
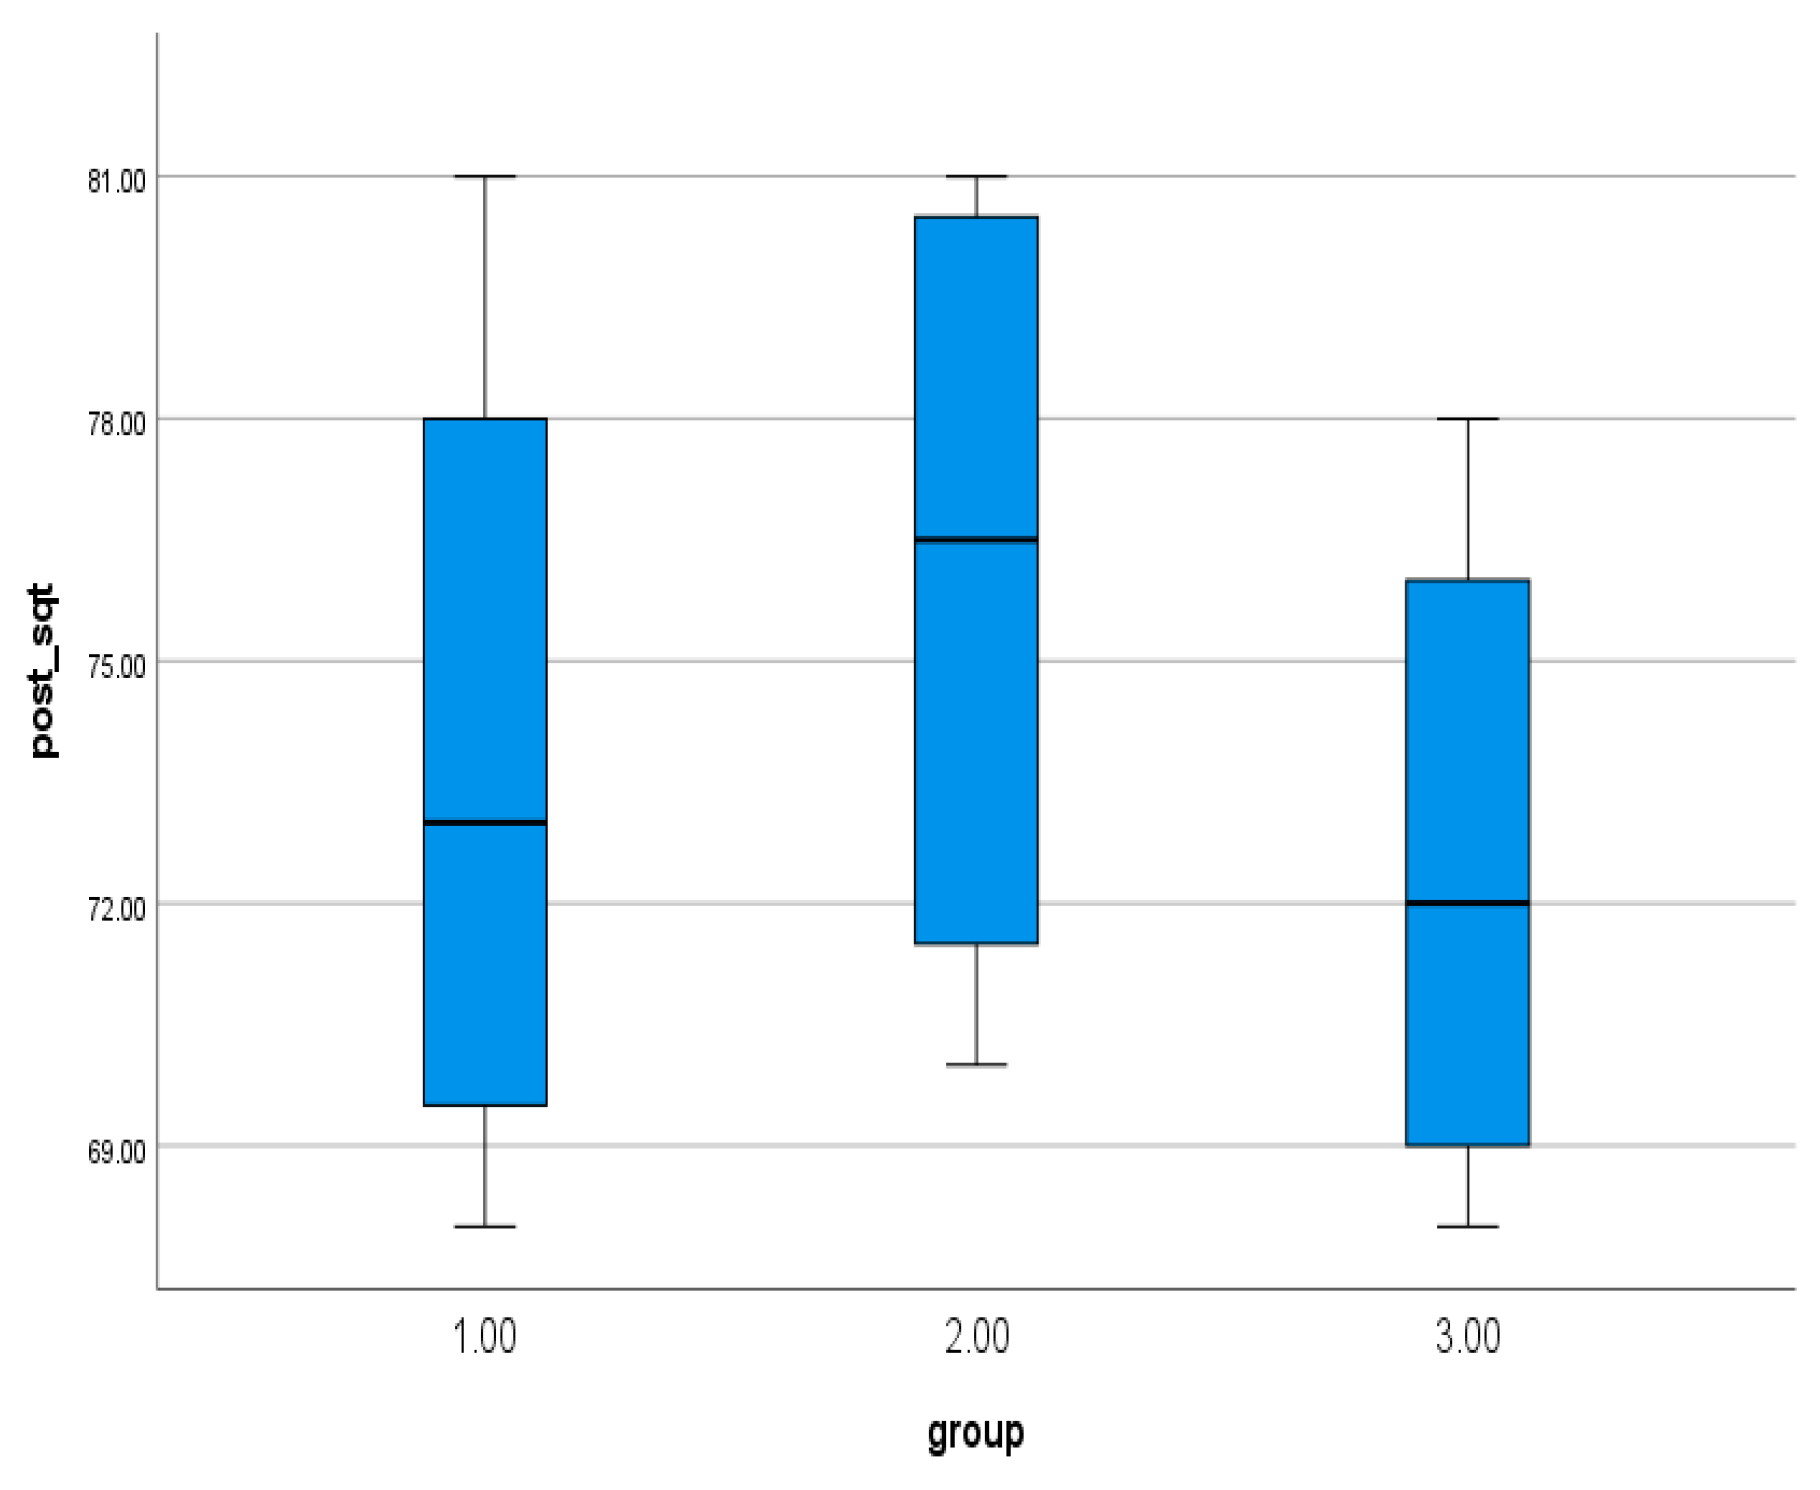
Figure 6.
Comparison of pre-post performance of 1RM Squat.
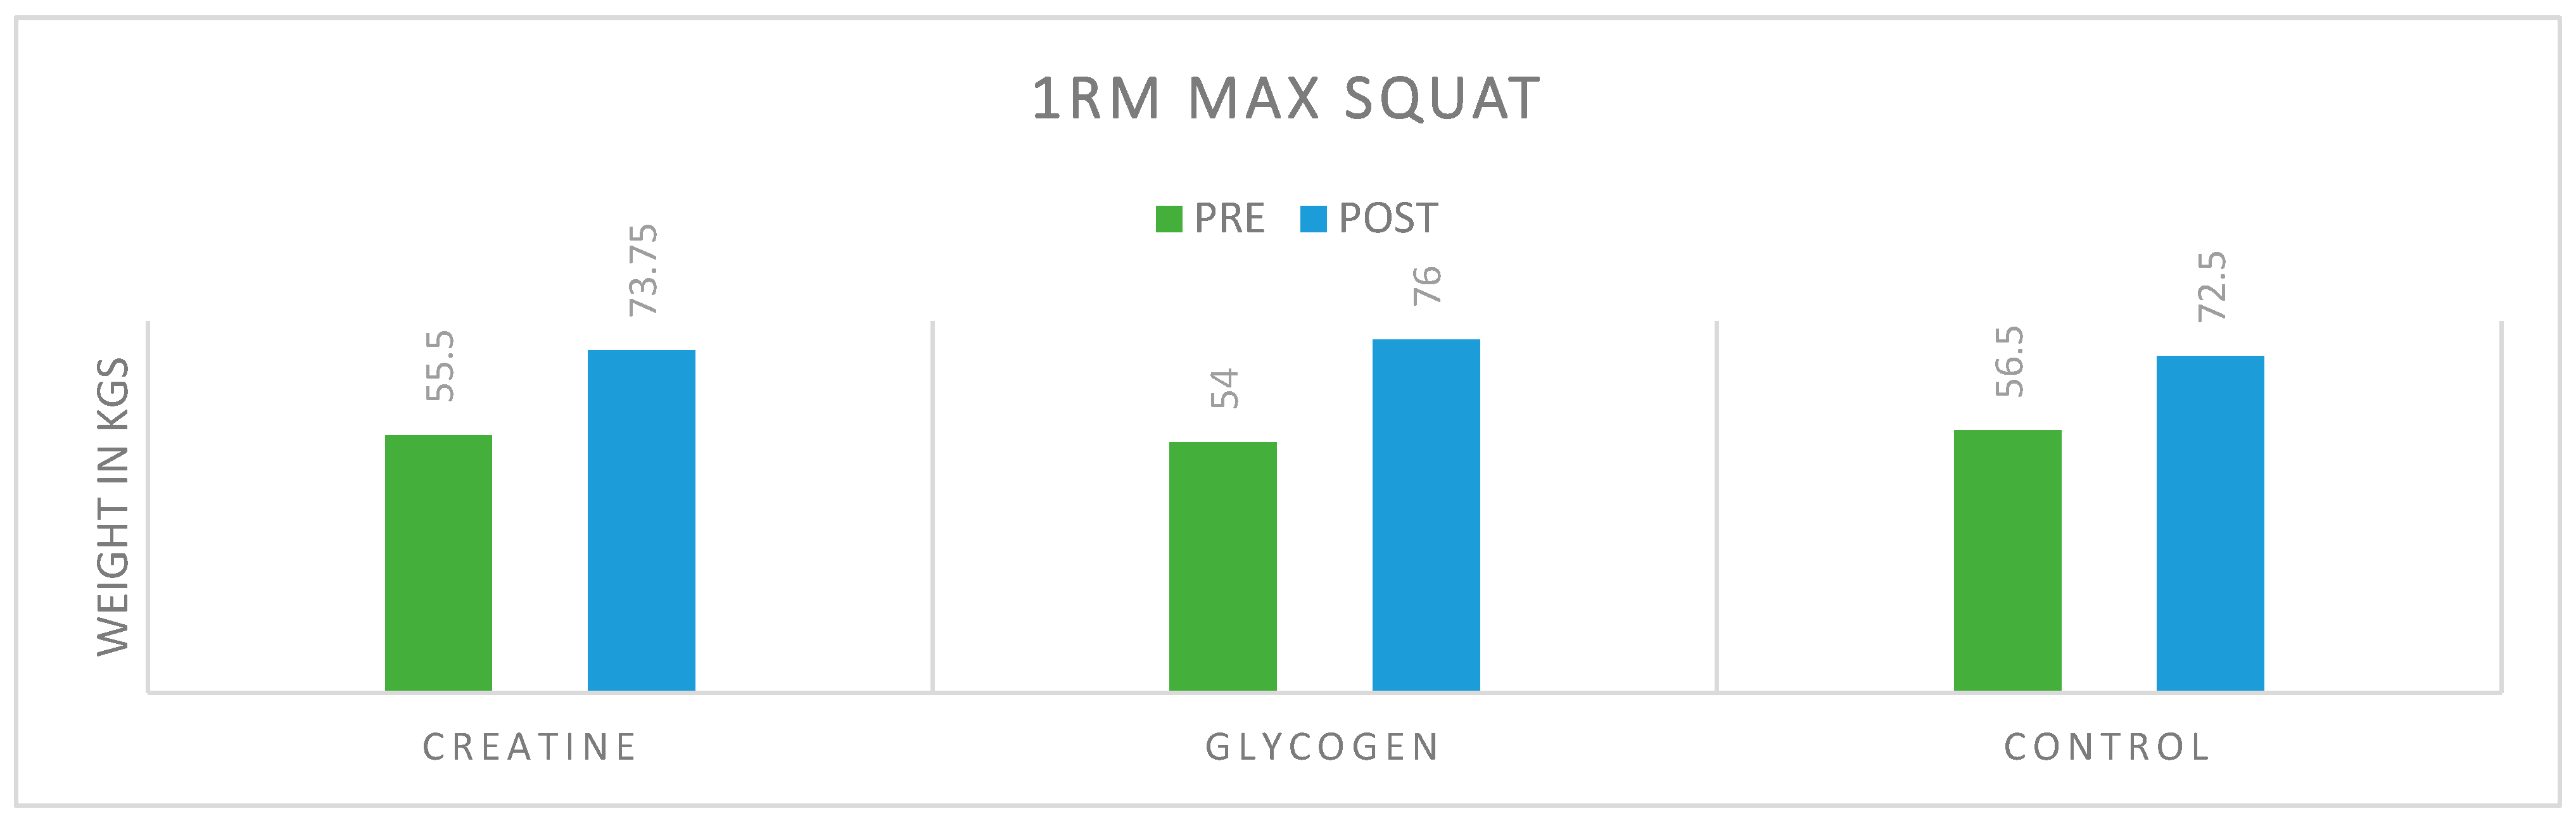
Table 3.
5. Summary of One-Way Analysis of Variance (ANOVA) of Skeletal Muscle Mass among different group.
Table 3.
5. Summary of One-Way Analysis of Variance (ANOVA) of Skeletal Muscle Mass among different group.
| Source of variance |
df | SS | MS | f-Value | Sig. |
| Between Group | 2 | 34.88 | 17.44 | 0.90 | 0.44 |
| Within Group | 9 | 174.16 | 19.35 | ||
| Total | 11 | 209.04 |
The one-way ANOVA results indicate no significant difference in the skeletal muscle mass among the different groups (F=0.90, p=0.44); since the p-value is greater than the conventional significance level of 0.05, we fail to reject the null hypothesis. This suggests that any observed variation in skeletal muscle mass between the groups is likely due to random chance rather than an actual effect.
Figure 7.
pre-mean scores of skeletal muscle mass.
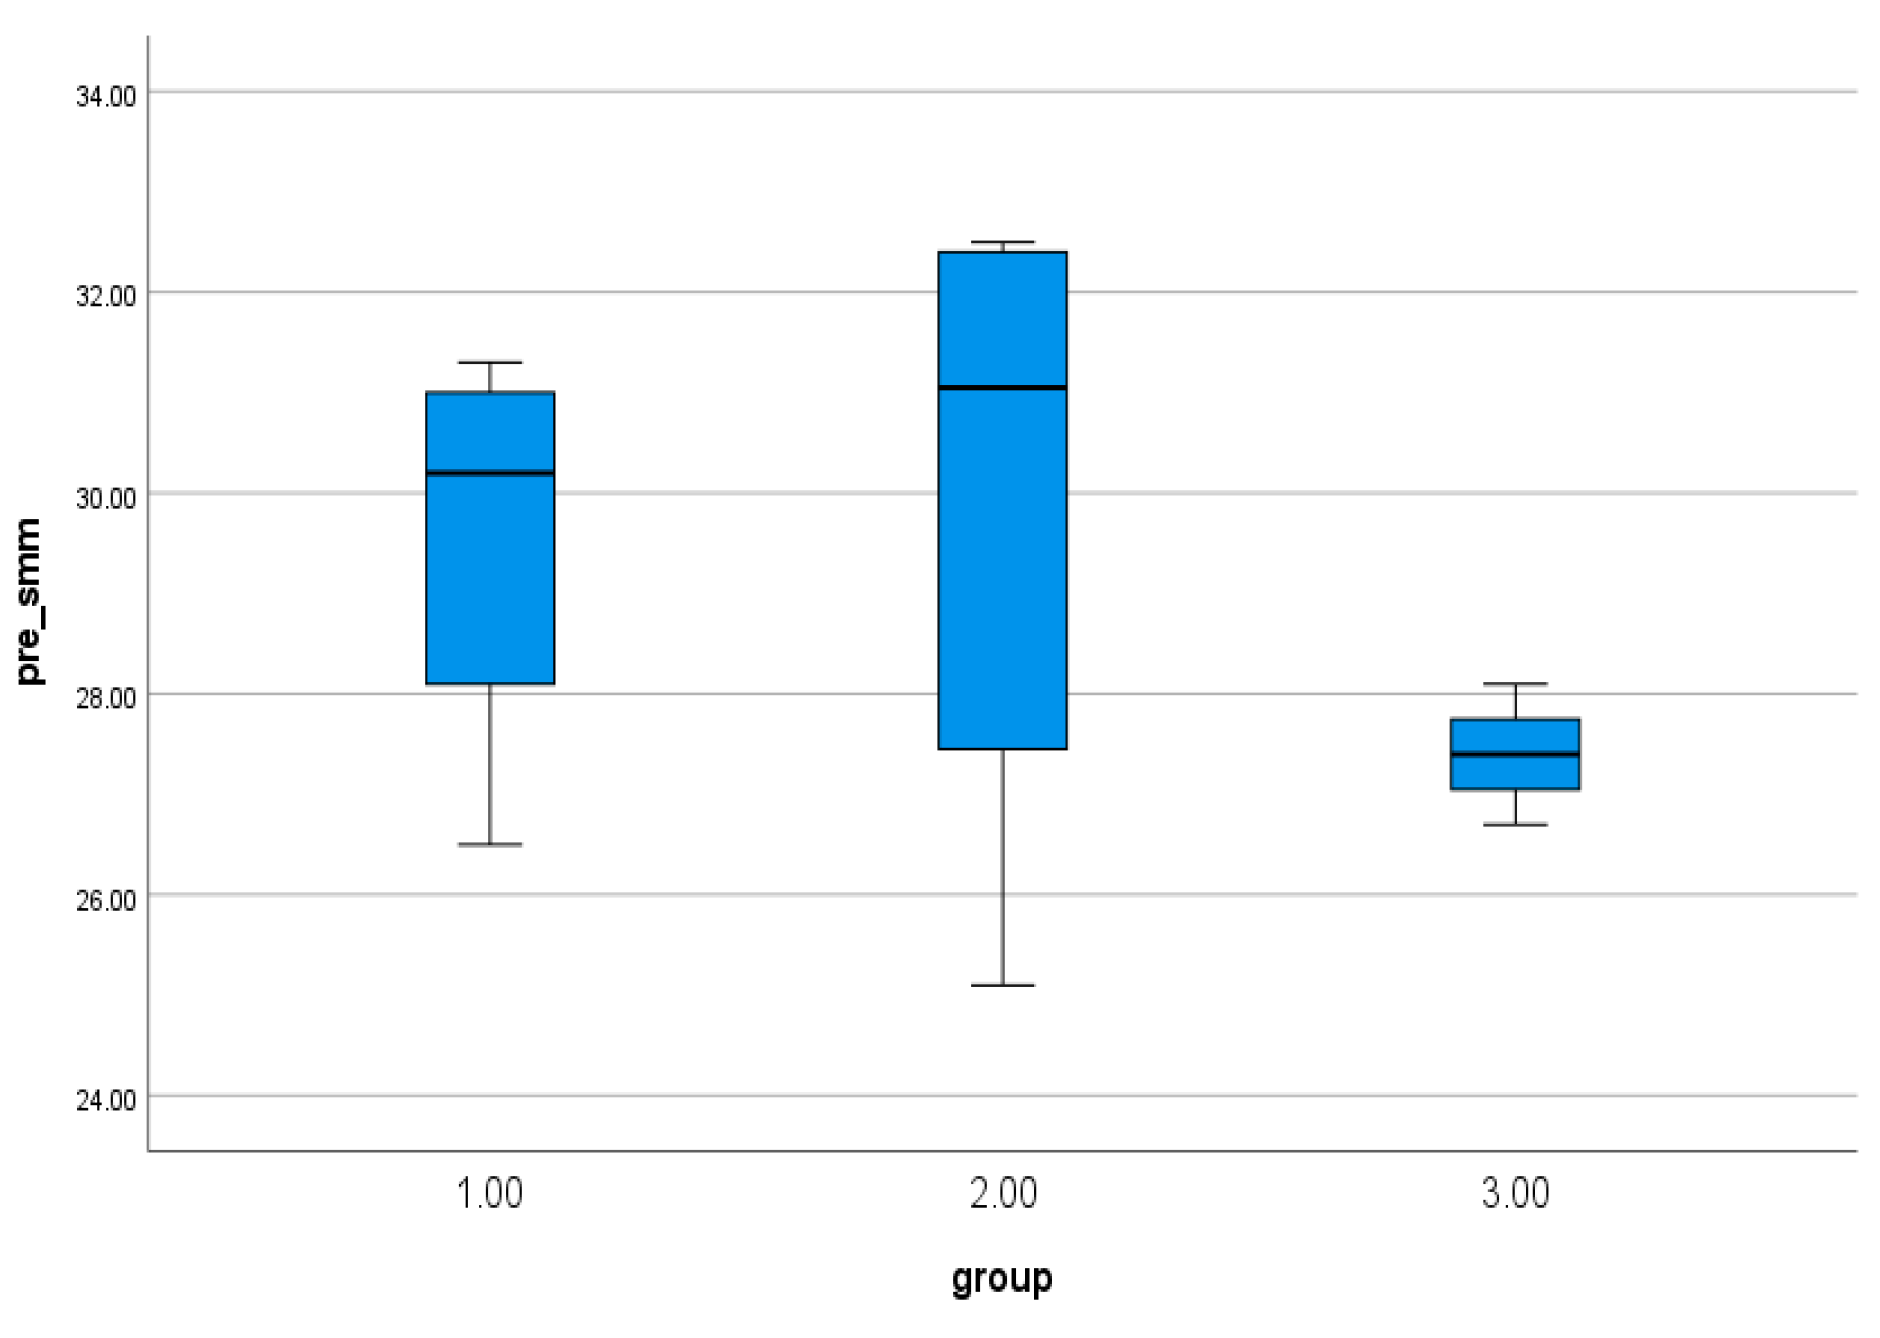
Figure 8.
post-mean scores of skeletal muscle mass.
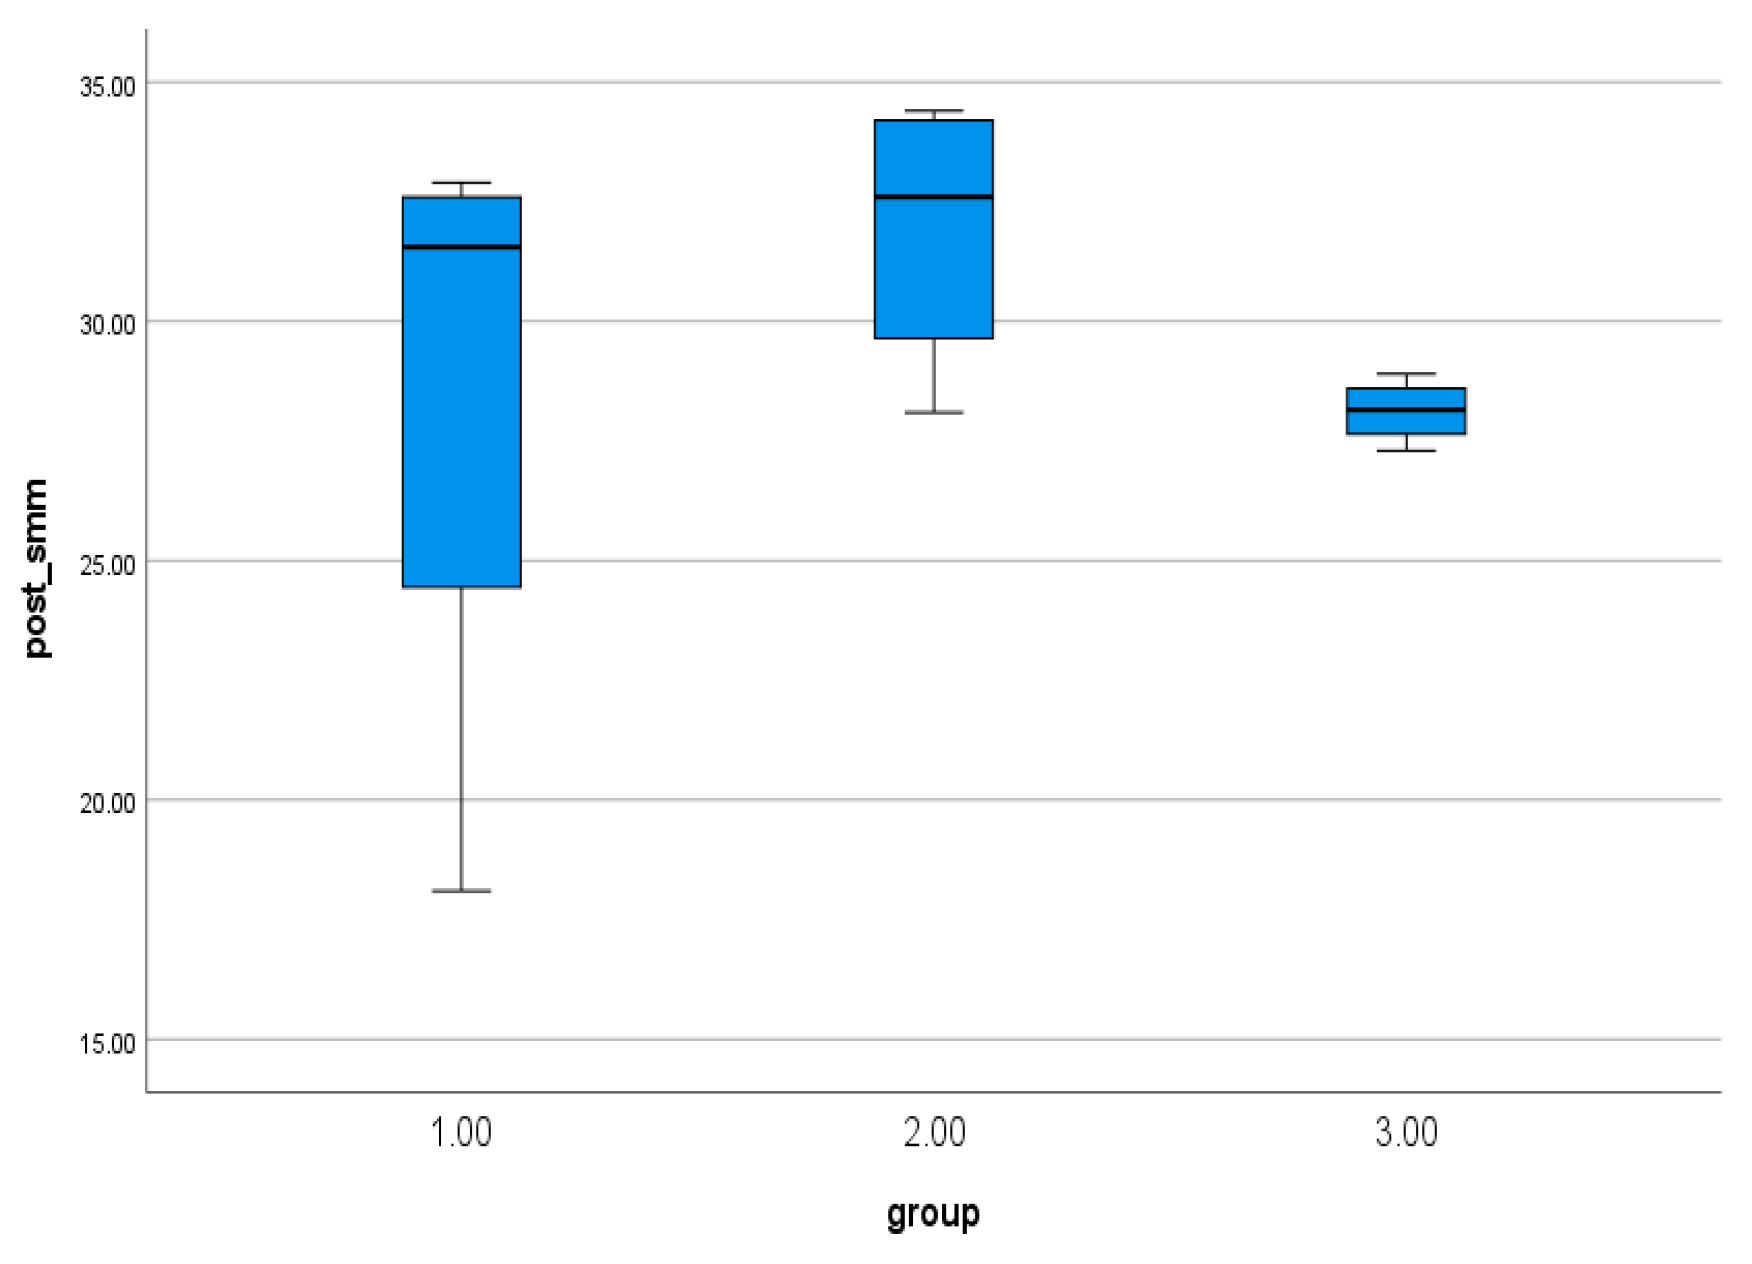
Figure 9.
Comparison of pre-post performance of 1RM Bench press of all three groups.
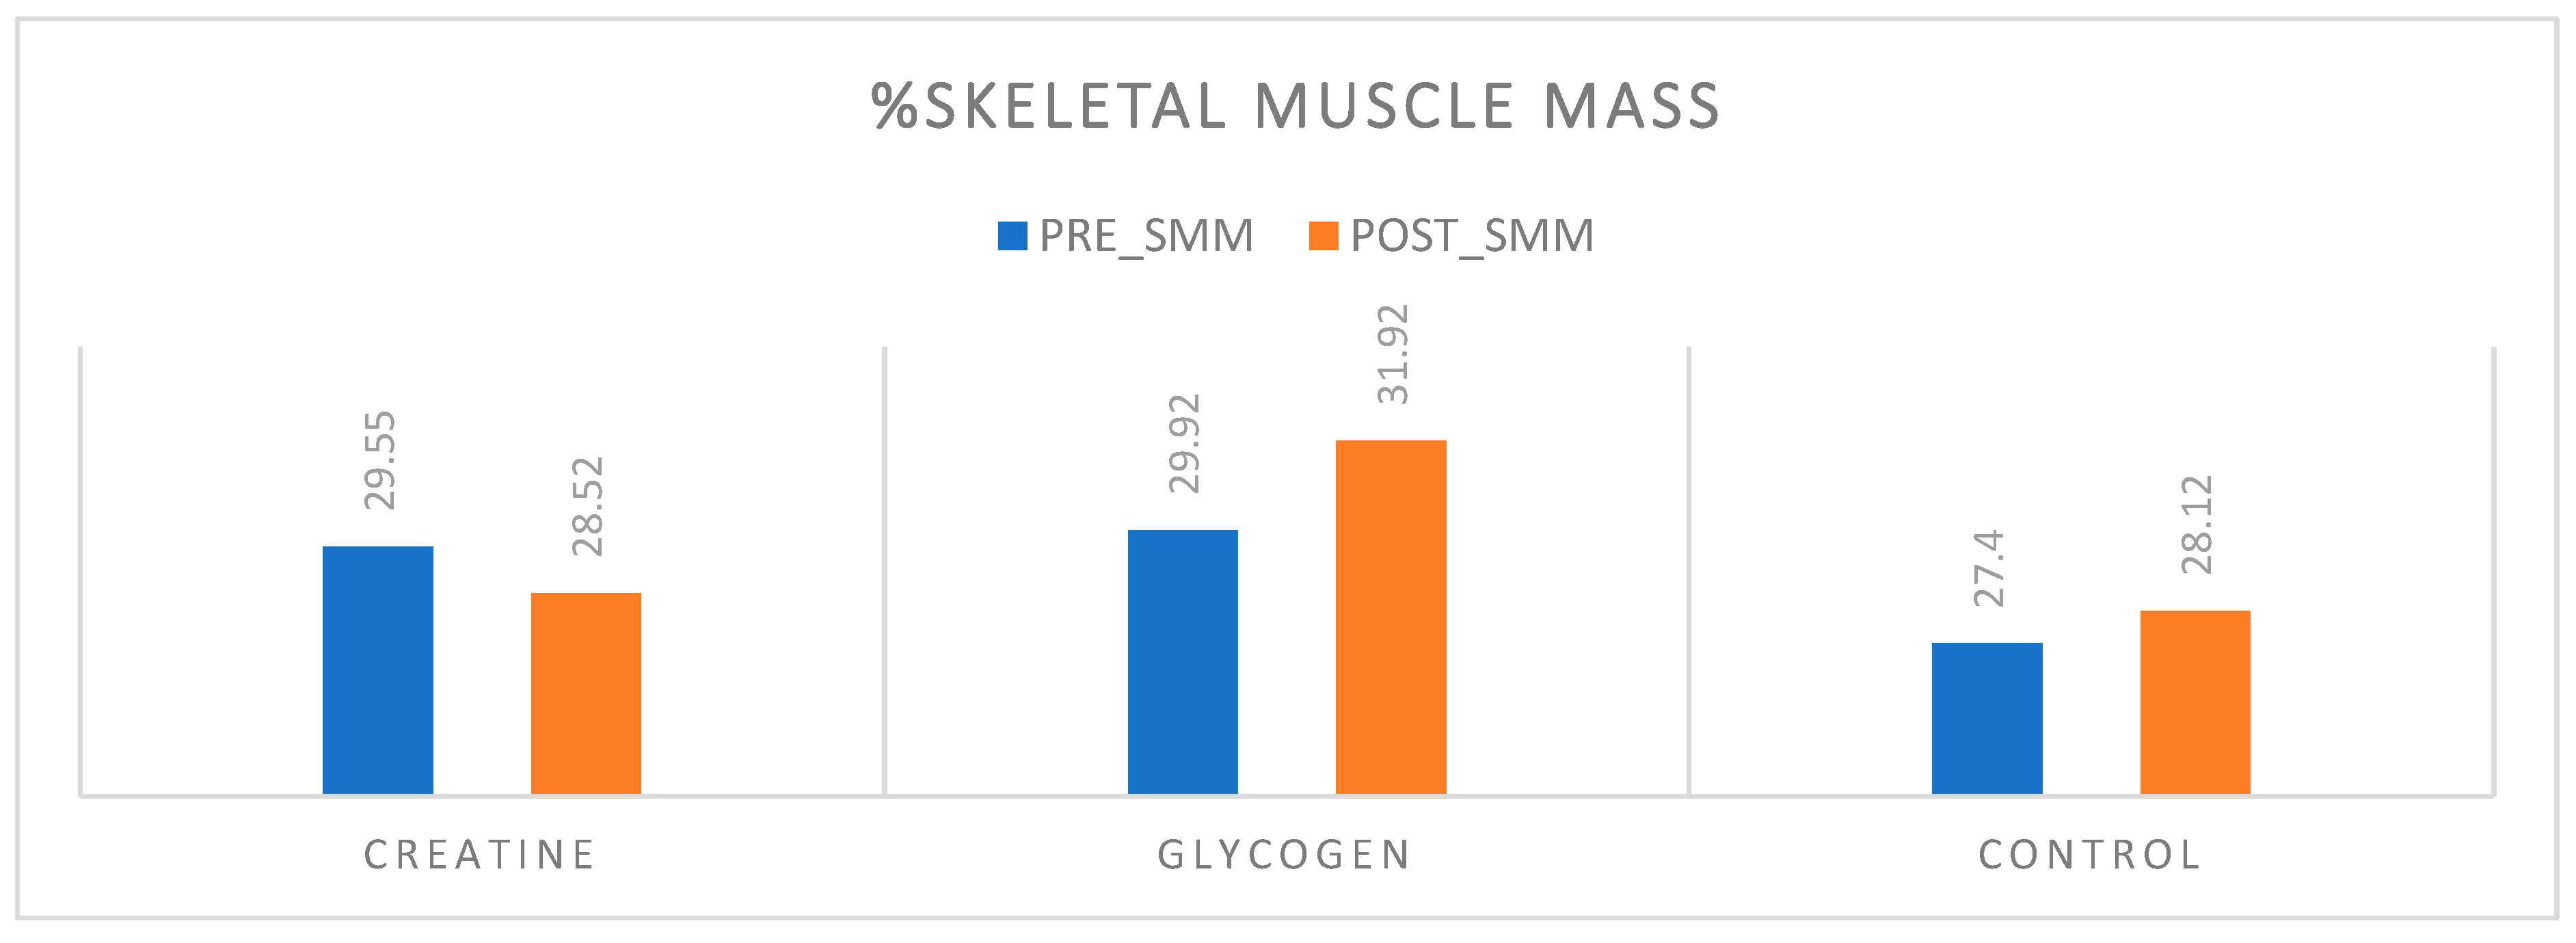
Table 3.
6. Summary of One-Way Analysis of Variance (ANOVA) of Body Fat Mass among different groups.
Table 3.
6. Summary of One-Way Analysis of Variance (ANOVA) of Body Fat Mass among different groups.
| Source of variance |
df | SS | MS | f-Value | Sig. |
| Between Group | 2 | 9.252 | 4.626 | 0.90 | 0.44 |
| Within Group | 9 | 46.225 | 5.136 | ||
| Total | 11 | 55.477 |
The one-way ANOVA results indicate no significant difference in the skeletal muscle mass among the different groups (F=0.90, p=0.44); since the p-value is greater than the conventional significance level of 0.05, we fail to reject the null hypothesis. This suggests that any observed variation in skeletal muscle mass between the groups is likely due to random chances rather than an actual effect.
Figure 10.
pre-mean scores of %body fat mass.
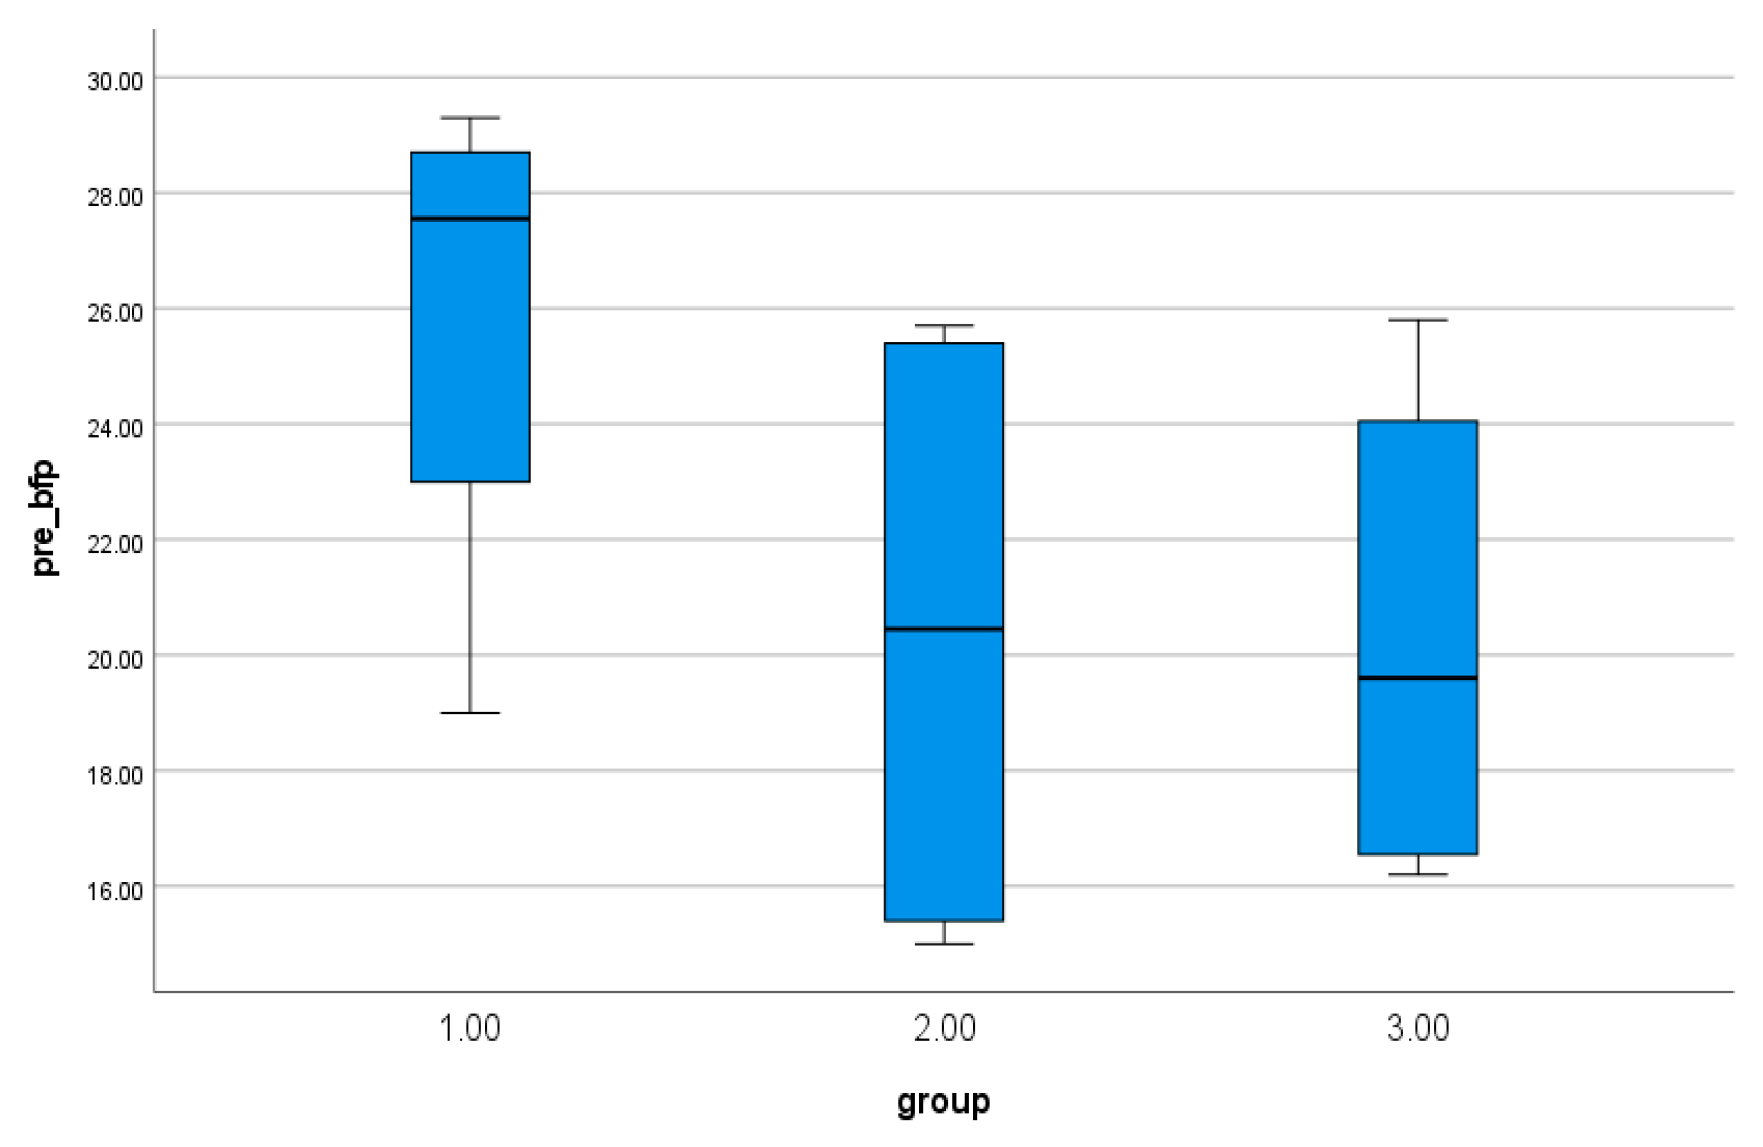
Figure 11.
post-mean scores of %body fat mass.
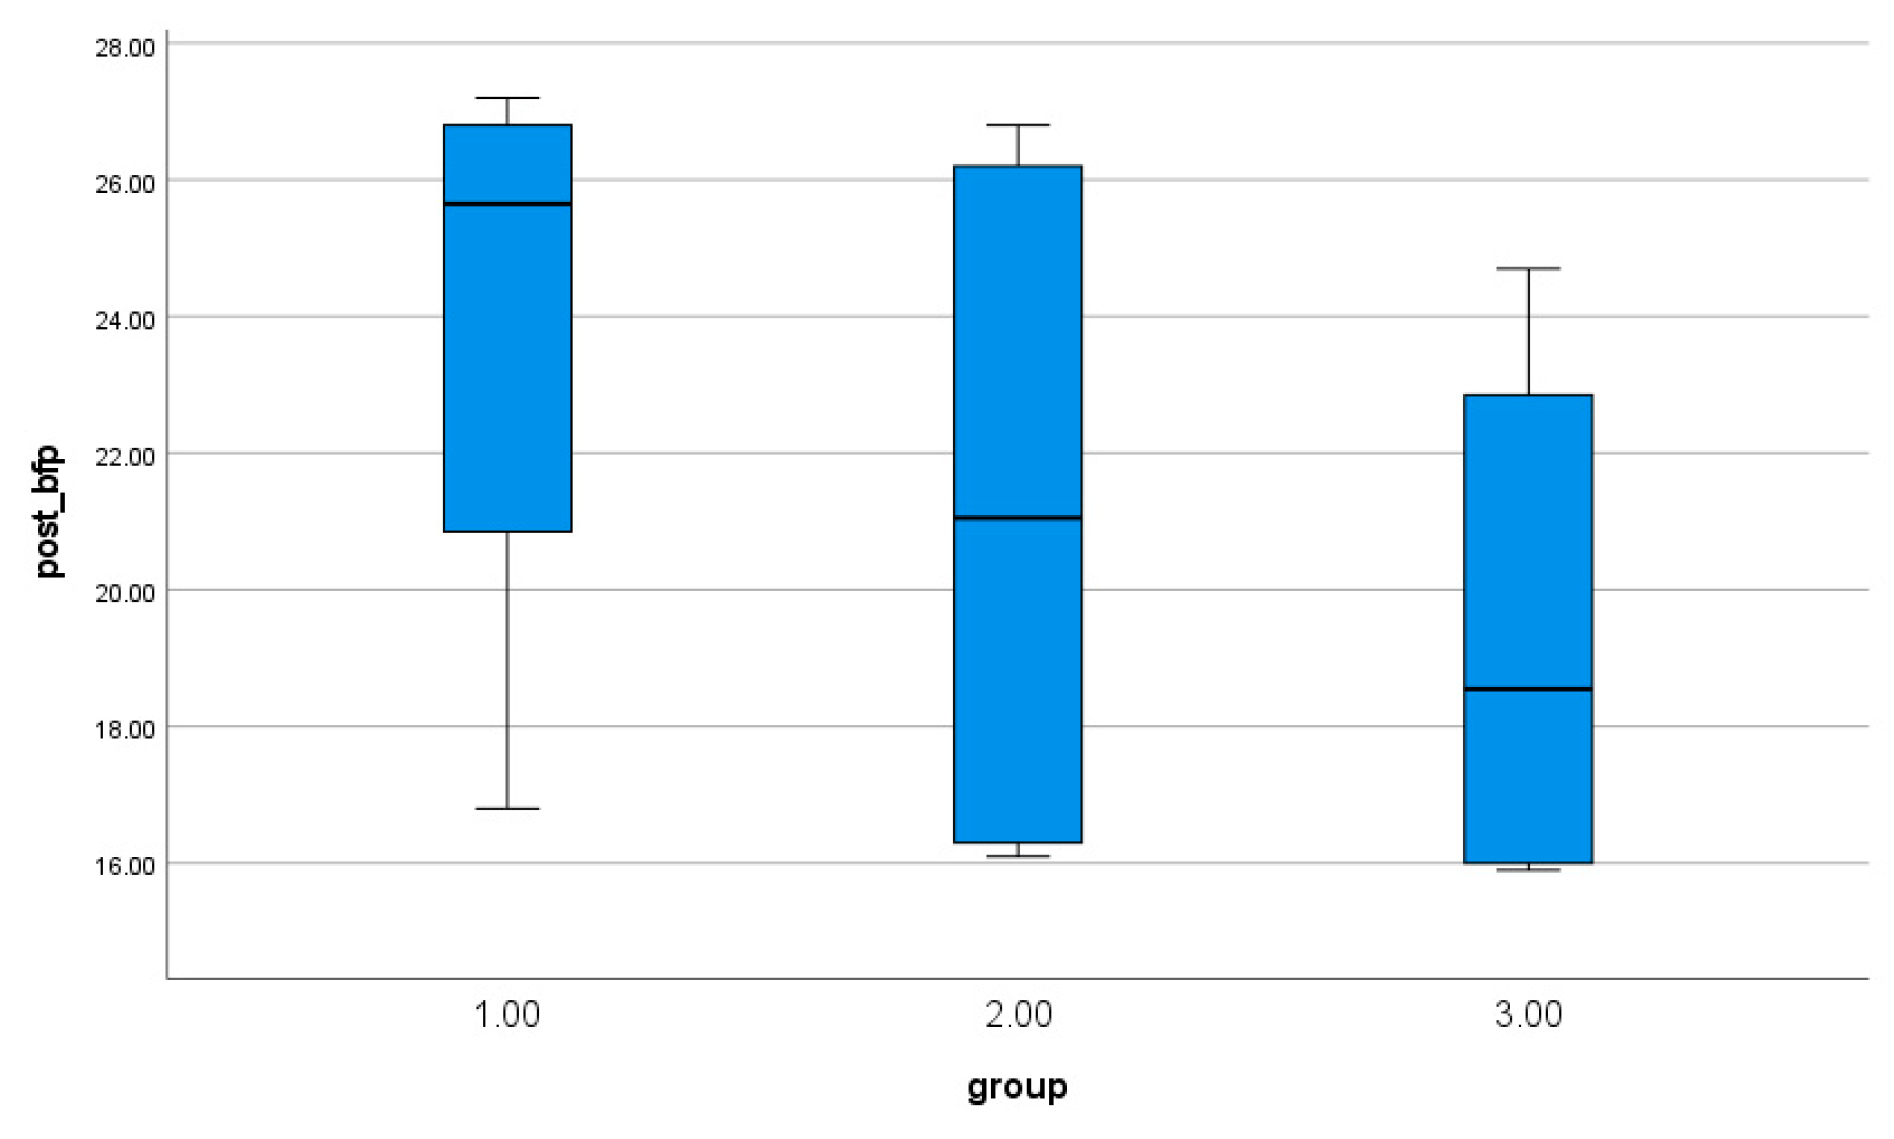
Figure 12.
Comparison of pre-post performance of % body fat mass.

Discussion
The study investigated the effect of glycogen loading and creatine supplementation on maximal strength development in the upper and lower body. Participants (N=12) were stratified into three groups: creatine monohydrate supplementation (CRE; n=4), a glycogen loading group (GLY; n=4), and a control group (CON; n=4). All groups completed a six-week progressive resistance training program. Maximal strength outcomes were assessed via one-repetition maximum (1RM) testing pre- and post-intervention.
Statistical analysis using one-way ANOVA revealed significant improvements in both upper and lower body maximal strength in the GLY group compared to CRE and CON (p<0.05). Glycogen loading will likely support upper body strength by super-compensating muscle glycogen stores. Glycogen serves as a primary fuel for glycolytic energy systems, which are essential for sustaining performance during moderate-load, higher-repetition upper body exercises (e.g., bench press, pull-ups). Upper body muscles, which may rely more on Type I (slow-twitch) fibers or mixed fiber types, benefit from glycogen’s role in delaying fatigue and supporting recovery between sets, thereby enabling greater training volume and hypertrophy over time (Burke et al., 2017; Robergs et al., 1991). This outcome may be attributed to glycogen's role as the primary substrate for adenosine triphosphate (ATP) generation during high-intensity anaerobic exercise, thereby enhancing work capacity and neuromuscular performance during repeated bouts of resistance training (Escalante et al., 2021). In contrast, the creatine group showed significant improvement in lower body maximum strength compared to the GLY and CON group at the 0.05 level of significance. Creatine supplementation likely enhanced lower body strength due to its role in rapidly regenerating adenosine triphosphate (ATP) during high-intensity, short-duration activities, which are critical for lower body movements like squats and deadlifts. These exercises heavily recruit large muscle groups (e.g., quadriceps, glutes) dominated by Type II (fast-twitch) fibers, which benefit most from creatine’s ability to buffer ATP and promote cell volumization, leading to greater hypertrophy and power output (Cooke et al., 2009; Rawson & Volek, 2003).
No significant difference between muscle hypertrophy and adiposity has been observed due to several factors, including the small sample size (Button et al., 2013). Six weeks of resistance training may not be sufficient time, as muscle growth and fat loss are gradual processes that often require more protracted intervention (Schoenfeld et al., 2016, 2017). Training alone without a calorie deficit may not lead to significant changes in adiposity, which could also be a possible reason (Willis et al., 2012). Dietary intake was also not controlled or monitored; differences in caloric intake or micronutrient distribution could have influenced the results (Morton et al., 2018).
Conclusions
The conclusions were derived based on the findings and within the study’s limitations. The one-way ANOVA indicated that the Glycogen Loading Group significantly improved the upper body maximum strength compared to the creatine supplement and control group, whereas the creatine group showed greater lower body strength development compared to the Glycogen loading and control groups. No significant difference between the groups has been observed regarding muscle hypertrophy and adiposity. Further investigation with the large sample size or additional factors may be needed to confirm these findings.
Acknowledgment
The authors would like to acknowledge the contributions of the laboratory in-charge of the sports biomechanics laboratory of Central University of Punjab, Ghudda, Bathinda, Punjab India.
Conflict of Interest
The authors declare no conflict of interest.
References
- Albrecht, B. M., Stalling, I., Recke, C., Doerwald, F., & Bammann, K. (2023). Associations between older adults’ physical fitness level and their engagement in different types of physical activity: Cross-sectional results from the OUTDOOR ACTIVE study. BMJ Open, 13(3), e068105. [CrossRef]
- Barranco-Gil, D., Alejo, L. B., Revuelta, C., Górriz, M., Pagola, I., Ozcoidi, L. M., Lucia, A., & Valenzuela, P. L. (2024). High-dose short-term creatine supplementation without beneficial effects in professional cyclists: A randomized controlled trial. Journal of the International Society of Sports Nutrition, 21(1), 2340574. [CrossRef]
- Burke, L. M., Ross, M. L., Garvican-Lewis, L. A., Welvaert, M., Heikura, I. A., Forbes, S. G., Mirtschin, J. G., Cato, L. E., Strobel, N., Sharma, A. P., & Hawley, J. A. (2017). Low carbohydrate, high fat diet impairs exercise economy and negates the performance benefit from intensified training in elite race walkers. The Journal of Physiology, 595(9), 2785–2807. [CrossRef]
- Button, K. S., Ioannidis, J. P. A., Mokrysz, C., Nosek, B. A., Flint, J., Robinson, E. S. J., & Munafò, M. R. (2013). Power failure: Why small sample size undermines the reliability of neuroscience. Nature Reviews Neuroscience, 14(5), 365–376. [CrossRef]
- Cooke, M. B., Rybalka, E., Williams, A. D., Cribb, P. J., & Hayes, A. (2009). Creatine supplementation enhances muscle force recovery after eccentrically-induced muscle damage in healthy individuals. Journal of the International Society of Sports Nutrition, 6(1), 13. [CrossRef]
- Dahal, M., Dahal, K. R., Pokhrel, N. R., & Kutal, D. (2024). Creatine Supplements: What the Research Says about How It Can Help Healthy Athletes. Global Journal of Health Science, 16(2), 48. [CrossRef]
- Deminice, R., Rosa, F. T., Franco, G. S., Jordao, A. A., & De Freitas, E. C. (2013). Effects of creatine supplementation on oxidative stress and inflammatory markers after repeated-sprint exercise in humans. Nutrition, 29(9), 1127–1132. [CrossRef]
- Desai, I., Wewege, M. A., Jones, M. D., Clifford, B. K., Pandit, A., Kaakoush, N. O., Simar, D., & Hagstrom, A. D. (2024a). The Effect of Creatine Supplementation on Resistance Training–Based Changes to Body Composition: A Systematic Review and Meta-analysis. Journal of Strength & Conditioning Research, 38(10), 1813–1821. [CrossRef]
- Escalante, G., Stevenson, S. W., Barakat, C., Aragon, A. A., & Schoenfeld, B. J. (2021). Peak week recommendations for bodybuilders: An evidence based approach. BMC Sports Science, Medicine and Rehabilitation, 13(1), 68. [CrossRef]
- Forbes, S. C., Candow, D. G., Neto, J. H. F., Kennedy, M. D., Forbes, J. L., Machado, M., Bustillo, E., Gomez-Lopez, J., Zapata, A., & Antonio, J. (2023b). Creatine supplementation and endurance performance: Surges and sprints to win the race. Journal of the International Society of Sports Nutrition, 20(1), 2204071. [CrossRef]
- Kumar, R., Dr. Binthu Mathavan. S, & Singh, Dr. S. (2024). A Comparative Investigation of Physical and Physiological Components of Team Game Athletes from Northeast and South India. Indian Journal of YOGA Exercise & Sport Science and Physical Education, 55–60. [CrossRef]
- Morton, R. W., Murphy, K. T., McKellar, S. R., Schoenfeld, B. J., Henselmans, M., Helms, E., Aragon, A. A., Devries, M. C., Banfield, L., Krieger, J. W., & Phillips, S. M. (2018). A systematic review, meta-analysis and meta-regression of the effect of protein supplementation on resistance training-induced gains in muscle mass and strength in healthy adults. British Journal of Sports Medicine, 52(6), 376–384. [CrossRef]
- Mr. Dinesh, Dr. Kuldeep Nara, & Dr. Sunita Rani. (2024). IMPACT OF WEIGHT TRAINING ON HEALTH RELATED PHYSICAL FITNESS COMPONENTS OF SCHOOL GOING GIRLS. EPRA International Journal of Research & Development (IJRD), 181–191. [CrossRef]
- Physical Education and Sports, Division of Humanities and Political Sciences, Hellenic Naval Academy, Piraeus, Athens, Greece, Vantaraki, A.-D., Panteion University, School of Social Science, Athens, Greece, Vantarakis, S. A., & University of Patras, Rio Patras, Greece. (2023). EFFECTS OF WEIGHT TRAINING ON PHYSICAL FITNESS AND BODY COMPOSITION ON A WARSHIP. Journal of Applied Sports Sciences, 2023(2), 3–11. [CrossRef]
- Rawson, E. S., & Volek, J. S. (2003). Effects of Creatine Supplementation and Resistance Training on Muscle Strength and Weightlifting Performance.
- Robergs, R. A., Pearson, D. R., Costill, D. L., Fink, W. J., Pascoe, D. D., Benedict, M. A., Lambert, C. P., & Zachweija, J. J. (1991). Muscle glycogenolysis during differing intensities of weight-resistance exercise. Journal of Applied Physiology, 70(4), 1700–1706. [CrossRef]
- Schoenfeld, B. J., Ogborn, D., & Krieger, J. W. (2016). Effects of Resistance Training Frequency on Measures of Muscle Hypertrophy: A Systematic Review and Meta-Analysis. Sports Medicine, 46(11), 1689–1697. [CrossRef]
- Schoenfeld, B. J., Ogborn, D., & Krieger, J. W. (2017). Dose-response relationship between weekly resistance training volume and increases in muscle mass: A systematic review and meta-analysis. Journal of Sports Sciences, 35(11), 1073–1082. [CrossRef]
- The effects of BCAA and creatine supplementation on anaerobic capacity and ball kicking speed in male football players. (2021). Journal of Men’s Health. [CrossRef]
- Tinôco, M. A., Nascimento, M. D. M., Marques, A., Gouveia, É. R., Miguel, S., Santos, F., & Ihle, A. (2023). The Relationship between Physical Fitness and Cognitive Functions in Older People: A Systematic Review. Sustainability, 15(23), 16314. [CrossRef]
- Willis, L. H., Slentz, C. A., Bateman, L. A., Shields, A. T., Piner, L. W., Bales, C. W., Houmard, J. A., & Kraus, W. E. (2012). Effects of aerobic and/or resistance training on body mass and fat mass in overweight or obese adults. Journal of Applied Physiology, 113(12), 1831–1837. [CrossRef]
Disclaimer/Publisher’s Note: The statements, opinions and data contained in all publications are solely those of the individual author(s) and contributor(s) and not of MDPI and/or the editor(s). MDPI and/or the editor(s) disclaim responsibility for any injury to people or property resulting from any ideas, methods, instructions or products referred to in the content. |
© 2025 by the authors. Licensee MDPI, Basel, Switzerland. This article is an open access article distributed under the terms and conditions of the Creative Commons Attribution (CC BY) license (http://creativecommons.org/licenses/by/4.0/).
Copyright: This open access article is published under a Creative Commons CC BY 4.0 license, which permit the free download, distribution, and reuse, provided that the author and preprint are cited in any reuse.


