
Submitted:
02 August 2025
Posted:
06 August 2025
You are already at the latest version
Abstract
This study investigates visual fatigue in a real-world pharmaceutical packaging environment, where operators perform repetitive inspection and packing tasks under frequently suboptimal lighting conditions. A human-centered methodology was applied, combining adapted self-report questionnaires with high-frequency eye-tracking data collected via Tobii Pro Glasses 3, alongside lux-level measurements. Key eye movement metrics, such as fixation duration, visit patterns, and pupil diameter, were analyzed within defined work zones (Areas of Interest). Principal Component Analysis was employed to reduce data complexity and uncover latent visual behavior patterns. Results revealed a progressive increase in visual fatigue across the workweek, throughout each shift, and particularly during night shifts, and is strongly associated with inadequate lighting. Notably, tasks involving high physical workload under poor illumination emerged as critical risk scenarios. This integrated approach not only confirmed the presence of visual fatigue but also identified high-risk conditions in the workflow, enabling targeted ergonomic interventions. The findings offer a practical framework for enhancing operator well-being and inspection performance through sensor-based monitoring and environment-specific design improvements, aligned with the goals of Industry 5.0.
Keywords:
visual fatigue
; eye tracking
; wearable sensors
; human-centered design
; pharmaceutical packaging
; Industry 5.0
; occupational health
1. Introduction
Visual fatigue, also known as eye strain or visual discomfort, is a physical and cognitive condition that arises from prolonged visual activity, especially under demanding or non-ergonomic conditions [1]. It usually happens when you stare at the same thing for a long time, move your eyes a lot, or work with a lot of visual information [2]. Symptoms include ocular discomfort, dryness, blurred vision, cephalalgia, and diminished cognitive focus, potentially affecting cognitive functioning and overall task performance [3,4]. These impacts are especially relevant today as industries move toward more intelligent and human-centric paradigms, such as those promoted by Industry 5.0, which places a renewed emphasis on worker well-being and adaptive technology [5].
This type of fatigue presents a serious challenge in occupations that demand sustained visual precision and attention to detail. It slows us down, makes it more likely that we’ll miss important signals, and raises the chance of making mistakes. These are all big problems in fields like healthcare, manufacturing, packaging, and transportation. If a quality control operator is scanning hundreds of products or a technician is looking for small flaws in bright lights, their work suffers if their eyes are tired [6]. Visual fatigue, on the other hand, is often ignored or just accepted as part of the job, even though it has real effects. But over time, it can build up, leading to chronic stress, long-term eye discomfort, and even early signs of computer vision syndrome (CVS) [7,8]. This means that workers will not only be uncomfortable, but their performance will also go down and their health will be at risk. This is something that industries can no longer afford to ignore.
The issue becomes even more pressing when viewed through the lens of local data. According to data from the Colombian Safety Council (2024) [9], the manufacturing sector had the highest incidence of occupational diseases in 2024, representing 21.1% of all cases, followed by administrative and support services activities with 12.4%. Overall, musculoskeletal disorders predominate as the most frequently reported occupational disease [10]. Despite the growing relevance of visual health conditions in the modern work environment, the Colombian legal framework (Decree 676 of 2020) does not directly include CVS or visual fatigue, focusing on more traditional ocular diagnoses (conjunctivitis, kerartitis, cataracts), however, the legislation enables the qualification of these conditions as occupational diseases as long as the cause-effect relationship is demonstrated. [11] found that only 7,6% of workers in Saudi Arabia reported absences due to dry eye effects caused by fatigue, while a significant 29,4% mentioned that it reduced their effective working hours. According to the World Health Organization (WHO) and the International Labour Organization (ILO), uncorrected vision problems cause a productivity loss estimated at USD 411 billion [12]. In this context, empirical research is essential to make these conditions visible and quantify them. A notable example is a study on pharmaceutical workers in Bogotá - Colombia, which revealed a 51.4% prevalence of CVS [13]. Beyond the work environment, studies in academic populations also reveal this problem: [14] found a prevalence of 84.4% of CVS in medical students in Tunja - Colombia in 2022. Similarly, research with optometry students at La Salle University in Bogotá confirmed a high prevalence, identifying headache (89.9%), red eye and dry eyes as the most prevalent symptoms [15]. Although the symptoms of eyestrain vary from dry eyes and blurred vision to chronic headaches and musculoskeletal complaints, its true impact remains hidden in absenteeism records, often referred to as musculoskeletal disease or general illness.
This context highlights a critical gap in both research and workplace practice, which this research aims to overcome. Despite rising awareness globally, visual fatigue continues to be underreported and inadequately measured, especially in operational environments. Truly understanding visual fatigue requires robust, multi-dimensional assessment strategies. Yet that is not always simple. Fatigue manifests differently among individuals and does not always produce obvious or immediate signs [4]. Some workers may feel their eyes getting heavy or experience blurred vision and loss of concentration. Others may remain unaware, pushing through their tasks while performance silently declines. Often, by the time fatigue is consciously recognized, significant cognitive and perceptual degradation has already occurred. That’s why researchers need to approach the problem from multiple angles, merging subjective perceptions with physiological data through smart technologies, in line with Industry 5.0’s emphasis on responsive, worker-oriented systems.
Subjective assessments help capture that first part—the personal experience. Tools like the Visual Fatigue Scale (VFS) [16] or the Simulator Sickness Questionnaire (SSQ) [17] ask straightforward questions: Are your eyes sore or tired? Are you struggling to focus? Do you feel mentally drained or a little dizzy? These kinds of questionnaires are quick and easy to use, and they give us insight into how someone is coping with the demands of the task. But the answers can be inconsistent—some people underreport symptoms, others overreport—and they often don’t catch the more subtle signs that fatigue is building up.
That’s when objective tools come in. Eye trackers and other devices can give us a lot of information about what’s going on behind the scenes. They track how long someone looks at one spot, how quickly their eyes move from one spot to another, how often they blink, and even how their pupils react to light and stress [18]. These minor indicators can indicate the initial manifestations of visual fatigue, often before the individual is consciously aware of it [19]. And in more advanced research, we’re starting to go even deeper by looking directly at brain activity with EEG (electroencephalography) [20]. By tracking changes in brainwave patterns, EEG can tell when someone’s mental workload is going up or when their attention is fading. For instance, if someone has more slower theta waves or fewer faster alpha waves, it could mean that they are mentally tired and having trouble staying focused [21]. EEG isn’t something we can use in most workplaces yet, but it’s very helpful in labs, especially when it’s used with other tools like eye tracking or heart rate sensors [22]. Integrating these insights helps advance our understanding of visual fatigue and opens new pathways for early intervention.
Up until now, most of what we know about visual fatigue has come from studies carried out in environments where the eyes are constantly at work and sustained attention is critical. Research has expanded in domains such as gaming, professional driving—including truck drivers, train operators, and pilots—and in virtual or mixed reality (VR/MR) systems. In these fields, performance often depends on how long a person can stay visually engaged without losing sharpness or slowing down [23]. There is also increased research being done on 3D technologies, especially in training and simulation settings where depth perception and screen-based interaction add new levels of visual complexity [24]. Office work has been a major concern, especially for people who spend a lot of time in front of screens, outside of those immersive spaces. In these situations, digital eye strain has become a major concern for occupational health [25]. Studies have linked long-term use of visual display terminals (VDTs) to discomfort, lower productivity, and long-term risks to eye health [26]. Researchers have also looked at healthcare settings, especially for tasks that require using computers for diagnostics or spending a lot of time looking at digital displays. Museums and other cultural spaces are starting to investigate how visual fatigue affects visitors, especially as they add more interactive and screen-based exhibits [27].
While these diverse domains have helped build a better understanding of visual fatigue, our own literature review reveals that studies specifically focused on industrial environments are surprisingly limited. We identified 21 relevant articles [28,29,30,31,32,33,34,35,36,37,38,39,40,41,42,43,44,45,46,47,48]. The few that do exist tend to concentrate on control rooms, monitoring stations, or screen-intensive tasks, where operators engage in prolonged digital observation and supervisory roles. These include settings such as process industry control rooms, refineries, and display-dominated workstations, with some studies further investigating the impact of lighting conditions and shift schedules on visual strain [33,34,36,37,41]. Several other articles have explored lighting ergonomics, visual comfort, or physiological responses such as EEG and pupil dynamics, but typically within experimental frameworks detached from actual industrial workflows [32,38,40,42,44,48]. Additionally, while a few innovative efforts have introduced AR systems, smart wearables, or fatigue detection tools into industrial applications, these remain largely exploratory and are not yet fully integrated into operational environments [29,31,42,43].
Only a small portion of studies directly focus on these hands-on, visually demanding activities, specifically investigating visual fatigue on the shop floor, beyond the scope of control room operations. These tasks are often performed under suboptimal lighting, tight time constraints, and high repetition [28,30,35,39,45,46,47]. Among these, only a few have integrated smart technologies—such as eye tracking, fatigue prediction algorithms, or sensor-driven lighting systems—to objectively monitor visual fatigue in real time [35,45,46,47].
This reveals a critical research gap: there is a very limited number of studies that investigate visual fatigue in real operational environments, particularly those that combine real-time, objective, and accurate measurements using smart technologies. These technologies enable continuous, non-intrusive data collection and provide early insights into the onset of fatigue, often before any visible decline in performance occurs. Such tools are essential for advancing the principles of Industry 5.0, where the focus moves beyond automation to the augmentation of human capabilities, using technology that adapts to the worker, rather than forcing the worker to adapt to the system [49]. They play a crucial role in supporting human-centered design, facilitating early intervention, and enabling proactive strategies that enhance both operator well-being and process reliability [50].
In response to this gap, the present study investigates visual fatigue in a pharmaceutical packaging line, applying a human-centered, sensor-based approach that opens new pathways for studying visual fatigue across a wider range of industrial applications. By combining environmental assessments, operator feedback, and objective eye-tracking data collected using Tobii Pro Glasses 3, the study aims to capture how visual fatigue develops during real work shifts. This approach allows us to identify high-risk tasks, understand the dynamics of fatigue in context, and support evidence-based interventions to improve both operator well-being and inspection accuracy.
The following sections present the methodology used in this study, detailing the experimental design and the setup implemented to assess visual fatigue in a real-world industrial environment. This is followed by the results and discussion, where we highlight how key risk points for visual fatigue were identified within the workflow. The paper concludes with a summary of key findings and implications, offering insights for future applications in human-centered industrial design and fatigue prevention.
2. Materials and Methods
This section describes the methodology adopted to investigate visual fatigue in a real-world setting for pharmaceutical packaging. Instead of using controlled simulations or lab experiments, we wanted to see how visual fatigue builds up naturally over the course of real work shifts. The following subsections go into detail about how the experiment was set up, how the data was collected, and the analytical methods used to find patterns of fatigue and point out important parts of the packaging process where ergonomic changes could have the biggest effect.
2.1. Experimental Setup
The study was conducted in the packaging area of a pharmaceutical company, where workers regularly do tasks that require a lot of visual attention, like checking, packaging, and sealing drugs. These jobs involve packing things into groups of one, ten, one hundred, or large trays. They require constant visual focus, quick hand movements, and good control of small movements. This environment is perfect for testing visual fatigue in a realistic work setting. We used the Tobii Pro Glasses 3 eye-tracking system and a modified Visual Fatigue Scale questionnaire to measure visual fatigue both objectively and subjectively. The Tobii Pro Glasses 3 is a lightweight, wearable eye tracker that can sample up to 100 times per second. It can record detailed eye movement data, such as gaze behaviour, fixations, saccades, and pupil diameter, in natural working environments. Specific Areas of Interest (AoIs) were established within the workspace, concentrating on the stations designated for the inspection and packaging of vials and packs. The eye-tracking information gathered in these AoIs included:
- Total Fixation Duration: Cumulative time fixating on the AoI.
- Fixation Count: Total number of fixations.
- Total Visit Duration: Total time spent in the AoI per visit.
- Average Visit Duration: Mean time per visit within the AoI.
- Visit Count: Number of gaze entries into the AoI.
- Percentage of Gazes as Fixations: Share of gazes resulting in fixations.
- Percentage of Total Activity Time in the AoI.
- Pupil Diameter: Monitored during fixations to infer cognitive load and fatigue.
Subjective visual fatigue was measured using an adapted Visual Fatigue Scale [16], comprising three Likert-scale items:
- Eye tiredness
- Vision clarity
- Eye discomfort
Each item was rated from 0 (very fresh/clear) to 4 (very tired/blurred), producing a total score ranging from 0 to 12.
The operator’s eyesight determines the success of visual inspection largely; so the illumination system is rather crucial for optimal performance. To contextualize the eye-tracking data, environmental lighting levels (measured in Lux) were collected using a luxmeter installed near the AoIs. Lux levels were measured once at the beginning of each trial, based on prior verification that lighting remained constant throughout.
The devices chosen to study visual fatigue were the eye tracker (Tobii Pro Glasses 3), the luxmeter sensor (for lighting levels), and the adapted Visual Fatigue Scale. These tools collectively provided a comprehensive view of visual fatigue, capturing both subjective perceptions and objective physiological indicators across various operational factors. Although additional tools were deployed in the broader study to assess other dimensions of human factors, such as stress, fatigue, and biomechanical risks, these aspects are beyond the scope of this paper.
2.2. Data Collection
Before the study began, all 43 participants (42 females and 1 male) gave their informed consent, and the research was approved by the Ethics Committee of Universidad de América (Protocol No. 002-2024), in accordance with the ethical principles of the Declaration of Helsinki. Participation was entirely voluntary, and no financial compensation was provided. With 43 participants out of around 80 total operators, the sample represented more than half of the actual workforce assigned to these packaging tasks. The group was evenly distributed across the four production lines included in the study, ensuring a balanced view of different operational settings. The gender composition also mirrored the real-life context of the workplace, where only three to four operators out of approximately 80 are male. The participants’ ages ranged from 19 to 53 years, with an average age of 32.2, making this a contextually appropriate and representative sample. To capture how visual fatigue develops during a typical shift, each operator was monitored at two key points in their workday: once during the first two hours of the shift, before the scheduled break, and once during the last two hours, after the break. These specific times were selected due to operational constraints, ensuring minimal disruption to the production process while still allowing meaningful observation of fatigue progression. Data were collected continuously throughout the week, from Monday to Friday, and included all three standard 8-hour shifts—morning (06:30–14:30), afternoon (14:30–22:30), and night (22:30–06:30). The study took place across four real-world production scenarios: Plant 4 Line 2, Plant 4 Line 3, Plant 4 Line 4, and Plant 8. During these sessions, workers continued with their normal tasks on the shop floor, allowing data collection to take place under realistic conditions. These tasks involved inspecting, packaging, and sealing pharmaceutical products in various formats—including individual units, batches of 10 or 100 items, and larger trays—highlighting the repetitive and visually demanding nature of their daily workload. While the packaging activity remained the same in each setting, differences in lighting and layout provided important context for assessing how environmental factors affect visual fatigue.
During each 20-minute data collection session, participants wore the Tobii Pro Glasses 3 to record detailed eye movement patterns as they worked naturally. At the beginning of each trial, environmental lighting conditions were measured using the luxmeter sensor installed near the AoIs. To complement the objective data, participants also completed the adapted Visual Fatigue Scale just before each eye-tracking session. This short survey captured how tired their eyes felt, how clear their vision was, and any general discomfort they experienced—providing valuable insight into how they perceived their own visual fatigue.
2.3. Data Analysis Techniques
This section outlines the techniques used to analyze the collected data with the goal of understanding how visual fatigue develops throughout the work shift. By examining environmental factors, biometric indicators from eye-tracking, and responses to the subjective visual fatigue scale, the analysis aimed to pinpoint the most visually demanding moments in the workflow—those that present the highest risk to operator comfort, accuracy, and well-being. These findings serve as the basis for proposing targeted ergonomic improvements to reduce visual strain and support long-term task sustainability.
2.3.1. Lighting Levels Analysis
Before proposing any ergonomic improvements, it was necessary to assess whether the lighting conditions at each workstation met internationally recognized standards for visual tasks. We referred to the ISO 8995-1:2002 (CIE S 008/E:2001) global standard on lighting for indoor work environments, which is also valid for use in Colombia. According to ISO 8995-1:2002, a minimum of 500 lux is recommended for precision visual tasks such as inspection and quality control. For tasks involving even greater visual demands, higher illumination levels—up to 1,500 lux—are advised to prevent eye strain and support visual performance throughout the shift. Maintaining lighting within this recommended range is critical for minimizing visual fatigue and supporting consistent task performance. In this study, we examined whether the lighting levels measured at the beginning of each trial fell within the acceptable range recommended by international standards. These deviations were then considered in relation to their potential impact on visual fatigue, helping to identify environmental risk factors that could compromise visual performance and operator comfort.
2.3.2. Eye-Tracker Analysis
Using the Tobii Pro Glasses 3, we collected a total of seven key eye-tracking metrics to assess visual behavior, along with pupil diameter as an additional physiological indicator. These metrics included: Total Fixation Duration (Tot Fix Dur), Fixation Count, Total Visit Duration (Tot Visit Dur), Average Visit Duration (Avr Visit Dur), Visit Count, Percentage of Total Activity Time in the AoI, and Percentage of Gazes as Fixations. Each metric was recorded within defined AoIs, allowing us to examine how visual attention and engagement fluctuated during actual work tasks. Before integrating pupil diameter into further analysis, we first evaluated its reliability under the conditions of the study. Since pupil size is highly sensitive to external factors—particularly lighting, but also temperature and humidity [51]—it was essential to determine whether it could serve as a valid fatigue indicator in our real-world setting. To this end, we explored its correlation with environmental variables such as light intensity (Lux), temperature (T), and relative humidity (RH). This step helped account for potential confounding influences and confirmed whether pupil data could be interpreted as a meaningful measure of visual strain.
To explore the relationships among the eye-tracking features and reduce potential redundancy, we applied Principal Component Analysis (PCA). PCA was selected not only for dimensionality reduction but also to manage multicollinearity and enhance the interpretability of visual fatigue-related patterns [52]. Preliminary checks revealed notable inter-correlations among several eye-tracking metrics—such as fixation duration, visit duration, and gaze frequency—that could undermine model robustness. By transforming these correlated variables into a set of uncorrelated principal components, PCA helped clarify the data structure and increased analytical stability. To further enhance interpretability, we applied Varimax rotation with Kaiser normalization [53]. Varimax, an orthogonal rotation method, simplifies the component structure by maximizing the variance of squared loadings within each component, making it easier to identify which original variables are most influential [53]. This method is particularly well suited for biometric datasets like eye-tracking, where multiple metrics often reflect similar underlying behaviors [54]. We chose Varimax over oblique methods (e.g., Promax) because our aim was to extract distinct, non-overlapping dimensions of visual behavior—such as visual engagement or search effort—rather than correlated latent factors [55]. Kaiser normalization was included to ensure that variables with larger variances did not dominate the solution and to stabilize the overall variance structure during rotation [53]. Only components with eigenvalues greater than 1 were retained to ensure that each captured a meaningful portion of total variance (Kaiser criterion). This approach resulted in a reduced set of orthogonal factors that represent the core dimensions of visual behavior in the packaging workflow, enabling us to pinpoint visually demanding tasks and fatigue-prone conditions more effectively.
2.3.3. Visual Fatigue Trends and Critical Risk Detection
In this final phase of analysis, we explored how visual fatigue varied across several operational and individual-level factors, aiming to identify the most critical points in the workflow where visual fatigue posed a risk. Specifically, we examined variations in both objective eye-tracking data and subjective scale scores based on the moment in the shift (beginning or end), type of shift (morning, afternoon, or night), day of the week (Monday to Friday), production line location (Plant 4 Line 2, Plant 4 Line 3, Plant 4 Line 4, and Plant 8), type of batch being packed (1, 10, 100, or trays), operator age, and years of experience.
Before conducting statistical comparisons, we first assessed data normality using the Kolmogorov–Smirnov (KS) and Shapiro–Wilk (SW) tests [56]. For repeated-measures data, we evaluated sphericity using Mauchly’s Test of Sphericity, which is applicable when normality assumptions are met [57]. Statistical significance testing was then used to determine whether observed differences across groups or time points were meaningful. To examine correlations between variables, the choice of test depended on the data distribution: Pearson’s correlation coefficient was used for normally distributed variables, while Spearman’s rank correlation was applied to non-normally distributed data [58]. These comparisons allowed us to detect patterns of fatigue progression and determine whether certain conditions were consistently associated with higher levels of fatigue. This multi-dimensional approach, combining biometric trends with self-reported fatigue, enabled a robust identification of high-risk scenarios. The findings guided the prioritization of ergonomic recommendations proposed to the industrial partner, helping target interventions where they would have the greatest impact on reducing visual fatigue and improving operator comfort and performance.
3. Results
This section presents the main findings of the study, structured according to the three analytical domains described previously: (1) lighting level assessment, (2) eye-tracking metrics and PCA analysis, and (3) trends in visual fatigue and risk detection across work-related and individual variables.
3.1. Lighting Levels
Figure 1 illustrates the lighting levels recorded across different production lines throughout the workday. Each data point corresponds to a measurement taken at the beginning of a trial, with colors and markers distinguishing between Line 2 (blue squares), Line 3 (orange circles), Line 4 (green Xs), and Line 8 (purple triangles). The horizontal dashed lines indicate the ISO 8995-1:2002 recommended range for precision tasks—500 Lux minimum (blue) and 1,500 Lux maximum (red). The data reveal that most lighting measurements fall below the minimum recommended threshold of 500 Lux, with Line 8 showing the lowest values, suggesting insufficient illumination for visually demanding tasks. In contrast, Line 8 at some points also exhibits lighting levels that exceed 1,500 Lux.
3.2. Eye-tracker Results
First, we assessed whether average pupil diameter could be reliably included in further analysis, given its known sensitivity to external lighting conditions [59]. To evaluate its statistical behavior, we conducted normality tests using both the Kolmogorov-Smirnov and Shapiro-Wilk tests. The results showed a p-value of 0.070 (KS) and 0.012 (SW) for pupil diameter, indicating that the distribution deviated from normality under the Shapiro-Wilk test, which is more sensitive for small sample sizes. Likewise, light intensity (Lux) was also found to be non-normally distributed (p < 0.001 in both tests). Due to these deviations from normality, we applied Spearman’s rank correlation to investigate the relationship between pupil diameter and environmental lighting. The analysis revealed a significant negative correlation (ρ = –0.506, p < 0.001), indicating that higher light levels were consistently associated with smaller pupil sizes. This outcome aligns with established physiological mechanisms, in which pupil constriction occurs as a natural response to increased ambient light, helping to regulate retinal exposure [59]. Consequently, pupil diameter was excluded from the final visual fatigue analysis, as its variation primarily reflected changes in lighting conditions rather than operator fatigue, and no further correlation with environmental data was pursued.
Using the remaining seven eye-tracking metrics—Tot Fix Dur, Fixation Count, Tot Visit Dur, Avr Visit Dur, Visit Count, Percentage of Total Activity Time in the AoI, and Percentage of Gazes as Fixations—we applied PCA. This method enhanced the clarity and stability of the analysis by reducing multicollinearity and revealing underlying dimensions of visual engagement. Prior to PCA, we evaluated the suitability of the dataset using two key tests: the Kaiser-Meyer-Olkin (KMO) Measure of Sampling Adequacy and Bartlett’s Test of Sphericity. The KMO value was 0.538—slightly above the commonly accepted minimum of 0.5—indicating marginal adequacy for PCA. Bartlett’s Test of Sphericity produced a statistically significant result (p < 0.001), confirming that there are sufficient correlations among variables to justify the application of PCA.
The PCA results revealed a clear underlying structure in the eye-tracking data, identifying three principal components that together explained 93.64% of the total variance. We applied the Kaiser criterion, selecting components with eigenvalues greater than 1. As shown in the scree plot (Figure 2), the first three components exceed this threshold, collectively accounting for 93.64% of the total variance—52.38% from Component 1, 27.46% from Component 2, and 13.79% from Component 3. The scree plot also reveals a clear “elbow” at the third component, reinforcing this selection by visualizing the point where adding more components yields diminishing returns in explained variance.
We applied Varimax rotation with Kaiser normalization (only factor loadings above 0.6 are reported to highlight significant contributions of variables to a specific factor). The rotated component matrix (Table 1) indicates three distinct components related to eye-tracking parameters, which can be interpreted as follows:
- Principal Component 1, “Overall Visual Engagement”: This component groups Total Visit Duration, Total Fixation Duration, Fixation Count, and Percentage of Total Activity Time in the AoI. Collectively, these metrics reflect the amount of visual attention and time devoted to task-relevant areas. High loadings on this component suggest sustained visual involvement, likely associated with task complexity or attentional demand. Therefore, this component is interpreted as a general indicator of visual engagement during operational activities.
- Principal Component 2, “Fixation Characteristics”: This factor includes Average Fixation Duration and Percentage of Gazes as Fixations, both of which describe the nature and stability of gaze behavior.
- Principal Component 3, “Visit Duration Pattern”: Driven solely by Average Visit Duration, this component highlights how long participants remained within each Area of Interest per visit.
Contextual interpretation remains essential across all three Principal Components, as each represents a distinct dimension of visual behavior. Nonetheless, these components collectively offer valuable insights for detecting shifts in visual strategy, attentional load, and emerging signs of fatigue. Since this study focused specifically on visual fatigue, we grounded our interpretation in prior literature on eye movement behavior under fatigue conditions [60,61,62,63]. Table 2 summarizes the expected changes in key eye-tracking metrics as visual fatigue increases:
As shown in Table 2, previous literature consistently reports that visual fatigue is characterized by increases in total and average fixation duration, as well as blinking frequency, along with decreases in fixation frequency and saccadic parameters. Notably, Principal Component 2 (Fixation Characteristics)—comprising Average Fixation Duration and Percentage of Gazes as Fixations—closely aligns with these empirically observed patterns. Both metrics capture aspects of gaze stability and attentional persistence, which tend to intensify as visual fatigue progresses. This convergence between the empirical loadings of PC2 and established theoretical expectations reinforces its interpretation as a valid and sensitive indicator of visual fatigue. Specifically, higher scores on this component reflect longer and more stable fixations, a behavior often linked to reduced efficiency in attentional modulation under fatigue. Since the cognitive demands of the task remain consistent throughout the shift—given the repetitive nature of the inspection activity—systematic increases in PC2 values can be reasonably attributed to the accumulation of visual fatigue rather than variations in task complexity. Accordingly, Principal Component 2 will serve as a key outcome variable in the following section, where we examine how visual fatigue evolves across different contextual and operational conditions. While all three components offer valuable insight into eye movement behavior, Principal Component 1—associated with overall visual engagement—appears to reflect general attentional demand or task structure, rather than fatigue-specific effects. Principal Component 3, dominated by average visit duration, may instead capture individual exploration style or navigation strategy. Because neither PC1 nor PC3 aligns consistently with established markers of visual fatigue in the literature, our analysis focuses solely on PC2, which directly reflects fixation stability and duration—two parameters most reliably linked to the onset and progression of visual fatigue.
3.3. Visual Fatigue Trends
This section presents selected key findings on how visual fatigue, based on Principal Component 2 (Fixation Characteristics), varies by shift timing, weekday, production line, batch type, age, and experience—highlighting critical risk scenarios for ergonomic intervention. We also incorporate subjective data from the Visual Fatigue Scale to strengthen our findings.
Before conducting statistical comparisons, we assessed the normality of Principal Component 2 (Fixation Characteristics) using both the Kolmogorov-Smirnov and Shapiro-Wilk tests. PC2 is normally distributed (KS: p = 0.200; SW: p = 0.122).
After conducting a detailed analysis of Principal Component 2 (Fixation Characteristics)—our validated proxy for visual fatigue—we examined its variation across several contextual and individual factors, including shift timing, production line, batch type, operator age, and experience. Using parametric tests and correlation analyses (following confirmation of normality), no significant patterns emerged in relation to these variables.
However, a clear and consistent trend was observed across the workweek. Given that weekdays are ordinal variables, we applied Spearman’s rank correlation, which revealed a strong positive association between PC2 and the progression of the week (ρ = 0.529, p < 0.001). This finding suggests that visual fatigue accumulates over time, likely due to continuous exposure to visually demanding tasks without sufficient recovery periods.
Figure 3 visualizes this weekly trend. At the beginning of the week (Monday), PC2 scores are negative, indicating lower levels of fixation duration and gaze stability—interpreted as a relatively fresh visual state with less fatigue. As the week progresses, PC2 values increase steadily and become positive, reflecting longer and more stable fixations, which are consistent with the known physiological and behavioral signatures of accumulated visual fatigue.
Additionally, pairwise comparisons with Bonferroni correction showed a statistically significant difference between Monday and Friday (p = 0.022), further supporting the hypothesis of fatigue accumulation.
An additional insight emerged when analyzing the weekly trend of Overall Engagement (PC1) in relation to Fixation Characteristics (PC2), our designated indicator of visual fatigue. As shown in Figure 4, the mean plots suggest an inverse relationship between these two components.
This inverse trend reinforces the conceptual distinction between the components: while PC1 captures the level of sustained attentional involvement, PC2 reflects fatigue-induced changes in gaze stability and fixation behavior. Their contrasting trajectories across the week empirically validate our use of PC2 to study visual fatigue and demonstrate how fatigue may undermine engagement during prolonged repetitive tasks. The Visual Fatigue Scale provided complementary insights into how operators subjectively perceived their visual fatigue, reinforcing the findings from biometric data. Using Spearman’s rank correlation—appropriate for ordinal Likert-scale responses—significant associations were found between perceived visual fatigue and both the shift timing (ρ = 0.214, p = 0.048) and the specific point within the shift (ρ = 0.392, p < 0.001). These results suggest that perceived visual fatigue tends to increase during later shifts (especially the night shift) and accumulate as the workday progresses.
Another notable result from the Visual Fatigue Scale relates to the physical load associated with different lot sizes. In this context, Lot 1 refers to packaging tasks involving single units; Lot 10 and Lot 100 refer to batches of 10 and 100 units respectively, while Tray 1 and Tray 2 involve handling large trays with a higher physical load. As shown in Figure 5, the highest mean visual fatigue score was recorded for Tray 2. This batch type corresponds to operations in Production Line 8, where the lowest illumination levels were previously recorded. This suggests a combined influence of physical task intensity and suboptimal lighting on the accumulation of visual fatigue.
4. Discussion
This study sheds light on several critical risk factors contributing to visual fatigue in pharmaceutical inspection and packaging environments. Among the most pressing concerns was the suboptimal lighting observed in Production Line 8, where illumination levels frequently fell below the ISO 8995-1:2002 recommended thresholds for tasks requiring high visual precision. Inadequate lighting in such visually demanding settings significantly elevates the risk of visual fatigue, which may compromise both operator well-being and the accuracy essential for pharmaceutical inspections. While some measurements temporarily exceeded the upper recommended lighting limit, these instances were managed appropriately and did not have a direct impact on the operators’ eyes. As observed in Figure 5, the perceived visual fatigue in Tray 1—which corresponded to the highest recorded lux levels—remained relatively low compared to Tray 2 in Plant 8. This suggests that the lighting variations were managed effectively, without compromising operator visual comfort.
To understand how visual fatigue evolves under different work conditions, we employed wearable eye-tracking technology (Tobii Pro Glasses 3) alongside PCA. This aligns with Industry 5.0’s emphasis on real-time, worker-adaptive monitoring systems. The identification of Principal Component 2—“Fixation Characteristics”—as a reliable and objective indicator of visual fatigue. Comprised of Average Fixation Duration and the Percentage of Gazes as Fixations, this component aligns closely with established physiological signatures of fatigue, such as longer and more stable fixations. The validity of this indicator was further strengthened by its empirical behavior: as Fixation Characteristics increased across the workweek, a simultaneous decline in Principal Component 1—“Overall Engagement”—was observed, reinforcing the inverse relationship between attentional engagement and fatigue accumulation.
Subjective responses from the Visual Fatigue Scale further validated the biometric findings, offering a comprehensive view of operator fatigue. Taken together, these two data sources revealed four consistent trends:
- Visual fatigue increased steadily across the workweek, as evidenced by rising scores in PC2 and a concurrent decline in PC1.
- Perceived fatigue accumulated progressively within each shift, becoming more pronounced as operators advanced through their tasks—indicating insufficient recovery during work hours.
- Night shifts were consistently associated with higher levels of perceived visual fatigue.
- Tray 2 tasks on Line 8 stood out as a critical risk scenario. These tasks involved a high physical load and were performed under the lowest recorded lighting levels. Operators reported the highest fatigue scores in this condition, suggesting a compounded effect of physical task intensity and inadequate visual environments on fatigue accumulation.
These insights illustrate how Industry 5.0 tools, such as wearable sensors, can help identify high-risk conditions and inform proactive ergonomic strategies. Based on these findings, we propose three targeted interventions aligned with the human-centric design principles of Industry 5.0: First, enhancing local task lighting represents a cost-effective and impactful improvement. Installing high-power desk lamps directly at workstations—particularly in areas with inadequate illumination such as Line 8—can substantially reduce visual strain during detailed tasks. Second, the implementation of adjustable overhead LED lighting systems can provide more consistent and customizable lighting across shifts and task types, improving both visual comfort and long-term energy efficiency [64]. Finally, implementing structured visual breaks—especially during night shifts or the latter half of a work shift—can play a critical role in reducing fatigue accumulation. Evidence suggests that even brief pauses every 20 to 30 minutes, allowing workers to rest their eyes by focusing on distant objects, help mitigate digital eye strain and support sustained visual performance [65].
5. Conclusions
This study presents a human-centered, sensor-based approach to assessing visual fatigue in pharmaceutical inspection and packaging environments—a domain where sustained attention, precision, and ergonomic sustainability are critical. By integrating wearable eye-tracking technology with subjective self-assessments, we established a novel, data-driven framework to monitor fatigue in real-time and identify high-risk working conditions. One of the most significant findings was the emergence of “Fixation Characteristics” as a robust indicator of visual fatigue. This was not only grounded in theoretical literature but also validated empirically by its inverse relationship with overall attentional engagement and by its alignment with self-reported fatigue levels. The convergence between sensor-based data and subjective experience exemplifies the kind of human-centric integration promoted by Industry 5.0. In line with the goals of this paradigm, our findings support proactive ergonomic interventions that go beyond productivity, prioritizing worker safety, comfort, and long-term well-being.
Data collection was limited to a single production facility within the pharmaceutical sector, which may restrict the generalizability of the findings. However, initial data from a second case study—conducted in a quality control process within the automotive sector—have begun to reveal similar fatigue patterns. These early results support the cross-domain validity of the “Fixation Characteristics” component as a robust indicator of visual fatigue. This suggests that the overall methodology, including PCA-based fatigue modeling, holds promise across diverse industrial environments. Future research will expand the dataset across sectors and incorporate additional variables known to influence visual fatigue, such as glare, contrast ratios, circadian rhythm disruptions, workstation design, and cognitive workload.
In conclusion, this study represents a key step toward bridging the gap between controlled laboratory research and the complexities of industrial reality. It provides empirical evidence that smart, non-intrusive technologies can be used not only to monitor visual fatigue but also to inform proactive ergonomic interventions. This aligns with the goals of Industry 5.0: creating workplaces that are not only more efficient, but also more adaptive, inclusive, and centered on human health and performance.
Author Contributions
Conceptualization, C.A.M.; methodology, C.A.M.; software, C.A.M. and J.S.P.; validation, C.A.M., J.S.P., M.C.S. and N.M.A.; formal analysis, C.A.M. and J.S.P.; investigation, C.A.M.; resources, M.D. and M.C.S.; data curation, C.A.M., J.S.P., M.C.S. and N.M.A; writing—original draft preparation, C.A.M.; writing—review and editing, C.A.M., M.D., J.S.P., M.C.S. and N.M.A.; visualization, C.A.M., M.D., J.S.P., M.C.S. and N.M.A.; supervision, M.D. and J.S.P.; project administration, M.D. and M.C.S.; funding acquisition, M.D. and M.C.S. All authors have read and agreed to the published version of the manuscript.
Funding
This work is funded by the CISC project, which is part of the grant H2020-MSCA-ITN-2020 grant agreement no. 955901.
Institutional Review Board Statement
The study was conducted in accordance with the Declaration of Helsinki and approved by the Ethics Committee of Universidad de América (Colombia) (protocol code 002-2024 June 2024).
Informed Consent Statement
Informed consent was obtained from all subjects involved in the study.
Data Availability Statement
The anonymized data files are available in the public Zenodo repository: https://doi.org/10.5281/zenodo.15705327.
Acknowledgments
The authors express their gratitude to Anyela Jineth Mateus and Catalina Nicholls from the pharmaceutical company for their invaluable support and collaboration throughout this research.
Conflicts of Interest
The authors declare no conflicts of interest.
Abbreviations
The following abbreviations are used in this manuscript:
| AoIs | Areas of Interest |
| CVS | Computer vision syndrome |
| EEG | Electroencephalography |
| KMO | Kaiser-Meyer-Olkin |
| KS | Kolmogorov-Smirnov |
| MR | Mixed reality |
| PCA | Principal Component Analysis |
| RH | Relative humidity |
| SW | Shapiro-Wilk |
| SSQ | Simulator Sickness Questionnaire |
| T | Temperature |
| VDTs | Visual display terminals |
| VFS | Visual Fatigue Scale |
| VR | Virtual reality |
References
- Herold, R.; Gevorgyan, H.; Damerau, L.S.; Hartmann, U.; Friemert, D.; Ellegast, R.; Schiefer, C.; Karamanidis, K.; Harth, V.; Terschüren, C. Effects of Smart Glasses on the Visual Acuity and Eye Strain of Employees in Logistics and Picking: A Six-Month Observational Study. Sensors 2024, 24, 6515. [Google Scholar] [CrossRef]
- Blehm, C.; Vishnu, S.; Khattak, A.; Mitra, S.; Yee, R.W. Computer vision syndrome: A review. Surv. Ophthalmol. 2005, 50, 253–262. [Google Scholar] [CrossRef]
- Blehm, C.; Vishnu, S.; Khattak, A.; Mitra, S.; Yee, R.W. Computer Vision Syndrome: A Review. Surv. Ophthalmol. 2005, 50, 253–262. [Google Scholar] [CrossRef] [PubMed]
- Rosenfield, M. Computer Vision Syndrome: A Review of Ocular Causes and Potential Treatments. Ophthalmic Physiol. Opt. 2011, 31, 502–515. [Google Scholar] [CrossRef] [PubMed]
- Nahavandi, S. Industry 5.0—A Human-Centric Solution. Sustainability 2019, 11. [Google Scholar] [CrossRef]
- Tjolleng, A.; Chang, J.; Park, J.; Lee, W.; Cha, M.; Park, J.; Jung, K. Development of a Human-Friendly Visual Inspection Method for Painted Vehicle Bodies. Appl. Ergon. 2023, 106, 103911. [Google Scholar] [CrossRef] [PubMed]
- Sheppard, A.L.; Wolffsohn, J.S. Digital Eye Strain: Prevalence, Measurement and Amelioration. BMJ Open Ophthalmol. 2018, 3. [Google Scholar] [CrossRef]
- Long, J.; Cheung, R.; Duong, S.; Paynter, R.; Asper, L. Viewing Distance and Eyestrain Symptoms with Prolonged Viewing of Smartphones. Clin. Exp. Optom. 2017, 100, 133–137. [Google Scholar] [CrossRef]
- Consejo Colombiano de Seguridad. Siniestralidad Laboral—Primer Semestre 2024. Observatorio de Seguridad y Salud en el Trabajo, 2024. https://ccs.org.co/observatorio/assets/boletin_fasecolda/6707f0df26940.pdf.
- Piedrahíta, H. Costs of Work-Related Musculoskeletal Disorders (MSDs) in Developing Countries: Colombia Case. Int. J. Occup. Saf. Ergon. 2006, 12, 379–386. [Google Scholar] [CrossRef]
- Binyousef, F.H.; Alruwaili, S.A.; Altammami, A.F.; Alharbi, A.A.; Alrakaf, F.A.; Almazrou, A.A. Impact of Dry Eye Disease on Work Productivity among Saudi Workers in Saudi Arabia. Clin. Ophthalmol. 2021, 15, 2675–2681. [Google Scholar] [CrossRef]
- Burton, M.J.; Ramke, J.; Marques, A.P.; Bourne, R.R.; Congdon, N.; Jones, I.; Faal, H.B.; et al. The Lancet Global Health Commission on Global Eye Health: Vision Beyond 2020. Lancet Glob. Health 2021, 9, e489–e551. [Google Scholar] [CrossRef] [PubMed]
- García Álvarez, P.E.; García Lozada, D. Factores Asociados con el Síndrome de Visión por el Uso de Computador. Investig. Andina 2010, 12, 107–119. [Google Scholar]
- Gerena Pallares, L.C.; Vargas Rodríguez, L.J.; Niño Avendaño, C.A.; Uyaban, G.C.; Ballesteros Virgen, Y. Prevalencia del Síndrome Visual por Computadora en los Estudiantes de Medicina de la Ciudad de Tunja Durante la Pandemia. Rev. Colomb. Salud Ocup. 2022, 12, e–7916. [Google Scholar] [CrossRef]
- Naranjo Suárez, I.D.; Villanueva Naranjo, L.F. Prevalencia del Síndrome Visual Informático en Estudiantes de Optometría de la Universidad de La Salle de Séptimo y Octavo Semestre en el Primer Ciclo del 2021. Undergraduate Thesis, Universidad de La Salle, Bogotá, Colombia, 2021. https://ciencia.lasalle.edu.co/server/api/core/bitstreams/848a9b7a-6613-4eb2-83d6-5abff1eaeed6/content. [Google Scholar]
- Benedetto, S.; Carbone, A.; Drai-Zerbib, V.; Pedrotti, M.; Baccino, T. Effects of Luminance and Illuminance on Visual Fatigue and Arousal during Digital Reading. Comput. Hum. Behav. 2014, 41, 112–119. [Google Scholar] [CrossRef]
- Kennedy, R.S.; Lane, N.E.; Berbaum, K.S.; Lilienthal, M.G. Simulator Sickness Questionnaire: An Enhanced Method for Quantifying Simulator Sickness. Int. J. Aviat. Psychol. 1993, 3, 203–220. [Google Scholar] [CrossRef]
- Eckstein, M.K.; Guerra-Carrillo, B.; Miller Singley, A.T.; Bunge, S.A. Beyond Eye Gaze: What Else Can Eyetracking Reveal about Cognition and Cognitive Development? Dev. Cogn. Neurosci. 2017, 25, 69–91. [Google Scholar] [CrossRef]
- Lin, H.-J.; Chou, L.-W.; Chang, K.-M.; Wang, J.-F.; Chen, S.-H.; Hendradi, R. Visual Fatigue Estimation by Eye Tracker with Regression Analysis. Sensors 2022, 2022, Article–7642777. [Google Scholar] [CrossRef]
- Wu, Y.; Tao, C.; Li, Q. Fatigue Characterization of EEG Brain Networks Under Mixed Reality Stereo Vision. Brain Sci. 2024, 14, 1126. [Google Scholar] [CrossRef] [PubMed]
- Trejo, L.; Kubitz, K.; Rosipal, R.; Kochavi, R.; Montgomery, L. EEG-Based Estimation and Classification of Mental Fatigue. In Mental Fatigue: Neural Correlates, Assessment and Interventions; Wiley: Hoboken, NJ, USA, 2021; Chapter 13, pp. 272–291. [Google Scholar] [CrossRef]
- Aksu, Ş.H.; Çakıt, E.; Dağdeviren, M. Mental Workload Assessment Using Machine Learning Techniques Based on EEG and Eye Tracking Data. Appl. Sci. 2024, 14. [Google Scholar] [CrossRef]
- Hirzle, T.; Cordts, M.; Rukzio, E.; Bulling, A. A Survey of Digital Eye Strain in Gaze-Based Interactive Systems. Proc. ACM Symposium on Eye Tracking Research & Applications (ETRA) 2020, pp. 1–12. [CrossRef]
- Lambooij, M.T.M.; Fortuin, M.; Heynderickx, I.; IJsselsteijn, W.A. Visual Discomfort and Visual Fatigue of Stereoscopic Displays: A Review. J. Imaging Sci. Technol. 2009, 53, 30201-1–30201–14. [Google Scholar] [CrossRef]
- Sheppard, A.L.; Wolffsohn, J.S. Digital Eye Strain: Prevalence, Measurement and Amelioration. BMJ Open Ophthalmol. 2018, 3, e000146. [Google Scholar] [CrossRef]
- Uchino, M.; Yokoi, N.; Uchino, Y.; Dogru, M.; Kawashima, M.; Komuro, A.; Sonomura, Y.; Kato, H.; Kinoshita, S.; Schaumberg, D.A.; Tsubota, K. Prevalence of Dry Eye Disease and Its Risk Factors in Visual Display Terminal Users: The Osaka Study. Am. J. Ophthalmol. 2013, 156, 759–766. [Google Scholar] [CrossRef]
- Hu, L.; Chen, L.; Liao, S.; Shan, Q.; Yan, J.; Shen, K. Evaluating the Effectiveness of Static and Dynamic Exhibits in Historical Museums Based on Eye-Tracking Experiments. SSRN Electron. J. 2023. [Google Scholar] [CrossRef]
- Untimanon, O.; Pacharatrakul, W.; Boonmeepong, K.; Thammagarun, L.; Laemun, N.; Taptagaporn, S.; Chongsuvivatwong, V. Visual Problems among Electronic and Jewelry Workers in Thailand. J. Occup. Health 2006, 48, 407–412. [Google Scholar] [CrossRef]
- Drouot, M.; Le Bigot, N.; Bolloc’h, J.; Bricard, E.; de Bougrenet, J.L.; Nourrit, V. The Visual Impact of Augmented Reality during an Assembly Task. Displays 2021, 66, 101987. [Google Scholar] [CrossRef]
- Yeow, P.H.P.; Sen, R.N. Ergonomics Improvements of the Visual Inspection Process in a Printed Circuit Assembly Factory. Int. J. Ind. Ergon. 2004, 33, 1–14. [Google Scholar] [CrossRef] [PubMed]
- Mättig, B.; Kretschmer, V. Smart Packaging in Intralogistics: An Evaluation Study of Human–Technology Interaction in Applying New Collaboration Technologies. Proc. 52nd Hawaii Int. Conf. Syst. Sci. 2019, 739–748. [Google Scholar]
- Jung, D.; Jung, S.; An, J.; Hong, T. Bio-Signals Based Occupant-Centric Lighting Control for Cognitive Performance, Visual Fatigue and Energy Consumption. Build. Environ. 2025, 269, 112424. [Google Scholar] [CrossRef]
- Glimne, S.; Brautaset, R.; Österman, C. Visual Fatigue during Control Room Work in Process Industries. Work 2020, 65, 903–914. [Google Scholar] [CrossRef] [PubMed]
- Lin, Y.C.; Ho, K.J. Night-Shift Work and Risk of Compromised Visual Acuity among the Workers in an Electronics Manufacturing Company. Int. J. Occup. Med. Environ. Health 2018, 31, 71–79. [Google Scholar] [CrossRef]
- Lin, J.-T.; Liang, G.-F.; Hwang, S.-L.; Wang, E.M.-Y. A Pre-Alarm System for Visual Fatigue in an IC Packaging Factory. Proc. IEEE Int. Conf. Ind. Eng. Eng. Manag. 2009, 2009, 2029–2033. [Google Scholar]
- Muraoka, T.; Ikeda, H.; Nakashima, N. Electronic Method for Evaluation and Recovery of Visual Strain Caused by Video Data Terminal Operations in Industry. Proc. IEEE Int. Conf. Ind. Electron. Control Instrum. 2002, 2002, 485–492. [Google Scholar]
- Muraoka, T.; Ikeda, H. Estimating Visual Fatigue Caused by Display Operations with Temperature Rise Sensed on Human Eyelids. In Proceedings of the 2015 IEEE 4th Global Conference on Consumer Electronics (GCCE), Osaka, Japan, 27–30 October 2015; IEEE: Piscataway, NJ, USA, 2015; pp. 495–496. [Google Scholar]
- Muraoka, T.; Uchimura, S.; Ikeda, H. Evaluating Visual Fatigue to Keep Eyes Healthy within Circadian Change during Continuous Display Operations. J. Disp. Technol. 2016, 12, 1464–1471. [Google Scholar] [CrossRef]
- Báez, G.; De la Vega, E.; Castro, C.; Elizarrarás, R. Use of Color Lights for the Detection of Anomalies in Quality Systems. Work 2012, 41, 5889–5891. [Google Scholar] [CrossRef]
- Tian, P.; Xu, G.; Han, C.; Zheng, X.; Zhang, K.; Du, C.; Wei, F.; Zhang, S.; Wu, Q. Research on an Indoor Light Environment Comfort Evaluation Index Based on EEG and Pupil Signals. Electronics 2024, 13, 3411. [Google Scholar] [CrossRef]
- Asadi, N.; Torabi Gudarzi, S.; Hosseini, S.S.; Hashemi, Z.; Foladi Dehaghi, R. The Correlation Between Lighting Intensity, Eye Fatigue, Occupational Stress, and Sleep Quality in the Control Room Operators of Abadan Refinery. Shiraz E-Med J. 2024, 25, e141536. [Google Scholar] [CrossRef]
- Lee, J.; Kim, N.; Park, J.; Kim, T.-Y.; Park, J.; Jeong, J. Design and Implementation of a Novel Eye Fatigue Analysis System for Safe Field Workers. Sensors 2023, 23, 6515. [Google Scholar] [CrossRef]
- Herold, R.; Gevorgyan, H.; Damerau, L.S.; Hartmann, U.; Friemert, D.; Ellegast, R.; Schiefer, C.; Karamanidis, K.; Harth, V.; Terschüren, C. Effects of Smart Glasses on the Visual Acuity and Eye Strain of Employees in Logistics and Picking: A Six-Month Observational Study. Sensors 2024, 24, 6515. [Google Scholar] [CrossRef] [PubMed]
- Wu, Y.; Tao, C.; Li, Q. Fatigue Characterization of EEG Brain Networks Under Mixed Reality Stereo Vision. Brain Sci. 2024, 14, 1126. [Google Scholar] [CrossRef]
- Tjolleng, A.; Chang, J.; Park, J.; Lee, W.; Cha, M.; Park, J.; Jung, K. Development of a Human-Friendly Visual Inspection Method for Painted Vehicle Bodies. Appl. Ergon. 2023, 106, 103911. [Google Scholar] [CrossRef]
- Tjolleng, A.; Jung, K. Development of a Visual Inspection Method for Defects on Metallic Surface Considering Emergent Feature. Appl. Sci. 2016, 6, 1234. [Google Scholar]
- Çevik, E.; Kızılaslan, A. Assessing Visual Control Activities in Ceramic Tile Surface Defect Detection: An Eye-Tracking Study. Int. J. Ind. Ergon. (in press).
- Feng, Y.; Chen, F. Investigation of Weighted Scales for Measuring Visual Fatigue in Screening Tasks. In Proceedings of the 2021 43rd Annual International Conference of the IEEE Engineering in Medicine & Biology Society (EMBC), Virtual Conference, 31 October–4 November 2021; pp. 5768–5771. [Google Scholar] [CrossRef]
- Nahavandi, S. Industry 5.0—A Human-Centric Solution. Sustainability 2019, 11, 4371. [Google Scholar] [CrossRef]
- Trstenjak, M.; Benešova, A.; Opetuk, T.; Cajner, H. Human Factors and Ergonomics in Industry 5.0—A Systematic Literature Review. Appl. Sci. 2025, 15, 2123. [Google Scholar] [CrossRef]
- Winn, B.; Whitaker, D.; Elliott, D.B.; Phillips, N.J. Factors Affecting Light-Adapted Pupil Size in Normal Human Subjects. Investig. Ophthalmol. Vis. Sci. 1994, 35, 1132–1137. [Google Scholar]
- Jolliffe, I.T.; Cadima, J. Principal Component Analysis: A Review and Recent Developments. Philos. Trans. R. Soc. A 2016, 374. [Google Scholar] [CrossRef] [PubMed]
- Kaiser, H.F. The Varimax Criterion for Analytic Rotation in Factor Analysis. Psychometrika 1958, 23, 187–200. [Google Scholar] [CrossRef]
- Mishra, A.K.; Vohra, V.; Raja, K.N.; Singh, S.; Singh, Y. Principal Component Analysis of Biometric Traits to Explain Body Conformation in Kajali Sheep of Punjab, India. Indian J. Anim. Sci. 2017, 87, 93–98. [Google Scholar] [CrossRef]
- Fabrigar, L.R.; Wegener, D.T.; MacCallum, R.C.; Strahan, E.J. Evaluating the Use of Exploratory Factor Analysis in Psychological Research. Psychol. Methods 1999, 4, 272–299. [Google Scholar] [CrossRef]
- Razali, N.M.; Wah, Y.B. Power Comparisons of Shapiro–Wilk, Kolmogorov–Smirnov, Lilliefors and Anderson–Darling Tests. J. Stat. Model. Anal. 2011, 2, 21–33. [Google Scholar]
- Grieve, A.P. Tests of Sphericity of Normal Distributions and the Analysis of Repeated Measures Designs. Psychometrika 1984, 49, 257–267. [Google Scholar] [CrossRef]
- Schober, P.; Boer, C.; Schwarte, L.A. Correlation Coefficients: Appropriate Use and Interpretation. Anesth. Analg. 2018, 126, 1763–1768. [Google Scholar] [CrossRef] [PubMed]
- Ellis, C.J. The Pupillary Light Reflex in Normal Subjects. Br. J. Ophthalmol. 1981, 65, 754–759. [Google Scholar] [CrossRef] [PubMed]
- Fan, L.; Wang, J.; Li, Q.; Song, Z.; Dong, J.; Bao, F.; Wang, X. Eye Movement Characteristics and Visual Fatigue Assessment of Virtual Reality Games with Different Interaction Modes. Front. Neurosci. 2023, 17, 1173127. [Google Scholar] [CrossRef] [PubMed]
- Marandi, R.; Madeleine, P.; Omland, Ø.; Vuillerme, N.; Samani, A. Eye Movement Characteristics Reflected Fatigue Development in Both Young and Elderly Individuals. Sci. Rep. 2018, 8, 13148. [Google Scholar] [CrossRef]
- Kashevnik, A.; Kovalenko, S.; Mamonov, A.; Hamoud, B.; Bulygin, A.; Kuznetsov, V.; Shoshina, I.; Brak, I.; Kiselev, G. Intelligent Human Operator Mental Fatigue Assessment Method Based on Gaze Movement Monitoring. Sensors 2024, 24, 6805. [Google Scholar] [CrossRef]
- Connell, C.; Thompson, B.; Turuwhenua, J.; Srzich, A.; Gant, N. Effects of Dopamine and Norepinephrine on Exercise-Induced Oculomotor Fatigue. Med. Sci. Sports Exerc. 2017, 49, 1778–1788. [Google Scholar] [CrossRef]
- Albarrán Morillo, C.; Demichela, M. Wearable Devices Enhancing Human Capabilities in Direct Enamel Painting Defect Detection. Proc. ESREL 2024 Conf. 2024. Available online: https://esrel2024.com/wp-content/uploads/articles/ea1/wearable-devices-enhancing-human-capabilities-in-direct-enamel-painting-defect-detection.pdf.
- Sheppard, A.L.; Wolffsohn, J.S. Digital Eye Strain: Prevalence, Measurement and Amelioration. BMJ Open Ophthalmol. 2018, 3, e000146. [Google Scholar] [CrossRef]
Figure 1.
Lighting levels (in Lux) recorded at the beginning of each trial.
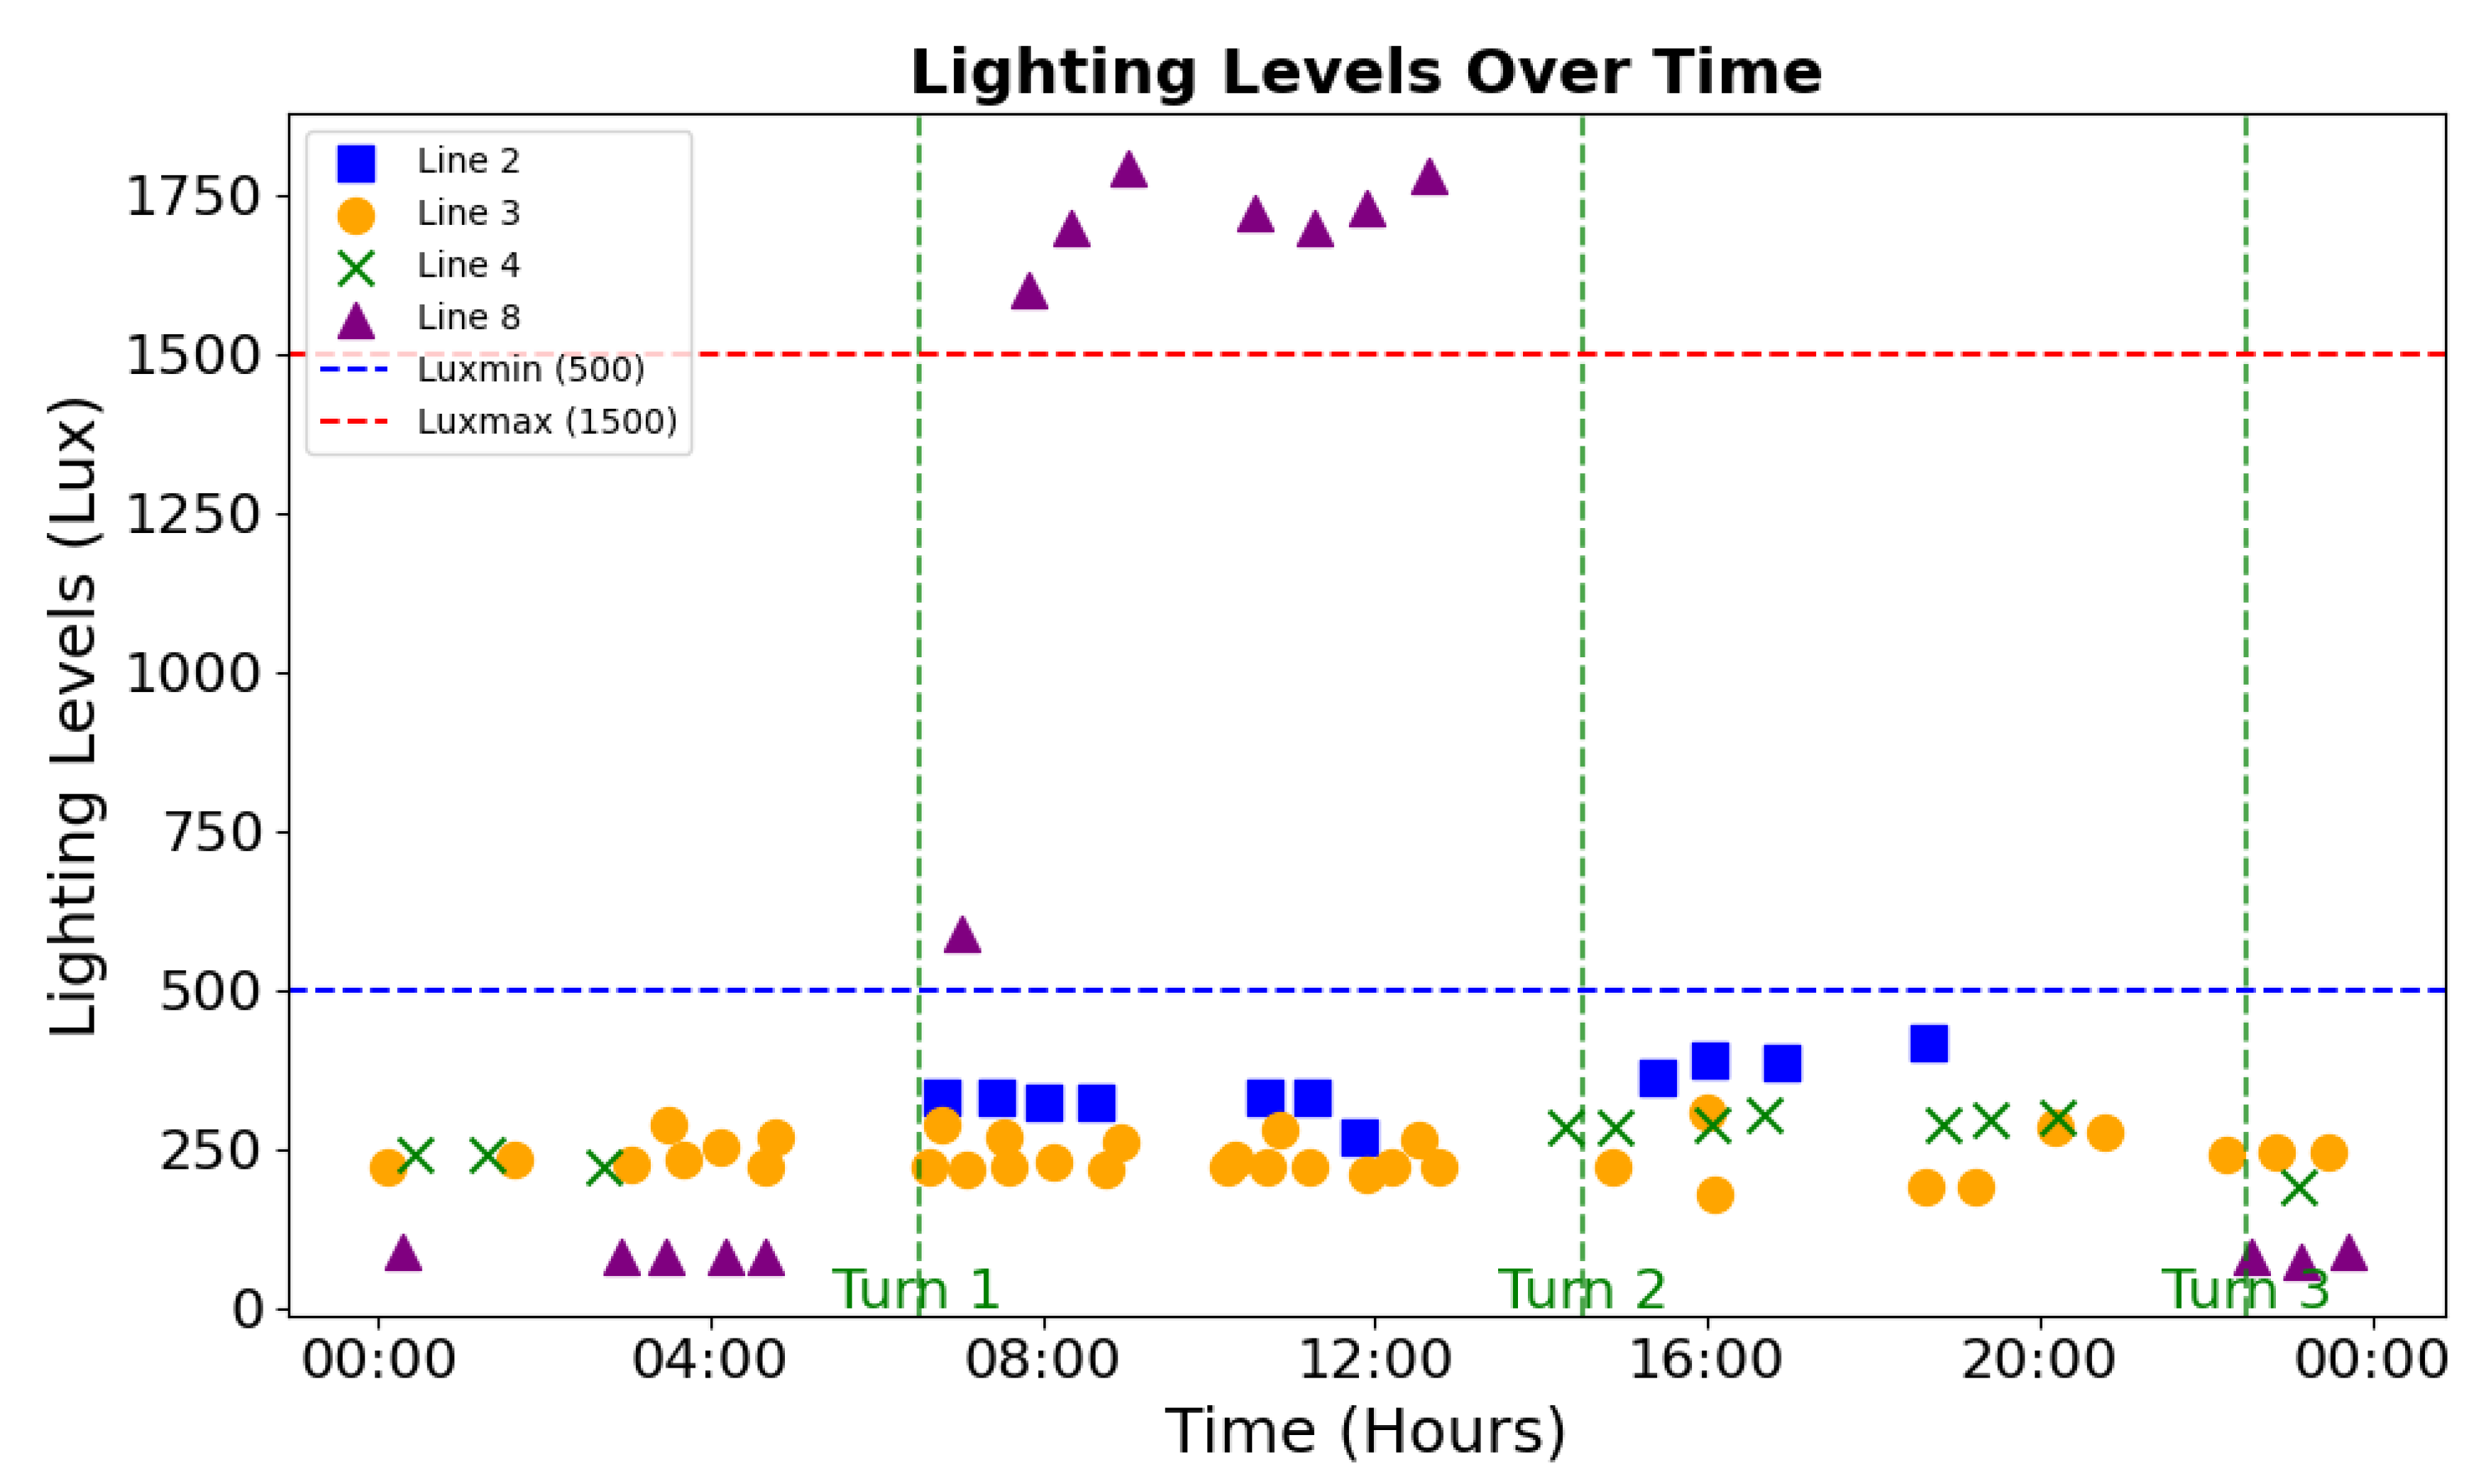
Figure 2.
Scree plot of PCA for the seven eye-tracking metrics.
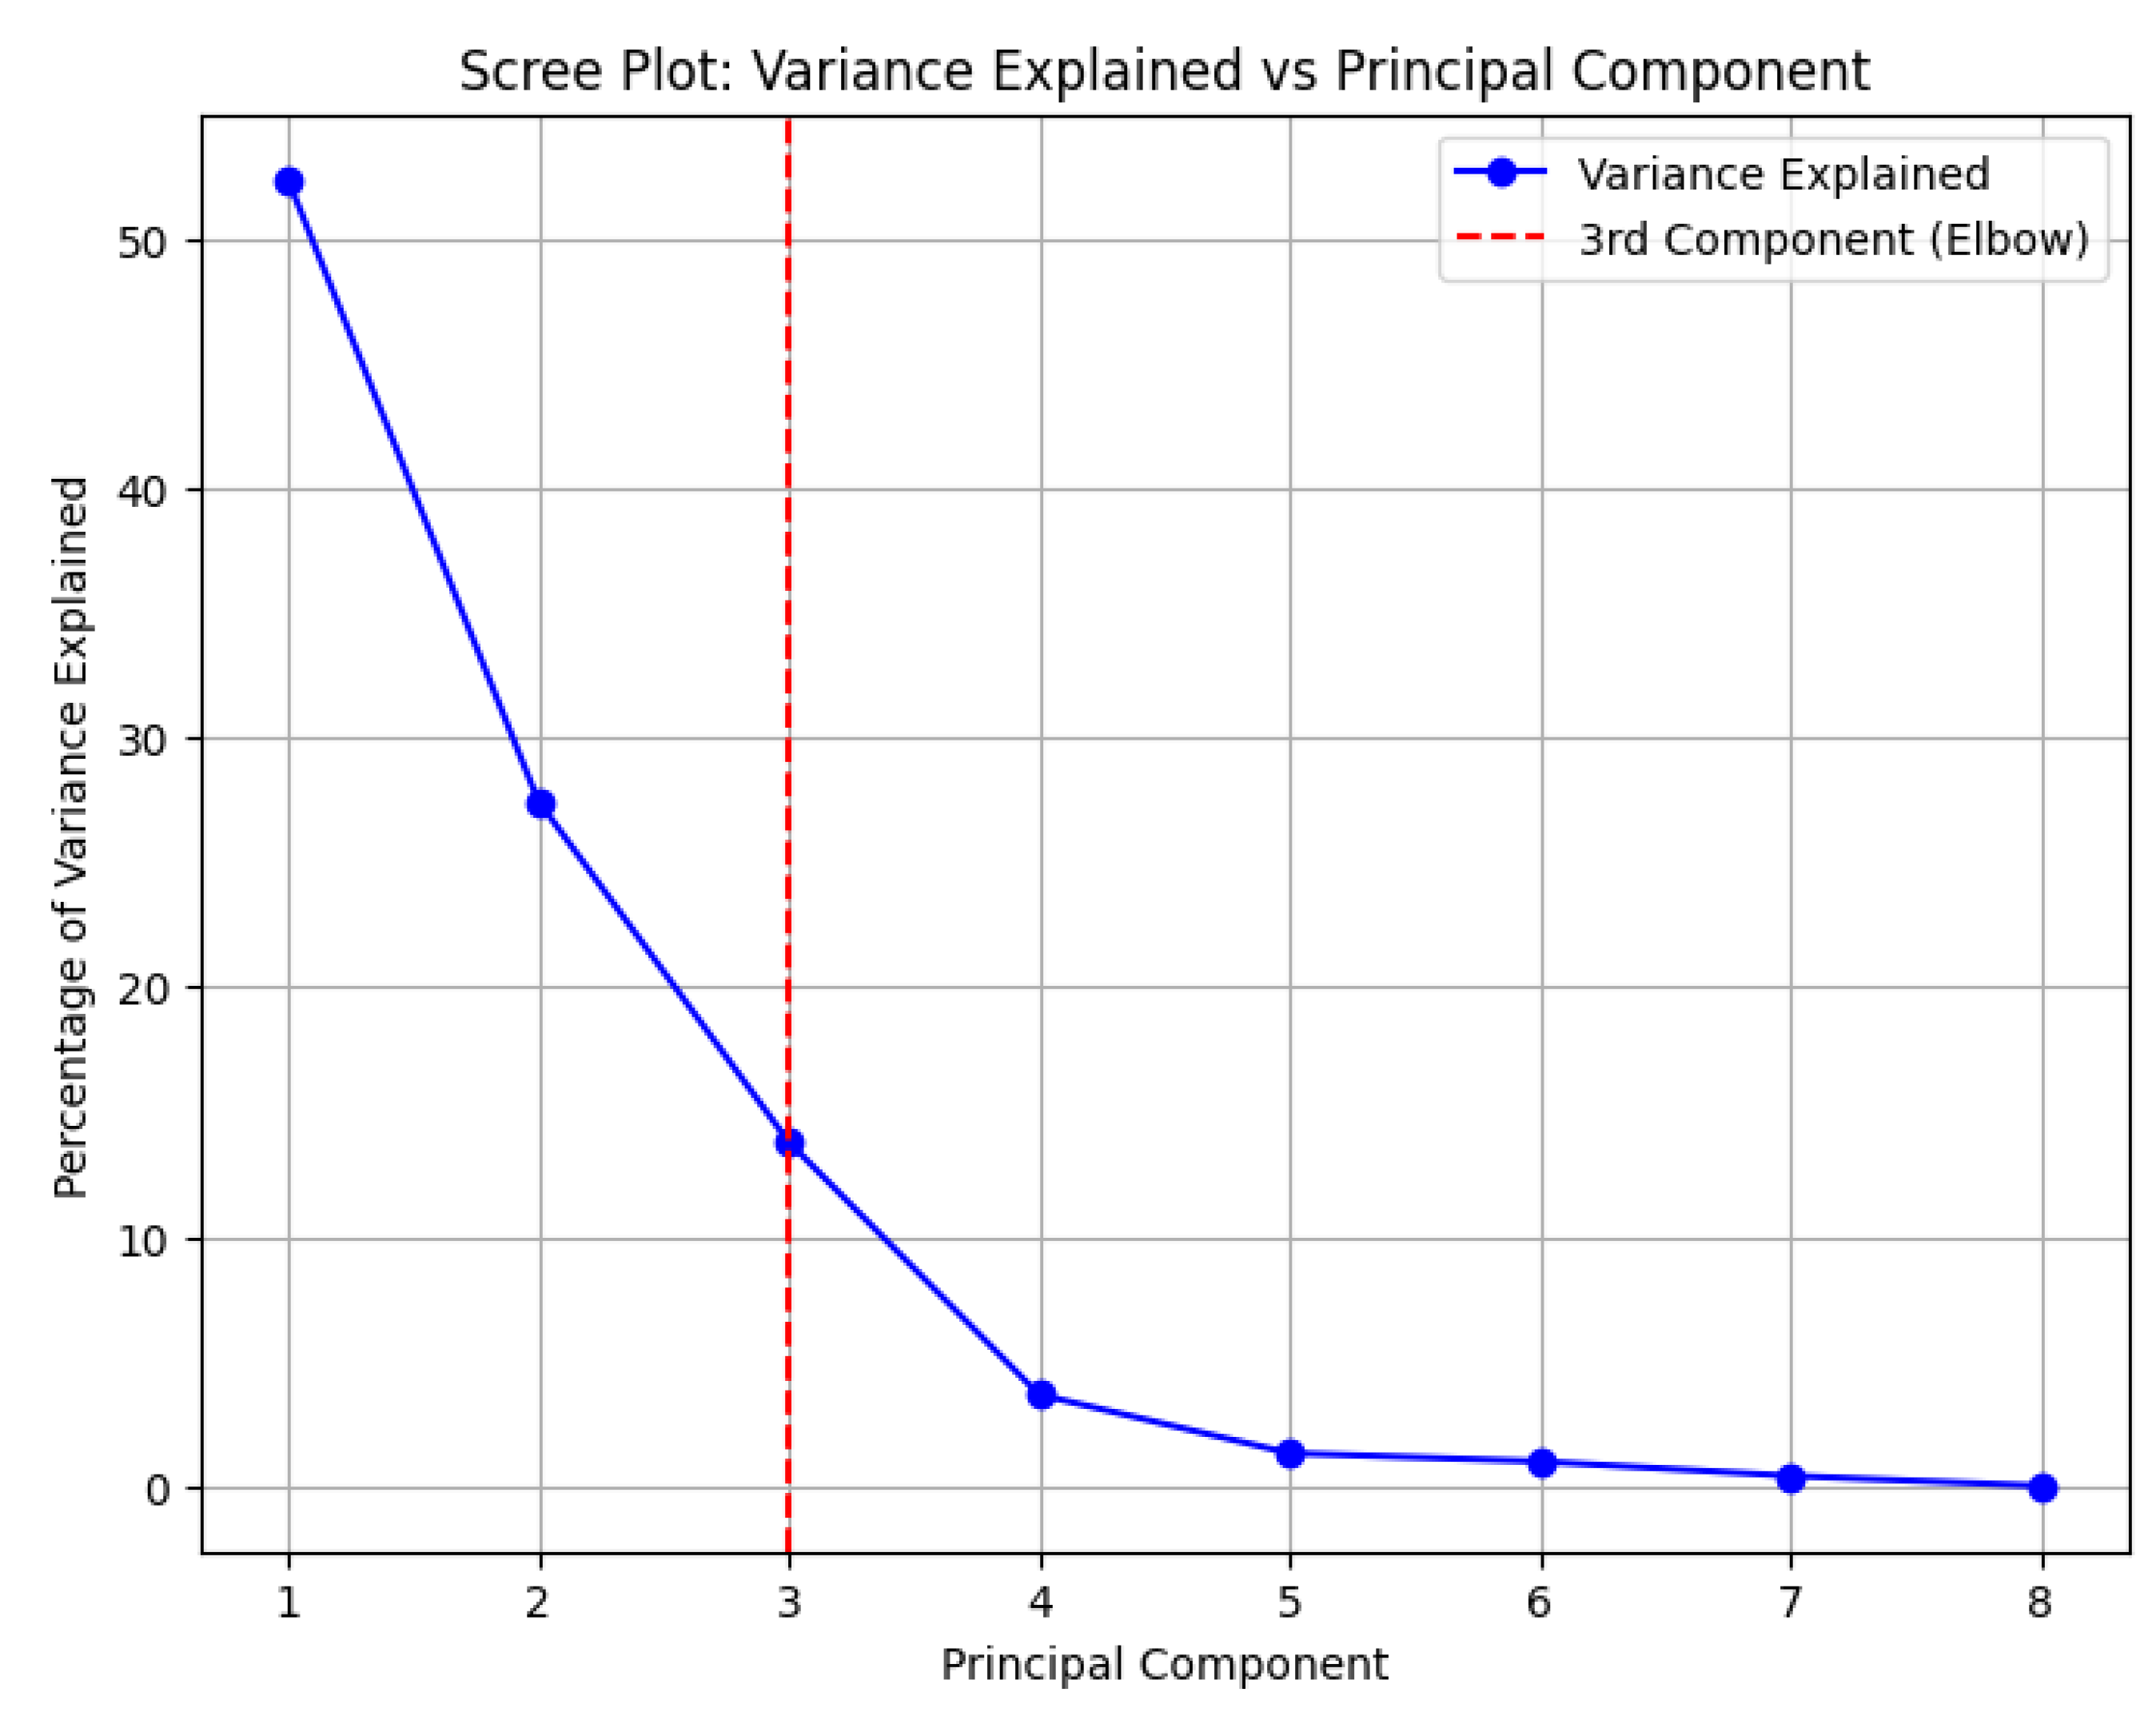
Figure 3.
Weekly trend of mean Fixation Characteristics (PC2), our objective indicator of visual fatigue. Values start negative on Monday—indicating less stable, shorter fixations typical of a rested visual system—and increase steadily through Friday, reflecting longer, more stable fixations typically associated with cumulative visual fatigue.
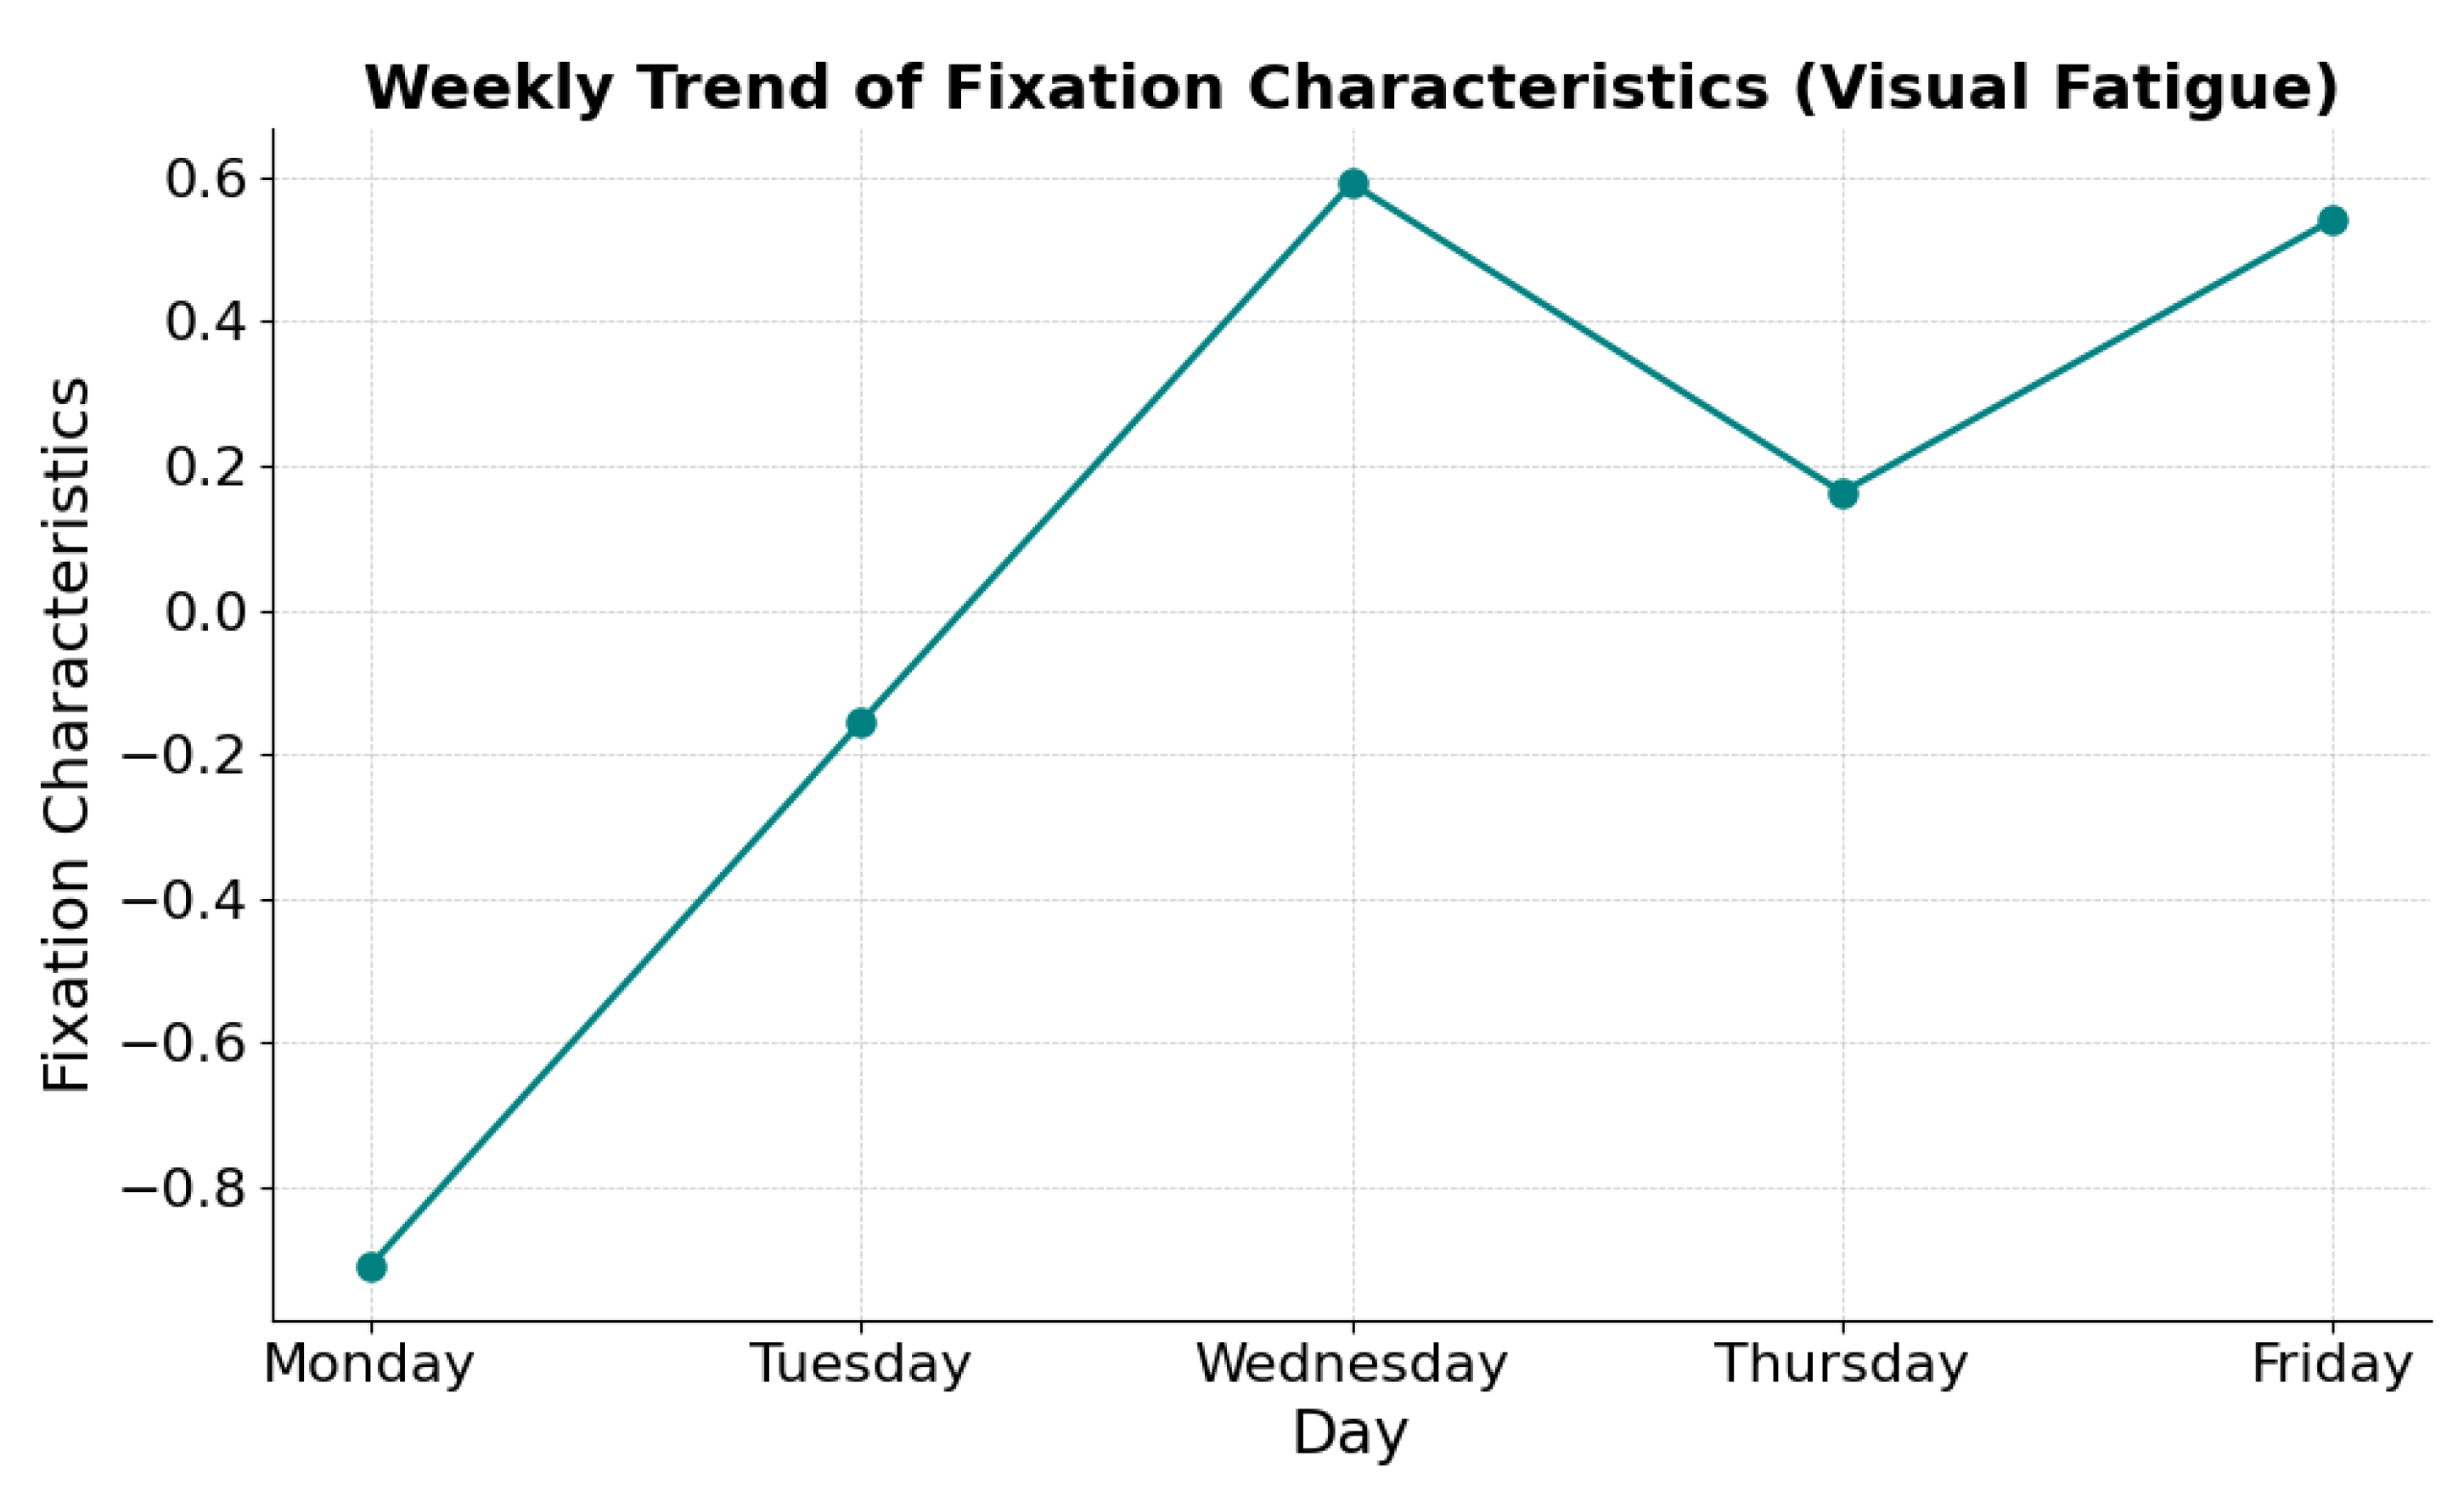
Figure 4.
Weekly trend of mean Overall Visual Engagement (PC1). The curve shows high engagement at the beginning of the week, a significant drop midweek (Wednesday), and a partial recovery before tapering off again on Friday.
Figure 4.
Weekly trend of mean Overall Visual Engagement (PC1). The curve shows high engagement at the beginning of the week, a significant drop midweek (Wednesday), and a partial recovery before tapering off again on Friday.

Figure 5.
Mean Visual Fatigue Scale scores reported across different lot sizes. Results show a steep increase in perceived visual fatigue from Lot 1 to Lot 10, which then stabilizes through Lot 100 before decreasing slightly for Tray 1 and peaking sharply in Tray 2.
Figure 5.
Mean Visual Fatigue Scale scores reported across different lot sizes. Results show a steep increase in perceived visual fatigue from Lot 1 to Lot 10, which then stabilizes through Lot 100 before decreasing slightly for Tray 1 and peaking sharply in Tray 2.
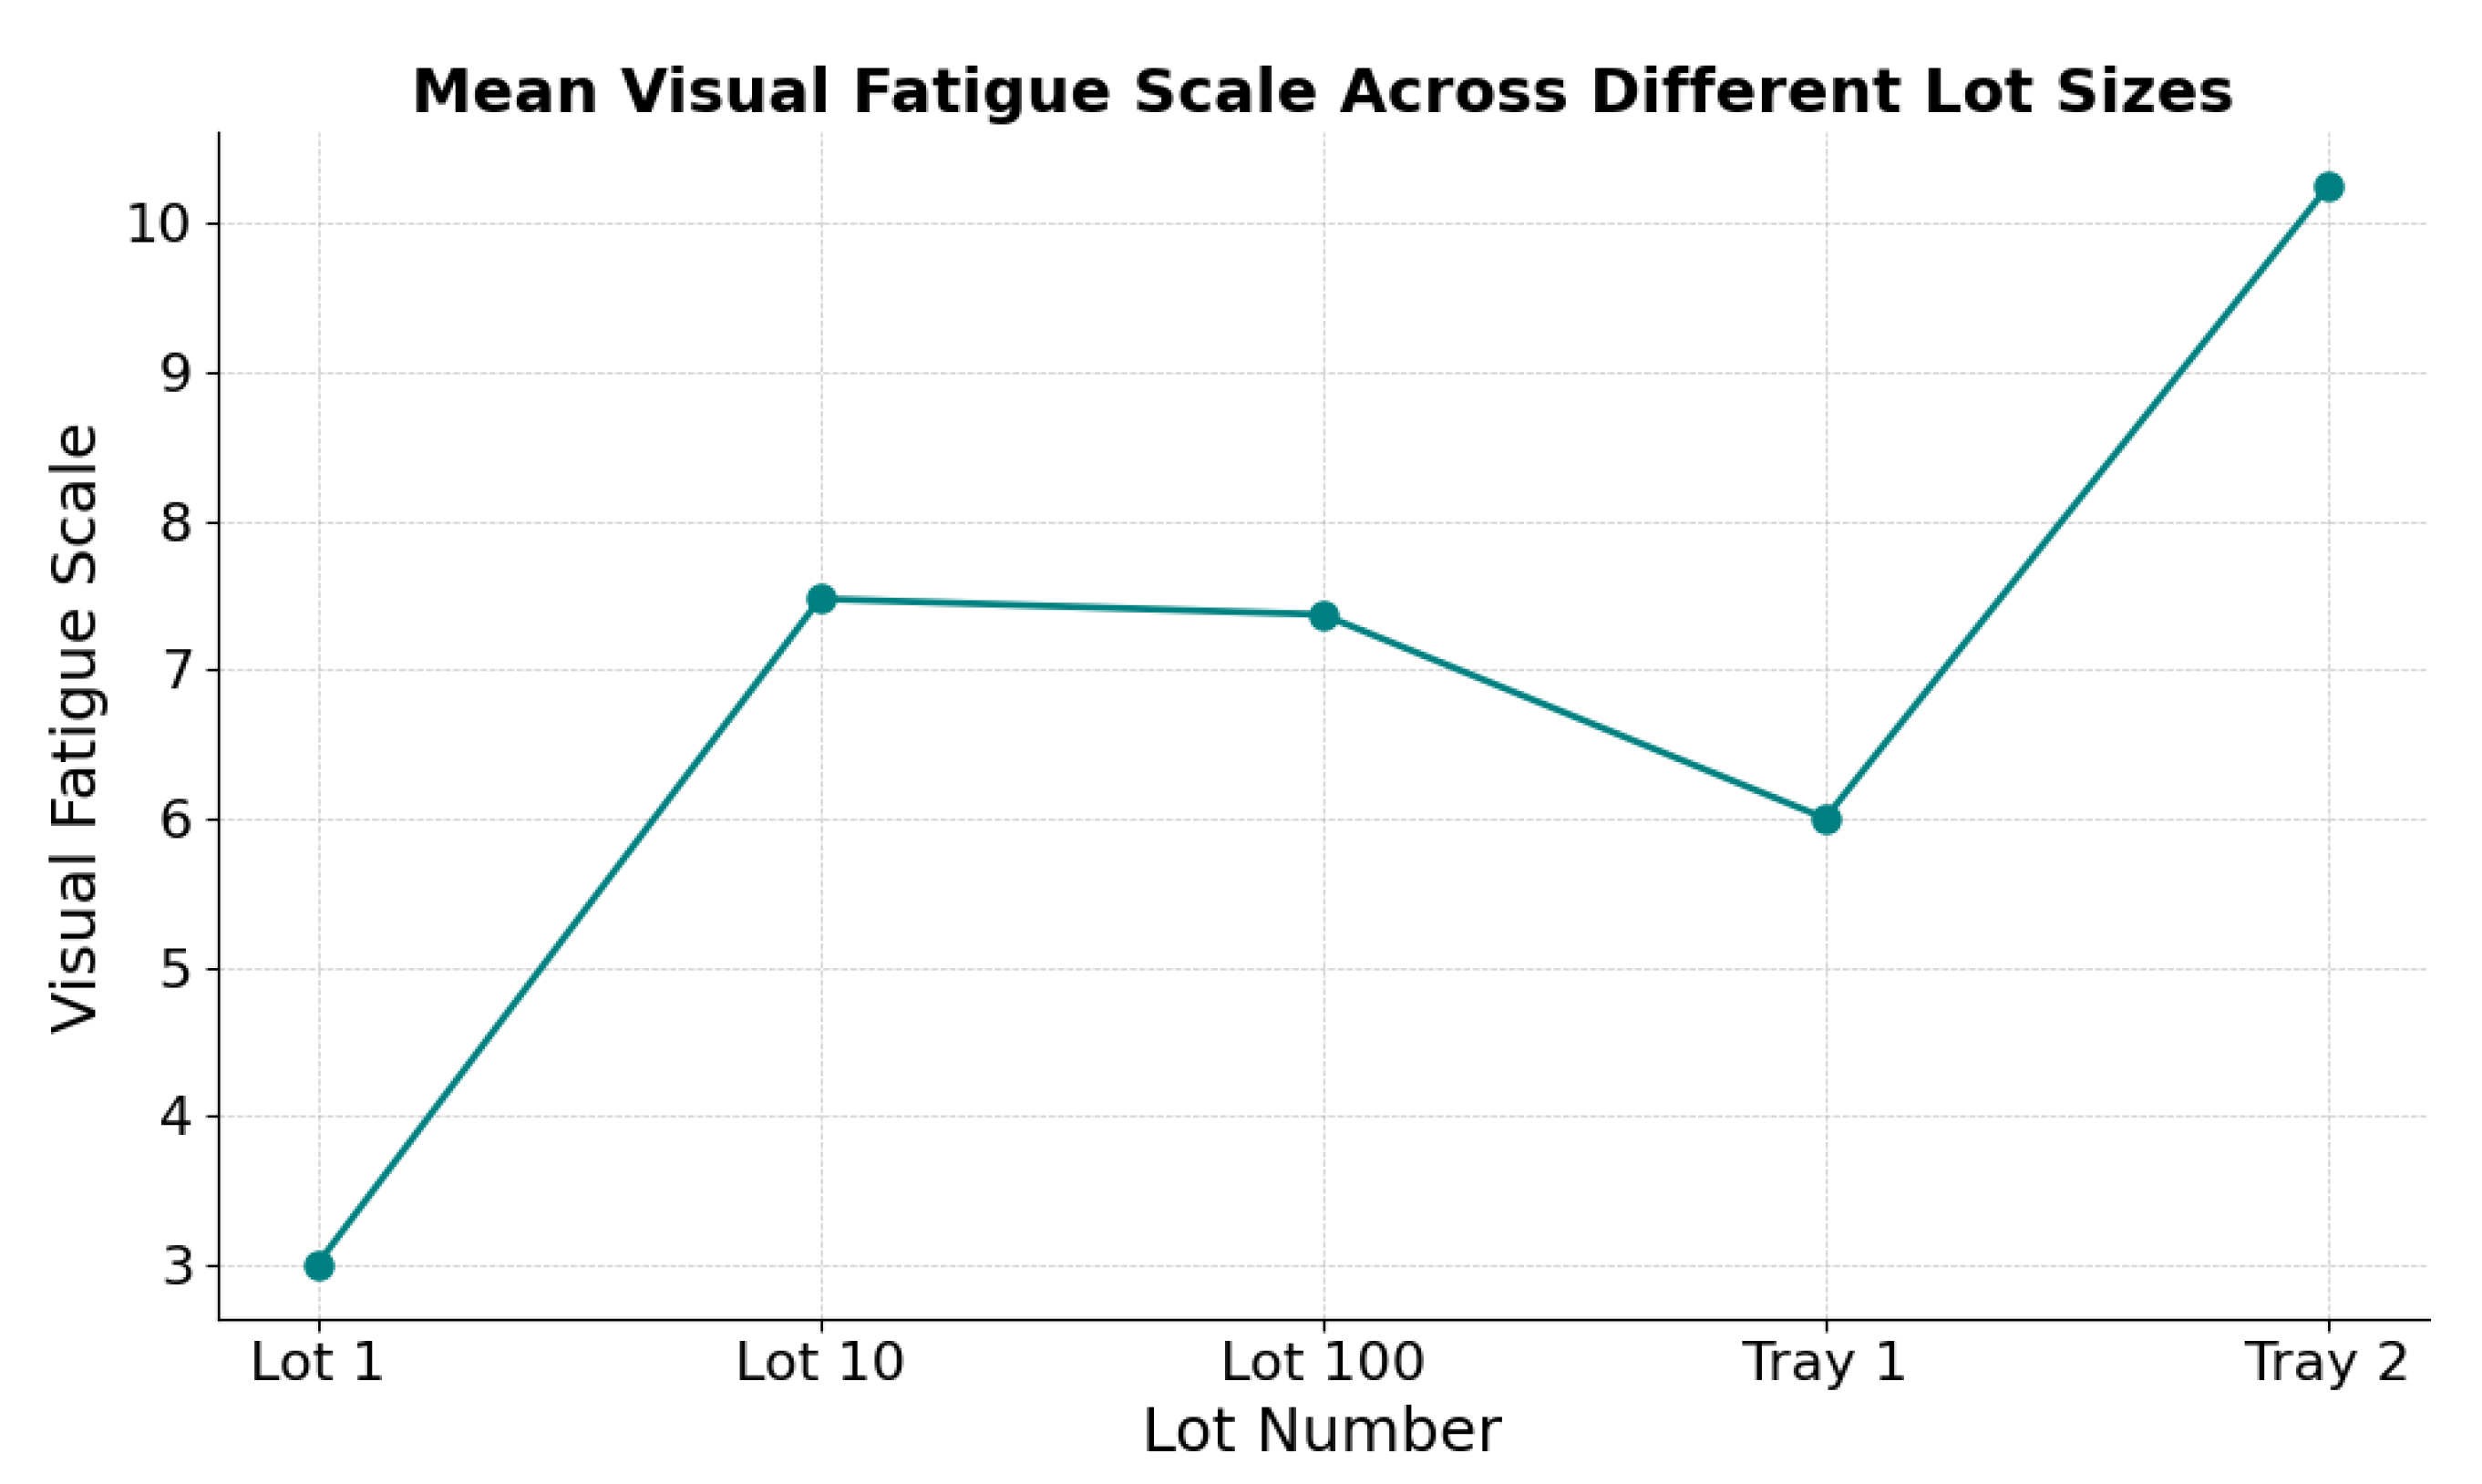

Table 1.
Rotated Component Matrix for the seven eye-tracking metrics.
| Variable | Principal Component | |||
|---|---|---|---|---|
| 1 | 2 | 3 | ||
| Tot Visit dur | 0.981 | |||
| Tot fixation dur | 0.969 | |||
| Fixation Count | 0.944 | |||
| % total activity time | 0.936 | |||
| % gazes are fixation | 0.963 | |||
| Avr Fixation dur | 0.904 | |||
| Avr Visit dur | 0.942 |
Table 2.
Rotated Component Matrix for the seven eye-tracking metrics.
| Eye Movement Parameters | Change with Visual Fatigue |
|---|---|
| Fixation frequency | ↓ |
| Total fixation duration | ↑ |
| Average fixation duration | ↑ |
| Percentage of Gazes as Fixations | ↑ |
| Average fixation angle: left eye | ~ |
| Average fixation angle: right eye | ~ |
| Total saccade duration | ↓ |
| Average saccade duration | ↓ |
| Average saccade magnitude: left eye | ↓ |
| Average saccade magnitude: right eye | ↓ |
| Maximum saccade magnitude: left eye | ↓ |
| Maximum saccade magnitude: right eye | ↓ |
| Blinking frequency | ↑ |
| Average blinking duration | ↑ |
| Average rotation angle: left eye | ~ |
| Average rotation angle: right eye | ~ |
| Pupil diameter | ↓ |
↑: Increase with visual fatigue; ↓: Decrease with visual fatigue; ~: Little to no change.
Disclaimer/Publisher’s Note: The statements, opinions and data contained in all publications are solely those of the individual author(s) and contributor(s) and not of MDPI and/or the editor(s). MDPI and/or the editor(s) disclaim responsibility for any injury to people or property resulting from any ideas, methods, instructions or products referred to in the content. |
© 2025 by the authors. Licensee MDPI, Basel, Switzerland. This article is an open access article distributed under the terms and conditions of the Creative Commons Attribution (CC BY) license (http://creativecommons.org/licenses/by/4.0/).
Copyright: This open access article is published under a Creative Commons CC BY 4.0 license, which permit the free download, distribution, and reuse, provided that the author and preprint are cited in any reuse.


