
Submitted:
04 August 2025
Posted:
05 August 2025
You are already at the latest version
Abstract
Design and development of scaffolds play a crucial role in tissue engineering. In this regard, the study aims to establish the influence of porosity on the morpho-structural, physical-chemical and biochemical characteristics of the polylactic acid (PLA) and/or polycaprolactone (PCL) scaffolds, in order to be considered candidates for tissue reconstruction. The results indicated that binary PLA-PCL and PCL matrices are more suitable than PLA, due to their higher crystallization degree. FTIR results showed that the hydrogen bond preponderance decreases with the porosity, revealed by the FTIR bands displacement in the more porous samples. A 28% increase in the PLA-PCL porosity led to a decrease in crystallization by 60%, but to an increase of water, glucose and blood components uptake by 188, 178 and 28%, respectively. Moreover, PLA-PCL scaffold was more stable to the lipase action than neat PLA, as a result of the lower density of ester groups and high crystallization degree. Lactobacillus growth increases with porosity and was found to be more pronounced on PLA-PCL. All these results show that the more porosity of the binary PLA-PCL matrices, as well as of the single PLA or PCL polymers is an essential factor influencing theirs crystallinity, nutrients uptake, biodegradability and toxicity.
Keywords:
polylactic acid
; polycaprolactone
; porosity
; crystallinity
; thermostability
; mechanical resistance
; nutrients uptake
; hydrophilicity
; biodegradability
; biocompatibility
1. Introduction
The design and development of scaffolds play a crucial role in tissue engineering. Their characteristics are essential for functioning as synthetic extracellular matrices [1]. A scaffold for tissue development may be partly viewed as an engineering challenge, in which a multiscale list of key requirements must be fulfilled to achieve an optimal process. Thus, the matrix must have mechanical strength, high porosity and large interconnected pores facilitating cell development and the circulation of nutrients and residues. Also, morphology is essential in creating surfaces conducive to cell adhesion. For example, a matrix can be used for soft tissue reconstruction only if it contains pores with a diameter between 200 and 250 μm [2]. In addition, the absorption capacity of organic matter (carbohydrates, protein), as well as the resistance to enzymatic action are important [3]. In the literature, a large variety of materials have been proposed for ligament scaffolds, including polyetheretherketone (PEEK), polylactic acid (PLA), polyglycolic acid (PGA), polycaprolactone (PCL), and copolymers based on them such as copolymer PLA-PGA (PLGA) and copolymer (PLA-PCL) PLCL for their biodegradability and material characteristics [2]. PCL is intensively used for tissue reconstruction due to its biocompatibility and hydrophobic character that ensures cell adhesion [3]. PCL is a thermoplastic polymer with a low melting point and high elasticity, but with low mechanical and thermal resistance. In this sense, combining it with other types of biomaterials could be a solution to improve these drawbacks, to achieve the ideal characteristics of a scaffold for tissue reconstruction. PLA is one of the most compatible thermoplastics with scaffolding potential for tissue reconstruction. It has mechanical resistance and stability even at higher temperatures. It exhibits shape memory performance comparable to that of PCL [3]. Kumar et al. [3] developed PCL-PLA matrices by porogen leaching, considered the most acceptable composites for tissue reconstruction, in the form of interspersed PCL-PLA failures. The results showed that the mechanical properties, adhesion and cell proliferation were superior in the case of the PLA-PCL composite than for neat PCL. Other studies have reported successful testing of the PLA-PCL compound as a stent [4] or as a bone substitute in dogs, following the association with hydroxyapatite [5]. Apart from soft tissue reconstruction, PCL is also studied as a substitute biomaterial for other organs such as the dermis [6], nerve [7] or myocardium [8]. Chen et al. [6] reported a fetal dermis-inspired architectural scaffold designed for scarless dermal regeneration with polycaprolactone/collagen/hyaluronic acid, fabricated successively through porogen-leaching and electrospinning methods, demonstrating desirable hydrophilic properties and wettability, fibroblasts proliferation and no excessive inflammatory reaction, denoting good biocompatibility and a prospect of tissue engineering in vivo. Rejali et al. [8] developed polyglycerol sebacate/polycaprolactone/ reduced graphene oxide composite scaffolds for myocardial tissue engineering and they have proved that adding 2%wt reduced graphene oxide to the composite scaffold decreased the diameter and degradation rate, while increasing electrical conductivity and ductility. Mechanical evaluations revealed results close to the heart muscle’s elastomeric properties. Soltani Gerdefaramarzi et al. [7] have tested the PLA-PCL-graphene composite as a potential candidate for the reconstruction of the nerve tissue. They showed that the composite scaffold containing 50 wt% PLA, 48.5 wt% PCL and 1.5 wt% graphene satisfies the requirements for the peripheral nerve tissue. Porogen leaching is one of the oldest polymer processing technologies for porous product development. It is based on dispersing a template within a polymeric solution, gelling and removing of the template to result in a porous morphology. Porogen leaching applies to various polymers and the dissolution of “sacrificial structures” is a common feature in many fabrication approaches for vascularization and tissue reconstruction [9]. Yildirim et al. [1] combined the porogen leaching and supercritical drying with liquid CO2 to prepare polycaprolactone/graphene oxide microporous interconnected structures and showed that PCL-graphene oxide scaffolds do not possess any toxicity towards L-929 mouse fibroblasts. Another study [29] evaluated a multilayer electrospun scaffold composed of polyurethane (PU), platelet-derived growth factor (PRGF), and gelatin, on which human mesenchymal stem cells, fibroblasts, and Lactobacillus plantarum were cultured. The results showed that the presence of L. plantarum had a positive effect on cell viability and increased the activity of genes involved in fibroblast migration and proliferation. Although there are no specific studies on the direct interaction between PLA/PCL scaffolds fabricated by porogen leaching and L. plantarum, the combination of these elements could be explored for the development of biomaterials with antibacterial and probiotic properties. The incorporation of Lactobacillus plantarum into PLA/PCL scaffolds could offer benefits in infection prevention and tissue regeneration. After a literature review, it was found that information about the influence of porosity on morpho-structure mechanical strength, thermostability, nutrient absorption, biodegradability, hydrophilicity and biocompatibility of PLA and/or PCL-based materials is very reduced. In this regard, the purpose of this study is establish the influence of porosity on the above mentioned properties, considered essential for a biomaterial to be considered for tissue reconstruction.
2. Materials and Methods
2.1. Reagents
PLA was purchased from Nature Works Minnetonka, USA. Dicloromethane, silver nitrate, monopotassium phosphate, di-sodium phosphate and ethanol (96%) were purchased from Chemical Company (Romania). Sodium chloride, pancreatic lipase and glucose were purchased from Merck (Germany). Albumin and the reagents used for glucose and albumin analysis were purchased from Biosystem (Romania). The biocompatibility evaluation of the scaffolds was performed using a probiotic powder containing viable Lactobacillus plantarum (Swanson®, Fargo, ND, USA).
2.2. Preparation of Scaffolds
The precursors and quantities used to prepare the scaffolds are presented in Table 1. PLA is of the Ingeo™ Biopolymer 4043D type. PCL is the 6-caprolactone polymer, with Mn 80 000. The scaffolds were prepared by porogen leaching, by using sodium chloride as porogen, according to the procedure described by Yildirim et al. [1] with some changes. The amount (Table 1) of PLA and/or PCL indicated in Table 1 was mixed with the dichloromethane at room temperature under magnetic stirring (250 rpm), until completely dissolving of the PLA and/or PCL granules, respectively. Then, sodium chloride granules were added, followed by manual homogenization for 2 minutes and distribution into Teflon vessels with 2 cm diameter. The samples dried in air for 48h were washed in distilled water to remove the sodium chloride from the pores, until the negative reaction in the presence of 5%(wt) aqueous solution of silver nitrate. At the time the solution did not contain a white precipitate or a cloudy silver cloride the washing was considered complete (Table 1). Then, the samples were allowed to dry at 400C for 36 h in the oven.
2.3. Characterization of Scaffolds
2.3.1. Morphology and Elemental Analysis
The scaffolds`morphology was determined by optical and scanning electron (SEM) microscopy. A BRESSER LCD Micro Microscope with a magnification 10X was used to collect the micro-images. The SEM images were recorded with a Jeol ARM 200 CF SEM Cs system. The samples were covered with a thin layer of carbon to enable surface conductivity. Elemental analysis was determined by energy-dispersive X-ray spectrometry (EDXS). An energy-dispersive X-ray spectrometer (SDD), model Jeol Centurion was used. The working potential was set to 80 kV.
2.3.2. Structure
The scaffolds` structure was investigated by X-ray diffraction (XRD) and Fourier-Transformed-InfraRed Spectroscopy (FTIR).
A Shimadzu X-ray diffractometer (XRD 6000, Kyoto, Japan) operated with CuKα radiation (λ=1.54 Å) and Ni filter was used to investigate the crystallization degree of the scaffolds. The diffraction patterns were recorded in 2θ range from 10° to 80° with a scan speed 2°/min. The crystallinity rate of the sample was calculated with the following equation:
(1)
where the Icrystalline and Itotal were calculated by FullProof Suite software. The primary crystallite size of the materials was calculated using the Scherrer equation.
A Perkin Elmer Spectrum BX spectrometer was used to collect the FTIR spectra. The wavenumber ranged from 4000 to 600 cm-1. Each FTIR spectrum is the average of 8 measurements. The resolution was 4 cm-1. The transmittance values from the FTIR spectra were standardized, by using the formula: standardized value = (experimental value – average value)/standard deviation, in order to be able to compare the results.
2.3.3. Differential Thermal Analysis (DTA) and Thermogravimetry (TGA)
For thermal and thermogravimetric measurements, a DTG-60H Derivatograph (Shimadzu Corporation, Kyoto, Japan) recording simultaneously the differential thermal analyses (DTA) curve and the thermogravimetric (TGA) curve was used. The sample support was an alumina crucible covered with a perforated alumina lid, and the reference material was α-alumina.. The samples were heated between 30 and 5000C, with a heating rate of 10°C/min, in a nitrogen atmosphere with a flow of 70 mL/min.
2.3.4. Physical-Chemical Characterization of the Scaffolds
The relative densityof the matrices was determined by dividing the mass of the sample by its volume, considered cylindrical. Thus, the relative density (d) was calculated with the formula:
(2)
Where: d – relative density (g/cm3); m – sample mass (g); r – radius (cm); h – height (cm).
The relative porosity was determined by measuring the volume of distilled water absorbed by the sample mass in the process. The relative porosity was calculated with the formula:
(3)
Where: P – relative porosity (cm3/g); VH2O – water volume absorbed by sample until equilibrium was reached (cm3); m – sample mass (g).
The water retention capacity was determined by immersion for 48 h in distilled water the matrix with the initial known mass for 48 h, followed by draining and weighing. The water retention capacity (WRC) was calculated with the formula:
(4)
Where: mf – final mass of the sample (g); m0 – initial mass of the sample (g).
The tensile strength (kN/m2) was determined as the pressure applied to break a cylindrical-shaped scaffold (4 cm diameter / 1 cm thickness). The parameter was calculated as follows:
(5)
Where: TS – tensile strength (kN/m2); m – mass that breaks the scaffold (kg); g – gravitational acceleration (9.81 m/s2); d – the thickness of the wire by which the matrix is suspended (m); h – matrix thickness (m);
The wettability of the scaffolds was determined by measuring the contact angle by using the ImageJ’s measurement tool. The images in .jpeg format at minimum compression were captured by using a Canon 80D digital single reflex camera and were saved as the camera default, at maximum resolution.
The glucose uptake and release were carried out by immersing a weighted piece of matrix in 10 mL of 0.25% glucose solution for 3 hours at 37ºC. The concentration of the glucose not absorbed was established using the BTS-350 spectrophotometer. Glucose generates, through the coupled reactions (r1) and (r2), a colored complex that is spectrophotometrically measured.
(1)
(2)
The released glucose was determined by immersing the 3D scaffolds obtained after the glucose uptake in distilled water for 24 h at 370C, followed by the determination of the glucose concentration according to the above described procedure.
The absorption and release of albumin were carried out by immersing a weighted piece of matrix with the known mass in 5 mL of albumin solution (49.2 g/L) prepared in a phosphate buffer solution with pH 7.2. The phosphate buffer solution was prepared by combining 20 mL of monopotassium phosphate solution (KH2PO4) (9.8 g/L) with 80 mL of disodium phosphate solution (Na2HPO4) (9.479 g/L). The samples were stored for 3 hours at 37ºC and were analyzed using the BioSystems BTS-350 spectrophotometer. The albumin in the sample reacts with bromochresol green in an acidic medium, forming a colored complex that can be measured spectrophotometrically at 630 nm.
The released albumin was determined by immersing the 3D scaffolds obtained after the albumin uptake in distilled water for 24 h at 370C, followed by the determination of the albumin concentration according to the above described procedure.
2.3.5. Bio-Chemical Characterization of the Scaffolds
In vitro biodegradability under the action of pancreatic lipase was determined by monitoring the mass variation of the matrix after 7, 14 and 21 days of storage in solution containing the enzyme with different concentrations (60 µg/mL, 40 µg/mL and 20 µg/mL respectively), following storage at 37 ºC. Biodegradability (B) was determined with the formula:
(6)
Where: mf – final mass of the sample (g); m0 – initial mass of the sample (g).
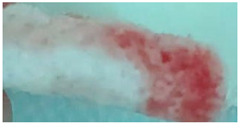
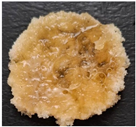
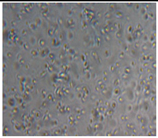
The absorption capacity of blood components was monitored by immersing the scaffold in 2 mL of freshly collected pig's blood on anticoagulant (citric acid). The samples were kept for 24 hours at 37ºC, after which they were washed with distilled water. The appearance of the samples after fixation of the blood components was analyzed both macroscopically and using a Bresser optical microscope (10x magnification). The capacity of the scaffold to absorb the blood components was tested by recording the UV-Vis spectrum (250-700 nm) of the blood remaining after immersing the scaffold and determining the absorbance with the highest units, namely at 278, 347, 412, 544 and 579 nm, respectively. A Perkin Elmer Lambda 35 spectrophotometer was used. The amount of the absorbed blood components by the scaffolds was determined as the measured absorbance (a.u.)/mL absorbed blood/g scaffold. The University Ethics Commission of the Technical University of Cluj Napoca approved with registration no. 667/6.12.2024 the manipulation of biological products for this study.
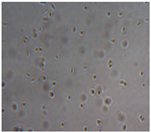
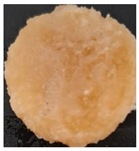
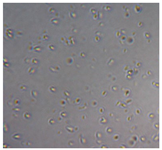
The biocompatibility of the scaffolds was determined by testing the development capacity of Lactobacillus plantarum. The circular-shaped sample (1 cm in diameter) was sterilized by immersion in 75% ethanol solution for 24 hours at room temperature, then washed with phosphate buffer solution of pH 7.2 sterilized at 121 0C, for 15 minutes. The sterilized sample was immersed in MRS Agar medium (Oxoid Ltd., Basingstoke, UK) sterilized and cooled at 450C and left for 2 hours for soaking, after which it was seeded with 0.5 mL suspension containing 5.5 x 10⁸ colonies of Lactobacillus plantarum. The samples were analyzed at different time intervals and in parallel, in vivo microscopic preparations were performed to evaluate the developed Lactobacillus culture.
2.3.6. Statistical Analysis
Density, porosity, WRC, tensile strength and glucose, albumin and blood components uptake were performed in triplicate and the mean and standard deviation were determined according to the mathematical procedure described by Mihaly Cozmuta [10].
3. Results
3. Results and Discussion
3.1. Morphology and Elemental Analysis
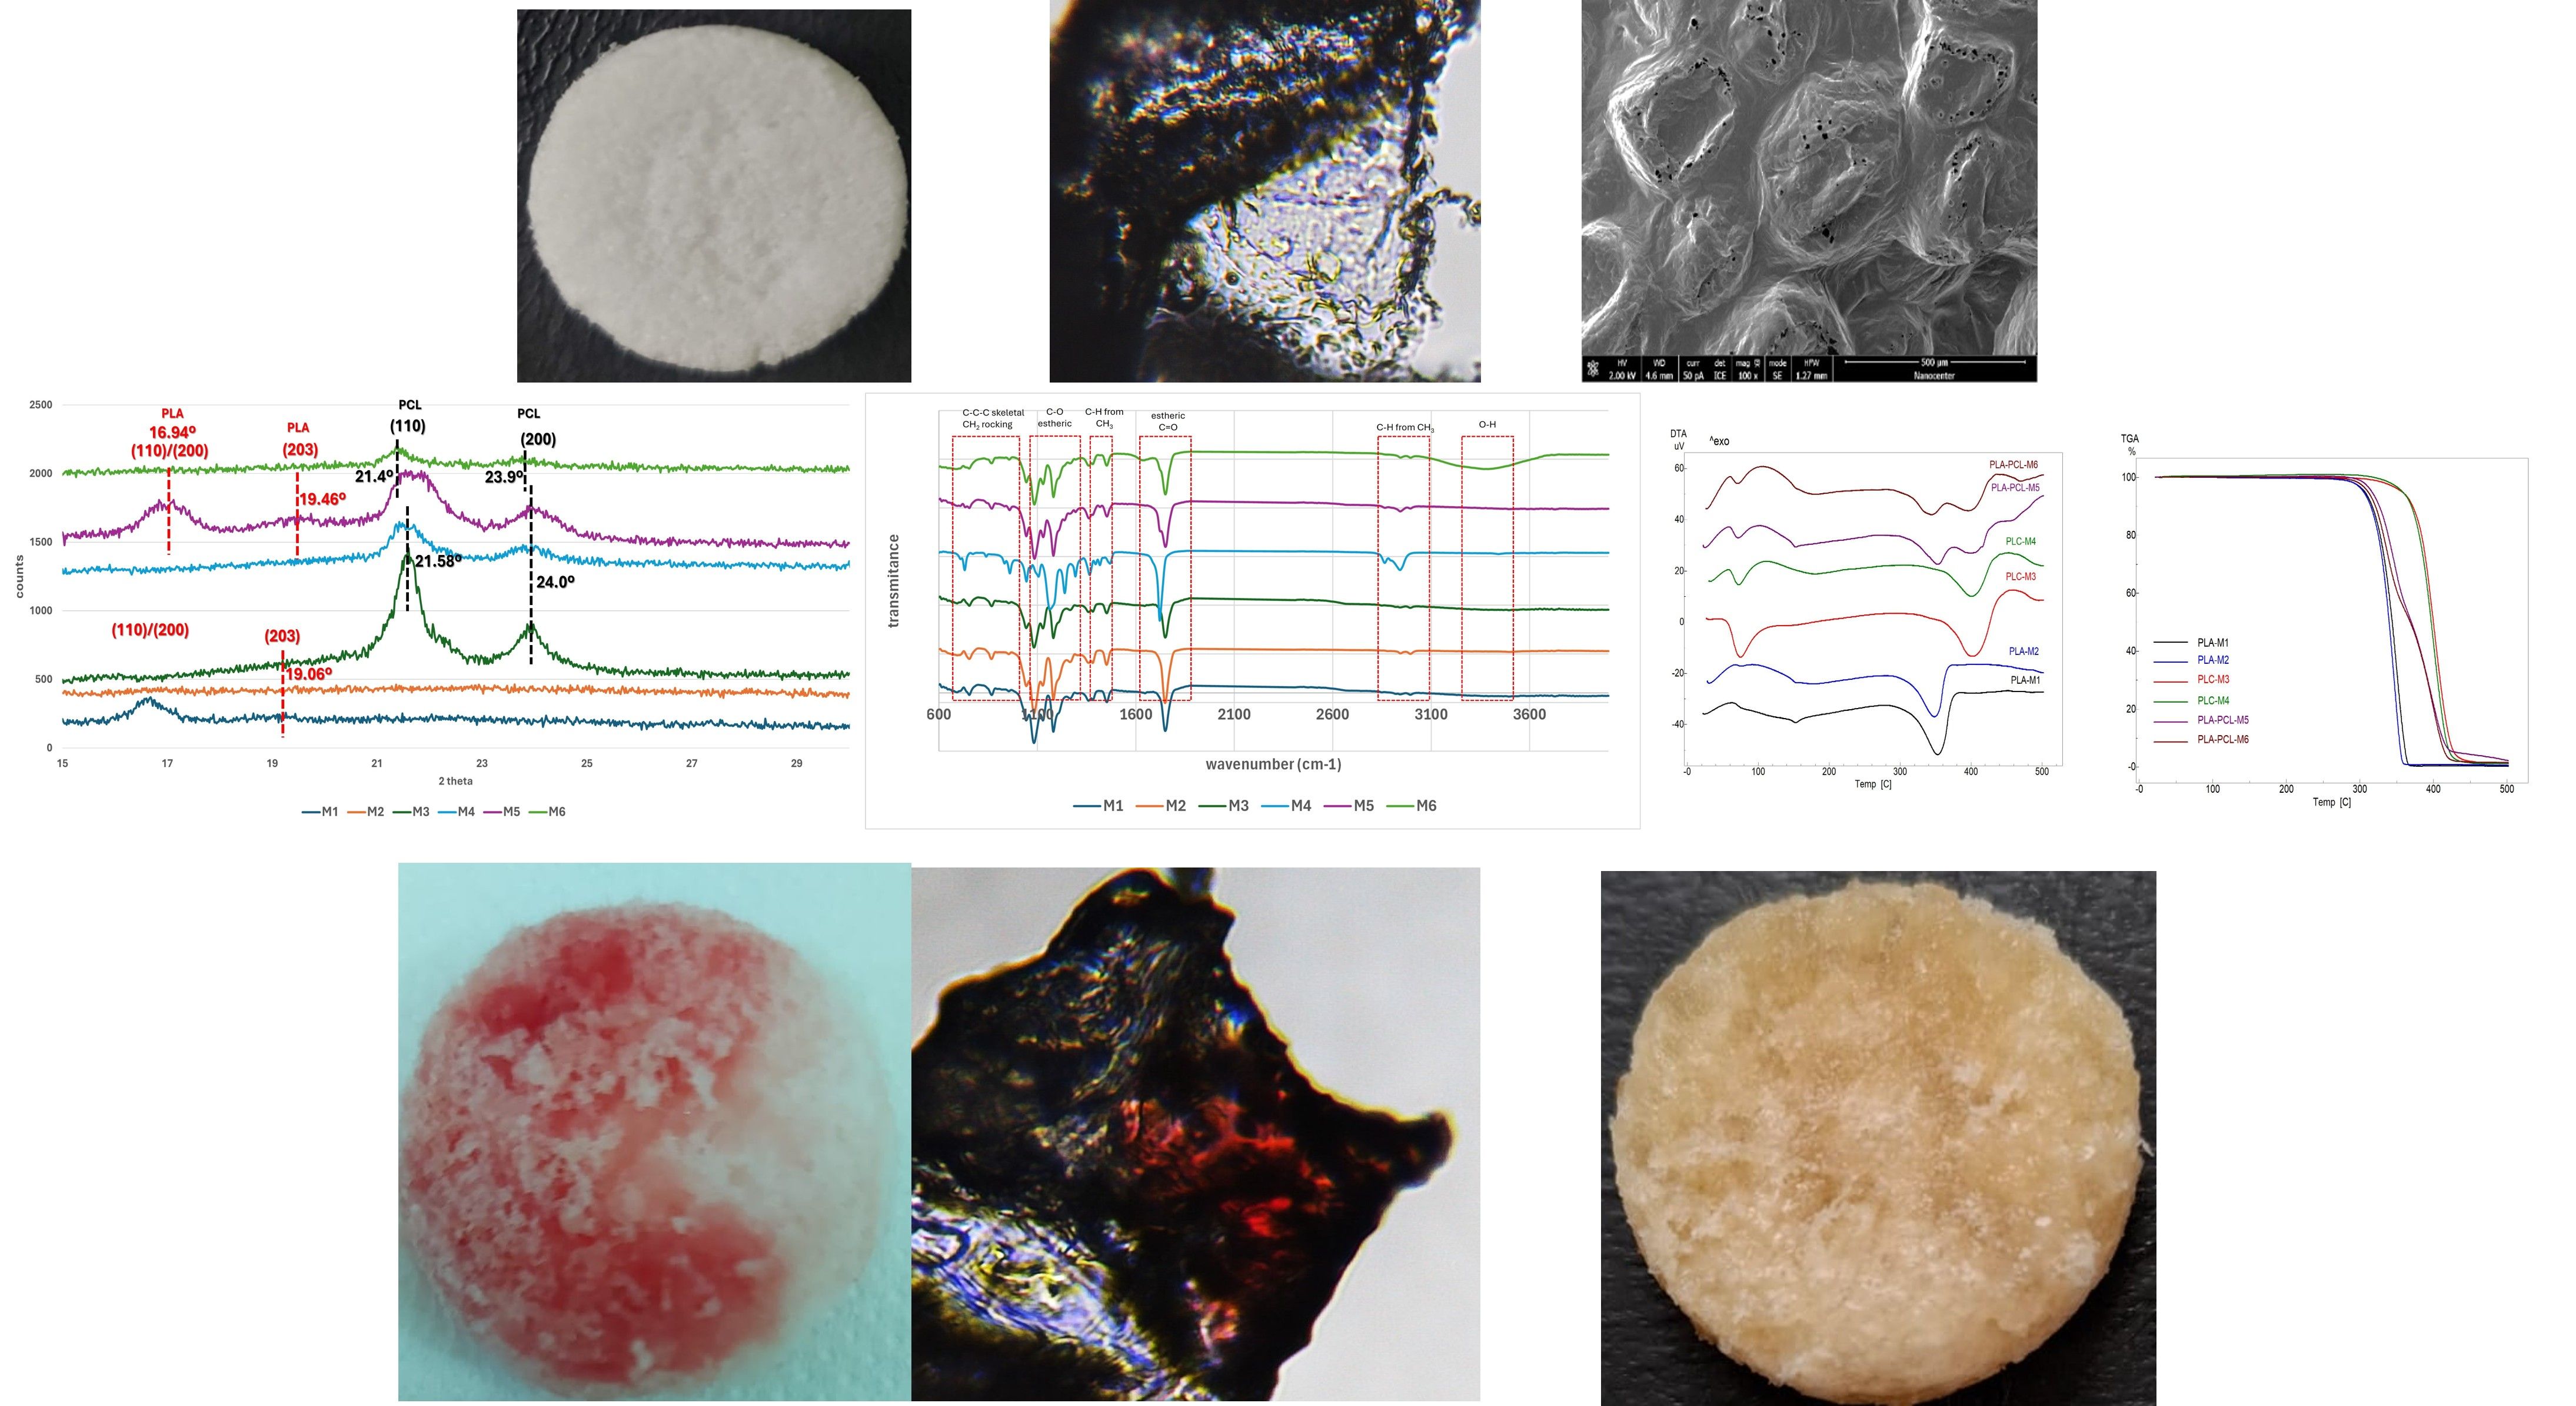
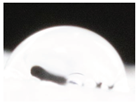
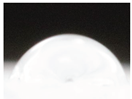
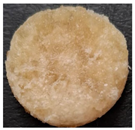
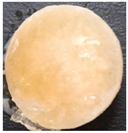
Macroscopically, the samples are white. Those prepared by using a higher amount of sodium chloride (M2, M4 and M6) are more porous and softer when piped (Table 1), while those prepared by using less sodium chloride (M1, M3 and M5) are more compact and a little rougher when piped (Table 1). There is no macroscopically observable difference between PLA and PCL.
The optical microscopy images show that the PLA filaments in the M1 and M2 samples as well as the PCL filaments in the M3 and M4 samples are interconnected (Table 2). Differences between the PLA samples (M1 and M2) and the PCL samples (M3 and M4) appear, namely the edge of the PLA matrix is more rounded and does not form filamentous ends, explained by the shorter hydrocarbonate chain. In contrast, the microscopic images of the M3 and M4 samples show a more filamentous structure given by a larger number of methylene groups from the PCL structure (Table 2). The M3 sample is more compact than the M4. A combination of compact and lax phases, corresponding to PLA and PCL respectively, is observed in the case of PLA-PCL matrices (M5 and M6 samples).
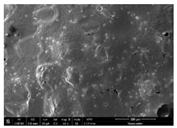
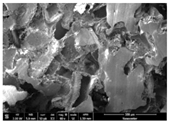
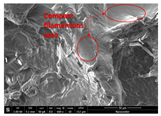
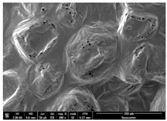
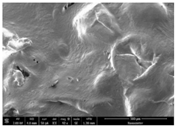
The SEM images (Table 2) show a compact structure in which the pores generated because the porogen dissolution can be seen. The samples prepared with the higher mass of porogen are, as expected, more porous, containing larger pores than those of the samples with the lower amount of porogen. The surface of the M1 and M2 samples (PLA samples) is rougher than that of M3 and M4 (PCL), M5 and M6 (PLA-PCL). The SEM image of the M3 sample also shows the filamentous areas (red circles) confirmed by the optical images. Hussain et al. [11] also developed PLA-based films modified with graphene oxide and their SEM images showed the compact, homogenous, and smooth surfaces, indicating the high quality of PLA films. They also proved by SEM images the presence of reinforcements in the PLA matrix. Zain et al. [12] also prepared PLA-PCL scaffold samples that exhibited a wide pore size distribution (ranging from 100 to 500 μm).
Table 3 illustrates the EDXS results. The carbon ranges between 55.6 and 72.5 wt%, oxygen between 27.5 and 44.4 wt%. The presence of chloride, sodium and kalium in M1, M2 and M6 samples revealed that the porogen was not completely removed during washing, but the remaining amounts are very low.
3.2. Structure of the Scaffolds
The XRD profiles of the scaffolds are presented in Figure 1. Generally, PLA crystallizes in α, α', β, and γ crystal forms depending on the different crystallization conditions [13].
The PLA-containing matrices prepared with the lowest amount of porogen (M1 and M5) show an intense crystallization reflection at 16.64◦ in M1 sample, corresponding to the 110 and 200 planes of the orthorhombic crystal structure, suggesting the presence of PLA in the α crystalline form [14,15], results confirmed by the thermogravimetric analyses. DTA showed that the melting point for PLA was in the range 152-1540C, characteristic for α crystalline PLA [32]. This signal was shifted to 16.94◦ in M5 sample, indicating that the presence of PCL slightly decreased the PLA`s crystallinity. This reflection does not appear in the XRD profiles of the samples prepared using the highest amount of porogen (M2 and M6). A sharp reflection appears at 19.06° and 19.46°, respectively in M1 and M5 samples, corresponding to the 203 plane of the PLA crystal structure [32].
Two strong reflections at 21.58° and 24° corresponding to the (110) and (200) planes of the orthorhombic crystal structure of PCL appear in the XRD profiles of M3 and M4 samples [1,16]. These reflections are shifted to 21.4° and 23.9°, respectively in M5 (PLA-PCL composite with the lowest porosity) as a result of PLA influence and are considerably reduced in M6 (PLA-PCL composite with the highest porosity).
The highest crystallinity was determined in the PCL-based scaffolds (samples M3 and M4), followed by the mixed materials (M5 and M6) and the lowest in the PLA-based ones (samples M1 and M2). The better crystallinity comes prevailingly given the minimized formation of defects [3]. It can be noted that in both PLA and PCL-based samples, the degree of crystallization decreases with the amount of porogen and, implicitly, with the porosity. An explanation could be as follows: crystallization involves two stages, nucleation and crystal growth; the crystallization centers are formed by the aggregation of particles during the nucleation process; subsequently, new particles are attached to the formed aggregates (crystallization centers) and thus the crystal growth takes place. Nucleation is favored by the small distance between particles and molecules [13]. The carbonyl groups in the polymer structure form intra- and intermolecular hydrogen bonds, which bring the polymeric chains closer together, favoring nucleation. The functional groups are spaced in the porous samples, the number of hydrogen bonds decreases and, implicitly, the polymer chains are distanced, thus reducing nucleation and, finally, crystallization [13]. The highest crystallinity degree and the largest crystallites in size have been determined for the PCL-based samples (M3 and M4) this contributing to the superior mechanical properties as demonstrated by the tensile testing. The results agree with those of Kumar et al. [3] who developed PCL-based filaments with different arrangements, suggesting that a high crystallinity degree of the materials confer a good mechanical resistance. The lowest structural characteristics correspond to the PLA-based samples (M1 and M2). According to Abdelhameed et al. [16], a reduced crystallinity degree with the porosity can also be explained also by the more predominant defects generated in the composite structure in comparison with the individual material (neat PCL).
However, the mixed PLA-PCL samples (M5 and M6) contain reflections characteristic of both PLA and PCL. Soltani Gerdefaramarzi et al. [7] prepared graphene-modified PLA-PCL matrices and had the same observation. They noted that the mixed matrix contained signals specific to both types of polymers. The degree of crystallization and the size of the crystallites of mixed PLA-PCL matrices are between those of individual PLA and PCL matrices. As regards the less porous samples, the crystallinity and the size of the crystallites of the PLA-PCL mixed sample (M5) are bigger than those of the PLA (M1 sample) and smaller than those of the PCL (M3 sample). The same variation is observed about the porous samples. In this regard, PCL and PLA-PCL scaffolds are more suitable for the manufacturing of smart scaffolds than PLA ones.
The chart in Figure 2 shows the standardized FTIR spectra of the samples. The standardized values of transmittance were calculated with the formula:
Standardized value = (experimental value – average)/standard deviation (7)
Characteristic vibrations for the O-H stretching at 3395 cm-1 are more pronounced in the FTIR spectrum of M6 sample [7,12,17,22,24,27,33]. The signals at 2996 and 2946 cm-1 are associated with the asymmetric and symmetric stretching of C-H bonds from CH3 groups in both PLA and PCL structures [7,12,17,24]. The interval 1722-1749 cm-1 corresponds to the stretching of C=O bonds from the ester groups [33]. In this interval, signal at 1725 cm-1 appears in the FTIR spectrum of M4 sample, assigned to the C=O stretching from the ester bond in a more amorphous material [34]. Signals at 1750-1752 cm-1 appeared in the FTIR spectra of the other samples are assigned to the vibration of C=O ester bonds from mixture PLA-PCL [7,12,24,35]. These results are in agreement with those achieved from the XRD patterns. Signals in the range 1456-1366 cm-1 are corresponding to the asymmetric deformation of methyl groups in PLA [33] and scissoring of methylene groups in PCL [17,22,27,34,35]. The frequency 1296 cm⁻¹ is present in FTIR spectra of both PLA and PCL-based samples and is corresponding to the etheric C-O-C stretching and C-H wagging in PLA [33] and C-C stretching and methylene twisting in PCL [34,35]. The signals in the range 1242-1044 cm-1 are attributed to the ester C-O stretching in PLA and ester C-C-O stretching in PCL [34,35]. The frequencies between 963 and 733 cm⁻¹ are relative specific and the signals at this interval is assigned to the skeletal C-C, C-H wagging in PLA [33] and to the methylene rocking and C-C-C bending in PCL [35]. As we already noted, the bands from the standardized FTIR spectra of M2, M4 and M6 are slightly misplaced, the most pronounced displacement being noted in the case of M4. The displacements can be generated by several factors including crystallinity degree [34,35] and the hydrogen bonds [17]. We have discussed above that M2, M4 and M6 samples contain a more dispersed network as a result of the highest amount of the used porogen. Thus, the hydrogen bond preponderance in these samples is lower in comparison with that in the samples M1, M3 and M5 and the difference in the hydrogen bond density could be the explanation for the bands displacement [17].
3.3. Differential Thermal Analysis (DTA) and Thermogravimetry (TGA)
The thermal behaviour of the scaffolds is observed in the DTA and TGA curves, illustrated in Figure 3a and Figure 3b. The maximum temperatures at which DTA events occur, and the mass losses observed in the thermogravimetric curves during the heating process are displayed in Table 4.
Because of their disordered structures, the samples M1 and M2 try to reach a more ordered phase when heated at 100°C. The weak exothermic signal that appears in the DTA curve (Figure 3a) of the two samples at ~63 and ~68°C, respectively, represents the glass transition temperatures (Tg), namely the point at which the PLA changes from a rigid, glass-like form to a more flexible, rubbery one [30]. The endothermic signal appearing at 152°C in sample M1 and at 154°C in sample M2 is due to the polymer melting (Figure 3 and Table 4). The next endothermic signal with a maximum at ~353°C in M1 and a maximum at ~ 347°C in M2 is associated with the thermal degradation of PLA, by cleavage of the ester bonds and the release of CO₂, lactic acids and other volatile products [13]. Thermogravimetric data showed (Figure 3b) that samples M1 and M2 have thermal stability up to 273°C and 275°C, respectively. The weight loss due to polymer decomposition was at 315°C ~8% in M1 and ~8.9% in M2, respectively.
The first endothermic signal with a maximum of 75°C for M3, and 72°C for M4, occurs because of the melting of the PCL polymer. The broad endothermic signal with the maximum at 181°C in the DTA curve of sample M4 could indicate preliminary cleavages of the polymer chain, the breaking of weak bonds in the polymer, or the removal of volatile impurities. The endothermic events at maximum peak ~402°C in M3 and at ~400°C in M4, is due to the thermal degradation of the polymer, through pyrolysis and ester bond cleavage processes [31]. The exothermic signals located at 455 and 453°C can be associated with the complete combustion of degradation residues. The thermogravimetric curve showed (Figure 3b) a thermal stability of samples M3 and M4 up to 310°C, after which the polymer decomposition starts. The weight loss at ~370°C due to decomposition is ~8.6% in M3 and ~10.2% in M4, respectively.
In the samples prepared from mixed PLA and PCL polymers (M5 and M6), the melting of PCL polymer is associated to endothermic signal from 72°C in M5 and at 71°C in M6. The melting of the second PLA polymer is observed in the presence of the endothermic signal observed at 153°C in M5 and 154°C in M6. The next two endothermic signals appear due to the PLA and PCL polymer chain decomposition, and are observed at 352 and 398°C in the DTA curve of M5, respectively at 344 and 396°C in the DTA curve of M6 sample. The exothermic signal due to the combustion of PCL residues appears at a lower value in the combined samples, at 430°C in M5 and at 436°C in M6.
Comparative analysis of DTA curves shows that melting and decomposition occur at different temperatures in the mixed samples (PLA-PCL) compared to those in the individual samples (PLA and PCL, respectively). The TGA curves show a delayed decomposition in the M3 and M4 samples compared to the M1 and M2 samples. By following the shape of the TG curves, it can be observed that the mass losses in the mixed PLA-PCL samples occur in two stages. The presence of PLA in the PCL matrix generates a slightly less stable composite than neat PCL. Gurler et al. [18] who developed PCL-based materials modified with a photopolymer designed for food packaging, showed a decrease in the thermal stability of PCL as the amount of photopolymer increases, by reducing the glass transition temperature (Tg) of PCL. The TGA-DTA results are correlated with the XRD results, namely the more stable materials are PCL-based materials displaying the highest crystallization degree. Kumar et al. [3] showed that crystallinity is one of the most important thermal property for scaffold manufacturing and that the more thermally stable materials are those better crystallized. By corroborating the results with the data in the literature it can be concluded that porosity is not significant from the thermal stability point of view and both PCL-based scaffolds (the less porous M3 and the more porous M4) are better candidates for scaffold manufacturing in tissue engineering than PLA or PLA-PCL materials.
3.4. Physical-Chemical Characterization of the Scaffolds
The charts in Figure 4, Figure 5, Figure 6, Figure 7, Figure 8 and Figure 9 reveal the physical-chemical characteristics of the scaffolds. The samples M1, M3 and M5 are denser than the samples M2, M4 and M6 prepared by using a double amount of NaCl porogen (Figure 4). No statistical difference between samples M1, M3 and M5, as well as between samples M2, M4 and M6, in terms of density can be noted. In contrast, the difference between the density values as a function of the amount of porogen used is statistically significant according to Anova One Way Tukey model (p>95%) (Figure 4). As expected, the porosity of the scaffolds shows an inversely proportional variation with density. The most porous samples are M2, M4 and M6, respectively, between 74 % and 78,5%, while the porosity of M1, M3 and M5 is in the 59-62% range (Figure 5). No significant difference in terms of porosity could be determined between M1, M3 and M5 as well as between M2, M4 and M6, meaning that the porosity is not influenced by the polymer type or by the mixing of the two materials. Soltani Gerdefaramarzi et al. [7] also determined the porosity of PLA and PCL scaffolds modified with graphene, as being ranged between 72% and 77%, similar to that of the porous samples M2, M4 and M6 developed in this study. Additionally, they have obtained similar porosity both for the PLA and the PCL samples.
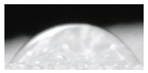
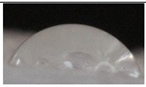
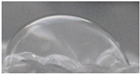
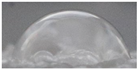
Hydrophilicity is an important parameter of the scaffolds used as materials for tissue reconstruction. The topography and hydrophilicity of the surface of scaffolds are the key factors in nutrient molecules and cell adhesion. The water droplets on the 3D scaffold`s surface and the average contact angles are displayed in Table 5, according to which all samples are hydrophilic. The differences between the contact angles are statistically nonsignificant. Hydrophilic materials are those that form a contact angle of less than 900 [19]. Theoretically, PLA is hydrophilic [20], while PCL is hydrophobic [21]. In our case, contact angles below 900 were also obtained for PCL-based scaffolds, meaning that the materials are hydrophilic. This behavior, in contradiction with the literature, could be explained by the morphology of the surface on which the drop falls. The contact angle formed by the droplet falling on the porous area is smaller than the angle formed on the pore-free area. Therefore, the high porosity of the PCL-based scaffolds is responsible for their hydrophilic character. The literature data revealed that the microporous structure could also be responsible for improving the hydrophilicity of a material [22].
Overall, these results show that both PLA, PCL and PLA-PCL scaffolds seem to be conductive to nutrients and cell adhesion, as a matrix for any kind of tissue engineering requires porous structure and good wettability [23].
The water retention capacity (WRC) reflects their ability to absorb body fluids, facilitate the transfer of essential nutrients and metabolites and allow cell adhesion, proliferation and differentiation. As expected, the water retention capacity (Figure 6) is significantly higher (Anova One Way Tukey model (p>95%)) for the most porous samples (M2, M4 and M6) as compared to M1, M3 and M5, because of a higher porosity. The porous samples based on PCL (M4) and PCL-PLA (M6) have a higher WRC as compared to the neat PLA (M2). Theoretically, WRC would be correlated with the presence of the hydrophilic groups as well as with the microporous structure of the matrix. In our case, the share of OH and ester groups is higher in the M2 matrix (PLA) than in M4 (PCL). Moreover, M2 and M4 have similar porosity (no significant difference between them in terms of porosity could be noted). Even so, the WRC of the M2 sample is significantly smaller than that of the PCL (M4) and PLA-PCL respectively (M6), although, they should be similar, based on the above presented characteristics. In this regard, the M2`s behavior could be explained by the different pore size. Soltani Gerdefaramarzi et al. [7] developed PLA scaffolds having the pore size smaller than that of PLA-PCL and PCL respectively. The conclusion is similar also to the statement of Garcia et al. [22] who developed PCL based-scaffolds modified with starch and/or CaO. In their case, the water absorption capacity increased with the content of starch and CaO, but, in addition, the authors also suggested that the microporous structure of the composites could also enhance the water absorption capacity [22].
PCL is stronger mechanically than PLA and PLA-PCL composites, probably due to a more filamentous hydro carbonate structure of PCL, as revealed by the results for mechanical strength presented in Figure 7. The results for mechanical strength are correlated with the conclusions of the XRD and FTIR measurements because of a smaller number of hydrogen bonds, conferring a smaller mechanical strength to the material in the porous samples. The results agree with those of Senatov et al. [24] who showed that the presence of PCL because of its high elasticity, considerably increased the elastic modulus of PCL-PLA. Our study also proved that the mechanical resistance of PCL is significantly higher than that of PLA (p>0.05 according to Anova One Way, Tukey model). The PCL-based samples are more crystallized as compared to PLA. More crystallization contributes to better mechanical resistance [3]. The porosity is a factor also affecting the mechanical resistance. The more porous samples were less mechanically resistant. This can be explained by the distancing between the functional groups in the porous samples, thus decreasing the preponderance of the hydrogen bonds and implicitly, the space between the polymer chains. Therefore, the overall effect is smaller tensile strength. With smaller crystallinity and predominant defects in the composite matrix the PLA-PCL samples have a smaller tensile resistance as compared to PCL and PLA [16].
M6, the porous PLA-PCL sample, uptakes more glucose than the other samples (Figure 8). The difference between M1, M2, M3, and M4 is not statistically significant. The absorption capacity of M1, M3, and M5, the less porous samples, is the smallest. The absorption of glucose on PLA is intense due to the compatibility between the OH groups of the carbohydrate and those of the PLA, while the most intense absorption by M6 occurs because of the four-factors synergism: porosity, crystallinity, polar compatibility and pore size. The results are in tune with those obtained at the WRC tests and like those in the literature [7,22]. Additionally, Green et al. [25] showed that glyco-PLA copolymers exhibited a successful uptake of both hydrophobic and hydrophilic molecules. All the samples released a smaller amount of glucose than the amount of glucose absorbed. The trend of all samples is like the trend spotted for the uptake profiles. The amount of glucose released increases with porosity and is considerably higher in the case of mixed PLA-PCL scaffolds. No statistical differences between the PLA and PCL samples can be noted.
All the samples have a similar uptake of albumin (Figure 9). M1 differs significantly from M2 (p>0.05 according to the Anova One Way, Tukey model), as M1 has a smaller absorption capacity than the other samples because of its low porosity and the high volume of the albumin molecule. The amount of albumin absorbed exceeds statistically the amount of albumin released. The albumin released and respectively absorbed have a similar trend of variation. There is no significant difference depending on the type and porosity of the samples in terms of albumin released.
Senatov et al. [24] proved the efficient uptake and release capacity of proteins given by the scaffolds based on PLA-PCL- hyaluronic acid. They stated that the different release kinetics of the materials indicate that the matrix itself makes a definite, and quite large, contribution to protein retention.
3.5. Bio-Chemical Characterization of the Scaffolds
3.5.1. In Vitro Biodegradability
In vitro biodegradability was determined by monitoring the mass decrease of matrices immersed in lipase solution of different concentrations. The mass loss increases with the enzyme concentration (Figure 10). At a 20 μg/mL concentration of lipase, there was no significant difference between samples regardless of type and porosity. At a lipase concentration of 40 μg/mL, the greatest mass loss was determined in the case of the M6 sample (porous PLA-PCL), followed by the PLA-based samples and the most stable were the PCL-based samples. At an enzyme concentration of 60 μg/mL, in a similar trend, the PLA and PLA-PCL samples are more vulnerable to lipase, while the PCL samples are the most stable. This behavior is due to the prior cleavage of ester bonds under the catalysis of lipase enzymes and the preponderance of the ester bonds in PLA which is higher than in PCL [26]. Moreover, the thermodynamic stability of the hydrocarbon linear chain (-(CH2)5-) in PCL is higher than the thermodynamic stability of the branched structure of the hydrocarbon chain (-CH(CH3)) in PLA [26]. Another factor affecting the enzymatic degradation is crystallinity. The presence of the crystalline zones prevents the diffusion and distribution of the enzyme within the sample [26]. In our study, the less crystallized samples are M1 and M2 (PLA-based samples) and M6 (porous PLA-PCL), displaying the most intense enzymatic degradation. In this regard, PLA and PLA-PCL materials could be used to develop self-degradable composites with controlled lifetime. The stability of PCL scaffolds exceeds the stability of PLA because of the action of lipase, as PCL scaffolds have a cleaner-cut semicrystalline structure [22]. Because of this, a PCL scaffold is a valuable option for reconstructing digestive tissues. Hussain et al. [2024] who tested the biodegradability of the PLA-based samples modified with graphene oxide (GO) and graphene nanoparticles (GNP), respectively, also showed the intense degradability of PLA in phosphate-buffered saline and Ringer’s solutions, but PLA/GO, PLA/GNP and PLA/CNTs composites exhibited slow degradation as compared to pure PLA. Jamali et al. [27] who developed hydrogels based on chitosan modified with PCL fibers, also showed that the biodegradability (weight loss) arises from chitosan and not PCL, because PCL loses its weight over a long period of time. The results are supported also by Garcia and coworkers [22], who proved the low biodegradability of neat PCL in comparison with the composites obtained by modifying PCL with starch and/or CaO. The results were similar also to those obtained by Soltani Gerdefaramarzi et al. [7] and Zain et al. [12], meaning that the degradation rate of PLA-PCL composite is higher than that of PCL.
3.5.2. The Absorption of Blood Components on the Scaffolds
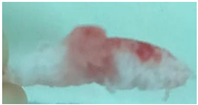
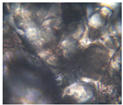
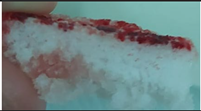
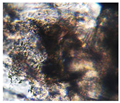
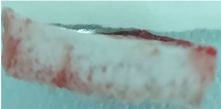
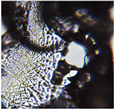
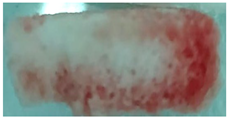
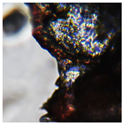
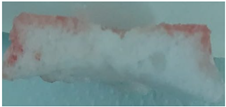
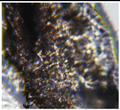
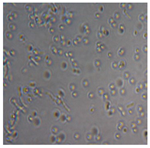
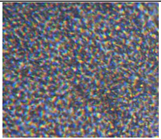
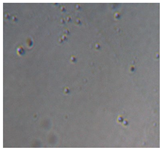
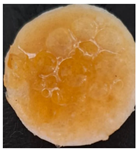
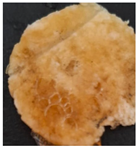
One of the most important factors in manufacturing scaffolds is cell adhesion. The images in Table 6 show that the most porous samples (M2, M4 and M6) have the entire surface absorbed with blood, in comparison with samples M1, M3 and M5 containing only some red areas. The section images also show that the samples M2, M4 and M6 are better impregnated with blood than the samples M1, M3 and M5, behavior suggesting that the absorption capacity is positively correlated with porosity. The microscopic images support the results given by the macroscopic images.
The analysis of data in Figure 11 reveals the same results. The highest values for the absorbed blood components were determined for M2, M4 and M6. No statistical significance was recorded between these three samples, as well as no difference between M1, M3 and M5 could be observed. The results are supported by the findings of Lamparelli et al. [28], who developed PLA-PLGA nanocarriers effectively internalized by various cell types. They also demonstrated that the uptake occurred in a dose-dependent manner.
3.5.3. The Biocompatibility of the Scaffolds
The biocompatibility of the matrices was determined by testing the development capacity of the Lactobacillus strains sown on the matrix soaked in the appropriate nutritive medium. On the surface of all matrices, Lactobacillus colonies developed to a smaller extent after two days and more pronounced after five days, with the aspect of a whitish film. The analysis of these materials, as shown in Table 7, reveals this phenomenon is more prominent in the porous (M2, M4, and M6) and the PLA-PCL samples. The results are supported by the literature. For example, Kumar et al. [3] deposited PLA nanofibers in PCL scaffolds in order to improve the proliferation of mouse fibroblast cell line (L929) and the results suggested that the cell proliferation on PLA-PCL scaffold obtained by depositing one PLA nanofiber in between the PCL scaffold was higher by almost 50% as compared with PCL and that the cell proliferation slightly dropped when more than one PLA nanofibers were included in PCL matrix, because of the interlayer gap restriction, but anyway the cell growth on PLA-PCL was considerably higher than on neat PCL. Soltani Gerdefaramarzi et al. [7] demonstrated the non-toxicity of PLA, PCL and PLA-PCL scaffolds for the PC-12 cells. Moreover, notable cell growth took place and based on these, they concluded that from all the investigated PLA-PCL based materials, those modified with graphene appear to be the most promising candidates for nerve tissue engineering. So, the results showed a good fixation capacity and support for the efficient development of porous samples for living cells, and PLA-PCL especially, demonstrating that these matrices are a good choice to be applied for tissue reconstruction.
4. Conclusions
The study aimed to develop of materials based on polylactic acid (PLA) and/or polycaprolactone (PCL) by porogen leaching, as potential scaffolds for tissue reconstruction and to establish the influence of porosity on the scaffold characteristics. PCL and PCL-PLA matrices are more suitable options for reconstructing tissues than neat PLA, because they have a higher degree of crystallization. Porosity reduced the degree of crystallization, the size of crystals and the preponderance of hydrogen bonds. The mixed PLA-PCL samples have a lower degree of crystallization than the PCL. The FTIR analyses confirm the XRD results, in terms of the lower share of hydrogen bonds in the more porous samples compared to the less porous, which is demonstrated by the displacement of the peaks in the FTIR spectra of the more porous samples. The PCL samples are thermally the most stable. Mixed PLA-PCL samples thermally decompose into two temperature stages and are less stable than PCL. The porosity, the degree of crystallization, the share of hydrophilic groups and the pores size influence the absorption capacity of water, glucose, albumin, and blood components. Even though the porosity and hydrophilicity are high and the sample is amorphous, a reduced water absorption capacity is due to the small size of pores. PCL is more mechanically resistant than PLA and PLA-PCL. The mechanical resistance decreases as porosity and the degree of crystallization decreases. The high porosity (> 78%) and the large pore size induced the PCL`s hydrophilicity. PLA and PLA-PCL are more vulnerable to the action of lipase than PCL, due to the higher share of ester groups and the lower degree of crystallization. Lactobacillus grows as porosity increases and is more accentuated on PLA-PCL, revealing its lack to toxicity. All these results converge to the conclusion that mixed PLA-PCL matrices are effective candidates for tissue reconstruction.
References
- Yıldırım, S.; Demirtaş, T.T.; Dinçer, C.A.; Yıldız, N.; Karakeçili, A. Preparation of Polycaprolactone/Graphene Oxide Scaffolds: A Green Route Combining Supercritial CO2 Technology and Porogen Leaching. The Journal of Supercritical Fluids 2017, 133, 156–162. [Google Scholar] [CrossRef]
- Laurent, C.; Liu, X.; De Isla, N.; Wang, X.; Rahouadj, R. Defining a Scaffold for Ligament Tissue Engineering: What Has Been Done, and What Still Needs to Be Done. Journal of Cellular Immunotherapy 2018, 4, 4–9. [Google Scholar] [CrossRef]
- Kumar, R.; Singh, R.; Kumar, V.; Ranjan, N.; Gupta, J.; Bhura, N. On 3D Printed Thermoresponsive PCL-PLA Nanofibers Based Architected Smart Nanoporous Scaffolds for Tissue Reconstruction. Journal of Manufacturing Processes 2024, 119, 666–681. [Google Scholar] [CrossRef]
- Guerra, A.J.; Cano, P.; Rabionet, M.; Puig, T.; Ciurana, J. 3D-Printed PCL/PLA Composite Stents: Towards a New Solution to Cardiovascular Problems. Materials 2018, 11, 1679. [Google Scholar] [CrossRef]
- Pitjamit, S.; Thunsiri, K.; Nakkiew, W.; Wongwichai, T.; Pothacharoen, P.; Wattanutchariya, W. The Possibility of Interlocking Nail Fabrication from FFF 3D Printing PLA/PCL/HA Composites Coated by Local Silk Fibroin for Canine Bone Fracture Treatment. Materials 2020, 13, 1564. [Google Scholar] [CrossRef] [PubMed]
- Chen, C.; He, J.; Huang, J.; Yang, X.; Liu, L.; Wang, S.; Ji, S.; Chu, B.; Liu, W. Fetal Dermis Inspired Parallel PCL Fibers Layered PCL/COL/HA Scaffold for Dermal Regeneration. Reactive and Functional Polymers 2021, 170, 105146. [Google Scholar] [CrossRef]
- Gerdefaramarzi, R.S.; Ebrahimian-Hosseinabadi, M.; Khodaei, M. 3D Printed Poly(Lactic Acid)/Poly(ε-Caprolactone)/Graphene Nanocomposite Scaffolds for Peripheral Nerve Tissue Engineering. Arabian Journal of Chemistry 2024, 17, 105927. [Google Scholar] [CrossRef]
- Rejali, A.; Ebrahimian-Hosseinabadi, M.; Kharazi, A.Z. Polyglycerol Sebacate/Polycaprolactone/Reduced Graphene Oxide Composite Scaffold for Myocardial Tissue Engineering. Heliyon 2024, 10, e38672. [Google Scholar] [CrossRef]
- Uquillas, J.A.; Malik, N. Tissue Engineering, Chapter Scaffold design and fabrication, ISBN 978-0-12-824459-3 2023 Elsevier.
- Mihaly-Cozmuta, L. Statistica Experimentala, UTPress Publishing House Cluj Napoca, Romania, ISBN 978-606-737-171-0 2016 pg. 193 and 201.
- Hussain, M.; Khan, S.M.; Shafiq, M.; Al-Dossari, M.; Alqsair, U.F.; Khan, S.U.; Khan, M.I. Comparative Study of PLA Composites Reinforced with Graphene Nanoplatelets, Graphene Oxides, and Carbon Nanotubes: Mechanical and Degradation Evaluation. Energy 308, 132917. [CrossRef]
- Zain, S.K.M.; Sazali, E.S.; Ghoshal, S.K.; Hisam, R. In Vitro Bioactivity and Biocompatibility Assessment of PCL/PLA–Scaffolded Mesoporous Silicate Bioactive Glass: Role of Boron Activation. Journal of Non-Crystalline Solids 2023, 625, 122763. [Google Scholar] [CrossRef]
- Zhao, X.; Yu, J.; Liang, X.; Huang, Z.; Li, J.; Peng, S. Crystallization Behaviors Regulations and Mechanical Performances Enhancement Approaches of Polylactic Acid (PLA) Biodegradable Materials Modified by Organic Nucleating Agents. International Journal of Biological Macromolecules 2023, 233, 123581. [Google Scholar] [CrossRef] [PubMed]
- Korra, S.; Madhurya, N.; Kumar, T.S.; Sainath, A.V.S.; Murthy, P.S.K.; Reddy, J.P. Extension of Shelf-Life of Mangoes Using PLA-Cardanol-Amine Functionalized Graphene Active Films. International Journal of Biological Macromolecules 2025, 139849. [Google Scholar] [CrossRef]
- Liao, Y.; Liu, C.; Coppola, B.; Barra, G.; Di Maio, L.; Incarnato, L.; Lafdi, K. Effect of Porosity and Crystallinity on 3D Printed PLA Properties. Polymers 2019, 11, 1487. [Google Scholar] [CrossRef] [PubMed]
- Abdelhameed, D.; Morsi, M.A.; Elsisi, M.E. Impact of CoCl2 on the Structural, Morphological, Optical, and Magnetic Properties of PCL/PVC Blend for Advanced Spintronic/Optoelectronic Applications. Ceramics International 2025. [Google Scholar] [CrossRef]
- Lu, H.; Kazarian, S.G. How Does High-Pressure CO2 Affect the Morphology of PCL/PLA Blends? Visualization of Phase Separation Using in Situ ATR-FTIR Spectroscopic Imaging. Spectrochimica Acta Part a Molecular and Biomolecular Spectroscopy 2020, 243, 118760. [Google Scholar] [CrossRef]
- Gürler, N.; Pekdemir, M.E.; Torğut, G.; Kök, M. Binary PCL–Waste Photopolymer Blends for Biodegradable Food Packaging Applications. Journal of Molecular Structure 2023, 1279, 134990. [Google Scholar] [CrossRef]
- Shi, Z.; Zhang, Y.; Liu, M.; Hanaor, D.A.H.; Gan, Y. Dynamic Contact Angle Hysteresis in Liquid Bridges. Colloids and Surfaces a Physicochemical and Engineering Aspects 2018, 555, 365–371. [Google Scholar] [CrossRef]
- Qi, Y.; Ma, H.-L.; Du, Z.-H.; Yang, B.; Wu, J.; Wang, R.; Zhang, X.-Q. Hydrophilic and Antibacterial Modification of Poly(Lactic Acid) Films by γ-Ray Irradiation. ACS Omega 2019, 4, 21439–21445. [Google Scholar] [CrossRef]
- Fee, T.; Surianarayanan, S.; Downs, C.; Zhou, Y.; Berry, J. Nanofiber Alignment Regulates NIH3T3 Cell Orientation and Cytoskeletal Gene Expression on Electrospun PCL+Gelatin Nanofibers. PLoS ONE 2016, 11, e0154806. [Google Scholar] [CrossRef]
- García, G.; Moreno-Serna, V.; Saavedra, M.; Cordoba, A.; Canales, D.; Alfaro, A.; Guzmán-Soria, A.; Orihuela, P.; Zapata, S.; Grande-Tovar, C.D.; et al. Electrospun Scaffolds Based on a PCL/Starch Blend Reinforced with CaO Nanoparticles for Bone Tissue Engineering. International Journal of Biological Macromolecules 2024, 273, 132891. [Google Scholar] [CrossRef] [PubMed]
- Chen, P.; Miao, Y.; Zhang, F.; Fan, Z.; Huang, J.; Mao, X.; Chen, J.; Hu, Z.; Wang, J. Tissue Engineering ECM-Enriched Controllable Vascularized Human Microtissue for Hair Regenerative Medicine Using a Biomimetic Developmental Approach. Journal of Advanced Research 2021, 38, 77–89. [Google Scholar] [CrossRef]
- Senatov, F.; Zimina, A.; Chubrik, A.; Kolesnikov, E.; Permyakova, E.; Voronin, A.; Poponova, M.; Orlova, P.; Grunina, T.; Nikitin, K.; et al. Effect of Recombinant BMP-2 and Erythropoietin on Osteogenic Properties of Biomimetic PLA/PCL/HA and PHB/HA Scaffolds in Critical-Size Cranial Defects Model. Biomaterials Advances 2022, 135, 112680. [Google Scholar] [CrossRef] [PubMed]
- Green, K.A.; Kulkarni, A.S.; Jankoski, P.E.; Newton, T.B.; Derbigny, B.; Clemons, T.D.; Watkins, D.L.; Morgan, S.E. Biocompatible Glycopolymer-PLA Amphiphilic Hybrid Block Copolymers with Unique Self-Assembly, Uptake, and Degradation Properties. Biomacromolecules 2024. [Google Scholar] [CrossRef]
- Zhang, W.; Hou, Z.; Chen, S.; Guo, J.; Hu, J.; Yang, L.; Cai, G. Aspergillus Oryzae Lipase-Mediated in Vitro Enzymatic Degradation of Poly (2,2′-Dimethyltrimethylene Carbonate-Co-ε-Caprolactone). Polymer Degradation and Stability 2023, 211, 110340. [Google Scholar] [CrossRef]
- Jamali, S.A.; Mohammadi, M.; Saeed, M.; Haramshahi, S.M.A.; Shahmahmoudi, Z.; Pezeshki-Modaress, M. Biomimetic Fiber/Hydrogel Composite Scaffolds Based on Chitosan Hydrogel and Surface Modified PCL Chopped-Microfibers. International Journal of Biological Macromolecules 2024, 278, 134936. [Google Scholar] [CrossRef]
- Lamparelli, E.P.; Marino, M.; Scognamiglio, M.R.; D’Auria, R.; Santoro, A.; Della Porta, G. PLA/PLGA Nanocarriers Fabricated by Microfluidics-Assisted Nanoprecipitation and Loaded with Rhodamine or Gold Can Be Efficiently Used to Track Their Cellular Uptake and Distribution. International Journal of Pharmaceutics 2024, 667, 124934. [Google Scholar] [CrossRef]
- Shahghasempour, L.; Hosseinzadeh, S.; Haddadi, A.; Kabiri, M. Evaluation of Lactobacillus Plantarum and PRGF as a New Bioactive Multi-Layered Scaffold PU/PRGF/Gelatin/PU for Wound Healing. Tissue and Cell 2023, 82, 102091. [Google Scholar] [CrossRef] [PubMed]
- DeStefano, V.; Khan, S.; Tabada, A. Applications of PLA in Modern Medicine. Engineered Regeneration 2020, 1, 76–87. [Google Scholar] [CrossRef]
- Gu, L.; Li, Y.; Yang, Y.; Wang, Z.; Jin, Y. Preparation and Adsorption Performance of Cellulose-Graft-Polycaprolactone/Polycaprolactone Porous Material. BioResources 2017, 12. [Google Scholar] [CrossRef]
- Vadas, D.; Nagy, Z.K.; Csontos, I.; Marosi, G.; Bocz, K. Effects of Thermal Annealing and Solvent-Induced Crystallization on the Structure and Properties of Poly(Lactic Acid) Microfibres Produced by High-Speed Electrospinning. Journal of Thermal Analysis and Calorimetry 2020, 142, 581–594. [Google Scholar] [CrossRef]
- Negi, A.; Verma, A.; Garg, M.; Goswami, K.; Mishra, V.; Singh, A.K.; Agrawal, G.; Murab, S. Osteogenic Citric Acid Linked Chitosan Coating of 3D-Printed PLA Scaffolds for Preventing Implant-Associated Infections. International Journal of Biological Macromolecules 2024, 282, 136968. [Google Scholar] [CrossRef] [PubMed]
- Garlotta, D. Literature Review of Poly(Lactic Acid). Journal of Polymer Environment 2001, 9, 63–84. [Google Scholar] [CrossRef]
- Sarasua, J.R.; Arraiza, A.L.; Balerdi, P.; Maiza, I. Crystallinity and Mechanical Properties of Optically Pure Polylactides and Their Blends. Polymer Engineering and Science 2005, 45, 745–753. [Google Scholar] [CrossRef]
Figure 1.
XRD patterns, crystallinity and crystallite size of the scaffolds.
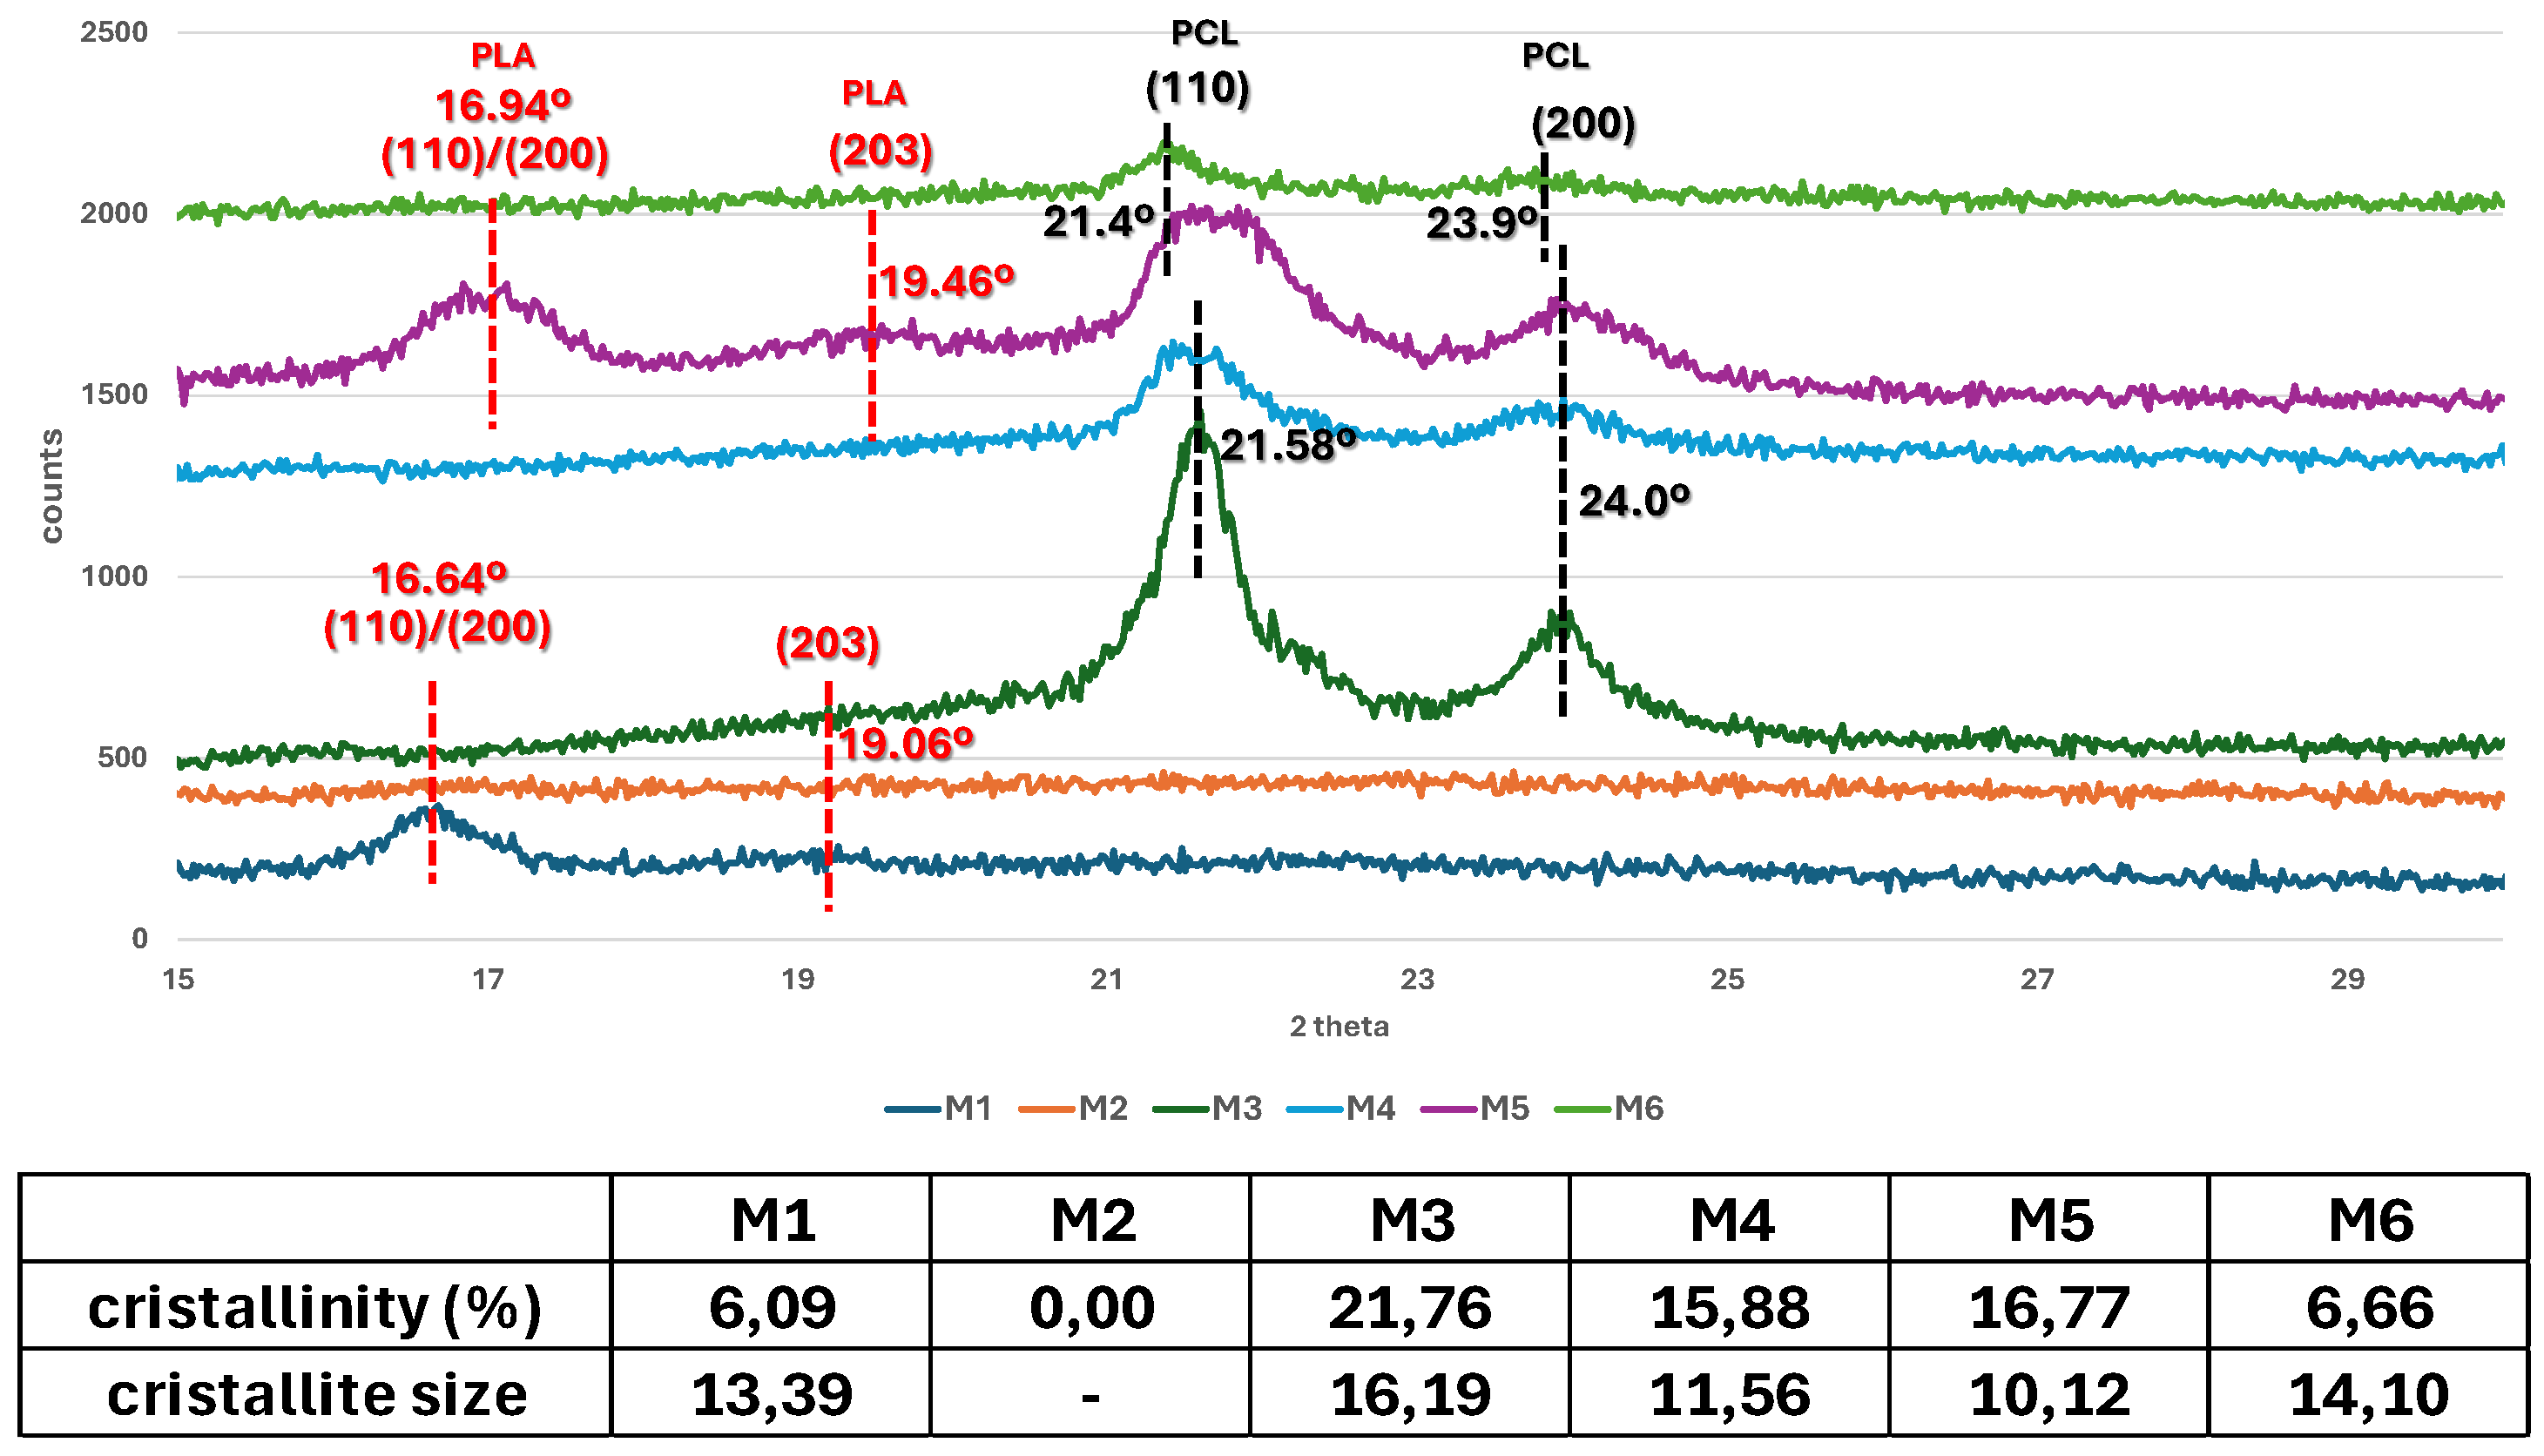
Figure 2.
Standardized FTIR spectra of the scaffolds.
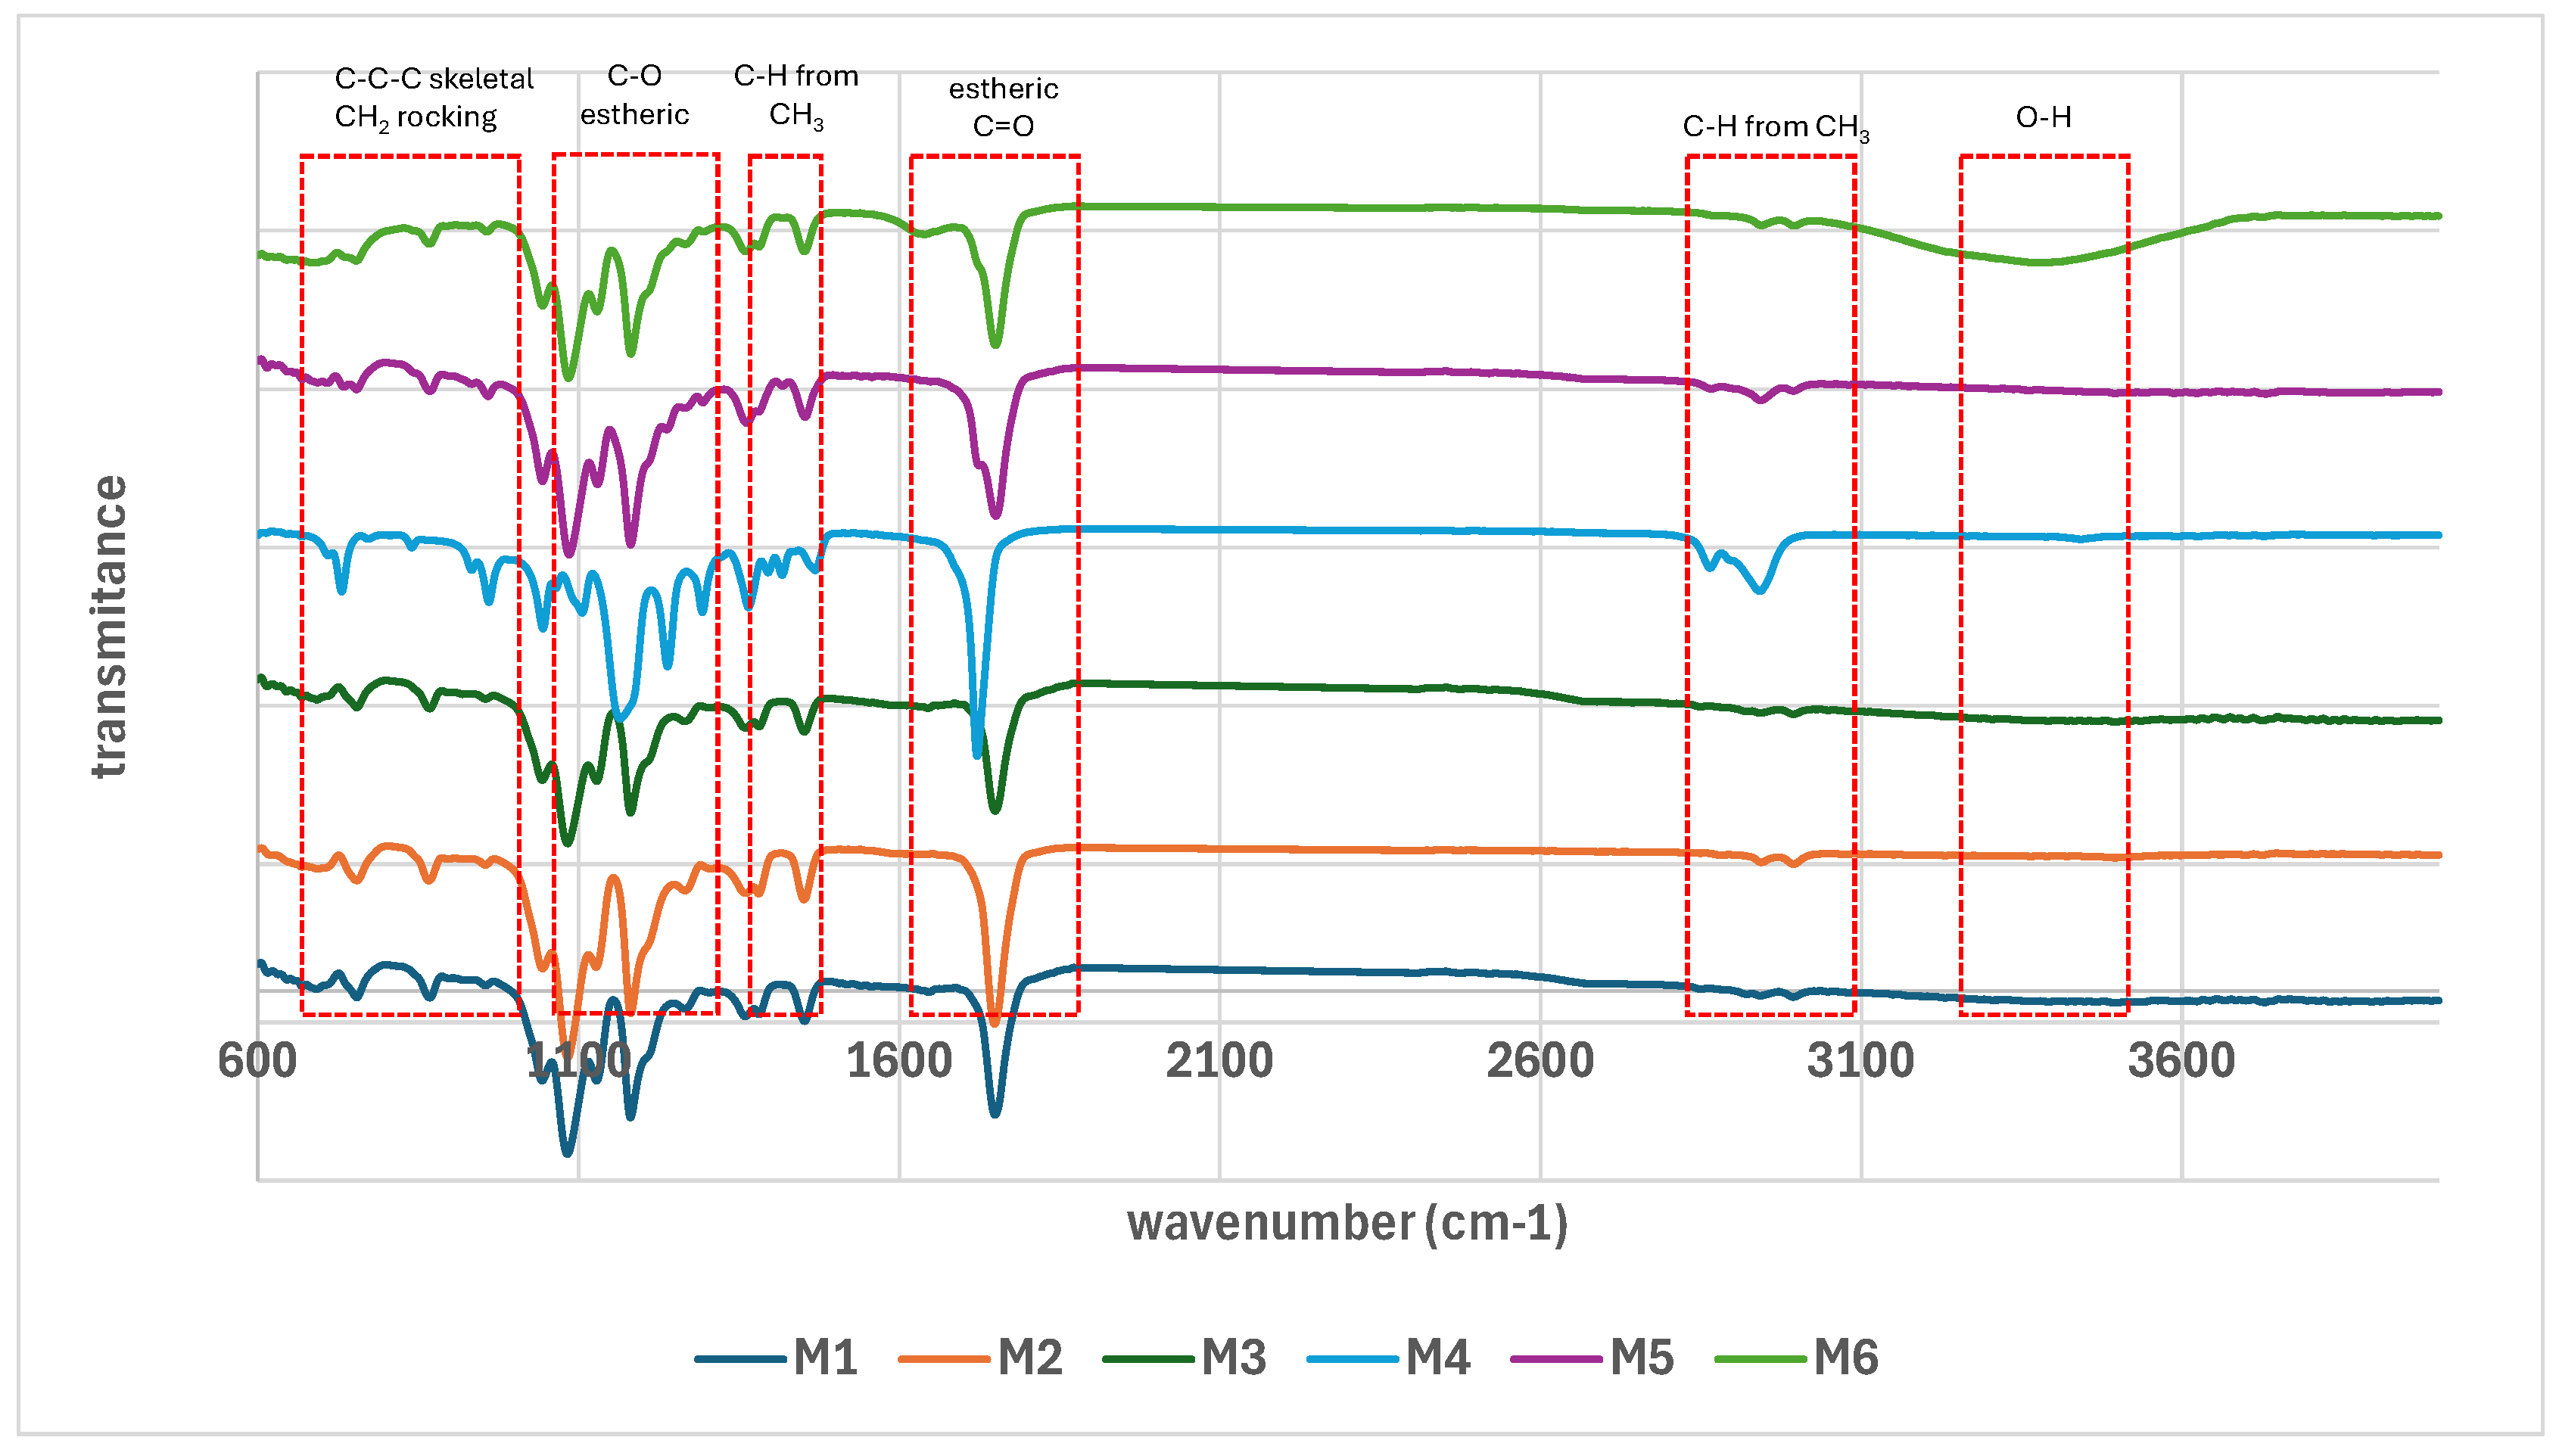
Figure 3.
DTA (a) and TGA (b) profiles of the scaffolds.
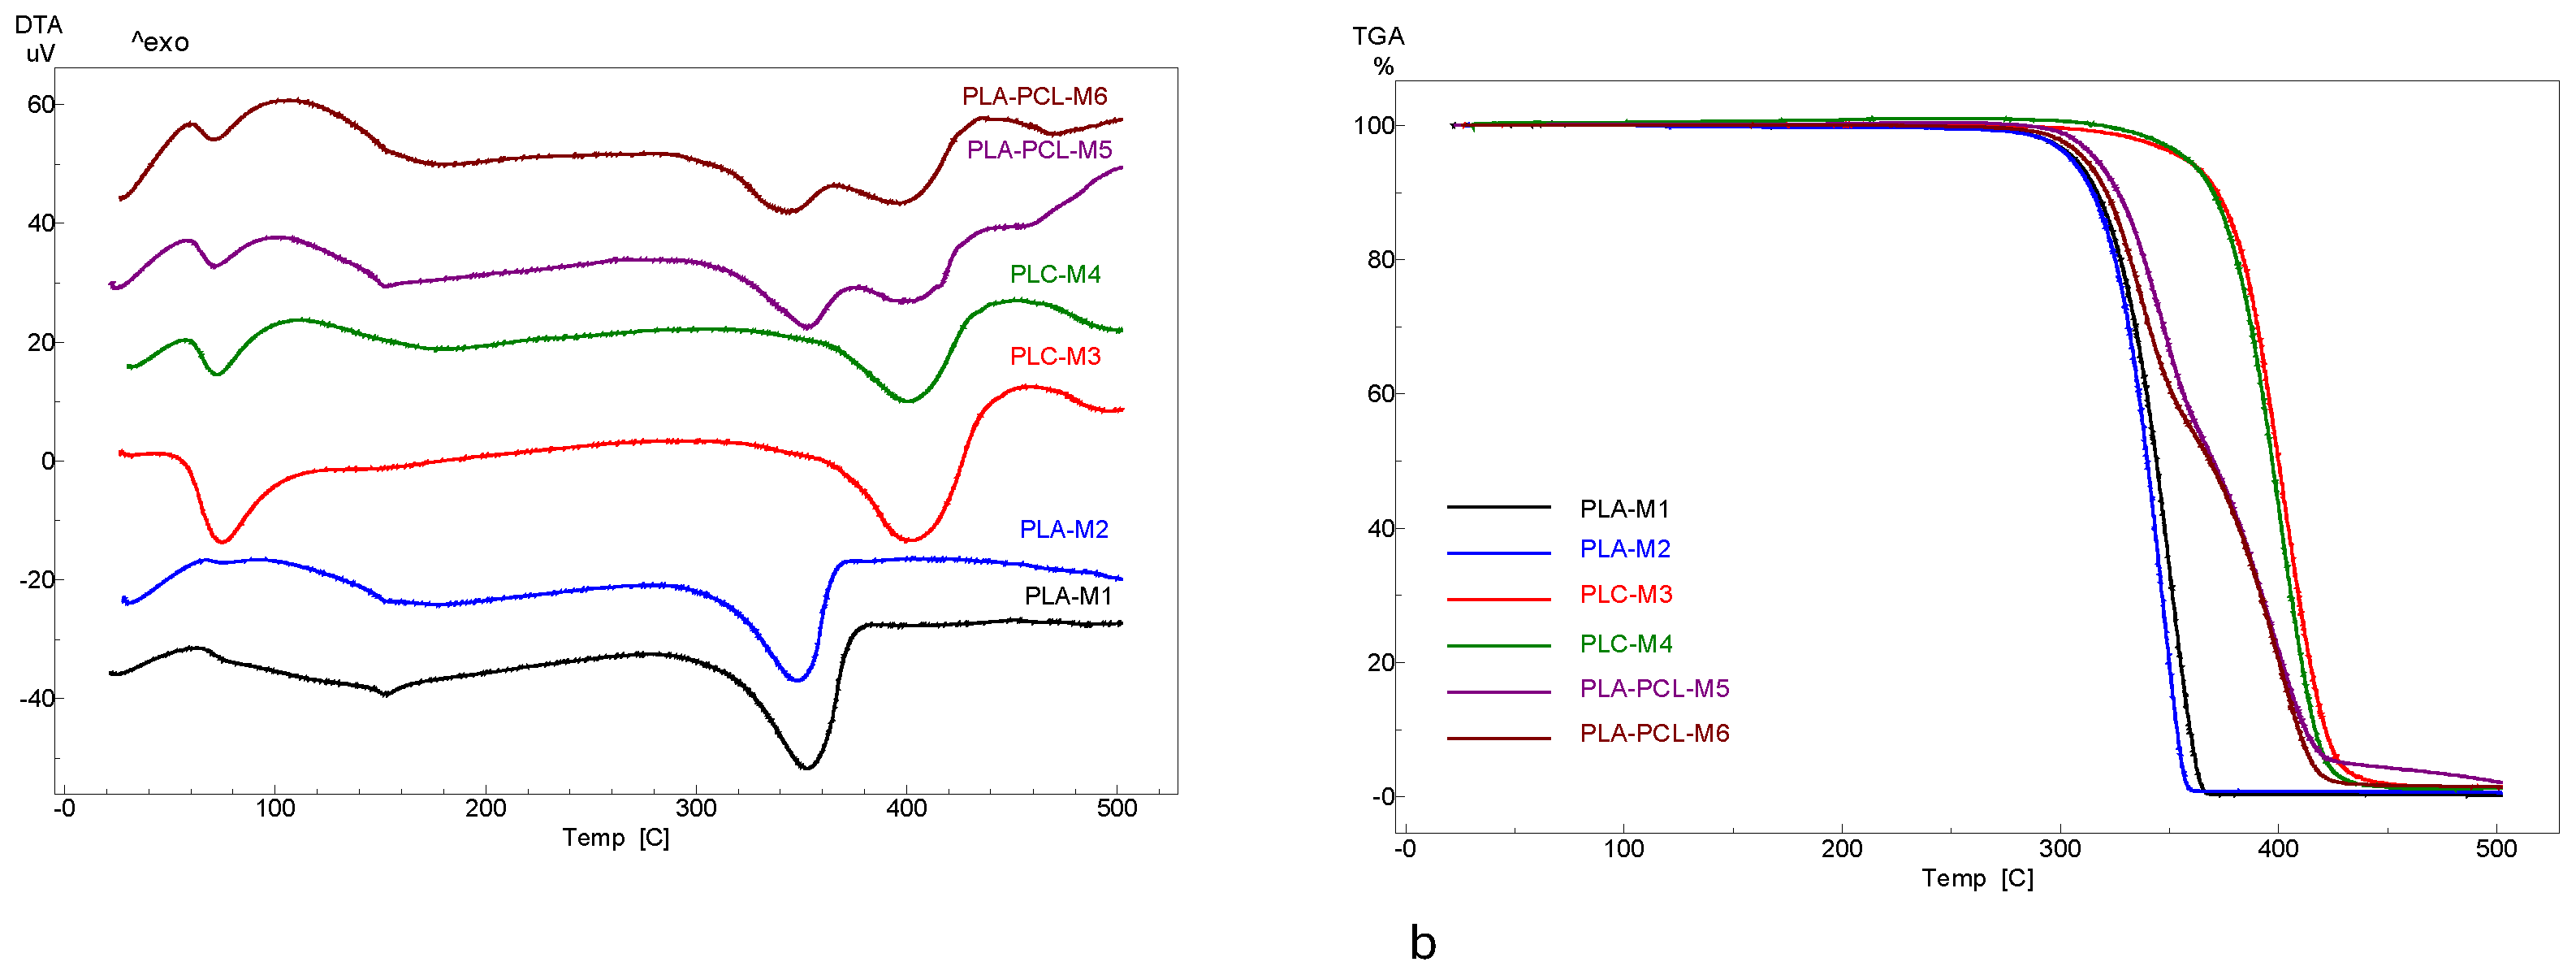
Figure 4.
Density of the 3D scaffolds (a, b – the same letter refers to nonsignificant differences, based on the Anova One Way, Tukey model).
Figure 4.
Density of the 3D scaffolds (a, b – the same letter refers to nonsignificant differences, based on the Anova One Way, Tukey model).
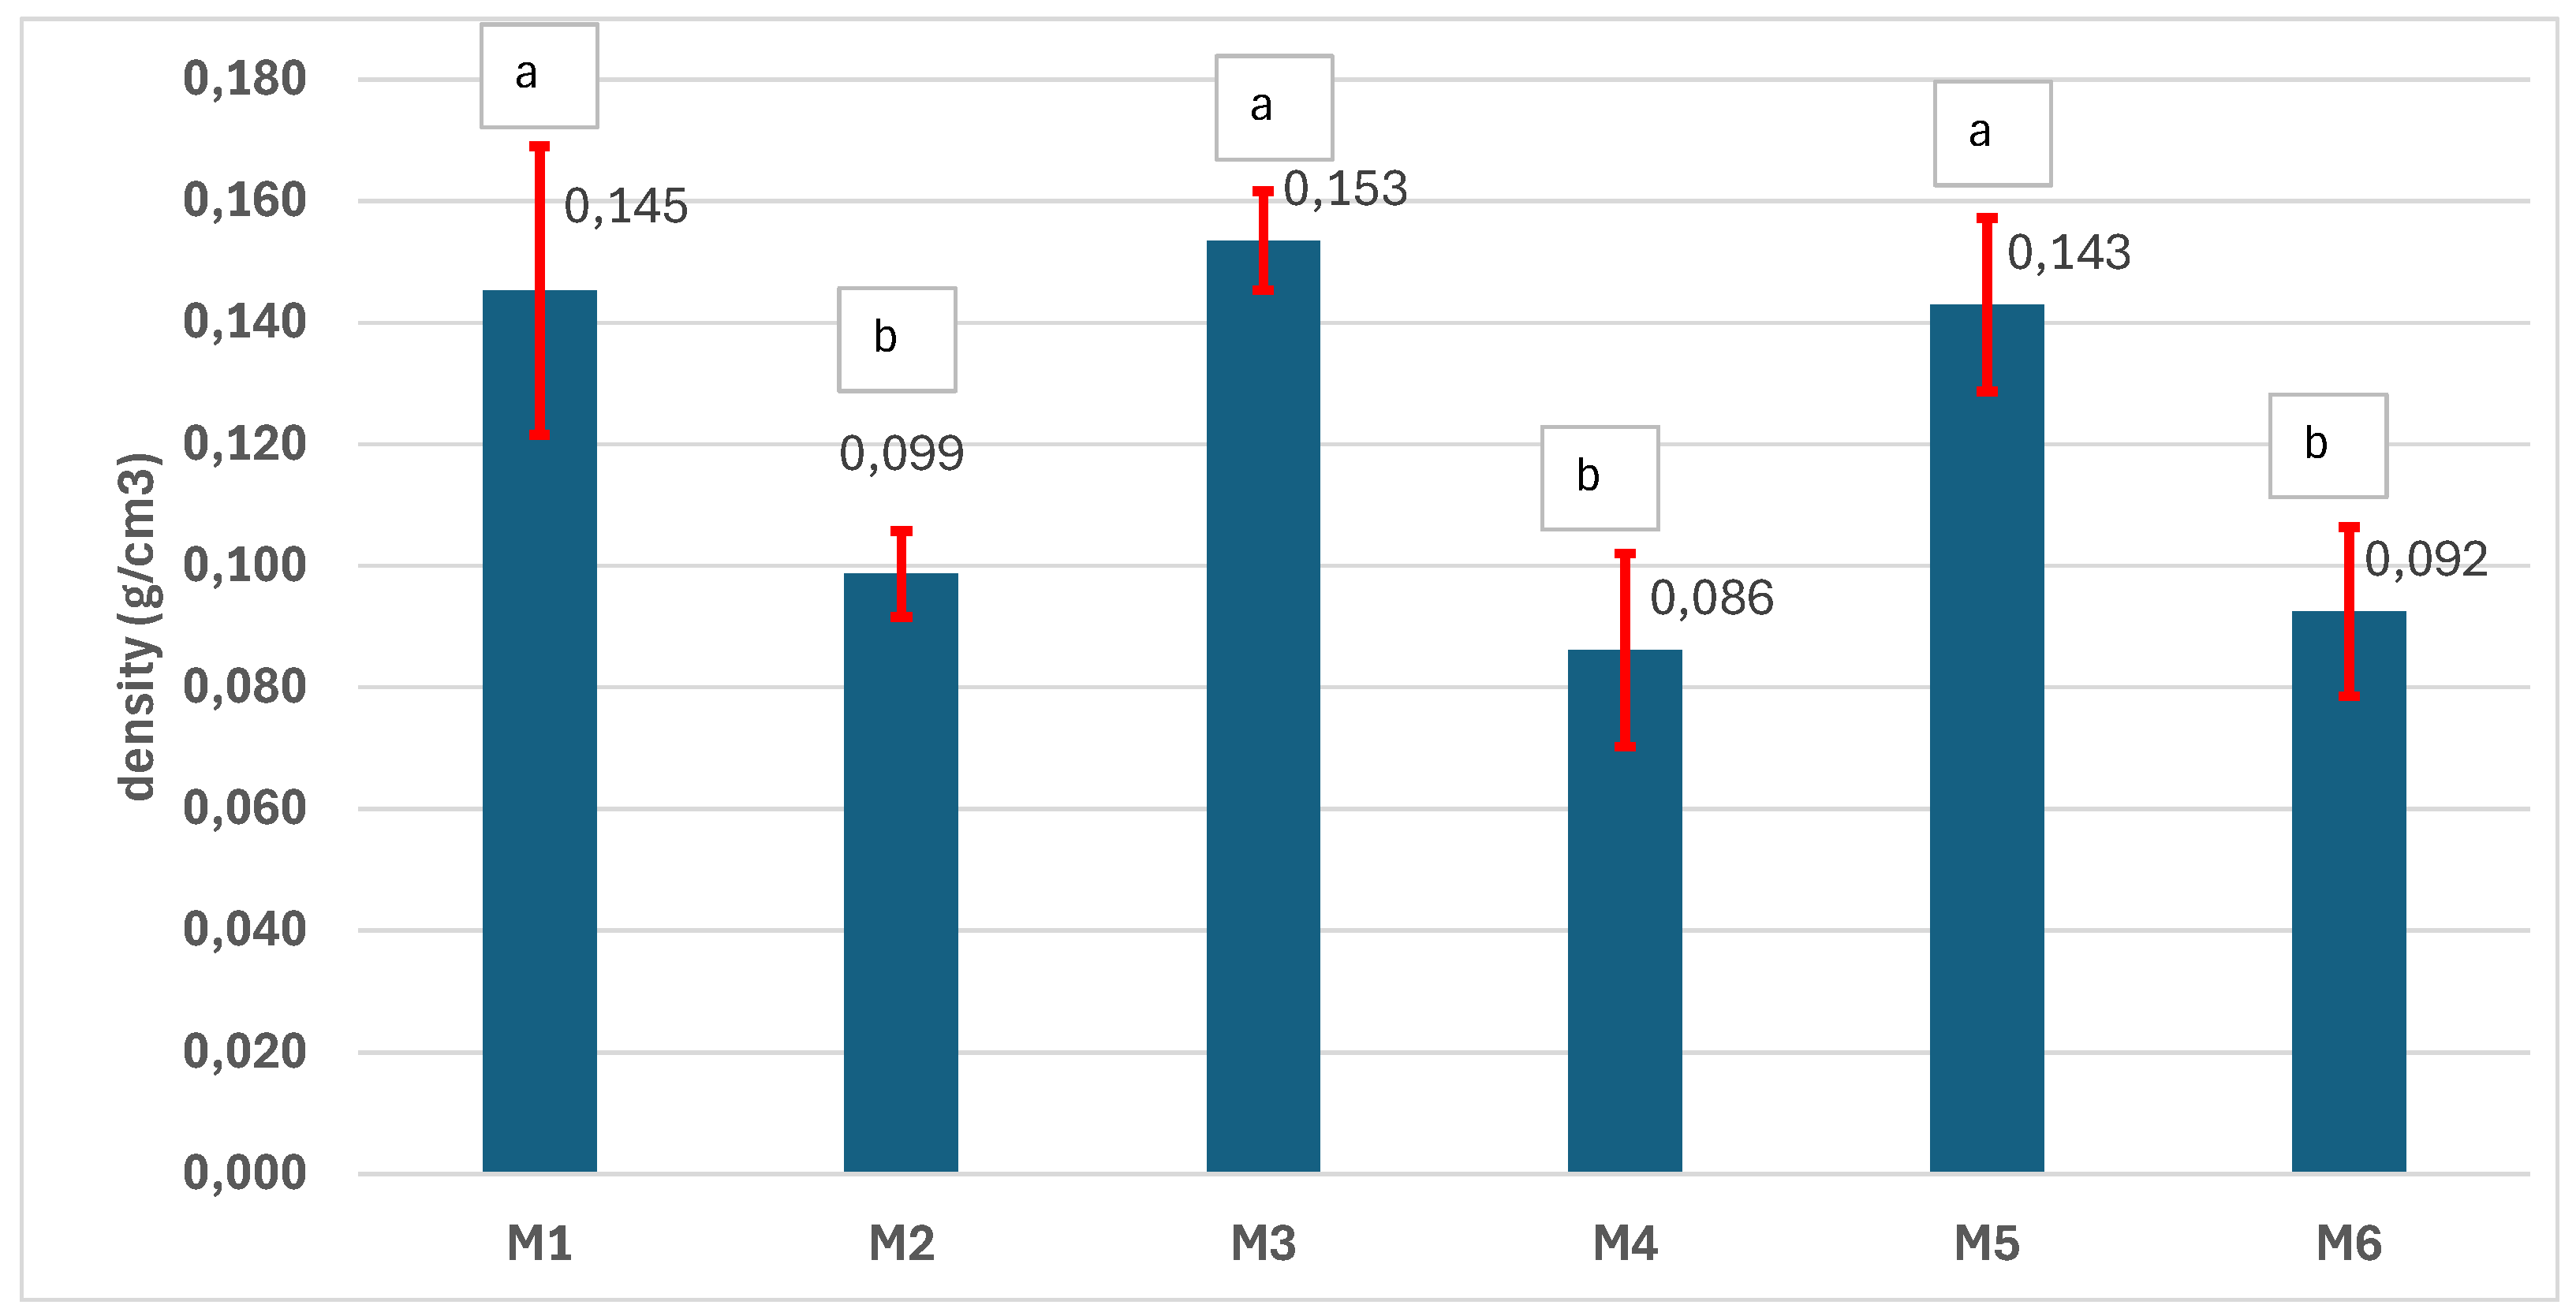
Figure 5.
Porosity of the 3D scaffolds (a, b – the same letter refers to nonsignificant differences, based on the Anova One Way, Tukey model).
Figure 5.
Porosity of the 3D scaffolds (a, b – the same letter refers to nonsignificant differences, based on the Anova One Way, Tukey model).
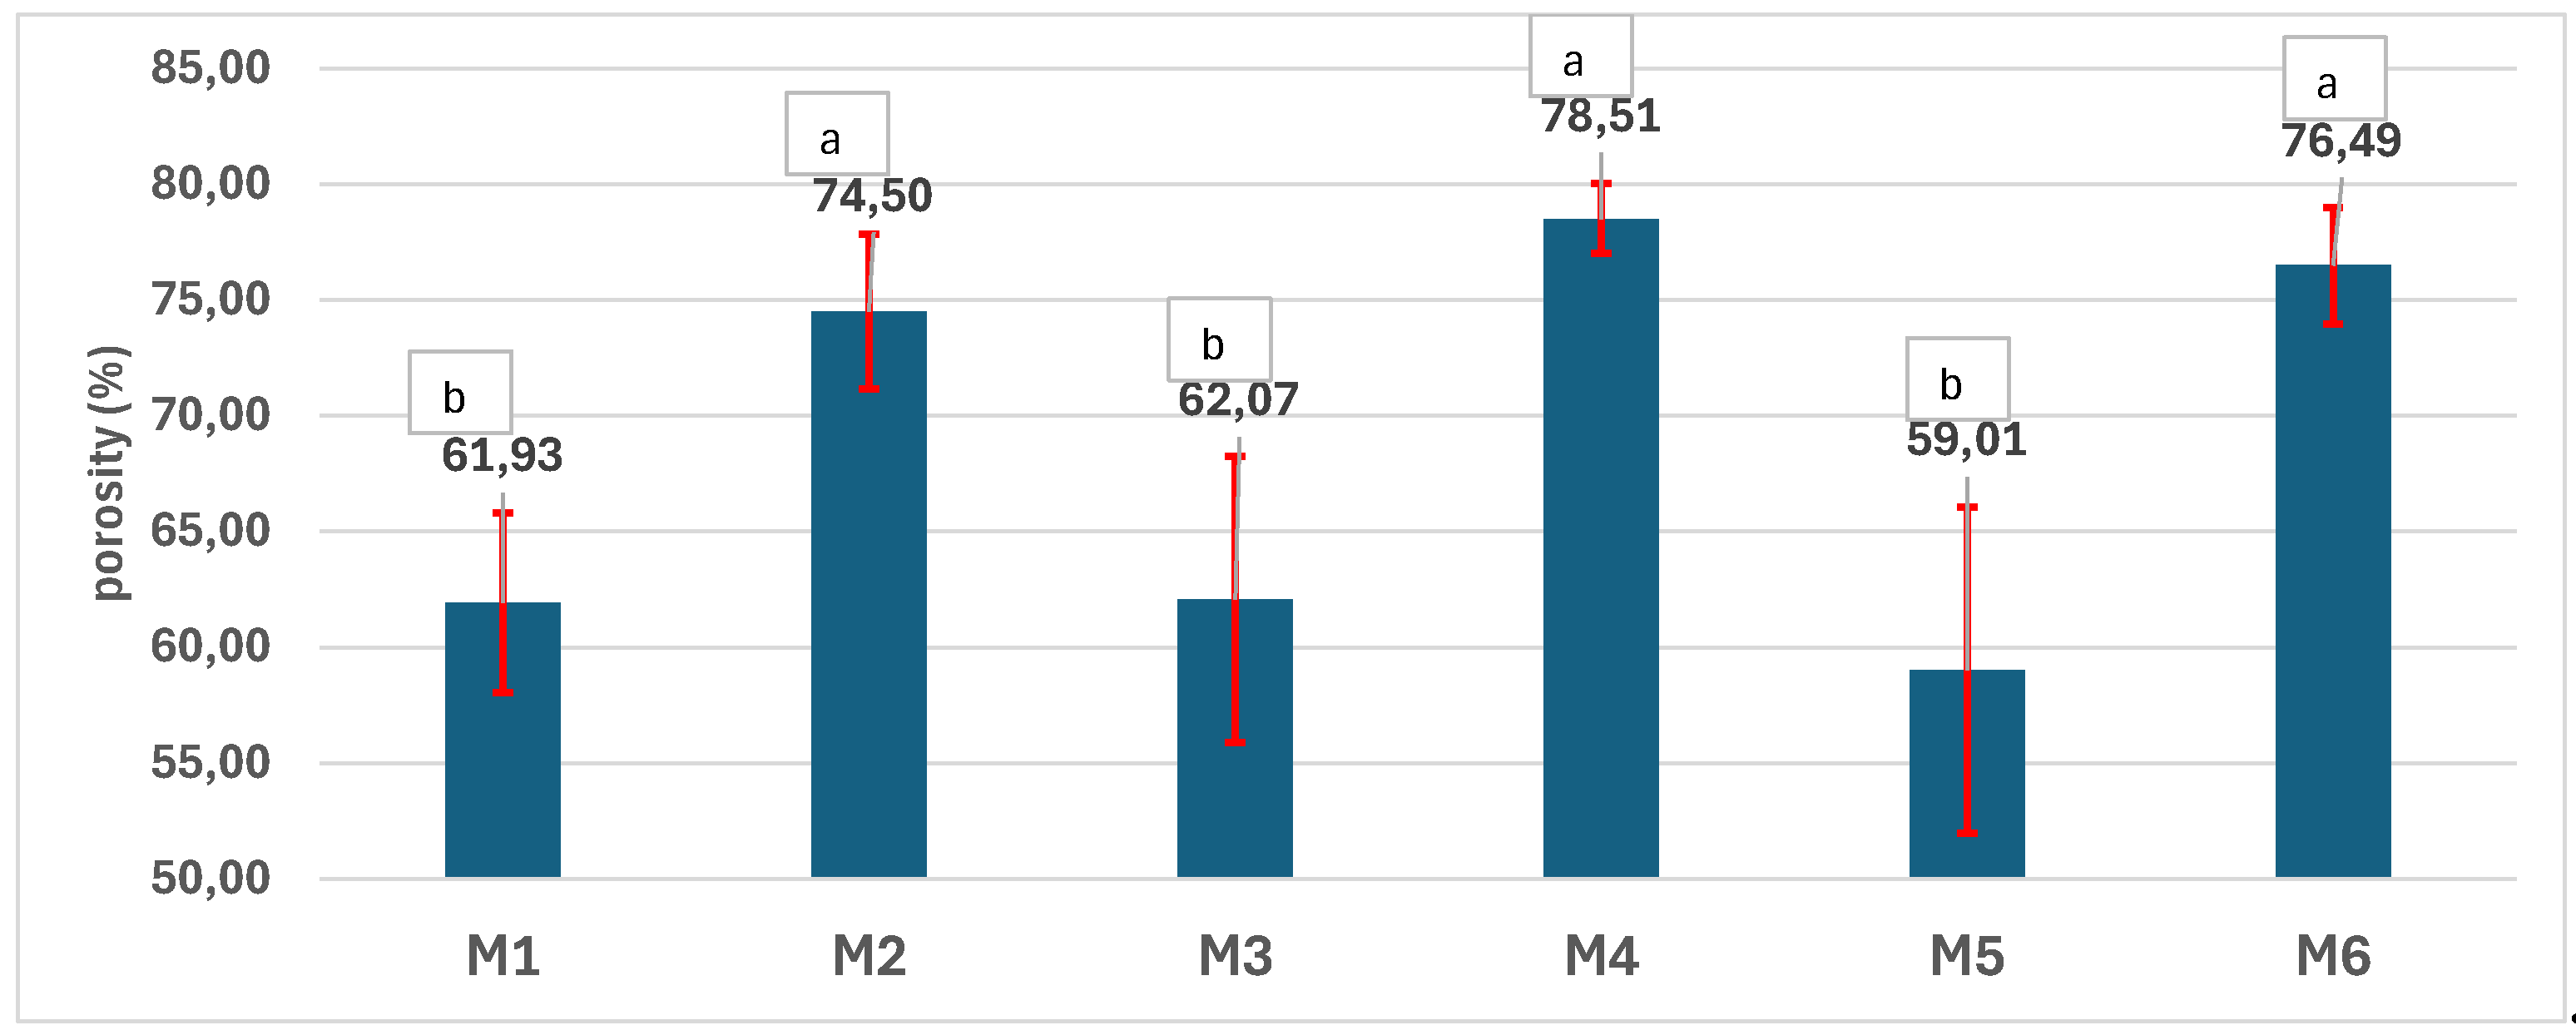
Figure 6.
Water retention capacity (WRC) of the 3D scaffolds (a, b, c – the same letter refers to nonsignificant differences, based on the Anova One Way, Tukey model).
Figure 6.
Water retention capacity (WRC) of the 3D scaffolds (a, b, c – the same letter refers to nonsignificant differences, based on the Anova One Way, Tukey model).
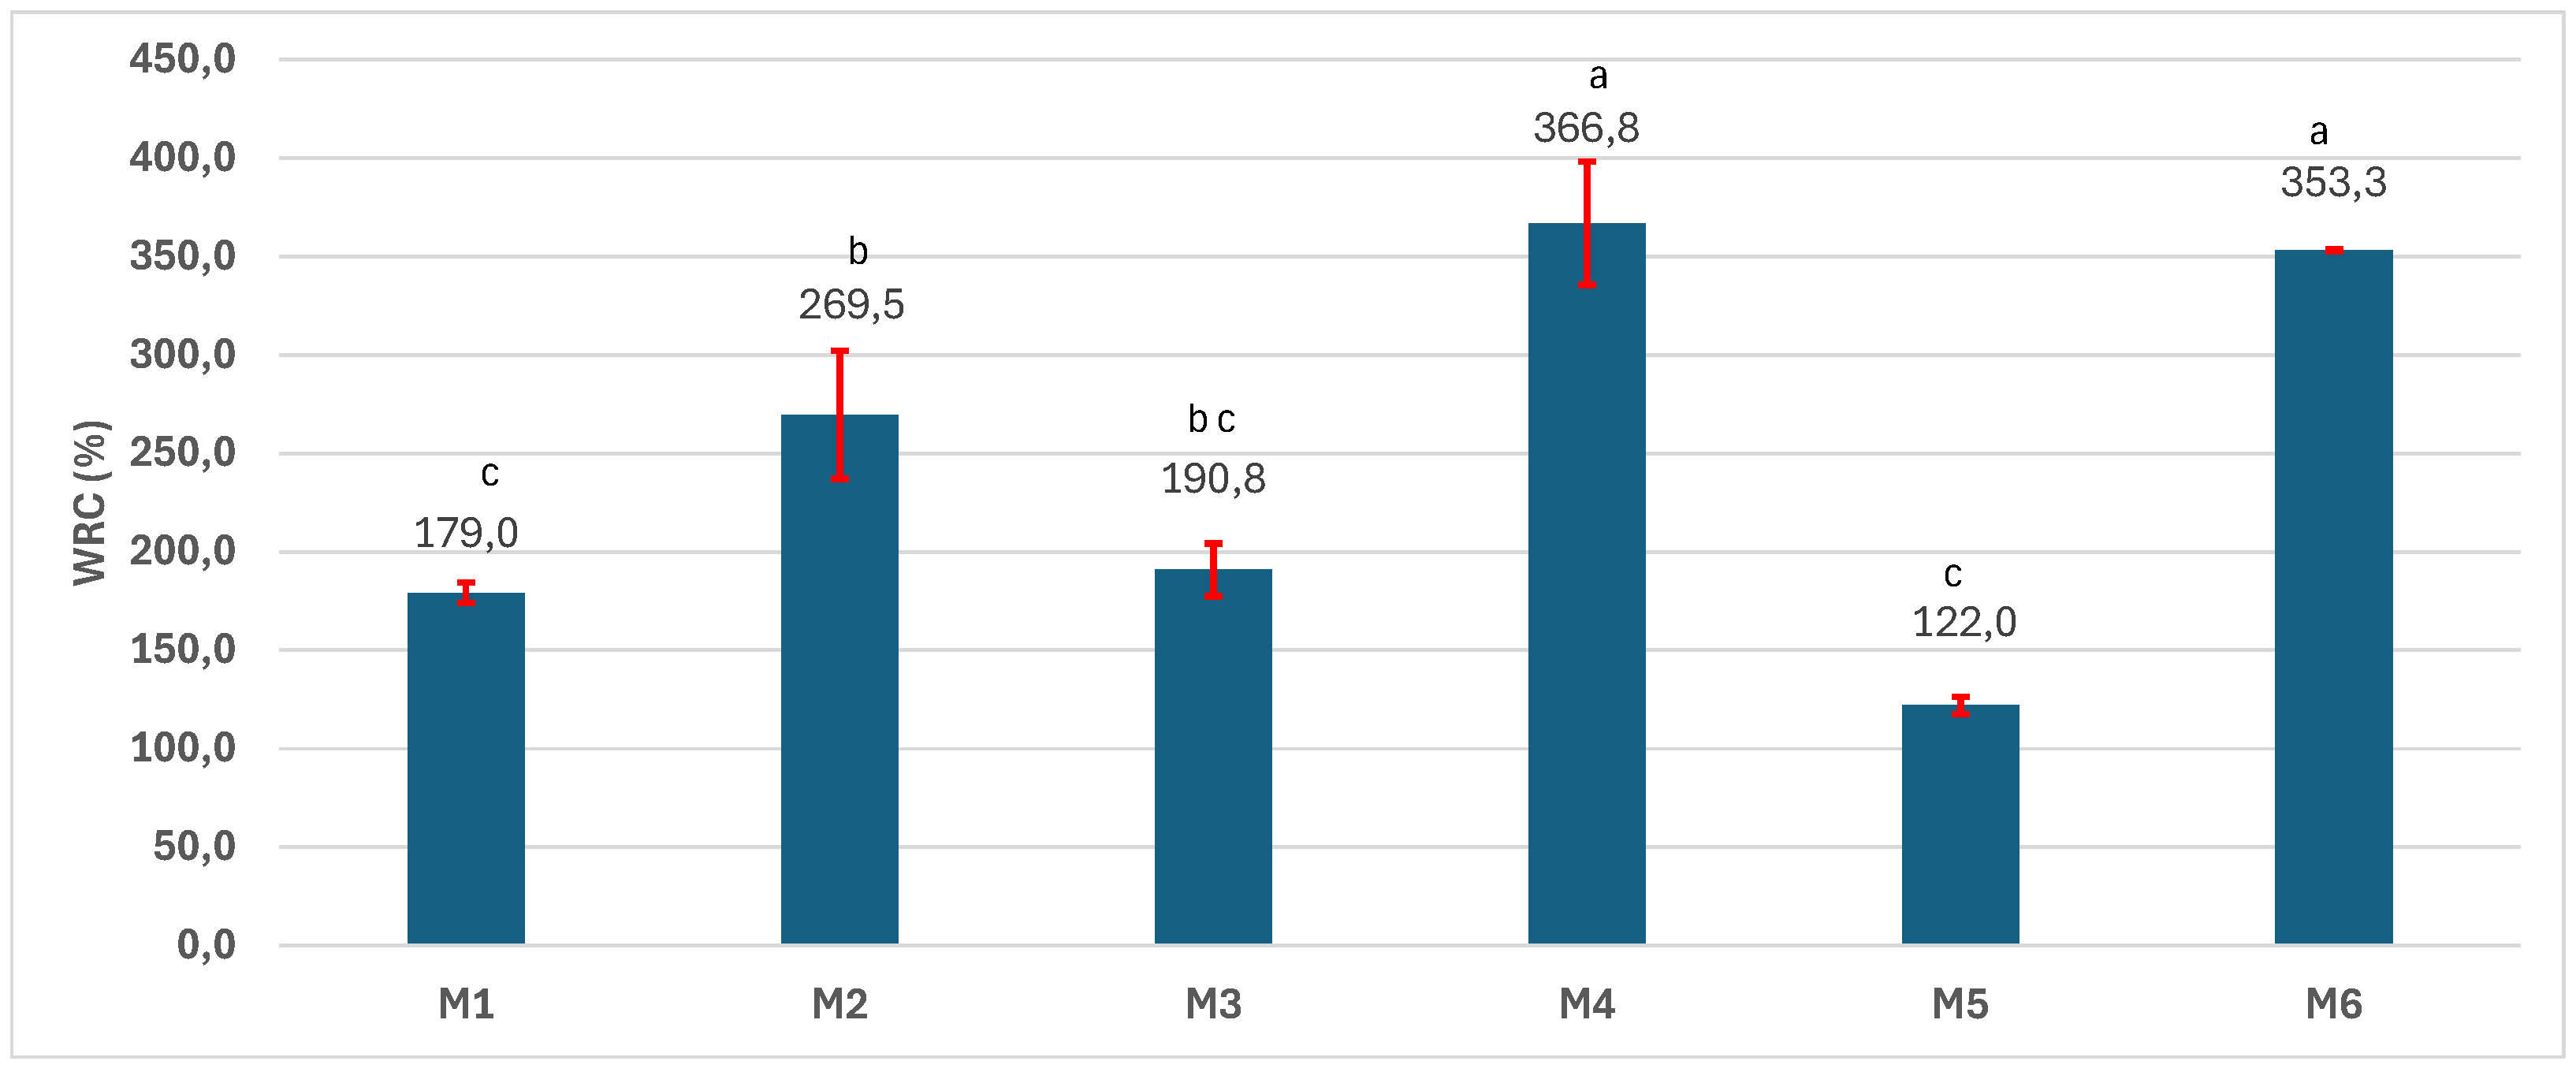
Figure 7.
Tensile resistance of the 3D scaffolds (a, b, c, d e – the same letter refers to nonsignificant differences, based on the Anova One Way, Tukey model).
Figure 7.
Tensile resistance of the 3D scaffolds (a, b, c, d e – the same letter refers to nonsignificant differences, based on the Anova One Way, Tukey model).
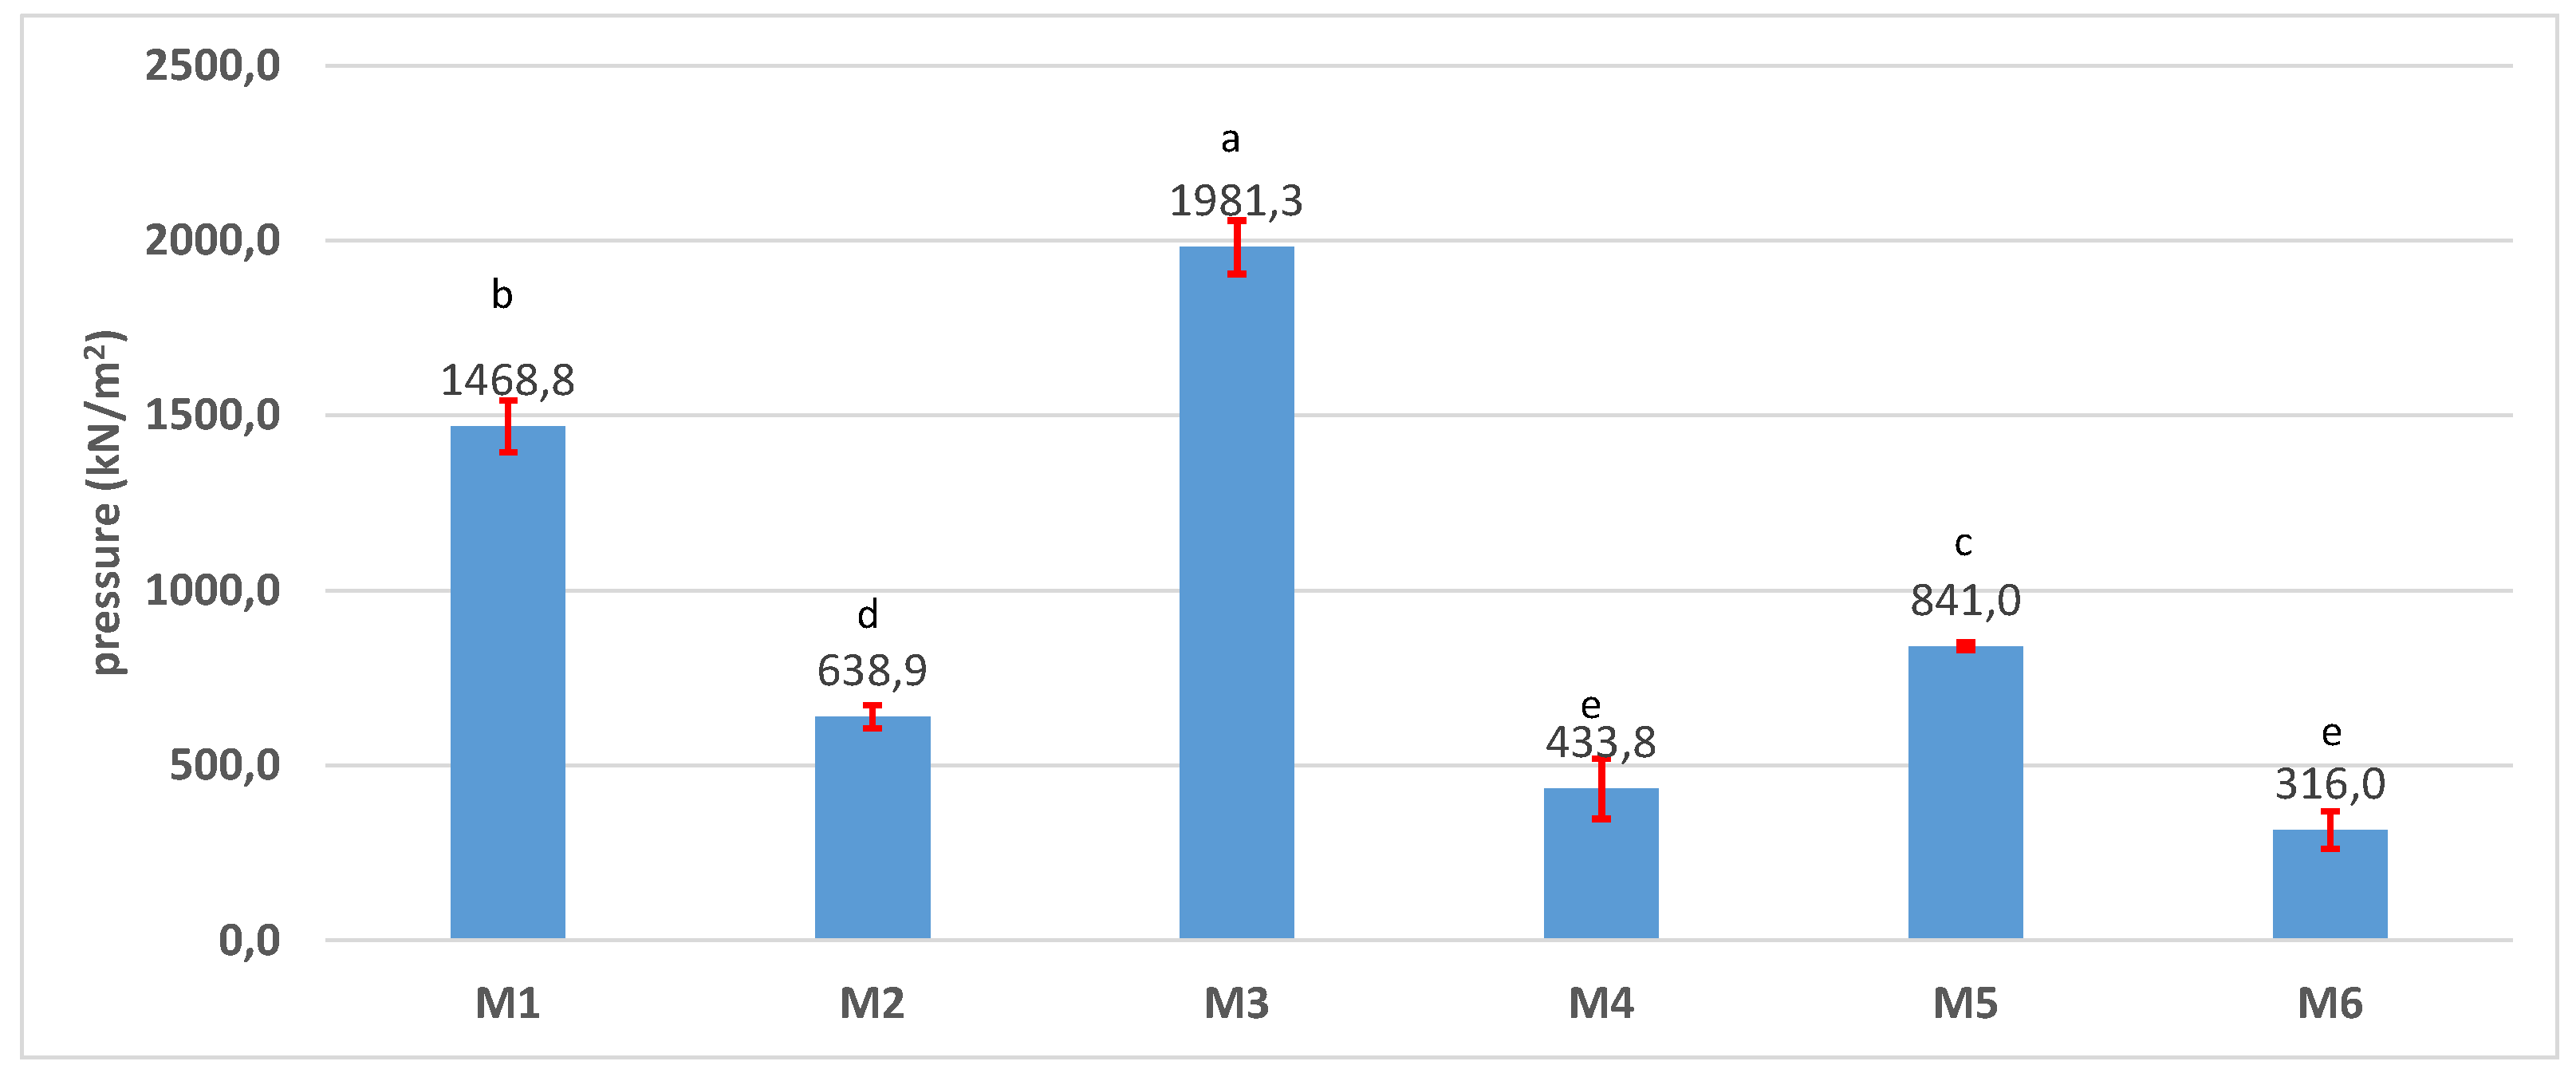
Figure 8.
Absorbed and released glucose from the 3D scaffolds (A, B – the same red capital letter refers to nonsignificant differences, based on the Anova One Way, Tukey model. These refer to the comparison between the quantity of glucose absorbed and released by the same sample; a, b, c, d – the same small letter refers: blue: to differences between samples in terms of the glucose absorbed, orange: to differences between samples in terms of the glucose released).
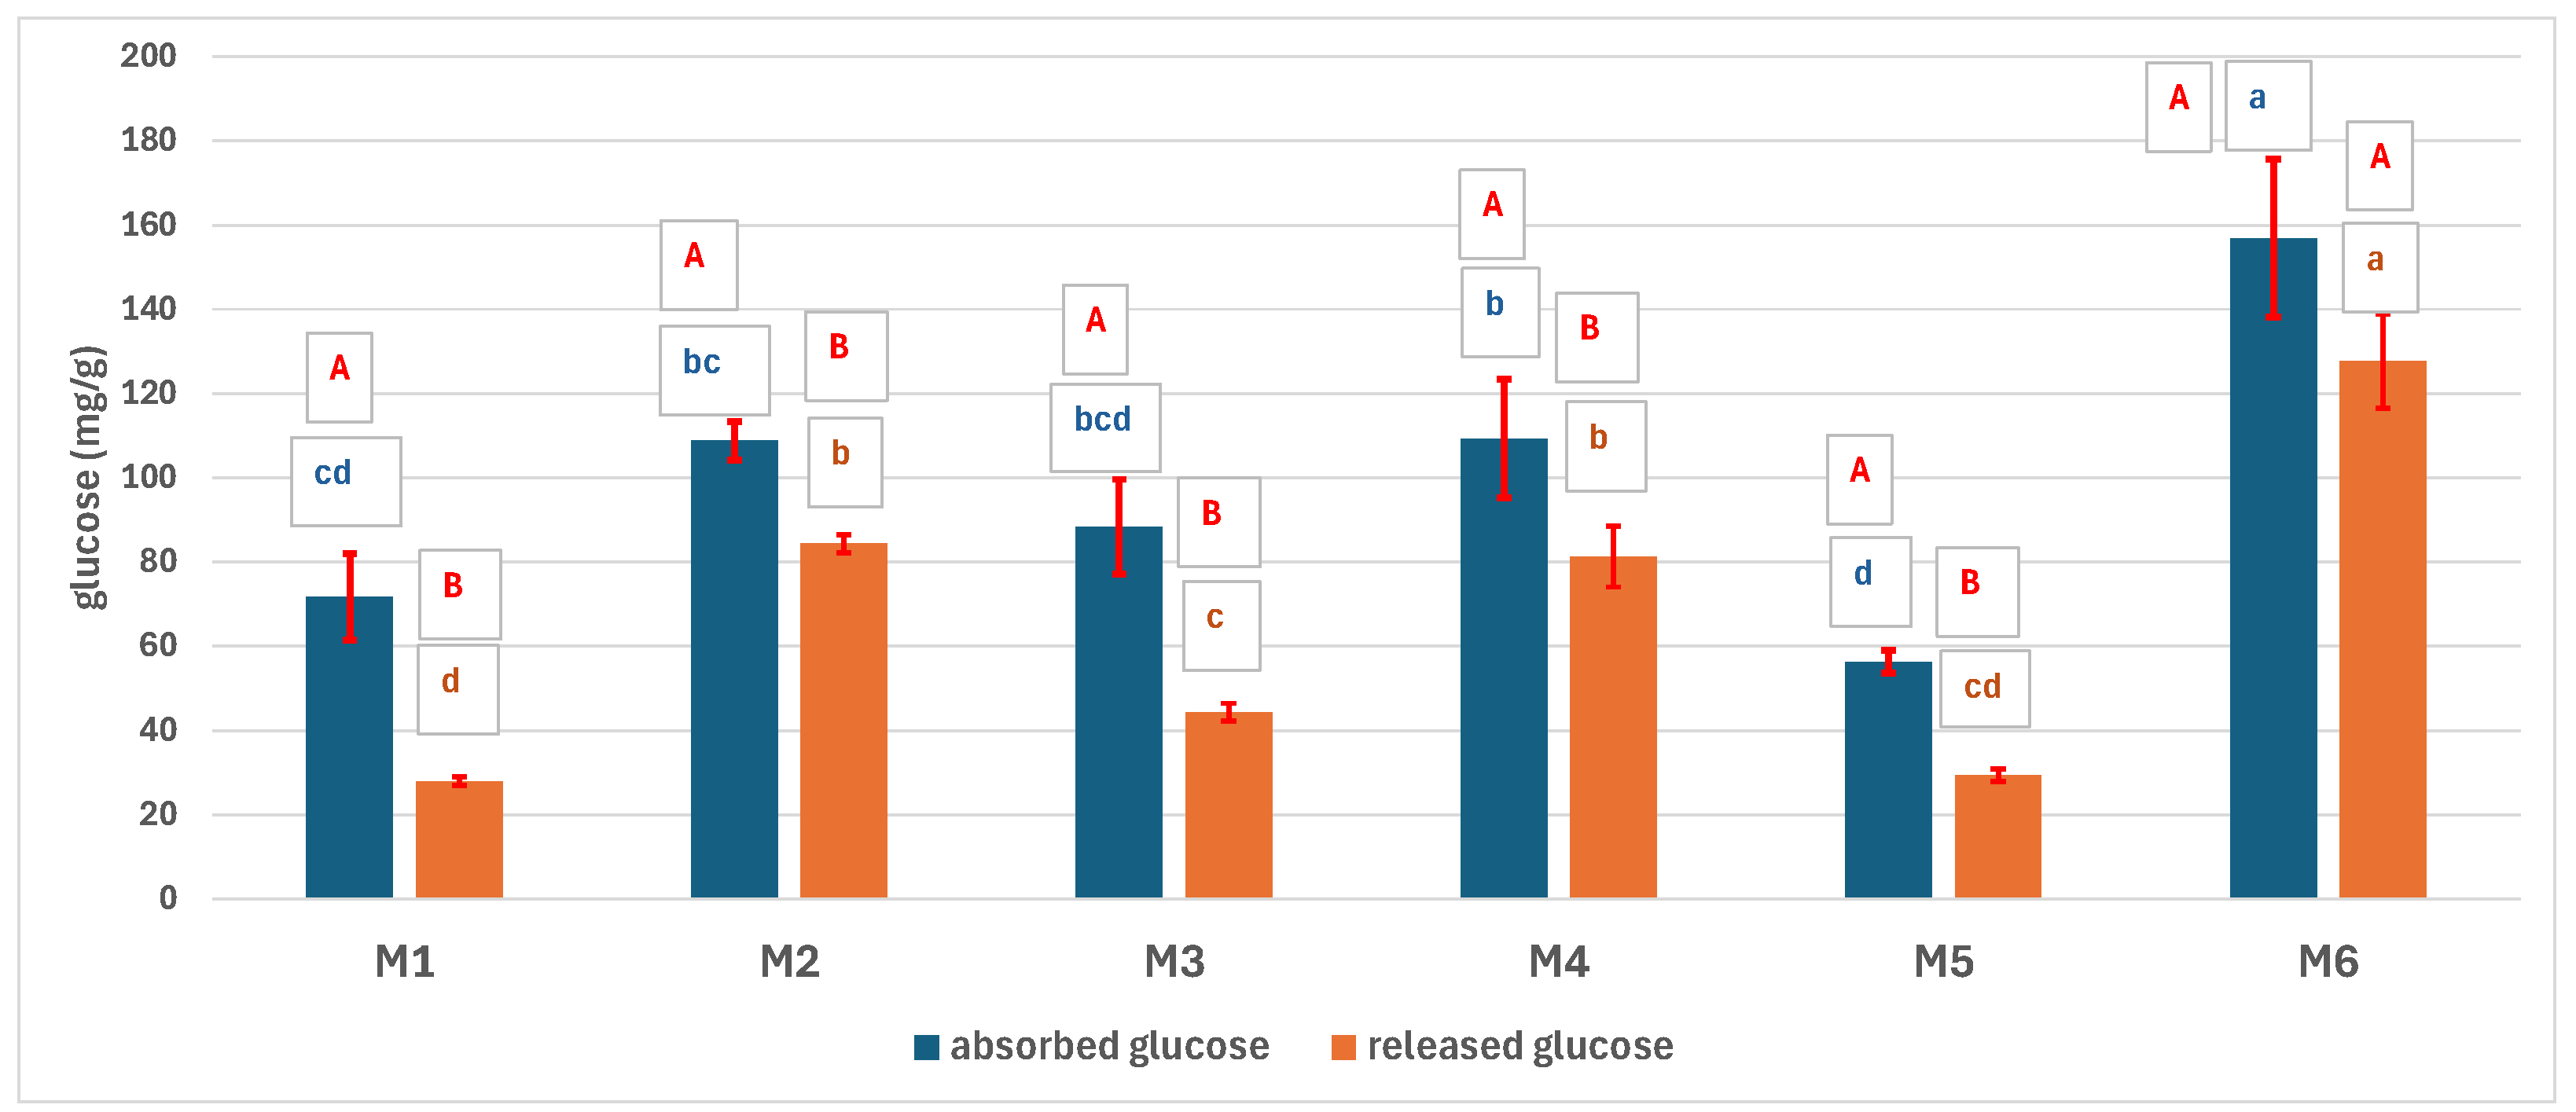
Figure 9.
Absorbed and released albumin from the 3D scaffolds (A, B – the same red capital letter refers to nonsignificant differences, based on the Anova One Way, Tukey model. These refer to the comparison between the quantity of albumin absorbed and released by the same sample; a, b – the same small letter refers: blue: to differences between samples in terms of the albumin absorbed, orange: to differences between samples in terms of the albumin released).
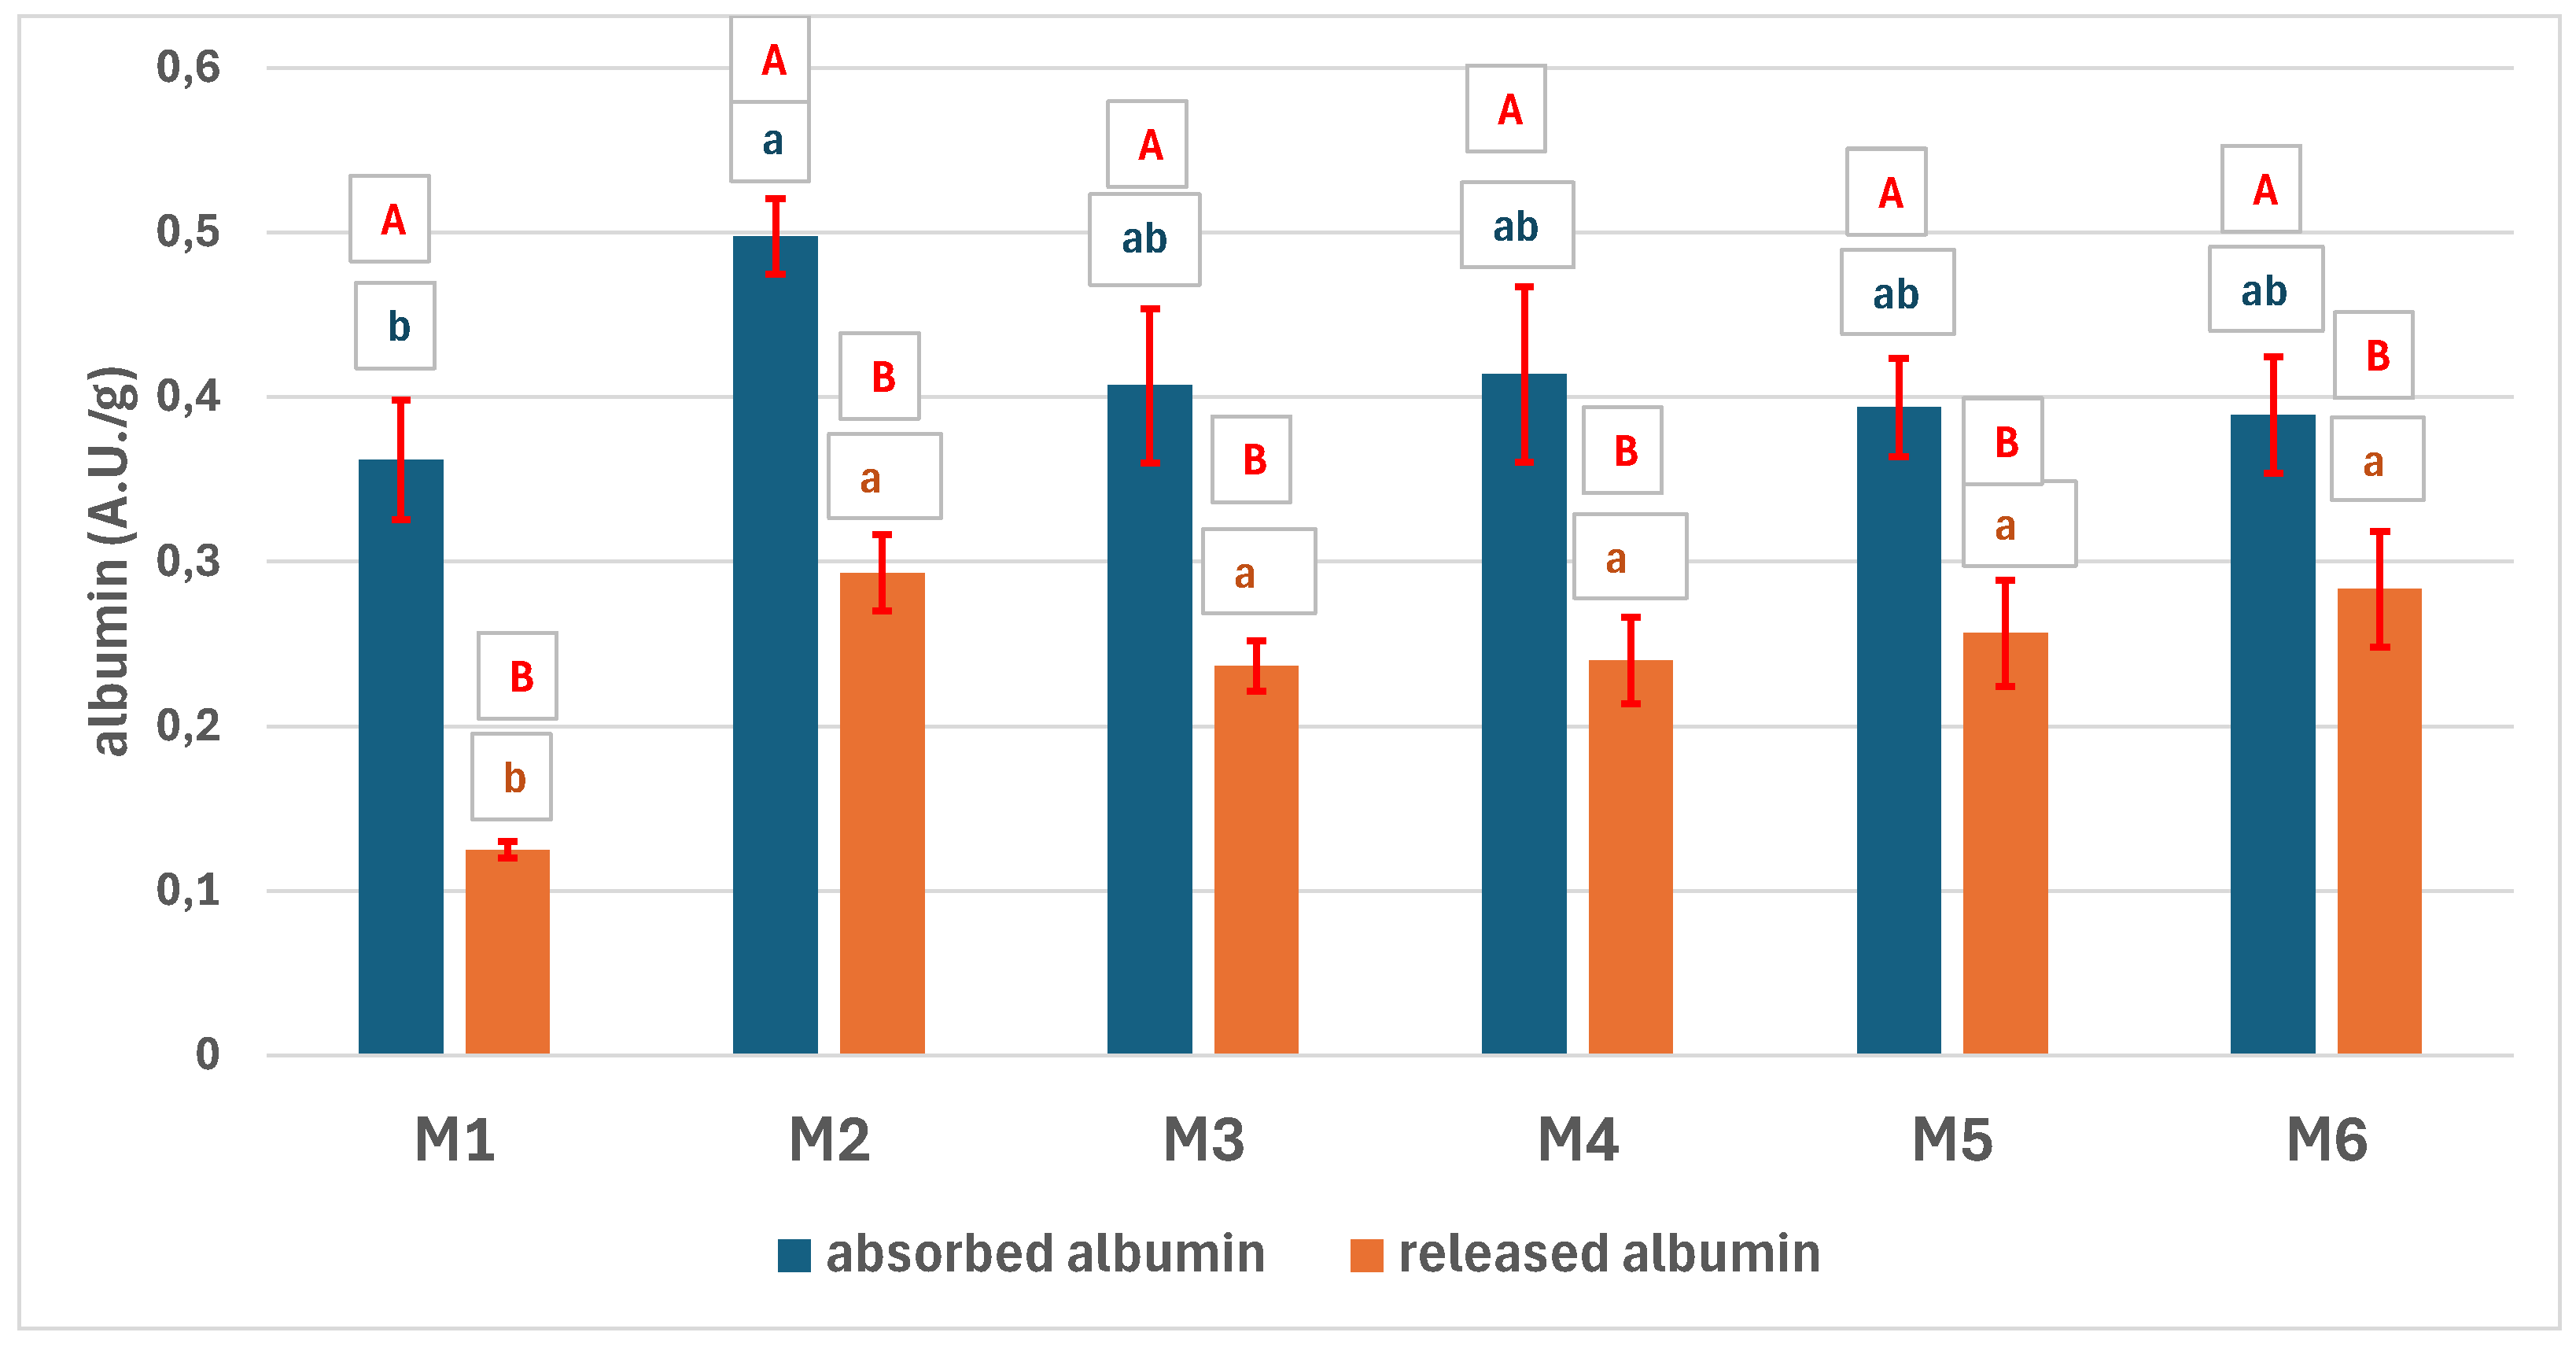
Figure 10.
In vitro biodegradability of the scaffolds in lipase solution with concentration of 60 µg/ml a), 40 µg/ml b) and 20 µg/ml c), at 370C (the same letters means that the differences are statistically nonsignificant according to Anova One Way, Tukey model).
Figure 10.
In vitro biodegradability of the scaffolds in lipase solution with concentration of 60 µg/ml a), 40 µg/ml b) and 20 µg/ml c), at 370C (the same letters means that the differences are statistically nonsignificant according to Anova One Way, Tukey model).
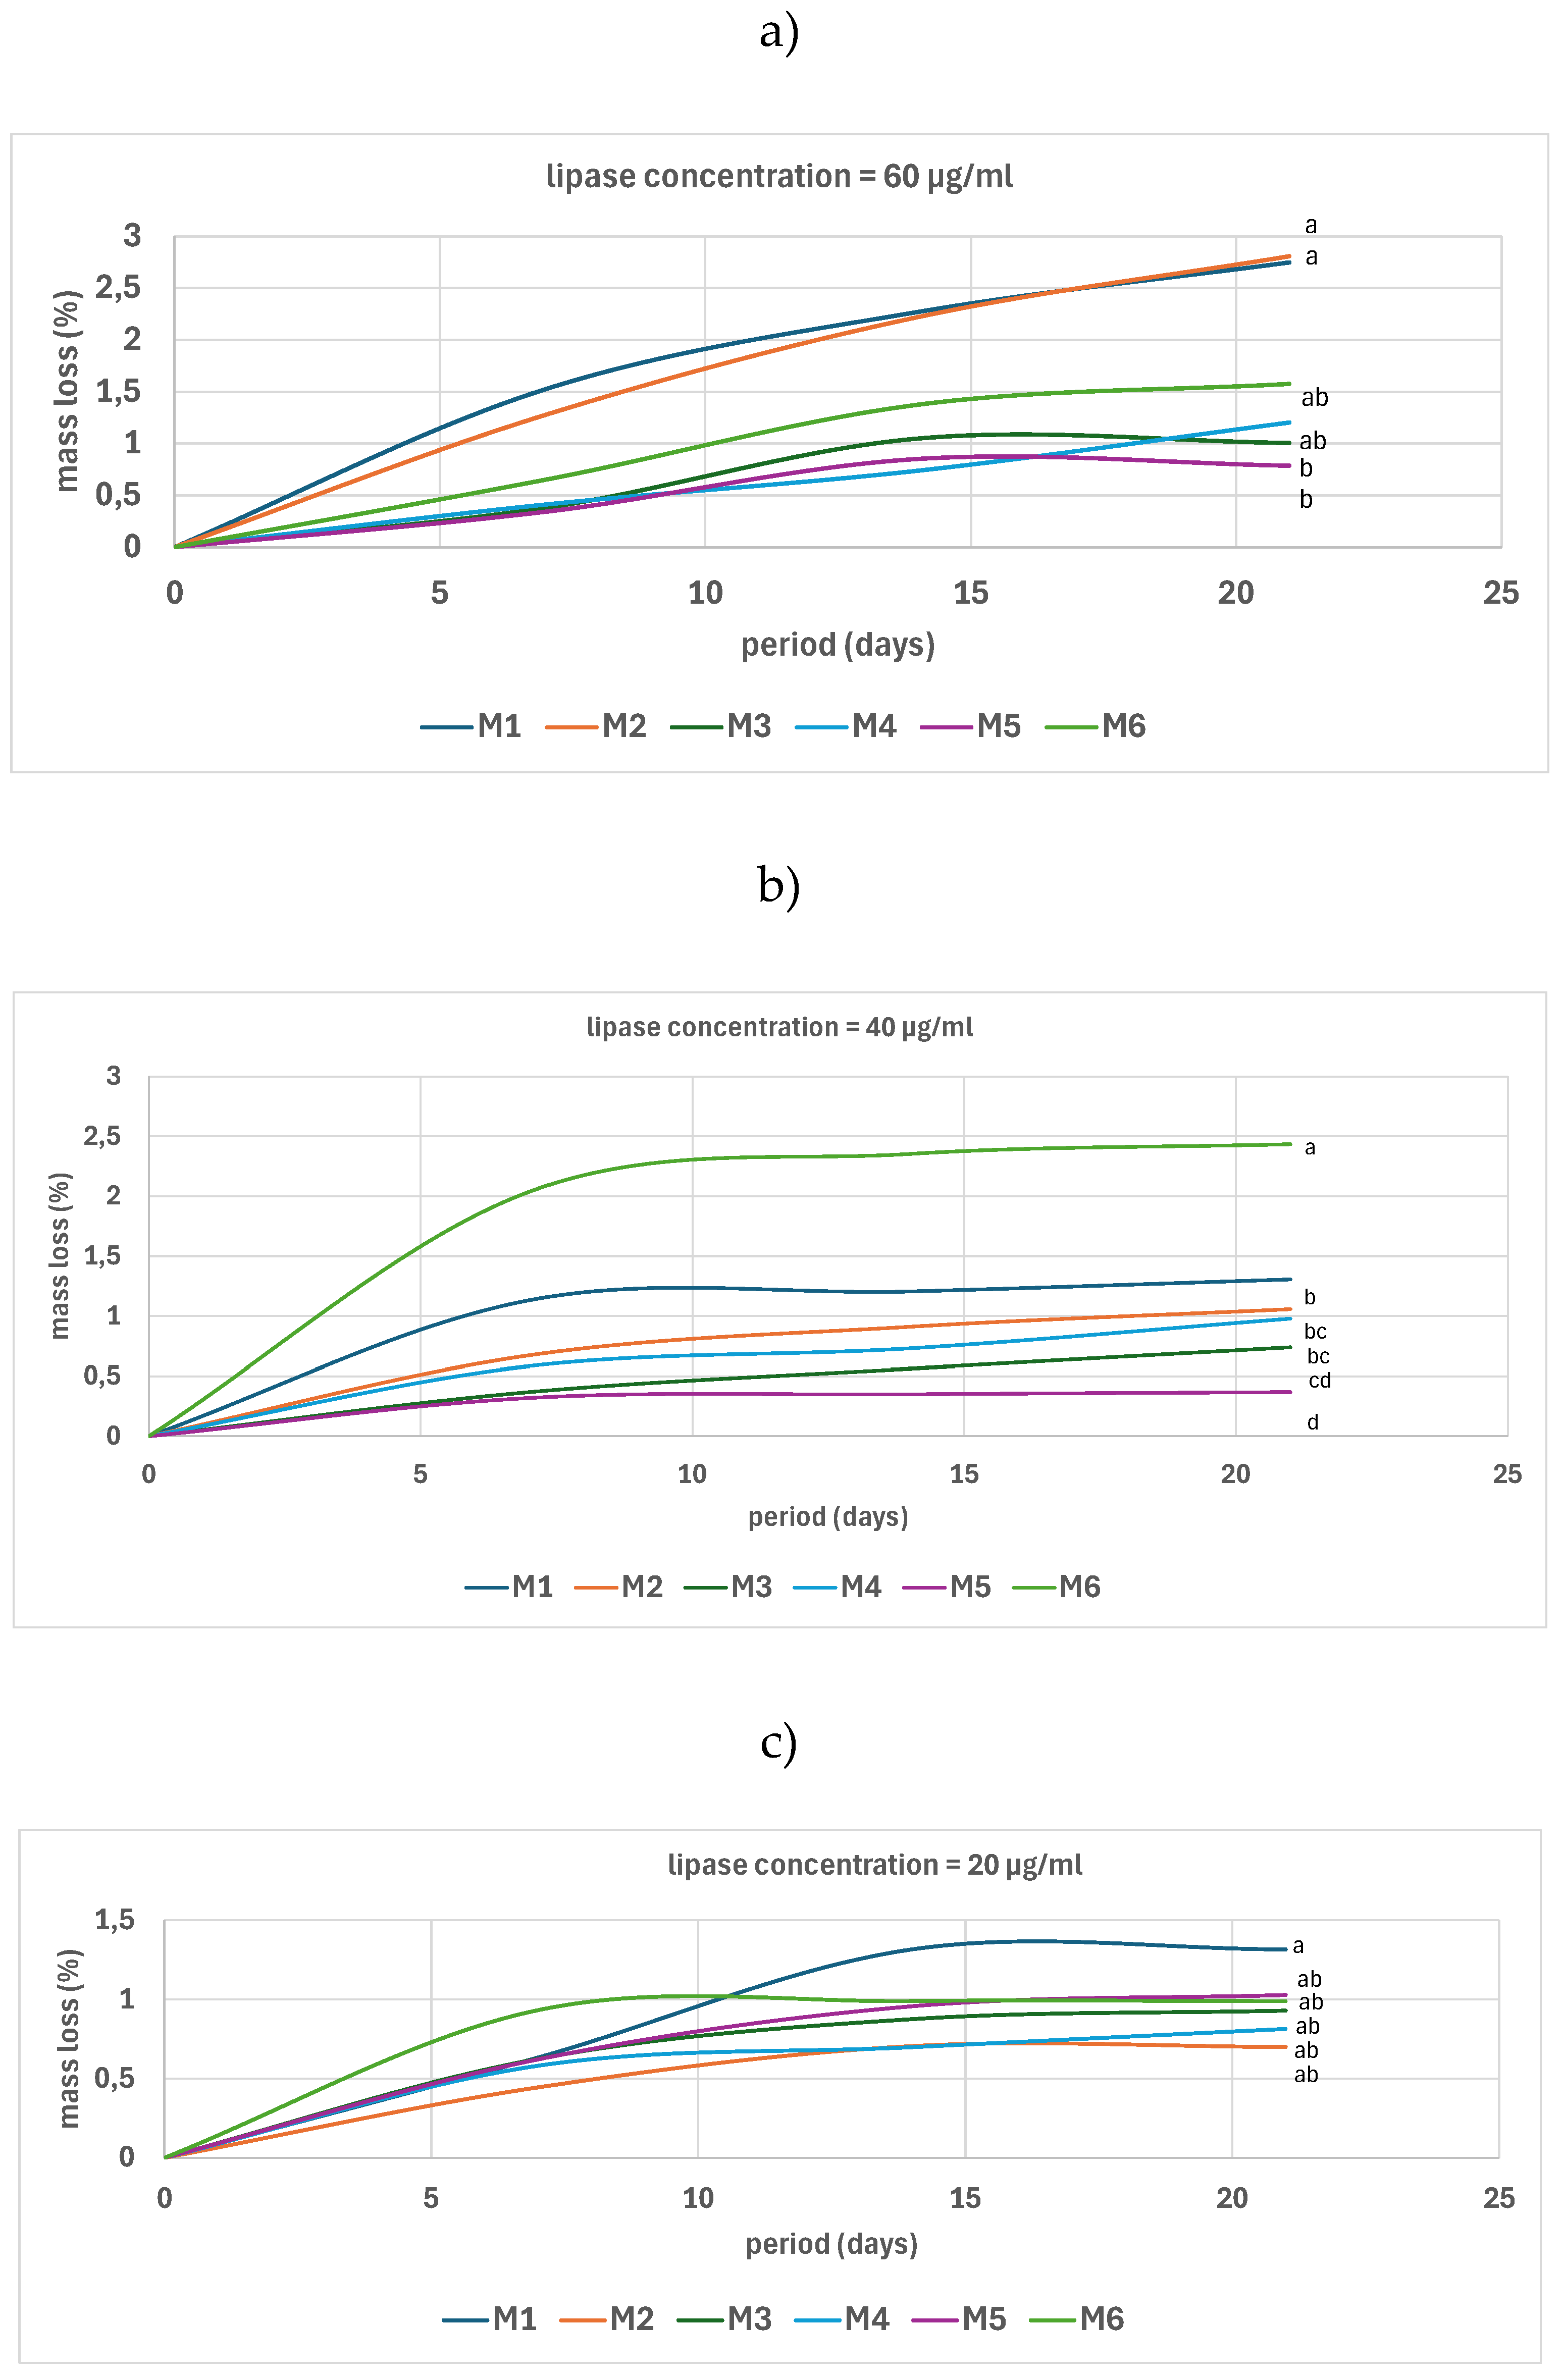
Figure 11.
Levels of absorbed blood components onto scaffolds (a, b, c, d – the same small letter refers to nonsignificant differences, based on the Anova One Way, Tukey model).
Figure 11.
Levels of absorbed blood components onto scaffolds (a, b, c, d – the same small letter refers to nonsignificant differences, based on the Anova One Way, Tukey model).
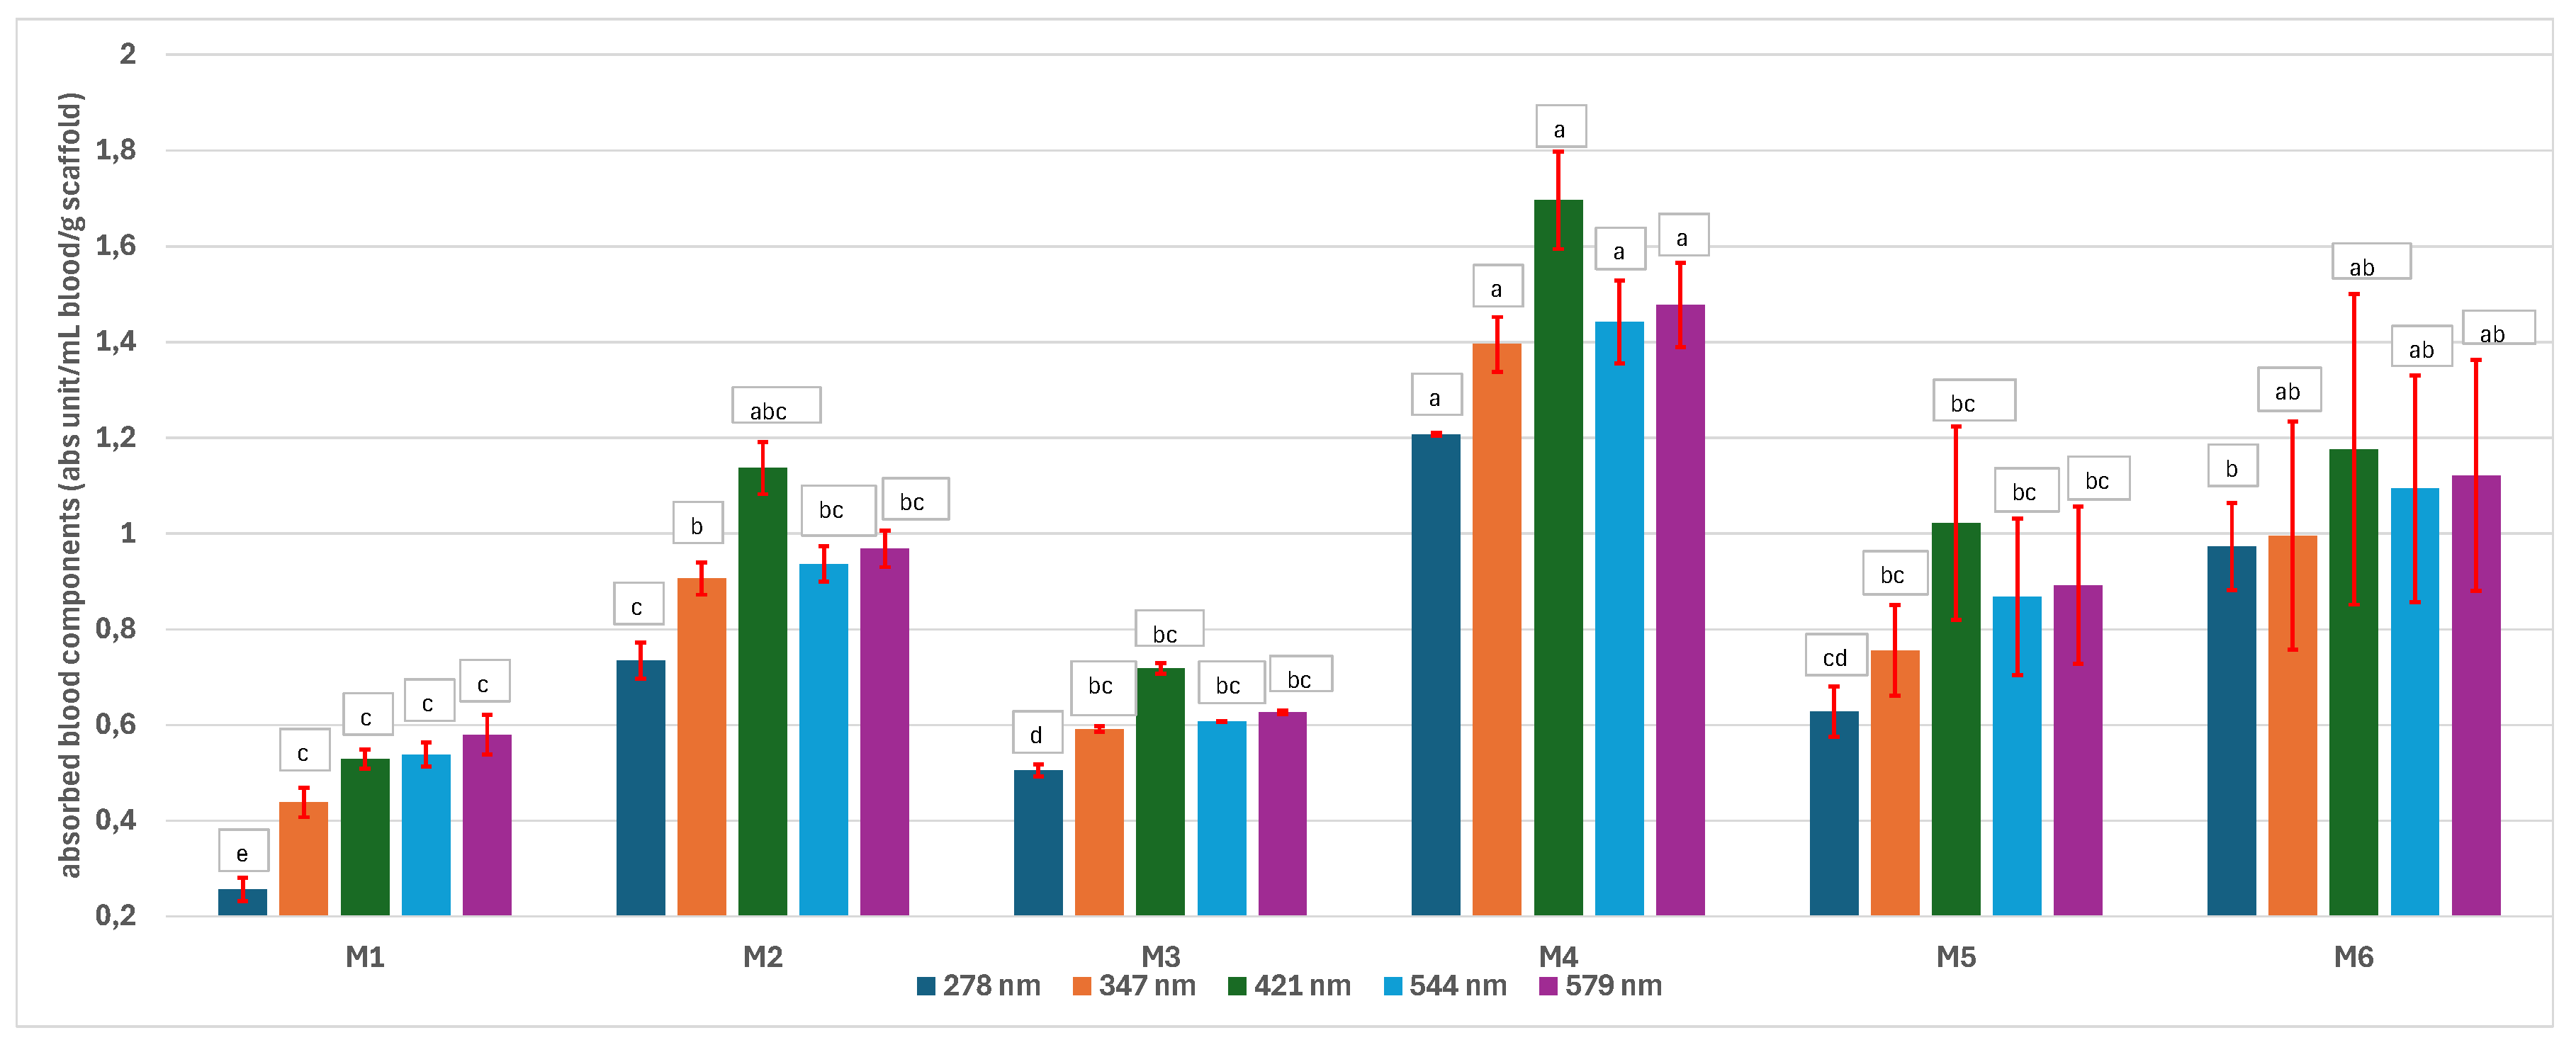

Table 1.
Raw materials and quantities used to prepare the scaffolds.
| Sample code | PLA (g) | PCL (g) | CH2Cl2 (ml) |
polymer:NaCl (wt:wt) |
NaCl (g) |
Image | ||||||
|---|---|---|---|---|---|---|---|---|---|---|---|---|
| M1 | 9 | - | 51 | 1:8 | 72 |  |
||||||
| M2 | 9 | - | 51 | 1:16 | 144 |  |
||||||
| M3 | - | 9 | 51 | 1:8 | 72 |  |
||||||
| M4 | - | 9 | 51 | 1:16 | 144 |  |
||||||
| M5 | 4.5 | 4.5 | 51 | 1:8 | 72 |  |
||||||
| M6 | 4.5 | 4.5 | 51 | 1:16 | 144 |  |
||||||
| Washing status of the scaffolds | ||||||||||||
| After the first day of washing |  |
Incomplete washing |  |
Complete washing |  |
|||||||
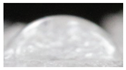
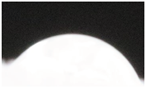
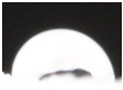
Table 2.
Microscopic and SEM images of 3D scaffolds.
| Sample code | Microscopic image (mag 10X) |
SEM image |
|---|---|---|
| M1 | 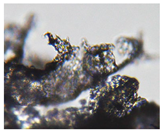 |
 |
| M2 | 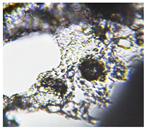 |
 |
| M3 | 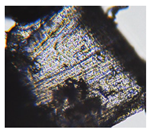 |
 |
| M4 | 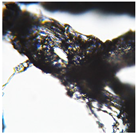 |
 |
| M5 | 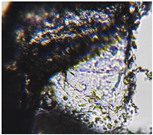 |
 |
| M6 | 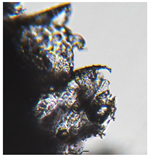 |
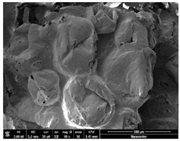 |
Table 3.
Map sum spectrum and elemental composition of the matrices resulted from EDXS.
| Sample code | Map sum spectrum |
|---|---|
| M1 | 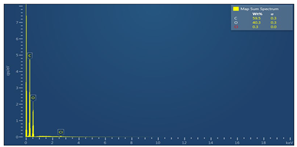 |
| M2 | 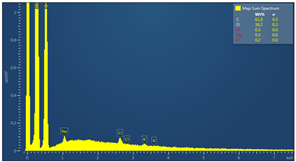 |
| M3 | 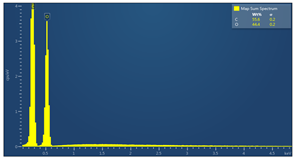 |
| M4 | 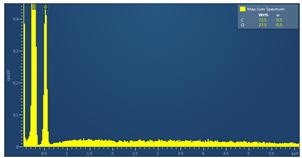 |
| M5 | 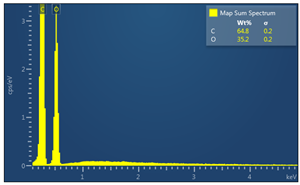 |
| M6 | 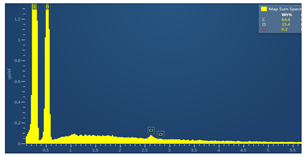 |
Table 4.
DTA/TGA parameters of the scaffolds.
| Sample code | DTA events | TG mass loss | Total mass loss |
|---|---|---|---|
| M1 | Exo 63°C glass transition Endo 152°C melting |
- | -99.0% |
| - | |||
| Endo 353°C decomposition | 273-315°C: -8,0% | ||
| 315-380°C: -91% | |||
| M2 | Exo 77°C glass transition Endo 154°C melting |
- | -98.2% |
| - | |||
| Endo 347°C decomposition | 275-315°C: -8.9% | ||
| 315-380°C: -89.3% | |||
| M3 | Endo 75°C melting PCL | - | -99.2% |
| Endo 402°C decomposition | 310-370°C: -8.6% | ||
| 370-426°C: -84.9% | |||
| Exo 455°C combustion/degradation | 426-500°C: -4.7% | ||
| M4 | Endo 72°C melting PCL | - | -99.1% |
| Endo 400°C degradation | 315-380°C: -19.1% | ||
| 380-427°C: -78% | |||
| Exo 453°C combustion/degradation | 427-500°C: -2% | ||
| M5 | Endo 72°C melting PCL Endo 153°C melting PLA |
- | -98.3% |
| - | |||
| Endo 352°C decomposition of PLA Endo 398°C decomposition of PCL |
270-315°C: -4.9% | ||
| 315-380°C: -38.6% | |||
| 380-420°C: -50.8% | |||
| Exo 430°C combustion | 420-500°C: -4% | ||
| M6 | Endo 71°C melting PCL Endo 154°C melting PLA |
- | -98.4% |
| - | |||
| Endo 344°C decomposition PLA Endo 396°C decomposition PCL |
270-315°C: -6.4% | ||
| 315-350°C: -33.3% | |||
| 350-420°C: -57.9% | |||
| Exo 436°C combustion/degradation | 420-500°C: -1.8% |
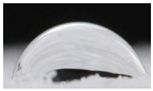
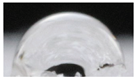
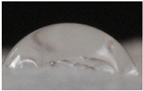
Table 5.
Images of the water droplets on the scaffold`s surface and average contact angles.
| Sample code | Replicate 1 | Replicate 2 | Replicate 3 | Average contact angle * |
|---|---|---|---|---|
| M1 | 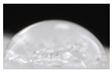 |
 |
 |
54.1±6.5 a |
| M2 | 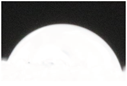 |
 |
 |
53.6±7.9 a |
| M3 | 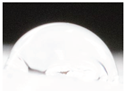 |
 |
 |
62.3±5.3 a |
| M4 | 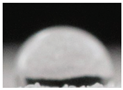 |
 |
 |
63.8±17.8 a |
| M5 | 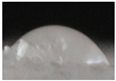 |
 |
 |
55.2±5.6 a |
| M6 | 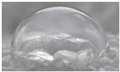 |
 |
 |
60.3±5.8 a |
* the same letters mean that the differences are statistically nonsignificant according to Anova One Way, Tukey model.
Table 6.
Macro- and microscopic images of the scaffolds after immersion in pig blood collected on citrate for 3 h at 370C.
Table 6.
Macro- and microscopic images of the scaffolds after immersion in pig blood collected on citrate for 3 h at 370C.
| Sample code | Macroscopic images | Microscopic images (10X) | |
|---|---|---|---|
| Front view | Section view | ||
| M1 | 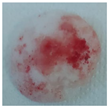 |
 |
 |
| M2 | 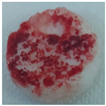 |
 |
 |
| M3 | 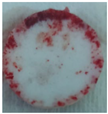 |
 |
 |
| M4 | 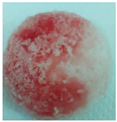 |
 |
 |
| M5 | 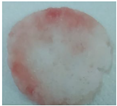 |
 |
 |
| M6 | 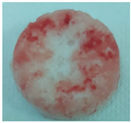 |
 |
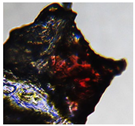 |
Table 7.
Macroscopic images of the scaffolds with Lactobacillus 2 and 5 days after inoculation and microscopic aspects of the bacterial culture.
Table 7.
Macroscopic images of the scaffolds with Lactobacillus 2 and 5 days after inoculation and microscopic aspects of the bacterial culture.
| Sample code | After 2 days | After 5 days | |
|---|---|---|---|
| Macroscopic image | Microscopic image of the Lactobacillus cell from the scaffold surface | ||
| M1 | 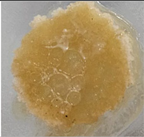 |
 |
 |
| M2 | 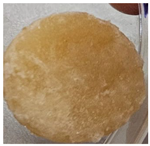 |
 |
 |
| M3 | 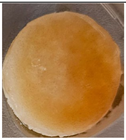 |
 |
 |
| M4 | 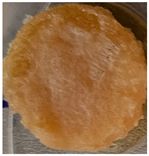 |
 |
 |
| M5 | 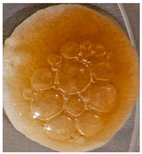 |
 |
 |
| M6 | 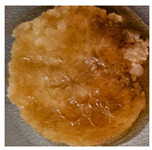 |
 |
 |
Disclaimer/Publisher’s Note: The statements, opinions and data contained in all publications are solely those of the individual author(s) and contributor(s) and not of MDPI and/or the editor(s). MDPI and/or the editor(s) disclaim responsibility for any injury to people or property resulting from any ideas, methods, instructions or products referred to in the content. |
© 2025 by the authors. Licensee MDPI, Basel, Switzerland. This article is an open access article distributed under the terms and conditions of the Creative Commons Attribution (CC BY) license (http://creativecommons.org/licenses/by/4.0/).
Copyright: This open access article is published under a Creative Commons CC BY 4.0 license, which permit the free download, distribution, and reuse, provided that the author and preprint are cited in any reuse.


