Submitted:
30 July 2025
Posted:
31 July 2025
You are already at the latest version
Abstract
A large amount of waste palm kernel shell is generated from palm oil processing. These waste residues are indiscriminately dumped, constituting nuisance to the environment. Palm kernel shell has great potential to be transformed into bio-based chemicals. This study focused on utilising palm kernel shell, an agricultural lignocellulosic biomass for bioethanol production. Raw shells were pretreated with 0.5% v/v H2SO4 acid solution at 100 ˚C for 30 minutes and 0.5 M NaOH alkaline solution at 120 ˚C for 20 minutes in an autoclave. The pretreated palm kernel shell was hydrolyzed at varied enzyme concentration of 10 -30 FPU/g for 72 hours at 50 ˚C. Fermentation was carried out on the hydrolysates at varied conditions of yeast concentration (1 – 5% v/v) temperature (25 – 35 ˚C) and time (24- 72 hours). Lowest glucose of 32.19 g/L at 10 FPU while highest glucose concentration of 39.78 g/L was obtained at enzyme concentration of 30 FPU. The conditions for maximum bioethanol production were 1.506% v/v, 35 ˚C and 70 hours for yeast concentration, temperature and time respectively. Analysis of variance showed that yeast concentration was significant for the fermentation process (p= 0.0186). These results confirmed the feasibility of transforming palm kernel shells to bioethanol.
Keywords:
Acid pretreatment
; bioethanol
; enzymatic hydrolysis
; fermentation
; palm kernel shells
1. Introduction
The transition from non-renewable to renewable energy is imperative. The use of non-renewable energy sources such as coal, petroleum and natural gas fossil fuels has contributed to environmental pollution and climate change [1]. Lignocellulose biomass is a promising raw material for the production of chemicals and fuels [2]. They are cheap and readily available materials [3]. They are composed of lignin, cellulose and hemicellulose and are obtained from agricultural, forest, municipal and industrial waste [4,5]. Nigeria generates up to 200 million tons of agricultural lignocellulosic wastes annually. These waste materials consist of rice straw, corn cobs, sugarcane bagasse, oil palm empty fruit bunch, palm kernel shells, etc. [6].
Oil palm (Elaeis guineensis) is a perennial crop grown in the tropical region of West Africa [7]. Other products obtained from oil palm are palm kernel shell, palm fronds, palm trunks, empty fruit bunches, mesocarp fibers and palm leaves [8]. Palm kernel shells are agro-lignocellulosic waste that comprise mainly of cellulose (28 – 33%), hemicellulose (21.6 – 22.1%) and lignin (33 – 44%) [7]. It is a hard enclosure of palm kernel discarded as waste when palm oil are processed from the palm fruit [9]. In Nigeria the amount of palm kernel shell waste generated annually is 2.5 million tonnes [9]. As a natural fiber, palm kernel shells have relatively low density and are environmentally friendly [10]. They also have a low carbon footprint and are converted into a wide range of value-added products such as biogas, biooil, biochar etc. which help in tackling issues of indiscriminate waste disposal and enhance the generation of cleaner energies [9]. The conversion of lignocellulosic waste to bioethanol involves series of steps namely pretreatment, hydrolysis and fermentation processes [11,12].
Pretreatment is an important process in the conversion of lignocellulosic biomass to bioethanol [13]. Pretreatment process helps dissociate the cellulose, hemicellulose and lignin components of the biomass through physical and chemical methods. Physical methods of pretreatment involve the reduction of biomass materials to smaller particles with the aim of decreasing the particle size, thereby increasing the biomass pore size and surface area [14]. They include milling, chipping, ultrasound, microwave, and ultraviolet radiation [11]. Chemical pretreatment employs acids, alkalis, ammonia, ionic liquids and organic solvents. This pretreatment attacks the hemicellulose and lignin components enabling cellulose hydrolysis [7]. Sukhang et al. [15] worked on the production of bioethanol from oil palm empty fruit bunch using acid (H2SO4) and alkaline (NaOH) pretreatment. Acid pretreatment produced 65.7% cellulose, 3.77% hemicellulose and 27.82% lignin. However, after alkaline pretreatment, cellulose increased to 72.1% whereas hemicellulose and lignin decreased to 3.24% and 17.60% respectively. Hydrolysis converts the cellulose and hemicellulose fraction of lignocellulosic biomass to monosaccharides, i.e., simple sugars, such as glucose, xylose, arabinose, fructose, etc. [16].
Hydrolysis of hemicellulose mostly produces pentose sugars (such as xylose) while hydrolysis of cellulose mostly produces hexose sugars (such as glucose) [17]. Acid hydrolysis is the oldest and most commonly used method that has been studied nearlya century ago [18,19]. This hydrolysis process occurs in the temperature range of between 120 ˚C to 180 ˚C , acid concentration range of 0.5% - 1.5% and reaction time of between 5 – 30 minutes [14,19]. Acids involved in the hydrolysis process are mainly strong acids such as sulphuric acid, nitric acid and hydrochloric acid [20]. Enzymatic hydrolysis is carried out using microorganisms that produce enzymes or commercially available enzymes [14]. Enzymatic hydrolysis is performed under mild process conditions which makes the process environmentally friendly and devoid of the formation of harmful compounds [21]. This process also occurs at a longer period (24 – 96 hours). The specificity of enzymes can facilitate the complete conversion of the substrate to sugars [22]. During enzymatic hydrolysis, cellulose is converted to glucose through the action of cellulase enzymes at temperatures between 40 and 50 ˚C [23]. Cellulases are a blend of enzymes comprising three main components namely endo-1, 4 -β-glucanase, exo-1,4- β- glucanase (cellobiohydrolase) and β-glucosidase. Endoglucanase is active in low crystalline regions of cellulosic material, generating free chain-ends whereas exoglucanase breaks down cellulose molecules by eliminating cellobiose units from the free chain-ends. β-glucosidase hydrolyzes the cellobiose unit to obtain glucose. Raman and Gnansounou [24] utilised cellulase and β – glucosidase enzymes in the enzymatic hydrolysis of empty fruit bunches to produce glucose. The enzymes were mixed with pretreated biomass (3g) and citrate buffer (16.5 mL), sterilized and placed in an incubator shaker at 50 ˚C at 150 rpm for 72 hours. The obtained liquid portion contained 164.4 g glucose.
Fermentation involves the use of microorganisms, such as yeast to release ethanol from simple sugars (such as glucose). Hydrolysis and fermentation can be performed sequentially as separate hydrolysis and fermentation (SHF) or simultaneously known as simultaneous saccharification and fermentation (SSF). Examples of yeast include Saccharomyces cerevisiae, Pichia stipites, Kluyveromyces marxianus, etc. [18,25]. Ben Taher et al. [26] used Saccharomyces cerevisiae to produce bioethanol using potato peel residues. The yeast was grown in 100 mL of potato peel residue enzyme hydrolysate on a rotary shaker at 30 ˚C at 100 rpm for 16 hours. The highest ethanol concentration obtained with the addition of ammonium sulphate supplement was 30 g/L.
Waste palm kernel shells are found in large amounts in Nigeria and can be transformed into useful products. Palm kernel shells have shown applicability in different areas. For instance, they have been used as detoxifiers in wastewater, abrasives in automobile parts, additives in drilling fluids, and reinforcement for metallic composites [9]. Palm tree residues, such as palm fronds [27], empty fruit bunches [28], mesocarp fibers [29], and palm trunk [30] have been converted to valuable chemicals such as xylose, glucose, hydrogen, methane and bioethanol.
Despite extensive research on lignocellulosic biomass, few studies have explored the use of palm kernel shells for bioethanol production. Thus, the main objective of this study is to valorize palm kernel shell to bioethanol through acid pretreatment, enzymatic hydrolysis and fermentation processes. Statistical evaluation using the response surface methodology was also utilised to determine the interactions between the independent variables and dependent variables.
2. Materials and Method
2.1. Preparation of Palm Kernel Shells
Palm kernel shells were collected from Covenant University oil palm plantation farm, Ota (6°38′N 3°06′E), South West Nigeria. The palm kernel shells were washed repeatedly with water and dried for 72 hours and crushed to powdery particles (nano sizes) using a mechanical grinder. The shells were stored in dry air-tight bags.
2.2. Determination of Chemical Composition of Palm Kernel Shell
The composition of ash, extractives, hemicellulose, lignin and cellulose were determined according to the procedures of Ayeni et al. 2015. Ash was determined by drying samples of palm kernel shell at 575°C. The ash content is the weight of residue after drying. Extractives were obtained through Soxhlet extraction with acetone solvent. The extractive content was gravimetrically quantified from the weight of residue after drying at 105°C, expressed as the percentage of the initial sample weight. Hemicellulose was determined by boiling a mixture of palm kernel shell and 0.5 M NaOH solution. The residue was dried at 105 °C and the hemicellulose content was expressed as difference in sample weight. Lignin was determined by hydrolyzing palm kernel shell in 72% H2SO4 solution. The total lignin content was expressed as the sum of the acid soluble and acid insoluble lignin content. The content of cellulose was calculated by difference, assuming that extractives, ash, hemicellulose and lignin, are the only components of the entire biomass.
2.3. Pretreatment of Raw Palm Kernel Shells
Acid pretreatment was carried out to solubilize hemicellulose and disrupt the lignin structure. A mixture of 5 g of palm kernel shell and 100 mL of 0.5% v/v H2SO4 solution was heated at 100 ˚C for 30 minutes in an autoclave (Benchmark Scientific – BioClave 16L). After heating, the mixture was left to cool. The cellulose-rich residue was separated from the filtrate (rich in hemicellulose) by vacuum filtration. The samples were filtered and the solid fraction was washed with distilled water and dried overnight in the oven. The dried residue was further pretreated with 0.5 M NaOH at 120 ˚C for 20 minutes to remove the lignin component from palm kernel shell. After pretreatment, the residue was washed continuously with distilled water to remove residual NaOH. After washing, the samples were dried for 10 hours in an oven at 105 ˚C. The dried palm kernel shell residue was used as substrate for enzymatic hydrolysis
2.4. Enzymatic Hydrolysis of Pretreated Palm Kernel Shell Residue
The enzymatic hydrolysis was performed in 100 mL Erlenmeyer flasks containing a mixture of 1 g pretreated palm kernel shell, 25 ml sodium citrate buffer (0.05 M, pH 4.8) and cellulase enzyme at 10, 20 and 30 FPU concentrations. The mixture was incubated in a thermostatic shaker incubator (HZQ-100L) at varied temperature (40 - 60 ˚C) and time (24 - 72 hours) at shaking speed of 120 rpm. The mixture was vacuum filtered to separate the residue from the filtrate. The filtrate is the enzymatically digested hydrolysate used as the substrate for the fermentation reaction.
2.4.1. Determination of Glucose Concentration in Hydrolysate
This procedure was adopted from Adney & Baker [31]. A working stock solution was prepared by dissolving 1000 mg glucose in 100 ml distilled water (10 mg/ml solution). Citrate buffer (0.5, 1.0, 2 and 4 mL) was added to 1 mL glucose stock solution. Glucose standards were prepared by adding 0.5 mL of each dilution to 1 mL of citrate buffer in a test tube. Then 3 mL of DNS reagent was added to the test tube and properly mixed. After incubation, all test tubes were placed in boiling water for about 5 minutes. After boiling, tubes were cooled in water bath. Absorbance readings were taken at wavelength of 510 nm. The unknown glucose concentration in the hydrolysed liquid samples was obtained from the linear regression equation
y = mx + c (1)
Where y, m, x and c represent Absorbance, slope, unknown glucose concentration and intercept respectively. The absorbance, slope and intercept are known values.
2.5. Fermentation of Hydrolysate
The hydrolysate obtained from enzymatic hydrolysis was used as substrate for the fermentation process. Dry Saccharomyces cerevisiae yeast (NCPF 3191 Lenticule discs) at 1%, 3% and 5% v/v concentration was cultivated in 250mL conical flasks containing yeast extract (3 g/L), peptone (5 g/L) and glucose (10 g/L) supplements. The cultures were grown in a water bath shaker (XMTE-205) at 30 ˚C for 24 hours and agitated at a speed of 150 rpm. The hydrolysate was sterilized prior to the fermentation process for 10 minutes at 120 ˚C. Fermentation was performed in 150 mL Erlenmeyer flasks containing 20 mL of hydrolysate and 30 mL of supplement under anaerobic conditions in an incubator shaker with agitation speed of 120 rpm at varied temperature (25 – 35 ˚C) and reaction time (24 – 72 hours). The bioethanol content in the fermented samples was determined by the dichromate method [32]. This method was carried out by dissolving 7.5 g of potassium dichromate in 70 mL sulphuric acid (5 M). Distilled water was added to the mixture to make the total volume to 250 mL. 0.3%v/v of pure ethanol solution (99.8%) was prepared in a 500 mL beaker.
2.5.1. Determination of Bioethanol in Fermented Mixture
Ethanol standard curve was obtained to determine the bioethanol concentrations after the fermentation process. Different volume of pure ethanol solutions (0.2, 0.4, 0.6, 0.8 and 1 mL) was mixed with 3 mL of sulphuric acid- potassium dichromate mixture. Distilled water was added to the mixture to make the total volume to 5 ml in the test tubes. The mixture was heated at 100 ˚C for 10 minutes. After heating, the test tubes were cooled to room temperature. Absorbance readings were taken at wavelength of 590 nm. The standard curve of absorbance against ethanol concentration was plotted [32]. The unknown bioethanol concentration in the fermented samples was obtained from the linear regression equation
y1 = mx + c (2)
Where y1, m, x and c represent Absorbance, slope, unknown bioethanol concentration and intercept respectively. The absorbance, slope and intercept are known values.
2.5.2. Experimental Design for Fermentation Experiment
Statistical analysis was carried out using Design Expert software version 13 (Stat-Ease, Inc., USA). Box-Behnken design method (involving response surface) was adopted for the experimental design of the fermentation process. Three process variables (yeast concentration, temperature and reaction time) were used for the design constituting a total of 15 runs. All factors were assigned three coded levels (-1, 0, +1) as shown in Table 1.
3. Results and discussions
3.1. Composition of Palm Kernel Shells
As shown in Table 2, acid pretreatment decreased the hemicellulose, cellulose and lignin content. Hemicellulose content decreased from 41.73% to 15.18% due to acid protonation of the hydroxyl and ether groups in hemicellulose facilitating the cleavage of glycosidic linkages acid pretreatment caused a reduction in the cellulose content from 31.06% to 22.71%. This decrease could be as a result of partial hydrolysis of amorphous cellulose regions. A slight reduction in the lignin content from 27.5% to 23.12% was observed. This was due to the partial solubilisation of lignin. Alkaline pretreatment further reduced the hemicellulose and lignin content to 11.23% and 12.40% respectively, but the cellulose content increased to 45.62%. Alkaline pretreatment primarily reduces the hemicellulose and lignin content by solubilizing them, resulting in their removal. The increase in the cellulose content was due to the swelling of the amorphous and crystalline region of cellulose caused by increased porosity in the region. The rate of decrease in hemicellulose content was higher compared to cellulose. This was because hemicellulose, due to its branched structure and fewer hydrogen bonds is more susceptible to hydrolysis. High hemicellulose and lignin contents can hinder production of bioethanol hence the need for their reduction through pretreatment. These results agree with Sukhang et al. [15] who reported a sequential acid-alkaline pretreatment of oil palm empty fruit bunch. Hemicellulose and lignin content reduced from 30.03% to 3.24% and 26.36% to 17.6% respectively while cellulose increased to 45.62%. In another study by Triwahyuni et al. [33], alkaline pretreatment (10% NaOH) was performed on oil palm fronds. Hemicellulose decreased from 13.95% to 8.04%, lignin decreased from 30.16% to 14.09% but cellulose increased from 33.47% to 72.59%. Lignin decreased by 16.07% which was higher than other results earlier discussed. This could be as a result of high concentration of sodium hydroxide used. Higher NaOH concentration was effective in removing lignin through the cleavage of the ester bonds. The low percent content of extractives indicates that the shells have low levels of impurities. The low ash content (1.53%) minimizes the occurrence of fouling and scaling in the reacting vessel. The compositional analysis of palm kernel shells after acid treatment showed significant changes in the biomass composition. The ash content decreased slightly from 1.53% to 1.21% suggesting minor leaching of inorganic materials during pretreatment.
3.2. Enzymatic Hydrolysis of Acid Pretreated Palm Kernel Shells
Glucose concentration increased with enzyme concentration at constant temperature and time of 50 ˚C and 72 hours respectively. At enzyme concentration of 10 FPU/g biomass, lowest glucose concentration of 32.19 g/L was produced, while at 30 FPU/g biomass, highest glucose concentration of 39.78 g/L was produced (Table 3). The higher the concentration of enzyme, the stronger the binding force between the substrate (palm kernel shell) and the active site of the enzyme thus increasing the rate of hydrolysis resulting in the production of more sugars. Kim & Kim [34] worked on the production of bioethanol from oil palm empty fruit bunch using sequential acid-alkaline pretreatment. 10% w/v of empty fruit bunch was hydrolyzed with Cellic CTec2 cellulase enzyme at varied concentrations (10 – 50 FPU/dry pretreated biomass). The concentration of glucose increased with increasing enzyme concentration and enzyme digestibility. At 10 FPU/ biomass, glucose concentration of 50 g/L was obtained while 50 FPU/biomass produced 70.8 g/L. Dahnum et al. [35] worked on the production of bioethanol from empty fruit bunch with enzyme concentration of 10, 20, 30 and 40 FPU/g biomass for 72 hours. Enzyme concentration of 10 FPU produced the lowest glucose concentration of 6.2% (w/w) while enzyme concentration of 40 FPU produced the highest glucose of 10.67 % (w/w) showing that glucose concentration increased with increasing enzyme concentration. This was attributed to conversion of more cellulose at higher enzyme concentration
3.2.1. Determination of Glucose Concentration in Enzymatic Hydrolysates
A standard curve of glucose concentration against absorbance at 510 nm was plotted as shown in Figure 5 to determine glucose concentration in enzymatic hydrolysates. The absorbance values fell within the range of 0 to 0.67. The concentrations (g/L) on the x-axis were obtained from mixture of the glucose stock solution at constant volume (1ml) with citrate buffer at varying volumes (0.5, 1, 2 and 4 ml). The mixture formed the glucose standard solutions that produced the plot. The plot was used to get the unknown glucose concentrations in the hydrolysates from Equation 1.
3.3. Fermentation of Cellulosic Hydrolysates
The fermentation process utilised Saccharomyces cerevisiae yeast. Dry yeast at varied concentration (1%, 3% and 5% w/v) was inoculated in 100 mL Erlenmeyer flasks containing 30 mL of nutritional supplement comprising of yeast extract (3 g/L), peptone (5 g/L) and glucose (10 g/L) and grown in a shaker bath at 30 ˚C for 24 hours at an agitation speed of 150 rpm. A mixture of 20 mL hydrolysate and supplement was sterilized at 120 ˚C for 10 minutes prior to the fermentation process. After sterilization, the mixture was incubated under anaerobic conditions in a shaker incubator with agitation speed of 120 rpm at varied temperature (25, 30 and 35 ˚C) and time (24, 48 and 72 hours). After incubation, mixture was vacuum filtered. The filtrate was analysed for bioethanol. using the dichromate method.
3.3.1. Determination of Bioethanol in Fermented Samples
Ethanol standard curve obtained from the prepared ethanol standard solutions is shown in Figure 6. The standard curve was used to get the unknown bioethanol concentrations in the fermented samples using Equation 2. The absorbance readings at wavelength of 590 nm fell within the range of 0.243 and 0.784. The R2 obtained from the plot was 0.9814 which was close to 1 indicating the data points are closely fit.
3.3.2. Experimental design for fermentation conditions
Statistical analysis was carried out using Design Software version 13 (Stat-Ease, Inc., USA). Response surface using Box-Behnken design was performed for the fermentation process. Three factors (yeast concentration, temperature and reaction time) and one response (ethanol concentration) were used for the design constituting a total of 15 runs as shown in Table 4. The bioethanol concentration ranged from 2.553 (run 8) to 9.606 g/L. The maximum bioethanol concentration was 9.606 g/L (run 5) with yeast concentration of 3% (v/v) at 35 ˚C for 72 hours. The calibration curve of absorbance against ethanol concentration (Figure 4) was used to determine the concentration of ethanol in the samples.
3.3.3. Statistical Analysis of Fermentation Conditions
The experimental data) was used to develop the model equation shown in Equation 3.
Y = 4.57– 1.23A + 0.7579B + 0.3846C – 0.8963AB – 0.2282AC + 2.58BC – 0.4515A2 + 0.3698 B2 + 1.12 C2 (3)
Where Y represents bioethanol concentration while A, B and C represents yeast concentration, temperature and reaction time respectively. Coded factors B, C, BC, B2 and C2 positively affected the concentration of ethanol while A, AB, AC and A2 had negative effects on the ethanol concentration. For instance, when inoculum concentration (A) is increased, the concentration of ethanol reduces.
The validity of the fitted model was evaluated using the analysis of variance (ANOVA) shown in Table 4. Bioethanol concentration displayed high F value of 5.79 and low p-value of 0.0337. The coefficient of determination (R2) obtained for the model was 0.9556. This value suggests the model highly predicts the response. This is because the closer the value of R2 to 1, the stronger the model in predicting the response. P-values of less than 0.05 (p < 0.05) indicates the model terms are significant. Yeast concentration (A) was the significant linear term with P value of 0.0186. Temperature (B) and reaction time (C) were statistically insignificant with P values of 0.0890 and 0.3338 respectively. This means that temperature and reaction time had little effects on the outcome (bioethanol concentration) suggesting that the sample size may not be sufficiently large. It could also be as a result of collinearity (highly correlated factor) which makes the individual effect of a factor difficult to isolate. Lack of fit was non-significant (p > 0.05) which indicates that the model is a good fit for the data. If lack of fit for the model is significant (p < 0.05), a more complicated model should be adopted to fit the model [37]. The predicted and actual values are represented in Figure 7, demonstrating a good quality of fit. It also indicates that the predicted and actual values are comparable.

Table 5.
Analysis of variance (ANOVA) of the developed ethanol concentration model.
| Source | Sum of Squares | df | Mean Square | F-value | p-value | |
| Model | 53.96 | 9 | 6.00 | 5.79 | 0.0141 | Significant |
| A-Yeast concentration | 12.18 | 1 | 12.18 | 11.76 | 0.0186 | |
| B-Temp. | 4.59 | 1 | 4.59 | 4.44 | 0.0890 | |
| C-Reaction time | 1.18 | 1 | 1.18 | 1.14 | 0.3338 | |
| AB | 3.21 | 1 | 3.21 | 3.10 | 0.1384 | |
| AC | 0.2082 | 1 | 0.2082 | 0.2012 | 0.6725 | |
| BC | 26.52 | 1 | 26.52 | 25.62 | 0.0039 | |
| A2 | 0.7525 | 1 | 0.7525 | 0.7270 | 0.4328 | |
| B2 | 0.5053 | 1 | 0.5053 | 0.4882 | 0.5159 | |
| C2 | 4.60 | 1 | 4.60 | 4.45 | 0.0888 | |
| Residual | 5.18 | 5 | 1.04 | |||
| Lack of Fit | 3.05 | 3 | 1.02 | 0.9586 | 0.5470 | Not significant |
| Pure Error | 2.12 | 2 | 1.06 | |||
| Cor Total | 59.14 | 14 |
3.3.4. Interactive Effects of Process Variables
The interactive effects of yeast concentration and temperature on bioethanol concentration is represented using surface plots as shown in Figure 8 (a). Increase in yeast concentration (1 – 3% v/v) resulted in increase in bioethanol concentration (4.12 – 4.19 g/L). Similarly, increase in temperature (25 – 35 ˚C) resulted in increase in bioethanol concentration (4.10 – 7.37 g/L). Further increase in yeast concentration (> 3% v/v) resulted in a decrease in bioethanol concentration (3.39 g/L). Highest bioethanol concentration was achieved at high temperature (35 ˚C) and low yeast concentration (1% v/v) while lowest bioethanol concentration (3.39 g/L) was achieved at low temperature (25.25 ˚C) and high yeast concentration (5% v/v). Chohan et al. [36] used response surface plots to investigate the interactive effects of temperature and pH on bioethanol concentration. It was reported that increase in temperature (28 – 40.8) and pH (4 – 5.8) resulted in increase in bioethanol concentration (7.2 – 25.5 g/L). However, bioethanol concentration reduced (25.5 – 14.2 g/L) at further increment in temperature (> 40.8 ˚C). They concluded that reduction in bioethanol due to high temperature was attributed to the breakdown of Saccharomyces cerevisiae yeast cells. Sukhang et al. [15] reported that bioethanol yield reduced with increase in yeast concentration but increased with increase in temperature (33.75 – 39 ˚C). Further increase in temperature (> 39 ˚C) resulted in decrease in bioethanol yield. They concluded that high temperature inhibited the growth of Kluveromyces marxianus yeast.
The interaction effects of reaction time and yeast concentration on bioethanol concentration are shown in Figure 8 (b). Bioethanol concentration increased (5.84 – 7.07 g/L) with increase in reaction time (24 – 72 hours) but reduced (5.84 – 3.84 g/L) with increase in yeast concentration (1 – 5% v/v). Highest bioethanol concentration (7.07 g/L) was achieved at low yeast concentration (1.03% v/v) and high reaction time (72 hours) while lowest bioethanol concentration (3.84 g/L) was achieved at high yeast concentration (5% v/v) and low reaction time (24.16 hours). Kim et al. [37] reported that at long fermentation time, maximum ethanol production was achieved.
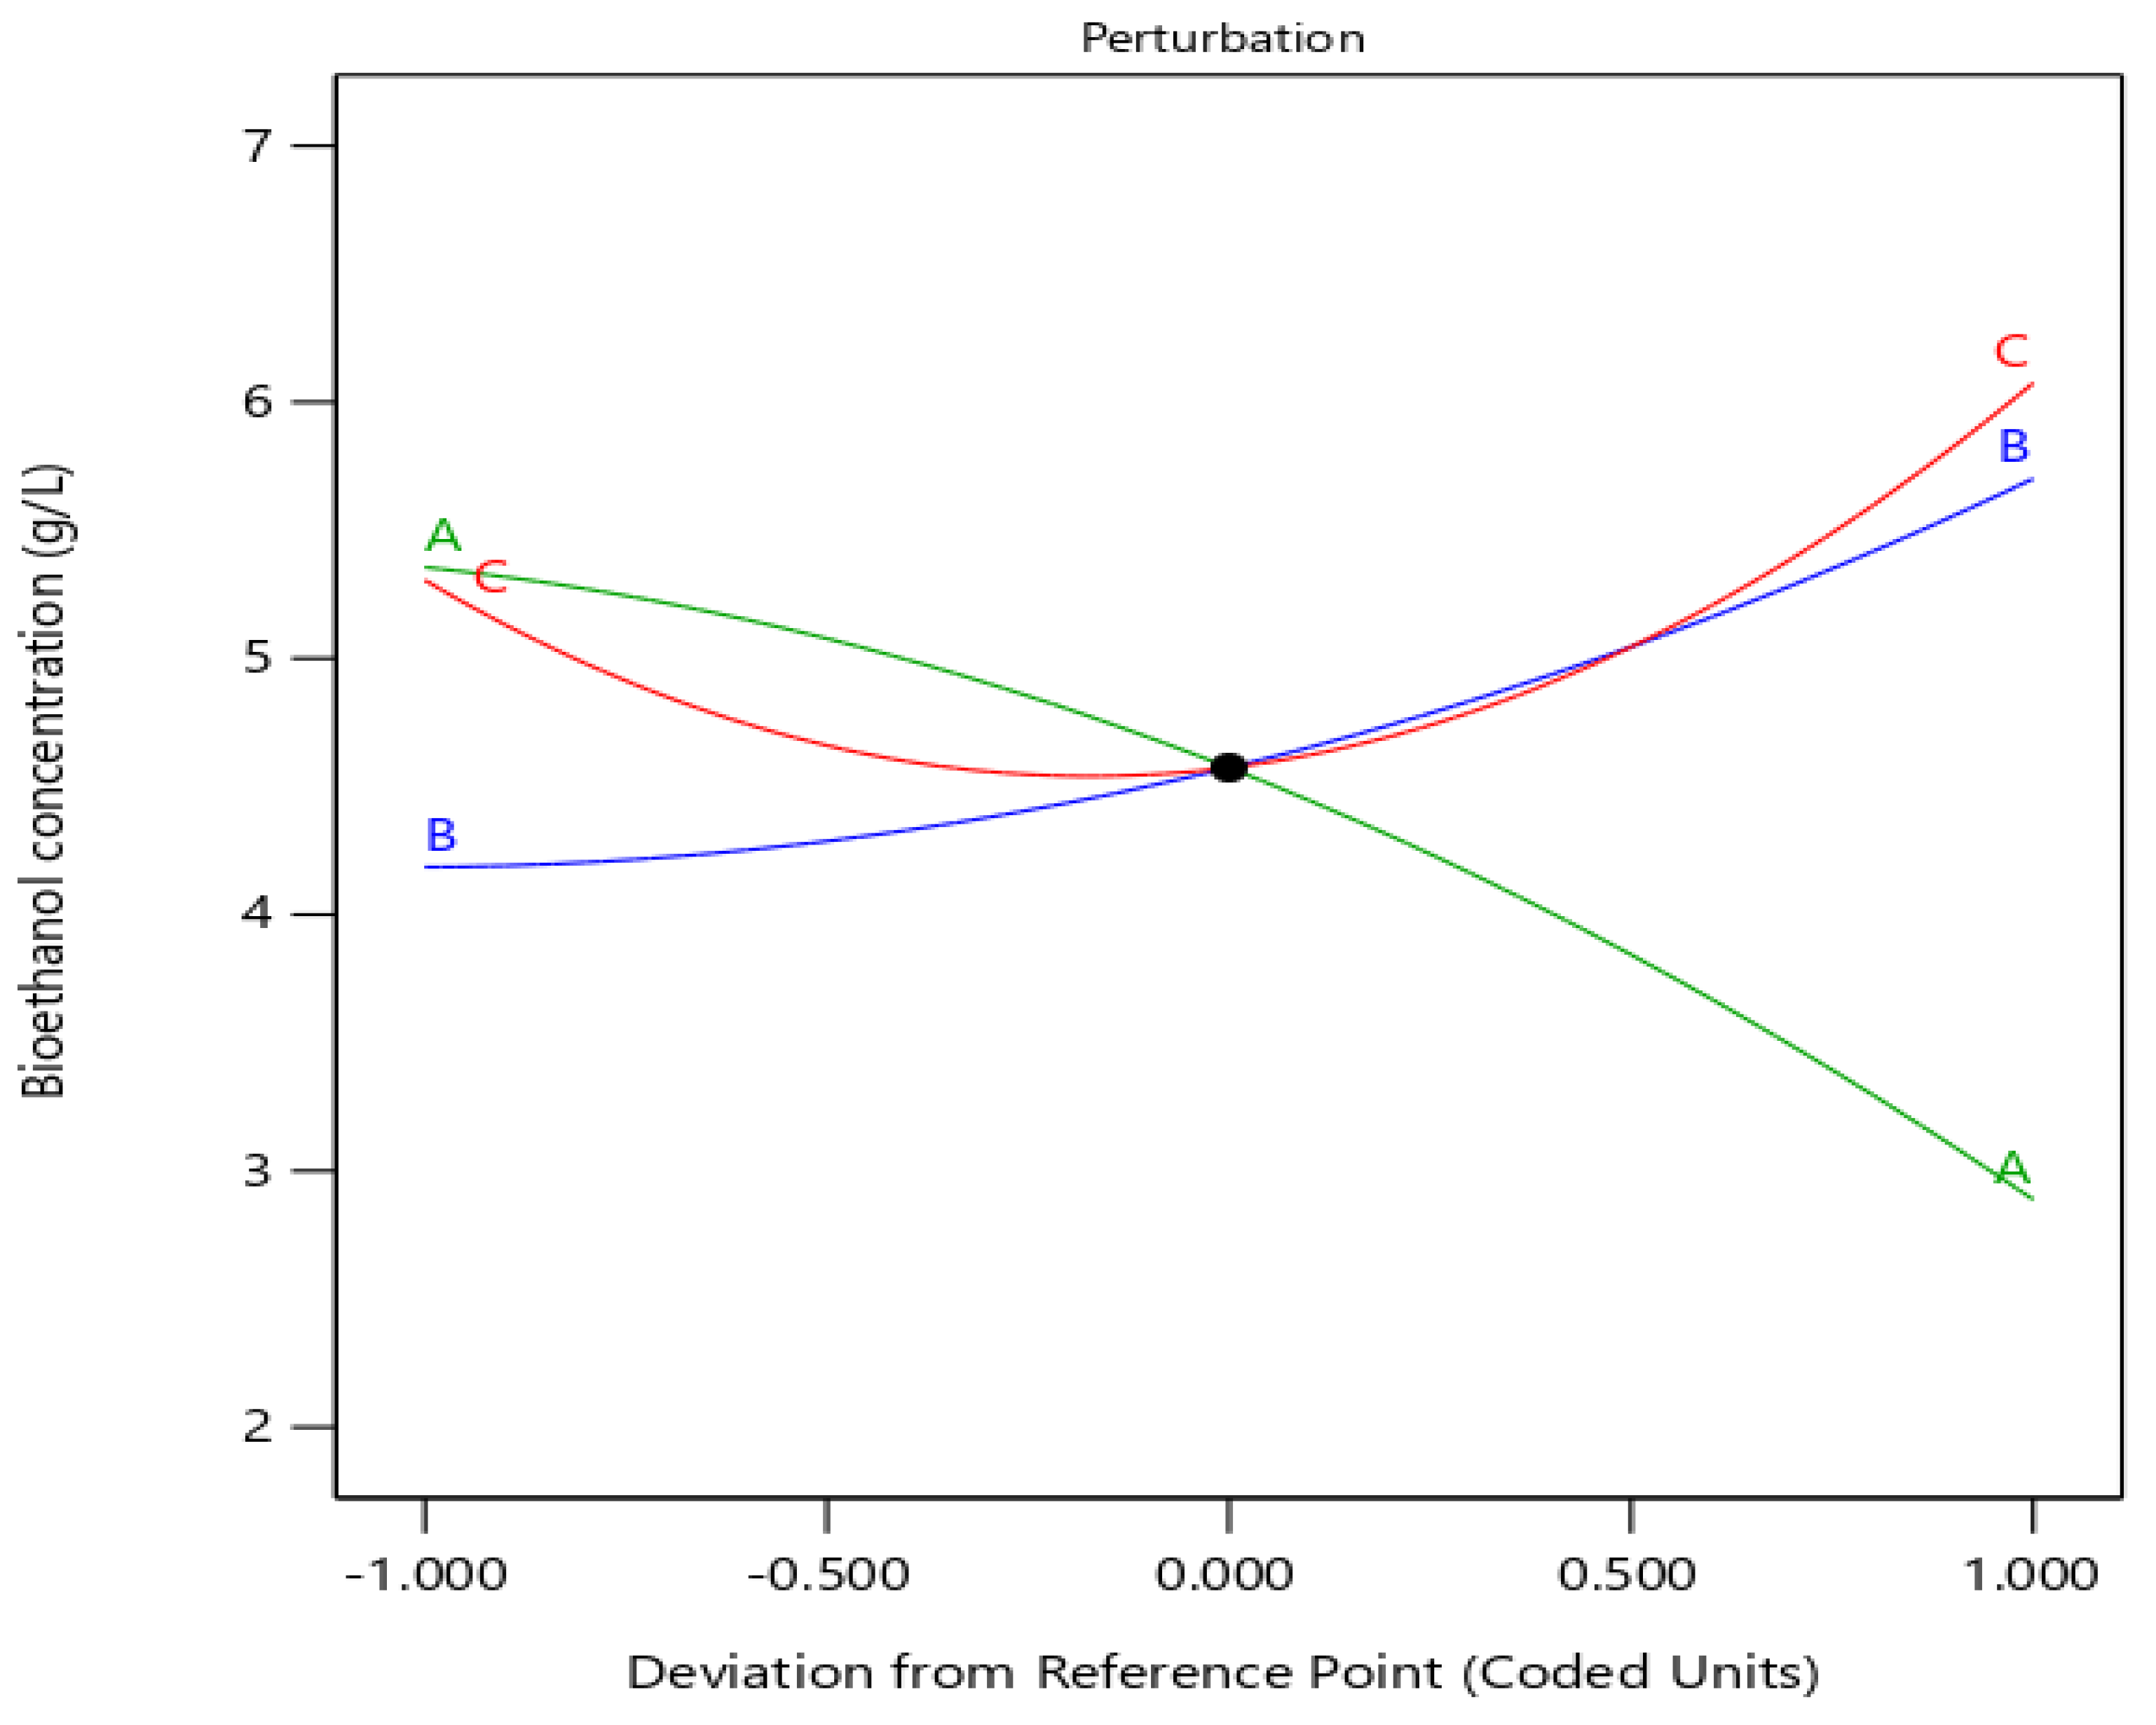
The perturbation plot (Figure 9) showed that factor A (yeast concentration) had the strongest effect on bioethanol concentration with a negative deviation of - 1.01 at 5.36 g/L bioethanol concentration. Factor C (reaction time) and Factor B (temperature) had deviations of +1.00 and +1.01.
Figure 8.
Surface plots of bioethanol concentration versus temperature and yeast concentration.
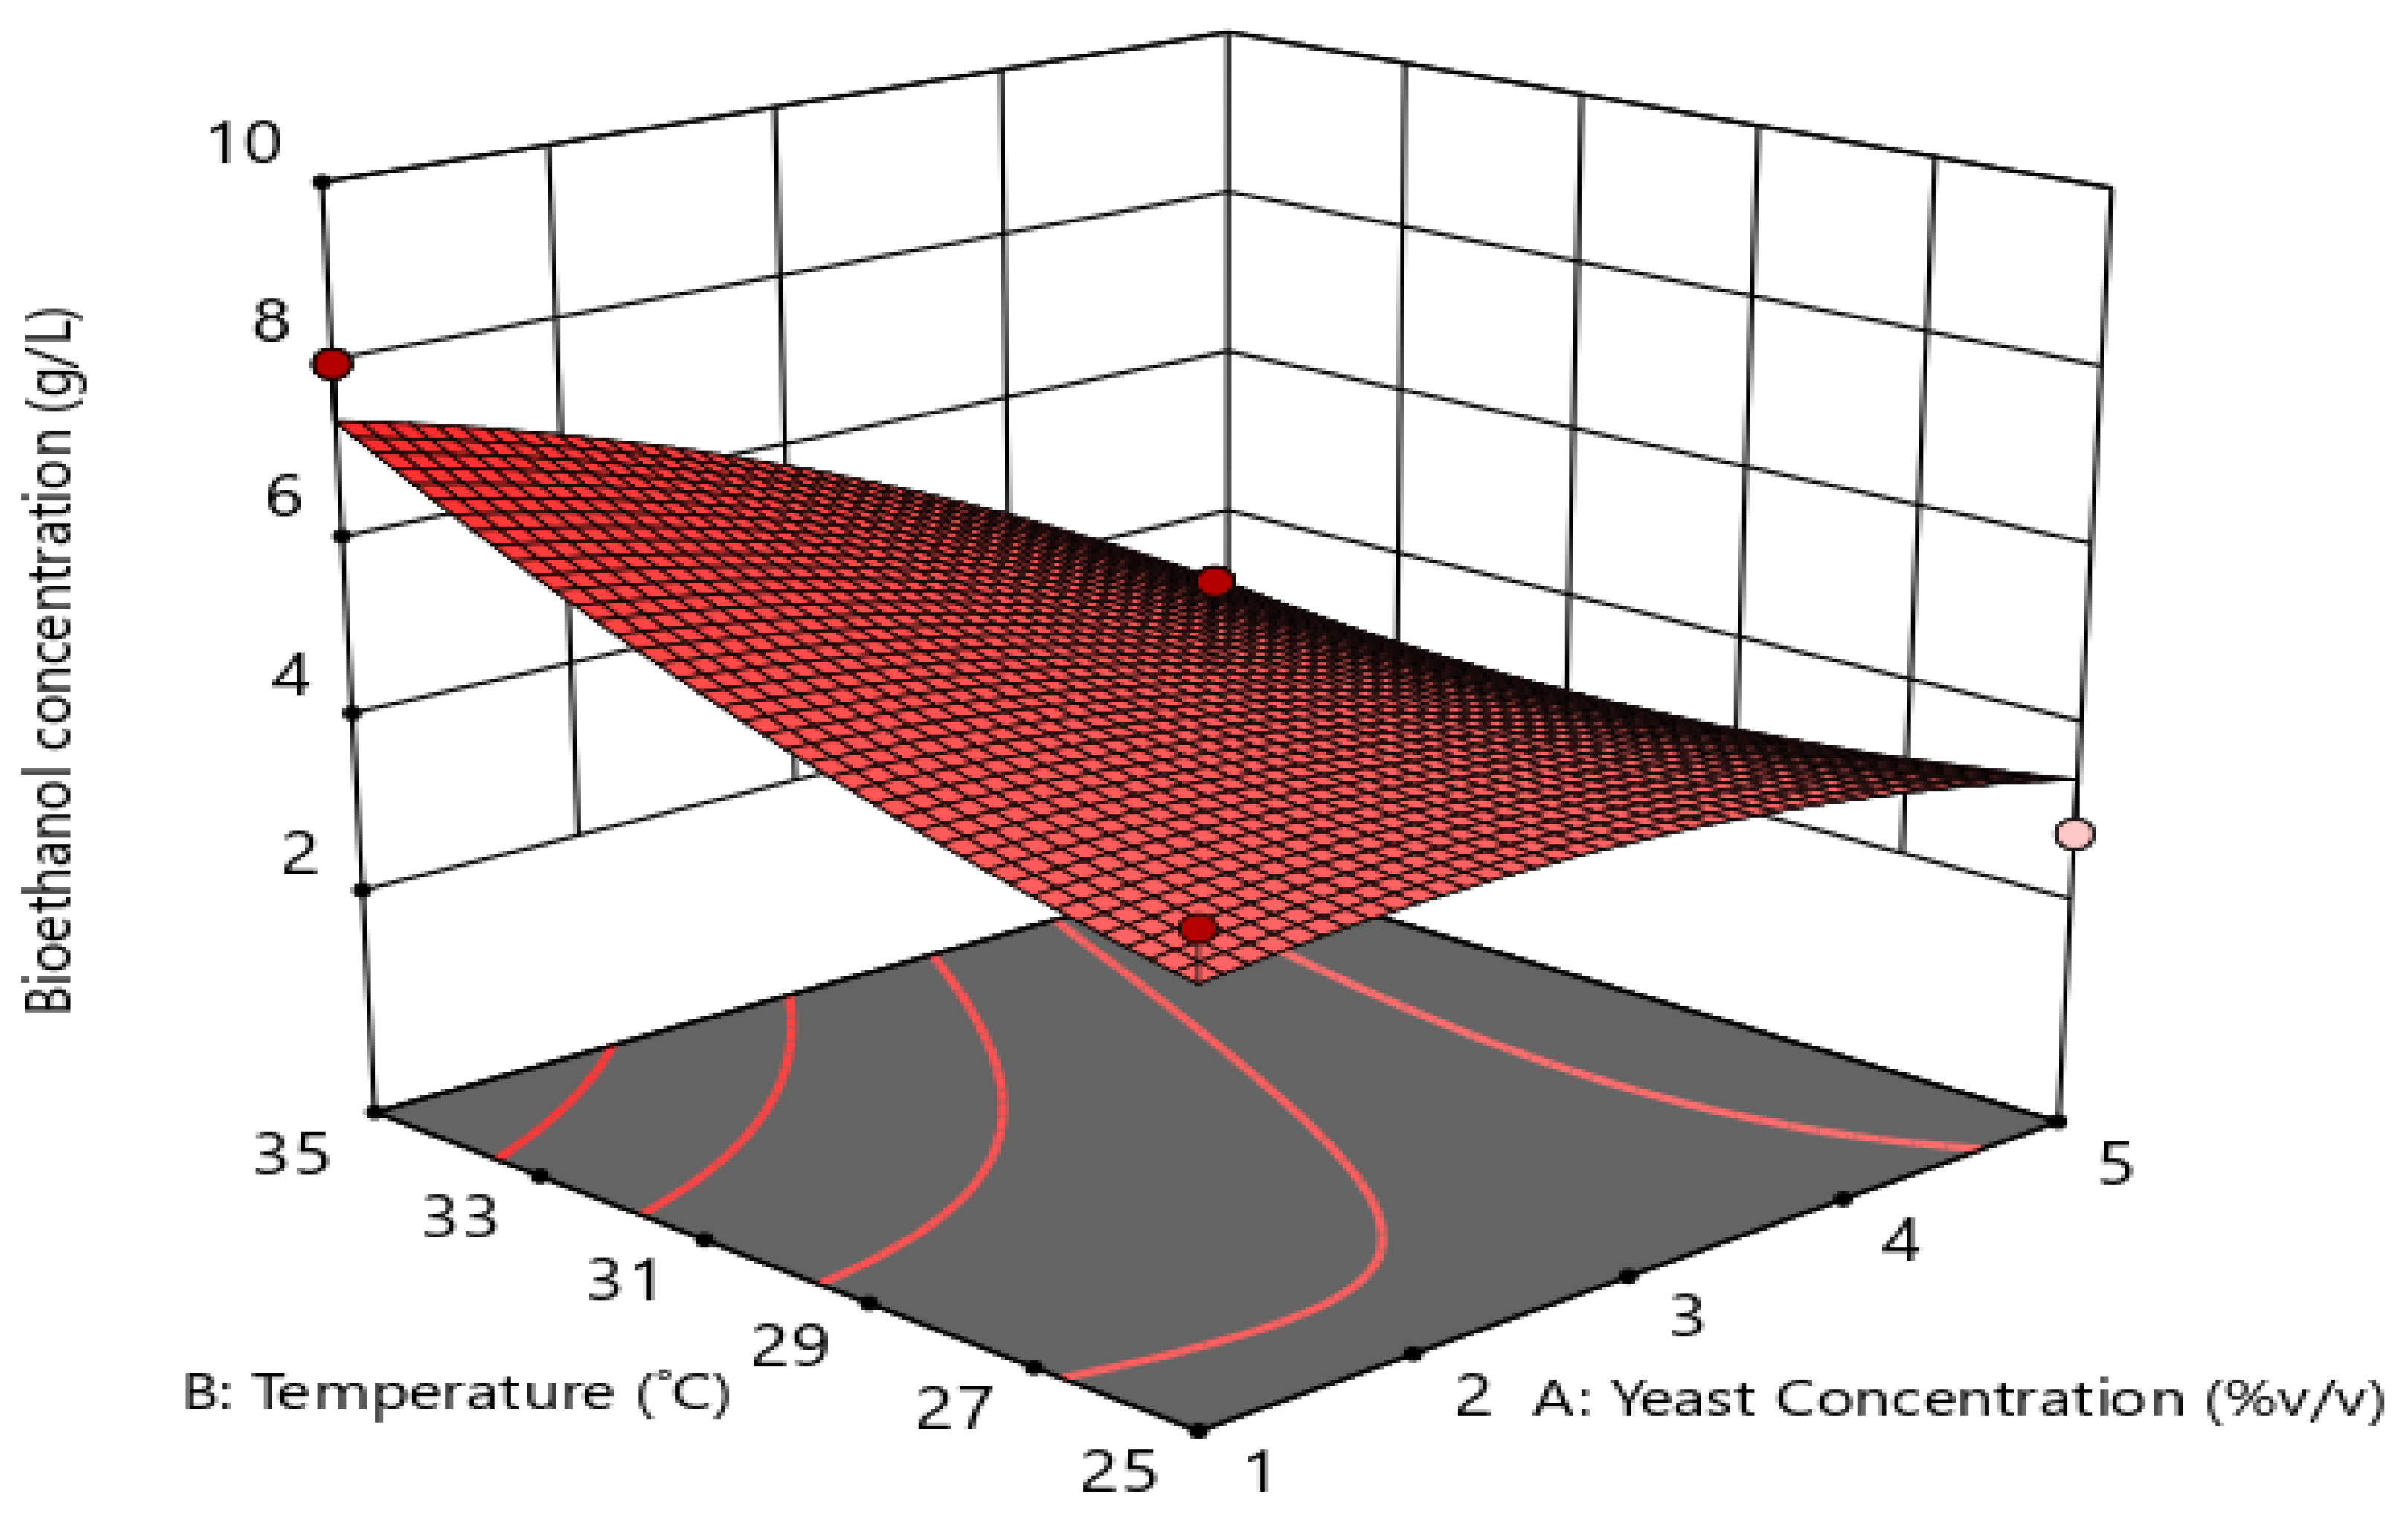
Figure 9.
Surface plots of bioethanol concentration versus reaction time and yeast concentration.
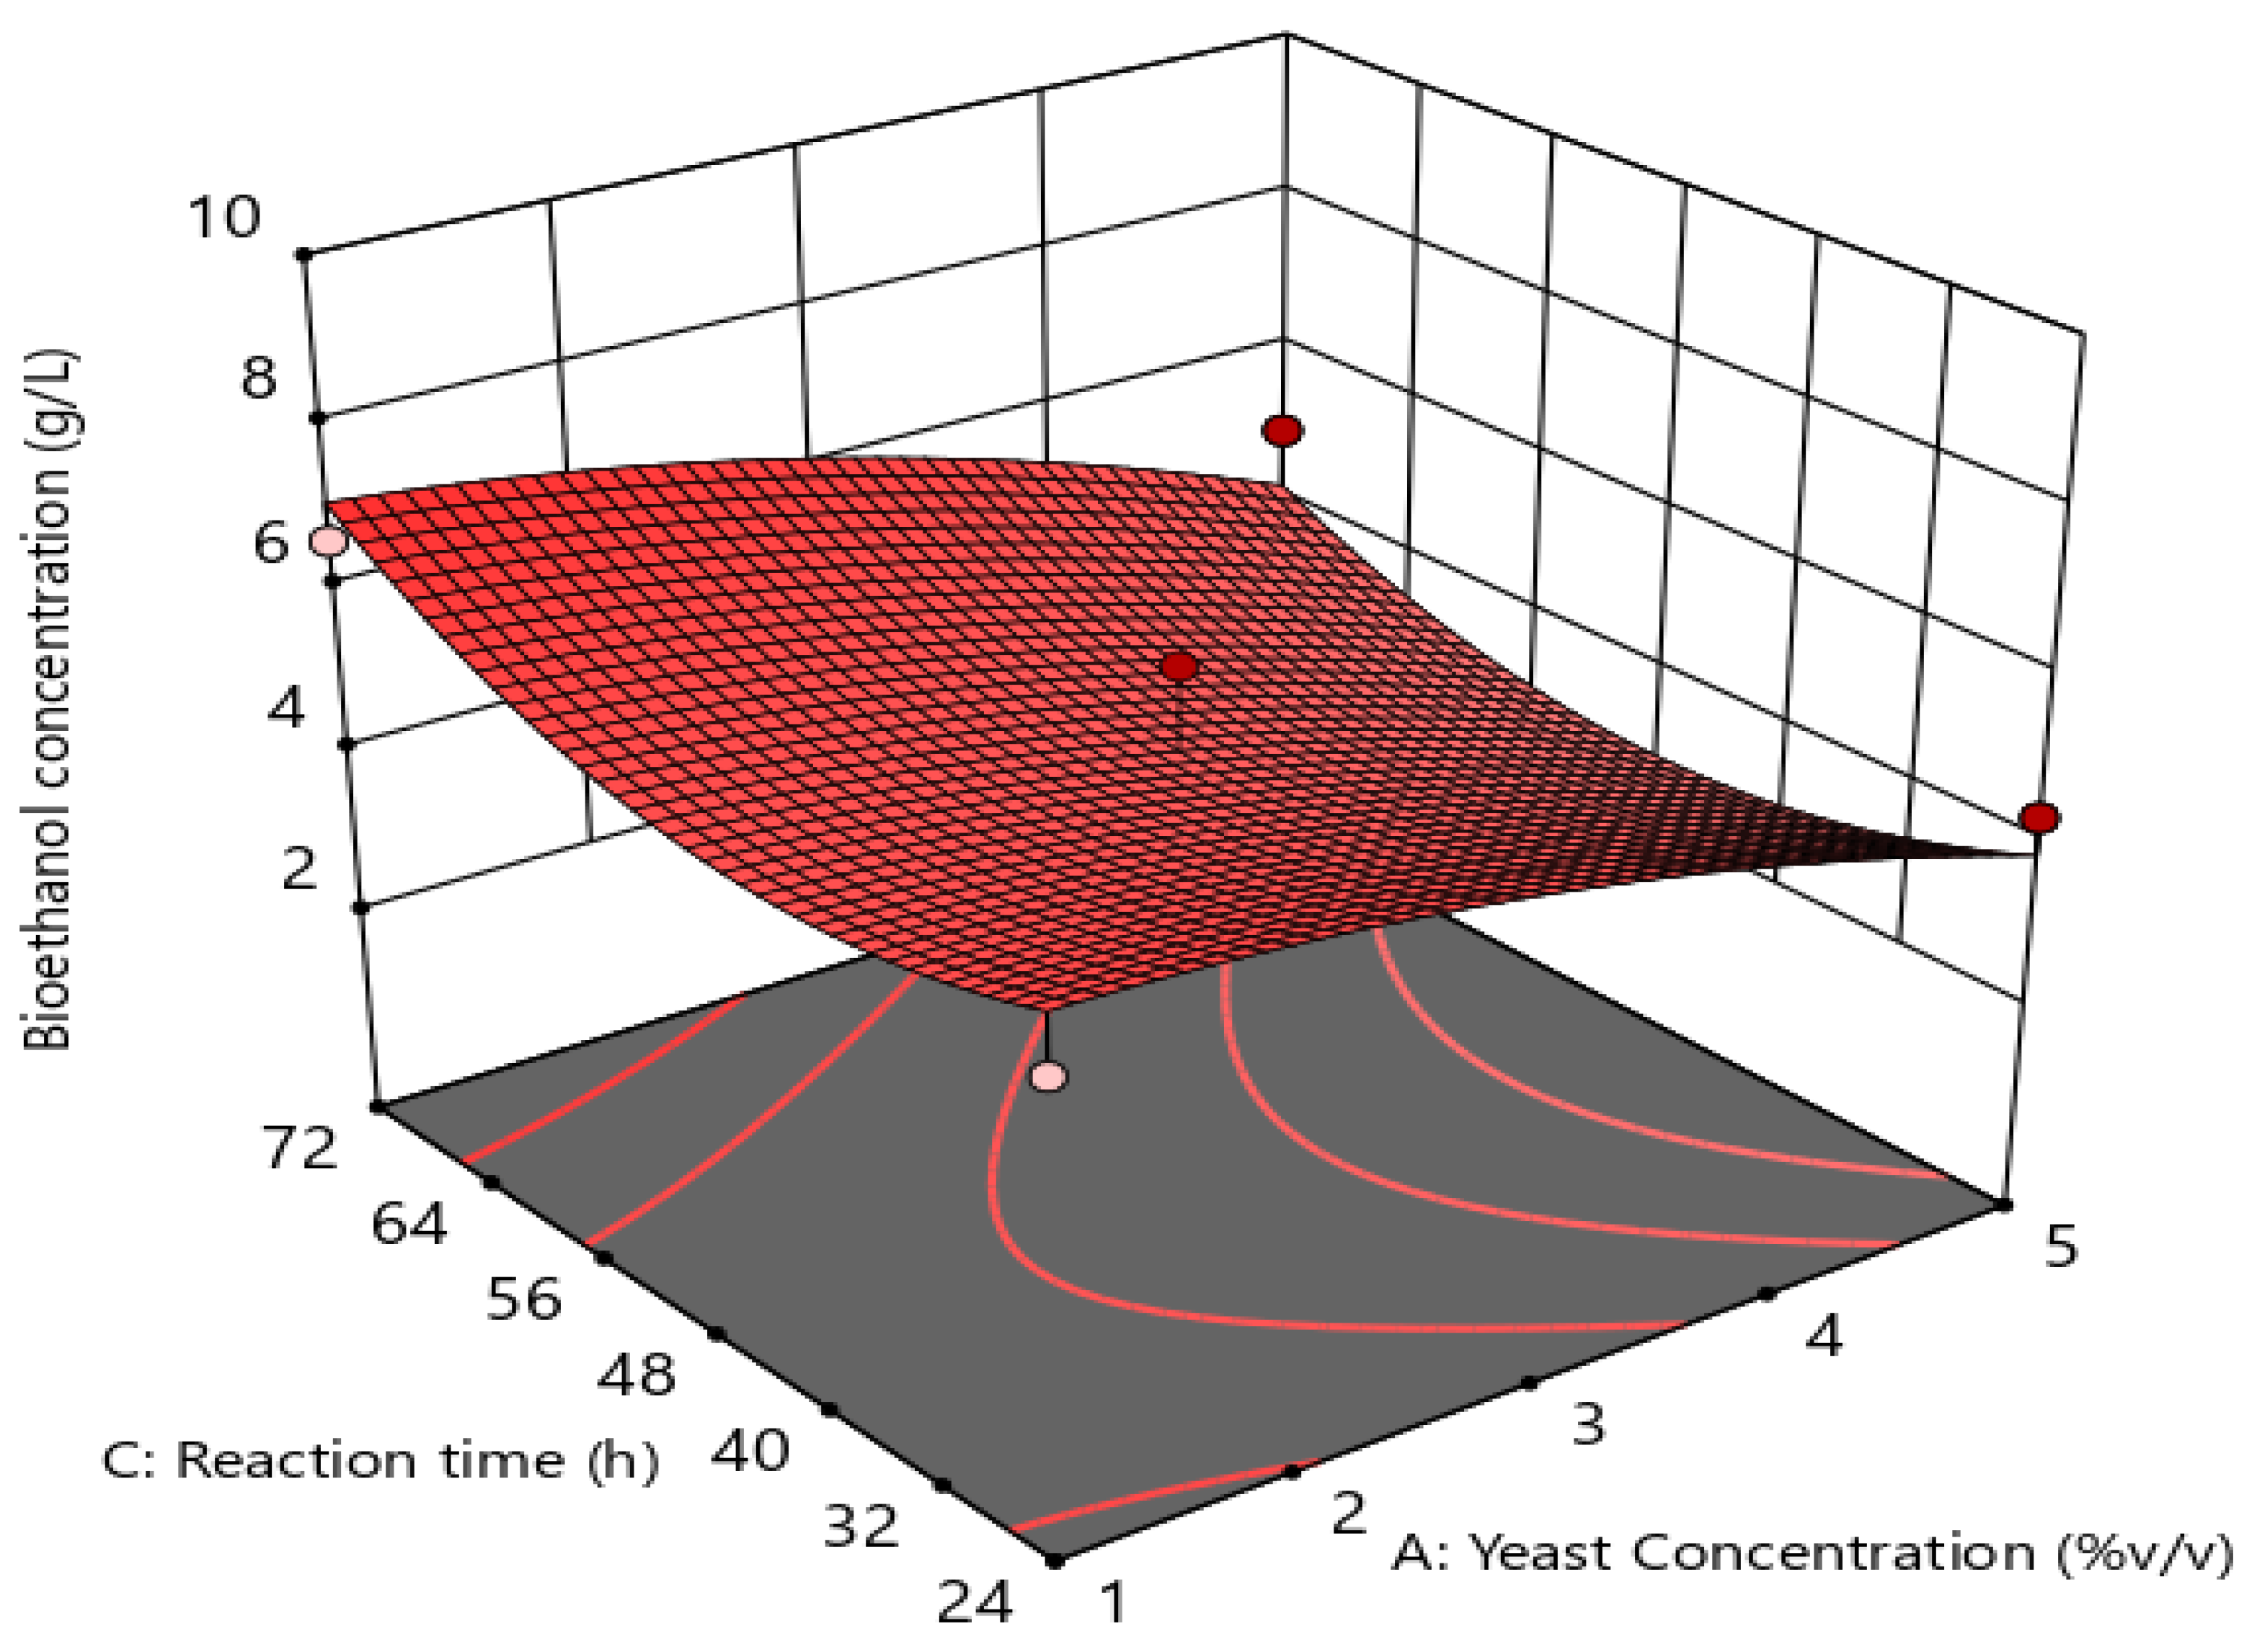
Figure 10.
Perturbation plot for bioethanol concentration.
3.3.5. Validation of the Developed Model for Optimal Fermentation Conditions
Validation experiments under the optimal conditions were conducted to maximize the bioethanol concentration as shown in Table 6. The predicted optimum conditions for maximum bioethanol concentration were 1.506% v/v, 34.89 ˚C and 69.61 hours for yeast concentration, temperature and reaction time. The optimized conditions produced a slightly lower glucose concentration of 9.74 g/L compared to the model prediction of 10.22 g/L. Sukhang et al. [15] reported optimum fermentation conditions for temperature (36.94 ˚C), yeast concentration (2.04% v/v) and reaction time (48 hours) for bioethanol production from oil palm empty fruit bunch with corresponding bioethanol yield of 34.39 g/L. Kim et al. [37] reported optimum fermentation conditions at 35.3 ˚C and 14 hours for maximum bioethanol concentration of 57.5 g/L obtained from food waste. The variations in ethanol concentration could be attributed to varied composition in biomass.
4. Conclusion
Bioethanol was obtained through pretreatment, enzymatic hydrolysis and fermentation processes. Acid pretreatment reduced the hemicellulose and lignin content in palm kernel shell. Hemicellulose was reduced from 41.73% w/w to 15.18% w/w while lignin was reduced from 27.5% w/w to 23.12% w/w. Alkaline pretreatment increased the cellulose content from 31.06 to 45.62% w/w while hemicellulose was further reduced from 15.18% w/w to 11.23% w/w and lignin from 23.12% w/w to 12.40% w/w. Design of experiment for fermentation process was carried out through response surface methodology using Box-Behnken design. Run 15 produced the lowest bioethanol concentration of 2.76 g/L while run 5 produced the highest bioethanol concentration of 9.61 g/L. Optimal bioethanol concentration of 9.74 g/L was achieved at 1.5% v/v yeast concentration, 34.89 ˚C and 69.61 hours. Analysis of variance revealed that yeast concentration had a significant effect on bioethanol yield with p-value of 0.0186. These results proved that palm kernel shells are promising feedstocks for bioethanol production.
Acknowledgments
Authors acknowledge CUCRID Covenant University, Ota, Nigeria for the publication of this research. Also appreciated is Prof. Ezinne Achinivu from the Department of Chemical Engineering, University of Illinois, Chicago, United States for the support with analysis of palm kernel shell samples.
Conflict of interest
The authors declare no conflict of interest
Use of AI Tools Declaration
The authors declare they have not used Artificial Intelligence (AI) tools in the creation of this article.
References
- Sanni, S.E.; Oni, B.A.; Okoro, E.E. Heterogeneous Catalytic Gasification of Biomass to Biofuels and Bioproducts: A Review. Korean J. Chem. Eng. 2024, 41, 965–999. [Google Scholar] [CrossRef]
- Wang, W.; Ren, J.; Li, H.; Deng, A.; Sun, R. Direct transformation of xylan-type hemicelluloses to furfural via SnCl4 catalysts in aqueous and biphasic systems. Bioresour. Technol. 2015, 183, 188–194. [Google Scholar] [CrossRef]
- Kumar, A.; Rapoport, A.; Kunze, G.; Kumar, S.; Singh, D.; Singh, B. Multifarious pretreatment strategies for the lignocellulosic substrates for the generation of renewable and sustainable biofuels: A review. Renew. Energy 2020, 160, 1228–1252. [Google Scholar] [CrossRef]
- Lee, C.B.T.L.; Wu, T.Y. A review on solvent systems for furfural production from lignocellulosic biomass. Renew. Sustain. Energy Rev. 2021, 137. [Google Scholar] [CrossRef]
- Ahmad, R.K.; Sulaiman, S.A.; Yusup, S.; Dol, S.S.; Inayat, M.; Umar, H.A. Exploring the potential of coconut shell biomass for charcoal production. Ain Shams Eng. J. 2022, 13, 101499. [Google Scholar] [CrossRef]
- Adejumo, I.O.; Adebiyi, O.A. Agricultural solid wastes: causes, effects, and effective management. Strategies of sustainable solid waste management 2020, 8, 139. [Google Scholar]
- Akhlisah, Z.; Yunus, R.; Abidin, Z.; Lim, B.; Kania, D. Pretreatment methods for an effective conversion of oil palm biomass into sugars and high-value chemicals. Biomass- Bioenergy 2021, 144. [Google Scholar] [CrossRef]
- Ahmad, A.; Buang, A.; Bhat, A. Renewable and sustainable bioenergy production from microalgal co-cultivation with palm oil mill effluent (POME): A review. Renew. Sustain. Energy Rev. 2016, 65, 214–234. [Google Scholar] [CrossRef]
- Uchegbulam, I.; Momoh, E.O.; Agan, S.A. Potentials of palm kernel shell derivatives: a critical review on waste recovery for environmental sustainability. Clean. Mater. 2022, 6. [Google Scholar] [CrossRef]
- Baffour-Awuah, E.; Akinlabi, S.A.; Jen, T.C.; Hassan, S.; Okokpujie, I.P.; Ishola, F. Characteristics of Palm Kernel Shell and Palm Kernel Shell-Polymer Composites: A Review.CONFERENCE NAME, LOCATION OF CONFERENCE, COUNTRYDATE OF CONFERENCE; p. 012090.
- Sanjuan-Acosta, M.J.; Tobón-Manjarres, K.; Sánchez-Tuirán, E.; Ojeda-Delgado, K.A.; González-Delgado, Á.D. An Optimization Approach Based on Superstructures for Bioethanol Production from African Palm Kernel Shells. Pol. J. Environ. Stud. 2021, 30, 2293–2300. [Google Scholar] [CrossRef]
- Efeovbokhan, V.E.; Egwari, L.; Alagbe, E.E.; Adeyemi, J.T.; Taiwo, O.S. Production of bioethanol from hybrid cassava pulp and peel using microbial and acid hydrolysis. BioResources 2019, 14, 2596–2609. [Google Scholar] [CrossRef]
- Kumar, B.; Bhardwaj, N.; Agrawal, K.; Chaturvedi, V.; Verma, P. Current perspective on pretreatment technologies using lignocellulosic biomass: An emerging biorefinery concept. Fuel Process. Technol. 2020, 199. [Google Scholar] [CrossRef]
- Zabed, H.; Sahu, J.; Boyce, A.; Faruq, G. Fuel ethanol production from lignocellulosic biomass: An overview on feedstocks and technological approaches. Renew. Sustain. Energy Rev. 2016, 66, 751–774. [Google Scholar] [CrossRef]
- Sukhang, S.; Choojit, S.; Reungpeerakul, T.; Sangwichien, C. Bioethanol production from oil palm empty fruit bunch with SSF and SHF processes using Kluyveromyces marxianus yeast. Cellulose 2019, 27, 301–314. [Google Scholar] [CrossRef]
- Wirawan, F.; Cheng, C.-L.; Lo, Y.-C.; Chen, C.-Y.; Chang, J.-S.; Leu, S.-Y.; Lee, D.-J. Continuous cellulosic bioethanol co-fermentation by immobilized Zymomonas mobilis and suspended Pichia stipitis in a two-stage process. Appl. Energy 2020, 266. [Google Scholar] [CrossRef]
- Palamae, S.; Dechatiwongse, P.; Choorit, W.; Chisti, Y.; Prasertsan, P. Cellulose and hemicellulose recovery from oil palm empty fruit bunch (EFB) fibers and production of sugars from the fibers. Carbohydr. Polym. 2017, 155, 491–497. [Google Scholar] [CrossRef] [PubMed]
- Azhar, S.H.M.; Abdulla, R.; Jambo, S.A.; Marbawi, H.; Gansau, J.A.; Faik, A.A.M.; Rodrigues, K.F. Yeasts in sustainable bioethanol production: A review. Biochem. Biophys. Rep. 2017, 10, 52–61. [Google Scholar] [CrossRef] [PubMed]
- Shahbazi, A.; Zhang, B. (2010). Dilute and concentrated acid hydrolysis of lignocellulosic biomass. Bioalcohol Production 143 – 158. https://doi.org/10.1533/9781845699611.2.143(2010). Dilute and concentrated acid hydrolysis of lignocellulosic biomass. Bioalcohol Production. [CrossRef]
- Agustini, N.W.S.; Hidhayati, N.; A Wibisono, S. Effect of hydrolysis time and acid concentration on bioethanol production of microalga Scenedesmus sp..CONFERENCE NAME, LOCATION OF CONFERENCE, COUNTRYDATE OF CONFERENCE; p. 012029.
- Madadi M, Tu Y, Abbas A (2017). Recent status on enzymatic saccharification of lignocellulosic biomass for bioethanol production. Electron J Biol 13: 135 – 143. https://www.researchgate.net/profile/Aqleem-Abbas-2/publication/316315642_Recent_Status_on_Enzymatic_Saccharification_of_Lignocellulosic_Biomass_for_Bioethanol_Production/links/5d54f51345851530407572ed/Recent-Status-on-Enzymatic-Saccharification-of-Lignocellulosic-Biomass-for-Bioethanol-Production.
- Khawla, B.J.; Sameh, M.; Imen, G.; Donyes, F.; Dhouha, G.; Raoudha, E.G.; Oumèma, N.-E. Potato peel as feedstock for bioethanol production: A comparison of acidic and enzymatic hydrolysis. Ind. Crop. Prod. 2014, 52, 144–149. [Google Scholar] [CrossRef]
- Vasić, K.; Knez, Ž.; Leitgeb, M. Bioethanol Production by Enzymatic Hydrolysis from Different Lignocellulosic Sources. Molecules 2021, 26, 753. [Google Scholar] [CrossRef]
- Raman, J.K.; Gnansounou, E. Furfural production from empty fruit bunch – A biorefinery approach. Ind. Crop. Prod. 2015, 69, 371–377. [Google Scholar] [CrossRef]
- Demi̇rBaş, A. Bioethanol from Cellulosic Materials: A Renewable Motor Fuel from Biomass. Energy Sources 2005, 27, 327–337. [Google Scholar] [CrossRef]
- Ben Taher, I.; Fickers, P.; Chniti, S.; Hassouna, M. Optimization of enzymatic hydrolysis and fermentation conditions for improved bioethanol production from potato peel residues. Biotechnol. Prog. 2017, 33, 397–406. [Google Scholar] [CrossRef] [PubMed]
- Sabrina, M.S.S.; Roshanida, A.R.; Norzita, N. Pretreatment of Oil Palm Fronds for Improving Hemicelluloses Content for Higher Recovery of Xylose. J. Teknol. 2013, 62. [Google Scholar] [CrossRef]
- Ahmad, A.; Chairul; Rita, N. ; Wulandari, R.; Sari, V.A. Hydrolysis process of oil palm empty fruit bunches for bioethanol production with Saccharomyces cerevisiae. Mater. Today: Proc. 2023, 87, 57–63. [Google Scholar] [CrossRef]
- Iberahim, N.I.; Jahim, J.M.; Harun, S.; Nor, M.T.M.; Hassan, O. Sodium Hydroxide Pretreatment and Enzymatic Hydrolysis of Oil Palm Mesocarp Fiber. Int. J. Chem. Eng. Appl. 2013, 101–105. [Google Scholar] [CrossRef]
- Sitthikitpanya, S.; Reungsang, A.; Prasertsan, P. Two-stage thermophilic bio-hydrogen and methane production from lime-pretreated oil palm trunk by simultaneous saccharification and fermentation. Int. J. Hydrogen Energy 2018, 43, 4284–4293. [Google Scholar] [CrossRef]
- Adney B, Baker J (2008). Measurement of Cellulase Activities. Laboratory analytical procedure, 1 – 11.
- Ayeni, A.O.; Omoleye, J.A.; Hymore, F.K.; Pandey, R.A. EFFECTIVE ALKALINE PEROXIDE OXIDATION PRETREATMENT OF SHEA TREE SAWDUST FOR THE PRODUCTION OF BIOFUELS: KINETICS OF DELIGNIFICATION AND ENZYMATIC CONVERSION TO SUGAR AND SUBSEQUENT PRODUCTION OF ETHANOL BY FERMENTATION USING Saccharomyces cerevisiae. Braz. J. Chem. Eng. 2016, 33, 33–45. [Google Scholar] [CrossRef]
- Triwahyuni, E.; Hariyanti, S.; Dahnum, D.; Nurdin, M.; Abimanyu, H. Optimization of Saccharification and Fermentation Process in Bioethanol Production from Oil Palm Fronds. Procedia Chem. 2015, 16, 141–148. [Google Scholar] [CrossRef]
- Kim, S.; Kim, C.H. Bioethanol production using the sequential acid/alkali-pretreated empty palm fruit bunch fiber. Renew. Energy 2013, 54, 150–155. [Google Scholar] [CrossRef]
- Dahnum, D.; Tasum, S.O.; Triwahyuni, E.; Nurdin, M.; Abimanyu, H. Comparison of SHF and SSF Processes Using Enzyme and Dry Yeast for Optimization of Bioethanol Production from Empty Fruit Bunch. Energy Procedia 2015, 68, 107–116. [Google Scholar] [CrossRef]
- Chohan, N.A.; Aruwajoye, G.; Sewsynker-Sukai, Y.; Kana, E.G. Valorisation of potato peel wastes for bioethanol production using simultaneous saccharification and fermentation: Process optimization and kinetic assessment. Renew. Energy 2020, 146, 1031–1040. [Google Scholar] [CrossRef]
- Kim JK, Oh BR., Shin H.J, et al. (2008). Statistical optimization of enzymatic saccharification and ethanol fermentation using food waste. Process Biochem 43 (11): 1308-1312. http://www.sciencedirect. 1359.
Figure 5.
Standard curve for determining the final concentration of glucose.
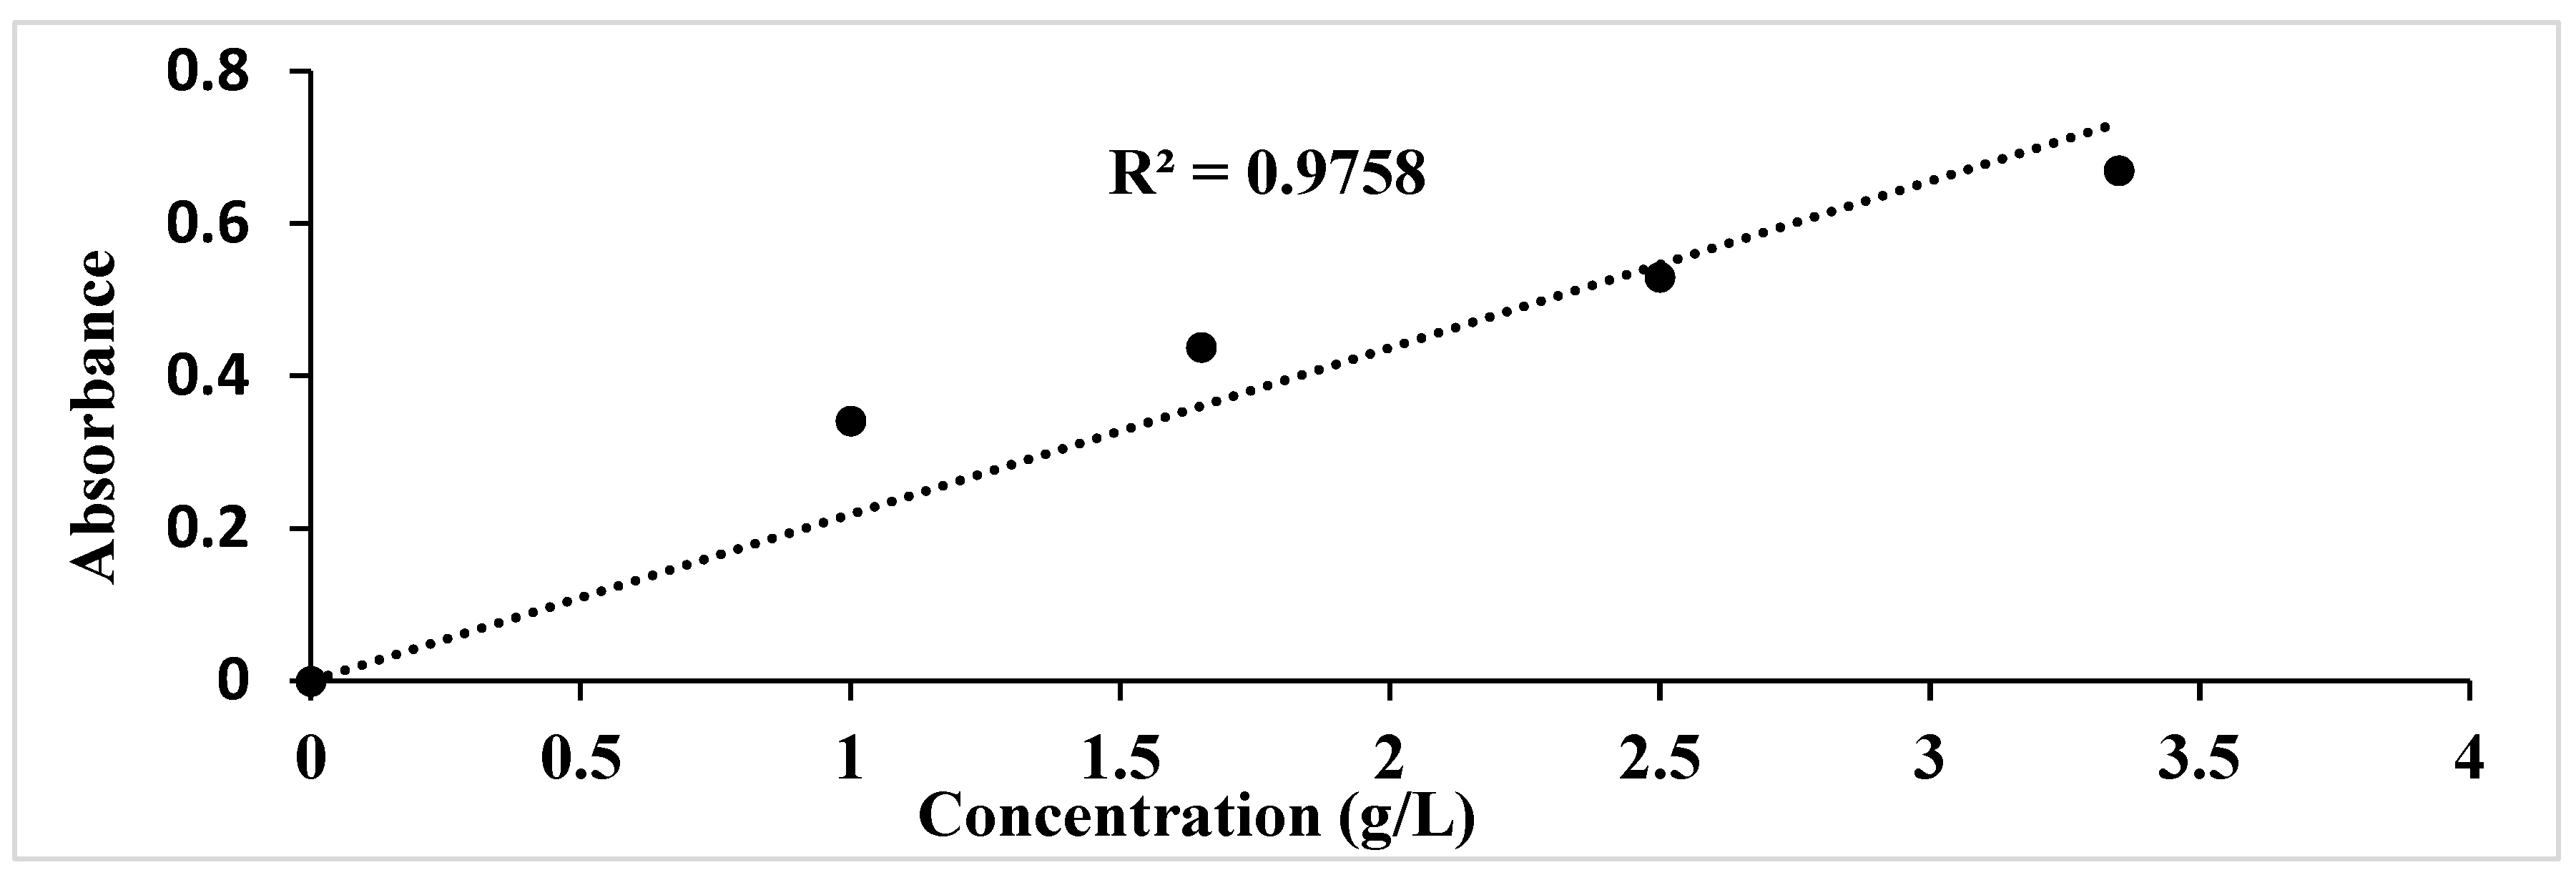
Figure 6.
Ethanol standard curve.
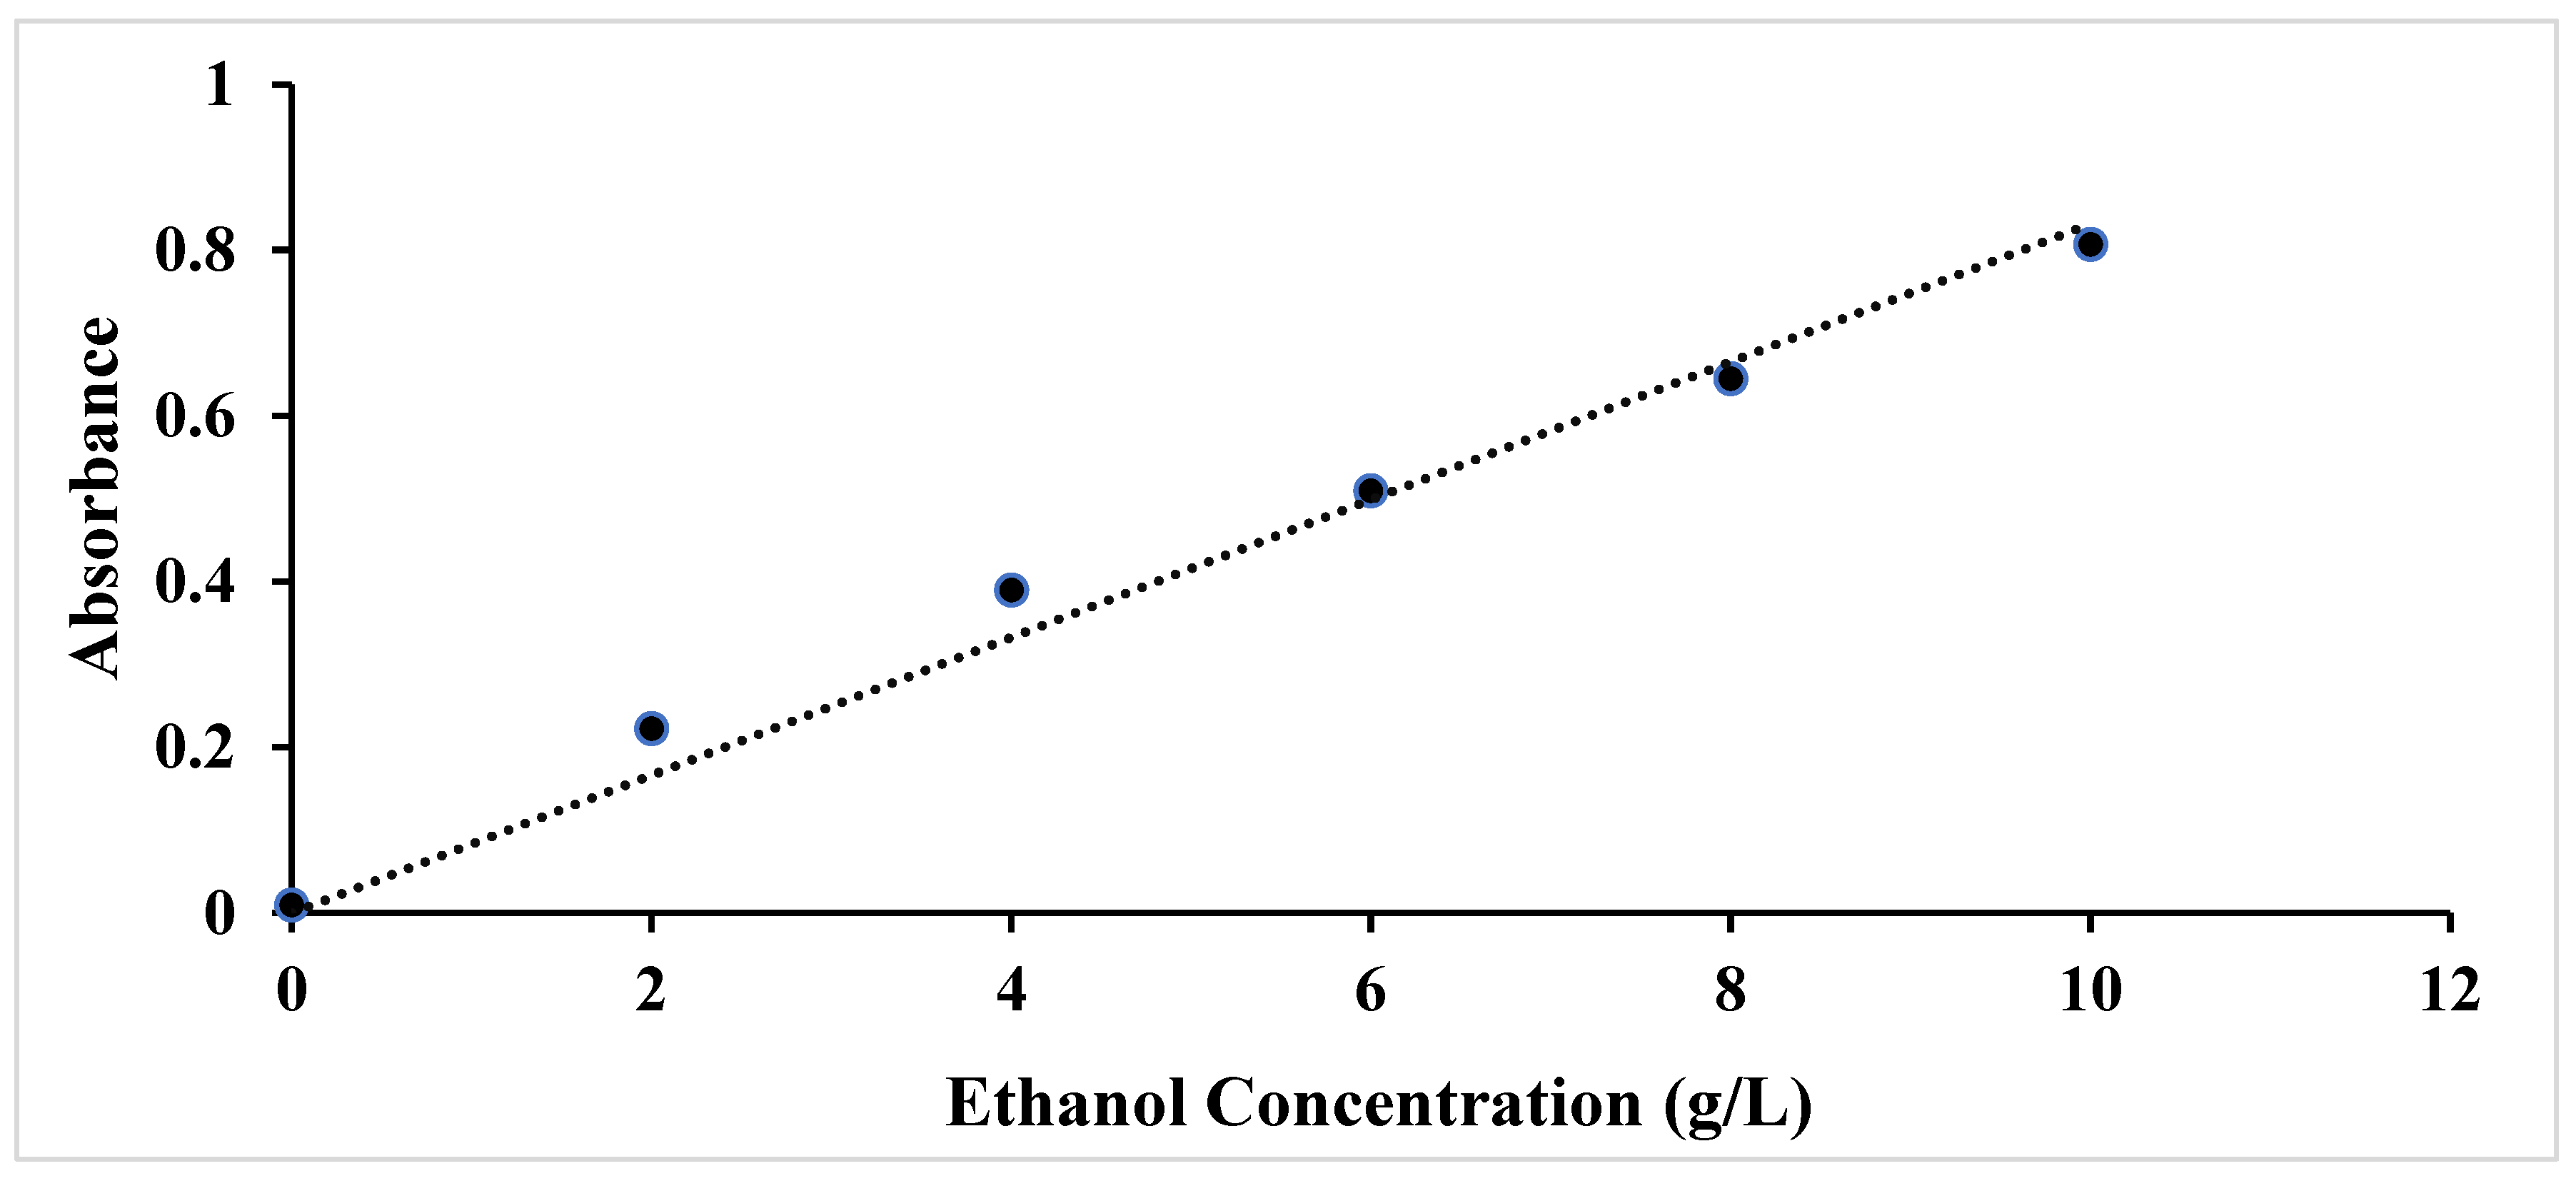
Figure 7.
Predicted and actual value representation for bioethanol concentration.
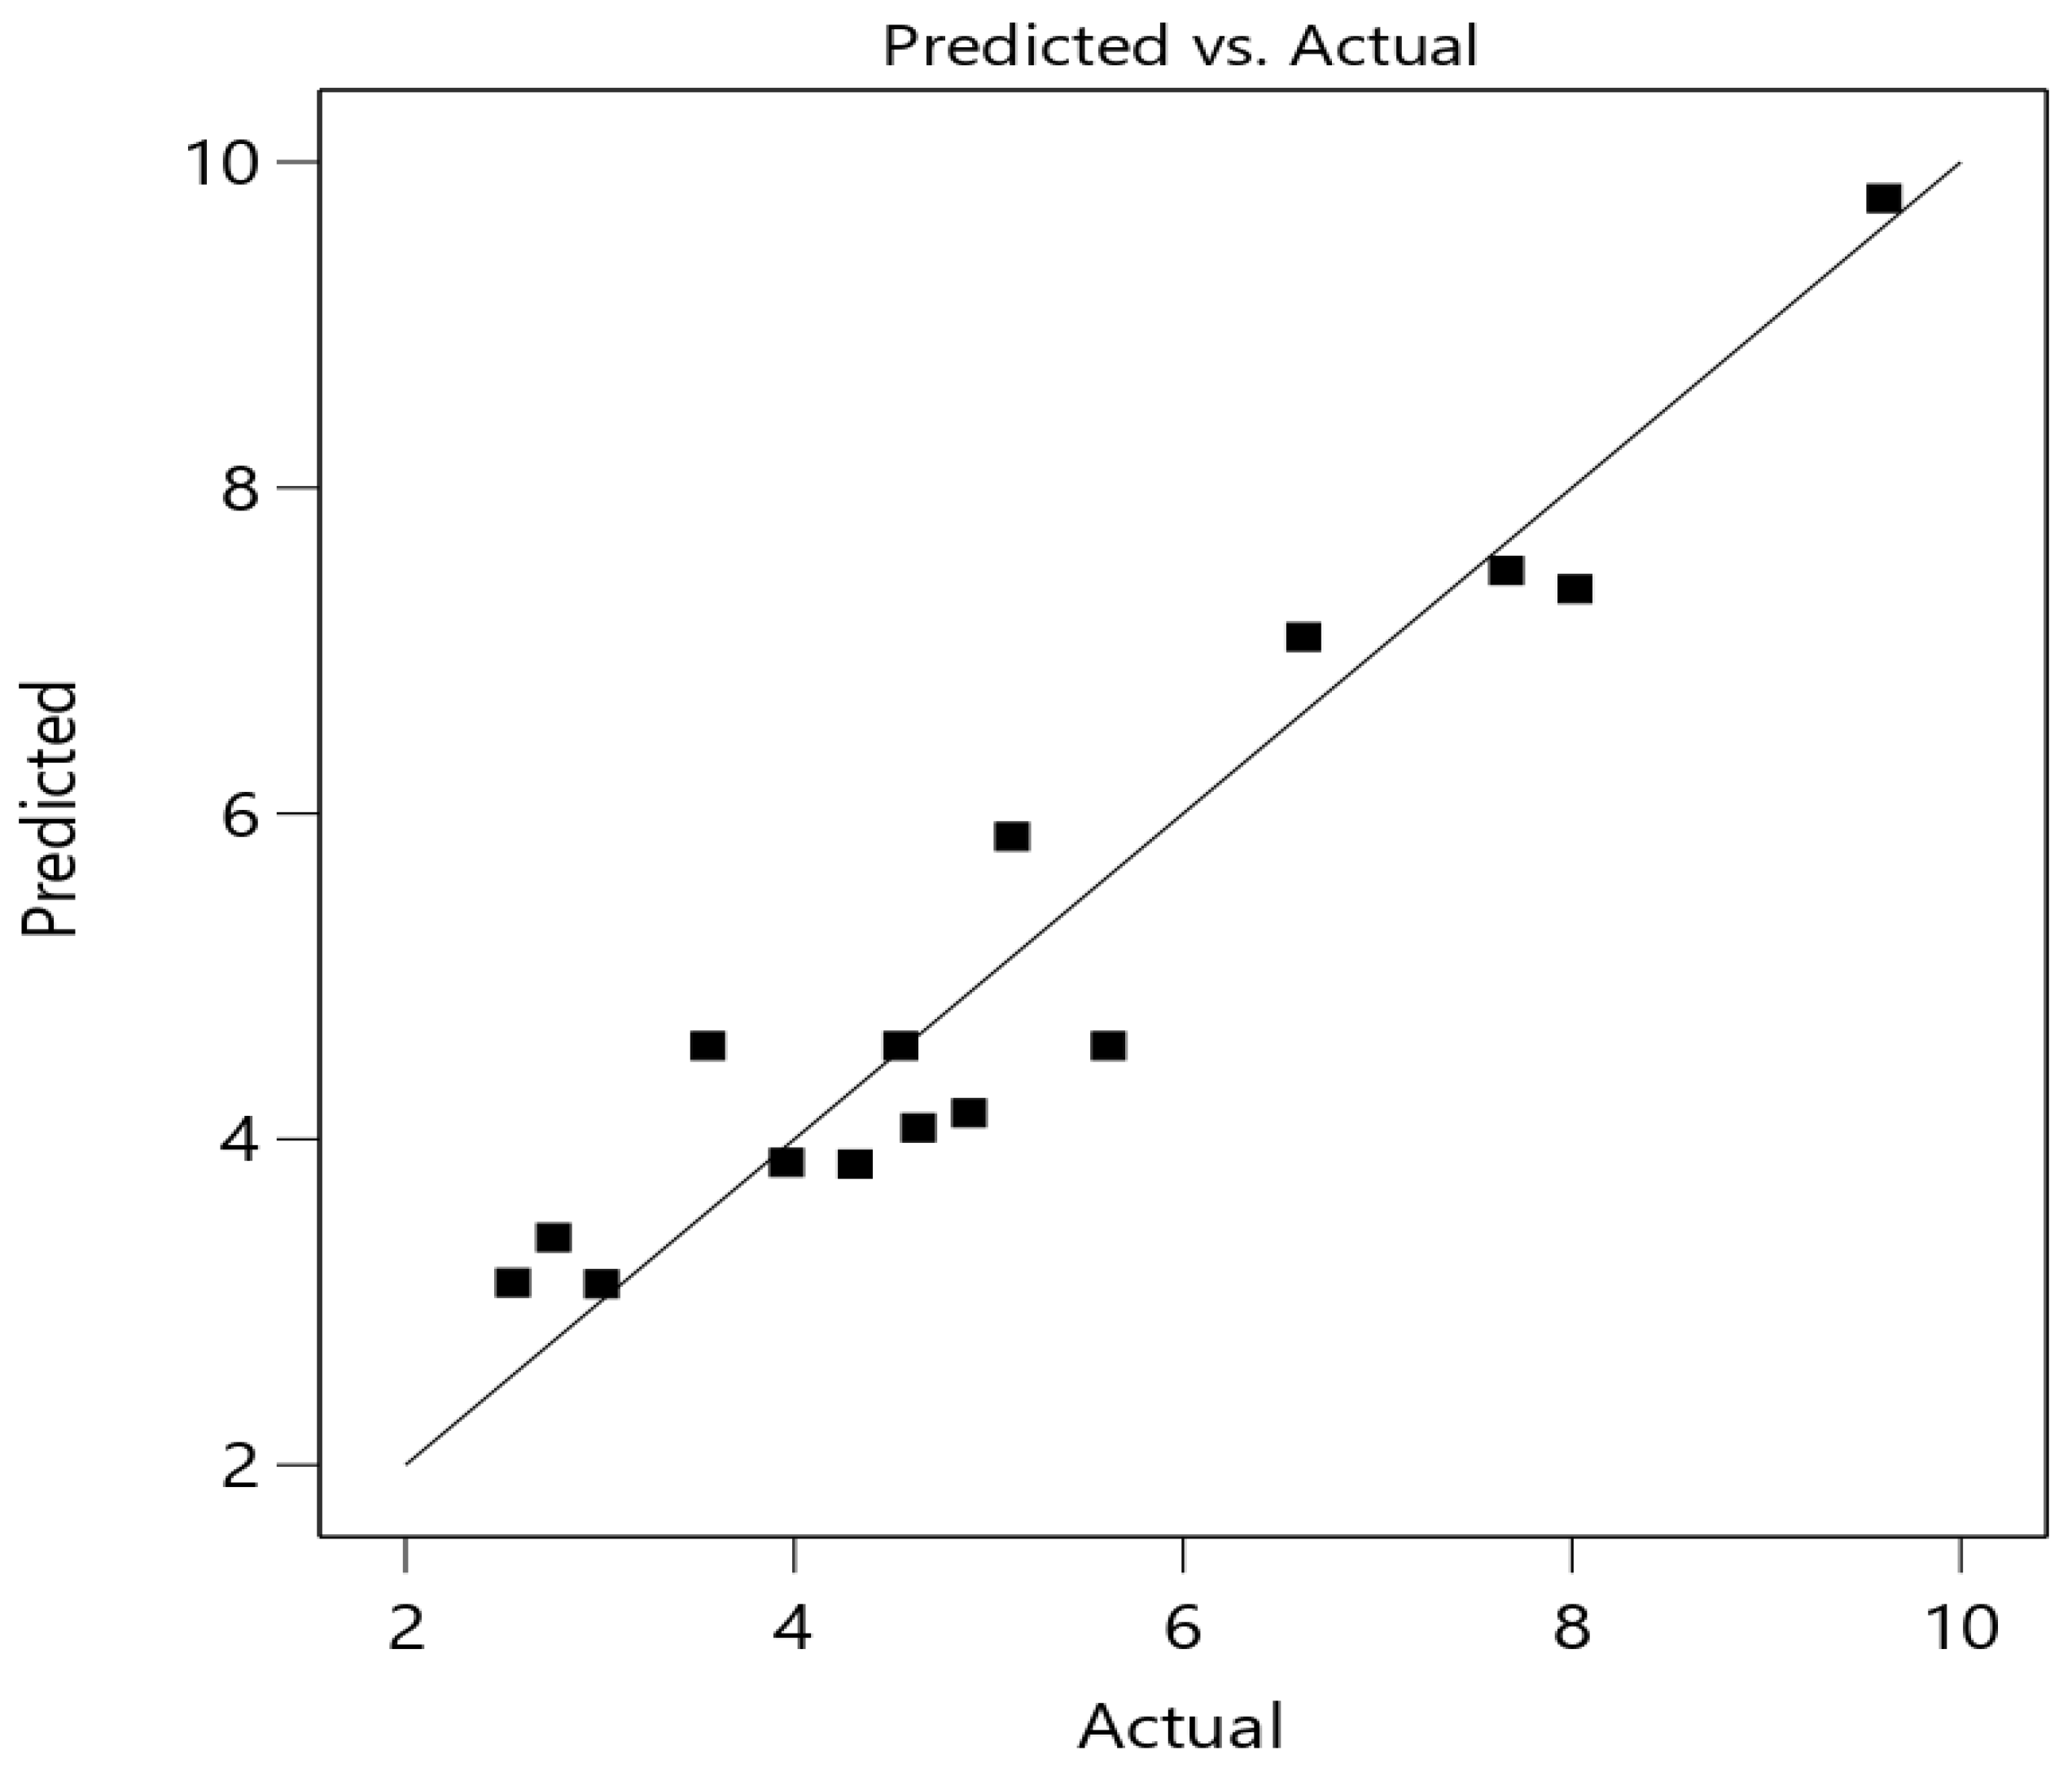
Table 1.
Three factor levels of Box-Behnken design for fermentation experiment.
| Symbol | Independent variable | Unit | Code | ||
| -1 | 0 | 1 | |||
| A | Yeast concentration | % v/v | 1 | 3 | 5 |
| B | Temperature | ˚C | 25 | 30 | 35 |
| C | Reaction time | h | 24 | 48 | 72 |
Table 2.
Compositional analysis of raw and treated palm kernel shell (PKS).
| Raw PKS (% w/w) | Pretreated PKS (% w/w) | ||
| Component | Acid | Alkaline | |
| Hemicellulose | 41.73 ± 1.07 | 15.18 ± 0.76 | 11.23 ± 0.6 |
| Cellulose | 31.06 ± 0.92 | 22.71 ± 0.31 | 45.62 ± 0.2 |
| Lignin | 27.5 ± 0.8 | 23.12 ± 0.56 | 12.40 ± 0.5 |
| Ash | 1.53 ± 0.26 | 1.21 ± 0.03 | |
| Extractives | 0.5 ± 0.12 | 0.04 | |
Table 3.
Glucose concentration obtained at varied enzyme concentration.
| Enzyme concentration (FPU/g biomass) | Glucose (g/L) |
| 10 | 32.19 ± 0.0 |
| 20 | 36.37 ± 0.4 |
| 30 | 39.78 ± 0.2 |
Table 4.
Experimental design for fermentation conditions.
| Run | Yeast concentration (% v/v) | Temperature (˚C) | Reaction time (h) | Bioethanol concentration (g/L) |
| 1 | 1 | 25 | 48 | 4.639 ± 0.0 |
| 2 | 1 | 35 | 48 | 8.016 ± 0.0 |
| 3 | 1 | 30 | 24 | 5.121 ± 0.0 |
| 4 | 3 | 30 | 48 | 4.548 ± 0.0 |
| 5 | 3 | 35 | 72 | 9.606 ± 0.0 |
| 6 | 3 | 30 | 48 | 5.617 ± 0.0 |
| 7 | 5 | 30 | 72 | 4.900 ± 0.1 |
| 8 | 5 | 35 | 48 | 2.553 ± 0.3 |
| 9 | 3 | 35 | 24 | 3.961 ± 0.1 |
| 10 | 3 | 25 | 72 | 3.009 ± 0.0 |
| 11 | 1 | 30 | 72 | 6.621 ± 0.0 |
| 12 | 3 | 30 | 48 | 3.557 ± 0.0 |
| 13 | 3 | 25 | 24 | 7.664 ± 0.2 |
| 14 | 5 | 30 | 24 | 4.313 ± 0.4 |
| 15 | 5 | 25 | 48 | 2.761 ± 0.0 |
Average values ± standard deviations of duplicate experiments.
Table 6.
Experimental and predicted values for bioethanol yield at different conditions.
| Optimum condition |
Bioethanol concentration (g/L) |
|||
| Yeast concentration (% v/v) | Temperature (˚C) | Reaction time (hrs) | Predicted values | Experimental values |
|
1.506 |
34.90 | 69.61 | 10.22 | 0.42 |
Disclaimer/Publisher’s Note: The statements, opinions and data contained in all publications are solely those of the individual author(s) and contributor(s) and not of MDPI and/or the editor(s). MDPI and/or the editor(s) disclaim responsibility for any injury to people or property resulting from any ideas, methods, instructions or products referred to in the content. |
© 2025 by the authors. Licensee MDPI, Basel, Switzerland. This article is an open access article distributed under the terms and conditions of the Creative Commons Attribution (CC BY) license (https://creativecommons.org/licenses/by/4.0/).
Copyright: This open access article is published under a Creative Commons CC BY 4.0 license, which permit the free download, distribution, and reuse, provided that the author and preprint are cited in any reuse.


