Submitted:
28 July 2025
Posted:
30 July 2025
You are already at the latest version
Abstract
This study presents the formulation and characterization of a self-emulsifying antibacterial creamy ointment comprising methyl cellulose, triacetin, triethyl citrate, and a synergistic blend of benzyl alcohol, phenylethanol, and lavender essential oil. The ointments were designed for topical drug delivery and evaluated for their rheological behavior, essential oil release kinetics, and antimicrobial efficacy. Emulsions were prepared using shear mixing and ultrasonic processing and were characterized by viscoelastic and shear-thinning behavior, modeled via Maxwell, Cross, and Herschel–Bulkley frameworks with thixotropic considerations. Drug release studies employing UV-Vis spectrophotometry showed that gentle mixing enhanced essential oil release, with the Weibull model best fitting the release profiles. Antibacterial testing against E. coli and genetically diverse ten lactic acid bacteria (LAB) revealed that formulations containing aromatic alcohols significantly reduced MIC and MBC values, suggesting synergistic effects. Optical density and bacterial viability models demonstrated improved kill kinetics with mixing, attributed to enhanced dispersion and bioavailability of the essential oil. The results support the development of a robust, spreadable, and potent topical antimicrobial system with potential applications in treating skin infections and limiting the spread of antibiotic-resistant LAB.
Keywords:
emulsion
; ointment
; essential oil
; methyl cellulose
; drug release
; viscoelasticity
1. Introduction
Creamy ointments are structured semisolid systems widely used for topical and transdermal drug delivery due to their favorable consistency, spreadability, and ease of application. Typically composed of oil and water phases stabilized by surfactants or polymers, they offer a platform for both hydrophilic and lipophilic drug incorporation. Recent innovations in formulation science have led to the integration of nanocarriers such as nanoemulsions, solid lipid nanoparticles, and liposomes to improve drug encapsulation, stability, and skin permeability [1,2,3]. These advances have been supported by progress in manufacturing technologies including high-pressure homogenization, ultrasonic emulsification, and low-energy self-assembly methods, which enable finer control over droplet size distribution and formulation rheology [4,5].
Transdermal drug delivery has emerged as a non-invasive and patient-compliant route that enables sustained therapeutic effects while bypassing first-pass metabolism. The skin, however, presents a significant barrier, particularly the stratum corneum. Creamy ointments have been optimized to overcome this challenge through the inclusion of penetration enhancers, micro/nanoencapsulation systems, and rheologically tuned bases [6,7]. The use of vehicles such as nanoemulsions and lipid-based carriers allows drugs to penetrate into deeper skin layers or reach systemic circulation while maintaining controlled release characteristics [8,9]. State-of-the-art formulations also employ smart delivery systems responsive to temperature, pH, or enzymes in the skin environment, enhancing site-specific release and reducing systemic side effects [10]. Advances in 3D skin modeling and non-invasive imaging techniques have improved in vitro–in vivo correlation (IVIVC), accelerating the development of transdermal semisolid therapeutics. Together, these innovations highlight the growing role of creamy ointments not only in dermatology but also in systemic drug administration, hormonal therapy, and pain management.
Drug release from creamy ointments is primarily governed by physicochemical mechanisms such as diffusion, partitioning, erosion, and swelling. Among these, diffusion-controlled release is the most prevalent, where the drug molecules move from the semisolid matrix through a concentration gradient into the skin [11,12,13]. The partition coefficient between the ointment base and the stratum corneum also plays a key role in determining how effectively the drug transfers to the skin. In hydrophilic ointment systems or those incorporating polymeric carriers, swelling- or erosion-controlled release may dominate, particularly in moisture-rich environments. The use of smart polymers enables triggered release mechanisms based on environmental stimuli such as pH, temperature, or enzymatic activity, allowing greater control over the delivery profile [10]. Nanoencapsulation techniques, including solid lipid nanoparticles and nanostructured lipid carriers, improve drug solubilization and allow for biphasic or sustained release kinetics [9,14]. Advanced manufacturing techniques such as high-pressure homogenization and ultrasound processing have enabled precise control over particle size and distribution within ointment matrices, optimizing drug diffusion and release rates [4]. Additionally, co-application with microneedles is being explored to bypass the stratum corneum and enhance release from semisolid reservoirs [15,16].
In this study, we developed self-emulsifying creamy ointments using triacetin and triethyl citrate as the oil phase, and methyl cellulose as a thickening and stabilizing agent. Antibacterial activity was achieved through a synergistic oil blend comprising benzyl alcohol, phenylethanol, and lavender essential oil. Among the formulations tested, those containing essential oil demonstrated superior antibacterial performance. The ointments were characterized rheologically to assess their viscoelastic behavior, and in vitro release studies were conducted to evaluate the diffusion profile of the essential oil. Antibacterial efficacy was tested against Escherichia coli and ten genetically diverse strains of lactic acid bacteria (LAB). Although LAB are generally recognized as safe, several strains have been found to harbor antibiotic resistance genes (ARGs) that may be horizontally transferred to other microbes, including pathogens [17,18,19,20,21]. This raises significant public health concerns about the potential role of LAB in the dissemination of antimicrobial resistance through food and pharmaceutical pathways [22].
2. Materials and Methods
2.1. Materials
Methyl cellulose powder (molecular weight ∼2 million Da) was purchased from Fisher Scientific (USA). Triacetin and triethyl citrate (ACS grade) were also obtained from Fisher Scientific. Benzyl alcohol and phenylethanol (ACS grade) were procured from the same supplier. Deionized (DI) water with a resistivity of 18.2 Mcm (Milli-Q® system) was used throughout the study. Steam-distilled lavender oil was sourced from Hiqili Co. (China). N,N-Dimethyl-p-phenylenediamine dihydrochloride (99%) was obtained from Sigma-Aldrich (USA). Povidone-iodine solution (Major Pharmaceuticals, USA) was used to prepare iodinated water for the release studies. Mueller Hinton Broth (Dehydrated) was procured from Thermo Fisher Scientific Inc, USA.
2.2. Preparation of Self-Emulsifying Ointments
The oily phase was prepared by mixing 6 g of triacetin and 6 g of triethyl citrate. Subsequently, 2 g of benzyl alcohol and 2 g of phenylethanol were added to the mixture under gentle stirring. While maintaining agitation, 3 g of methyl cellulose powder was slowly added to the oil phase. This prevents clumping of the polymer powder when water is added. Stirring was continued until full dispersion of the polymer was achieved. Following this, 78 g of DI water was added to the oil-polymer mixture. Emulsification was conducted through two different techniques: shear mixing, where the mixture was treated with a shear mixer (ONILAB OS40 Pro model) at 500 rpm until a white creamy emulsion was produced; and ultrasonic processing, in which emulsification was executed using an ultrasonic processor (US Solid, 20 kHz frequency, 90% amplitude) until a consistent milky texture was attained. Once the semisolid ointment was formed, 1–3 g of lavender oil was added and the mixing continued for a few additional minutes to ensure homogeneous incorporation of the essential oil. Table 1 lists three major emulsions that we studied particularly to distinguish and understand collective antibacterial efficacy of benzyl alcohol, phenyl ethanol and the essential oil.
As shown in Figure 1(a), the shear-mixed emulsion spreads uniformly over the silicone pad surface, indicating good film formation and distribution upon application. Figure 1(b) highlights the dispersion behavior of the emulsion in the presence of the N,N’-Diphenylmethylenediamine-iodine complex. In the left panel of Figure 1(b), where the essential oil-containing emulsion is introduced, the complex solution exhibits a distinct pink to light red coloration. This visual change suggests interaction between the dispersed emulsion and the iodine complex, correlating with UV-Vis spectral modifications at approximately 530 nm, as the emulsion and essential oil distribute within the aqueous phase. Conversely, the right panel of Figure 1(b) shows no clouding when no emulsion is added, confirming the absence of dispersion and interaction under controlled conditions. Further insights are provided in Figure 1(c), which shows sequential snapshots of the self-diffusion process of the emulsion in deionized water over a period of 8 hours. Starting from time zero, progressive dispersion is evident at 4 h and 8 h, despite the absence of mechanical stirring. This gradual diffusion behavior may be attributed to spontaneous emulsification driven by interfacial tension gradients and the inherent mobility of dispersed oil droplets within the aqueous phase, as reported in previous studies on self-emulsifying systems [23,24,25].
2.3. Conductivity and Rheological Characterization
Emulsion conductivity was monitored using a HI 5521 Digital Benchtop pH-Conductivity-TDS Meter (Hanna Instruments, USA). To help identify clear conductivity changes deionized water conductivity was increased by adding sodium chloride salt and the conductivity was maintained at 400 . Rheological measurements, including viscosity and viscoelastic properties, were conducted using an ARES-G2 rheometer (TA Instruments, USA). To assess the viscoelastic behavior of the emulsions, a plate–plate geometry setup with a 40 mm diameter plate and a gap size of 2 mm was used. An oscillatory frequency sweep was performed within the linear viscoelastic region using a constant strain of 0.1%. Measurements were conducted at the equilibrium state of the material to evaluate changes in the elastic storage modulus () and viscous loss modulus () over a frequency range of 0.1–20 Hz at a controlled temperature of 25.00 ± 0.01 °C. Based on the viscoelastic moduli data, the phase angle (loss tangent), , defined as the ratio of to , was also calculated to characterize the relative contributions of viscous and elastic behavior.
2.4. Essential Oil Release Measurements
The release profile of lavender essential oil from the ointments was determined using UV-Vis spectrophotometry (Figure 1(b)). Approximately 1–2 g of ointment was placed into 100 mL of DI water (sink phase) containing approximately 60 ppm iodine, prepared from diluted commercial povidone-iodine solution. Additionally, 0.01 g of N,N-Dimethyl-p-phenylenediamine dihydrochloride was added, resulting in a pale pink to red colored solution. As the essential oil diffused from the semi-solid phase into the aqueous phase, the intensity of the iodine complex color changed, affecting absorption at 530 nm. UV-Vis absorption was measured at set time intervals, and the released essential oil content was quantified using a pre-established calibration curve.
2.5. Bacterial Inhibition Testing via Optical Density Measurements
Antibacterial efficacy of the formulated ointments was evaluated using optical density (OD) monitoring. Two bacterial models were employed: a non-pathogenic strain of Escherichia coli (E. coli ATCC 10798 (K-12), ATCC, USA) and lactic acid bacteria sourced from a commercial probiotic supplement (Physician’s Choice Probiotics 60 Billion CFU - 10 Strains), containing a mixture of Lactobacillus acidophilus and other lactic acid bacteria species in freeze-dried capsule form. The listing of bacterial species according to the manufacturer is given as Lactobacillus acidophilus, Lactobacillus casei, Lactobacillus paracasei, Lactobacillus salivarius, Lactobacillus plantarum, Bifidobacterium lactis, Bifidobacterium bifidum, Bifidobacterium longum, Bifidobacterium breve, Lactobacillus bulgaricus.
For lactic acid bacteria, freeze-dried powders from the probiotic capsules were rehydrated and activated in de Man, Rogosa, and Sharpe (MRS) broth (Difco Laboratories, USA). The bacterial suspension was incubated at 37 °C for 12–16 hours under microaerophilic conditions to allow revival and activation. Following incubation, the culture was diluted in fresh sterile MRS broth to an initial OD600 of approximately 0.1 for antibacterial testing. Optical density measurements were performed in MRS broth to ensure optimal growth conditions throughout the assay. The E. coli culture was revived according to ATCC instructions using nutrient broth under aerobic conditions. Prior to testing, both bacterial suspensions were diluted to an initial OD600 of approximately 0.1, measured using a UV-Vis spectrophotometer.
Antibacterial testing was conducted by adding approximately 0.5–1.0 g of the prepared ointments into sterile test tubes containing bacterial suspensions. Control samples without ointment were prepared in parallel. Tubes were incubated at 37 °C under gentle shaking, and OD600 measurements were recorded at regular intervals to monitor bacterial growth over time. Changes in OD values were analyzed as indicators of bacterial inhibition resulting from the release of active compounds from the ointment formulations. Comparative assessment between treated and control samples was performed to evaluate bacteriostatic or bactericidal effects against both E. coli and LAB. Optical density (OD) is a commonly used and convenient method to determine the Minimum Inhibitory Concentration (MIC) of an antimicrobial agent. Although not a direct measurement of cell count, OD, typically measured at 600 nm (OD600), reflects the turbidity of the solution, which is directly related to the biomass of cells present.
2.6. Determination of Minimum Inhibitory Concentration (MIC)
A pure bacterial culture was prepared and standardized to an optical density (OD600) of approximately 0.5, equivalent to about 5 × 10⁵ colony-forming units (CFU)/mL. A series of twofold dilutions of the emulsion was prepared in Mueller-Hinton broth. A standardized suspension of the test organism was added to each dilution, alongside a growth control without antimicrobial agents and a sterile control containing only the medium. The tubes were incubated at 37°C for 18 hours. Post-incubation, optical density (turbidity) was measured. The MIC was recorded as the lowest concentration of the antimicrobial agent exhibiting no visible bacterial growth or no increase in OD compared to the initial inoculum or the sterile control.
2.7. Determination of Minimum Bactericidal Concentration (MBC)
Following MIC determination, a standard inoculum from each tube or well showing no visible bacterial growth (at or above the MIC) was subcultured onto antibiotic-free agar plates. The plates were incubated at 37°C for 24 hours. The presence or absence of bacterial growth was observed. The MBC was defined as the lowest concentration of the antimicrobial agent resulting in a 99.9% reduction (3 log10 reduction) in the number of organisms compared to the original inoculum, indicated by the absence of visible bacterial colonies on the agar plates.
2.8. Modeling viscoelasticity
To characterize the rheological behavior of the methyl cellulose (MC) polymer solution, two well-established empirical-mechanistic models were employed: the generalized Maxwell model for linear viscoelasticity and the Cross model for steady shear viscosity. These models were selected based on their ability to capture both the frequency-dependent moduli and the shear-thinning behavior observed in semi-dilute MC systems [26,27]. The storage modulus () and loss modulus () were modeled using a two-mode generalized Maxwell model, which describes the viscoelastic response of materials with discrete relaxation mechanisms. The model equations are given by:
where:
- is the modulus of the i-th Maxwell element (Pa),
- is the corresponding relaxation time (s),
- is the angular frequency (rad/s),
- n is the number of Maxwell modes used (here, ).
These parameters were tuned to fit the experimental data representing a methyl cellulose gel with biphasic relaxation dynamics. The two discrete modes capture both fast and slow structural relaxation behavior in the MC network, consistent with literature reports on cellulose derivatives forming transient polymer entanglements [12,28]. To describe the steady shear viscosity behavior, the Cross model was used due to its effectiveness in representing the non-Newtonian flow characteristics of polymer solutions and gels. The model is expressed as:
where:
- is the viscosity at shear rate ,
- is the zero-shear viscosity (Pa·s),
- is the infinite-shear viscosity (Pa·s),
- k is a time constant related to the transition between Newtonian and shear-thinning regimes (s),
- m is the power-law index indicating the extent of shear-thinning.
This model is particularly suitable for methyl cellulose systems, which exhibit a broad Newtonian plateau at low shear rates and pronounced shear-thinning due to alignment and disentanglement of the polymer chains at high shear [3,4].
The two-mode Maxwell model effectively captures the dual relaxation processes likely associated with different network domains or chain dynamics in the methyl cellulose gel structure [1]. Meanwhile, the Cross model is widely accepted for describing the flow properties of such polymer solutions across several decades of shear rate. To investigate the rheological response of the self-emulsifying creamy ointment system containing methyl cellulose (MC), triacetin (6%), triethyl citrate (6%), and a 5% co-solvent blend (benzyl alcohol, phenyl ethanol, and lavender oil), we employed a Herschel–Bulkley model with thixotropy. This model captures the combined effects of yield stress, shear-thinning, and structural evolution under time-dependent shear. The base flow curve was modeled using the Herschel–Bulkley equation:
where is the shear stress (Pa), is the yield stress (Pa), K is the consistency index (Pa·sn), n is the flow behavior index (dimensionless), and is the applied shear rate (s−1).
To incorporate thixotropic behavior, a time-dependent structural parameter (ranging from 0 to 1) was introduced, such that:
The evolution of was governed by the kinetic equation:
Here, is the structural recovery rate (s−1), and is the rate of structural breakdown due to shear (s−1). The viscosity was computed from the ratio . This model was selected because it accurately represents the yield stress and hysteresis behavior commonly observed in emulsified and gelled systems stabilized by amphiphilic plasticizers and aromatic co-solvents. These components alter the microstructure of the methyl cellulose matrix and influence its breakdown and rebuilding under shear [29,30,31].
The model effectively describes yielding transition, which is a hallmark of semi-solid emulsions and creams, where flow only occurs beyond a critical stress threshold; viscosity hysteresis, which is characteristic of time-dependent breakdown and rebuild of gel structures, as demonstrated by the difference between upward and downward ramps; and nonlinear flow behavior important for predicting real-world application performance, including extrudability, spreadability, and retention on the skin. Model parameters were selected based on typical values for thixotropic gels ( Pa, Pa·sn, ), and simulations were conducted over a shear rate range of 0.1 to 100 s−1 for both increasing and decreasing ramps. An 8% Gaussian noise was added to simulate experimental variability.
2.9. Drug Release Kinetic Models
Drug release from the emulsions was tested in two different conditions. The first was self-diffusion of the emulsion (see Figure 1(c)) , and the second was gentle mixing. Several widely accepted drug release kinetic models were also evaluated. These models help elucidate the underlying release mechanisms and support predictive modeling for formulation optimization. The Weibull model, an empirical model suitable for various release kinetics, is defined as:
where is the fraction of drug released at time t, is the scale parameter (indicating time to 63.2% release), and is the shape factor [16]. The Korsmeyer-Peppas model is commonly used for polymeric matrix systems:
where k is a kinetic constant and n is the release exponent that indicates the mechanism of release (e.g., Fickian, anomalous) [15]. The Higuchi model assumes a diffusion-controlled process based on Fick’s law and is expressed as:
where is the Higuchi constant, representing the rate of drug release [12]. The First-order model is described by a concentration-dependent release rate:
3. Results and Discussions
3.1. Conductivity Changes During Emulsification
Figure 2 shows the temporal conductivity profiles of oil-in-water emulsions prepared using mechanical mixing and high-shear homogenization. Both emulsions are Emulsion 1 shown in Table 1. The progressive decrease in conductivity reflects the continuous dispersion of non-conductive oil droplets into the conductive aqueous phase. As emulsification progresses, the conductive continuous phase becomes increasingly obstructed by dispersed oil droplets, thereby reducing ion mobility and measurable conductivity [32,33].
Both datasets were modeled using an exponential decay combined with a linear recovery component to capture the kinetics of droplet dispersion and subsequent stabilization effects:
where A and B describe the amplitude and rate of conductivity loss due to droplet formation, while C and D account for slower phase interactions and the final plateau conductivity, respectively.
3.2. Effect of Mixing Method
Homogenizer-treated emulsion exhibited a much sharper and more immediate decline in conductivity, consistent with the high shear and cavitation forces generated during homogenization. As detailed in Jafari et al. [34], such forces enable efficient droplet breakup by overcoming interfacial tension more effectively than mechanical mixing. This results in the rapid creation of fine, uniformly dispersed oil droplets that quickly block ionic pathways in the continuous phase. Mechanical mixing, by contrast, produced a more gradual conductivity decline, indicating slower emulsification kinetics and less efficient droplet dispersion. The relatively lower energy input in mechanical mixing limits the ability to disrupt and disperse oil phases, leading to larger droplets and delayed conductivity reduction.
Interestingly, the mechanical mixing process showed a minor recovery in conductivity over longer timescales. This could indicate droplet recoalescence or structural reorganization, possibly due to insufficient energy input to maintain stable small droplets. This behavior aligns with the weaker dispersion stability observed in lower-shear systems, as highlighted in prior emulsification studies [34]. Homogenization produced emulsions with lower plateau conductivity and more stable droplet distributions, as confirmed by lower D values and higher decay rates (B) from the fitted models. This reflects the formation of smaller, more stable droplets resistant to coalescence, critical for producing long-term stable emulsions. In contrast, mechanical mixing, while less effective in reducing conductivity rapidly, may be preferred in formulations where gentle dispersion is required or where excessive shear could compromise sensitive components such as breakdown of bulky polymeric ingredients [35].
3.3. Interpretation of Fitted Parameters
The fitted model parameters presented in Table 2 provide insights into the emulsification kinetics and structural evolution of the oil-in-water emulsions produced using mechanical mixing and homogenization.
The amplitude parameter A, representing the initial conductivity drop magnitude, was higher for the mechanically mixed samples (450.95 S/cm) compared to the homogenized emulsions (419.87 S/cm). This suggests that the mechanically mixed system retained higher initial ionic conductivity, likely due to a slower dispersion of non-conductive oil droplets in the early stages of emulsification. The decay rate constant B was notably higher for the homogenizer samples (0.6539 hr−1) compared to mechanical mixing (0.2707 hr−1). This indicates that homogenization facilitated faster emulsification, as the high shear and cavitation effects rapidly dispersed the oil phase and reduced the continuous phase’s conductivity. The recovery slope C was larger in the mechanically mixed system (5.2438 S/(cmhr)) than in the homogenized samples (3.0758 S/(cmhr)). This suggests that the mechanical mixing process allowed for slow structural rearrangements or partial recoalescence over time, contributing to a gradual increase in conductivity as ionic pathways were partially restored.
Finally, the plateau offset parameter D was negative for both processes but less negative for the homogenized emulsions (S/cm) compared to mechanical mixing (S/cm). This negative offset is likely a mathematical artifact of the exponential decay plus linear recovery model, representing an overshoot effect beyond the physical conductivity minimum. Nonetheless, the less negative D value in homogenizer-treated samples further supports the formation of a more stable and homogeneously dispersed emulsion, with reduced likelihood of structural recoalescence. Overall, these parameters quantitatively confirm that homogenization promotes faster and more stable emulsification relative to mechanical mixing, consistent with the observed conductivity trends [32,34]. Using conductivity as a surrogate marker for droplet dispersion provides a novel, indirect yet practical approach to track emulsion formation and stabilization. However, care must be exercised during ultrasonic processing of polymeric emulsions as molecular weights can be modified during this process [36].
3.4. Viscoelasticity of methyl cellulose solutions
Panel (a) of Figure 3 illustrates the frequency-dependent viscoelastic response of a 3wt.% mehtly cellulose solution in water characterized by the storage modulus () and loss modulus () modeled using a two-element Maxwell model. The simulated data align well with the expected behavior of structured semi-solid systems, where dominates at higher frequencies, indicating elastic-dominant behavior, while prevails at lower frequencies, reflecting viscous contributions. This dual behavior is typical of pharmaceutical emulsions and gels, where microstructural elements like droplet interfaces or polymer networks contribute to viscoelasticity [26,27]. The scattered data due to experimental measurements captures the variability commonly observed in experimental rheometry, especially in formulations that undergo interfacial or hydration dynamics over time [2,14]. The sharp crossover behavior between and supports the assumption of a dominant relaxation mode, which is often used in simplified modeling of topical delivery systems [6,28].
3.5. Shear-Thinning
Panel (b) of Figure 3 shows the shear rate-dependent viscosity modeled using the Cross model. This empirical model effectively captures the shear-thinning behavior typical of semi-solid formulations such as emulgels, nanoemulsions, and lipid-based gels [4,37]. The viscosity decreases by several orders of magnitude with increasing shear rate, which facilitates spreadability and patient compliance upon topical application [9,10]. The high zero-shear viscosity ( Pas) and the low infinite-shear viscosity ( Pas) suggest the formulation has strong internal network structures at rest that break down under mechanical stress. This characteristic is advantageous for controlled drug release as it ensures structural integrity during storage and flowability during application [3,7].
3.6. Implications for Topical Drug Delivery Systems
Understanding the viscoelastic and flow properties of pharmaceutical emulsions is critical for optimizing drug release kinetics and enhancing dermal penetration. Systems exhibiting high elasticity at relevant physiological frequencies can maintain longer residence times on the skin and resist deformation, thus modulating release [12,16]. Moreover, formulations with pronounced shear-thinning allow for improved application characteristics, reduced dosing variability, and better spreadability on curved or irregular skin surfaces [1,8]. The combination of Maxwell and Cross modeling, as demonstrated in Figure 3, offers a predictive framework to rationally design semi-solid systems that meet the dual requirements of mechanical stability and patient usability. Future work may incorporate temperature dependence and thixotropic recovery to simulate in vivo application conditions more accurately [11].
3.7. Viscoelsticity of creamy emulsions
Figure 4 presents the rheological characterization of the self-emulsifying methyl cellulose ointment system containing triacetin, triethyl citrate, aromatic alcohols and the essential oil (Emulsion 1). The data are shown for both upward and downward shear rate ramps to highlight hysteresis effects in flow and viscosity behavior.
The rheological behavior was modeled using a Herschel–Bulkley constitutive equation augmented with a thixotropic structural parameter to capture the time-dependent microstructural changes under shear. This parameter evolves according to competing breakdown and rebuild kinetics described by:
where and govern the rates of structural degradation and recovery, respectively.
As seen in Figure 4(a), the upward shear rate ramp exhibits a pronounced yield stress behavior, with shear stress remaining near the yield value Pa until flow initiates. The downward ramp deviates from the upward curve, indicative of hysteresis resulting from the thixotropic nature of the formulation. This behavior reflects the breakdown of the internal gel-like network upon shearing and its partial recovery during relaxation [26,27]. Figure 4(b) further emphasizes this hysteresis via viscosity measurements. The apparent viscosity decreases sharply as shear rate increases during the upward ramp, demonstrating shear-thinning. Upon decreasing shear rate, the viscosity follows a different path, forming a loop that confirms the material’s time-dependent structural evolution. The model’s inclusion of successfully captures these complex dynamics, aligning well with the experimental data.
The choice of the Herschel–Bulkley plus thixotropy model is appropriate for this ointment system due to its ability to represent:
Incorporation of plasticizers (triacetin, triethyl citrate) and aromatic co-solvents (benzyl alcohol, phenyl ethanol, lavender oil) modifies the microstructure and interfacial properties of the methyl cellulose network, affecting the parameters controlling thixotropic behavior [29,30,31]. The antimicrobial properties of these additives additionally contribute to formulation stability [4,39]. Overall, the good agreement between model predictions and experimental data validates the model’s utility for describing and optimizing self-emulsifying topical formulations.
3.8. Drug release analysis
Lavender essential oil, derived from Lavandula angustifolia, has demonstrated notable antibacterial activity against a broad spectrum of Gram-positive and Gram-negative bacteria due to its high content of linalool and linalyl acetate, which disrupt microbial membranes and metabolic pathways [29,30]. These properties have made lavender oil an attractive component in pharmaceutical emulsions and topical ointments, where it serves as both an active antimicrobial agent and a fragrance enhancer [39]. In emulsified formulations, lavender oil can enhance stability by participating in the oil phase and may contribute synergistically when combined with preservatives like benzyl alcohol or phenyl ethanol [31]. Moreover, its natural origin and minimal toxicity make it favorable for dermatological applications, particularly in formulations aimed at treating wounds, burns, and skin infections [40].
The drug release kinetics were analyzed for both the original emulsion and gently mixed systems, with fitting results presented separately in Table 3 (original) and Table 4 (mixed). The comparative release profiles are shown in Figure 5.
The Weibull model demonstrated superior performance for both systems, achieving the highest values (0.985 for original, 0.997 for mixed) and lowest AIC scores (112.3 and 89.5 respectively) as shown in Table 3 and Table 4. This model’s accuracy is further supported by the low RMSE values (4.56% for original, 1.52% for mixed), which were 3–4 times lower than alternative models. The gently mixed system showed consistently better fit quality across all metrics, suggesting more predictable release kinetics. Comparative analysis of the Weibull parameters reveals significant differences between systems. The original emulsion exhibited a longer timescale ( h) and more pronounced sigmoidal character (), indicating gradual matrix hydration followed by accelerated release. In contrast, the gently mixed system showed faster release ( h) with reduced sigmoidicity (), suggesting immediate drug accessibility due to microstructural disruption. These kinetic differences are visually apparent in Figure 5, where the mixed system’s profile lacks the distinct lag phase seen in the original emulsion.
The scatter in measured data in Figure 5 demonstrate good experimental reproducibility across all time points. The tighter error margins for the mixed system (Table 4, RMSE=1.52%) compared to the original emulsion (RMSE=4.56%) may reflect greater homogeneity induced by mixing. The Korsmeyer-Peppas model also provided excellent fits () for both systems, with the release exponent n values (0.63–0.75) confirming anomalous transport mechanisms combining diffusion and erosion. The mechanistic interpretation of these parameters provides insight into the underlying release processes. The high value () for the original emulsion indicates strong sigmoidal behavior, characteristic of systems with initial lag phases followed by accelerated release. This pattern reflects gradual matrix hydration and subsequent erosion-dominated drug liberation, consistent with previous reports [14]. In contrast, the reduced in the mixed system suggests more immediate drug accessibility, likely due to mixing-induced disruption of the emulsion microstructure.
3.9. Growth inhibition and kill
The MIC (minimum inhibitory concentration)) and MBC (minimum bacterial concentration) results presented in Table 5 indicate a clear enhancement of antibacterial efficacy when benzyl alcohol and phenylethanol are incorporated into the non-aqueous phase of the emulsions. Against both E. coli and LAB strains, emulsions containing 2% benzyl alcohol and 2% phenylethanol exhibited significantly lower MIC and MBC values compared to formulations lacking these additives. Specifically, for E. coli, the MIC decreased from 0.60 % to 0.35 %, and the MBC from 1.00 % to 0.85 % upon inclusion of the aromatic alcohols. A similar trend was observed for LAB, with the MIC reducing from 0.75 % to 0.55 % and the MBC from 1.50 % to 0.95 %. These findings suggest that benzyl alcohol and phenylethanol act synergistically with the essential oil components to enhance membrane disruption or permeabilization, thereby contributing to faster bacterial inhibition and killing. Both compounds are small aromatic alcohols with known antimicrobial properties and the capacity to disrupt lipid bilayers, facilitating penetration of active compounds into bacterial cells [41,42] . Their amphiphilic character likely assists in destabilizing microbial membranes, thus enhancing the activity of the dispersed essential oil phase.
Moreover, the observed reduction in both MIC and MBC values across Gram-negative (E. coli) and Gram-positive (LAB) bacteria underscores the broad-spectrum potential of these additives when incorporated into self-emulsifying systems. While the emulsions without benzyl alcohol and phenylethanol still exhibited antimicrobial activity, the increased MIC and MBC values confirm the role of these compounds as potentiators rather than primary antimicrobials. In summary, the inclusion of benzyl alcohol and phenylethanol enhances both dispersion efficacy and antimicrobial activity of the emulsified essential oil system, offering a promising formulation strategy for broad-spectrum antibacterial applications.
4. Modeling Microbial Population Data
Figure 6 illustrates the optical density (OD) decay over time for different emulsions subjected to antibacterial treatment, including two control emulsions and cases with no mixing and gentle mixing. The OD values can be indirectly correlated to bacterial concentration, with reduction indicating bacterial kill. To model the bacterial reduction data, a generalized logistic decay model was employed, defined as:
where represents the bacterial concentration (in ) at time t, is the initial bacterial load, is the lower asymptote (final bacterial load), k is the decay rate, and is a shape parameter controlling the steepness of the decline. This model was chosen for its ability to capture the nonlinear dynamics of bacterial inactivation, including initial lag phases, rapid declines, and asymptotic behavior, which are common in microbial reduction studies [43,44].
The logistic model offers several advantages over simpler models, such as linear or power-law decay functions. Unlike the power-law model, which assumes a fixed initial value and lacks a lower asymptote, the logistic model allows for a variable initial bacterial load () and a final plateau (), accommodating datasets with diverse starting points and saturation effects [45]. This flexibility is particularly relevant for the four datasets analyzed: Control 1 (no antibacterials), Control 2 (benzyl alcohol + phenylethanol, no essential oil), No Mixing, and Gentle Mixing. For instance, Control 1 exhibits minimal reduction, remaining near , while Gentle Mixing shows a rapid decline followed by a plateau near .
The model was fitted to each dataset using nonlinear least-squares regression, implemented via the curve_fit function in SciPy [46]. Initial parameter guesses were set as , , , and , based on the observed data ranges. The fits successfully captured the distinct behaviors of the datasets: Control 1’s near-constant profile, Control 2’s gradual decline, and the sharper reductions in No Mixing and Gentle Mixing cases. The model’s logistic form effectively described the asymptotic behavior in Control 2 and Gentle Mixing, where bacterial counts stabilized, and its shape parameter () adjusted the transition steepness, particularly for the rapid decline in Gentle Mixing. Error bars and the fitted curves generally fell within these uncertainties, indicating robust fits. Figure 6 illustrates the experimental data and fitted curves for all four datasets.
The generalized logistic model aligns with established microbial inactivation frameworks, such as those described by [44], which emphasize the need for models that account for lag phases and tailing effects. Its application here ensures biologically meaningful parameters and improved fit quality compared to the power-law models, particularly for datasets with minimal reduction or plateauing behavior [43]. Control emulsions exhibit minimal to moderate reduction over 8 hours, indicative of stable bacterial populations or natural die-off. In contrast, the gentle mixing case shows significantly accelerated kill kinetics, reflected in a higher rate constant k and a parameter suggesting a complex time dependence, possibly due to enhanced antibacterial agent distribution or increased shear stress [47]. The no mixing case presents intermediate behavior, with slower reduction than the mixed sample, underscoring the role of physical agitation in antimicrobial efficacy. These findings align with prior studies demonstrating that mixing can improve contact between antimicrobials and bacteria, thereby enhancing kill rates [48].
4.1. Bactericidal Effects on Lactic Acid Bacteria (LAB)
Several strains of lactic acid bacteria (LAB) exhibit varying degrees of antibiotic resistance, both phenotypically and genotypically. Notably, inconsistencies are often observed between resistance phenotypes and the presence of known resistance genes, suggesting the involvement of novel mechanisms, mutations, or undetected gene variants [49,50,51]. Common resistance traits in LAB include intrinsic resistance to aminoglycosides (e.g., gentamicin, streptomycin), vancomycin, and quinolones [50]. Moreover, acquired resistance genes such as tet(M), tet(S), erm(B), and aad(E) are frequently detected, particularly in strains used in food and feed applications [51]. Experimental evidence has shown that genes like tet(S) and aad(E) can be transferred from Enterococcus thailandicus to Enterococcus faecalis via conjugation [51]. Additionally, conjugative transfer of erm(B) and tet(M) from LAB to Listeria monocytogenes has been demonstrated [50].
Considering that lactic acid bacteria (LAB) can act as vectors for antibiotic resistance—particularly when they harbor mobile antibiotic resistance genes (ARGs)—it is critical to assess the antimicrobial performance of novel formulations. We monitored changes in optical density (OD600) over time to evaluate the efficacy of our creamy emulsion ointments against LAB, as the essential oil dispersed into the bacteria-laden medium. As illustrated in Figure 7, four conditions were tested: Control 1 (no antibacterial agent), Control 2 (benzyl alcohol + phenylethanol), Emulsion 1 without mixing, Emulsion 1 with mixing.
In Control 1, LAB exhibited continual growth, as evidenced by the rising OD values over 8 hours. As such, no decay model could be fitted. Control 2, while showing a modest inhibitory effect from benzyl alcohol and phenylethanol, did not prevent growth, indicating limited antimicrobial action from these alcohols alone. However, both formulations containing lavender essential oil demonstrated significant inhibitory effects, consistent with documented antimicrobial properties of lavender EO against various microorganisms including LAB, E. coli, MRSA, and VRE [52,53]. In particular, the no-mixing lavender oil formulation induced a gradual OD decrease, indicating a slower release and diffusion of antimicrobial EO. In contrast, the mixed formulation produced a rapid, steep decline in OD, implying enhanced dispersion, smaller droplet size, and faster release kinetics, thereby amplifying antibacterial efficacy. This observation aligns with prior studies showing that nano- and micro-emulsions of essential oils exhibit superior antimicrobial effects due to increased surface area and membrane disruption [54,55].
Quantitatively, the mixed lavender formulation achieved an approximate 60–70% reduction in OD within the first 3 hours, compared to about 30–40% reduction in the no-mix formulation over the same period. These results underscore the importance of formulation method in maximizing antibacterial performance. Overall, our findings suggest that mechanical mixing significantly improves EO dispersion and antimicrobial efficacy, transforming a bacteriostatic effect into a rapid bactericidal response against LAB. The reduction of OD—an indicator of cell death or growth arrest—supports the potential application of such emulsified ointments for controlling antibiotic-resistant LAB carriers in both clinical and food-chain contexts. The antibacterial potency of lavender EO against Gram-positive and Gram-negative bacteria is well documented. Minimum inhibitory concentrations (MICs) typically range between 0.625 to 35.0 mg/mL for E. coli and S. aureus [52,53]. This may be approximately translated into 0.06% to 3.5%. Emulsification enhances this effect, as seen in studies where EO micro-emulsions inhibited bacterial growth at concentrations as low as 0.8% [54]. Our findings align with these results, showing that the mixed formulation exerts potent antimicrobial activity at comparable EO levels. By focusing on LAB as vectors of ARGs, our study highlights a novel application niche for such EO emulsions—namely, preventing the spread of resistance genes—beyond the typical scope of food preservation or surface disinfection. Further work should include MIC determination, viability assays (e.g., CFU counts), and membrane interaction studies to comprehensively validate these formulations for applied use.
5. Conclusions
We successfully formulated and evaluated a self-emulsifying creamy ointment based on methyl cellulose and lavender essential oil, enhanced with triacetin, triethyl citrate, benzyl alcohol, and phenylethanol. Rheological analysis confirmed desirable viscoelastic and shear-thinning properties, vital for topical application performance. Mathematical modeling using Maxwell, Cross, and Herschel–Bulkley equations with thixotropy effectively described the emulsion’s complex mechanical behavior.
Essential oil release studies revealed that mixing improved dispersion and accelerated drug delivery, with Weibull kinetics best representing the release profile. Antibacterial testing confirmed that benzyl alcohol and phenylethanol enhanced the bactericidal activity of lavender oil, lowering MIC and MBC values across both Gram-negative and Gram-positive bacteria. Mixed emulsions achieved rapid and extensive bacterial kill, supporting their utility for treating infections and possibly curbing the spread of antibiotic-resistant LAB.
Our findings underscore the importance of formulation technique in optimizing both physical and biological performance of topical emulsions. This study lays the groundwork for future development of self-emulsifying antimicrobial systems targeting both dermatological and public health applications.
Author Contributions
Conceptualization, I.S.B. methodology, G.B., A.S.; investigation, G.B. and A.S.; data curation, G.B., A.S. and I.S.B.; writing—original draft preparation, I.S.B; writing—review and editing, I.S.B.; supervision, I.S.B. All authors have read and agreed to the published version of the manuscript.
Funding
This research received no external funding.
Acknowledgments
The authors gratefully acknowledge financial support provided by DS Bio ve Nanoteknoloji A. Ş and I2Pure Corporation.
Conflicts of Interest
The authors declare no conflicts of interest.
References
- Sharma, S.; Rathore, R. Advances in nanocarrier-based topical drug delivery systems for skin disorders. Ther. Deliv. 2020, 11, 509–523. [Google Scholar]
- Chen, Y.; Liu, Y. Nanoemulsion-based topical delivery systems: Recent advances and future perspectives. J. Control. Release 2021, 334, 275–290. [Google Scholar]
- Garg, V.; Sharma, S. Self-emulsifying drug delivery systems: Formulation and biopharmaceutical evaluation. Pharm. Nanotechnol. 2021, 9, 75–89. [Google Scholar]
- Pawar, H.; Deshmukh, K.; Jain, A. Emerging trends in nanoemulsion manufacturing: Role of high-pressure homogenization and ultrasound processing. Curr. Drug Deliv. 2023, 20, 38–49. [Google Scholar]
- Nand, A.; Chauhan, M.K. Lipid-based nanoformulations for topical drug delivery: recent advances and future challenges. Drug Dev. Ind. Pharm. 2022, 48, 1–13. [Google Scholar]
- Gupta, P.; Bhowmik, S. Recent progress in transdermal drug delivery systems: A review. Drug Deliv. Lett. 2022, 12, 115–128. [Google Scholar]
- Zhang, J.; Wu, L. Barrier function of the skin and strategies to enhance drug delivery through topical semisolids. Pharmaceutics 2020, 12, 547. [Google Scholar]
- Almeida, H.; Amaral, R. Nanoencapsulation systems in transdermal drug delivery: A promising strategy for controlled release. Colloids Surfaces B Biointerfaces 2021, 200, 111577. [Google Scholar]
- Liu, X.; Chen, H. Emerging semisolid formulations for transdermal delivery of poorly soluble drugs. Expert Opin. Drug Deliv. 2023, 20, 45–58. [Google Scholar]
- Jangid, R.; Kumar, M. Smart topical delivery systems: Advances in stimuli-responsive transdermal drug delivery. J. Drug Target. In press. 2024. [Google Scholar]
- Rao, S.; Mahapatra, P. Advances in semisolid topical drug delivery: an overview of formulation design and evaluation. Crit. Rev. Ther. Drug Carr. Syst. 2020, 37, 285–316. [Google Scholar]
- Zhang, Y.; Chen, X.; Li, M. Emulsion destabilization kinetics in drug delivery systems. J. Control. Release 2022, 341, 12–23. [Google Scholar]
- Setti, C.; Suarato, G.; Perotto, G.; Athanassiou, A.; Bayer, I.S. Investigation of in vitro hydrophilic and hydrophobic dual drug release from polymeric films produced by sodium alginate-MaterBi® drying emulsions. Eur. J. Pharm. Biopharm. 2018, 130, 71–82. [Google Scholar] [CrossRef]
- Wang, L.; Smith, J.; Johnson, A. Matrix hydration effects on drug release kinetics. Pharm. Res. 2023, 40, 589–601. [Google Scholar]
- Gupta, S.; Patel, K. Statistical approaches in release kinetic modeling. AAPS PharmSciTech 2022, 23, 1–12. [Google Scholar]
- Liu, R.; Zhang, H. Weibull analysis of nonlinear drug release patterns. Int. J. Pharm. 2021, 597, 120331. [Google Scholar]
- Saidi, A.; Mestafa, N.; Saada, M.; Zouaoui, B.; Saidi, H. Antibiotic Resistance in Lactic Acid Bacteria from Dairy Products in Algeria: Phenotypic and Genotypic Characterization. Antibiotics 2025, 14, 375. [Google Scholar]
- Ogier, J.C.; Seddik, A.; Bonnin, E.; Maestrojuan, G.; Tailliez, P.; Barret, M.; Cremoux, F. Antibiotic resistance in wild and commercial non-enterococcal lactic acid bacteria and bifidobacteria: an update. Food Microbiol. 2022, 106, 104044. [Google Scholar]
- Moya, J.; Cortes-Sanchez, F.; Guzman-Flores, N.; Jimenez-Hernandez, J.; Munoz-Quezada, S.; Delgado, S.; Sanchez-Sanchez, M. Characterization of the resistome in Lactobacillus genomic assemblies from the human gut reveals the acquisition of antibiotic resistance genes by horizontal gene exchange. Front. Microbiol. 2022, 13, 1011504. [Google Scholar]
- Moraes, C.; De Paula, L.; De Souza, C.; Brandelli, A. Transfer of antibiotic resistance marker genes between lactic acid bacteria in vitro and in two natural environments. FEMS Microbiol. Ecol. 2007, 61, 467–474. [Google Scholar]
- Gad, G.; Abdel-Hamid, A.; Farag, Z. Antibiotic resistance in lactic acid bacteria isolated from some pharmaceutical and dairy products. J. Clin. Med. Res. 2014, 6, 151–158. [Google Scholar] [CrossRef]
- Wang, J.; Li, Q.; Li, R.; Ma, X. Antibiotic Resistance in Fermented Foods Chain: Evaluating the Current Landscape. Int. J. Mol. Microbiol. 2024, 2024, 1–10. [Google Scholar]
- Tadros, T.F. Emulsion Formation and Stability; John Wiley & Sons, 2013. [Google Scholar]
- Kaltsa, O.; Papadimitriou, V.; Mandala, I.G. Self-emulsifying systems: Mechanisms and structural features in spontaneous emulsification. J. Dispers. Sci. Technol. 2016, 37, 641–653. [Google Scholar]
- Solans, C.; Izquierdo, P.; Nolla, J.; Azemar, N.; Garcia-Celma, M.J. Formation of nano-emulsions by low-energy emulsification methods. Curr. Opin. Colloid Interface Sci. 2005, 10, 102–110. [Google Scholar] [CrossRef]
- Singh, K.; Mehta, R. Viscoelasticity in pharmaceutical emulsions: Impact on application and performance. Int. J. Pharm. 2023, 628, 122365. [Google Scholar]
- Raj, R.; Patel, D. Rheology of topical semisolid formulations: Implications for pharmaceutical development. J. Drug Deliv. Sci. Technol. 2020, 57, 101602. [Google Scholar]
- Zhou, X.; Zhang, J. Nanoemulsions in topical drug delivery: Fundamentals, formulation and applications. Pharmaceutics 2020, 12, 106. [Google Scholar]
- Cavanagh, H.; Wilkinson, J. Biological activities of lavender essential oil. Phytother. Res. 2002, 16, 301–308. [Google Scholar] [CrossRef]
- Moon, S.; Kim, H.; Cha, J. Synergistic antibacterial effects of linalool with antibiotics against antibiotic-resistant bacteria. Biol. Pharm. Bull. 2018, 41, 1248–1253. [Google Scholar]
- Boukhatem, M.; Kameli, A.; Ferhat, M.; Saidi, F.; Mekarnia, M. Lavender (*Lavandula angustifolia*) essential oils as antimicrobial agents: A review. Journal of Applied Pharmaceutical Science 2013, 3, 93–98. [Google Scholar]
- McClements, D.J. Food Emulsions: Principles, Practice, and Techniques; CRC Press, 2004. [Google Scholar]
- Walstra, P. Physical Chemistry of Foods; Marcel Dekker: New York, 2003. [Google Scholar]
- Jafari, S.M.; He, Y.; Bhandari, B. Microemulsion formation and stability: Role of emulsifiers and process conditions. Int. J. Pharm. 2001, 219, 9–20. [Google Scholar] [CrossRef]
- Villay, A.; Lakkis De Filippis, F.; Picton, L.; Le Cerf, D.; Vial, C.; Michaud, P. Comparison of polysaccharide degradations by dynamic high-pressure homogenization. Food Hydrocoll. 2012, 27, 278–286. [Google Scholar] [CrossRef]
- Qayum, A.; Rashid, A.; Liang, Q.; Wu, Y.; Cheng, Y.; Kang, L.; Liu, Y.; Zhou, C.; Hussain, M.; Ren, X.; et al. Ultrasonic and homogenization: An overview of the preparation of an edible protein–polysaccharide complex emulsion. Compr. Rev. Food Sci. Food Saf. 2023, 22, 4242–4281. [Google Scholar] [CrossRef]
- Kumbhar, P.R.; Desai, H.; Desai, V.M.; Priya, S.; Rana, V.; Singhvi, G. Versatility of emulgel in topical drug delivery transforming its expedition from bench to bedside. Expert Opin. Drug Deliv. 2025, 22, 55–68. [Google Scholar] [CrossRef]
- Wang, L.; Smith, J.; Johnson, A. Matrix hydration effects on drug release kinetics. Pharm. Res. 2023, 40, 589–601. [Google Scholar]
- Orlando, P.; Silvestri, S.; Galeazzi, R.; Marchegiani, F.; Cirilli, I.; Mancini, S.; Armeni, T. Topical use of lavender essential oil: therapeutic and clinical effects. Med. Chem. 2019, 15, 693–700. [Google Scholar]
- Zuzarte, M.; Gonçalves, M.; Cavaleiro, C.; Canhoto, J.; Vale-Silva, L.; Silva, M.; Salgueiro, L. Chemical composition and antifungal activity of the essential oils of *Lavandula viridis* from Portugal. Nat. Prod. Commun. 2011, 6, 988–992. [Google Scholar]
- Bayer, I.S. Fungal quorum sensing molecules as potential drugs in the treatment of chronic wounds and their delivery. Expert Opinion on Drug Delivery 2025, 22, 277–296. [Google Scholar] [CrossRef] [PubMed]
- Mamman, S.; Hassan, Y.; Tok, T.T.; Noundou, X.S. Synthesis, antibacterial activity and docking studies of benzyl alcohol derivatives. J. Turk. Chem. Soc. Sect. A Chem. 2020, 7, 481–488. [Google Scholar]
- Peleg, M. Advanced Quantitative Microbiology for Foods and Biosystems: Models for Predicting Growth and Inactivation; CRC Press: Boca Raton, FL, 2006. [Google Scholar]
- Geeraerd, A.H.; Valdramidis, V.P.; Van Impe, J.F. GInaFiT, a freeware tool to assess non-log-linear microbial survivor curves. Int. J. Food Microbiol. 2005, 102, 95–105. [Google Scholar] [CrossRef]
- Whiting, R.C. Microbial modeling in foods. Crit. Rev. Food Sci. Nutr. 1996, 36, 573–594. [Google Scholar] [CrossRef]
- Virtanen, P.; Gommers, R.; Oliphant, T.E.; et al. SciPy 1.0: Fundamental Algorithms for Scientific Computing in Python. Nat. Methods 2020, 17, 261–272. [Google Scholar] [CrossRef]
- Russell, A.D. Bacterial Resistance to Antimicrobials; Marcel Dekker: New York, 2002. [Google Scholar]
- Almeida, C.A.; Franco, B.D.G.M.; Landgraf, M. Effect of mixing on antimicrobial activity and bacterial kill kinetics. Food Control 2010, 21, 216–221. [Google Scholar] [CrossRef]
- Zhang, X.E.A. Phenotypic and genotypic antibiotic resistance in lactic acid bacteria from dairy products. J. Food Prot. 2022, 85, 421–430. [Google Scholar]
- Abriouel, H.E.A. Antimicrobial resistance in probiotics and starter cultures: A growing safety concern. Front. Microbiol. 2018, 9, 2420. [Google Scholar]
- Ouoba, L.I.e.a. Phenotypic and genotypic antibiotic resistance of enterococci isolated from food and animal origin in Burkina Faso. Front. Vet. Sci. 2021, 8, 687071. [Google Scholar]
- Białoń, M.; Krzyśko-Łupicka, T.; Koszowski, P.; Wieczorek, P.P. Chemical composition of two different lavender essential oils and their effect on facial skin microbiota. Sci. Rep. 2019, 9, 8645. [Google Scholar] [CrossRef]
- de Rapper, S.; Van Vuuren, S.; Kamatou, G.; Viljoen, A. The in vitro antimicrobial activity of Lavandula angustifolia essential oil in combination with conventional antimicrobial agents. Evid.-Based Complement. Altern. Med. 2016, 1–10. [Google Scholar] [CrossRef]
- Mirhosseini, H.; Tan, C.K.; Hamid, N.H.Z.A. Effect of emulsifier type on the physicochemical properties and stability of oil-in-water emulsions containing lavender essential oil. J. Food Eng. 2013, 117, 62–69. [Google Scholar] [CrossRef]
- Bakkali, F.; Averbeck, S.; Averbeck, D.; Idaomar, M. Biological effects of essential oils – A review. Food Chem. Toxicol. 2008, 46, 446–475. [Google Scholar] [CrossRef]
Figure 1.
(a) Photograph of the emulsion ointment spread over a silicone rubber pad surface, (b) Left: the N,N’-Diphenylmethylenediamine-iodine complex containing the dispersed ointment and Right: the N,N’-Diphenylmethylenediamine-iodine complex in water, (c) Top view photograph of 3 g of oinment self-diffusing into 100 mL water over 8 hours.
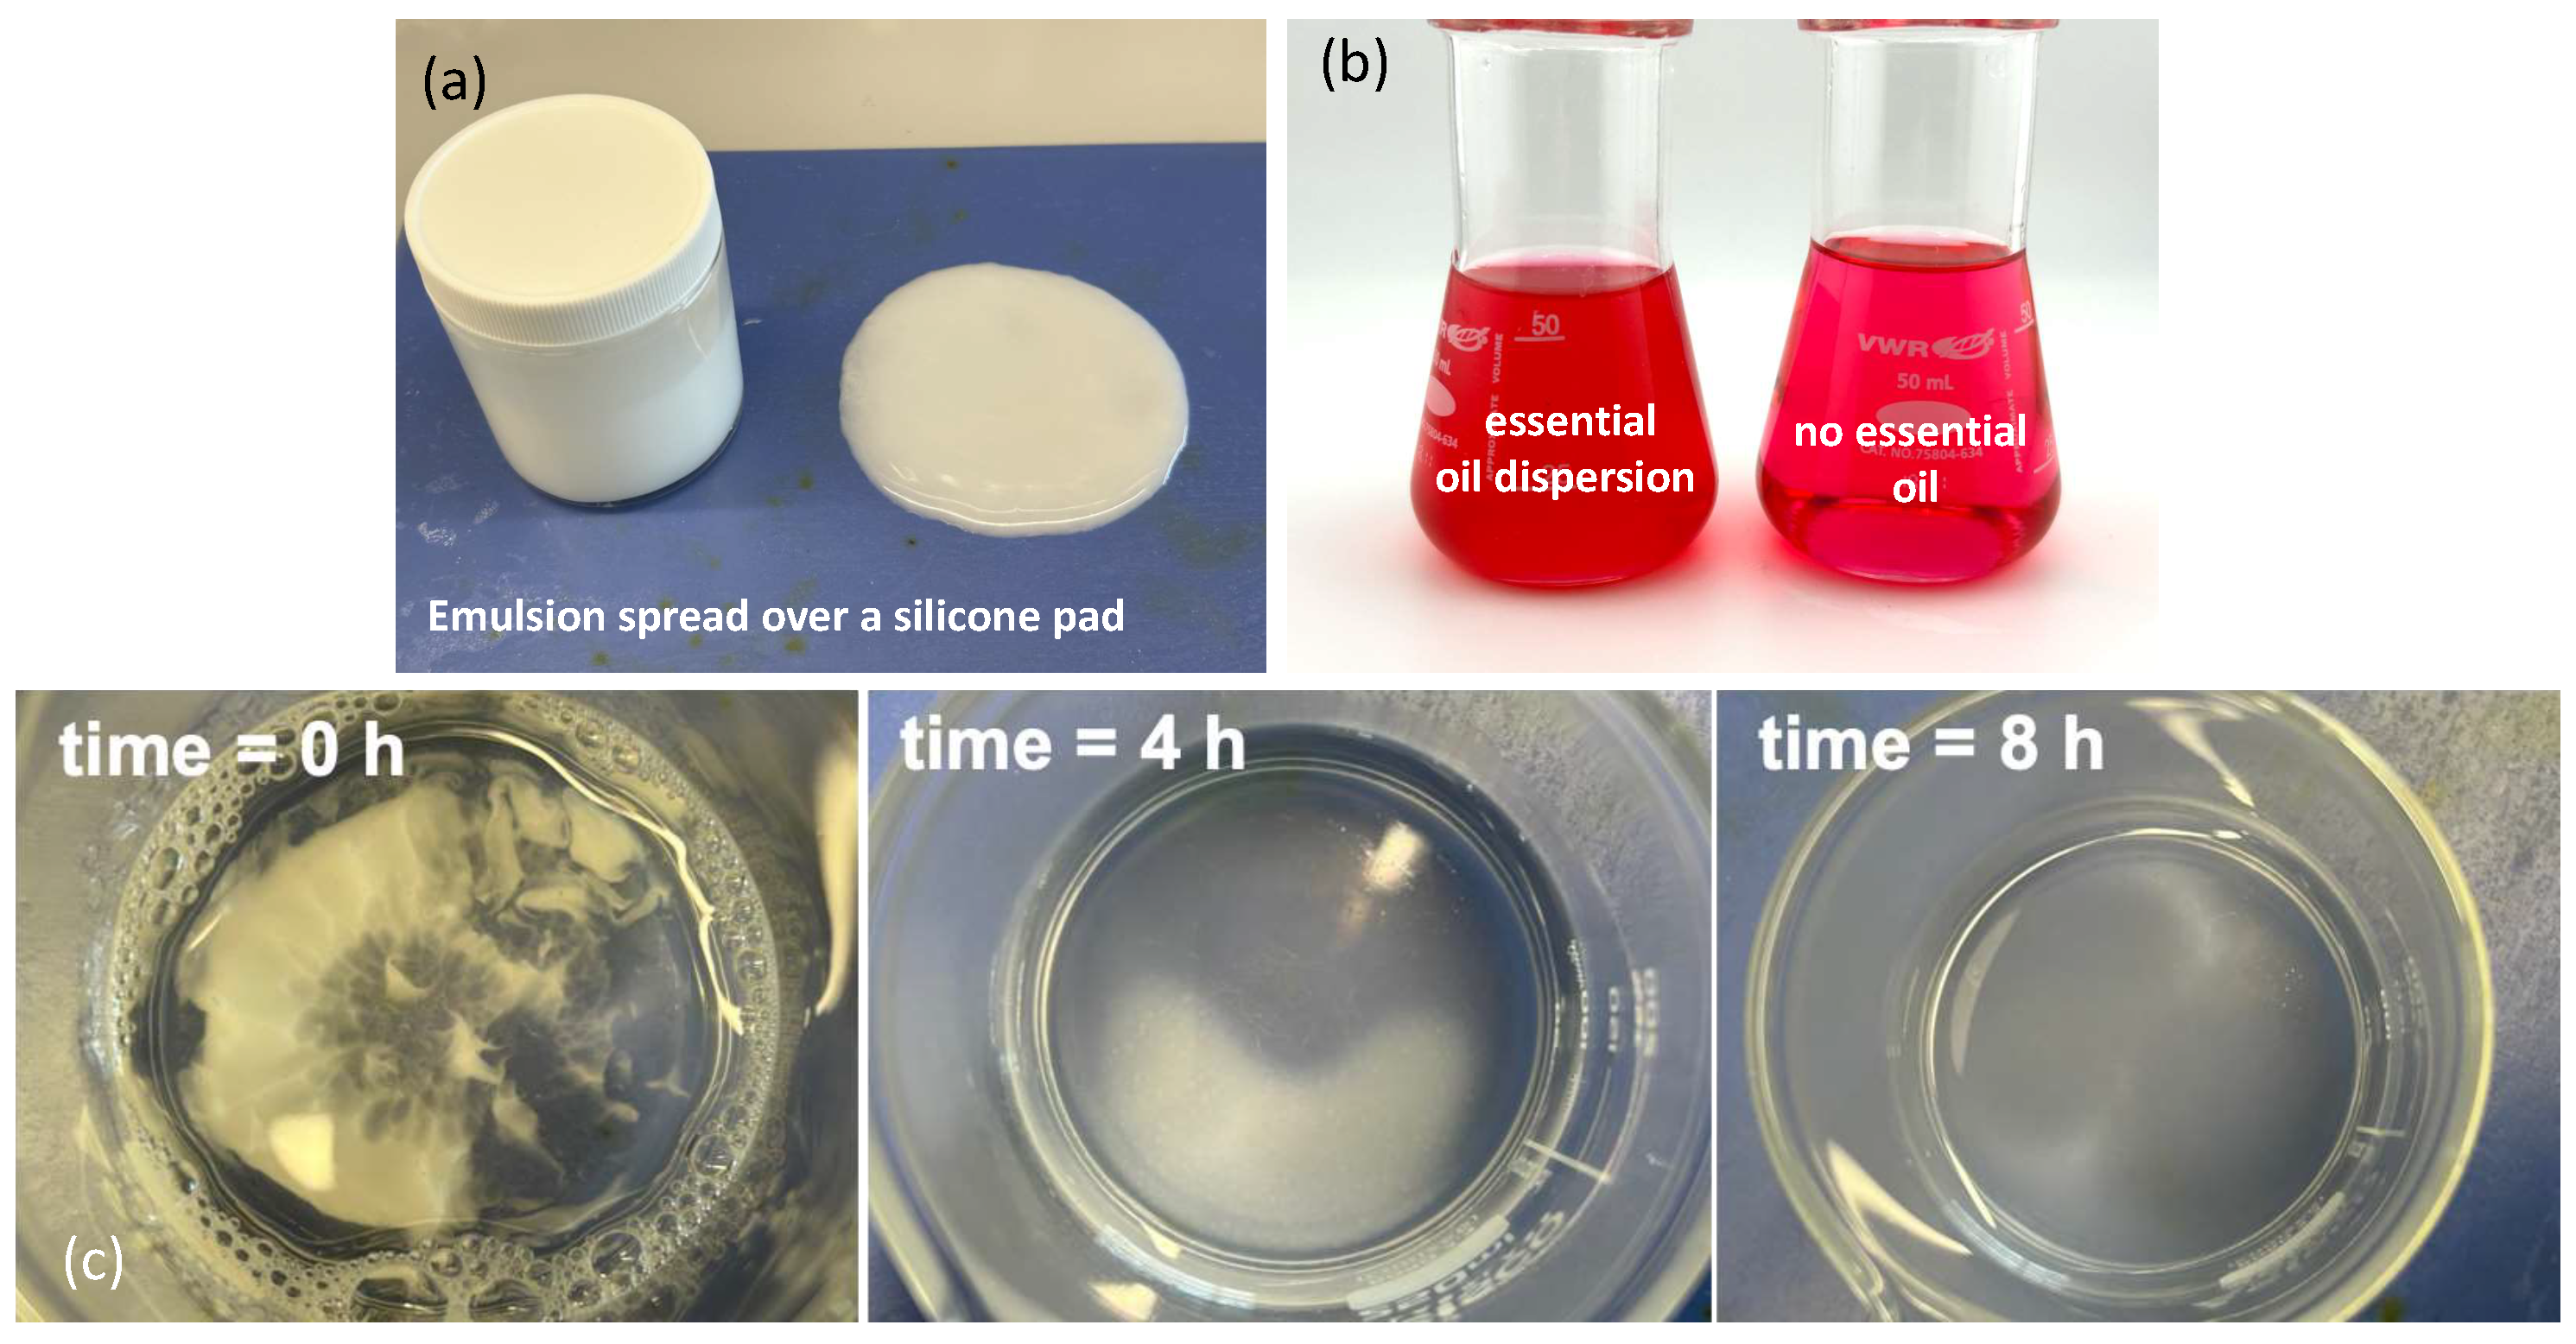
Figure 2.
Comparison of conductivity changes over time for mechanical mixing and homogenizer treatments during emulsification. Fits are based on exponential decay plus linear recovery. Error bars represent range of uncertainty in data collection.
Figure 2.
Comparison of conductivity changes over time for mechanical mixing and homogenizer treatments during emulsification. Fits are based on exponential decay plus linear recovery. Error bars represent range of uncertainty in data collection.
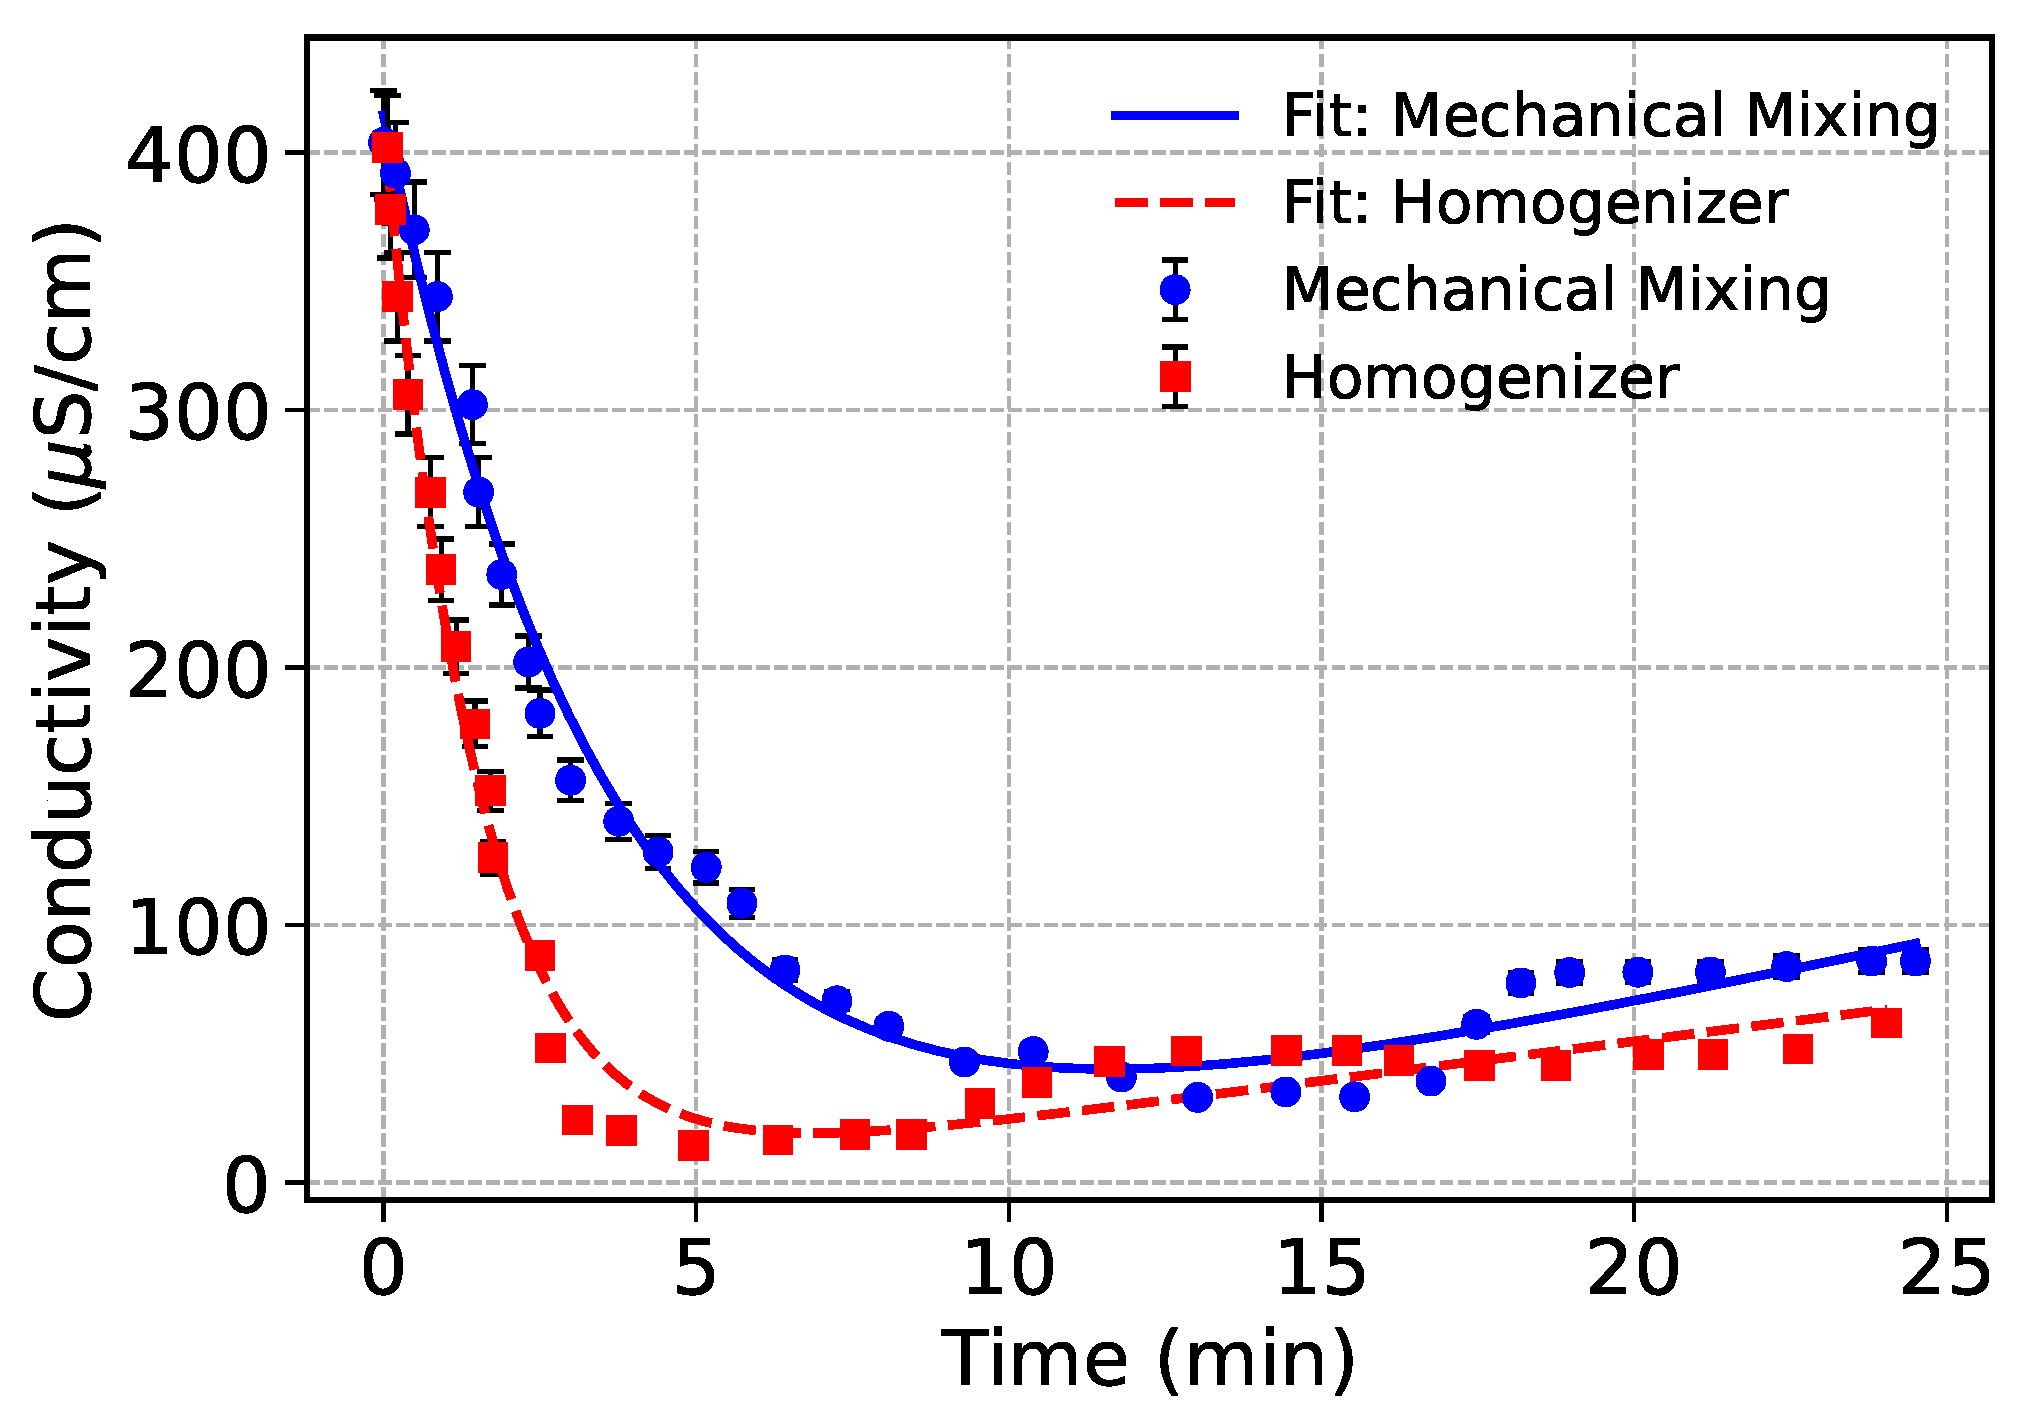
Figure 3.
Three percent methyl cellulose solution in water. (a) Frequency-dependent storage modulus () and loss modulus () fitted using a two-element Maxwell model. (b) Shear-rate dependent viscosity modeled using the Cross model. In both panels, open symbols represent experimental data including error bars.
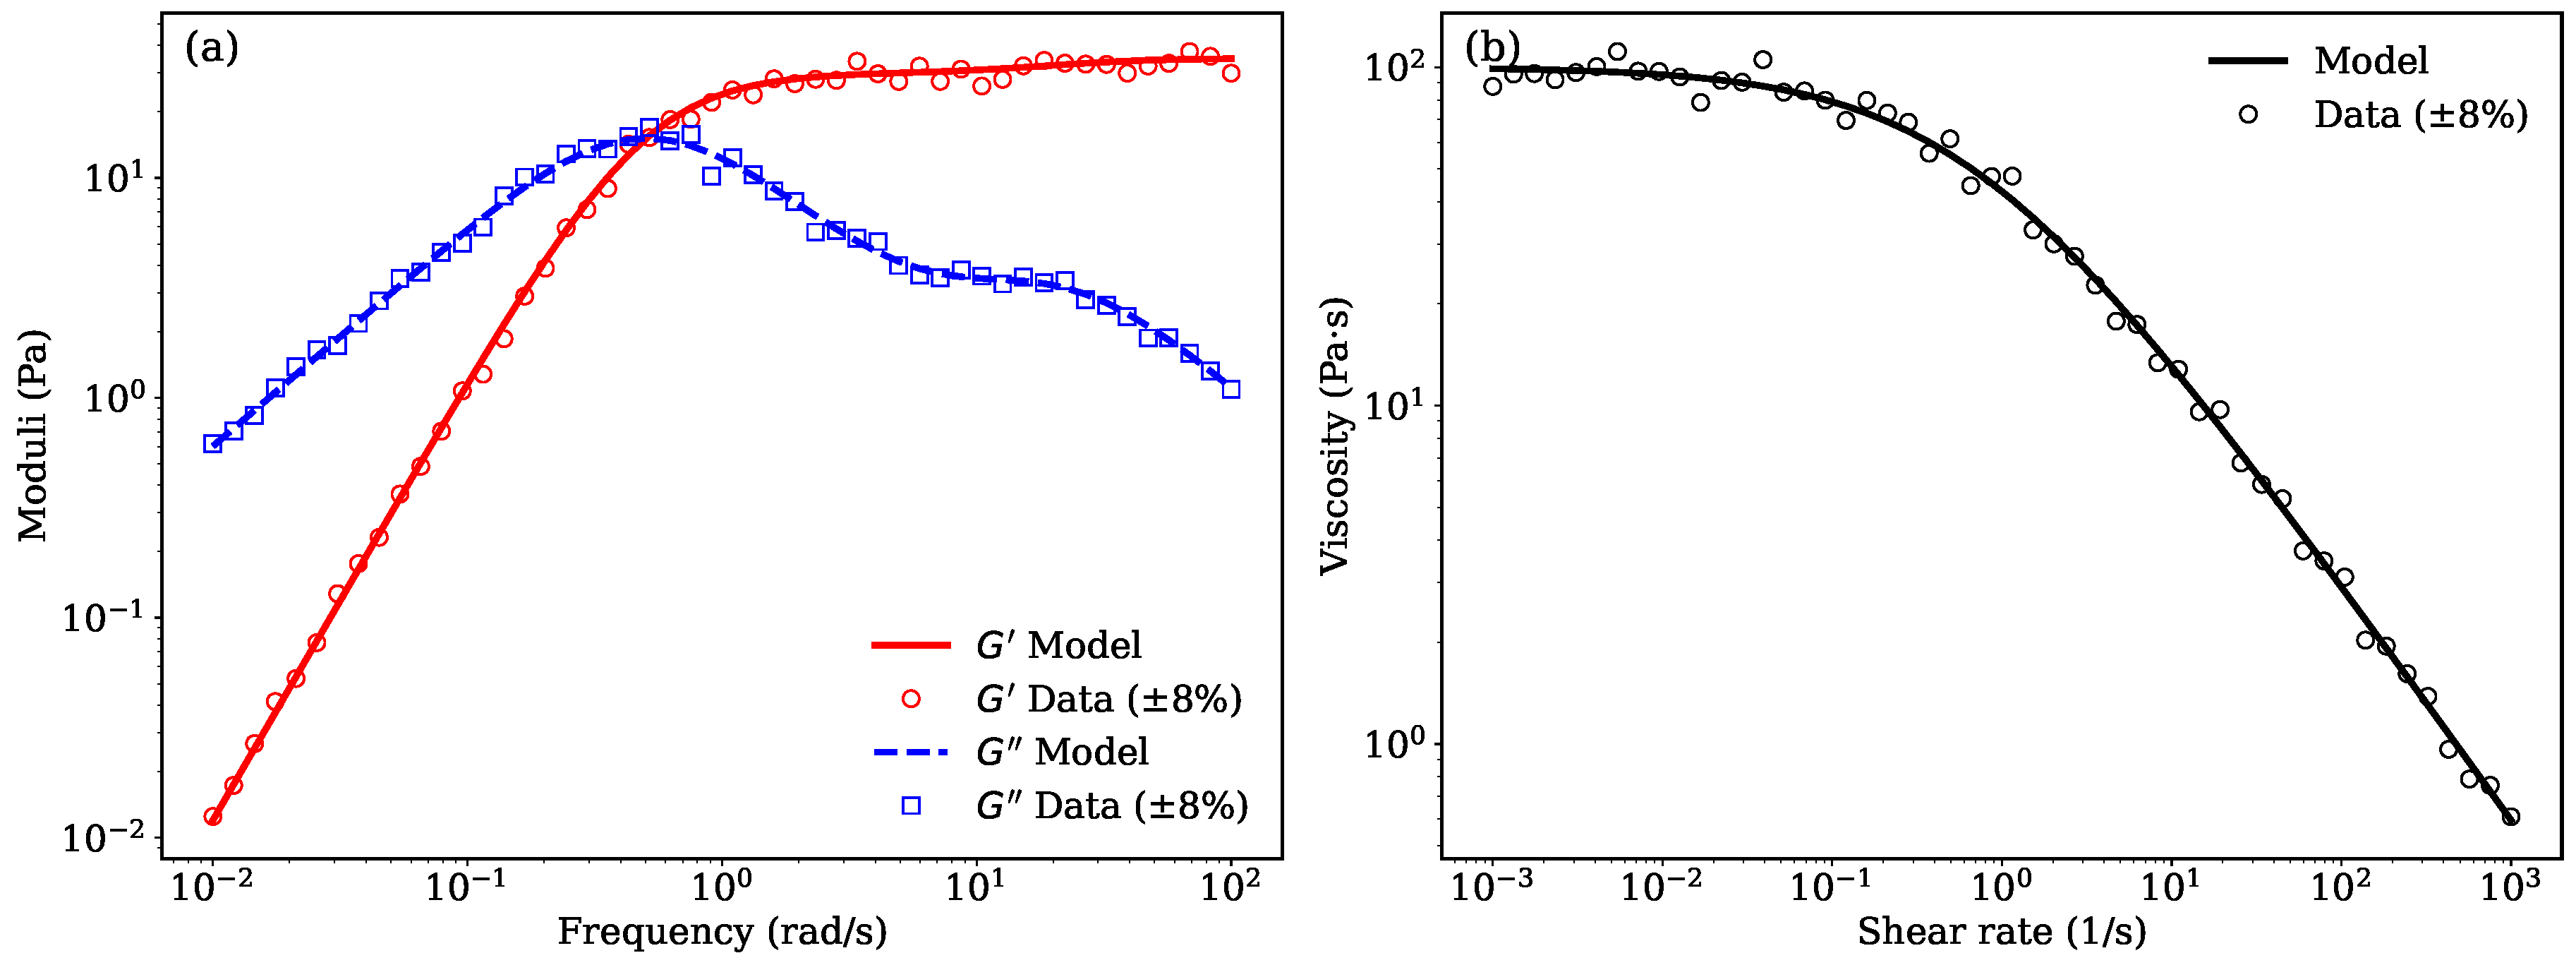
Figure 4.
Rheological properties of the self-emulsifying ointment system, Emulsion 1. (a) Flow curves displaying shear stress as a function of shear rate for increasing (solid red) and decreasing (dashed blue) ramps, including experimental data. The yield stress, indicated by the horizontal dotted line, demonstrates the critical stress threshold required for flow initiation. (b) Apparent viscosity hysteresis loops showing viscosity versus shear rate during the upward and downward ramps, illustrating the time-dependent breakdown and recovery of the material’s internal structure.
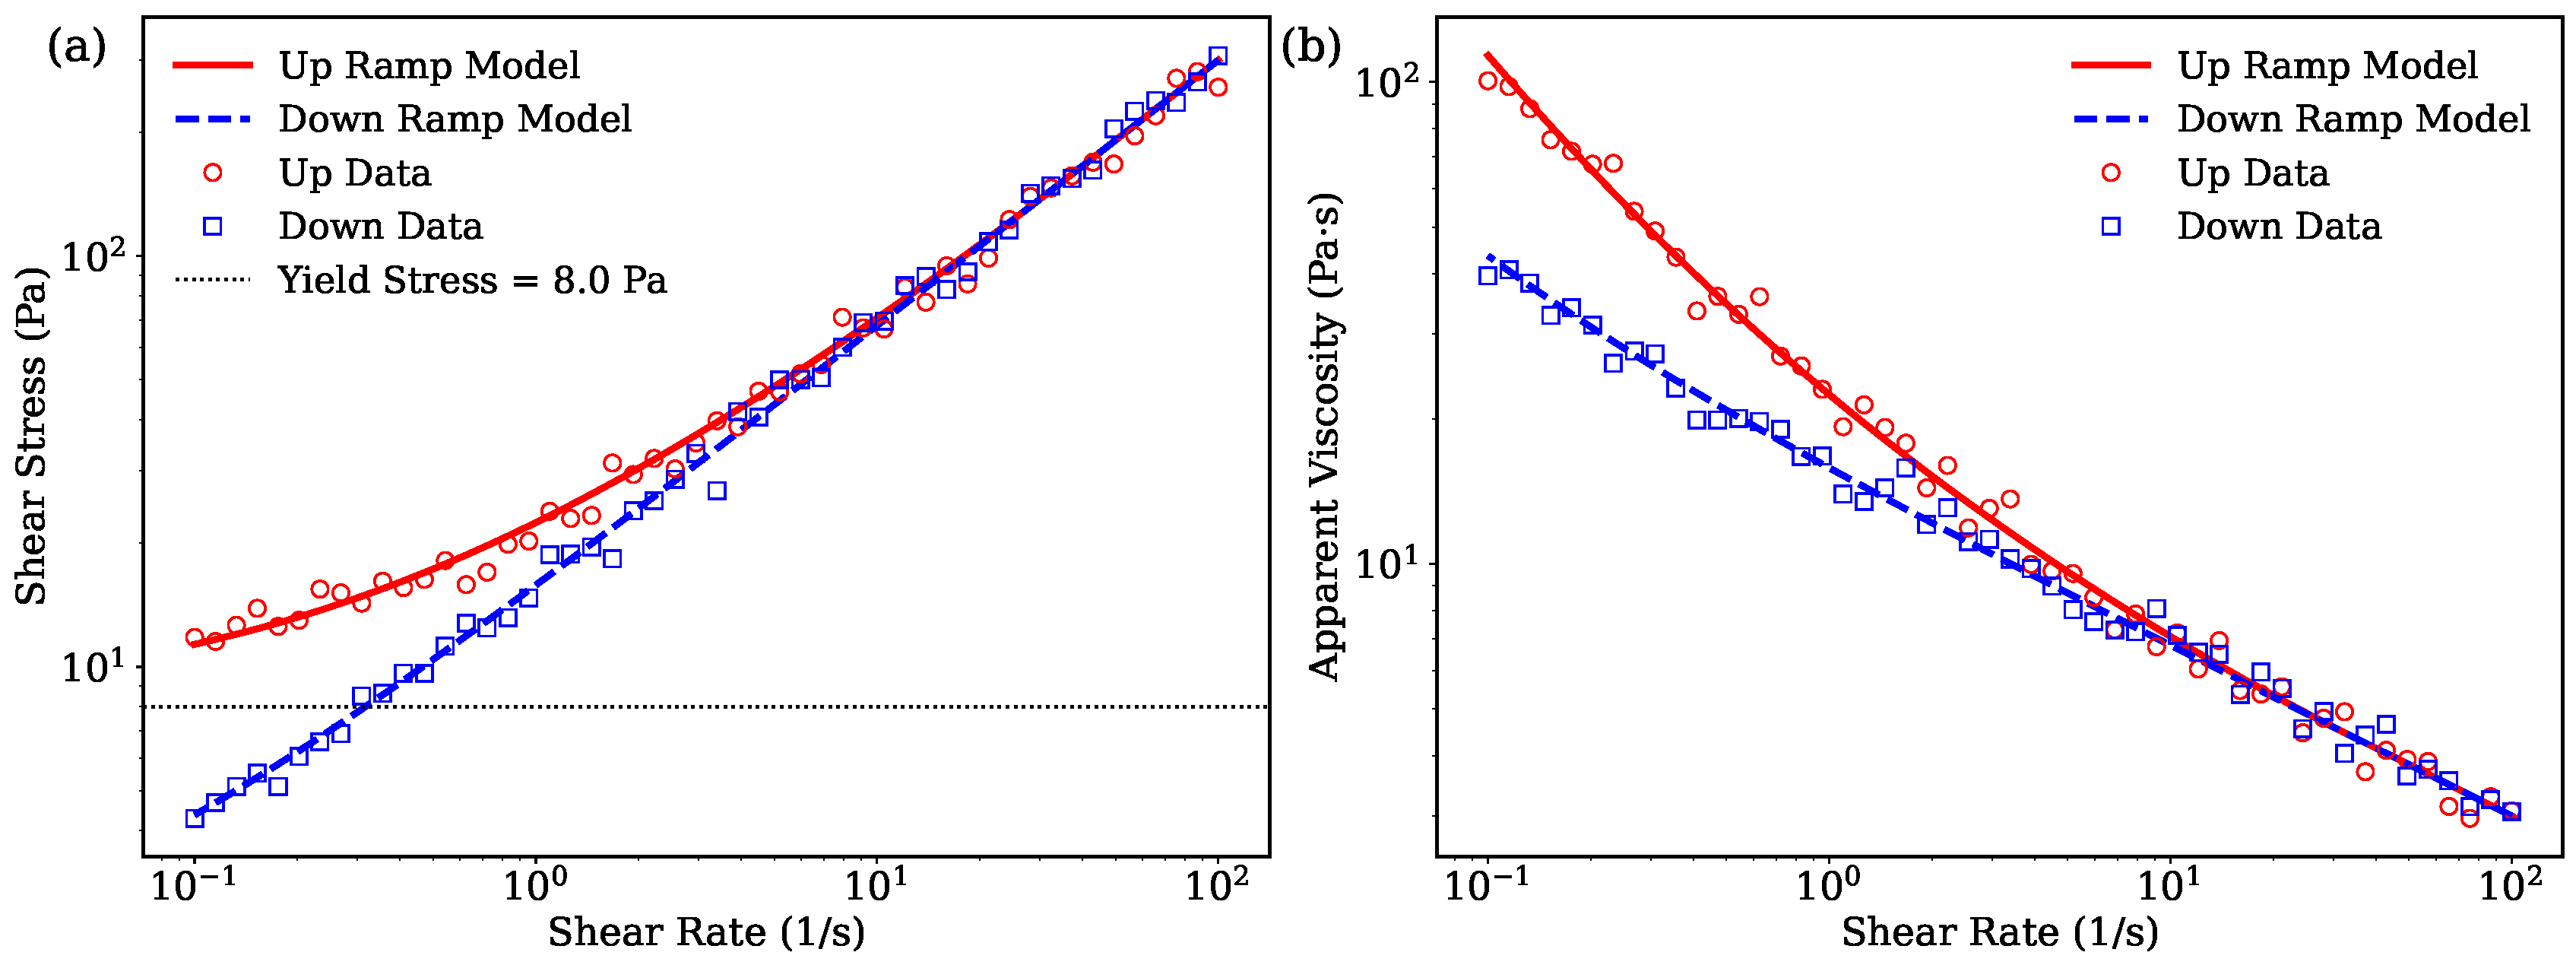
Figure 5.
Drug release profiles comparing original emulsion (blue circles, solid fit line) and gently mixed system (orange squares, dashed fit line). Error bars represent uncertainty range in measurements.
Figure 5.
Drug release profiles comparing original emulsion (blue circles, solid fit line) and gently mixed system (orange squares, dashed fit line). Error bars represent uncertainty range in measurements.
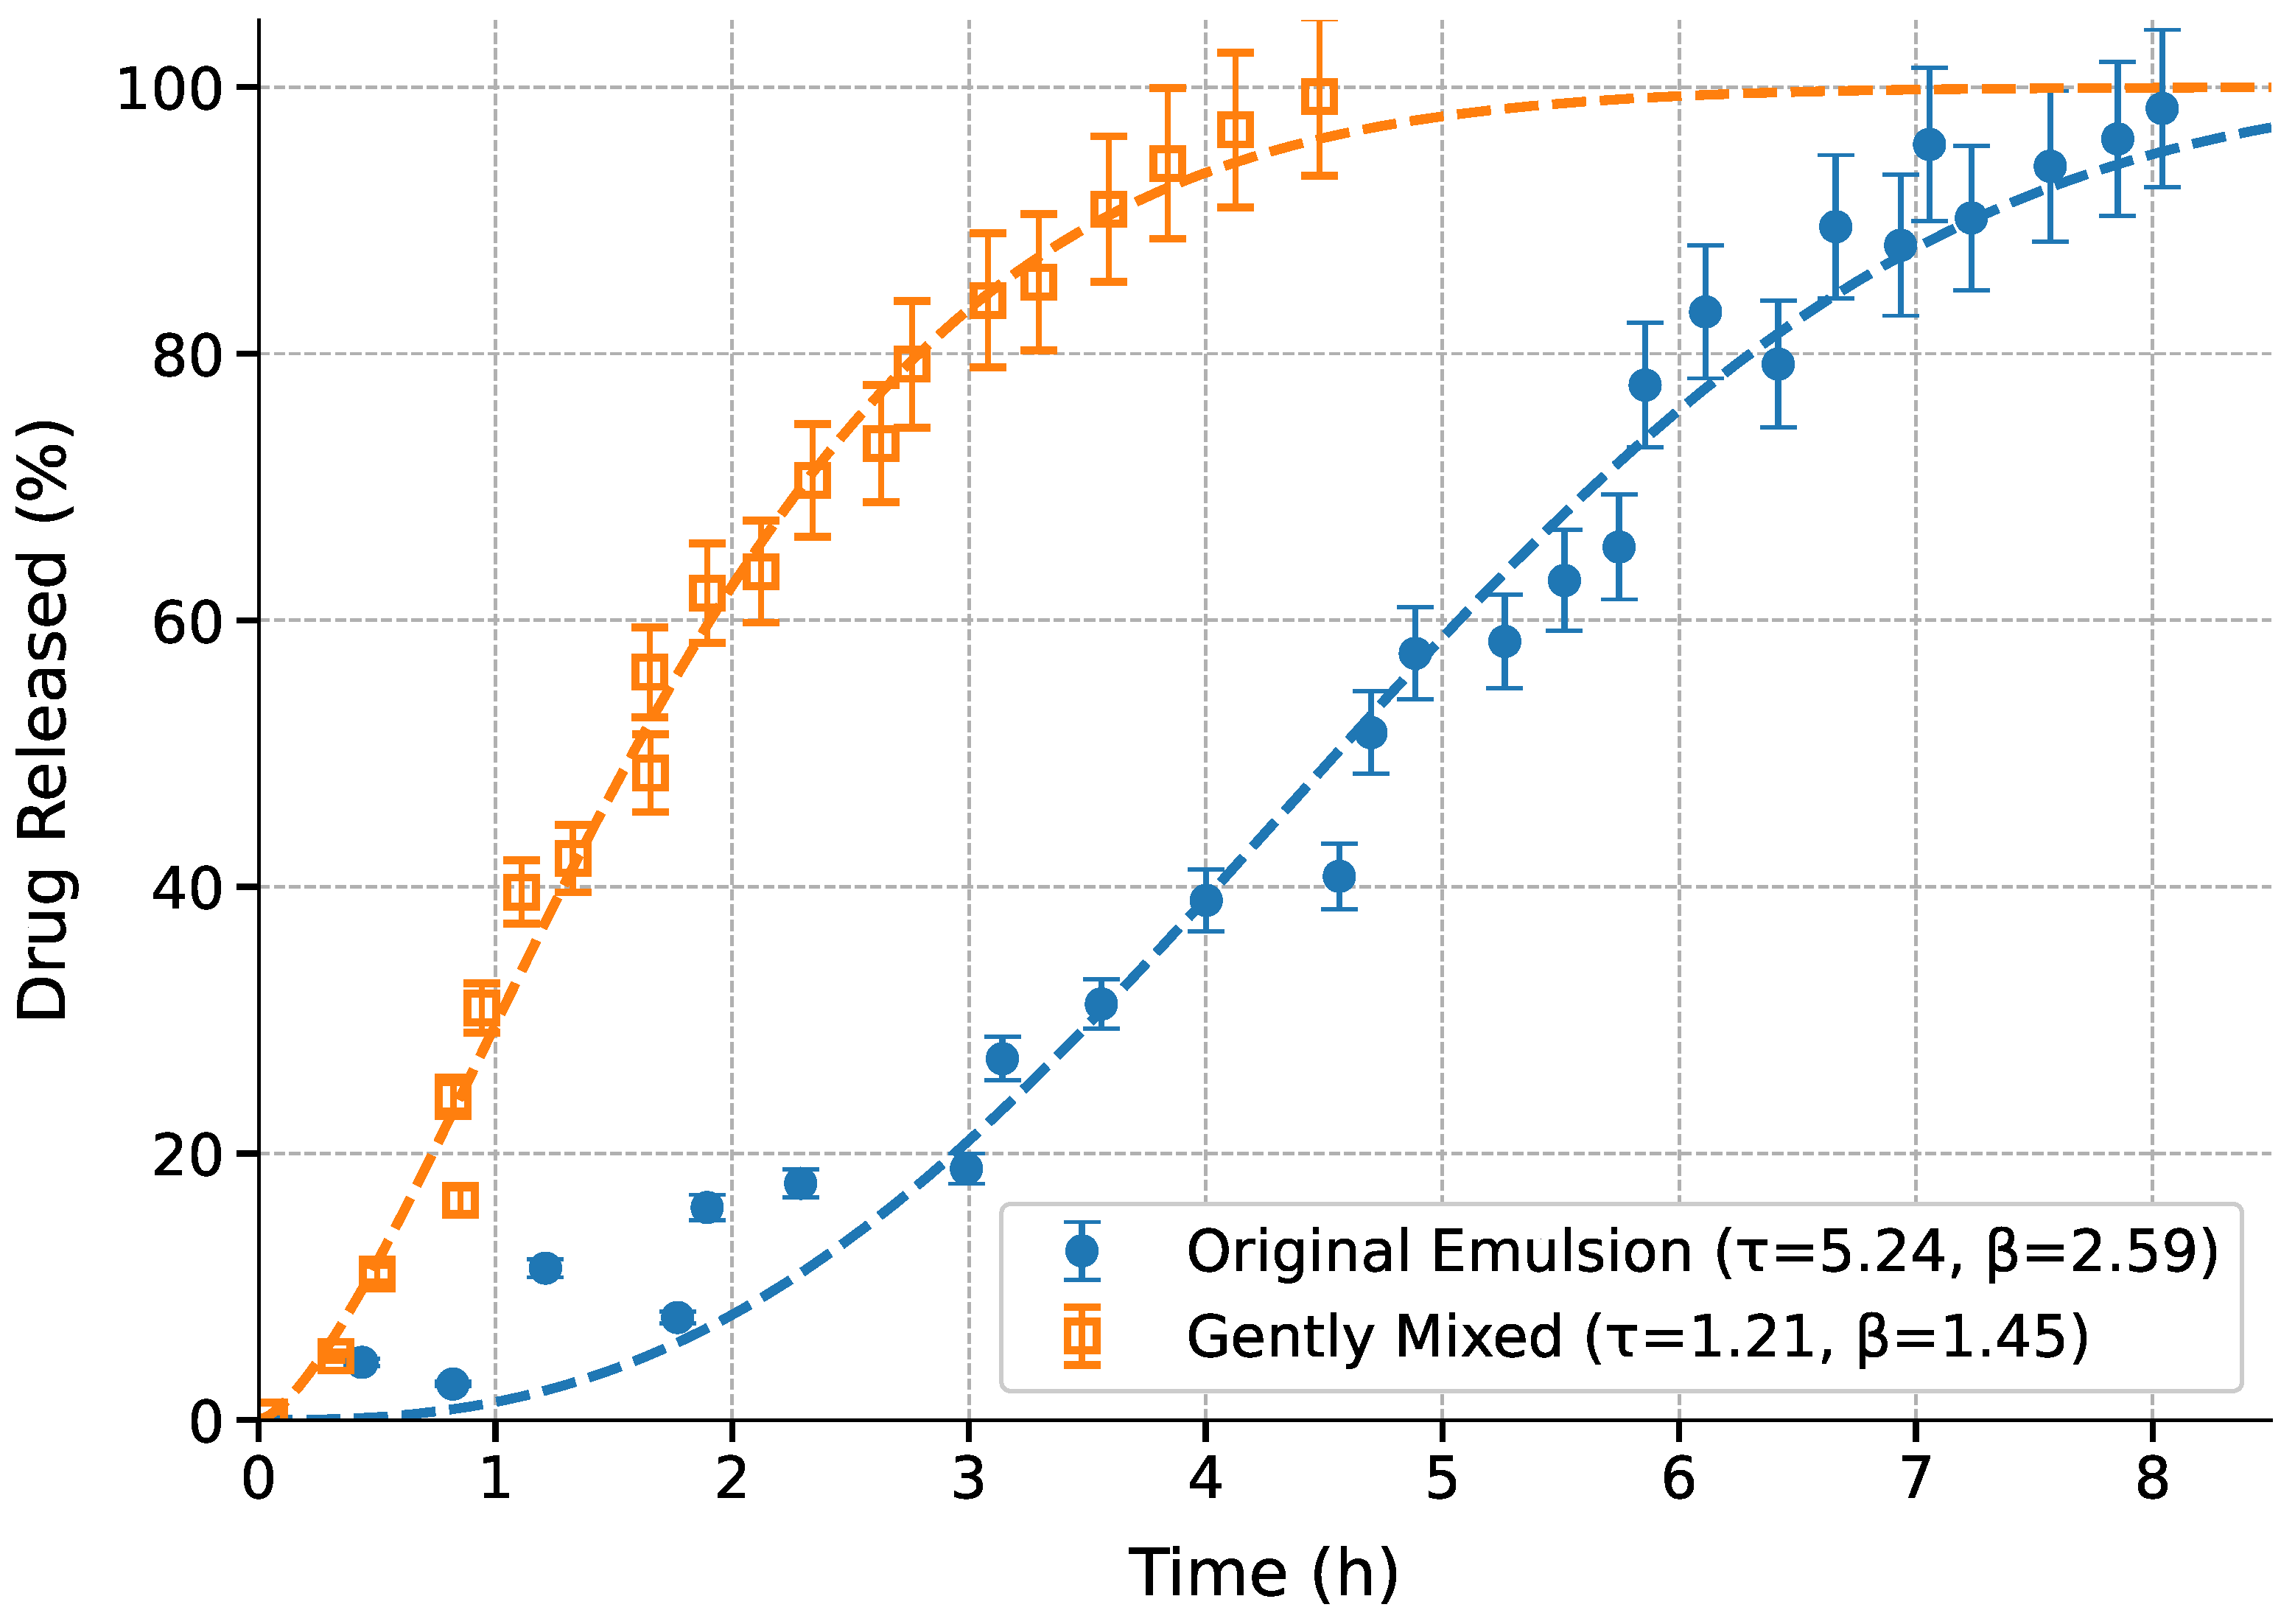
Figure 6.
Bacterial reduction data and fitted generalized logistic decay curves for four datasets: Control 1 (no antibacterials, blue circles), Control 2 (benzyl alcohol + phenylethanol, no essential oil, green circles), No Mixing (black circles), and Gentle Mixing (red circles). Mixing cases are done with Emulsion 1. Solid and dashed lines represent the fitted models, with error bars. The model effectively captures minimal reduction in Control 1, gradual decline in Control 2, and rapid declines with plateaus in No Mixing and Gentle Mixing.
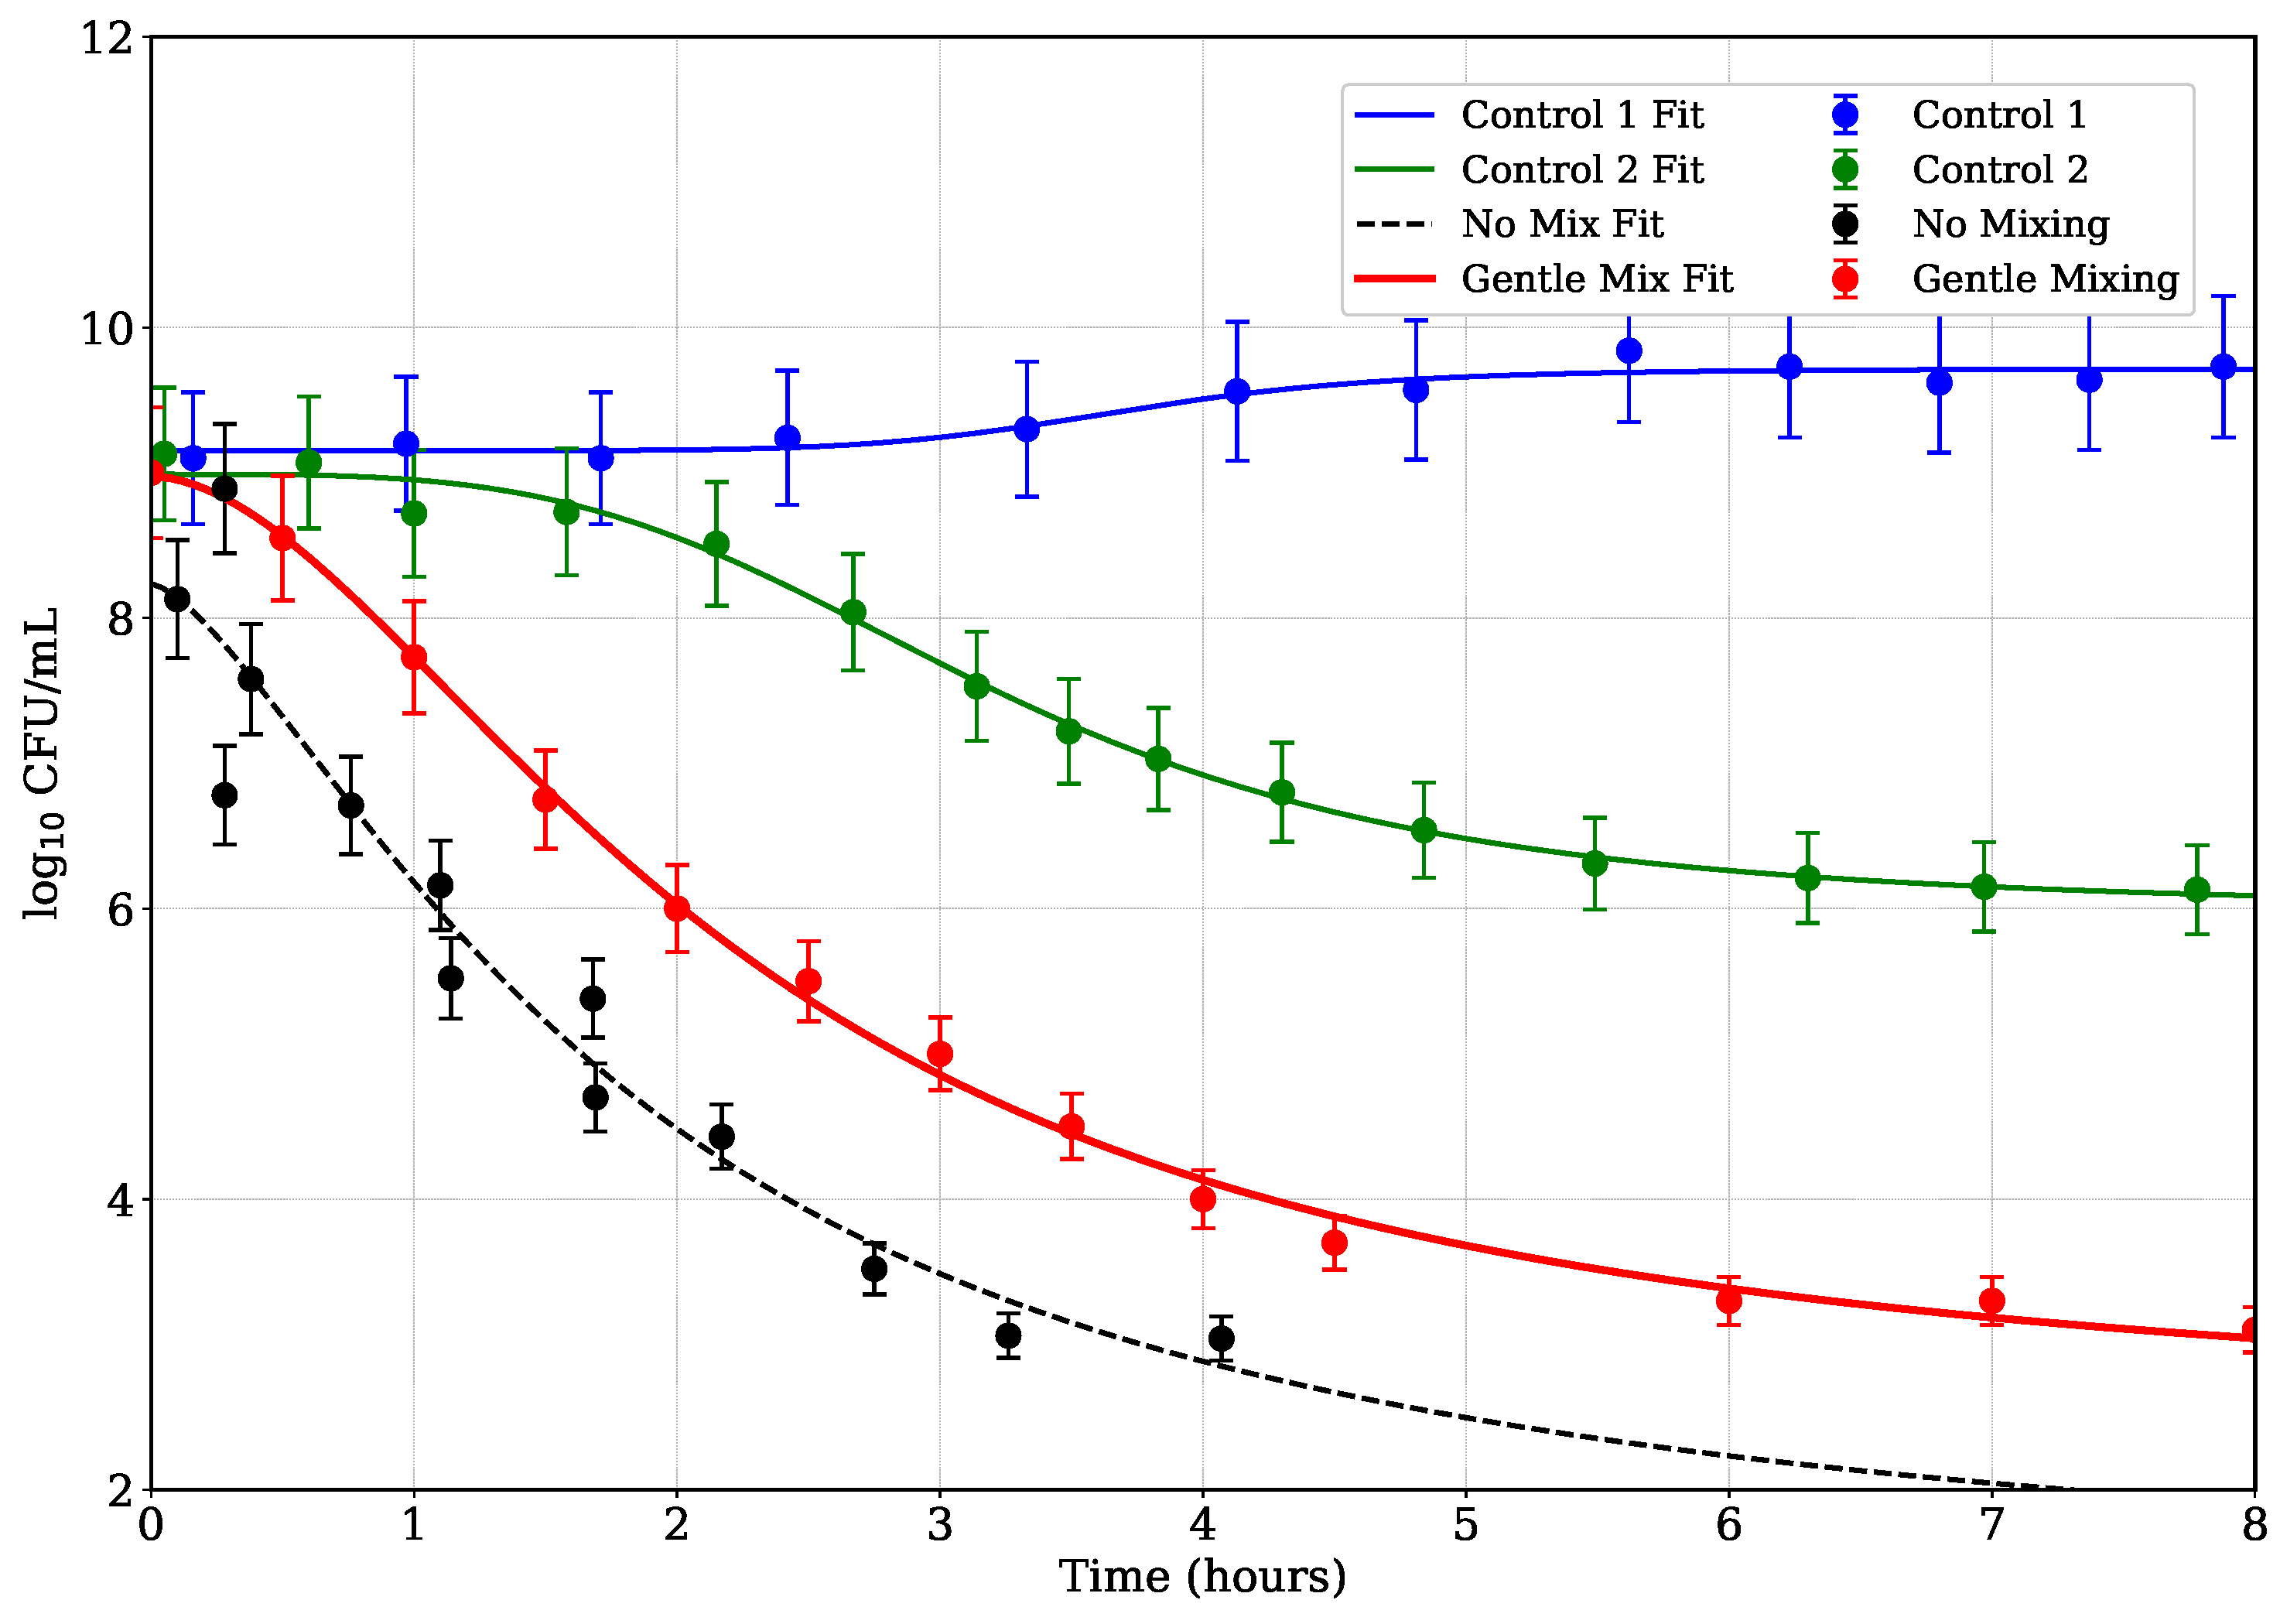
Figure 7.
Optical density (OD600) profiles of lactic acid bacteria (LAB) cultures over time under four different treatment conditions: (i) Control 1 – bacteria in nutrient medium without any antibacterial agent (blue markers), (ii) Control 2 – bacteria exposed to benzyl alcohol and phenylethanol emulsion without essential oil (green markers), (iii) Lavender oil emulsion prepared without mechanical mixing (red markers), and (iv) Lavender oil emulsion prepared with high-shear mixing (magenta markers). Error bars represent variability based on replicate measurements. Solid lines indicate the logistic decay model fits to the experimental data.
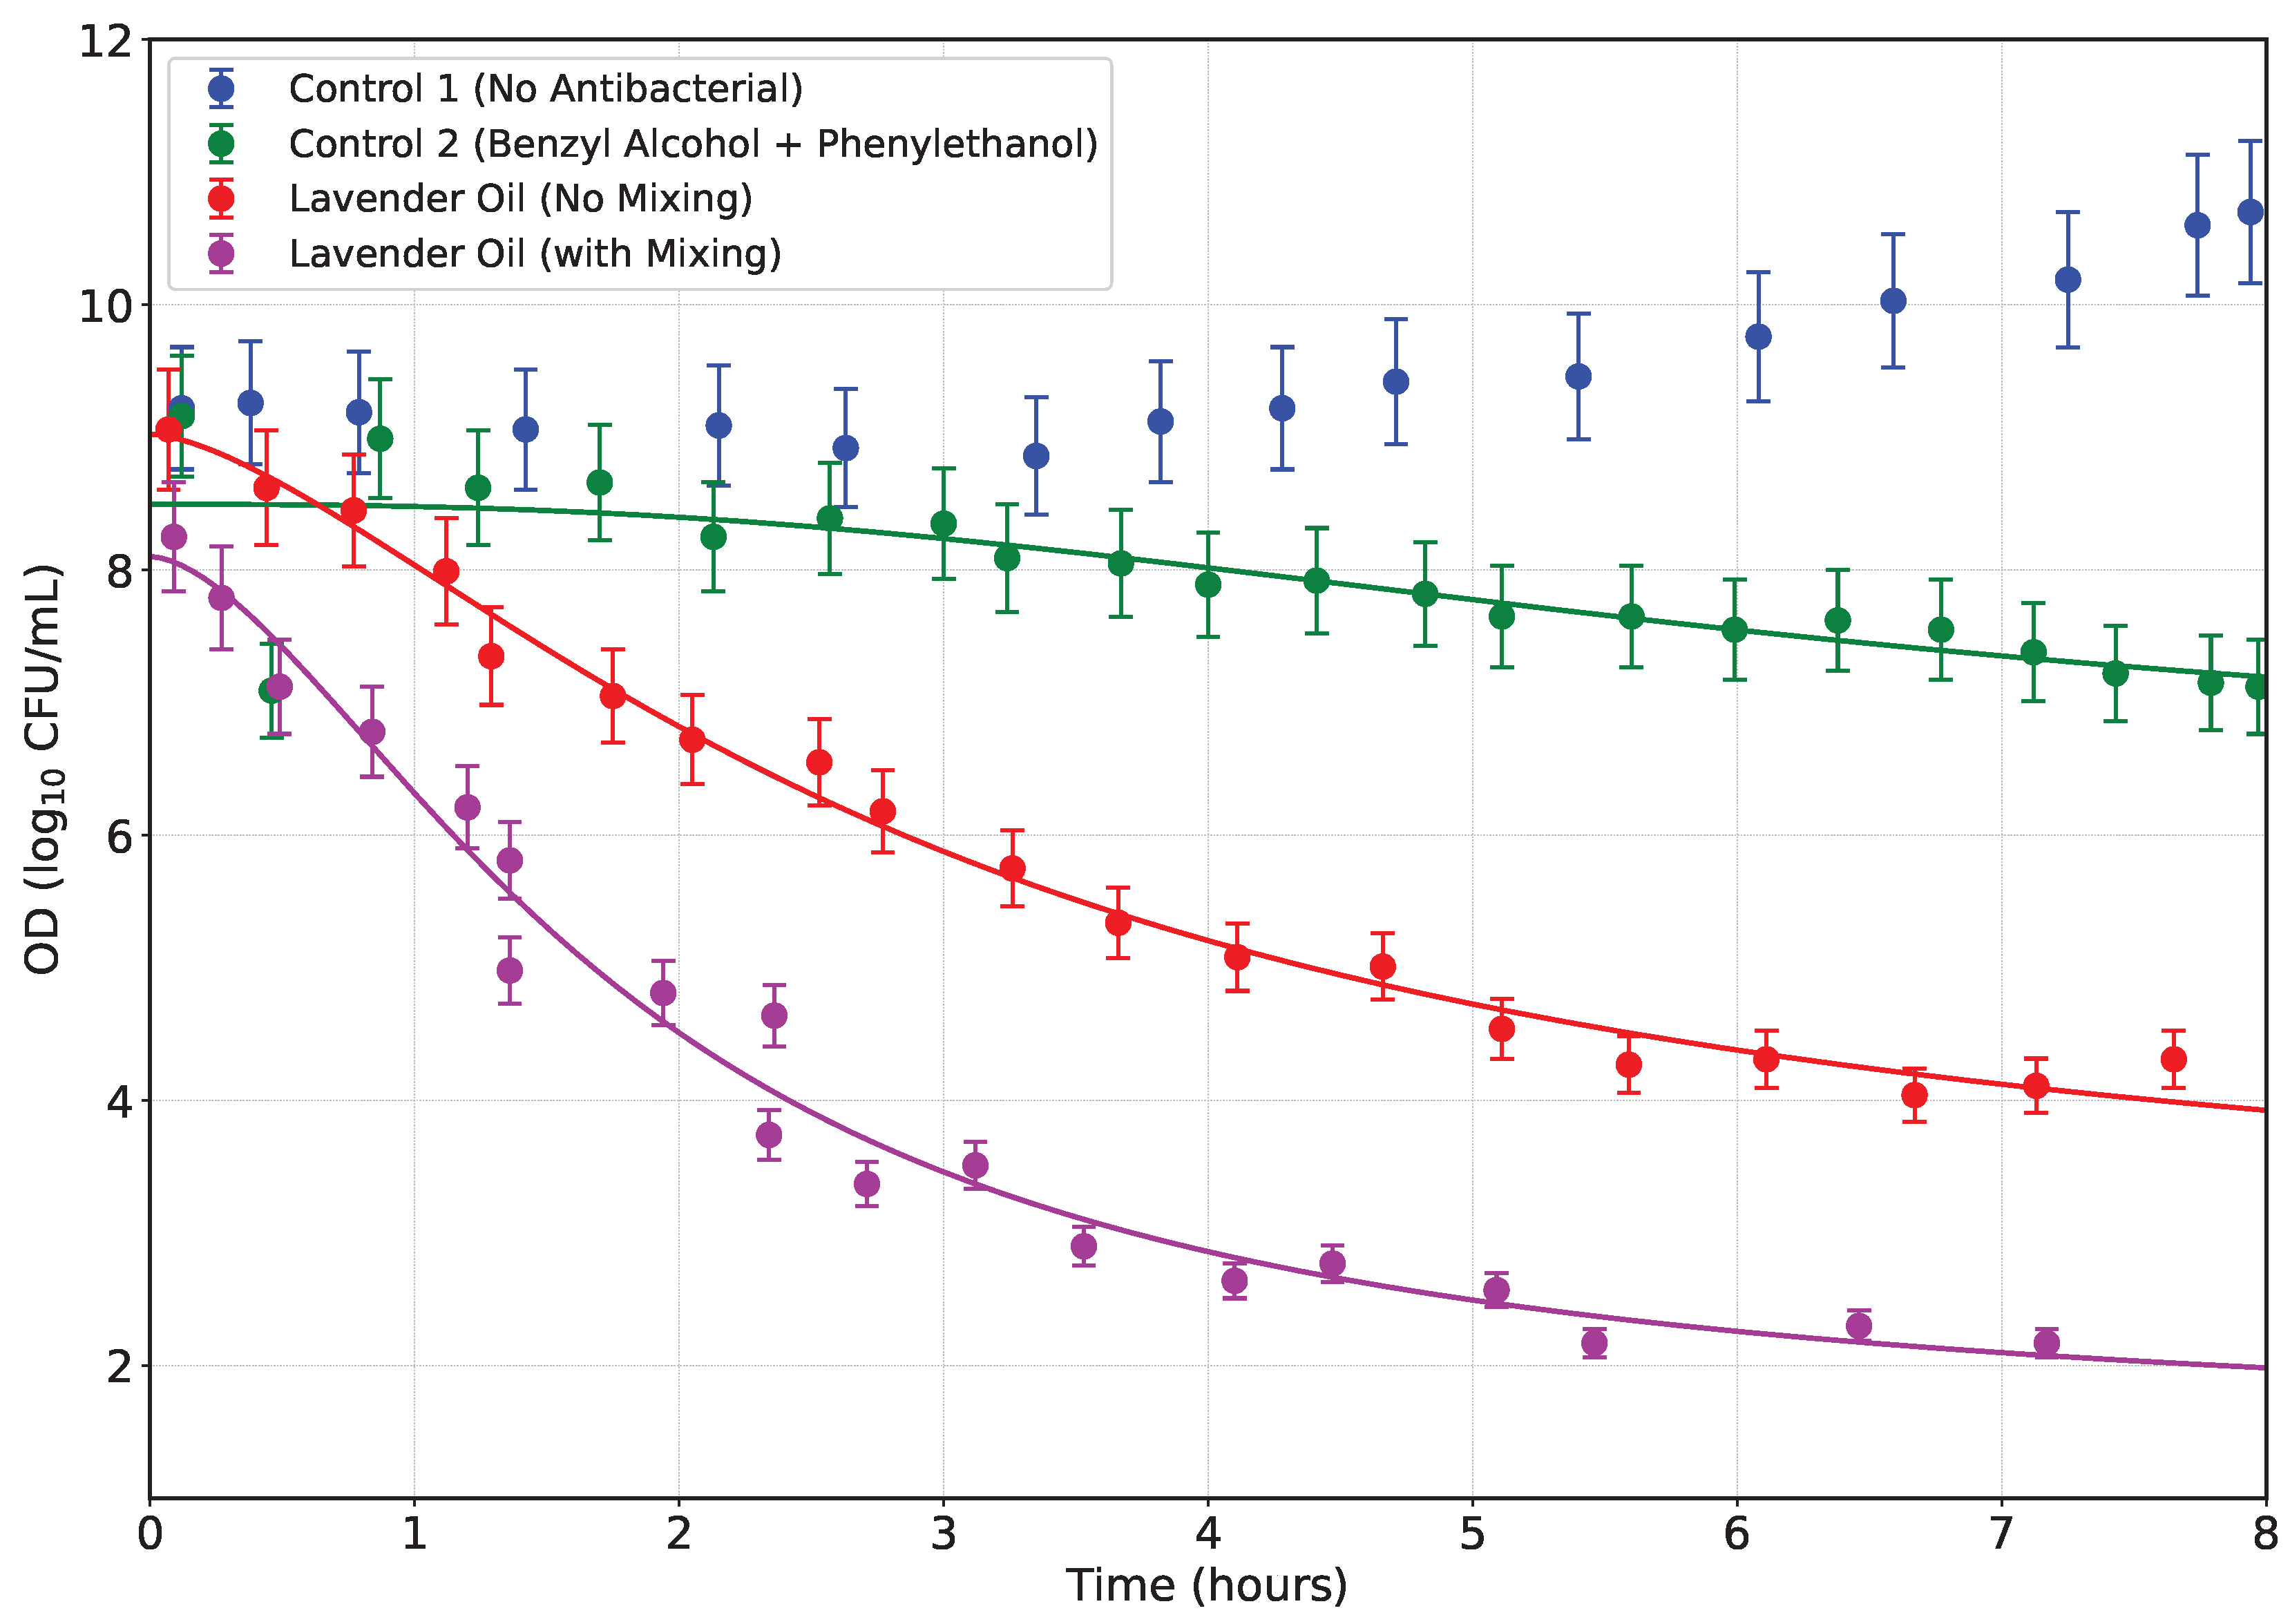

Table 1.
Composition of Emulsions (All components in %).
| Emulsion ID |
Triethyl Citrate |
Triacetin | Benzyl Alcohol |
Phenylethanol | Lavender Oil |
|---|---|---|---|---|---|
| 1 | 6.0 | 6.0 | 2.0 | 2.0 | 1.0 |
| 2 | 6.0 | 6.0 | 0.0 | 0.0 | 1.0 |
| 3 | 6.0 | 6.0 | 2.0 | 2.0 | 0.0 |
Table 2.
Fitted model parameters for conductivity reduction during oil-in-water emulsification using mechanical mixing and homogenization.
Table 2.
Fitted model parameters for conductivity reduction during oil-in-water emulsification using mechanical mixing and homogenization.
| Parameter | Unit | Mechanical Mixing | Homogenizer |
|---|---|---|---|
| A | S/cm | 450.95 | 419.87 |
| B | hr−1 | 0.2707 | 0.6539 |
| C | S/(cmhr) | 5.2438 | 3.0758 |
| D | S/cm | -36.26 | -6.65 |
Table 3.
Model fitting results for original emulsion system.
| Model | Parameters | RMSE (%) | AIC | |
|---|---|---|---|---|
| Weibull | , | 0.985 | 4.56 | 112.3 |
| Korsmeyer-Peppas | , | 0.963 | 6.82 | 125.7 |
| Higuchi | 0.932 | 8.91 | 138.2 | |
| First-order | 0.876 | 11.34 | 152.9 |
Table 4.
Model fitting results for gently mixed system.
| Model | Parameters | RMSE (%) | AIC | |
|---|---|---|---|---|
| Weibull | , | 0.997 | 1.52 | 89.5 |
| Korsmeyer-Peppas | , | 0.993 | 2.89 | 98.3 |
| Higuchi | 0.962 | 5.12 | 115.6 | |
| First-order | 0.945 | 6.24 | 122.8 |
Table 5.
Minimum Inhibitory Concentration (MIC) and Minimum Bactericidal Concentration (MBC) of emulsions containing different non-aqueous phase ingredients against E. coli and LAB.
Table 5.
Minimum Inhibitory Concentration (MIC) and Minimum Bactericidal Concentration (MBC) of emulsions containing different non-aqueous phase ingredients against E. coli and LAB.
| Bacteria | Triethyl Citrate (%) | Triacetin (%) | Benzyl Alcohol (%) | Phenyl ethanol (%) | MIC (%) | MBC (%) |
|---|---|---|---|---|---|---|
| E. coli | 6.0 | 6.0 | 2.0 | 2.0 | 0.35 | 0.85 |
| E. coli | 6.0 | 6.0 | 0.0 | 0.0 | 0.60 | 1.00 |
| LAB | 6.0 | 6.0 | 2.0 | 2.0 | 0.55 | 0.95 |
| LAB | 6.0 | 6.0 | 0.0 | 0.0 | 0.75 | 1.50 |
Disclaimer/Publisher’s Note: The statements, opinions and data contained in all publications are solely those of the individual author(s) and contributor(s) and not of MDPI and/or the editor(s). MDPI and/or the editor(s) disclaim responsibility for any injury to people or property resulting from any ideas, methods, instructions or products referred to in the content. |
© 2025 by the authors. Licensee MDPI, Basel, Switzerland. This article is an open access article distributed under the terms and conditions of the Creative Commons Attribution (CC BY) license (http://creativecommons.org/licenses/by/4.0/).
Copyright: This open access article is published under a Creative Commons CC BY 4.0 license, which permit the free download, distribution, and reuse, provided that the author and preprint are cited in any reuse.


