
Submitted:
31 March 2025
Posted:
01 April 2025
You are already at the latest version
Abstract
This study investigates the Quality by Design-driven development and optimization of a nanoemulgel incorporating Kunzea ericoides oil for transdermal therapy. Nanoemulgels enhance percutaneous drug delivery, sustain release profiles, and improve bioavailability. A Central Composite Design was employed to optimize critical formulation parameters, with ANOVA confirming a statistically significant impact on particle size and drug release kinetics (p < 0.05). The optimized formulation exhibited a particle size of 112.38 nm, a polydispersity index of 0.203, and a zeta potential of -29.0 mV, ensuring colloidal stability. In vitro drug release followed the Higuchi model (R² = 0.989, kH = 4.776), indicating diffusion-controlled kinetics, while the Korsmeyer-Peppas model (n = 0.88) suggested an anomalous transport mechanism. Antibacterial studies determined minimum inhibitory concentrations of 250 µg/mL for Staphylococcus aureus and 500 µg/mL for Escherichia coli, indicating greater susceptibility in S. aureus. In vivo anti-inflammatory evaluation using a carrageenan-induced paw edema model demonstrated a statistically significant reduction in inflammation (p = 0.005 at 60 min), with near-complete resolution by 240 min. These findings underscore the potential of Kunzea ericoides nanoemulgel as a promising transdermal therapeutic, integrating controlled drug release with potent anti-inflammatory and antibacterial properties for dermatological and inflammatory conditions.
Keywords:
quality by design
; nanoemulgel
; Kunzea ericoides
; transdermal delivery
; anti-inflammatory
; antibacterial
; drug release kinetics
; Central Composite Design
1. Introduction
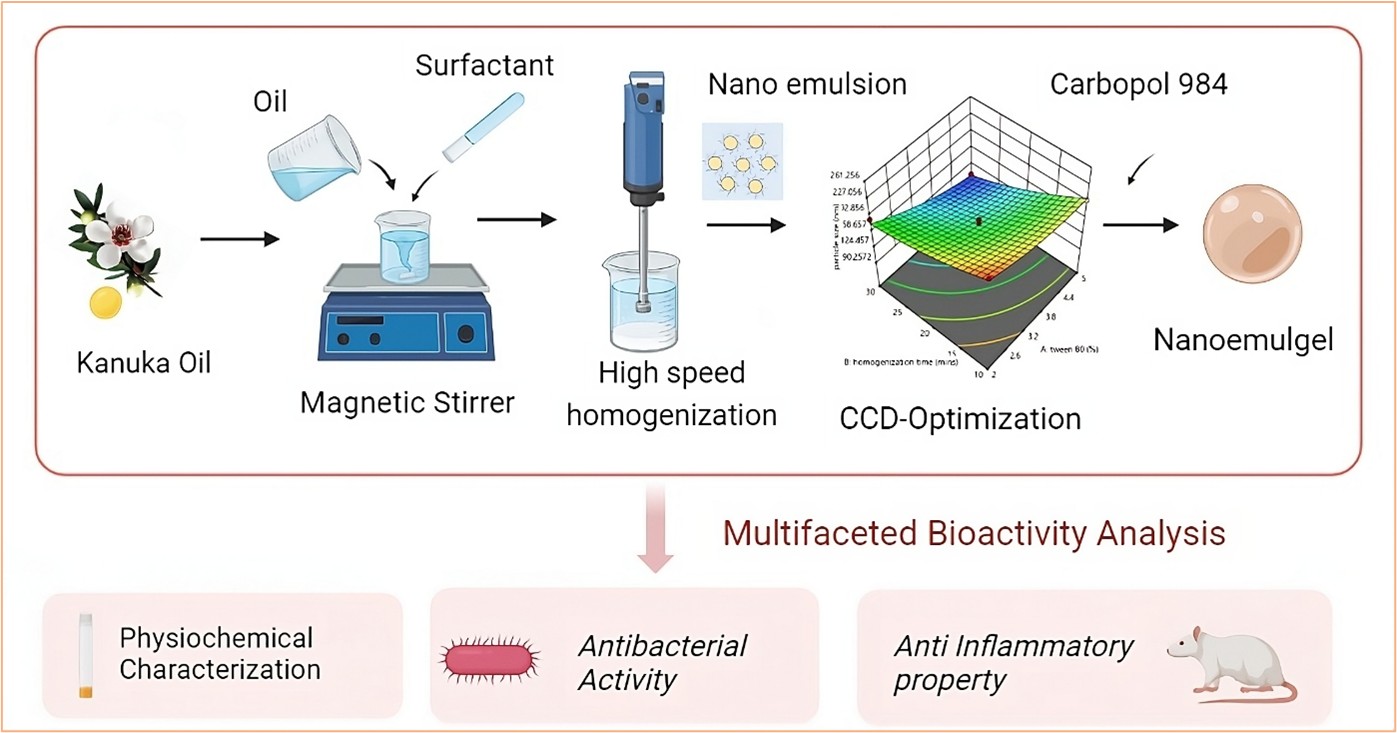
The protective function of the skin is often compromised by environmental stressors, intrinsic aging, and pathological conditions, leading to oxidative stress, inflammation, and impaired tissue repair mechanisms [1]. Among these factors, ultraviolet (UV) radiation induces reactive oxygen species (ROS) generation, triggering lipid peroxidation, DNA damage, and mitochondrial dysfunction, which contribute to photoaging and inflammatory disorders. Chronic skin conditions such as acne, eczema, and psoriasis further disrupt the epidermal barrier, alter cutaneous microbiota, and exacerbate inflammatory responses, diminishing the skin’s regenerative capacity [2]. Natural bioactive compounds with anti-inflammatory, antimicrobial, and antioxidant properties are increasingly explored for skin repair and protection. Kunzea ericoides oil (Kanuka oil) exhibits antibacterial, wound-healing, and free radical-scavenging properties. However, its clinical application is limited by po or solubility, instability, and inadequate skin penetration [3]. To overcome these challenges, nanoemulsions (NEs) offer an advanced drug delivery approach, improving solubility, enhancing skin permeation, and enabling controlled drug release. Incorporating NEs into a gel matrix (nanoemulgel) enhances viscosity, prolongs skin retention, and optimizes therapeutic efficacy for transdermal applications [4]. This study aims to develop and optimize a Kanuka-loaded nanoemulgel using the Quality by Design (QbD) approach, employing Central Composite Design (CCD) to assess the impact of formulation parameters on stability, drug release, and therapeutic performance. The optimized formulation was subjected to physicochemical characterization, in vitro drug release studies, antibacterial assessment, and in vivo anti-inflammatory evaluation using the carrageenan-induced hind paw edema model in Wistar rats. The findings support the potential of Kanuka nanoemulgel as a transdermal therapeutic system with sustained drug release and dual antibacterial-anti-inflammatory activity for dermatological applications.
2. Results and Discussion
2.1. FT-IR Analysis of Kanuka Oil
The IR spectrum of Kanuka oil exhibits characteristic peaks corresponding to various functional groups, confirming its complex chemical composition. FTIR analysis was conducted using a Bruker ALPHA II FTIR spectrometer equipped with an attenuated total reflectance (ATR) accessory. The spectrum was recorded over the wavenumber range of 4000–400 cm−1, at a resolution of 4 cm−1, averaging 32 scans to ensure spectral accuracy (Figure 1). A broad absorption band at 3738.27 cm−1 corresponds to free hydroxyl (O–H) stretching, indicative of phenols and alcohols. Peaks at 2951.18, 2927.57, and 2727.26 cm−1 correspond to C–H stretching vibrations, suggesting the presence of alkane chains and saturated hydrocarbons. The intense C=O stretching bands at 1735.18 and 1650.78 cm−1 suggest the presence of esters and ketones, which are common constituents of essential oils and may contribute to their fragrance and stability. Further evidence of alkane structures is supported by C–H bending peaks at 1448.81 and 1322.20 cm−1. Strong absorption bands at 1123.89 and 1102.64 cm−1 correspond to C–O stretching, indicating ether or alcohol functionalities.
Additionally, peaks at 1027.69, 787.17, and 882.51 cm−1 suggest C=C bending, confirming the presence of aromatic rings, likely representing monoterpenes and sesquiterpenes. The fingerprint region, with peaks at 531.52 and 449.52 cm−1, provides unique spectral characteristics specific to Kanuka oil. The functional group assignments corresponding to the observed peaks are summarized in Table 1, which provides the accepted wavenumber ranges for each functional group. These findings confirm the presence of bioactive monoterpenes, sesquiterpenes, esters, and alcohols, validating the chemical integrity of Kanuka oil for formulation studies.
2.2. Preparation and Optimization of Kanuka Nanoemulsions
Nanoemulsions were optimized according to the predefined criteria levels and specific HLB value, with droplet size as the response parameter. Table 2 provides an overview of the experimental design matrix and the corresponding observed results. It was noticed that the particle size of the formulation is significantly influenced by Tween 80 concentration (Factor 1) and homogenization time (Factor 2). From the experimental data, the smallest particle size (100.65 nm) was observed when Tween 80 was at its center level (X1 = 0) and homogenization time was at its highest axial level (X2 = A). This indicates that increasing homogenization time enhances particle size reduction, likely due to greater shear forces breaking down droplet size more effectively. In contrast, the largest particle size (184.9 nm) was obtained at the lowest levels of both factors (X1 = −, X2 = −), suggesting that insufficient surfactant leads to poor emulsification, while shorter homogenization time results in inadequate particle size reduction.
Additionally, excessive Tween 80 did not significantly reduce particle size further, implying that an optimal concentration is necessary to stabilize the formulation without excessive micelle formation. Thus, to achieve a minimum particle size, a combination of moderate Tween 80 concentration and higher homogenization time is recommended. After data fitting, JMP software generated polynomial model equations for the primary factors and their interactions. the quadratic (second-order polynomial) model equation for particle size (PS) can be written in the standard form:
where X1 represents the Tween 80 concentration (2–6%), and X2 denotes the homogenization time (10–30 min) in coded values. The model suggests that both factors significantly influence particle size, with higher Tween 80 and increased homogenization time reducing droplet size. However, a quadratic effect for Tween 80 indicates an optimal concentration beyond which further addition may not enhance emulsification. The ANOVA analysis (Table 3) demonstrates that the model is statistically valid (p=0.0092), indicating that Tween 80 concentration and homogenization time have a strong influence on particle size reduction. The model explains 84.62% of the variation in particle size (R2=0.8462), and the adjusted R2 value of 0.7942 accounts for predictor adjustments, confirming a good fit. Among the individual factors, Tween 80 (p=0.0426) and homogenization time (p=0.0013) significantly reduce particle size. The quadratic term for Tween 80 (p=0.0509) suggests a non-linear effect, while the homogenization time squared term was not significant (p=0.4027), indicating a more linear influence.
PS=122.68−10.43X1−21.67X2−0.31X1X2+10.64X12+4.03X22
The interaction effect between Tween 80 and homogenization time was also insignificant (p=0.96), suggesting they work independently. Overall, the model provides a reliable predictive framework for optimizing particle size in nanoemulsions. The significance of the factors identified through ANOVA is further illustrated by the half-normal plot, which visually represents the impact of individual factors and their interactions on particle size (Figure 2).
The half-normal plot illustrates the impact of various factors on particle size. Factors like homogenization time (10,30) and Tween 80 (2,6), which are far above the blue line, are the most significant contributors to particle size reduction. The quadratic term of Tween 80 lies closer to the blue line, indicating a minor non-linear effect, while factors near or below the red line are statistically insignificant and have minimal influence. This emphasizes that the most impactful factors deviate significantly above the blue line, confirming their critical role in particle size optimization. The zeta potential values, as presented in the Table 2, provide critical insight into the stability of the formulations. Zeta potential ranges from -16.9 mV to -31.5 mV, with higher absolute values indicating greater electrostatic repulsion and improved colloidal stability.
The most negative zeta potential of -31.5 mV is observed at high levels of homogenization time (A), suggesting that increased homogenization time enhances particle stability. Conversely, the least negative value of -16.9 mV is observed at low levels of both Tween 80 (-) and homogenization time (-), indicating reduced stability under these conditions. Intermediate values of zeta potential are noted when Tween 80 or homogenization time is varied individually, highlighting their individual contributions to colloidal stability. Overall, the results suggest that optimizing both factors can significantly enhance particle stability, as indicated by more negative zeta potential values.
The 3D surface plots for particle size and zeta potential (Figure 3) depict the interactive effects of Tween 80 concentration and homogenization time on these critical response parameters. In the particle size plot, the color gradient transitions from red (larger particle size) to blue (smaller particle size), with the smallest sizes observed in the blue regions, indicating the optimal conditions for size reduction.
Similarly, the zeta potential plot shows a gradient from red (higher, less negative values) to blue (lower, more negative values), where more negative zeta potential (blue zones) signifies improved stability. The data points, represented as black markers, align closely with the surface in both plots, validating the predictive accuracy of the model. The particle size plot highlights conditions that minimize size, while the zeta potential plot emphasizes the structural stability. Together, these plots underscore the significance of balancing Tween 80 and homogenization time to achieve optimal particle size and stability, with the alignment of experimental data reinforcing the reliability of the model.
The optimal experimental conditions were identified using the prediction profiler (Figure 4), indicating a Tween 80 concentration of 5.01 and a homogenization time of 30 minutes. At these settings, the predicted particle size was 102.33 nm, with a confidence interval ranging from 86.07 nm to 118.58 nm, ensuring the reliability of the prediction. The zeta potential was predicted to be -29.88 mV, with a confidence interval of -31.99 mV to -27.75 mV, reflecting the stability of the colloidal system. The desirability score was 0.9758, highlighting the efficacy of the optimization approach in achieving the desired balance between particle size and zeta potential. These outputs confirm that robustness of the model and its ability to predict optimal conditions effectively.
2.3. Characterization Study of Kanuka-Loaded Nanoemulsions (K-NE)
To achieve a formulation with optimal characteristics, freshly prepared K-NEs were evaluated using various stability parameters. Over the course of 60 days under different thermal conditions, the formulations exhibited no signs of physical instability, such as visible creaming, phase separation, or significant changes in color and transparency. Additionally, the outcomes from heating-cooling and freeze-thaw cycles confirmed adequate thermodynamic stability, confirming the robustness of the Kanuka nanoemulsions under various conditions. Among the tested formulations, the one optimized through prediction profiles using CCD was selected for further studies, showing the best balance of stability and other desired characteristics.
2.4. Physicochemical Properties and Morphological Evaluation
The particle size analysis revealed an average diameter of 112.38 nm with a PDI of 0.203, Suggesting a consistent and well-distributed particle size and uniform dispersion. Zeta potential measurements recorded a value of -29.0 mV, suggesting good colloidal stability by preventing particle aggregation. Thermal stability assessments, including heating-cooling and freeze-thaw cycles, demonstrated stable thermodynamic properties with no phase separation, ensuring formulation robustness. SEM analysis showed a predominantly spherical morphology with a smooth surface texture, indicating uniform droplet formation. The absence of crystalline structures in the obtained micrographs confirms the amorphous nature of the formulation, which is crucial for enhancing solubility and bioavailability [5]. Furthermore, no visible aggregation or structural irregularities were observed, highlighting the excellent dispersion quality and physical stability of the nanoemulsion (Figure 5).
2.5. Entrapment Efficiency of Kanuka Nanoemulsion
A calibration curve for Kanuka oil was constructed within the concentration range of 1 to 15 µg/mL, demonstrating excellent linearity with a high correlation coefficient (R2 = 0.998). The LOD and LOQ were determined to be 0.45 µg/mL and 1.42 µg/mL, respectively, indicating the sensitivity and precision of the method. The Kanuka content in the optimized nanoemulsion formulation was measured at 98.12 ± 0.42% on the day of formulation preparation. Following 60 days of storage, the Kanuka content decreased to 92.87 ± 1.36%, indicating a retention rate of 94.65%, suggesting good stability over time. A well-balanced emulsifier system minimizes droplet fusion, stabilizing the nanoemulsion and resulting in a higher entrapment efficiency (EE%). The optimized K-NEs formulation exhibited an EE% of 96.78 ± 0.55%, confirming effective encapsulation and long-term stability.
2.6. Development and Characterization of Kanuka Nanoemulgel (K-NG)
The optimized K-NEs was incorporated into varying concentrations of Carbopol 940 to formulate K-NG. Among the tested formulations, Carbopol 940 (1% w/w) exhibited optimal physicochemical properties, including clarity, consistency, uniformity, and adequate adhesion strength, as confirmed by the Thumb Test over a 30-day evaluation period. Accelerated thermal stability tests shows that K-NG remained consistent, with no signs of phase separation, aggregation, or syneresis. Higher Carbopol concentrations resulted in greater stability during centrifugation cycles and improved adhesion strength, viscosity, and physical stability but slightly reduced spreadability and flow properties [6]. The pH of the developed K-NG formulation was 5.74 ± 0.09, remained stable with minimal variation over 30 days, ensuring safe and effective application with low risk of skin irritation. Overall, the K-NG exhibited desirable uniformity, physical appearance, spreadability, thermodynamic stability, well-distributed droplet size, and favorable surface properties, making it a promising candidate for topical applications.
2.7. In Vitro Drug Release and Diffusion Kinetics
The in vitro drug release profile of K-NG was evaluated and contrasted with K-NEs, n-EnKan Hydrogel, and n-EnKan. The cumulative drug release data over 360 minutes (Figure 6) indicated that K-NEs exhibited the highest drug release (89.3%), followed by K-NG (68.2%), n-EnKan (48.6%), and n-EnKan Hydrogel (28.7%). The drug release kinetics of Kanuka Nanoemulgel were analyzed using the Higuchi model, which describes drug diffusion from a matrix system [7]. A linear regression of cumulative drug release (Q) vs. sqrt t showed a high correlation (R2=0.989), with a Higuchi rate constant (kH) of 4.776. This indicates that the release mechanism is predominantly diffusion-controlled. Additionally, the Korsmeyer-Peppas model was applied, yielding an exponent (n = 0.88), suggesting an anomalous (non-Fickian) transport mechanism, where both diffusion and polymer relaxation (swelling/erosion) contribute to drug release [8].
Among the formulations, K-NG provided a sustained release profile, demonstrating its potential for prolonged therapeutic effects compared to K-NEs. The controlled release behavior is attributed to the gel matrix, which modulates the diffusion of the nanoemulsion, leading to a more extended-release period [9].
2.8. Evaluation of Antibacterial Activity
The antimicrobial activity of K-NG was evaluated against Staphylococcus aureus and Escherichia coli using the broth dilution method. The minimum inhibitory concentration (MIC) values demonstrated that S. aureus exhibited greater susceptibility (MIC = 250 µg/mL) compared to E. coli (MIC = 500 µg/mL). This indicates a pronounced antibacterial effect, with a stronger inhibition against Gram-positive bacteria. While the MIC values of K-NG were higher compared to conventional antibiotics, Kanuka oil is well known for its favorable safety profile and has demonstrated antimicrobial efficacy even at relatively high doses without toxic effects [10]. Given its topical application, the formulation remains within safe and effective concentration limits, making it a promising candidate for reducing bacterial bio-burden on the skin [11]. This suggests potential benefits in managing dermatological conditions such as acne, burns, and wounds susceptible to bacterial contamination. Additionally, the combined antibacterial and anti-inflammatory properties of K-NG could aid in wound healing, further supporting its therapeutic potential in infection control and skin care.
2.9. Evaluation of Dermal Response in the Acute Irritation Study
The acute dermal irritation potential of the K-NG was evaluated based on OECD guideline 404 using three groups of male Wistar rats (n = 3 per group). The irritation response was assessed at 1, 24, 48, and 72 hours post-application. The irritation scores, represented as median ± interquartile range (IQR), are summarized in Table 4. At 1 hour, the Kanuka nanoemulgel group exhibited mild redness (median score: 1.0 ± 0.5), which resolved completely within 24 hours, with no further irritation observed at later time points. In contrast, the positive control (Formalin) caused persistent erythema (median score: 2.0 ± 0.5) along with mild edema, which remained evident up to 72 hours, though with a gradual reduction in severity. The negative control (Blank Gel) did not induce any dermal reactions throughout the study. Statistical analysis using the Kruskal-Wallis test confirmed a significant difference (p < 0.05) between groups at all time points, indicating that the Kanuka nanoemulgel is significantly less irritating than Formalin and comparable to the negative control. These findings support the non-irritant nature of the Kanuka nanoemulgel, making it a promising candidate for dermatological applications.
2.10. In-Vivo Anti-Inflammatory Activity
Inflammation is a crucial defense mechanism of the immune system, protecting the host from various invading pathogens [12]. However, it often leads to distressing conditions such as redness, pain, and edema, significantly impacting the quality of life. Chronic inflammation is a primary reason for frequent physician visits, and while oral anti-inflammatory drugs are effective, their long-term use is associated with adverse effects [13]. To overcome these limitations, a topically applied transdermal formulation with enhanced patient compliance is desirable [14]. The in vivo anti-inflammatory activity of K-NG was evaluated using the carrageenan-induced hind paw edema method. The topical application of K-NG was compared with a negative control (blank nanoemulgel) and a positive control (Dicloran® gel 2.5%). The progression of paw edema was recorded at 0, 30, 60, 120, 240, and 360 minutes (Figure 7), and the reduction in inflammation was quantified at regular intervals. Paw volume was measured in milliliters (mL), and inhibition of edema (%) was calculated. Statistical analysis was performed using one-way ANOVA followed by the Tukey-Kramer post hoc test, with significance set at p < 0.05. The results demonstrated a significant reduction in paw edema (p < 0.05) in the K-NG-treated group compared to the control (Table 5). At 30 minutes, the positive control (Dicloran® gel) reduced paw edema volume to 0.30 ± 0.004 mL, while K-NG significantly decreased it further to 0.22 ± 0.003 mL. The inhibition of edema was 23.1% in the standard treatment group and 43.6% in the K-NG-treated group.
A statistically significant reduction was observed in the positive control compared to the control (p = 0.038). At 60 minutes, the positive control group showed 26.3% inhibition of edema, while K-NG demonstrated a highly significant reduction of 57.9% (p = 0.005). At 120 minutes, the K-NG-treated group exhibited a greater reduction in paw edema (0.08 ± 0.001 mL, 78.4% inhibition) compared to the standard (0.21 ± 0.002 mL, 43.2% inhibition), though the difference was not statistically significant (p = 0.089). By 240 minutes, the paw edema volume in the K-NG-treated group was 0.02 ± 0.001 mL, achieving 94.4% inhibition, while the positive control group had a volume of 0.07 ± 0.001 mL with 80.5% inhibition, demonstrating the potent anti-inflammatory effect of K-NG. By 360 minutes, both K-NG and Dicloran® gel completely resolved inflammation (100% inhibition of edema). These findings confirm the efficacy of K-NG in reducing inflammation, with comparable or superior effects to the standard treatment, suggesting its potential as an effective transdermal anti-inflammatory therapy.
3. Conclusions
This study developed a QbD-optimized nanoemulgel incorporating Kunzea ericoides oil, exhibiting controlled drug release, antibacterial activity, and anti-inflammatory effects. The formulation demonstrated stable physicochemical properties, diffusion-controlled release kinetics, and significant therapeutic potential against S. aureus and E. coli. In vivo evaluation confirmed its anti-inflammatory efficacy, comparable to standard treatment. Given its promising safety profile and efficacy, this formulation presents a viable candidate for transdermal applications in dermatological and inflammatory conditions, supporting its potential for further clinical development and commercialization.
4. Materials and Methods
4.1. Materials
Kanuka oil was acquired from Avi Naturals (Delhi, India). Surfactants, along with Carbopol 934, Benzyl alcohol, and NaOH, were obtained through Loba Chemie Private Limited, Mumbai. Staphylococcus aureus Strain (737 - MTCC), Escherichia coli (1035 - MTCC) acquired from Microbial type culture collection and gene bank situated in Chandigarh.
4.2. Screening of Surfactants and FT-IR Analysis of Kanuka Oil
A comprehensive screening process was conducted to assess the suitability of various surfactants for oil-in-water (O/W) nanoemulsions. The surfactants evaluated included Polysorbates (Tween 80, Tween 20), sorbitan esters (Span 80, Span 20), and polyethylene glycol (PEG 400) as excipients. Formulations were prepared with surfactant concentrations ranging from 1% to 20% w/v, maintaining the oil phase at 5% w/v for consistency. The screening process involved solubility studies, phase behavior analysis, and emulsification efficiency testing. Key parameters, including visual appearance, emulsion stability, and droplet size, were systematically analyzed to determine the optimal surfactant (15). Tween 80 demonstrated superior emulsification capacity, producing stable, homogenous nanoemulsions with Kanuka oil, resulting in an optimized formulation with improved stability and reduced droplet size. Thus, Tween 80 was selected as the surfactant of choice for further formulation development.
FT-IR analysis of Kanuka oil was performed using an attenuated total reflectance (ATR) accessory (Lab India-Bruker). A small aliquot of the oil was applied directly onto the ATR crystal to ensure optimal contact. The spectrum was recorded over the wavenumber range of 4000–400 cm−1 with a resolution of 4 cm−1, averaging 32 scans to enhance signal accuracy. Background correction was conducted prior to sample analysis, and the acquired spectral data were examined for characteristic functional group assignments.
4.3. Preparation and Optimization of Kanuka nanoemulsion
Based on preliminary studies and Preformulation analysis, the optimal concentration of Kanuka oil was determined to be 5% w/v. The nanoemulsion was prepared using the oil-in-water (O/W) emulsification technique. The aqueous phase, consisting of distilled water (89–93% w/v) and Tween 80 (2–6% w/v), was gradually added dropwise into the oil phase under continuous stirring using a Remi stirrer at 40°C for 1 hour to obtain a homogenous mixture [16]. The resulting pre-emulsion was then subjected to high-speed homogenization at 1400 rpm for 10–30 minutes to achieve a stable nanoemulsion.
To optimize the Kanuka oil nanoemulsion, a 2-factor, 3-level Central Composite Design (CCD) was constructed using JMP Statistical Software (version 17.0.0). Surfactant concentration (X1) and homogenization time (X2) were selected as independent variables, with levels ranging from 2% to 6% and 10 to 30 minutes, respectively. The mean droplet size (Y1) was minimized, while the zeta potential (Y2) was maintained within a specified range. These responses were analyzed to determine the optimal formulation conditions. A total of 13 experiments were conducted, including one replicate and five center points to ensure model reliability. The obtained results were analyzed using ANOVA at a 95% confidence interval (CI), with significance set at P ≤ 0.05 (17). The formulation exhibiting the optimal response in terms of droplet size and zeta potential was selected for further characterization and evaluation.
4.4. Evaluation of Entrapment Efficiency
The Entrapment Efficiency (EE) of Kanuka-NEs (K-NEs) was assessed following previously established methodologies (18). The calibration curve of Kanuka extract was initially plotted at its λmax of 450 nm, with linearity confirmed utilizing a regression equation. Additionally, the Limit of Detection (LOD) and Limit of Quantification (LOQ) were evaluated (9). In the experiment, 100 µL of K-NEs was diluted at a 1:100 ratio using an ethanol-water mixture in equal proportions (1:1 v/v). The Kanuka concentration (µg/mL) in each sample was determined using UV-visible spectroscopy. To eliminate interference from formulation components, a Kanuka-free formulation served as a blank. Each sample test was carried out in triplicate.
4.5. Physicochemical Characterization and Stability Assessment
The prepared K-NEs were analyzed for zeta potential, particle size and polydispersity index (PDI), and utilizing the Malvern Zetasizer Nano ZS 90, through photon correlation spectroscopy. Measurements were conducted at 25°C in disposable polystyrene cells for size and PDI, while omega cuvettes were used for zeta potential analysis (19). Stability assessments included thermal stress evaluations through heating-cooling and freeze-thaw cycles. In the heating-cooling cycle, the samples were subjected to alternating temperatures of 40°C and 48°C for 48-hour intervals over three cycles, followed by examination for phase separation. The freeze-thaw cycle involved repeated freezing at -20°C and thawing at 25°C for three cycles, with subsequent centrifugation to detect instability [20]. Morphological characterization was conducted using Scanning Electron Microscopy (SEM), where samples were analyzed at various magnifications under an optimal accelerating voltage of 5 kV [21]. Automated image analysis techniques were utilized to evaluate the shape and surface characteristics of the dispersed phase. These evaluations provide critical insights into the physicochemical stability and structural integrity of K-NEs.
4.6. Preparation of Kanuka – Loaded Nanoemulgel
Kanuka Nanoemulgel (K-NG) was prepared using Carbopol 940 concentrations ranging from 0.5% to 2% w/w. The precise quantity of Carbopol was blended using the ideal K-NEs under constant stirring. Benzyl alcohol was incorporated as a preservative, and the pH was adjusted using 1 M NaOH [22]. The formulation underwent physicochemical characterization, Parameters such as transparency, color stability, bubble formation, consistency, content leakage, and uniformity were assessed. Adhesion strength was determined using the Thumb Test, conforming the lack of visible droplets and verifying formulation integrity [23]. Spreadability was assessed using the glass plate method, where a Brookfield viscometer (ULA S00 spindle, 4 rpm, torque level 10) was used to determine viscosity. Additionally, the pH stability of the K-NG was analyzed to ensure long-term stability and skin compatibility.
4.7. In Vitro Drug Release Study and Kinetics
The In vitro release profile of the K-NG formulation was evaluated using a modified Franz diffusion cell method [24]. A cellophane membrane (12 kDa molecular weight cut-off) was pre-soaked in a 1:1 ethanol-water mixture overnight to ensure complete saturation. Subsequently, 1 g of K-NG was loaded into the donor compartment of the diffusion cell. Sampling was performed at fixed time intervals, with fresh medium replenished in the acceptor compartment after each collection to maintain volume and diffusion conditions. The experiment was conducted under controlled conditions, with constant stirring at 200 rpm and temperature maintained at 32°C [25]. After sampling, the K-NG formulation was appropriately diluted, and the Kanuka oil concentration was determined using UV-visible spectroscopy at 450 nm, based on the established calibration curve. A Kanuka-free formulation was used as a blank to account for any potential interference from excipients. In addition to the developed K-NG, the release profiles of its corresponding nanoemulsion (K-NEs), non-encapsulated Kanuka oil (n-EnKan) (Kanuka oil dissolved in ethanol-water), and n-EnKan hydrogel formulation (Carbopol 940 1% w/w incorporating non-encapsulated Kanuka oil) were also evaluated to offer a thorough insight of the release behavior. The results were represented as the mean ± SD from 3 independent experiments. To analyze the diffusion characteristics and release kinetics of the optimized K-NG, various kinetic models, including zero-order, first-order, Hixson-Crowell, Higuchi, and Korsmeyer-Peppas, were applied [26]. The best-fit model was selected based on the highest R2 value, representing the most accurate depiction of the release profile.
4.8. Antimicrobial Activity of K-NG
The antibacterial efficacy of the K-NG formulation was evaluated against Staphylococcus aureus (737 - MTCC) and Escherichia coli (1035 - MTCC) using the broth microdilution method following Clinical and Laboratory Standards Institute (CLSI) guidelines. Two-fold serial dilutions of the formulation were prepared in Mueller-Hinton Broth (MHB) in a 96-well microplate, ranging from 500 µg/mL to 1.95 µg/mL. Fresh bacterial cultures were grown on Nutrient Agar medium, and the inoculum was standardized to 0.5 McFarland turbidity (~1.5 × 10⁸ CFU/mL) using sterile saline [27]. The bacterial suspension was further diluted to achieve a final inoculum density of 5 × 10⁵ CFU/mL per well, and each well received 100 µL of bacterial suspension. The plates were incubated at 37 °C for 24 hours under controlled conditions [28]. Bacterial growth was assessed by measuring optical density (OD600) using a microplate reader, with MIC defined as the lowest concentration showing no visible turbidity and OD ≤ 0.1. To ensure experimental reliability, appropriate controls were included: a sterility control containing only MHB without bacterial inoculum, a growth control with bacterial inoculum but no K-NG formulation, and an antibiotic control using Ciprofloxacin (2 µg/mL) for comparative efficacy. The experiment was conducted in triplicate, and MIC values were reported as mean ± standard deviation (SD) to ensure reproducibility.
4.9. In Vivo Study
This study was conducted on adult male Wistar rats weighing 250 ± 10 g. The animals were maintained under standard conditions, including a room temperature of 25 ± 2°C, a 12-hour light/12-hour dark cycle, and free access to a standard laboratory chow diet [29]. All experimental procedures were conducted in strict compliance with the Institutional Animal Ethics Committee (IAEC) (Reg. No: 1048/PO/Re/S/07/CPCSEA). The study protocol, approved under certificate number 07/IAEC/CLPT/2023-24, adhered fully to the CPCSEA requirements.
4.10. Acute Dermal Irritation Study
The acute dermal irritation potential of the K-NG formulation was evaluated using healthy male Wistar rats in accordance with OECD guideline 404 [30]. A dose of 0.5 g of the K-NG was applied to a 6 cm2 shaved dorsal skin area under a semi-occlusive dressing for 4 hours. The positive control (Formalin, 0.8% solution) and negative control (blank formulation gel) were similarly tested. Following exposure, the sites were rinsed with lukewarm water, and dermal reactions were assessed at 1, 24, 48, and 72 hours for erythema, edema, and other signs of irritation.
4.11. Evaluation of In Vivo Anti-Inflammatory Activity
The in vivo anti-inflammatory activity of K-NG was evaluated using the carrageenan-induced hind paw edema model in male Wistar rats (n=6 per group) weighing 200–300 g. The animals were housed under controlled conditions (25 ± 2°C, 12-hour light/dark cycle) with free access to food and water [31]. The study was conducted following ethical approval from the IAEC. The animals were randomly divided into three groups: Group 1 (Negative control) received blank nanoemulgel, Group 2 (Positive control) was treated with Dicloran® gel (2.5%), and Group 3 (Treatment) received K-NG (5% w/w Kanuka oil nanoemulgel). Inflammation was induced by subplantar injection of 0.1 mL of 1% w/v carrageenan suspension into the right hind paw of all groups. Immediately after induction, 0.5 g of the respective formulations was topically applied to the affected area and gently massaged for uniform absorption. The application was performed once, and paw edema volume was measured at baseline (0 min) and at 30, 60, 120, 240, and 360 minutes using a digital vernier caliper by an observer blinded to the treatment groups. The percentage change in paw edema volume was calculated using the standard formula:
where Mean Cn represents the mean paw volume at a given time point, and Mean Ci represents the initial paw volume before inflammation induction. The inhibition of edema was further analyzed in comparison to the control group [32].
4.12. Statistical Analysis and Interpretation
Statistical analysis was performed using the Student’s t-test for pairwise comparisons and one-way ANOVA followed by the Tukey-Kramer post hoc test for multiple group comparisons. Results were expressed as mean ± standard deviation (SD) for in vitro studies and mean ± standard error of the mean (SEM) for in vivo experiments. A p-value of less than 0.05 was considered statistically significant to ensure the reliability and reproducibility of the findings.
Author Contributions
Conceptualization, Y.K. and M.S.U.; methodology, Y.K. and M.S.U.; software, Y.K.; validation, Y.K. and M.S.U.; formal analysis, Y.K. and M.S.U.; investigation, Y.K. and M.S.U.; resources, Y.K. and M.S.U.; data curation, Y.K. and M.S.U.; writing—original draft preparation, Y.K.; writing—review and editing, Y.K. and M.S.U.; visualization, Y.K. and M.S.U.; supervision, M.S.U.; project administration, Y.K. and M.S.U. All authors have read and agreed to the published version of the manuscript.
Funding
This research received no external funding.
Institutional Review Board Statement
The animal study protocol was approved by the Institutional Animal Ethics Committee (IAEC) of Chalapathi Institute of Pharmaceutical Sciences (Reg. No: 1048/PO/Re/S/07/CPCSEA) under certificate number 07/IAEC/CLPT/2023-24. All experimental procedures were conducted in accordance with the guidelines of the Committee for the Control and Supervision of Experiments on Animals (CCSEA).
Informed Consent Statement
Not applicable.
Data Availability Statement
The data generated in this study can be requested from the corresponding author
Acknowledgments
The authors gratefully acknowledge SRM Institute of Science and Technology, Kattankulathur, Chalapathi Institute of Pharmaceutical Sciences, Guntur, and JJS College of Pharmacy, Ooty for providing guidance, laboratory facilities, and equipment to carry out the research work. We also extend our thanks to JMP Statistical Discovery LLC for providing the software used in optimizing the Design of Experiments.
Conflicts of Interest
The authors declare no conflicts of interest.
Abbreviations
The following abbreviations are used in this manuscript:
| QbD | Quality by Design |
| NE | Nanoemulsion |
| NEs | Nanoemulsions |
| K-NE | Kanuka Nanoemulsion |
| K-NEs | Kanuka Nanoemulsions |
| K-NG | Kanuka Nanoemulgel |
| CCD | Central Composite Design |
| ANOVA | Analysis of Variance |
| PDI | Polydispersity Index |
| CI | Confidence Interval |
| EE | Entrapment Efficiency |
| LOD | Limit of Detection |
| LOQ | Limit of Quantification |
| SEM | Scanning Electron Microscopy |
| UV | Ultraviolet |
| O/W | Oil-in-Water |
| MHB | Mueller-Hinton Broth |
| MIC | Minimum Inhibitory Concentration |
| CLSI | Clinical and Laboratory Standards Institute |
| CFU | Colony-Forming Unit |
| IAEC | Institutional Animal Ethics Committee |
References
- Mirrashed F, Sharp J, Krause V, Morgan J, Tomanek B. Pilot study of dermal and subcutaneous fat structures by MRI in individuals who differ in gender, BMI, and cellulite grading. Skin Res Technol. 2004;10(2):161-168. [CrossRef]
- Wlaschek M, Maity P, Makrantonaki E, Scharffetter-Kochanek K. Connective tissue and fibroblast senescence in skin aging. J Invest Dermatol. 2021;141(4):985-992. [CrossRef]
- Asthana GS, Asthana A, Singh D, Sharma PK. Etodolac containing topical niosomal gel: formulation development and evaluation. J Drug Deliv. 2016;Article ID 9323616. [CrossRef]
- Khavkin C, Ellis DA. Aging skin: histology, physiology, and pathology. Facial Plast Surg Clin North Am. 2011;19(2):229-234. [CrossRef]
- Madrid Sani AT, Ramos-Rocha KLV, Sarcinelli MA, Chaves MHdC, Rocha HVA, Léo P, et al. Development of a dry powder formulation for pulmonary delivery of azithromycin-loaded nanoparticles. J Pharm Pharm Sci. 2024;27:Article ID 13635. [CrossRef]
- Ahmad N, Ahmad R, Al-Qudaihi A, Alaseel SE, Fita IZ, Khalid MS, Pottoo FH. Preparation of a novel curcumin nanoemulsion by ultrasonication and its comparative effects in wound healing and the treatment of inflammation. RSC Adv. 2019;9(35):20192-20206. [CrossRef]
- Alexander A, Dwivedi S, Giri TK, Saraf S, Saraf S, Tripathi DK. Approaches for breaking the barriers of drug permeation through transdermal drug delivery. J Control Release. 2012;164:26-40. [CrossRef]
- Burki IK, Khan MK, Khan BA, Uzair B, Braga VA, Jamil QA. Formulation development, characterization, and evaluation of a novel dexibuprofen-capsaicin skin emulgel with improved in vivo anti-inflammatory and analgesic effects. AAPS PharmSciTech. 2020;21:Article ID 211. [CrossRef]
- Bagheri AM, Ranjbar M, et al. Curcumin nanoemulgel: characterization, optimization, and evaluation of photoprotective efficacy, anti-inflammatory properties, and antibacterial activity. J Cluster Sci. 2024;35:2253-2272. [CrossRef]
- Khan BA, Ahmad N, et al. Formulation development of pharmaceutical nanoemulgel for transdermal delivery of febuxostat: physical characterization and in vivo evaluation. Eur J Pharm Sci. 2024;195:Article ID 1-10. [CrossRef]
- Alonso MM, Martínez V, Rubio L, Parra JL, Coderch L. Antioxidant cosmeto-textiles: skin assessment. Eur J Pharm Biopharm. 2013;84:192-199. [CrossRef]
- Zacher J, Altman R, Bellamy N, Brühlmann P, Da Silva J, Huskisson E, Taylor R. Topical diclofenac and its role in pain and inflammation: an evidence-based review. Curr Med Res Opin. 2008;24(4):925-950. [CrossRef]
- Peng Y, Ao M, Dong B, Jiang Y, Yu L, Chen Z, Hu C, Xu R. Anti-inflammatory effects of curcumin in inflammatory diseases: status, limitations, and countermeasures. Drug Des Devel Ther. 2021;4503-4525. [CrossRef]
- Okoli C, Akah P, Nwafor S, Anisiobi A, Ibegbunam I, Erojikwe O. Anti-inflammatory activity of hexane leaf extract of Aspilia africana CD Adams. J Ethnopharmacol. 2007;109(2):219-225. [CrossRef]
- Shahavi MH, Hosseini M, Jahanshahi M, Meyer RL, Darzi GN. Evaluation of critical parameters for preparation of stable clove oil nanoemulsion. Arab J Chem. 2019;12(8):3225-3230. [CrossRef]
- Sari TP, Mann B, Kumar R, Singh RRB, Sharma R, Bhardwaj M, Athira S. Preparation and characterization of nano emulsion encapsulating curcumin. Food Hydrocoll. 2015;43:540-546. [CrossRef]
- Azami SJ, Teimouri A, Keshavarz H, Amani A, Esmaeili F, Hasanpour H, et al. Curcumin nanoemulsion as a novel chemical for the treatment of acute and chronic toxoplasmosis in mice. Int J Nanomedicine. 2018;13:7363-7374. [CrossRef]
- Chuacharoen T, Prasongsuk S, Sabliov CM. Effect of surfactant concentrations on physicochemical properties and functionality of curcumin nanoemulsions under conditions relevant to commercial utilization. Molecules. 2019;24(15):2744. [CrossRef]
- Singh A, Avupati VR. Development and validation of UV-spectrophotometric method for the estimation of curcumin in standardized polyherbal formulations. J Young Pharm. 2017;9(4):491. [CrossRef]
- Baboota S, Shakeel F, Ahuja A, Ali J, Shafiq S. Design development and evaluation of novel nanoemulsion formulations for transdermal potential of Celecoxib. Acta Pharm. 2007;57(3):315-32. [CrossRef]
- Algahtani MS, Ahmad MZ, Ahmad J. Nanoemulsion loaded polymeric hydrogel for topical delivery of curcumin in psoriasis. J Drug Deliv Sci Technol. 2020;59:101847. [CrossRef]
- Guleri KT, Preet KL. Formulation and evaluation of topical gel of aceclofenac. J Drug Deliv Ther. 2013;3(6):51-3. [CrossRef]
- Firmansyah F, Muhtadi WK, Indriani S, Ulhaq MD, Auliya SR, Iskandar B, et al. Development of novel curcumin nanoemulgel: optimization, characterization, and ex vivo permeation. Pharm Educ. 2022;22(2):98-103. [CrossRef]
- Manaswitha A, Swetha PS, Devi N, Babu KN, Shankar KR. Oleic acid-based emulgel for topical delivery of ofloxacin. J Drug Deliv Ther. 2019;9(4-A):183-90. [CrossRef]
- Estabragh MAR, Pardakhty A, Ahmadzadeh S, Dabiri S, Afshar RM, Abbasi MF. Successful application of alpha lipoic acid niosomal formulation in cerebral ischemic reperfusion injury in a rat model. Adv Pharm Bull. 2022;12(3):541. [CrossRef]
- Salamanca CH, Barrera-Ocampo A, Lasso JC, Camacho N, Yarce CJ. Franz diffusion cell approach for pre-formulation characterization of ketoprofen semi-solid dosage forms. Pharmaceutics. 2018;10(3):30139. [CrossRef]
- Alvarado H, Abrego G, Souto E, Garduño-Ramirez M, Clares B, García M, et al. Nanoemulsions for dermal controlled release of oleanolic and ursolic acids: in vitro, ex vivo and in vivo characterization. Colloids Surf B Biointerfaces. 2015;130:40-7. [CrossRef]
- Gharaei S, Ohadi M, Hassanshahian M, Porsheikhali S, Forootanfar H. Isolation, optimization, and structural characterization of glycolipid biosurfactant produced by marine isolate Shewanella algae B12 and evaluation of its antimicrobial and anti-biofilm activity. Appl Biochem Biotechnol. 2022;194(4):1755-74. [CrossRef]
- Gunes H, Gulen D, Mutlu R, Gumus A, Tas T, Topkaya AE. Antibacterial effects of curcumin: an in vitro minimum inhibitory concentration study. Toxicol Ind Health. 2016;32(2):246-50. [CrossRef]
- Vyas S, Raval J, Gajjar A, Shah D. Ketorolac-dextran conjugates: synthesis, in vitro and in vivo evaluation. Acta Pharm. 2007;57(4):441-50. [CrossRef]
- Organisation for Economic Co-operation and Development (OECD). Test No. 404: Acute Dermal Irritation/Corrosion. OECD Guidelines for the Testing of Chemicals, Section 4. 2015. Available online: https://www.oecd.org/en/publications/2015/07/test-no-404-acute-dermal-irritation-corrosion_g1g59b23.html (accessed on 20 March 2025).
- Karaman M, Firinci F, Cilaker S, Uysal P, Tugyan K, Yilmaz O, et al. Anti-inflammatory effects of curcumin in a murine model of chronic asthma. Allergol Immunopathol (Madr). 2012;40(4):210-4. [CrossRef]
Figure 1.
FT-IR spectrum of Kanuka oil, confirming key functional groups: O–H (3738 cm−1), C–H (2951, 2917, 2772 cm−1), C=O (1735 cm−1), C=C (1653 cm−1), and C–O (1243–1027 cm−1), indicating the presence of monoterpenes, sesquiterpenes, esters, and alcohols.
Figure 1.
FT-IR spectrum of Kanuka oil, confirming key functional groups: O–H (3738 cm−1), C–H (2951, 2917, 2772 cm−1), C=O (1735 cm−1), C=C (1653 cm−1), and C–O (1243–1027 cm−1), indicating the presence of monoterpenes, sesquiterpenes, esters, and alcohols.
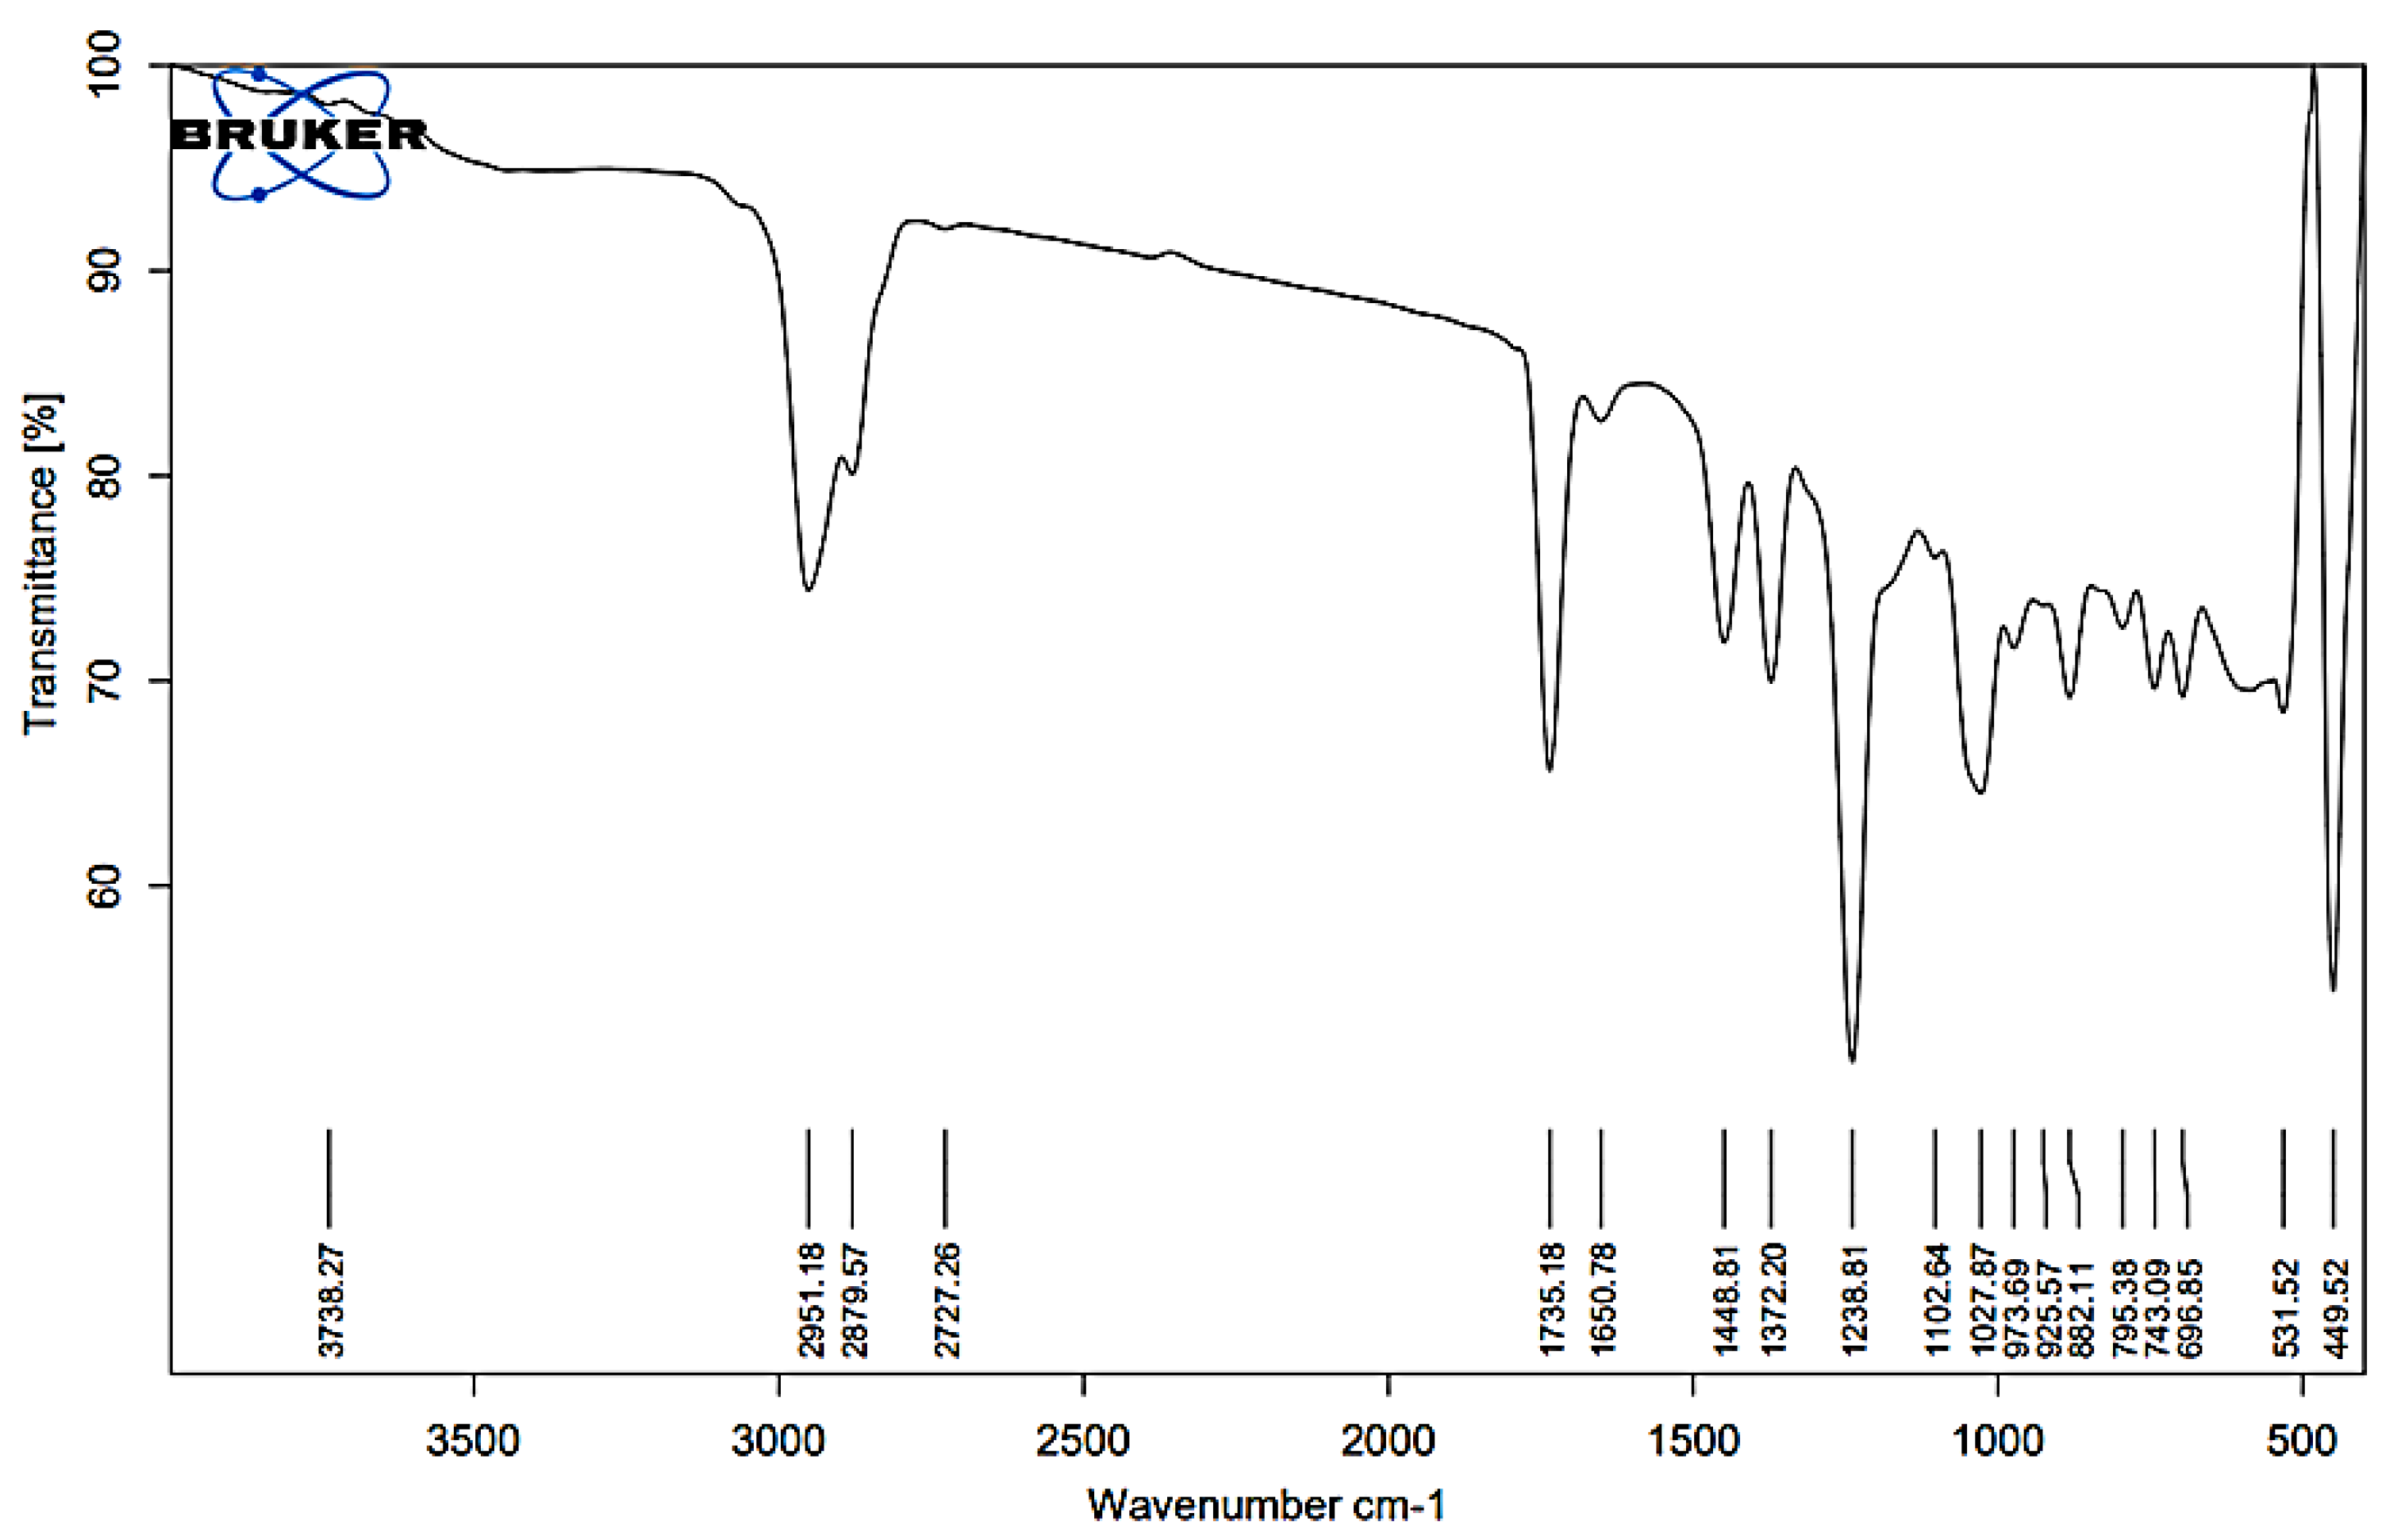
Figure 2.
Half-Normal Plot of Factor Effects on Particle Size. The blue line represents Lenth’s pseudo-standard error (PSE) slope, used to assess factor significance, while the red line serves as a reference slope of 1. Factors further from the red line and closer to the blue line are more significant in influencing particle size.
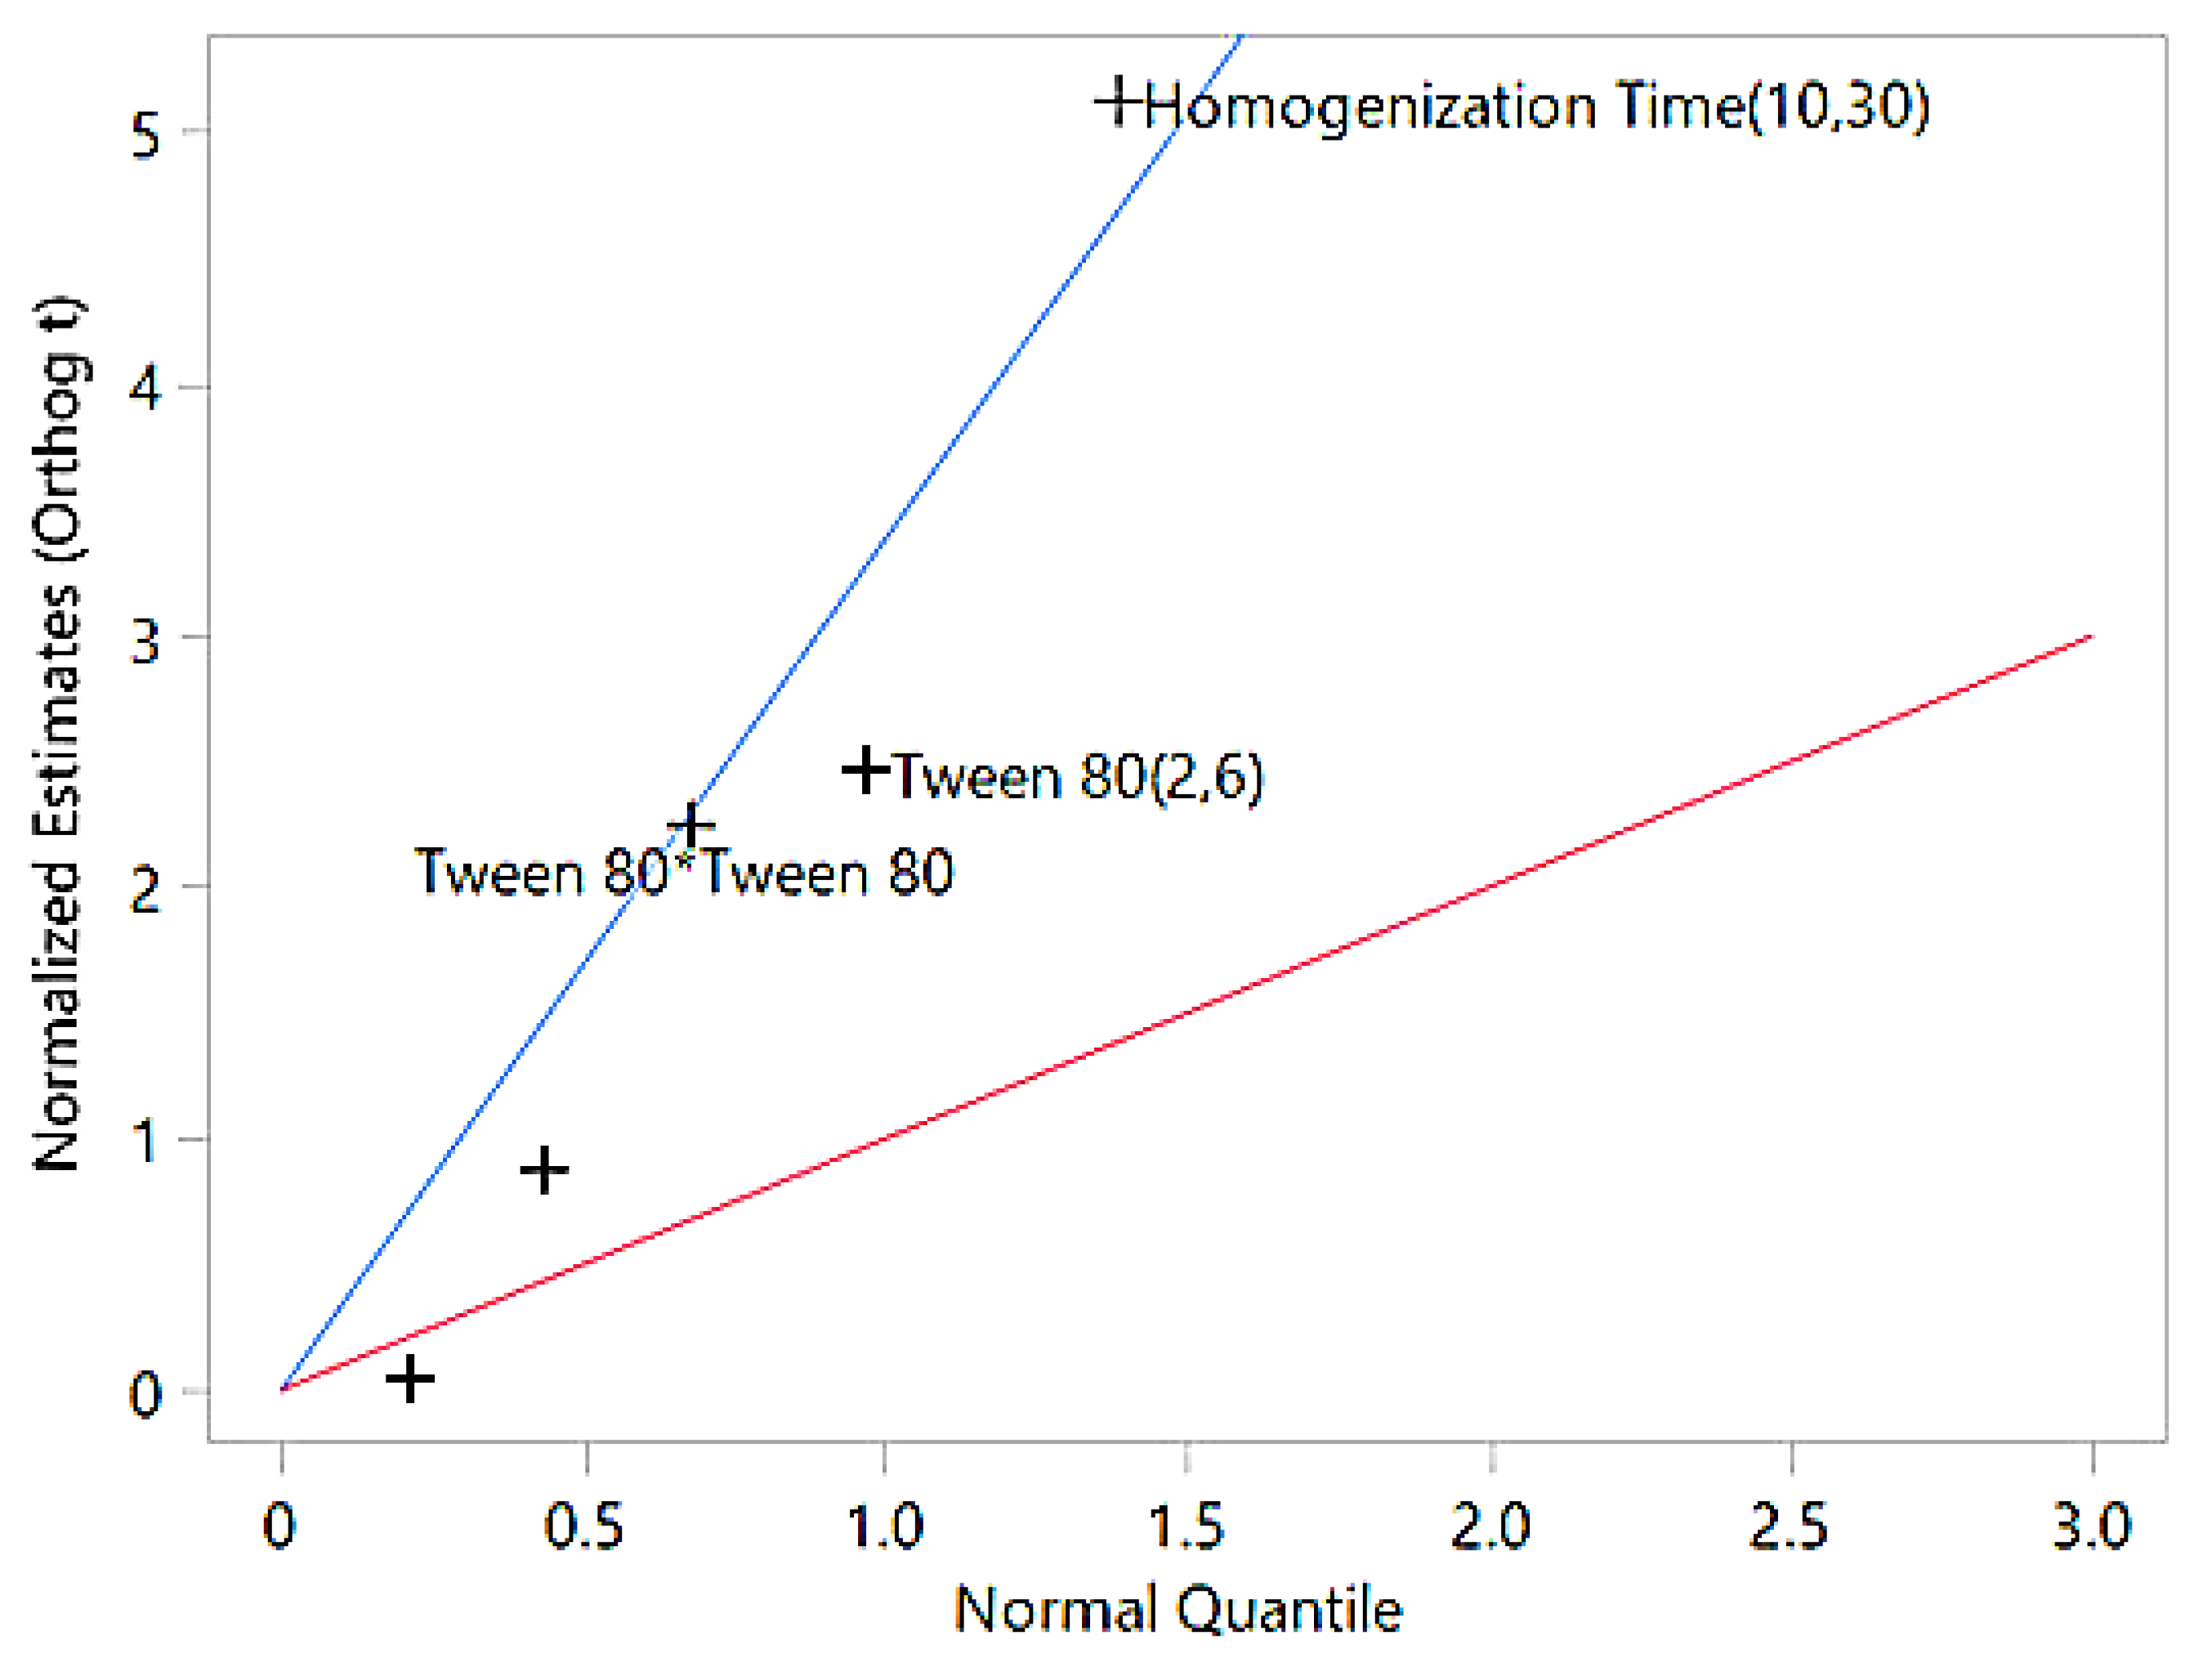
Figure 3.
3D surface plots illustrating the interaction effects of Tween 80 concentration and homogenization time on (A) particle size and (B) zeta potential. These response surface plots highlight the trends in particle size reduction and charge stabilization, aiding in the identification of optimal formulation conditions.
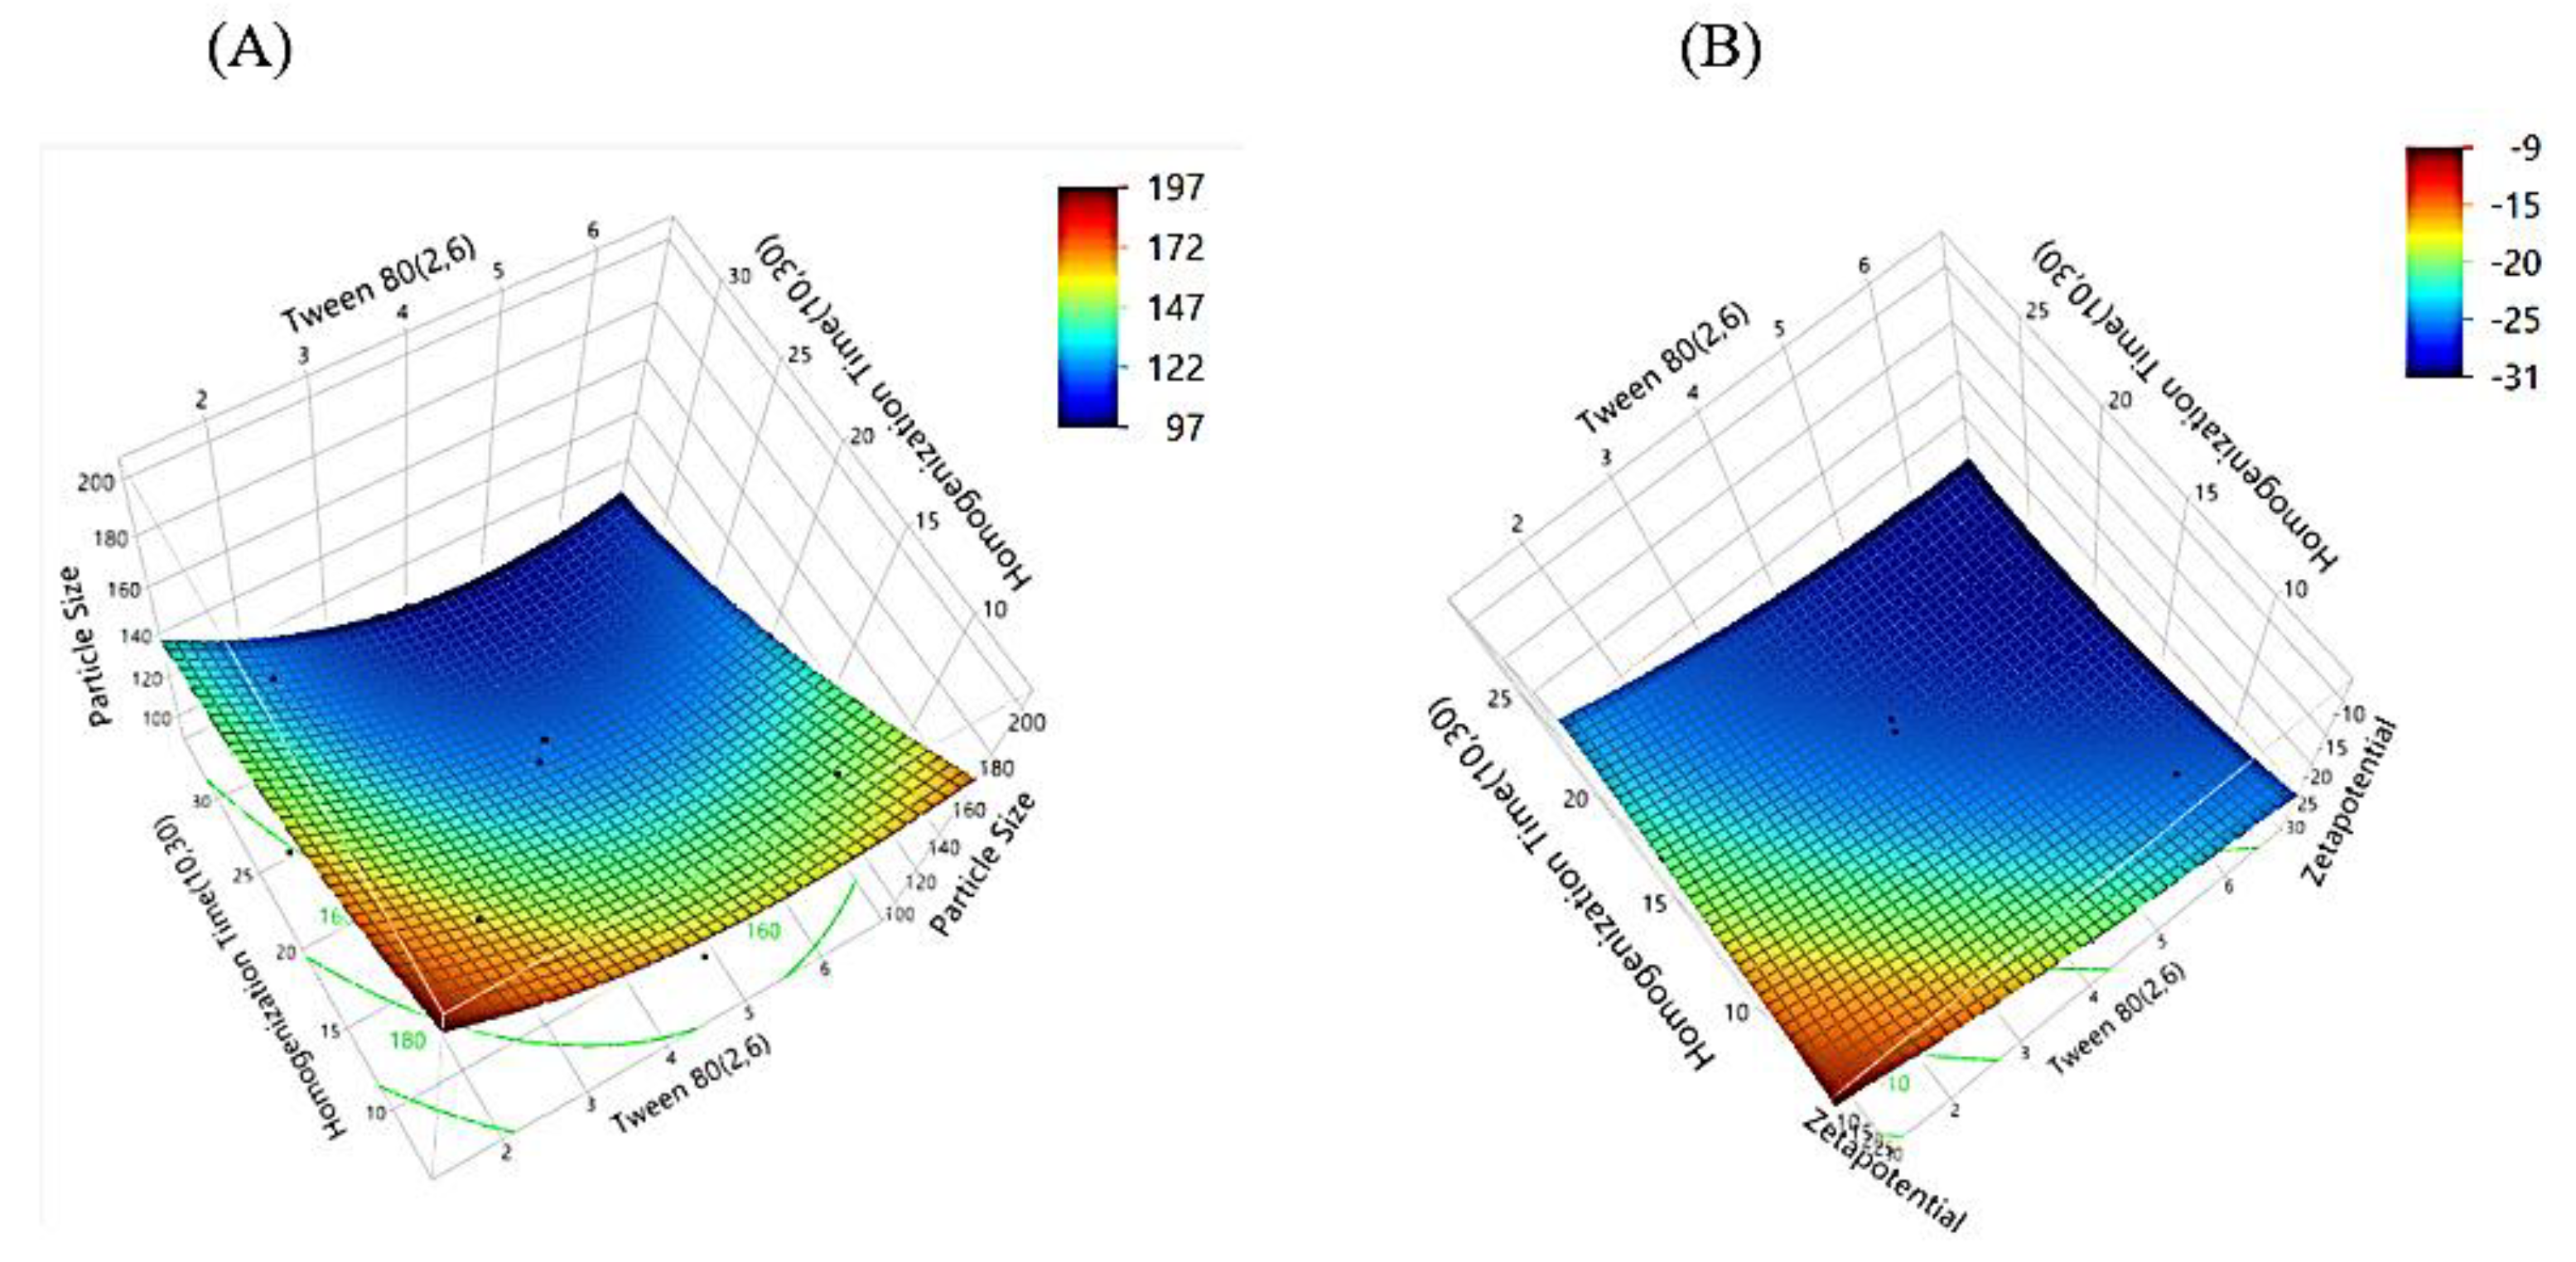
Figure 4.
Prediction profiler illustrating the influence of Tween 80 concentration and homogenization time on particle size, zeta potential, and overall desirability. The plots display model-based predictions with confidence intervals (blue lines) and indicate optimal parameter settings (red dashed lines) for achieving the desired formulation characteristics.
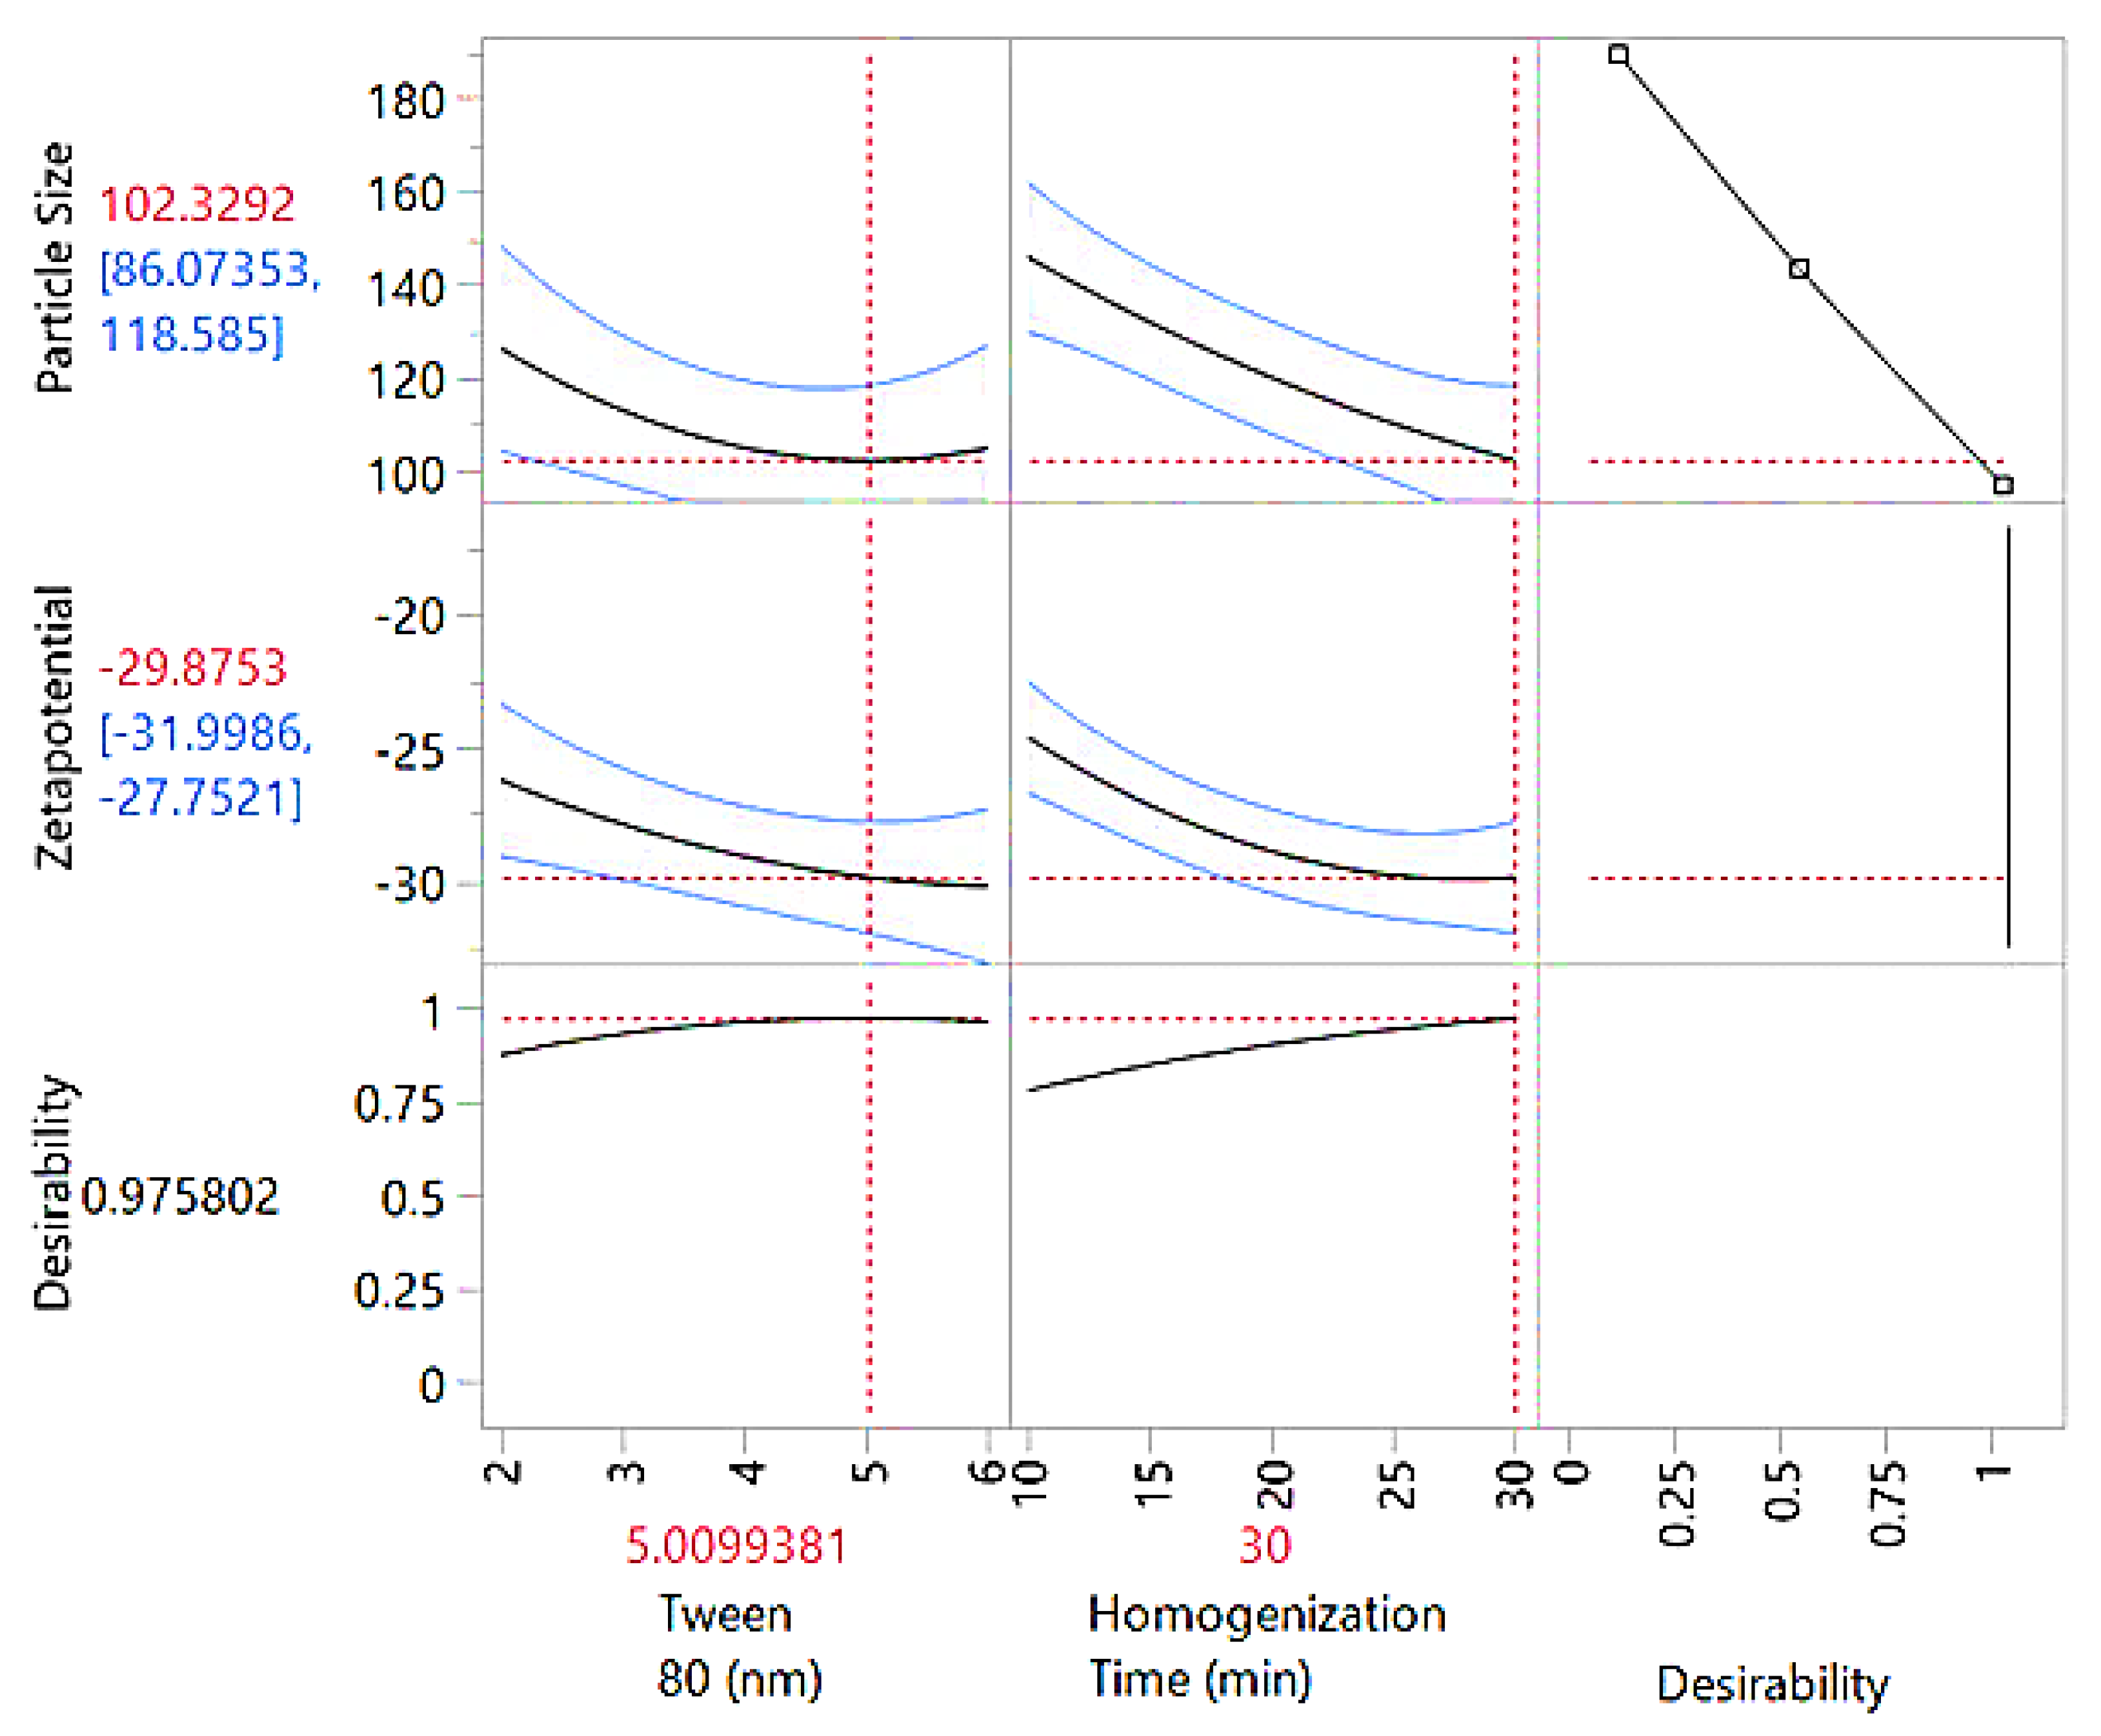
Figure 5.
(A) Particle size distribution of the nanoemulsion, indicating uniformity and size range. (B) Zeta potential distribution, reflecting colloidal stability. (C) Scanning electron microscopy (SEM) image of the nanoemulsion at 250× magnification, showing surface morphology. (D) SEM image at 350× magnification, providing a detailed view of the structural characteristics.
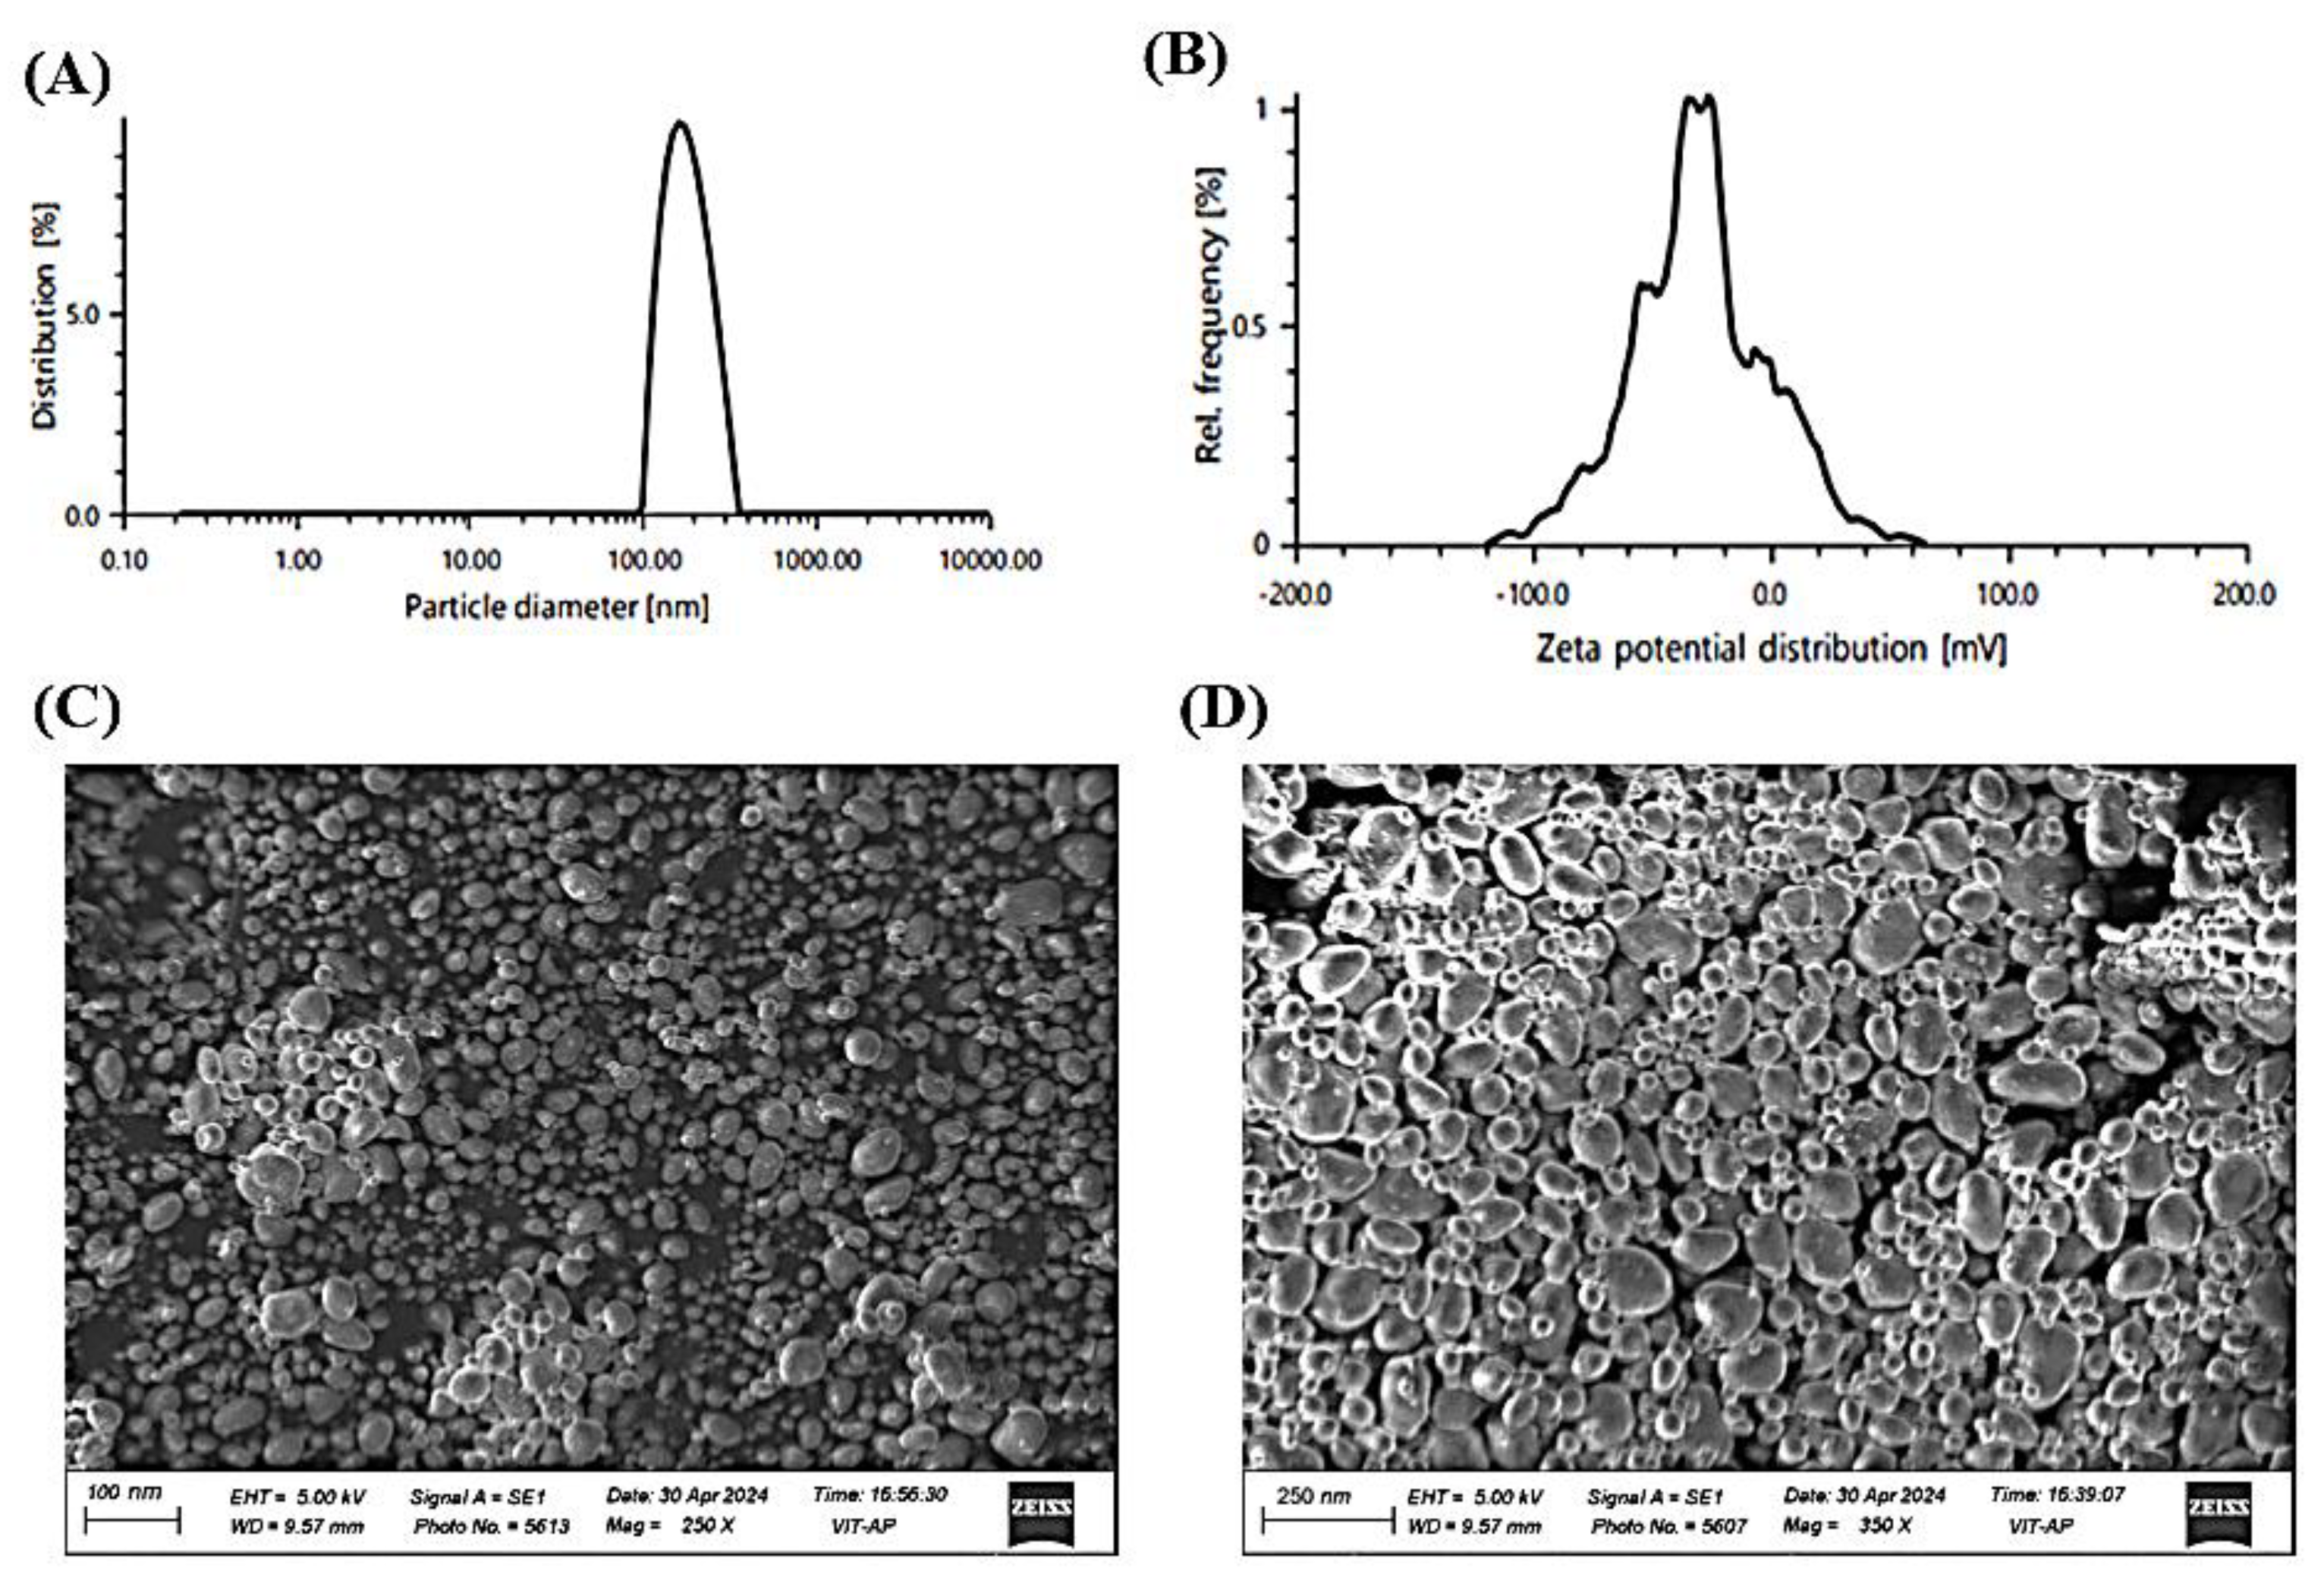
Figure 6.
Cumulative drug release (%) of different formulations over time, presented as mean ± SD (n = 3). The release profiles of K-NG (♦), K-NE (▲), n-EnK (■), and n-EnK Hydrogel (●) illustrate differences in drug release kinetics among formulations. Error bars indicate standard deviation, highlighting variability in release behavior.
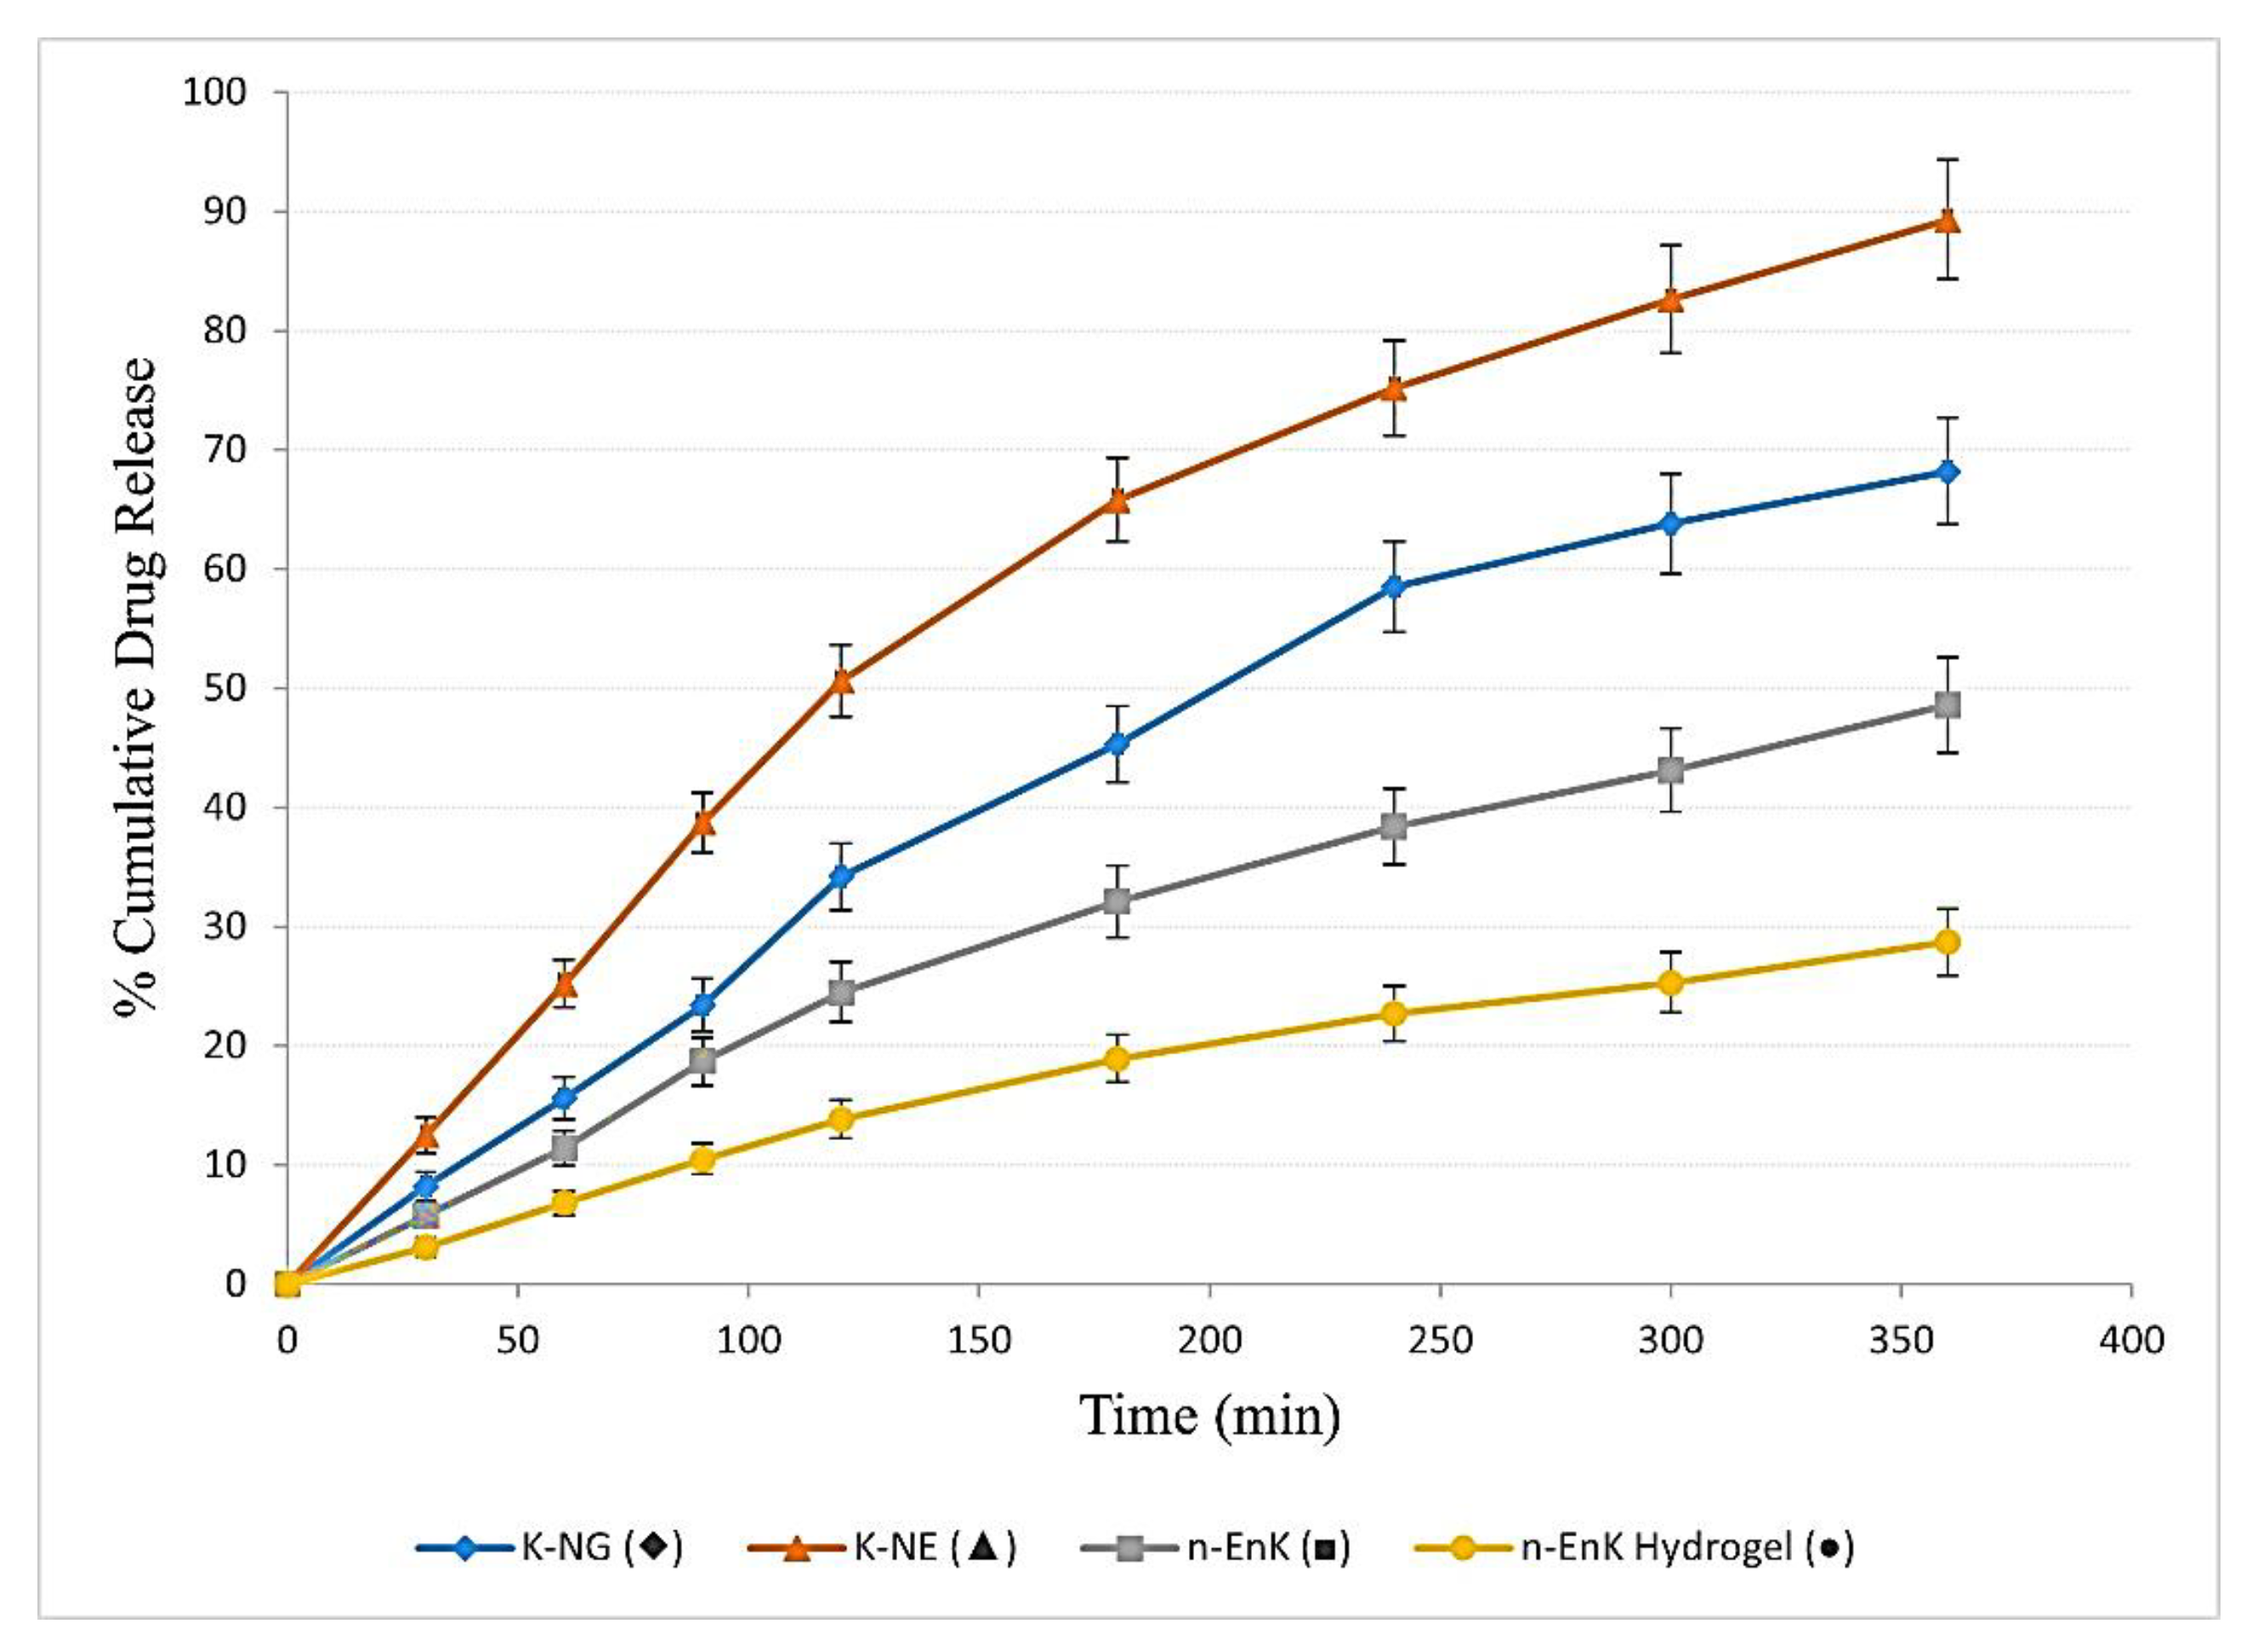
Figure 7.
In vivo anti-inflammatory evaluation of K-NG using the carrageenan-induced paw edema model. Images show paw swelling in the Negative Control (blank nanoemulgel), Positive Control (Dicloran® gel 2.5%), and Treatment (K-NG) groups over time (0–360 min), highlighting K-NG’s edema-reducing effect.
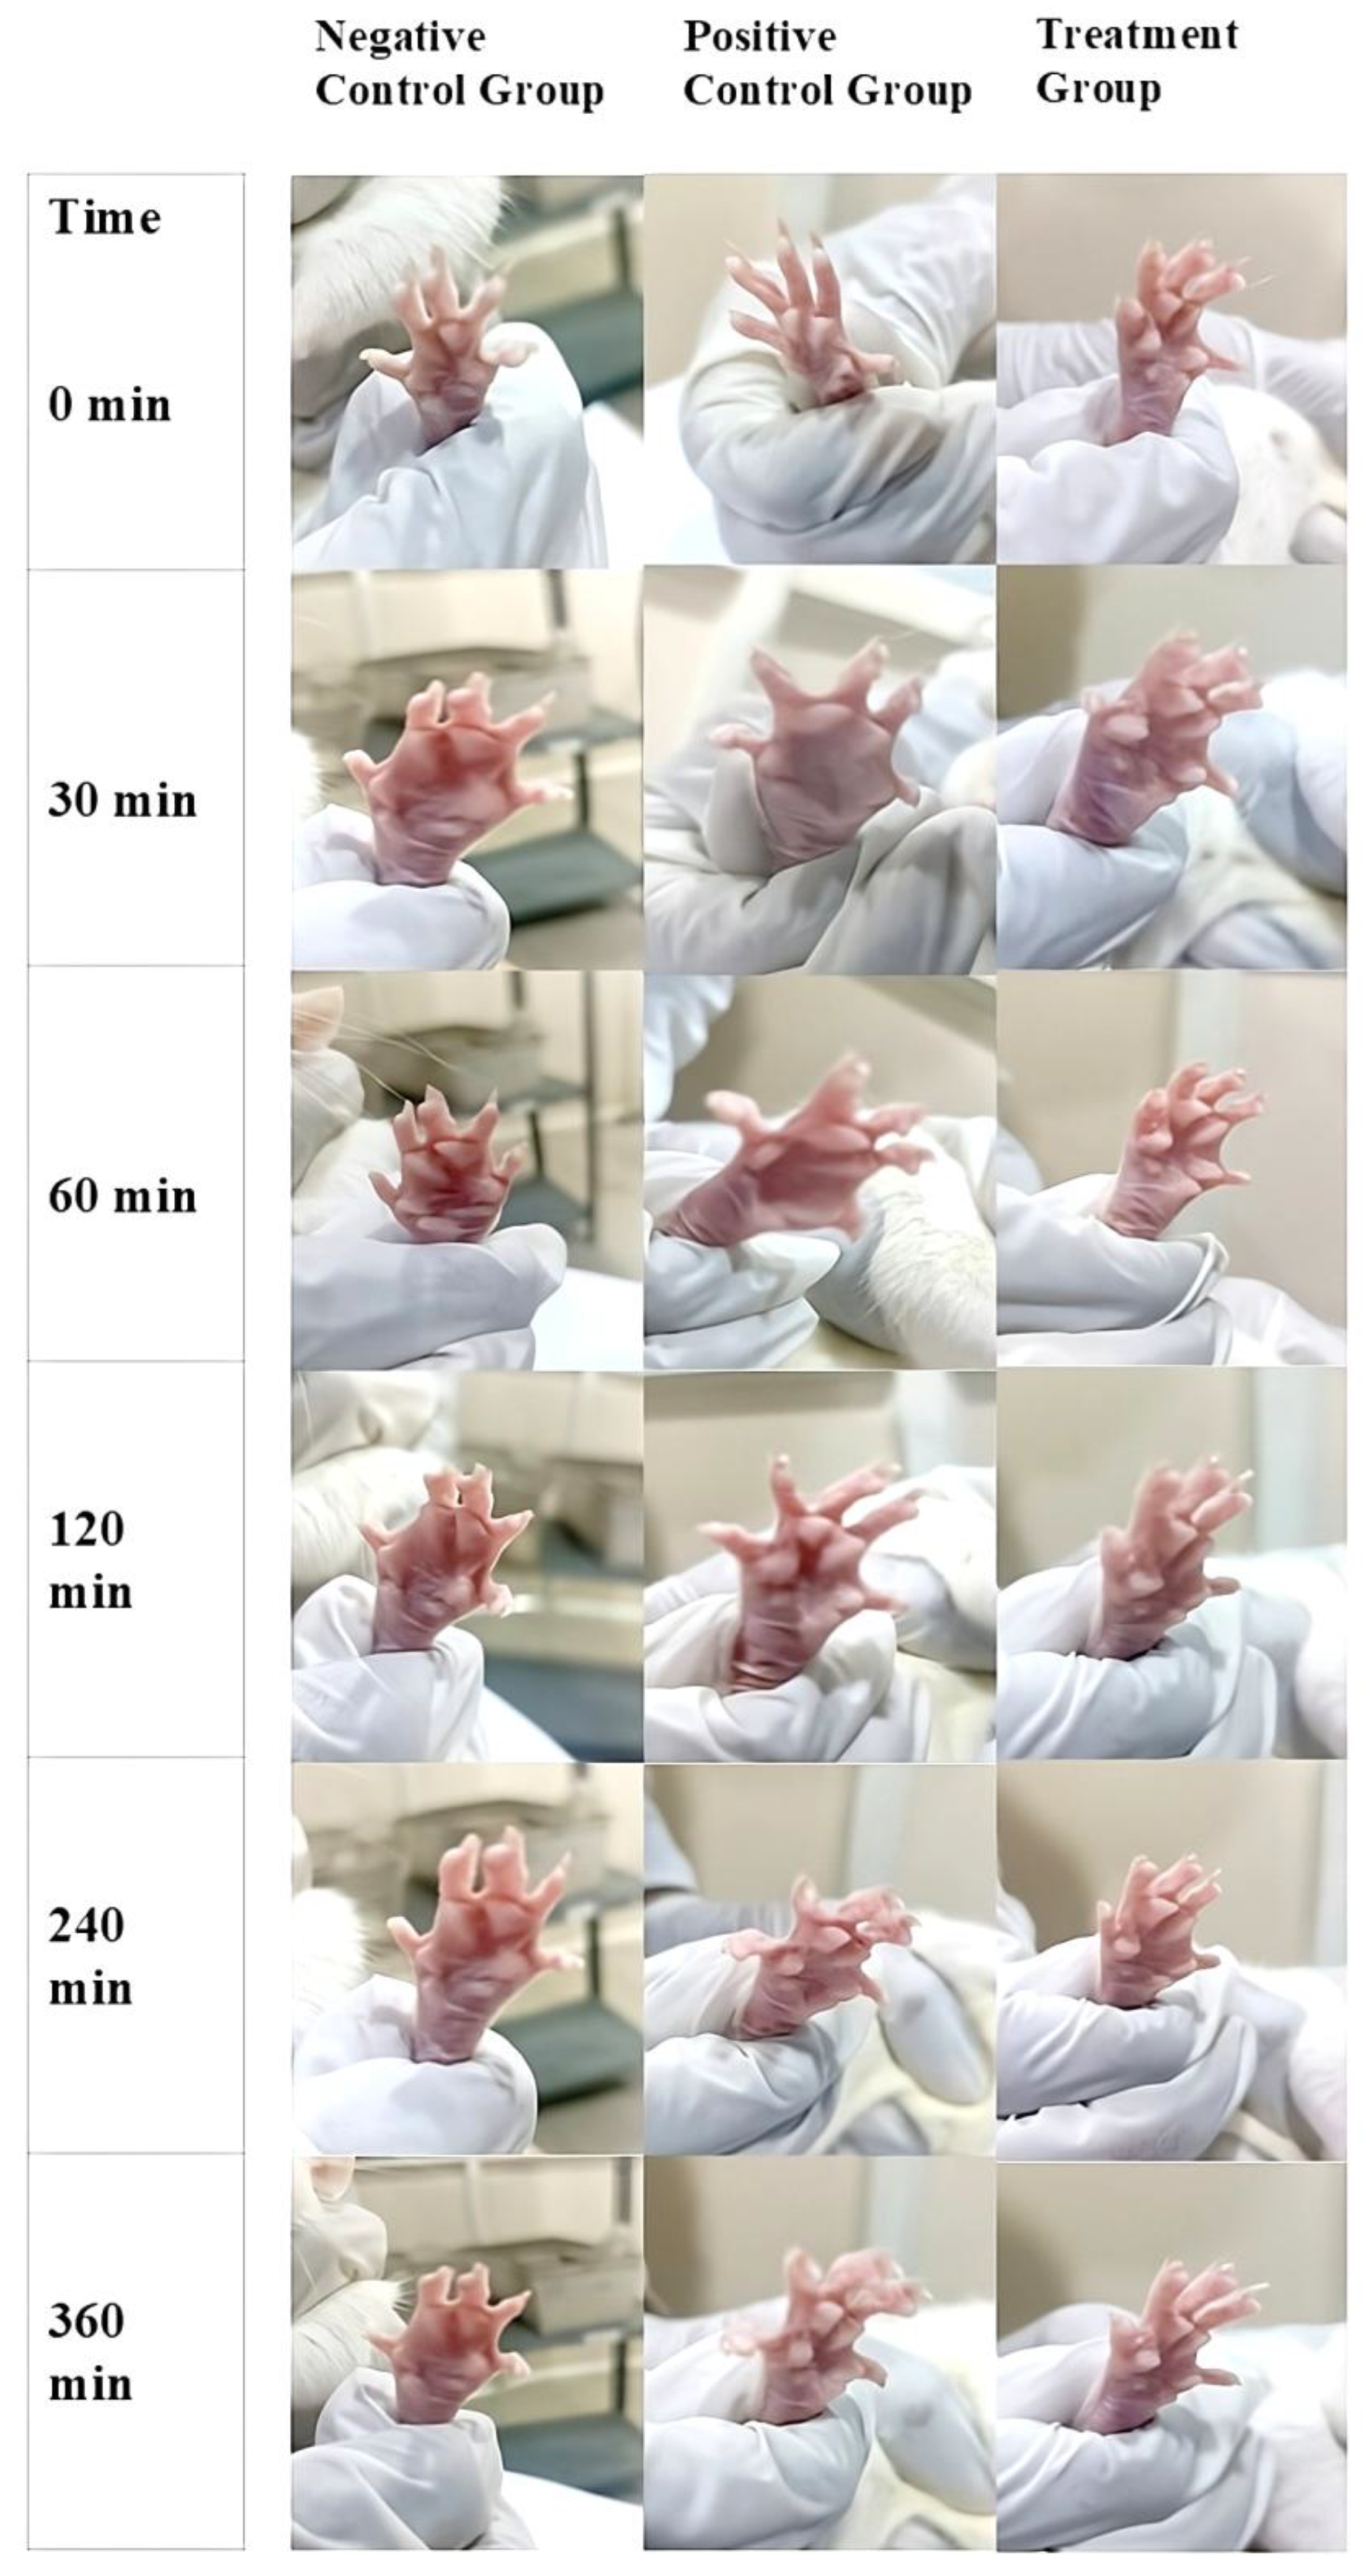

Table 1.
FTIR Absorption Peaks of Kanuka Oil and Their Functional Group Assignments.
| Wavenumber (cm−1) | Functional Group | Accepted Range (cm−1) | Probable Compound Type |
|---|---|---|---|
| 3738.27 | O–H stretch | 3200–3700 | Phenols, Alcohols |
| 2951.18, 2927.57, 2727.26 | C–H stretch | 2800–3000 | Alkanes (saturated hydrocarbons) |
| 1735.18, 1650.78 | C=O stretch | 1650–1750 | Esters, Ketones |
| 1448.81, 1322.20 | C–H bending | 1300–1500 | Alkanes |
| 1123.89, 1102.64 | C–O stretch | 1000–1300 | Ethers, Alcohols |
| 1027.69, 787.17, 882.51 | C=C bending | 650–1000 | Terpenes, Phenolics |
| 531.52, 449.52 | Fingerprint region | <600 | Specific spectral features |
Table 2.
Experimental Design Matrix with Observed Particle Size and Zeta Potential values.
| Formulations | Tween 80 (%) X1 | Homogenization time (min) X2 | Particle Size (nm) | Zetapotential |
|---|---|---|---|---|
| 1 | 4.0 | 20.0 | 136.67 | -28.5 |
| 2 | 6.0 | 30.0 | 101.76 | -29.9 |
| 3 | 2.0 | 10.0 | 184.90 | -16.9 |
| 4 | 4.0 | 20.0 | 119.78 | -29.1 |
| 5 | 1.2 | 20.0 | 145.87 | -19.4 |
| 6 | 4.0 | 20.0 | 113.23 | -24.7 |
| 7 | 2.0 | 30.0 | 132.50 | -27.4 |
| 8 | 4.0 | 20.0 | 125.38 | -27.6 |
| 9 | 4.0 | 34.1 | 100.65 | -28.3 |
| 10 | 4.0 | 05.9 | 148.23 | -19.5 |
| 11 | 4.0 | 20.0 | 118.34 | -26.8 |
| 12 | 6.8 | 20.0 | 129.45 | -31.5 |
| 13 | 6.0 | 10.0 | 155.40 | -25.6 |
Table 3.
ANOVA Summary for Model Significance and Statistical Analysis.
| Factor | df | Total Sum of Squares | Average Square | F-Ratio | Probability value | Significance |
|---|---|---|---|---|---|---|
| Model | 5 | 5462.94 | 1092.59 | 7.68 | 0.0092 | Significant |
| Error | 7 | 995.58 | 142.23 | - | - | - |
| Total | 12 | 6458.53 | - | - | - | - |
| Intercept | - | - | 122.68 | 23 | <0.0001 | Highly significant |
| Tween 80 | 1 | - | -10.43 | -2.47 | 0.0426 | Significant |
| Homogenization Time | 1 | - | -21.67 | -5.14 | 0.0013 | Highly significant |
| Tween 80 × Homogenization Time | 1 | - | -0.31 | -0.05 | 0.96 | Not significant |
| Tween 80 × Tween 80 | 1 | - | 10.64 | 2.35 | 0.0509 | Marginally significant |
| Homogenization Time × Time | 1 | - | 4.03 | 0.89 | 0.4027 | Not significant |
| R2 | - | 0.8462 | - | - | - | Indicates strong model fit |
| Adjusted R2 | - | 0.7942 | - | - | - | Adjusted for predictors |
Table 4.
Acute Dermal Irritation Scores of different groups.
| Time Point | Kanuka Nanoemulgel 1 | Positive Control (Formalin) 1 | Negative Control (Blank Gel) 1 | p-value 2 |
|---|---|---|---|---|
| 1 hour | 1.0 ± 0.5 | 2.0 ± 0.5 | 0.0 ± 0.0 | 0.0319 |
| 24 hours | 0.0 ± 0.0 | 2.0 ± 0.0 | 0.0 ± 0.0 | 0.0183 |
| 48 hours | 0.0 ± 0.0 | 2.0 ± 0.5 | 0.0 ± 0.0 | 0.0211 |
| 72 hours | 0.0 ± 0.0 | 1.0 ± 0.0 | 0.0 ± 0.0 | 0.0183 |
1 n = 3 (median ± IQR). 2 p < 0.05, significant difference between groups (Kruskal-Wallis test).
Table 5.
In Vivo Anti-Inflammatory Assessment: Edema Inhibition and Statistical Comparisons.
| Time (min) | Negative Control Group (mL) 1 | Positive Control Group (mL) 1 | Treatment Group (mL) 1 | Inhibition of Edema (%) | Group Comparisons | Mean Difference (mL) | p-value 4 |
|---|---|---|---|---|---|---|---|
| 0 | 0.00 ± 0.00 | 0.00 ± 0.00 | 0.00 ± 0.00 | - | - | - | - |
| 30 | 0.39 ± 0.005 | 0.30 ± 0.004 | 0.22 ± 0.003 | 23.1 2/ 43.6 3 |
Control vs. Standard | -0.9 | 0.038 |
| 60 | 0.38 ± 0.004 | 0.28 ± 0.003 | 0.16 ± 0.002 | 26.3 2/ 57.9 3 |
Control vs. Treatment | -2.2 | 0.005 |
| 120 | 0.37 ± 0.003 | 0.21 ± 0.002 | 0.08 ± 0.001 | 43.2 2/ 78.4 3 |
Standard vs. Treatment | -1.3 | 0.089 |
| 240 | 0.36 ± 0.002 | 0.07 ± 0.001 | 0.02 ± 0.001 | 80.5 2/ 94.4 3 |
- | - | - |
| 360 | 0.35 ± 0.001 | 0.00 ± 0.00 | 0.00 ± 0.00 | 100 2,3 | - | - | - |
1 Mean ± SEM (n = 6). 2 Inhibition percentage relative to the Positive Control Group (Standard, S). 3 Inhibition percentage relative to Treatment Group (T). 4 Statistical significance set at p < 0.05.
Disclaimer/Publisher’s Note: The statements, opinions and data contained in all publications are solely those of the individual author(s) and contributor(s) and not of MDPI and/or the editor(s). MDPI and/or the editor(s) disclaim responsibility for any injury to people or property resulting from any ideas, methods, instructions or products referred to in the content. |
© 2025 by the authors. Licensee MDPI, Basel, Switzerland. This article is an open access article distributed under the terms and conditions of the Creative Commons Attribution (CC BY) license (http://creativecommons.org/licenses/by/4.0/).
Copyright: This open access article is published under a Creative Commons CC BY 4.0 license, which permit the free download, distribution, and reuse, provided that the author and preprint are cited in any reuse.


