Submitted:
25 July 2025
Posted:
29 July 2025
You are already at the latest version
Abstract
Reducing energy consumption in belt conveyor systems is critical to improving the overall energy efficiency of lignite mining operations. This study presents a theoretical and empirical analysis of energy use in overburden and coal conveyors, with a focus on balancing the relationship between belt speed and load. Building on the theory of conveyor motion resistance, the Energy Consumption Index (WskZE)—previously introduced by the authors—is revisited as a function of two key variables: belt speed (v) and real-time material flow rate (Qr). Empirical validation was conducted using operational data from variable-speed conveyors in the Konin lignite mine and compared to similar-length conveyors in the Belchatów mine. In Konin, tests were performed under two operational scenarios: (i) constant belt speed with varying excavator output, and (ii) constant output with varying belt speed. The results confirm that WskZE is linearly dependent on belt speed and inversely proportional to throughput, as predicted by theoretical models. However, findings also show that lowering belt speed—while effective in reducing energy use—results in a higher proportion of power being consumed to move the belt and heavy idlers, especially when these components are sized for peak loads. The study suggests a revised conveyor design philosophy (a new paradigm) that emphasizes maximizing the mass ratio of transported material to moving components. Additionally, it recommends integrating real-time monitoring of energy performance indicators into mine control systems to enable energy-aware operational decisions.
Keywords:
belt conveyors
; energy consumption
; lignite mining
; variable speed drives
; energy efficiency index
1. Introduction
This study addresses the analysis of electric energy consumption by coal conveyors in a brown coal mine. Unlike previous studies that utilized empirical data from the mine [1,2,3], this paper presents theoretical considerations regarding reducing energy consumption of conveyors. Prior analyses of data from the Belchatów mine were conducted without reference to the theory of conveyor motion resistance, resulting in empirically selected functions that were not theoretically motivated. This paper transitions from examining factors influencing energy consumption and classical relationships for determining total conveyor motion resistance to exploring power demand and the unit Energy Consumption Index (WskZE), as defined in earlier works [1,2,3,4,5,6].
The derived dependencies were verified using empirical data published in other studies, focusing on one of the conveyors from the coal conveyors line in the Drzewce lignite pit in the Konin lignite mine. This line allows for belt speed adjustments, providing a unique opportunity to analyse the impact of speed changes on energy demand fluctuations. The test results have been documented in several works by various authors from Poland [7,8,9,10] and abroad [11], as the subject is current. Both from theoretical calculation of savings [12,13,14], the capability of control speed and speed adjustments [13,15], as well as application in an industrial environment [14,15,16].
Polish studies [8,9,10,17] describe the energy consumption of the DW5 conveyor, which is similar in length (940 m) to the previously analysed A and B conveyors in the Belchatów mine [1,2,3]. Unlike the Belchatów mine, the excavator’s efficiency remained constant during the test period, while the belt speed and, consequently, the degree of conveyor belt trough filling were adjusted.
This paper theoretically and empirically determines the ratio of the power demand of the conveyor in idle motion (without mined material) to the power required to operate the conveyor under load. This analysis reveals the extent of energy waste associated with transporting an empty belt. This quotient is compared to the ratio of the mass of the transported mined material to the mass of the hauler in tire transport.
Such a comparison highlights the significance of the ratio of the mass of the mined material to the mass of the belt and idlers per running meter of the conveyor route in determining the energy efficiency of the conveyor [16,17]. Reducing the speed while maintaining efficiency is beneficial for existing lines, but for new conveyors, it is essential to reconsider the principles of belt conveyor and belt selection. The need for conveyors to handle maximum (peak) momentary efficiency, which occurs infrequently [18,19,20,21,22], results in long-term energy costs for transporting a wide and heavy belt, even when operating at an average efficiency of 30%-40% of the theoretical efficiency [23].
Revisiting this design paradigm and managing peak performance through surge tanks behind the excavator could ensure an even stream of mined material, adjusted to the optimally selected efficiency percentile, is fed to the receiving conveyors [20,21,22]. Additionally, better utilization of machine working time, given the low degree of calendar time utilization, could allow for longer exploitation of mined material at lower efficiency, thereby better fulfilling nominal capacity [23,24].
2. Theoretical Model of Energy Consumption–Factors Affecting Energy Needs
During stable operation, the driving force of the driving drum equals the total motion resistance that must be overcome [7,27]. According to the DIN 22101 [28] standard, the total resistance to the movement of the conveyor (FC) can be divided into four main components: the main resistance (FG), the concentrated resistance (FS), the lifting resistance (FH), and the additional resistance (FD) (Equation (1)):
The total motion resistance can be calculated using Equation (2):
where mi, mb, and ml represent the mass of the idlers (i), belt (b), and load (l) per meter of the route length (in kg/m). The individual elements of this formula can be presented as the sum of the components for homogeneous sections of the conveyor route characterized by the same parameters (e.g., the angle of route inclination δ). For simplicity, it is assumed that the conveyor is homogeneous in this respect. The goal is not to calculate the exact resistance to motion, which should be done using specialized software considering all necessary details [29], but to illustrate the factors influencing the general proportions of the impact of various factors on the total resistance of the conveyor.
The mass ml of the mined material weighing down 1 meter of the conveyor belt length can be calculated from the conveyor capacity Qr and the belt speed v using Equation (3):
where the conveyor capacity Qr is given in Mg/h and the belt speed v in m/s.
The weight of the belt per meter of conveyor length is calculated using Equation (4):
For the analyzed conveyors with a belt width of B=1.6m, 1 m2 of belt weighs mbu=45.88 kg/m2, and 1 running meter weighs mb=73.4 kg (1.6×45.88), giving a total belt weight of 146.8 kg (2mb).
The mass (mi) of rotating parts of idlers per meter of conveyor length is calculated using Equation (5):
Figure 1.
Geometry of the conveyor support set in the upper and lower strands (after [7]).
Figure 1.
Geometry of the conveyor support set in the upper and lower strands (after [7]).
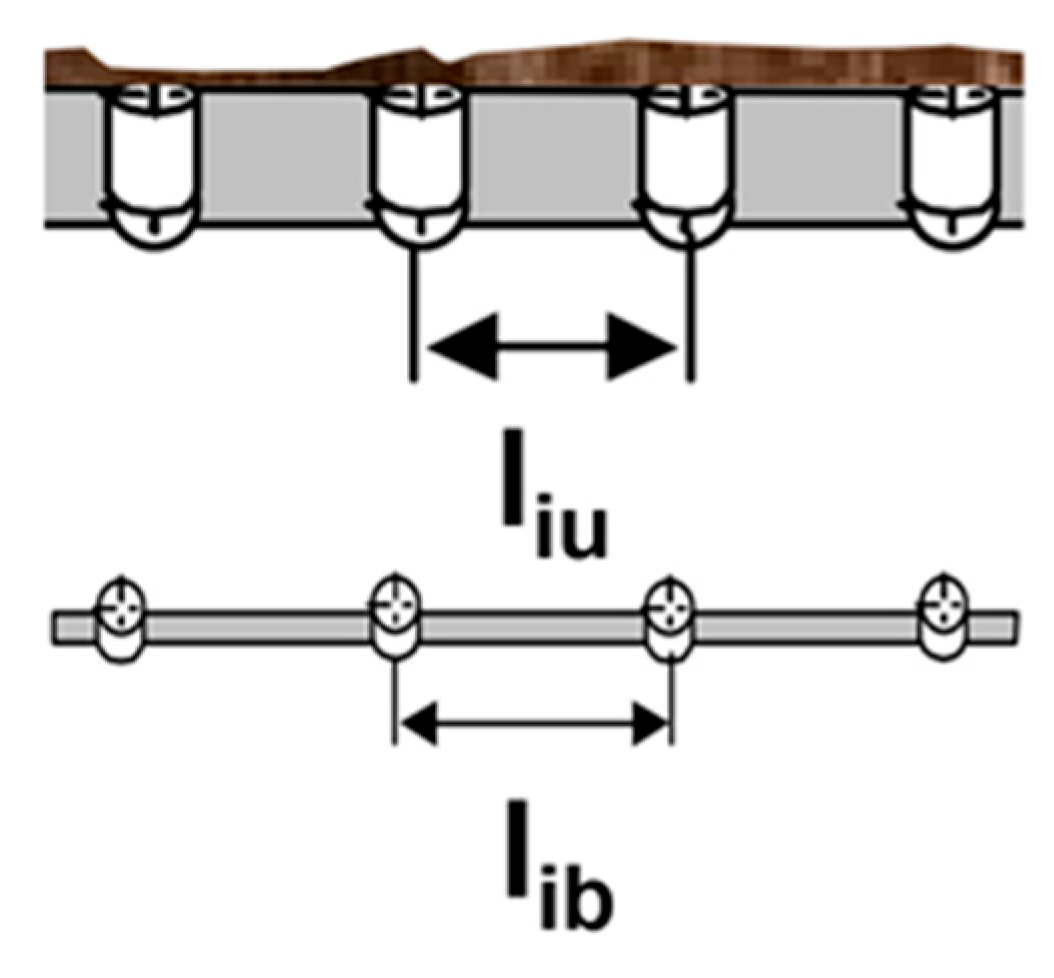
The route of the analyzed conveyors consists of repeatable elements, as shown in the drawing (Figure 2).
For one 6-meter-long set of support, there are five upper sets with a total weight of 609.5 kg (each set contains three idlers, and their total weight is 121.9 kg), and one set of lower idlers with a weight of 69.8 kg. In total, the rotating parts weigh 679.3 kg, and one running meter of conveyor weighs approximately 113.2 kg.
At full load of the conveyor (its operation with a theoretical capacity of Qtheor=6,400 Mg/h), there is only 339.27 kg of excavated material (according to Table 3) per meter of belt. When working with a load of 30-40%, the amount of excavated material varies within the range of 101.78 kg to 135.71 kg. The influence of the weight of the belt and idlers has a significant impact on the total resistance, as their weight per meter of belt (260 kg) is twice that of the excavated material 0.30 (=102.78/260) and 0.52 (=135.71/260). This worsens the proportions for full load 1.3 (=339,27/260), for which the belt weight accounts for 43.27% of the total load (=146,8/339,27) and the idlers weight for 33.37% (=113.2/339.27). In total, the idlers and belt weight is then 76.64% of the full load, which provides a similar ratio of transported excavated material to moving mass of 1.3 (=339.27/260) as in the most efficient trucks and dumpers e.g., Belaz-75710 1.25 (=450/360) [30]; Caterpillar 797F 1.28 (=400/312) [31]; Liebherr T 284 1,54 (=363/236) [32]).
Unfortunately, when the load on the conveyor falls below the nominal load, this ratio is much worse. In the analysed case of a 40% load, this ratio is approximately 0.39, which roughly corresponds to the proportions of dumpers on the route in both directions, with and without excavated material during the return e.g., 0.4 for Belaz-75710 . We use energy twice to transport the machine, and only in one direction we transport excavated material with a weight corresponding to the weight of the dumper. In conical pits the truck can recuperate energy moving down but it requires much more energy going up. On the flat surface truck has to go twice with load and without. In belt conveyor we move belt in upper and bottom part in the same time. Resistance to motion consider both movements.
The energy demand required to transport the mined material by conveyor should be estimated based on knowledge of the friction coefficient (FC). The necessary power (PC) needed to drive the conveyor, which must be transmitted by the drive system, is calculated using Equation (6) [7]:
where η is the efficiency of the conveyor drive.
3. The Energy Consumption Index WskZE
Knowing the power demand, we can determine the unit Energy Consumption Index for transporting 1 Mg over a distance of 1 km (WskZE). If we assume that the conveyor operates with the efficiency Qr (Mg/h) for the time T (given in hours), then it transports the mass TQr of the mined material (in Mg), and the Energy Consumption Index WskZE can be calculated from Equations (7) and (8). Similar findings were observed in a recent papers based on four years of operational data from a Polish lignite mine, where a 35% increase in average load reduced the unit Energy Consumption Index (WskZE) by 26% [1,2,3].
After inserting FC (Equation (2)) into Equation (8), we get Equations 9-11:
We can already see that the Energy Consumption Index WskZE depends on the ratio of the unit masses of moving parts and the mass of the mined material on the belt (mi/ml and mb/ml), as well as the resistance coefficients (C and f), and the efficiency η. It also has a component that depends on the ratio of the lifting height of the mined material H and the conveyor length L. However, it does not depend directly on the length of the conveyor, as the energy consumed is calculated per kilometer of route and per metric ton of mined material.
The mass of mined material per meter of belt (mu) depends on the conveyor capacity Qr and the belt speed v (according to Equation (3)). Therefore, it is worthwhile to transform Equation (11) further:
3.1. Model Simplification for Flat Conveyors
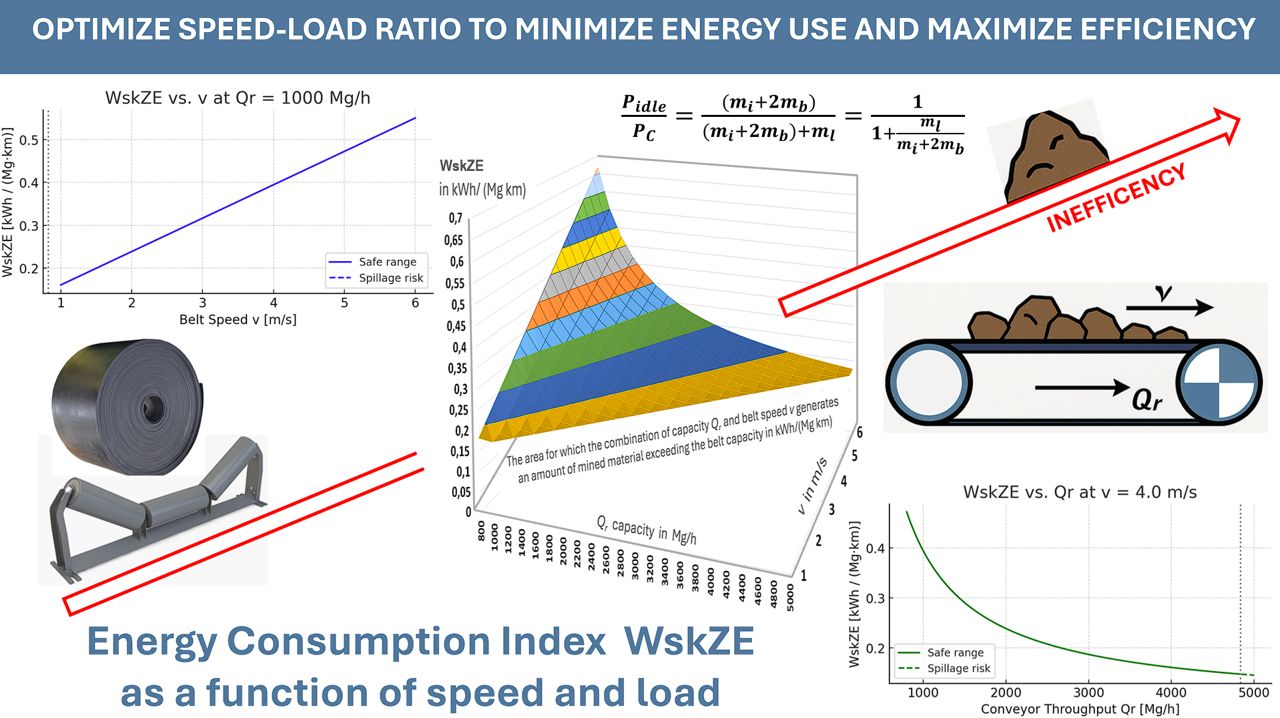
For horizontal conveyors, when H=0 and cosδ=1, WskZE (Equations (12) and (13)) becomes a function of two variables: belt speed v and actual conveyor capacity Qr, and takes the form (Equation (14)):
When Qr is reduced for a sufficiently long time (smaller than Qtheor) and constant for a reasonably long time (e.g., due to the operation of excavators in more difficult conditions), then because the energy consumption index WskZE depends linearly on the speed, it is reasonable to reduce the belt speed to the minimum value ensuring full loading of the conveyor belt. At this reduced speed (when Qr is much smaller than Qtheor), we significantly reduce energy consumption.
4. Empirical Verification Using Konin Mine Data
The linear relationship between energy consumption and belt speed is consistent with the results of industrial research. The paper [17] presents the results of research on belt conveyor drive systems, which were conducted on a 940-meter-long DW5 horizontal conveyor operating in the Drzewce opencast mine (Figure 3). The study included measurements of changes in the power consumed by the drives depending on the belt speed and the load of mined material.
In the work [23], the conveyor motion resistance coefficient is differentiated based on various parameters of the belt, conveyor, material, and even temperature. These factors can affect the quotient of power demand in motion, both with and without load, whether fully or partially. This requires separate studies. The considerations presented are estimates based on data read from the graph.
In the case of horizontal conveyors [7], which are primarily used in the belt line of the Drzewce opencast mine, the energy consumption of belt conveyors was measured as a function of changes in the belt speed at a constant load (the excavator operated with a constant efficiency Qr=833 Mg/h). Energy consumption is practically proportional to the belt speed (Figure 4).
5. Analysis of Belt Resistance and Power Ratios
The power demand (PC, in kW) can be determined from Equation (6) by inserting FC (Equation (2)):
The required power for no-load motion (Pidle) can be determined by assuming ml=0, and for a horizontal conveyor cosδ=1:
For a horizontal conveyor, when H=0 and cosδ=1, we have Equation (18):
As a result of the adopted assumptions, the ratio of power required to operate the conveyor without and with the mined material for a flat conveyor corresponds to the ratio of the mass of the moving parts of the idlers and the belt to the total mass with the mined material (Equation (19)):
The higher the ratio of the mass of the mined material to the mass of the moving parts, the smaller the share of power required to operate the empty conveyor will be of the active power required to operate the loaded conveyor. For a constant capacity Qr=833 Mg/h and speeds v=1, 2, 3, 4, and 5 m/s, this ratio changes from approximately 50.51% to 67.12%, 75.38%, and 80.33%. This does not correspond to the measurement results (Figure 4): 73.75%, 65.24%, 63.59%, 61.02%, and 58.95%, which may indicate that the amount of mined material (ml) affects the change of the resistance to motion coefficient (f), which assumes different values for idle run and work under load. It probably also changes depending on the degree of belt filling, and perhaps in another way with the belt speed. With the change in belt load, its contact zone and pressure change, and this is also influenced by the level of its initial tension, which is not taken into account here. It is therefore clear that continuing research is worthwhile, and knowledge of how the demand for power for conveyors changes at different speeds and filling levels is highly valuable.
5.1. Introduction of Variable Coefficient of Resistance f(v)
Let’s assume that the coefficient of resistance to motion depends on the belt speed. Then the power ratio will take the form (Equation (20)):
Statistical methods were used to select functions so that the product of Cf for idle and loaded operation would provide a good fit for the power demand equations. It was assumed that the conveyor has a length of L=940 m, the mass of the moving parts is 260 kg, and the capacity of 1 meter of the belt is 232.80 kg. Then Cf as a function of speed will take the form (Equations (21) and (22)):
Cfidle(v) = 0,0169222 + 0,0188338/v
Cf(v) = 0,0303286 - 0,00485153/v
These equations are not optimized for achieving the highest R2 index, but rather simple models that ensure their product with linear equations yields a linear result for idle operation and an almost linear result for load operation. They can be determined using the assumed values. The power requirements Pidle(v) and PC(v) at different speeds v, taking into account the variation of the drag coefficient Cf(v) (Equations (21) and (22)), are given by Equations 23, 23a and 24, 24a:
Pidle(v)= Cfidle (v)*2523.752 v
Pidle (v)= 47.53184 + 42.70744 v
PC(v) = Cf(v) (2523.752 v + 2246.03)
PC(v) = 55.8749 + 76.54185 v – 10.897/v
For the functions thus determined, the quotient of the demand for power of the conveyor without and with load now corresponds to the proportions determined from the graph (Figure 4) and does not deviate from them by more than +/- 2%. For the subsequent speeds of 1, 2, 3, 4, 5, and 6 m/s, the power ratio is 74.26%, 65.33%, 62.32%, 60.77%, and 59.82%, respectively. This means that even at 6 m/s, nearly 60% of the energy is used to overcome the resistance to the movement of the empty belt (ratio 1.5:1). At 1 m/s, the ratio of energy used to transport the belt to the energy used to transport the excavated material is 4:1 (Figure 5).
In the calculations, it was assumed that for the measurements described in [7], the speeds were selected so that the capacity Qr=833Mg/h filled the belt trough by about 100% at v=1m/s. With this assumption, at a speed of 5.24 m/s, the minimum nominal capacity of the line Qtheor should be approximately 4400 Mg/h, and at 6 m/s, about 5000 Mg/h. Of course, it can be higher, and then the mass of 233.80 kg/m would correspond to a lower value of the filling degree. This is not crucial for the nature and direction of changes.
For the data presented in the graph (Figure 4), it is possible to calculate and plot changes in WskZE as a function of the belt load (its degree of filling, Figure 6). The energy consumption rate decreases with the increase of the belt load (the degree of utilization of the theoretical capacity).
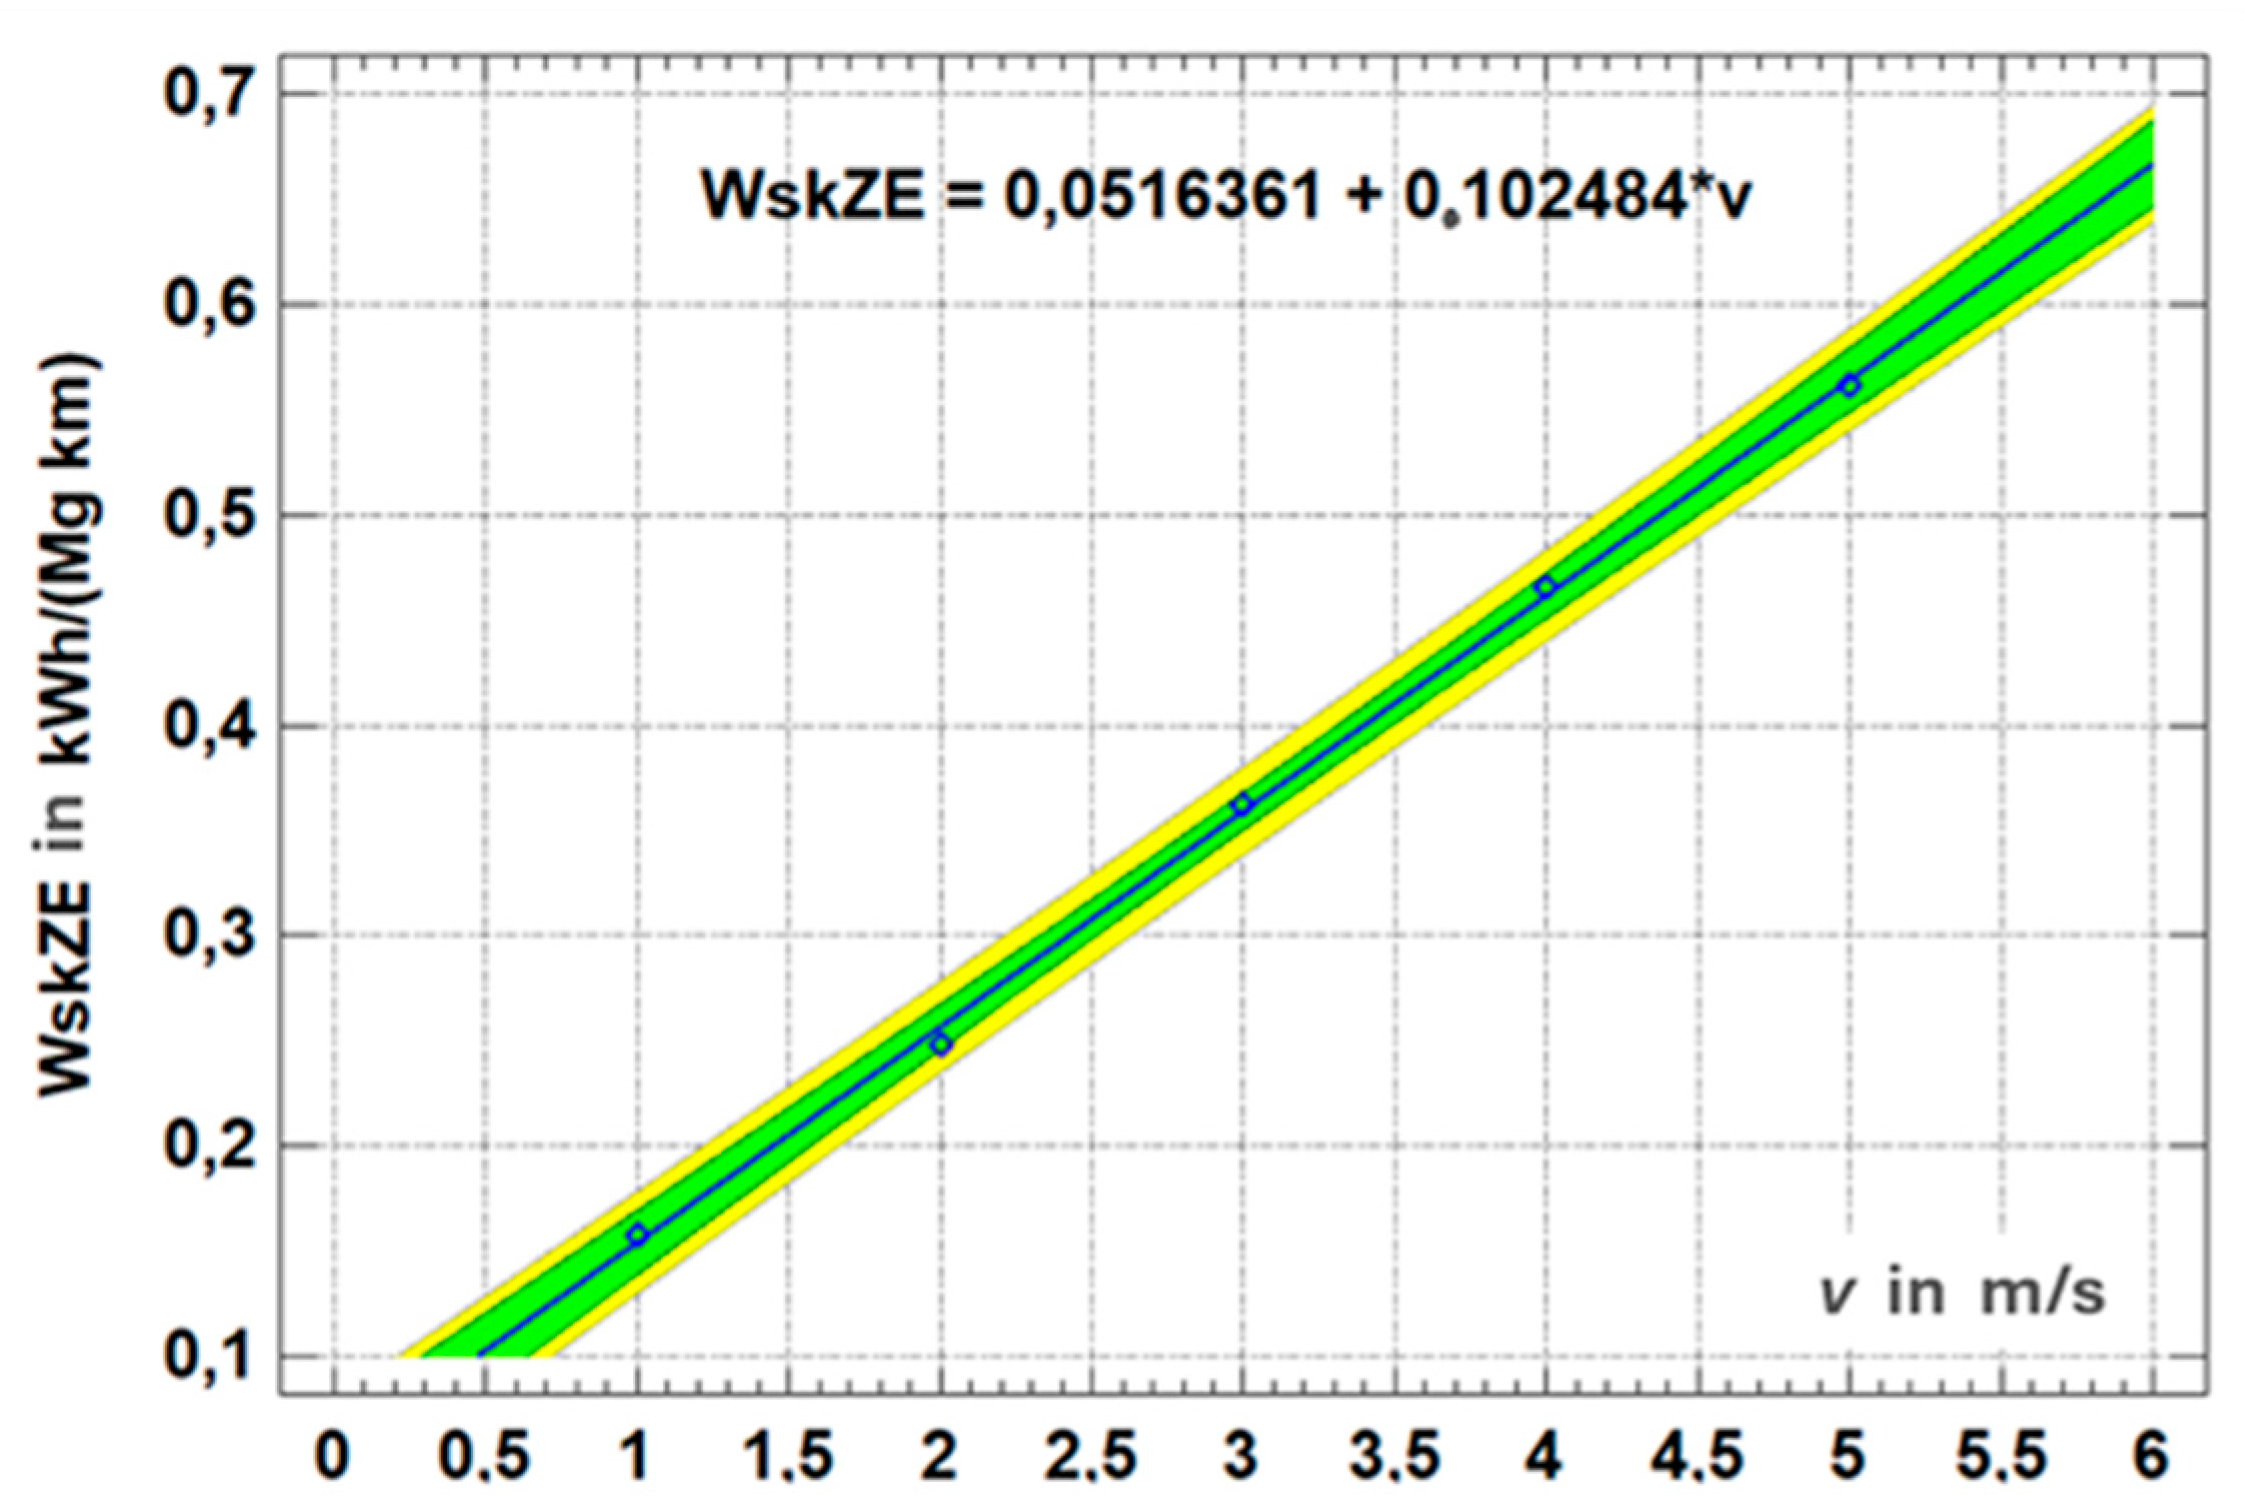
After calculating WskZE based on the measurements (according to Equation (7)), the parameters in the linear equation of Formula (14) can be selected. This will allow estimating some unknown parameters (Equation (25)):
WskZE (v)= 0,18589*(0.551314 v + 1/3.6)= 0.102484 v +0.051636
Given Cfg/η=0.18589 and (mi+2mb)/Qr=0.551314.
This allows us to estimate the weight of the belt and rollers at approximately 459.24 kg/m, which appears to be an excessively high value in light of the value determined for the conveyors from the Belchatów mine (260 kg/m).
Figure 7.
WskZE as a function of belt speed for constant excavator performance for the DW5 conveyor (based on [1]).
Figure 7.
WskZE as a function of belt speed for constant excavator performance for the DW5 conveyor (based on [1]).
After applying the estimates from Belchatów, the equation is slightly modified, and the estimation error increases slightly, but the equation parameters are closer to the actual data (Equation (26), 26a):
WskZE = 0.299555*(260*v/833+1/3,6)
WskZE = 0.093498559 v +0.083209722
Given Cfg/η=0.299555, the change in capacity and speed must meet the condition of the maximum amount of excavated material that can be transported on the belt. It was assumed that this quantity is 233.25 kg/m (=4 400 /(3.6*5.24)). In the graph (Figure 8), this is illustrated by removing data for about half of the graph below the diagonal (833 Mg/h, 6 m/s). If, due to transfers, only the maximum amount of excavated material remains on the belt, then WskZE will no longer depend on Qr and v, because the belt cannot accept more loaded material. From Equation (11), it follows that this indicator depends on the amount of loaded material ml (for a given route structure, which determines the values of mi and mb). Qr and v are used only to determine this amount, provided that it does not exceed the maximum value resulting from the capacity of the belt.
6. Calculation of WskZE for Konin Mine and Comparison with Belchatow Mine
Similar results were presented in two works [8,33]. They also concern horizontal belt conveyors from the Drzewce opencast mine, where the energy consumption of belt conveyors was measured as a function of belt speed changes at a constant load on a coal line with adjustable conveyor speed. These papers also confirmed that energy consumption is proportional to the belt speed (Figure 9). Unfortunately, the graphs presented in two publications [8,33] appear ambiguous in terms of the description of the x-axis, making it difficult to conclude, so the figures (Figure 9) are only estimations. Both articles present similar proportions of energy consumed in idle run to energy used to transport coal with constant efficiency.
Despite the ambiguity of the x-axis description, these data can be used in rough WskZE calculations (according to Equation (7)). It was assumed that the data originated from a variable-speed line in the Drzewce opencast mine, which operated at a capacity of 833 Mg/h, and most likely from the same DW5 flat conveyor, as mentioned in other studies [17].
For the general case, it can be seen that the power PC depends linearly on L, which is why the conversion of the specific energy consumption per 1 km of route in the formula for WskZE (according to Equation (14)) removes this influence. Notably, to calculate the consumption for the entire route, WskZE should be multiplied by the route length L given in kilometres.
The slope of the straight line for determining the demand for conveyor power PC (Equation (15)-18) is 0.94Cfg(mi+2mb)/(1000η). Clearly, the greater the mass of the idlers and belt per meter of the conveyor, the faster the power required to overcome the resistance to movement increases. The increase in the conveyor’s capacity moves the entire line vertically, increasing the required power when Q increases or decreasing it when Q decreases. Notably, certain combinations of Q and v are not feasible to implement, as each speed has a limiting efficiency resulting from the belt’s capacity. Therefore, it is not possible to reduce demand by reducing speed and increasing efficiency. Savings can be achieved by reducing the speed when the efficiency drops for some reason. Real data from measurements in the mine confirm this.
In the work [9] for the 5.716 km-long chain of coal conveyors in the Drzewce opencast mine of KWB Konin, the specific energy consumption index was determined. WskZE was 0.26141 kWh/(Mgkm). During one month, 187.196 kWh of electric energy was used to transport 125,280 tons of coal over a distance of 5.716 km (Table 1].
In this article [9], WskZE was determined for a larger number of overburden and coal lines in the KWB “Konin”, but the one from the Drzewce open pit resembles conveyors A and B analysed in the works [1,2,3], especially the DW5 conveyor, which is 940 meters long, i.e., almost 1 km. Its distinguishing feature is the possibility of speed regulation, which resulted in a reduction of WskZE from the average level in other open pits of approximately 0.4997 kWh/(Mgkm) (0.442 kWh/(Mgkm) in the Lubstów branch, 0.594 kWh/(Mgkm) in the Jóźwin branch, 0.463 kWh/(Mgkm) in the Kazimierz branch) to the level of 0.261 kWh/(tkm). This is a reduction of approximately 50%. It is important that the low level of the WskZE indicator in the KWB “Bełchatów” was achieved without speed regulation, and the benefits of using energy-saving belts will be shown in the next paper. The average value of this indicator was 0.2886 kWh/(tkm) (conveyor A) and 0.3036 kWh/(tkm) (conveyor B) [1,2,3]. It is evident that there is still potential for further energy savings, making it worthwhile to continue researching various possibilities for reducing this indicator.
Similar results were presented in [33]. The Konin lignite mine operates conveyors with a total length of 50 km. The length of belt conveyors with adjustable belt speed in the coal line constitutes 12% of the total length of the conveyors in operation. Between May 2006 and March 2007, 3,328.781 MWh of energy were used, and 2,323,101 Mg of coal were transported over a distance of 5,867 km. The energy consumption index was 0.244 kWh/(Mgkm). The analysed line operated at a speed of 3 m/s for 8 months and at 2.5 m/s for 3 months. The achieved index was therefore slightly lower than that presented in Table 1. Energy consumption is therefore over 50% lower than in the Kazimierz open-pit mine (0.434 kWh/tkm) and the Jóźwin open-pit mine (0.622 kWh/tkm). As a result, energy consumption was reduced by 4.2% throughout the plant.
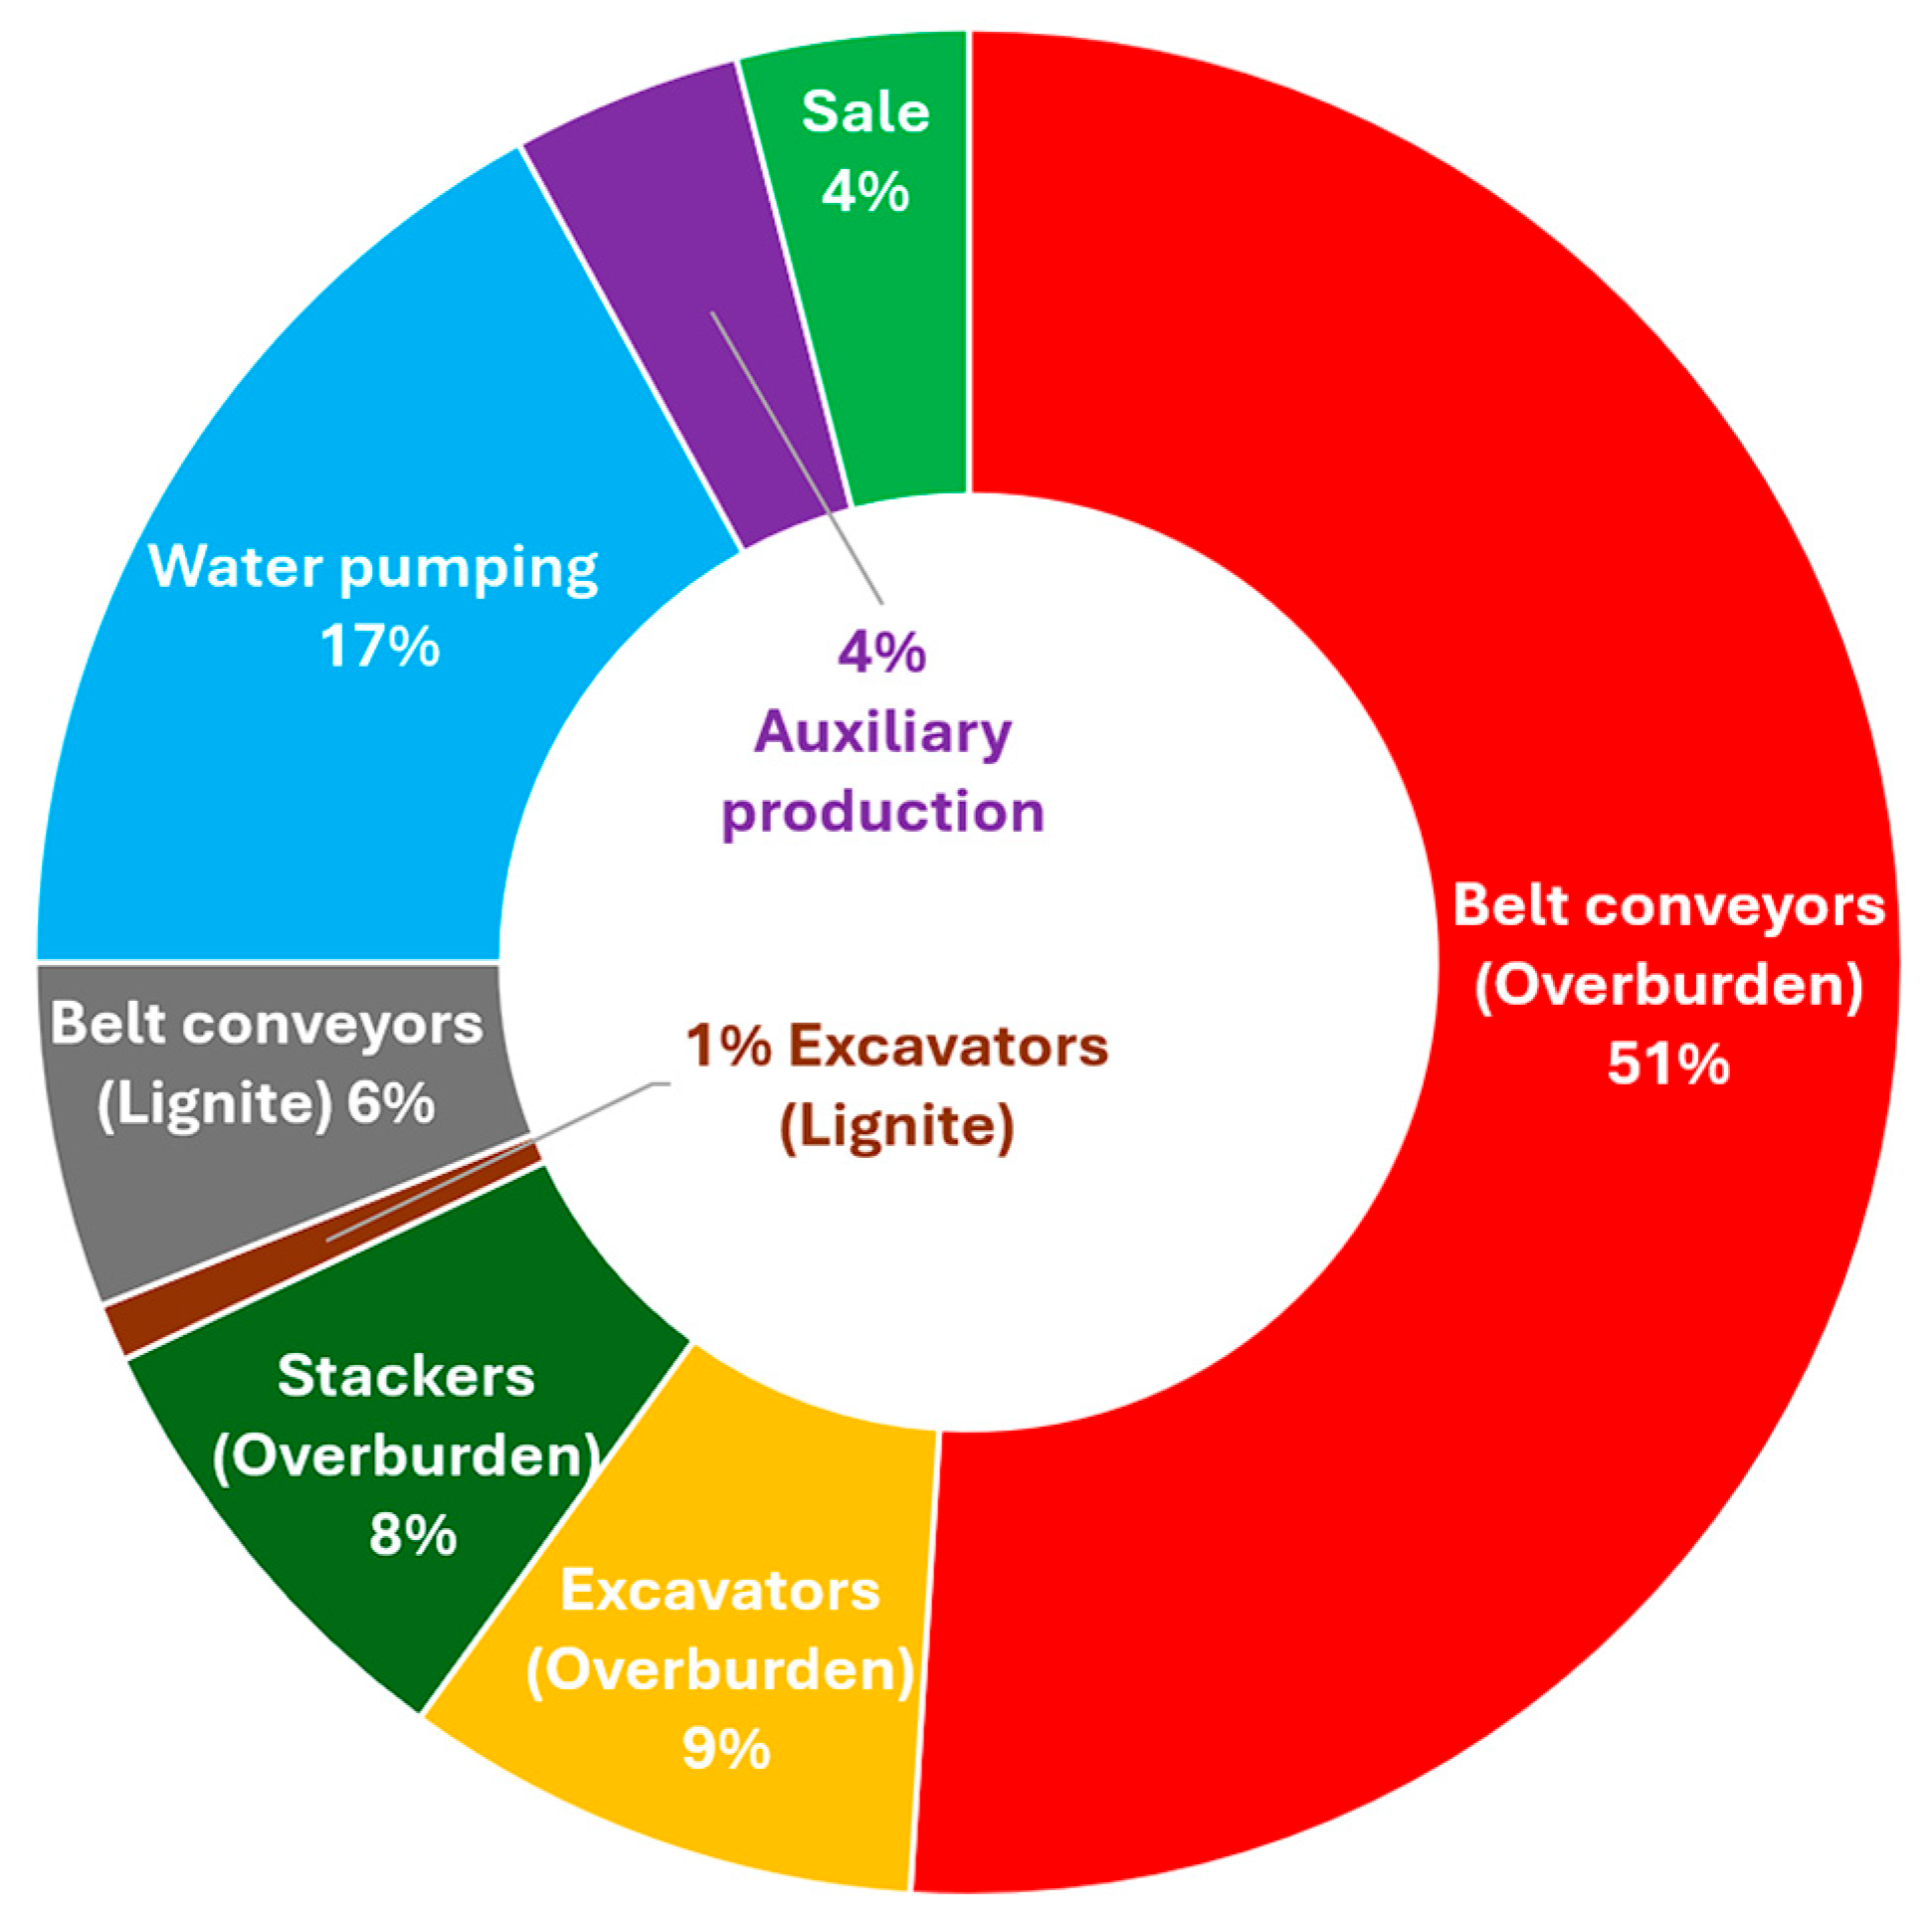
In the Konin Coal Mine, approximately 70% of the electricity is consumed by the drive systems [17]. The overburden conveyors consume 51%, and the coal conveyors consume 6%, as coal is transported to the power plant by train. Overburden excavators consume 9%, coal excavators 1%, and stackers 8%. In total, this accounts for 78% of the mine’s total energy consumption, and the mine consumes approximately 350 GWh per year [10].
According to the authors [13], the optimal consumption of electric energy occurs when the conveyor operates with a nominal load. Since the load of the conveyor belt depends on the type of material transported by the belt (coal, overburden) and on the excavator’s capacity, which is variable, the conclusion is that the belt speed should be adjusted to the current load [13]. Due to the diversified geological structure of coal seams, it is not possible to ensure a constant efficiency of the coal excavator, which would simultaneously provide the nominal load of the belt conveyor at a constant nominal speed of 5.24 m/s. In such applications, to ensure the nominal filling of the belt, it is necessary to adjust the conveyor belt speed to match the excavator’s instantaneous efficiency [22,34].
Figure 10.
Energy consumption of the Konin Coal Mine, divided into individual technical processes [9].
Figure 10.
Energy consumption of the Konin Coal Mine, divided into individual technical processes [9].
The scale of savings achieved (4.2% on a mine scale) thanks to modifications of 12% of transport routes seems significant. However, the problem lies in forecasting efficiency in advance, which would enable matching the speed to the expected efficiency during the entire conveyor’s loading period.
7. Discussion of Results
The results demonstrate that energy consumption in conveyor systems is highly sensitive to belt speed v and the variability of excavator output Qr. While reducing speed can lower the energy consumption index (WskZE), it also lengthens transport time. For a 2 km-long conveyor, transport time increases from 6.36 minutes at 5.24 m/s to 13.33 minutes at 2.5 m/s, and over 33 minutes at 1 m/s. To achieve energy savings, the lowered excavator’s efficiency must remain relatively stable during this extended transport period. If efficiency increases during this time, material spills may occur if the speed cannot be quickly adjusted to match throughput, thereby negating the intended energy benefits.
This points to the necessity of synchronizing speed adjustments with precise excavator operation schedules, taking into account known field obstacles such as buried concrete pipes in drainage shafts [34] or difficult-to-excavate layers [19]. In [9], an algorithm was proposed to adapt the belt speed based on real-time excavator performance; however, no practical implementation has been reported. Observations in [21] showed that during the excavator’s working cycle, momentary performance drops can occur—down to zero—when the wheel is not in contact with the bench. Such pauses may last several seconds or even longer during manoeuvring, making it economically inefficient to follow such fluctuations with real-time belt speed adjustments. These rapid changes form a non-stationary stochastic process, characterized by intermittent but repeating cycles [21,22], and can only be modelled as stationary and ergodic over short time intervals [22,35]. The non-stationarity is further exacerbated by changing geological conditions and frequent anomalies in mining operations.
To address these challenges, one solution proposed is the integration of buffer hoppers behind the excavators to absorb rare peaks in excavation rates. This enables a more constant flow to the conveyor system, without needing to oversize belts or dynamically track every fluctuation in real-time. Instead of sizing the belt for rare maximum loads, a buffer-based system smooths the flow to a selected performance level—typically defined by an optimized percentile (e.g., 90th) of excavator output [20,21,22]. Excess material is temporarily stored and released when output drops. The size and parameters of such hoppers should be optimized jointly with belt width and speed.
Further evaluation can be conducted using DEM (Discrete Element Method) simulations, which model the mechanical and flow behavior of excavated material under varying moisture and weather conditions [36,37,38]. Without such a buffer, belts must be selected to handle rare maximum loads, resulting in wider and heavier belts with disproportionately large energy consumption and wear—especially in the central zone (see Figure 11).
Furthermore, our findings confirm that the assumption of constant gravity-related resistance (Cfg) is not valid across all speeds. Analysis of the DW5 conveyor in the Konin mine shows that the ratio of idle power to loaded power demand changes significantly with speed, indicating that Cfg should be treated as a variable component. These dynamics should be incorporated into updated theoretical models.
The inefficient use of very wide belts—sized for rare peaks—is also critiqued. Selecting such belts results in a high share of moving mass (component mi + 2mb in Formula (15)), which increases energy consumption even during average operational loads. As found in [20,23,24], extreme capacity utilization is rare, and wide belts are often underfilled, particularly when the belt runs at full speed and the excavator slows down. This contributes to belt wear and energy waste.
Advanced statistical tools should be more widely employed. Analysis of energy use, mass transport, and operating time from several conveyors [1,2,3] confirms that modern mining operations collect substantial amounts of data. However, data utilization remains low. As suggested in [35,39,40], employing mathematicians equipped with advanced statistical tools can help transform raw operational data into practical insights. With the advent of Industry 4.0, data mining should be more fully integrated into mining operations. Peak Over Threshold (POT) analysis [21], combined with DEM simulations [36,37,38], can also help determine appropriate buffer sizes and predict the occurrence of peak loads.
It is also worth exploring whether installing feed and discharge storage tanks would offer a more cost-effective and energy-efficient alternative to duplicating conveyor chains. These strategies could maintain reliability while minimizing capital and operational expenditures. The Wrocław University of Science and Technology has both the personnel and the modelling capabilities to conduct such integrated transport system optimizations.
Studies on belt core wear, such as those conducted for the Bogdanka mine [18], show that under stable coal flow conditions, belt service life is more influenced by cover abrasion than by core degradation. These findings support earlier forecasts that link belt longevity to conveyor length [23,41], providing further justification for optimized conveyor layouts and speed control strategies [42,43,44]. Reduced energy consumption, improved durability, and lower costs all point to the potential for implementing the findings of this study more broadly including energy-saving belts [45], belt loading [46] and energy efficiency classification of belts and conveyors [6,47,48,49], as well as comparison of energy consumption and emissions with trucks [50].
8. Conclusions
This study demonstrates that a two-variable model for unit Energy Consumption Index (WskZE), dependent on conveyor speed and load, offers a robust framework for analyzing and optimizing conveyor efficiency. Field data from the Konin mine confirm the theoretical relationships and highlight the practical implications of variable speed control.
Reducing belt speed lowers energy use but requires prolonged stability in excavator output. Without such stability, either material spillage or energy loss due to unnecessary acceleration may occur. A key recommendation is to align conveyor control systems with detailed excavator operation planning and geotechnical conditions.
The introduction of intermediate hoppers behind excavators emerges as a promising strategy for managing load variability. These systems can reduce reliance on oversized belts and enhance the overall efficiency and durability of the transport chain. Their effectiveness should be further evaluated through DEM simulations and statistical modeling of excavation cycles.
In conclusion, the findings support a shift from static belt design towards dynamic, data-informed strategies for conveyor operation. These include intelligent speed control, optimized belt width selection, and use of buffering systems. Together, these strategies offer a path toward substantial energy savings, cost reduction, and enhanced reliability in lignite mine operations.
Author Contributions
Conceptualization, L.J. and M.B.; methodology, L.J.; software, L.J.; validation, L.J. and M.B.; formal analysis, L.J.; investigation, M.B.; resources, L.J and M.B..; data curation, L.J. and M.B.; writing—original draft preparation, L.J.; writing—review and editing, M.B.; visualization, L.J.; supervision, L.J.; project administration, M.B.; funding acquisition, M.B and L.J. All authors have read and agreed to the published version of the manuscript.
Funding
This research received no external funding.
Data Availability Statement
The data presented in this study are available on request from the corresponding author.
Acknowledgments
The authors would like to thank the mine management for providing detailed data on the energy consumption of the analyzed conveyors.
Conflicts of Interest
The authors declare no conflicts of interest.
References
- Bajda, M.; Jurdziak, L. Comparison of electric energy consumption by belt conveyors in a brown coal mine. Part 4. Theoretical considerations and verification for data from Konin. Górnictwo Odkrywkowe 2019; 60(6):4-16 (in Polish).
- Bajda, M., Jurdziak, L. Electric Energy Needs of Belt Conveyors in One of the Polish Lignite Mines - Method of Analysis. Civil and Environmental Engineering Reports 2025;35(2):170-184. [CrossRef]
- Bajda, M.; Jurdziak, L.; Konieczka, Z. Impact of Monthly Load Variability on the Energy Consumption of Twin Belt Conveyors in a Lignite Mine. Energies 2025;18(8): 2003. [CrossRef]
- Kawalec, W.; Suchorab, N.; Konieczna-Fuławka, M.; Król, R. Specific Energy Consumption of a Belt Conveyor System in a Continuous Surface Mine. Energies 2020, 13, 5214. [CrossRef]
- Suchorab, N. Specific energy consumption - the comparison of belt conveyors. Mining Science 2019;26:263-274. [CrossRef]
- Suchorab-Matuszewska, N. Data-Driven Research on Belt Conveyors Energy Efficiency Classification. Archives of Mining Sciences 2024;375-389. [CrossRef]
- Kulinowski, P. Selection of drive power and conveyor belt strength in steady-state operating conditions. Belt conveyor – calculations. Accessed 20.06.2025 (in Polish). http://www.kmg.agh.edu.pl/Dydaktyka/Przedmioty/Transport_przenosnikowy/Materialy/PT_algorytm.pdf. //www.kmg.agh.edu: http.
- Woźniak, D.; Hardygóra, M. Aspects of selecting appropriate conveyor belt strength. Energies 2021, vol. 14, no. 19, art. 6018, pp. 1-13.
- Szymański, J. Coal conveyors with adjustable belt speed. Technical and economic aspects. Górnictwo i Geoinżynieria 2009;33(2):427-438 (in Polish).
- Szymański, J. Logistic and economic issues of transporting brown coal in mines using conveyors with adjustable belt speed. Logistyka 2009;4:44-48 (in Polish).
- Jena, M.C.; Mishra, S.K.; Moharana, H.S. Experimental investigation on maximizing conveying efficiency of belt conveyors used in series application and estimation of power consumption through statistical analysis. Environmental Progress & Sustainable Energy 2023;42(3): e14031.
- Ji, J.; Miao, C.; Li, X.; Liu, Y. Speed regulation strategy and algorithm for the variable-belt-speed energy-saving control of a belt conveyor based on the material flow `rate. Plos One 2021;16(2): e0247279.
- Matras, E.; Reizer, R.; Umiński, W. Optimization of belt conveyor operation. Problemy Eksploatacji 2007;1:57-65 (in Polish).
- Wen, L.; Liang, B.; Zhang, L.; Hao, B.; Yang, Z. Research on coal volume detection and energy-saving optimization intelligent control method of belt conveyor based on laser and binocular visual fusion. IEEE Access 2023. [CrossRef]
- Zhou, Q.; Gong, H.; Su, W.; Yan, Q.; Shi, K.; Du, G. Active speed control of belt conveyor with variable speed interval based on fuzzy algorithm. Journal of Electrical Engineering & Technology 2024;19(3):1499-1513.
- Gładysiewicz, L.; Kawalec, W.; Król, R. Selection of carry idlers spacing of belt conveyor taking into account random stream of transported bulk material. Eksploatacja i Niezawodność - Maintenance and Reliability 2016;18(1):32-37.
- Jurdziak, L.; Bajda, M.; Błażej, R. Estimation of Purchase and Replacement Costs of Conveyor Belts and their Splices in an Underground Mine Based on their Durability. IOP Conf. Series: Earth and Environmental Science 221 (2019) 012099.
- Blazej, R.; Jurdziak, L.; Kawalec, W. Why Weibull distribution can be used to describe belt segment and belt loop operating time and why it is not enough to use it to predict remaining belt life. In: Proceedings of the World Congress on Engineering 2015 (Vol. 1), WCE July 1-3, 2015,London, U.K.
- Galetakis, M.; Michalakopoulos, T.; Bajcar, A.; Roumpos, C.; Lazăr, M.; Svoboda, P. Project Bewexmin: Bucket Wheel Excavators Operating under Difficult Mining Conditions Including Unmineable Inclusions and Geological Structures with Excessive Mining Resistance. 13th ISCSM 2016 Belgrade, 11-14 September 2016.
- Jurdziak, L. Methodology of BWE efficiency analysis for power reduction of conveyor drives. In: Proceedings of the 8th International Symposium Continuous Surface Mining, ISCSM 2006, Aachen, Mainz, 24-27 September 2006, pp. 125-131.
- Jurdziak, L. Application of extreme value theory for joint dimensioning of BWEs and long distance belt conveyors in lignite mine. In: International Conference on Bulk Europe 2008, Prague, Czech Republic, 11-12 September 2008.
- Jurdziak, L. Analysis of Moving Averages of BWEs Actual Capacity. Advances in Intelligent Systems and Computing, Vol. 835. Intelligent Systems in Production Engineering and Maintenance, ISPEM 2019. [CrossRef]
- Kolovos, Ch. Efficiency of a bucket wheel excavator lignite mining system. Int. J. Surf. Min. Reclam. Environ. 2004;18(1):21-29.
- Kasztelewicz, Z. Analysis of the operating parameters of domestic brown coal mines. Górnictwo Odkrywkowe 2004;46(2):21-32 (in Polish).
- Kulinowski, P.; Kasza, P.; Zarzycki, J. Influence of design parameters of idler bearing units on the energy consumption of a belt conveyor. Sustainability 2021;13(1):437.
- Kulinowski, P.; Kasza, P.; Zarzycki, J. Methods of Testing of Roller Rotational Resistance in Aspect of Energy Consumption of a Belt Conveyor. Energies 2022;16(1):26.
- Gładysiewicz, L. Belt conveyors - theory and calculations. Wrocław University Science and Technology Press; 2003 (in Polish).
- DIN 22101:2011-12. Continuous conveyors - Belt conveyors for loose bulk materials - Basis for calculation and dimensioning.
- Kawalec, W.; Kulinowski, P. Conveyor belt calculations. Transport Przemysłowy 2007;1(27):6-11 (in Polish).
- https://en.wikipedia.org/wiki/BelAZ_75710 (Accessed 20.06.2025).
- https://en.wikipedia.org/wiki/Caterpillar_797 (Accessed 20.06.2025).
- https://en.wikipedia.org/wiki/Liebherr_T_282_series (Accessed 20.06.2025).
- Kasztelewicz, Z.; Szymański, J. Energy saving control method of electrical drives in conveyor belts with regulated speed in surface brown coal mine. Archives of Mining Sciences 2008:53(2):319-329.
- Nowak-Szpak, A.; Strempski, A.; Bajcar, A. The results of studies on mining process in example of excavator SchRs 4000.37.5. Górnictwo Odkrywkowe 2012;(5-6):85-91 (in Polish).
- Gładysz, S. Statistical analysis of mass distribution irregularities on conveyor belts and stackers serving the excavator and conveyor system. Scientific Works of the Institute of Mathematics of the Wrocław University of Science and Technology, Wrocław 1964 (in Polish, not published).
- Doroszuk, B.; Król, R. Analysis of conveyor belt wear caused by material acceleration in transfer station. Mining Science 2019;(26):189–201.
- Walker, P.; Doroszuk, B.; Król, R. Analysis of ore flow through longitudinal belt conveyor transfer point. Eskploatacja i Niezawodność - Maintenance and Reliability 2020;22(3):536-543.
- Walker, P.; Kawalec, W.; Król, R. Application of the discrete element method (DEM) for simulation of the ore flow inside the shaft ore bunker in the underground copper ore mine. In Intelligent Systems in Production Engineering and Maintenance 2019:633-644. Springer International Publishing.
- Gładysz, S. The process of failure of the technological system of opencast mines. Węgiel Brunatny 1964;(1): 62-74 (in Polish).
- Gładysz, S. Efficiency of the conveyor system. Węgiel Brunatny 1965;(3):199÷204 (in Polish).
- Jurdziak, L. Determination of the influence of conveyor length on the durability of conveyor belts in an underground mine. Prace Naukowe Instytutu Górnictwa Politechnik Wrocławskiej 1988;(50) Seria: Konferencje Nr 11, Podstawowe Problemy Transportu Kopalnianego, Wrocław.
- Gladysiewicz, L.; Kawalec, W. Optimised selection of a belt conveyor loaded by a BWE. In: Proceedings of the 8th International Symposium of Continuous Surface Mining ISCSM, Achen; 2006.p.353-357.
- He, D.; Liu, X.; Zhong, B. Sustainable belt conveyor operation by active speed control. Measurement 2020;(154):107458.
- Vasić, M.; Miloradović, N.; Blagojević, M. Speed control of high power multiple drive belt conveyors. IMK-14 – Research and Development in Heavy Machinery 2021;27(1):9-15. [CrossRef]
- Bajda, M.; Jurdziak, L.; Pactwa, K.; Woźniak, J. Energy-Saving of Conveyor Belts in the Strategy and Reporting of Corporate Social Responsibility Initiatives of Producers. In: Global Congress on Manufacturing and Management 2021.pp.402-414. Cham: Springer International Publishing.
- Bahadirov, G.A.; Gulmatov, A.B.; Umarov, B.T.; Mirzayev, O.T. Eco-efficient conveyer belt loading methods. A classification approach for minimizing energy consumption. In E3S Web of Conferences 2025;614:01004). EDP Sciences.
- Kawalec, W.; Woźniak, D. Energy efficiency of the bottom cover of a conveyor belt–the first step to the new classification of belts. Mining Science 2014;21(2):47-60.
- Konieczna-Fuławka, M. Energy-Saving Solutions Applied in Belt Conveyors: A Literature Review. Energies 2025;18(12), 3019.
- Woźniak, D. Aspects of selecting appropriate conveyor belt strength. Energies. 2021, vol. 14, no. 19, art. 6018, pp. 1-13.
- Liu, F.; Cai, Q.; Chen, S.; Zhou, W. A comparison of the energy consumption and carbon emissions for different modes of transportation in open-cut coal mines. International Journal of Mining Science and Technology 25.2 (2015): 261-266. ISSN 2095-2686. [CrossRef]
Figure 2.
Diagram of the route section of the analysed conveyors (data from the mine) (after [7]).
Figure 2.
Diagram of the route section of the analysed conveyors (data from the mine) (after [7]).
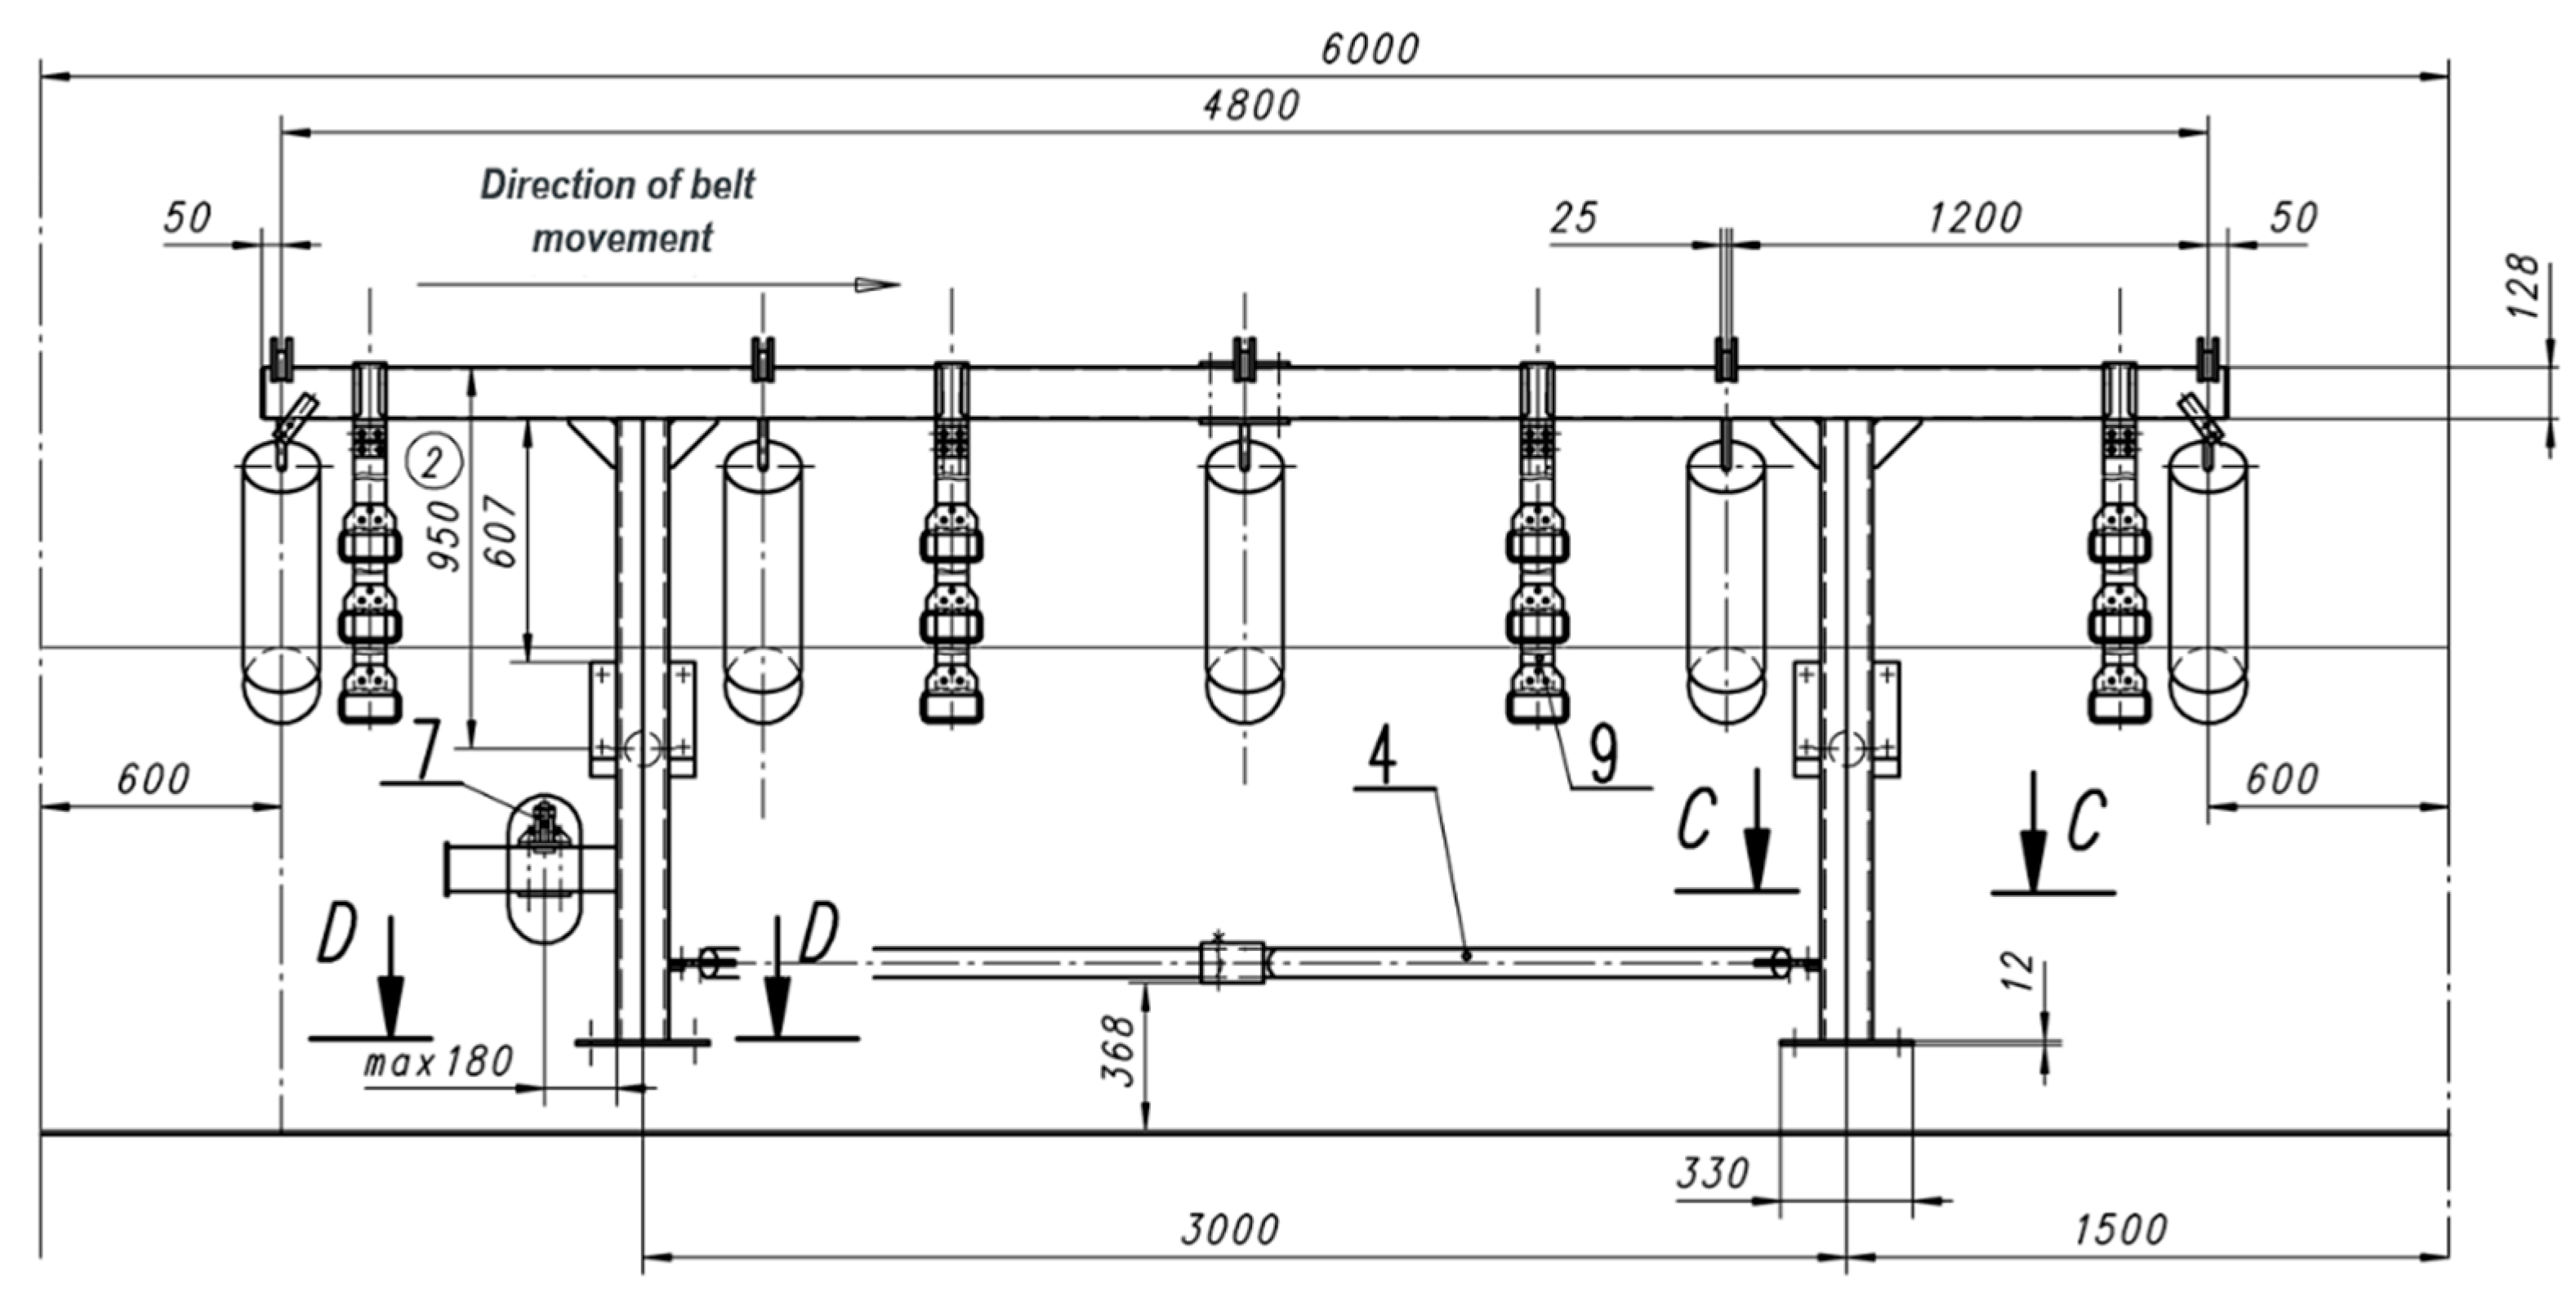
Figure 3.
Diagram of the route section of the analysed conveyors (data from the mine) (after [17,33]).
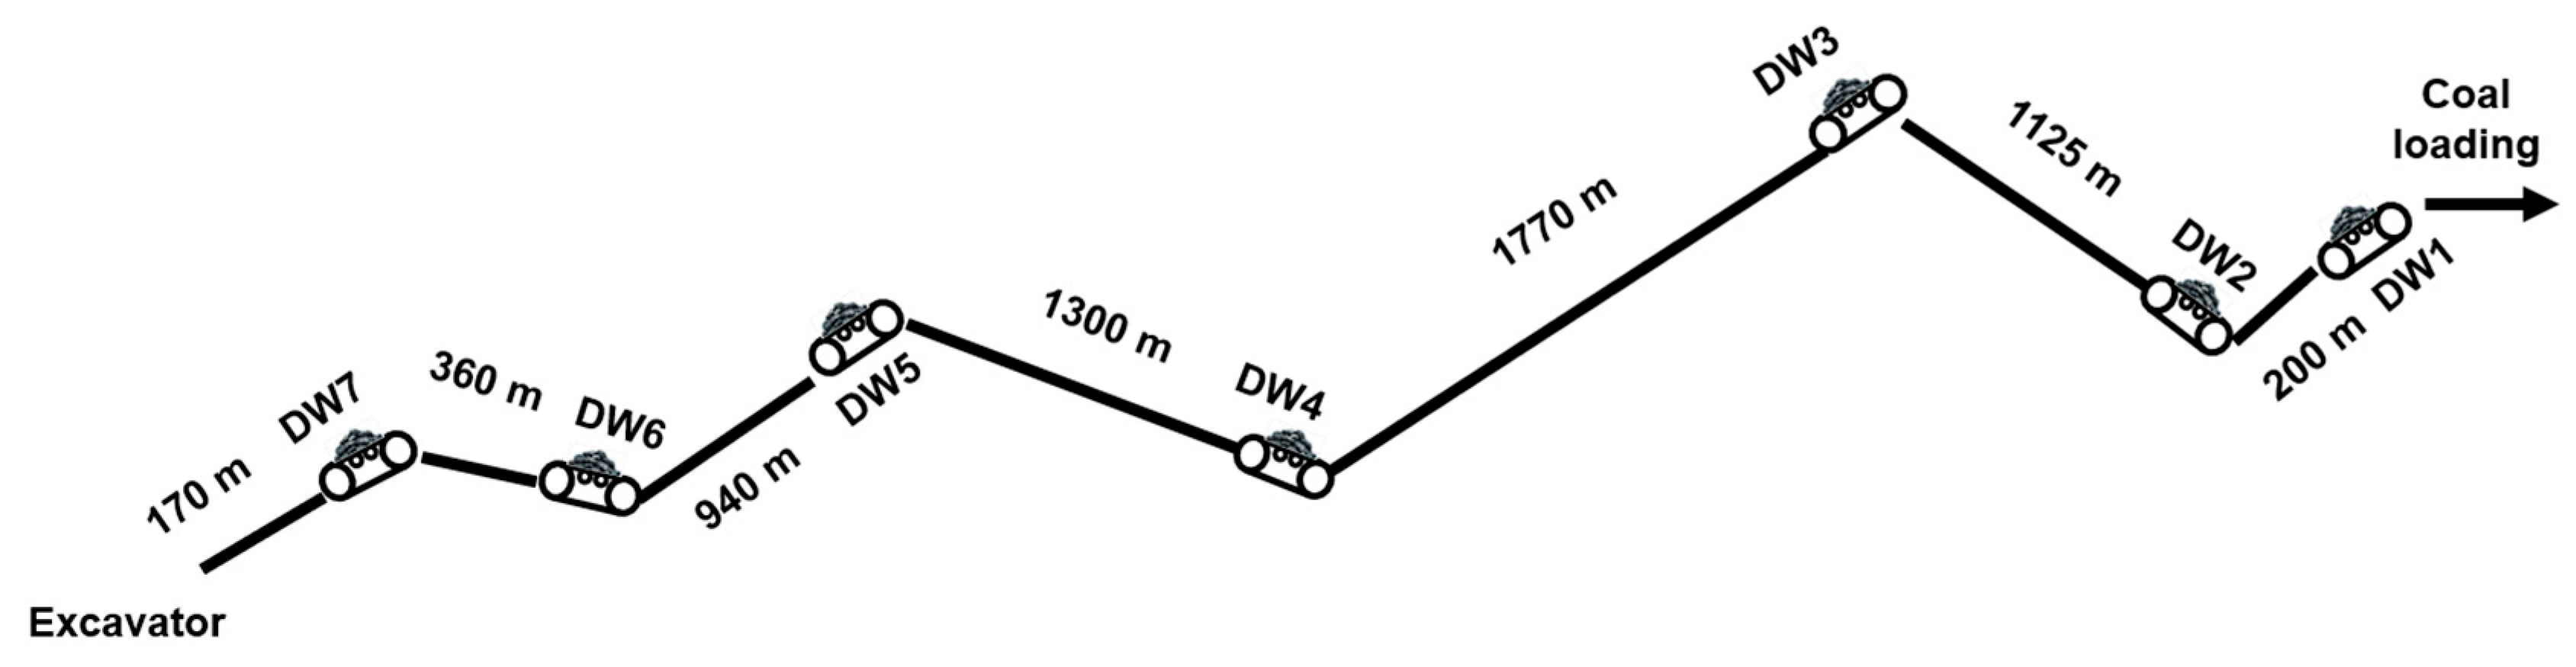
Figure 4.
Dependence of power consumption of the drive systems of an empty and loaded flat belt conveyor on the belt speed (based on [17]).
Figure 4.
Dependence of power consumption of the drive systems of an empty and loaded flat belt conveyor on the belt speed (based on [17]).
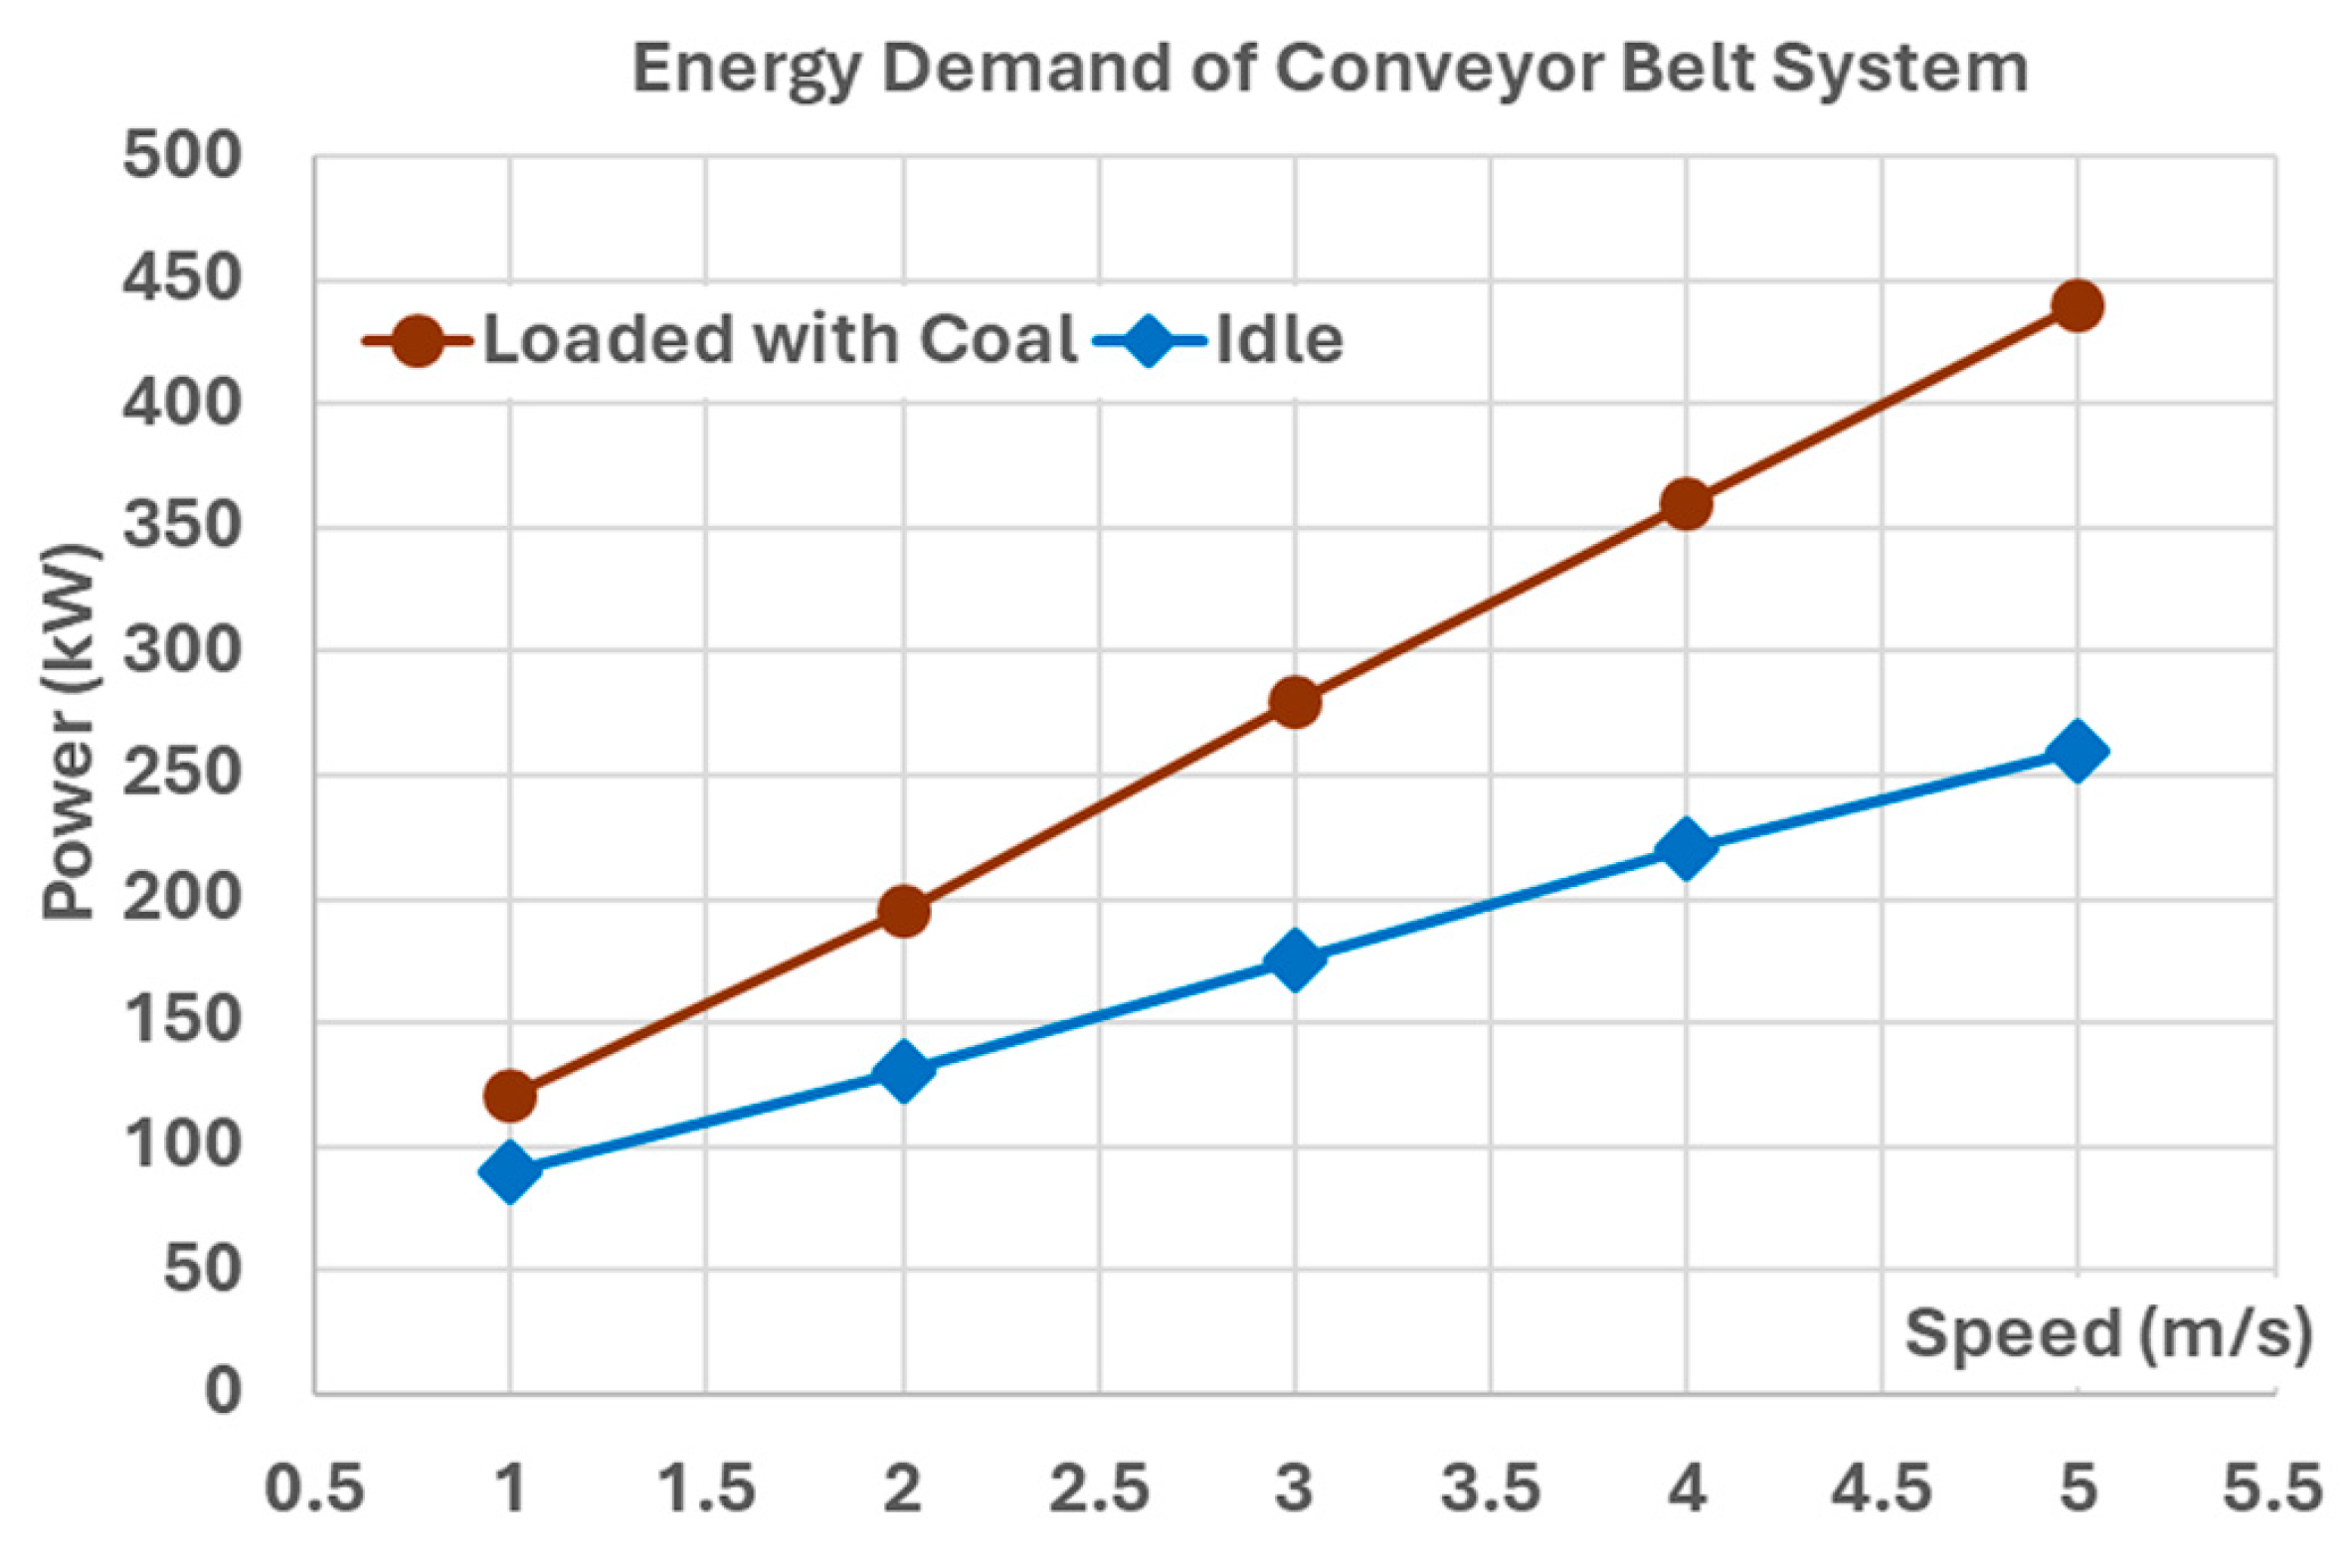
Figure 5.
Changes in the product Cf(v) as a function of belt speed v (in m/s) and belt filling degree (in %, assumed to be 100% for the speed of 1 m/s) at a constant capacity Qr=833Mg/h [based on [1]).
Figure 5.
Changes in the product Cf(v) as a function of belt speed v (in m/s) and belt filling degree (in %, assumed to be 100% for the speed of 1 m/s) at a constant capacity Qr=833Mg/h [based on [1]).
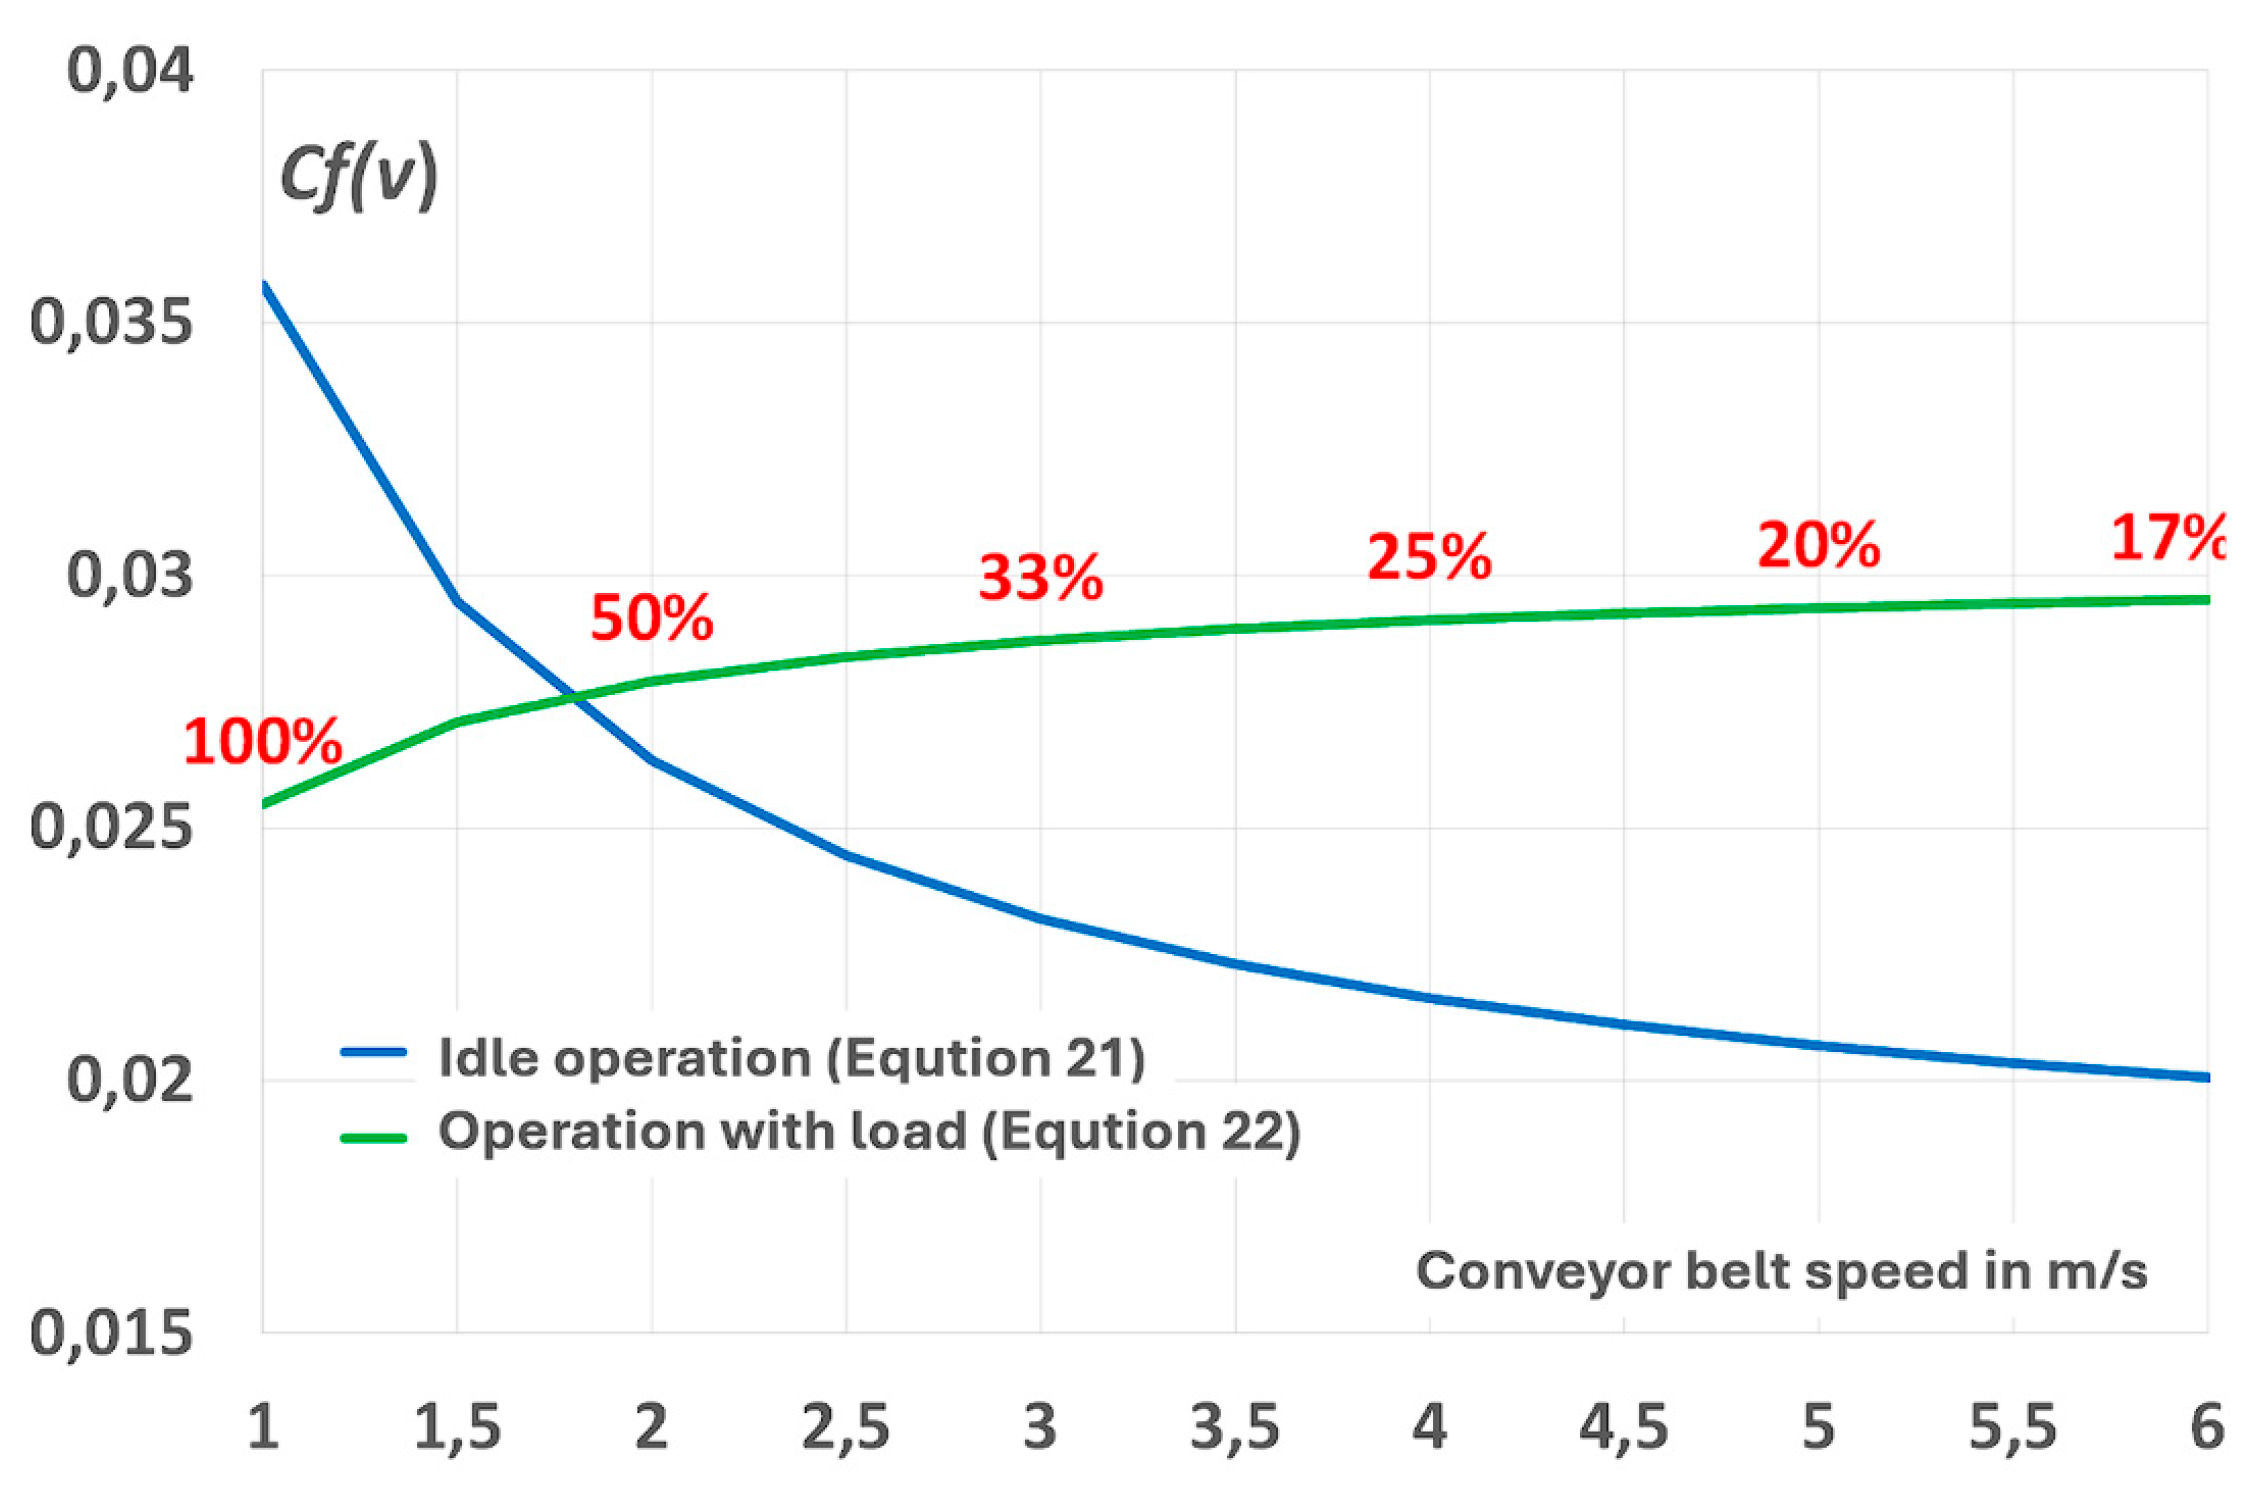
Figure 6.
Changes in the unit energy consumption index WskZE for the DW5 conveyor and the data from (Figure 4). For the measurement points, the belt speed and the conveyor’s power demand during no-load operation were given as a percentage of the demand with load (based on [1]).
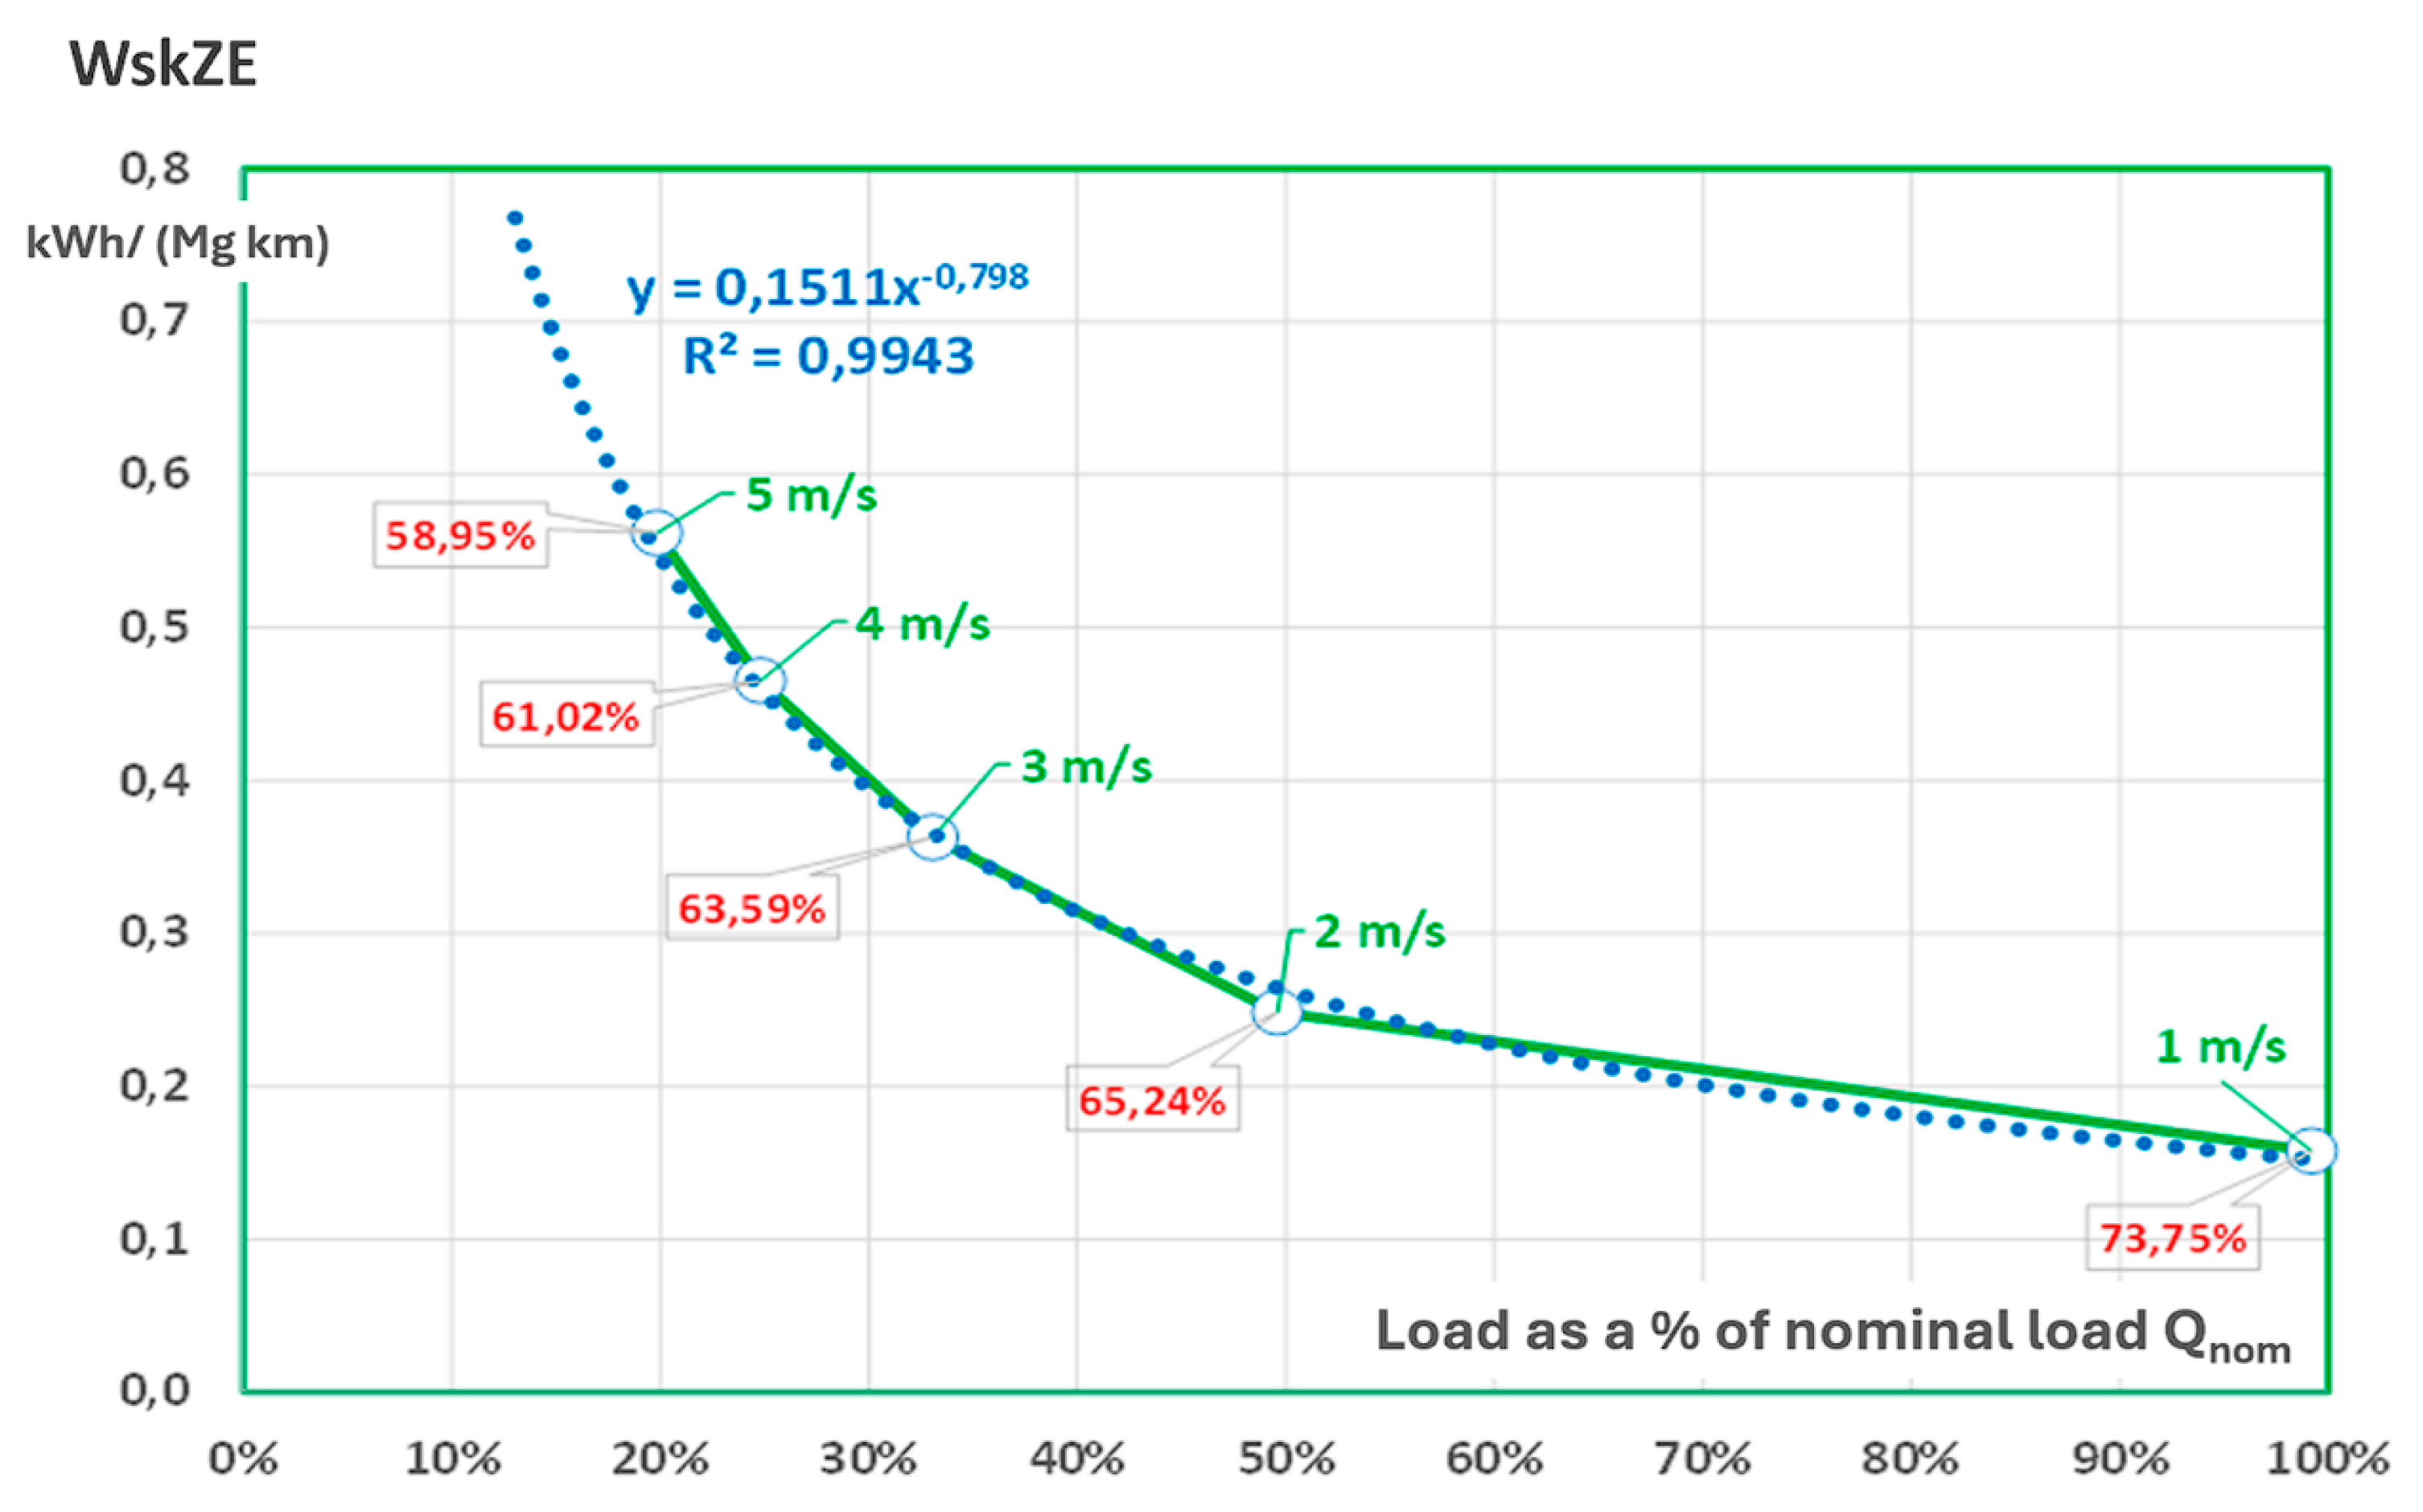
Figure 8.
WskZE(v,Q) for speed changes in the range of 1-6 m/s and capacity of 800-5,000 Mg/h. WskZE=0.299555 (260 v/ Qr +1/3.61) (based on [1]).
Figure 8.
WskZE(v,Q) for speed changes in the range of 1-6 m/s and capacity of 800-5,000 Mg/h. WskZE=0.299555 (260 v/ Qr +1/3.61) (based on [1]).
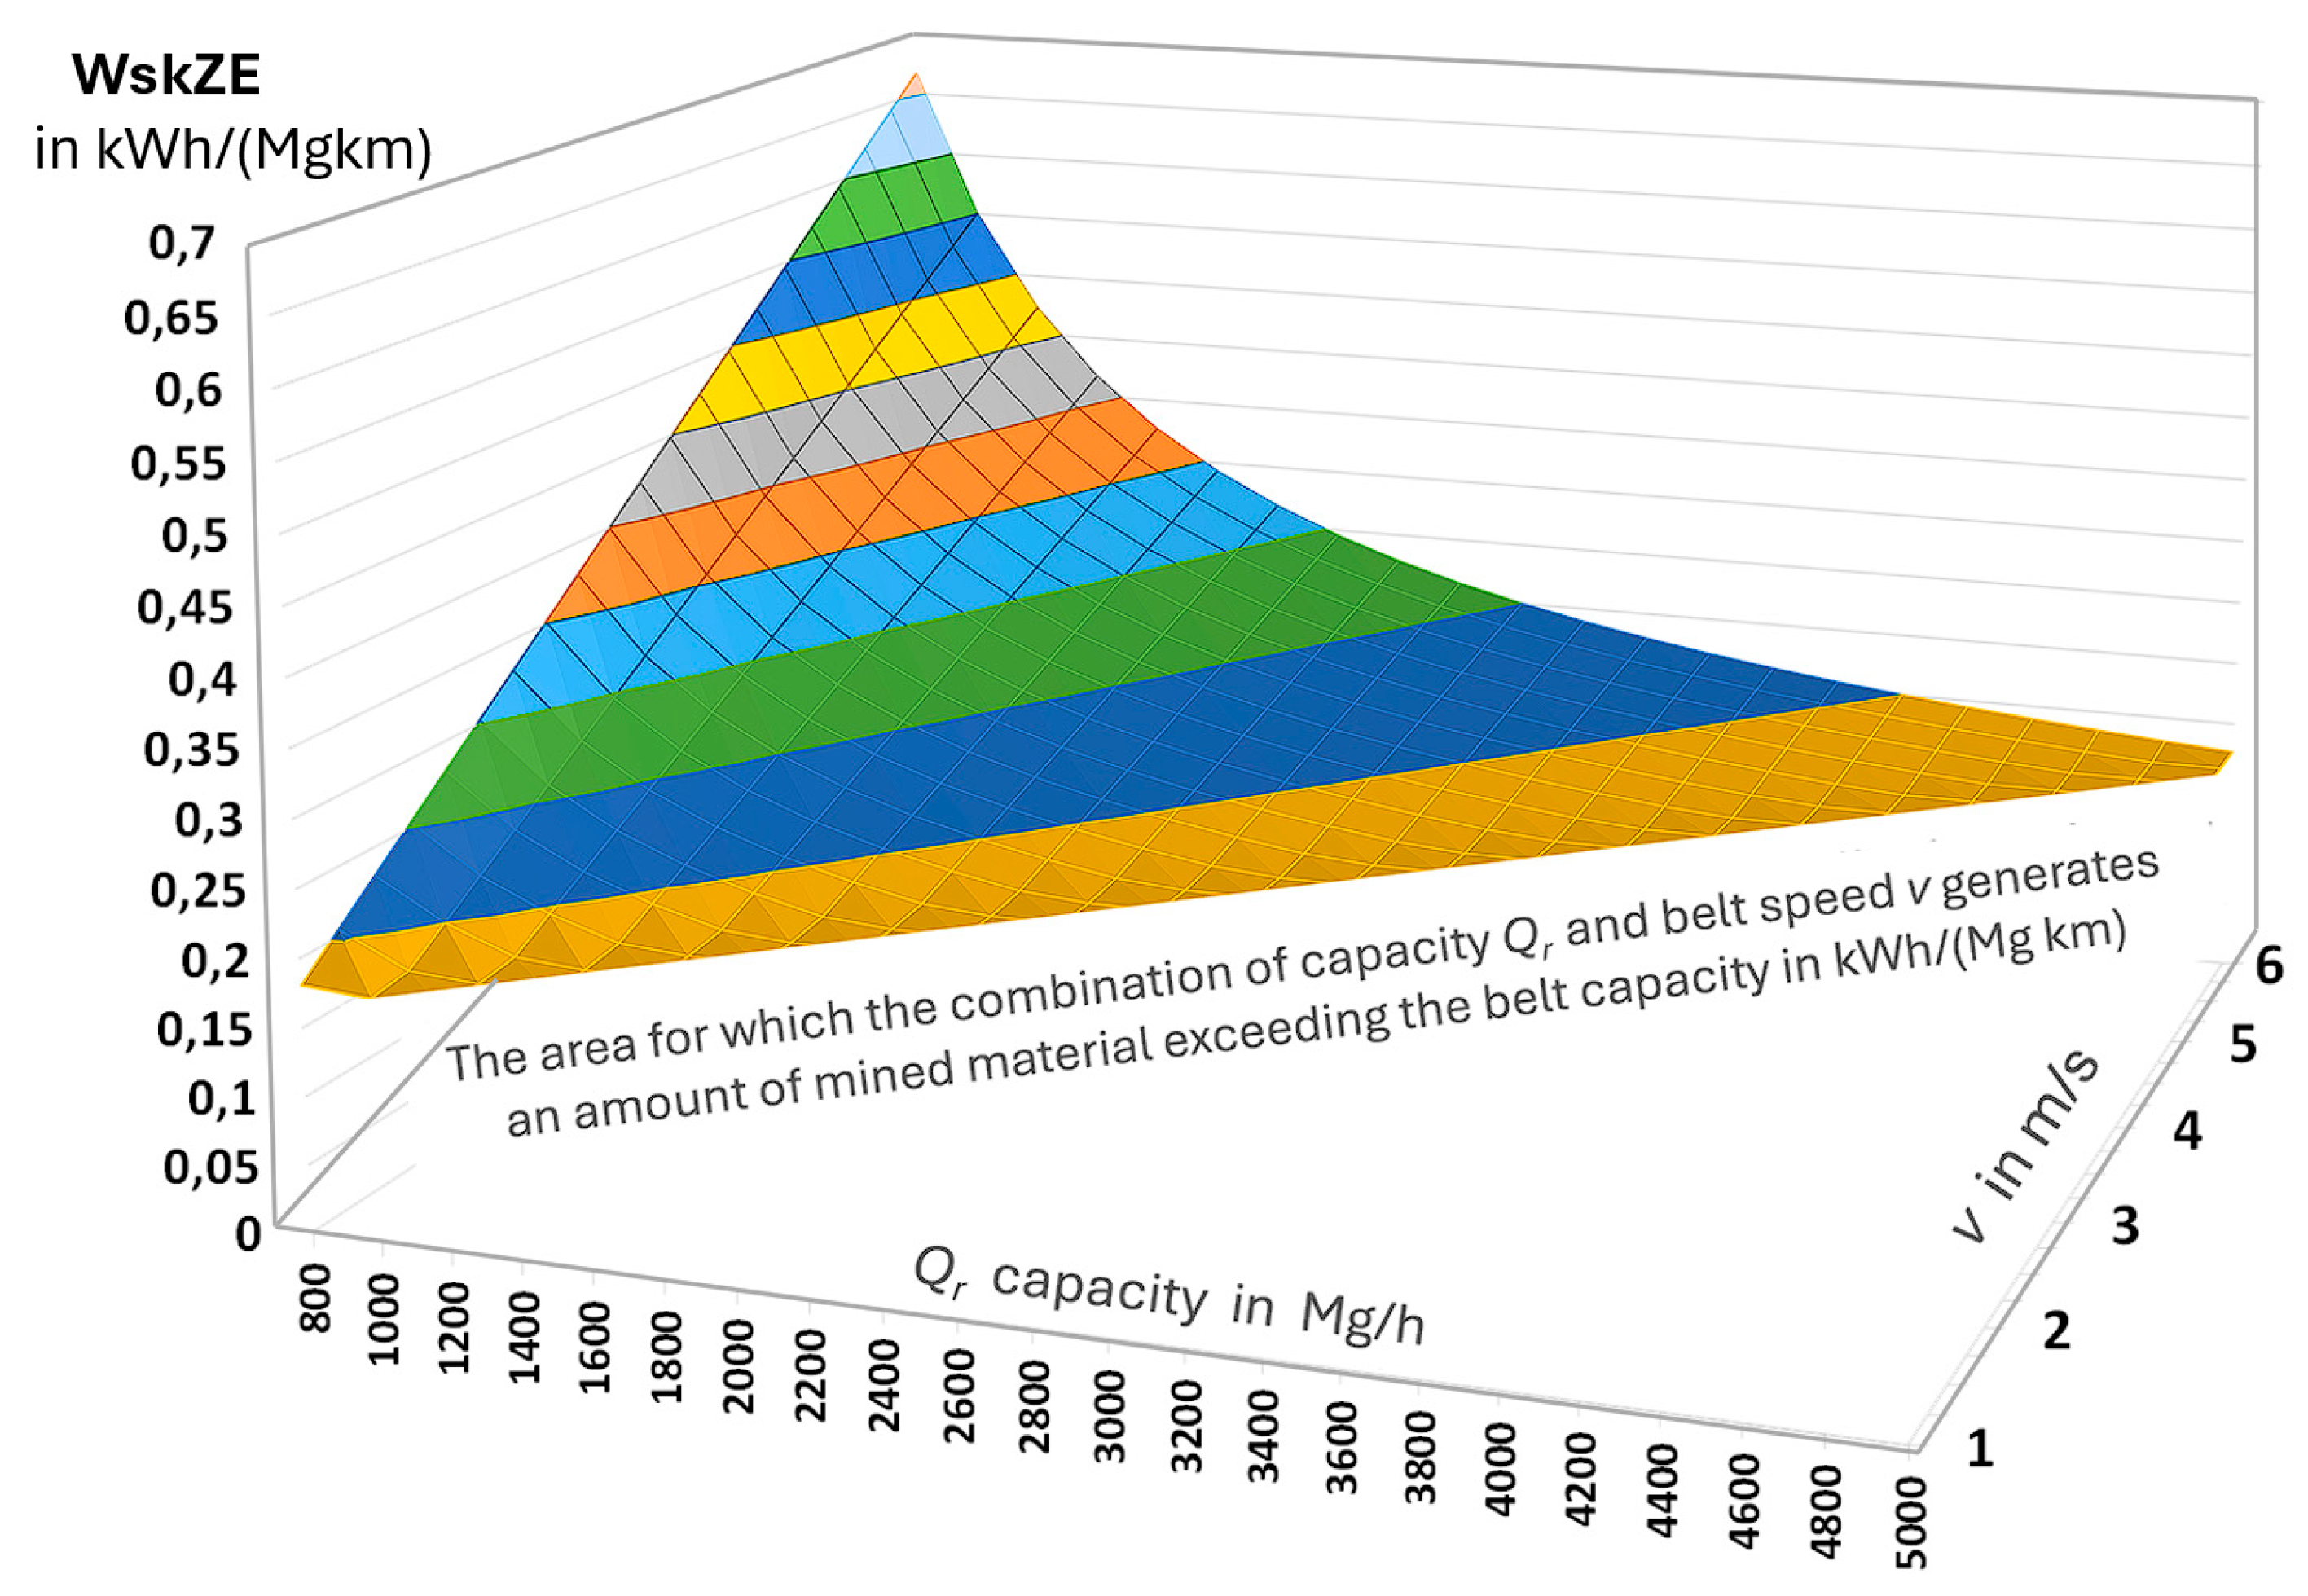
Figure 9.
Power consumption curve of the drive systems of the empty and loaded conveyor belt depending on the belt speed based on data from A [33] and B [8].
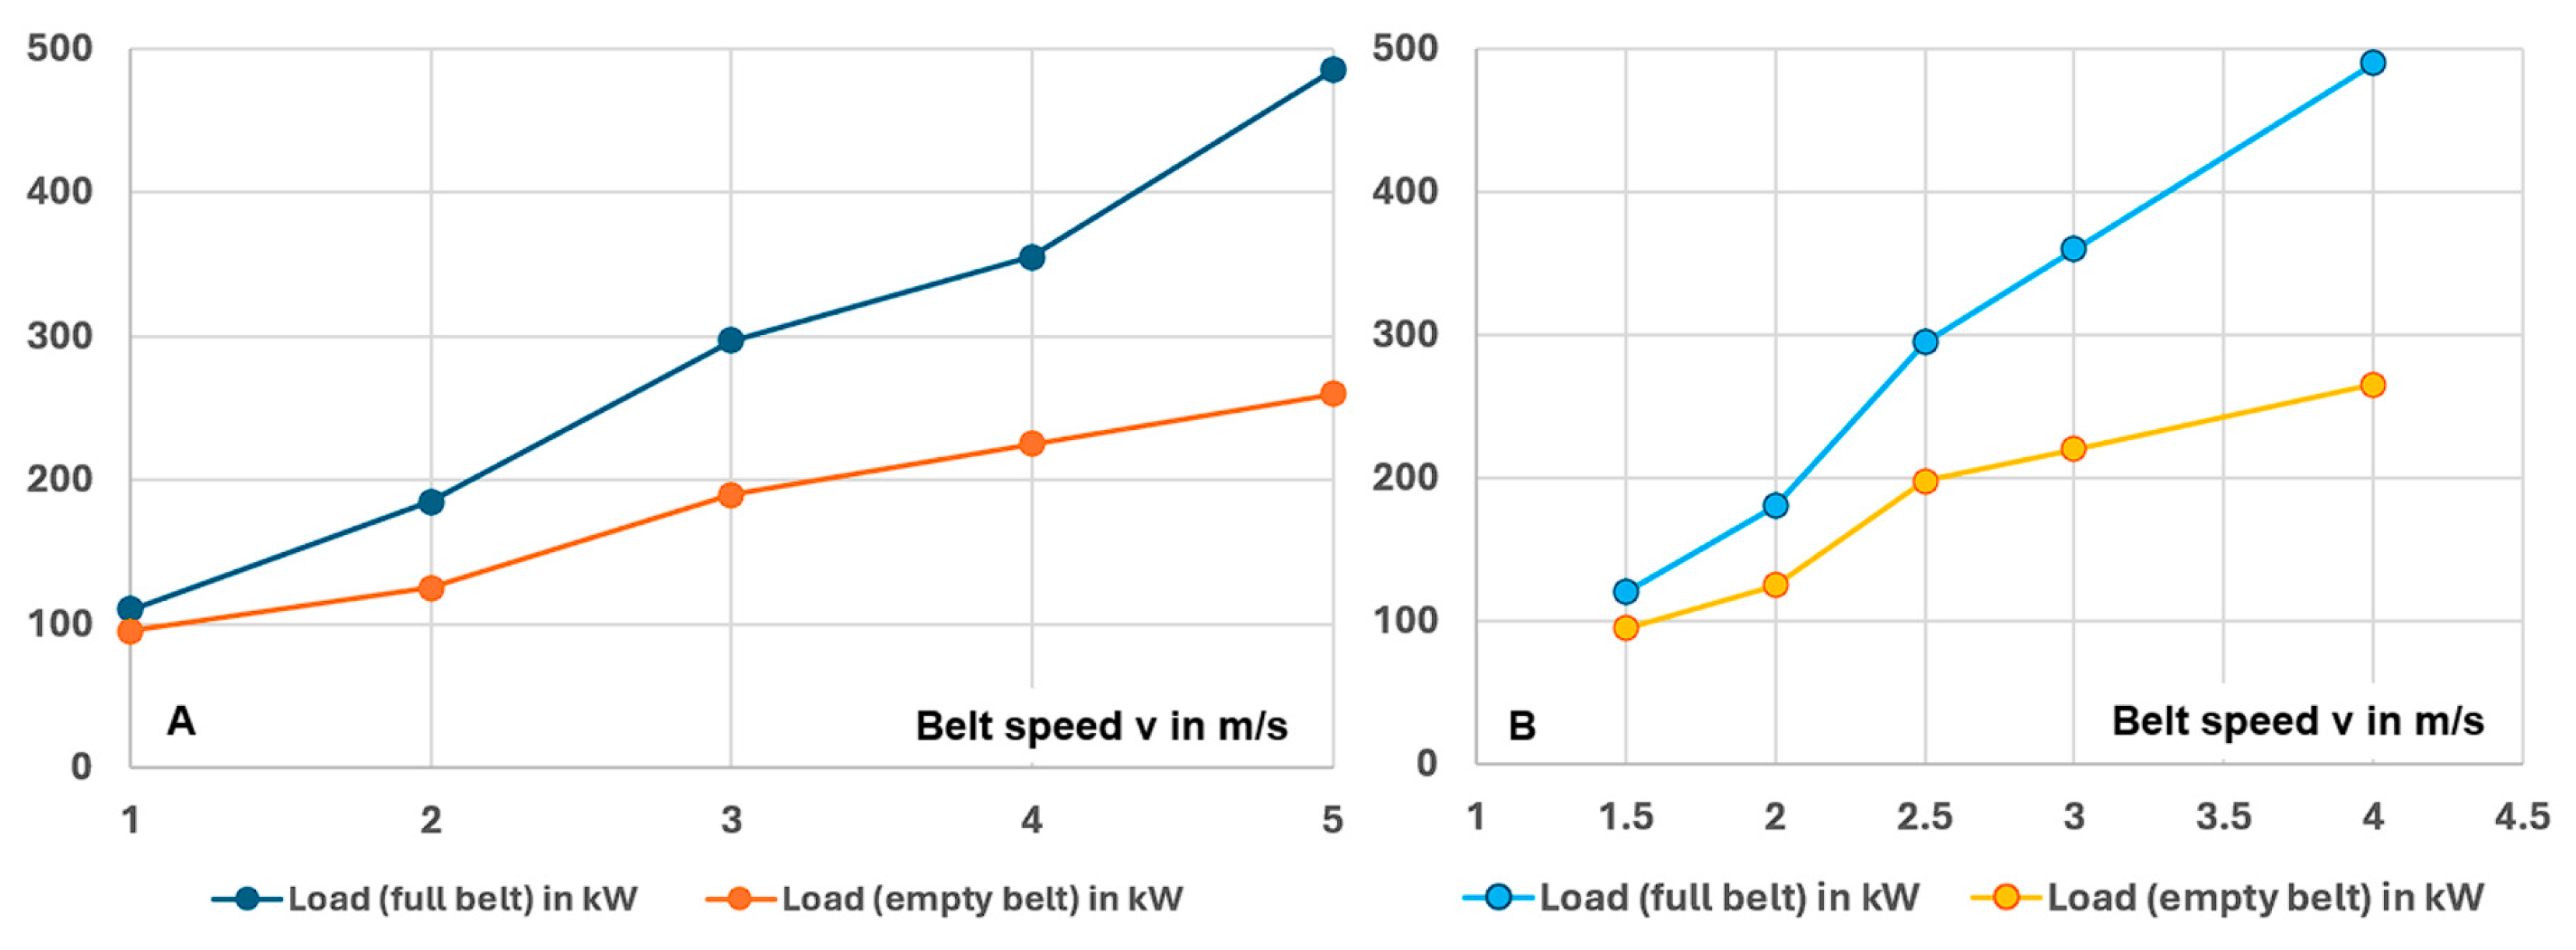
Figure 11.
Cumulative distribution of cord damage in the core on the cross-section of the St belt based on measurements made with the DiagBelt magnetic diagnostic system on photos of the belt and conveyor (after [1]).
Figure 11.
Cumulative distribution of cord damage in the core on the cross-section of the St belt based on measurements made with the DiagBelt magnetic diagnostic system on photos of the belt and conveyor (after [1]).
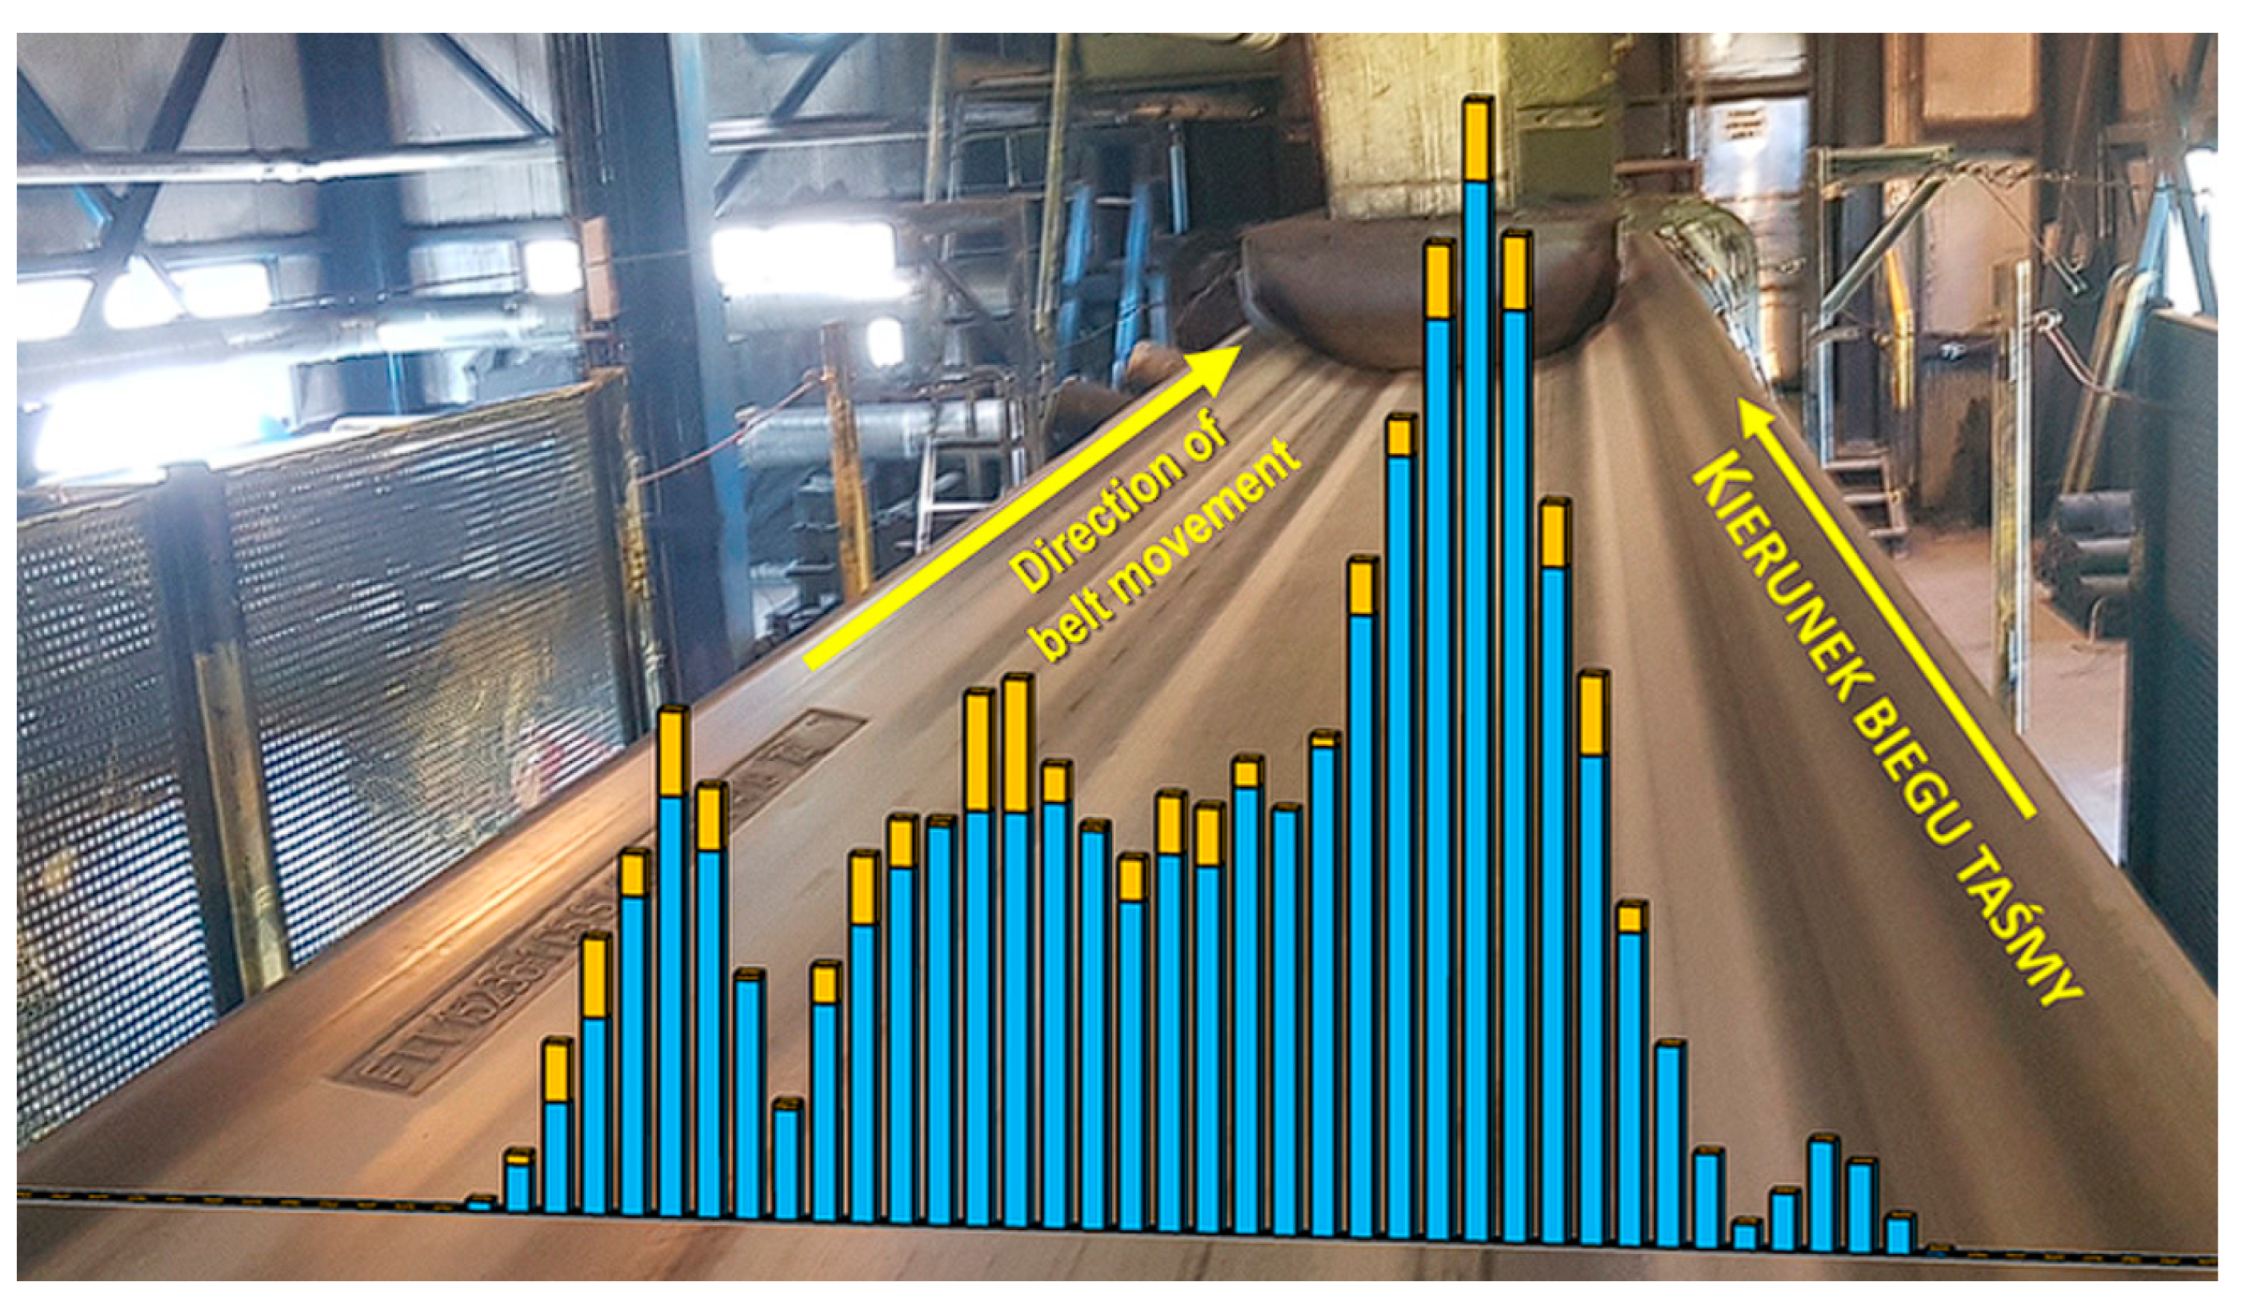

Table 1.
Specific Energy Consumption Index WskZE in the Drzewce opencast mine [9].
Table 1.
Specific Energy Consumption Index WskZE in the Drzewce opencast mine [9].
| “Drzewce” opencast mine | Conveyor chain length, km | Energy consumption per month, kWh |
Production per month, overburden, m3 coal, t |
Energy Consumption Index, kWh/(m3 km) kWh/(t km) |
|---|---|---|---|---|
| Coal conveyors with adjustable belt speed 1.5 m/s - 6.0 m/s | overburden | 2 399 653 | 1 129 283 | 0.923 |
| 2.302 | ||||
| coal | 187 196 | 125 280 | 0.261 | |
| 5.716 |
Disclaimer/Publisher’s Note: The statements, opinions and data contained in all publications are solely those of the individual author(s) and contributor(s) and not of MDPI and/or the editor(s). MDPI and/or the editor(s) disclaim responsibility for any injury to people or property resulting from any ideas, methods, instructions or products referred to in the content. |
© 2025 by the authors. Licensee MDPI, Basel, Switzerland. This article is an open access article distributed under the terms and conditions of the Creative Commons Attribution (CC BY) license (http://creativecommons.org/licenses/by/4.0/).
Copyright: This open access article is published under a Creative Commons CC BY 4.0 license, which permit the free download, distribution, and reuse, provided that the author and preprint are cited in any reuse.


