
Submitted:
19 March 2025
Posted:
19 March 2025
You are already at the latest version
Abstract
This study examines the influence of average monthly load variations on the unit energy consumption indicator (ZE) of belt conveyors, defined as the energy required to transport 1 Mg of bulk material (coal) over a distance of 1 km. The analysis is based on energy consumption data from twin belt conveyors operating in a Polish lignite mine over four years. Monthly records included transported mass, conveyor operating time, energy consumed, and atmospheric conditions (temperature and humidity). The results indicate statistically significant differences in ZE between the analyzed conveyors. A relative increase in average load by 35% (from 2000 Mg/h) corresponded to a 26% reduction in ZE, with a specific decrease of 90 Wh/Mg/km. The findings highlight that optimizing conveyor load distribution can significantly reduce energy consumption—by up to 30%. These insights underscore the potential for energy savings through better conveyor load management without requiring significant infrastructural investments.
Keywords:
belt conveyor
; energy consumption
; unit energy consumption
; conveyor load
; theoretical capacity
1. Introduction–Collected Data
Belt conveyors are not only a more cost-effective alternative to wheeled transport [1,2,3,4,5,6,7], but they are also more environmentally friendly due to their use of electric motors for propulsion and bulk material handling [8,9,10]. Additionally, when operating on downhill slopes, they can serve as energy generators [11,12], contributing to energy recovery and efficiency improvements.
Beyond their primary function in material transport, belt conveyors present innovative opportunities for energy management. They can serve as a form of dry energy storage, similar to pumped-storage power plants [13], by utilizing gravitational energy. Additionally, they can help mitigate renewable energy curtailment by enabling the seasonal transfer of surplus energy from summer to winter. This can be achieved by integrating conveyors with bucket-wheel excavators that remove overburden and expose lignite seams near power plants, effectively creating coal storage reserves [14]. In some cases, conveyors can be powered directly by solar panels, providing both a renewable energy source and protection for transported materials against adverse weather conditions [15].
This study explores the impact of varying conveyor loads on energy consumption, analyzing extensive operational data collected from a Polish lignite mine over four years. The findings aim to enhance the efficiency of belt conveyor systems and identify potential strategies for reducing energy consumption in large-scale mining operations.
Energy and Economic Efficiency of Belt Conveyors
The energy and economic efficiency of belt conveyors, both in standard applications and specialized scenarios like those mentioned earlier, depend largely on the energy required to transport a unit of mass over a distance of 1 km. A unit energy consumption indicator (ZE) was introduced in previous studies [16,17,18,19,20,21] to facilitate accurate comparisons between different conveyor systems, providing a standardized metric for evaluating conveyor performance. This indicator also enables the optimal selection of conveyors for specific transport tasks, including open pit optimization [22,23,24,25] and the selection of belt conveyors for underground operations [26].
Extensive research, including both laboratory and industrial studies, has been conducted to analyze the primary sources of conveyor motion resistance. Findings indicate that indentation rolling resistance [27,28,29,30,31] contributes to over 60% of total motion resistance (Figure 1). Researchers have also sought to systematically assess the energy efficiency of belt conveyors [21, 2024] and explore methods for reducing energy consumption.
Key areas of investigation include:
- -
- -
- -
- -
A methodology for comparing the energy consumption of belt conveyors was presented in previous studies [16]. These studies demonstrated that variations in monthly energy consumption are statistically significant, making direct comparisons between different conveyors challenging. Even when operating under nearly identical conditions, fluctuations in transported mass and monthly energy usage resulted in considerable differences.
This study focuses on two twin conveyors operating in parallel coal transport lines. Despite their nearly identical construction and function—both transferring coal from the same pit to the same power plant during similar periods—they exhibited negligible small differences in length (Table 1) and, more importantly, in the total mass of coal transported and the total time of their operation (Table 2). This difference directly influenced their average capacity and, consequently, the degree to which their theoretical capacity was utilized (Table 3).
The width and speed of the belts were identical for both conveyors, ensuring that variations in energy consumption were not due to structural differences or external weather conditions. Instead, discrepancies in energy use were solely attributed to differences in transferred coal mass and achieved monthly performance levels.
Because these conveyors operated in parallel, direct comparison was complicated by significant monthly and overall differences in transported coal mass and operating time. Consequently, their actual average efficiency—measured as the ratio of transported mass to operating time—varied monthly. Additionally, Conveyor A’s data was incomplete, missing 12 months of measurements.
Direct energy consumption values were not used to ensure a fair and reliable comparison. Instead, the unit energy consumption indicators (ZE) were analyzed, allowing for a standardized evaluation of conveyor efficiency across varying operational conditions.
2. Results and Discussion
2.1. Comparison of the Average Monthly Capacities of the Tested Conveyors
During the analyzed period, the average capacity of Conveyor A was 2,381.99 Mg/h, with an energy consumption index (ZEA) of 286.45 Wh/Mg/km. Conveyor B had an average capacity of 2,309.47 Mg/h, with a slightly higher energy consumption index (ZEB) of 300.69 Wh/Mg/km (Table 3). This means Conveyor B consumed 14.24 Wh/Mg/km more energy per transported unit than Conveyor A. Although the relative difference of 4.97% was not substantial, it was statistically significant and caused by a 1.13% increase in average conveyor capacity.
Interestingly, an inverse relationship was observed between capacity and energy efficiency. Despite being less loaded, Conveyor B had a lower average monthly capacity (72.51 Mg/h, or 3.04%, compared to Conveyor A). This suggests that higher unit energy consumption was associated with lower capacity utilization. A strong negative correlation was identified between ZE and conveyor capacity (R² = -0.84 and -0.85 for conveyors A and B, respectively). A 35% relative increase in capacity (from 2000 up to 2700 Mg/h) led to a 26% reduction in ZE (from 340 down to 250 Wh/Mg/km), equating to a 90 Wh/Mg/km decrease. Proper load distribution could reduce unit energy consumption by up to 30%.
Research manuscripts reporting large datasets deposited in a publicly available database should specify where the data have been deposited and provide the relevant accession numbers. If the accession numbers have not yet been obtained at the time of submission, please state that they will be provided during review. They must be provided before publication.
A statistical comparison of two independent sample distributions was conducted to verify the significance of these differences. The results, illustrated in Figure 1, show the histograms of monthly average capacities for both conveyors. The modal value for Conveyor A (~2400 Mg/h) is slightly higher than that for Conveyor B (~2300 Mg/h), indicating a small but measurable shift in performance.
Figure 2.
Comparison of the histograms of monthly average capacities (Q) for Conveyors A and B.

A more detailed view of the density distributions (Figure 3) confirms this shift. The peak value for Conveyor A is approximately 135 Mg/h higher than that for Conveyor B, which is almost twice the difference observed in the mean values (72.51 Mg/h). Additionally, the efficiency distribution of Conveyor A shows slight left-hand asymmetry, while Conveyor B exhibits a right-hand asymmetry, suggesting different operational characteristics.
Figure 3.
Density traces of monthly average capacities (Q) for Conveyors A and B.
2.2. Statistical Analysis of Conveyor Capacities
Table 1 presents key descriptive statistics for the analyzed datasets of monthly capacities. Notably, Conveyor A consistently exhibited higher values across various measures of central tendency (mean, median), with differences ranging from 3% to 4%. The median showed the most significant difference (-4.36%), while the harmonic mean differed the least (-3.1%).
In terms of dispersion, Conveyor A displayed more significant variability, with a higher standard deviation (146.62 Mg/h vs. 142.20 Mg/h) and variance. Conveyor B’s variance was 5.94% lower, and its standard error was 16.01% lower, indicating slightly more consistent performance.

Table 4.
Basic statistics for monthly average capacities (Q) of Conveyors A and B.
| Descriptive Statistics | Conveyor A | Conveyor B | Absolute Difference | Relative Difference (%) |
|---|---|---|---|---|
| No. of Measurements | 36 | 48 | 12 | 33.33 |
| Mean in Mg/h | 2,370.56 | 2,296.89 | -73.67 | -3.11 |
| Median in Mg/h | 2390.60 | 2,286.37 | -104.23 | -4.36 |
| Geometric Mean in Mg/h | 2,366.14 | 2,292.63 | -73.51 | -3.11 |
| Harmonic Mean in Mg/h | 2,361.69 | 2,288.42 | -73.27 | -3.10 |
| Standard Deviation in Mg/h | 146.62 | 142.20 | -4.42 | -3.02 |
| Coefficient of Variation | 6.19% | 6.19% | 0.10 | 0.10 |
| Standard Error in Mg/h | 24.437 | 20.525 | -3.912 | -16.01 |
| Variance in Mg2/h2 | 21,498.1 | 20,221.2 | -1276.9 | -5.94 |
| Minimum Capacity in Mg/h | 2119.17 | 2045.89 | -73.28 | -3.46 |
| Maximum Capacity in Mg/h | 2693.29 | 2692.01 | -1.28 | -0.05 |
| Range in Mg/h | 574.12 | 646.12 | 72.00 | 12.54 |
| Lower Quartile (Q1) in Mg/h | 2307.98 | 2200.30 | -107.68 | -4.67 |
| Upper Quartile (Q3) in Mg/h | 2445.07 | 2409.83 | -35.24 | -1.44 |
| Interquartile Range in Mg/h | 137.10 | 209.53 | 72.44 | 52.84 |
| Skewness | 0.0178 | 0.4232 | 0.4053 | 2273.16 |
| Kurtosis | -0.0170 | 0.0559 | 0.0729 | -427.76 |
Key Observations:
-
Consistent Variation:
- -
- The coefficient of variation was nearly identical (6.19%) for both conveyors despite differences in mean values.
- -
- The maximum capacities were almost the same (~2,693 Mg/h), while the minimum capacity was lower for Conveyor B.
-
Higher Dispersion in Conveyor B:
- -
- The range of fluctuations in Conveyor B’s capacity was 72 Mg/h higher than in Conveyor A (646.12 Mg/h vs. 574.12 Mg/h).
- -
- This wider range may be due to seasonal and operational factors, requiring further investigation.
-
Efficiency Distribution Differences:
- -
- Interquartile and intersextile ranges suggest a more concentrated distribution in Conveyor A, while Conveyor B exhibited greater dispersion at the extremes.
- -
- The kurtosis values suggest that both datasets approximate a normal distribution, though Conveyor A’s slight negative kurtosis (-0.017) contrasts with Conveyor B’s positive kurtosis (0.056).
- -
- Conveyor B exhibited stronger right-side skewness (0.42), indicating higher occurrences of lower-than-average capacities than Conveyor A (skewness = 0.017).
While statistically significant, the observed differences in capacities between the two conveyors do not appear to be solely due to construction differences. Instead, variations in load distribution, seasonal effects, and potential external factors likely contributed to the discrepancies. These factors warrant further exploration, particularly concerning their impact on energy consumption trends.
A separate study is needed to investigate atmospheric and seasonal influences on belt conveyor efficiency, as these may also explain the observed variability in capacity utilization.
2.1.1. Statistical Significance of Differences in Monthly Average Capacities
The differences observed visually (Figure 1 and Figure 2) and identified through various descriptive statistics (Table 1) may appear significant but could still be coincidental. A series of tests was conducted to formally verify their statistical significance. Given that the differences affect not only central tendency measures but also positional statistics and density distribution traces (Figure 2), they are unlikely to occur by chance. However, a rigorous statistical approach is required.
- Confidence Intervals for Monthly Average Capacities
To compare the means of the two conveyors, 95% confidence intervals were determined:
- Conveyor A: 2,370.56 ± 49.61 [2,320.95; 2420.17]
- Conveyor B: 2,296.89 ± 41.29 [2,255.59; 2338.18]
Additionally, a 95% confidence interval was calculated for the differences in the unit energy consumption index (ZE), assuming equal variances:
- ZE Difference: 73.67 ± 63.21 [10.47; 136.88]
Since this interval does not contain zero, we conclude that the difference in means is statistically significant at the 95% confidence level.
- Student’s t-Test for Mean Comparison
A Student’s t-test was performed to compare the means of the two samples. The null hypothesis (H0) assumed equal means, while the alternative hypothesis (H1) suggested a difference. Assuming equal variances:
- t-statistic: 2.31884
- P-value: 0.02289
Since the P-value is less than 0.05, we reject the null hypothesis, confirming a statistically significant difference between the mean capacities of Conveyors A and B.
- F-Test for Variance Comparison
Before performing the t-test, an F-test was conducted to check whether the two samples had equal variances. The standard deviations were:
- Conveyor A: 146.622 [118.92; 191.26]
- Conveyor B: 142.201 [118.38; 178.18]
- Variance Ratio: 1.0632
- 95% Confidence Interval for Variance Ratio: [0.57575; 2.0211]
The F statistic was 1.06315 with a P-value of 0.83486. Since the P-value exceeds 0.05, we do not reject the null hypothesis, confirming no statistically significant difference in standard deviations.
- Mann-Whitney (Wilcoxon) Test for Median Comparison
A Mann-Whitney test was conducted to compare the medians:
-
Median Capacities:
- -
- Conveyor A: 2,390.6
- -
- Conveyor B: 2,286.37
-
Mean Ranks:
- -
- Conveyor A: 49.6111
- -
- Conveyor B: 37.1667
- W-statistic: 608
- P-value: 0.02092
Since the P-value is less than 0.05, we reject the null hypothesis and confirm a statistically significant difference between the medians at the 95% confidence level.
- Kolmogorov-Smirnov Test for Distribution Compatibility
The Kolmogorov-Smirnov (K-S) test was used to compare the distributions of both samples:
- DN Statistic: 0.3819
- K-S Statistic: 1.7323
- P-value: 0.00049
Since the P-value is below 0.05, we conclude that there is a statistically significant difference between the two distributions at a 95% confidence level.
Figure 4 compares Box-and-Whisker plots, scatter plots, and confidence intervals for the mean and median monthly capacities of both conveyors. The intervals do not overlap, reinforcing the statistical significance of the differences.
Figure 4.
Graphical Analysis of Confidence Intervals.
Figure 5 displays cumulative empirical distribution functions, showing that the distribution shift is most pronounced in the central region, with smaller variations at the tails.
Figure 5.
Chart of two cumulative empirical distributions for the monthly averages of capacity Q for conveyors A and B.
Figure 5.
Chart of two cumulative empirical distributions for the monthly averages of capacity Q for conveyors A and B.
Conclusion
The statistical tests confirm that Conveyors A and B’s observed differences in monthly average capacities are significant. These differences primarily impact the variation of the unit energy consumption index (ZE). The next chapter will explore the relationship between capacity and energy efficiency in greater detail through regression analysis.
2.3. Regression of the Unit Energy Consumption Indicator ZE Against the Average Capacity of the Conveyor
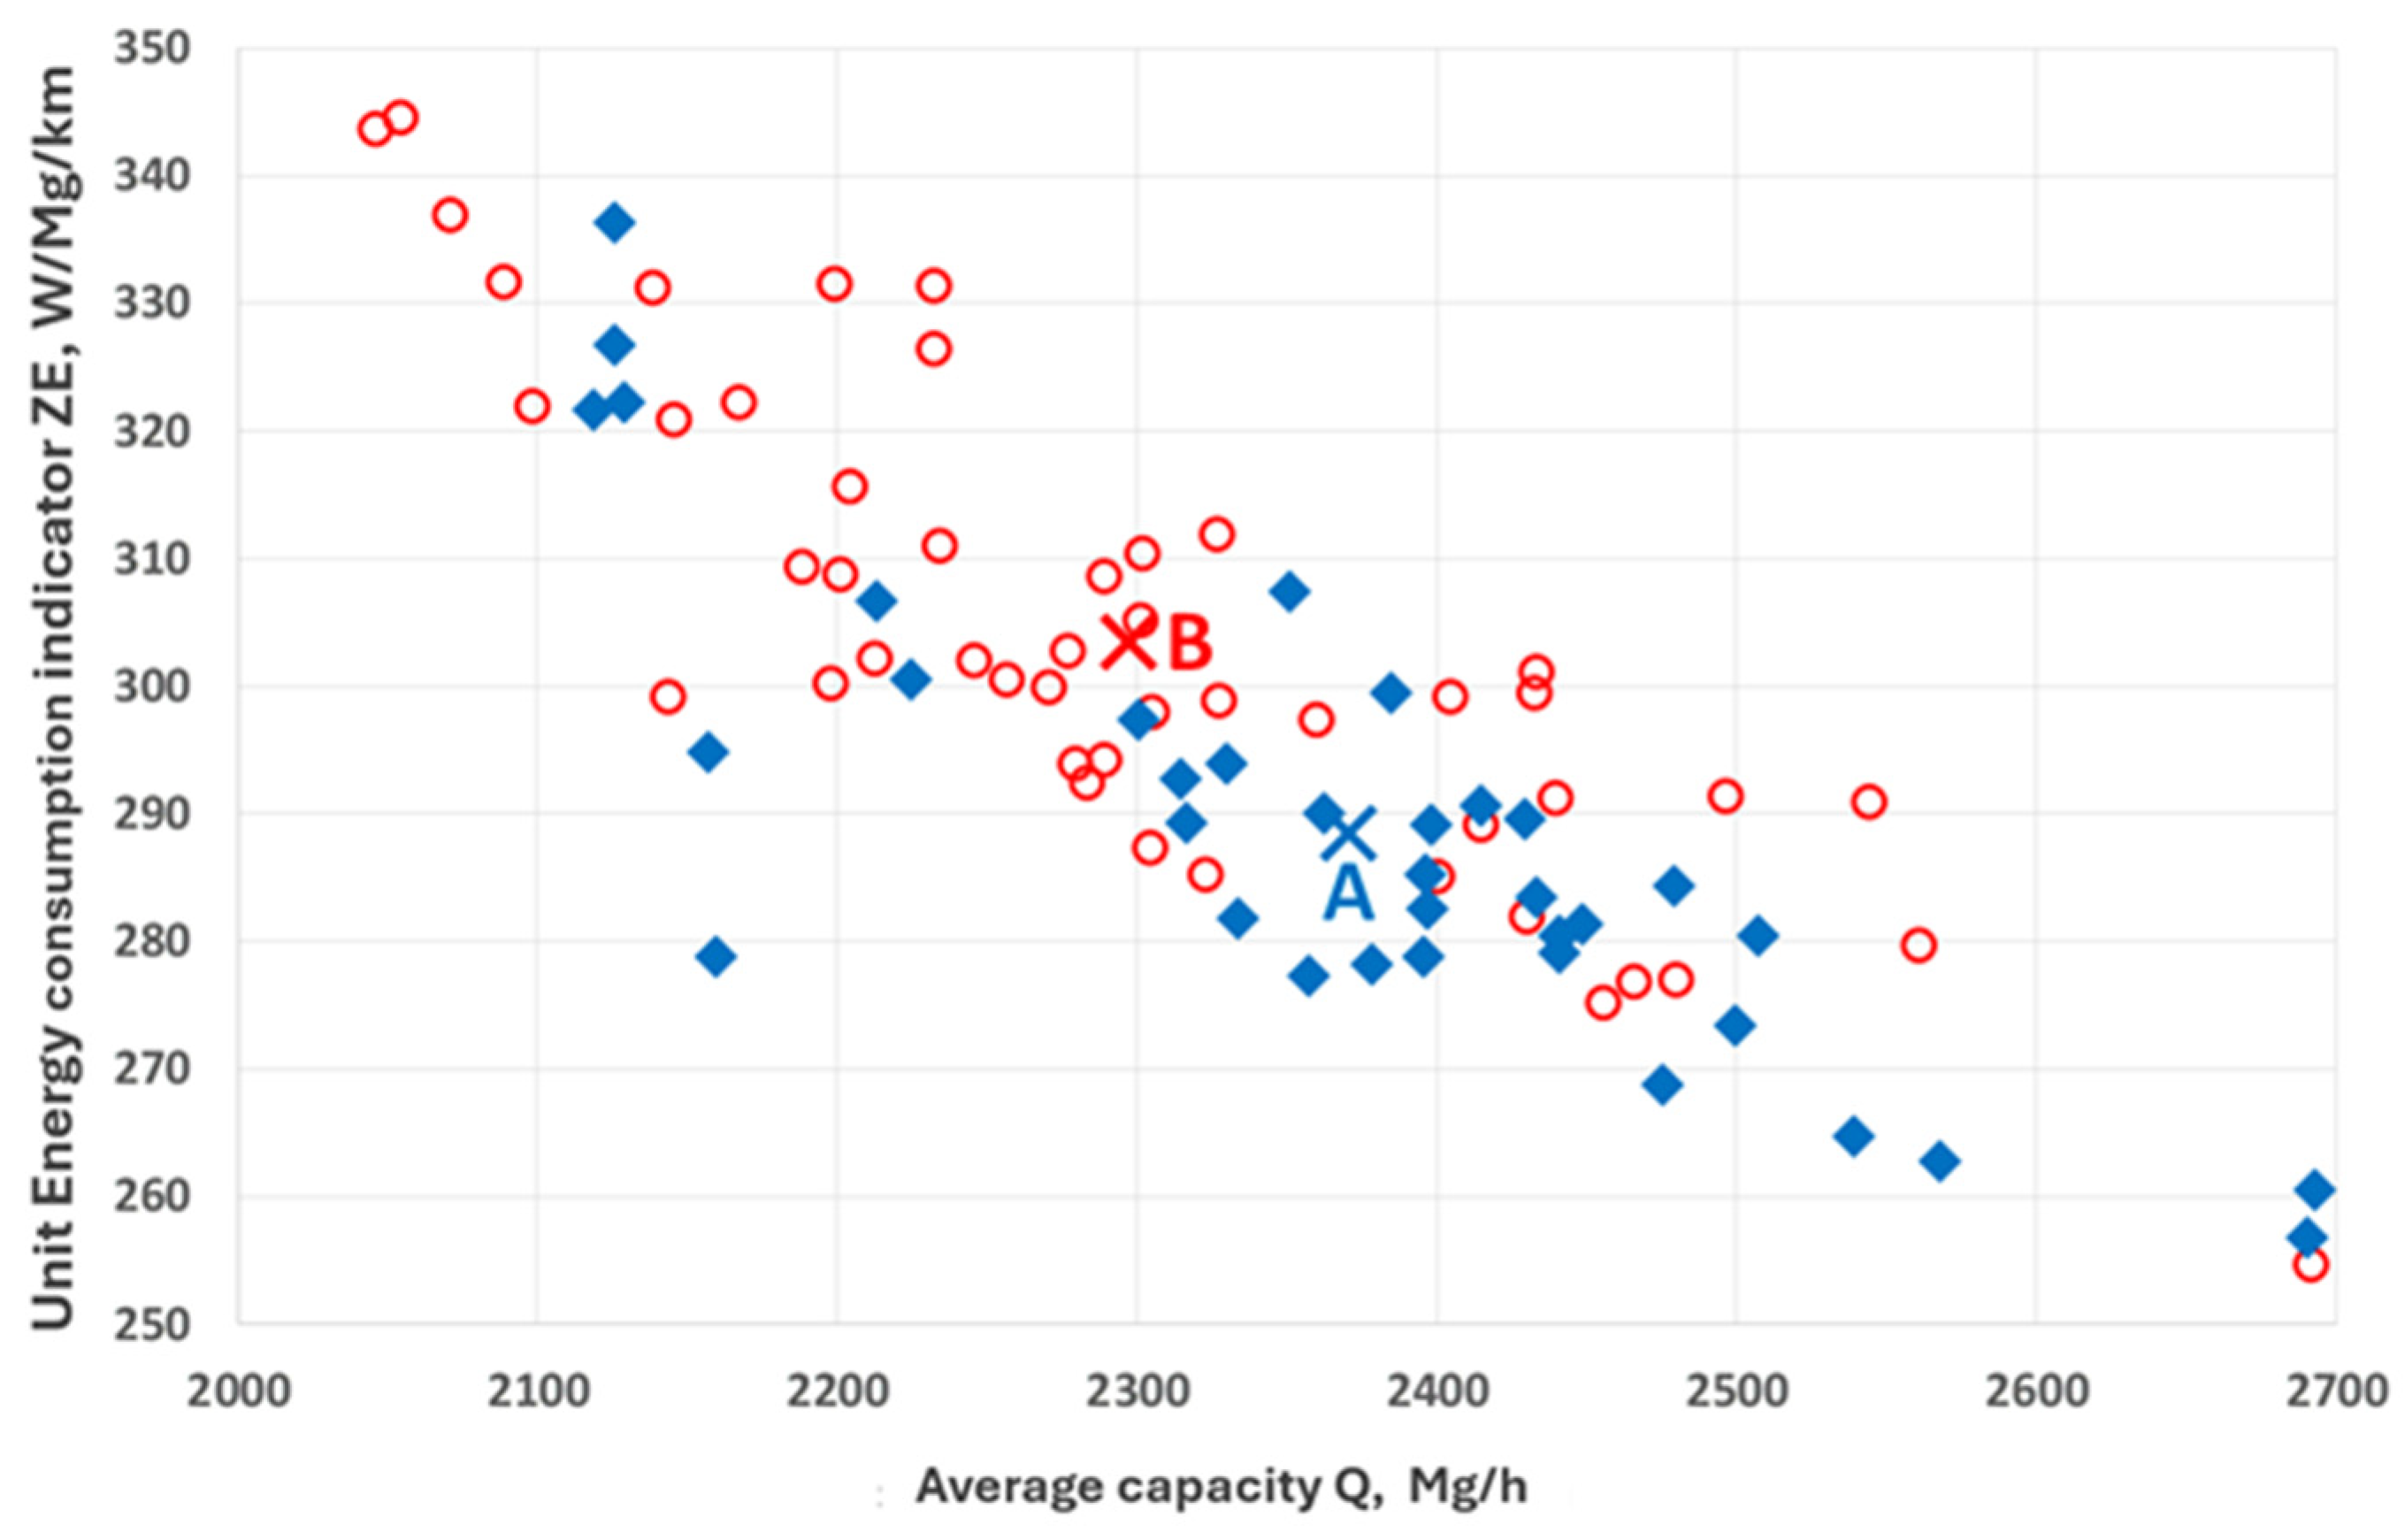
The impact of the monthly average capacity on the specific energy consumption index of the conveyor can be observed in the matrix graph (Figure 5), where all data points are plotted, differentiating between conveyors A and B. The points are mixed and aligned along a negatively inclined diagonal, confirming a strong negative correlation (-0.84 and -0.85 for conveyors A and B, respectively).
The graph (Figure 6) presents 84 complete data pairs (36 for conveyor A and 48 for conveyor B). More blue points (conveyor A) are located in the lower part of the graph, while red points (conveyor B) dominate the upper part. This indicates differences in the average specific energy consumption for conveyor A (288.6 Wh/Mg/km) and conveyor B (303.6 Wh/Mg/km), primarily due to differences in their monthly average capacities: 2370.6 Mg/h for A and 2296.9 Mg/h for B.
Figure 6.
Matrix diagram showing the impact of monthly average capacity Q on the specific unit energy consumption indicator ZE for conveyors A and B.
Figure 6.
Matrix diagram showing the impact of monthly average capacity Q on the specific unit energy consumption indicator ZE for conveyors A and B.
Figure 7.
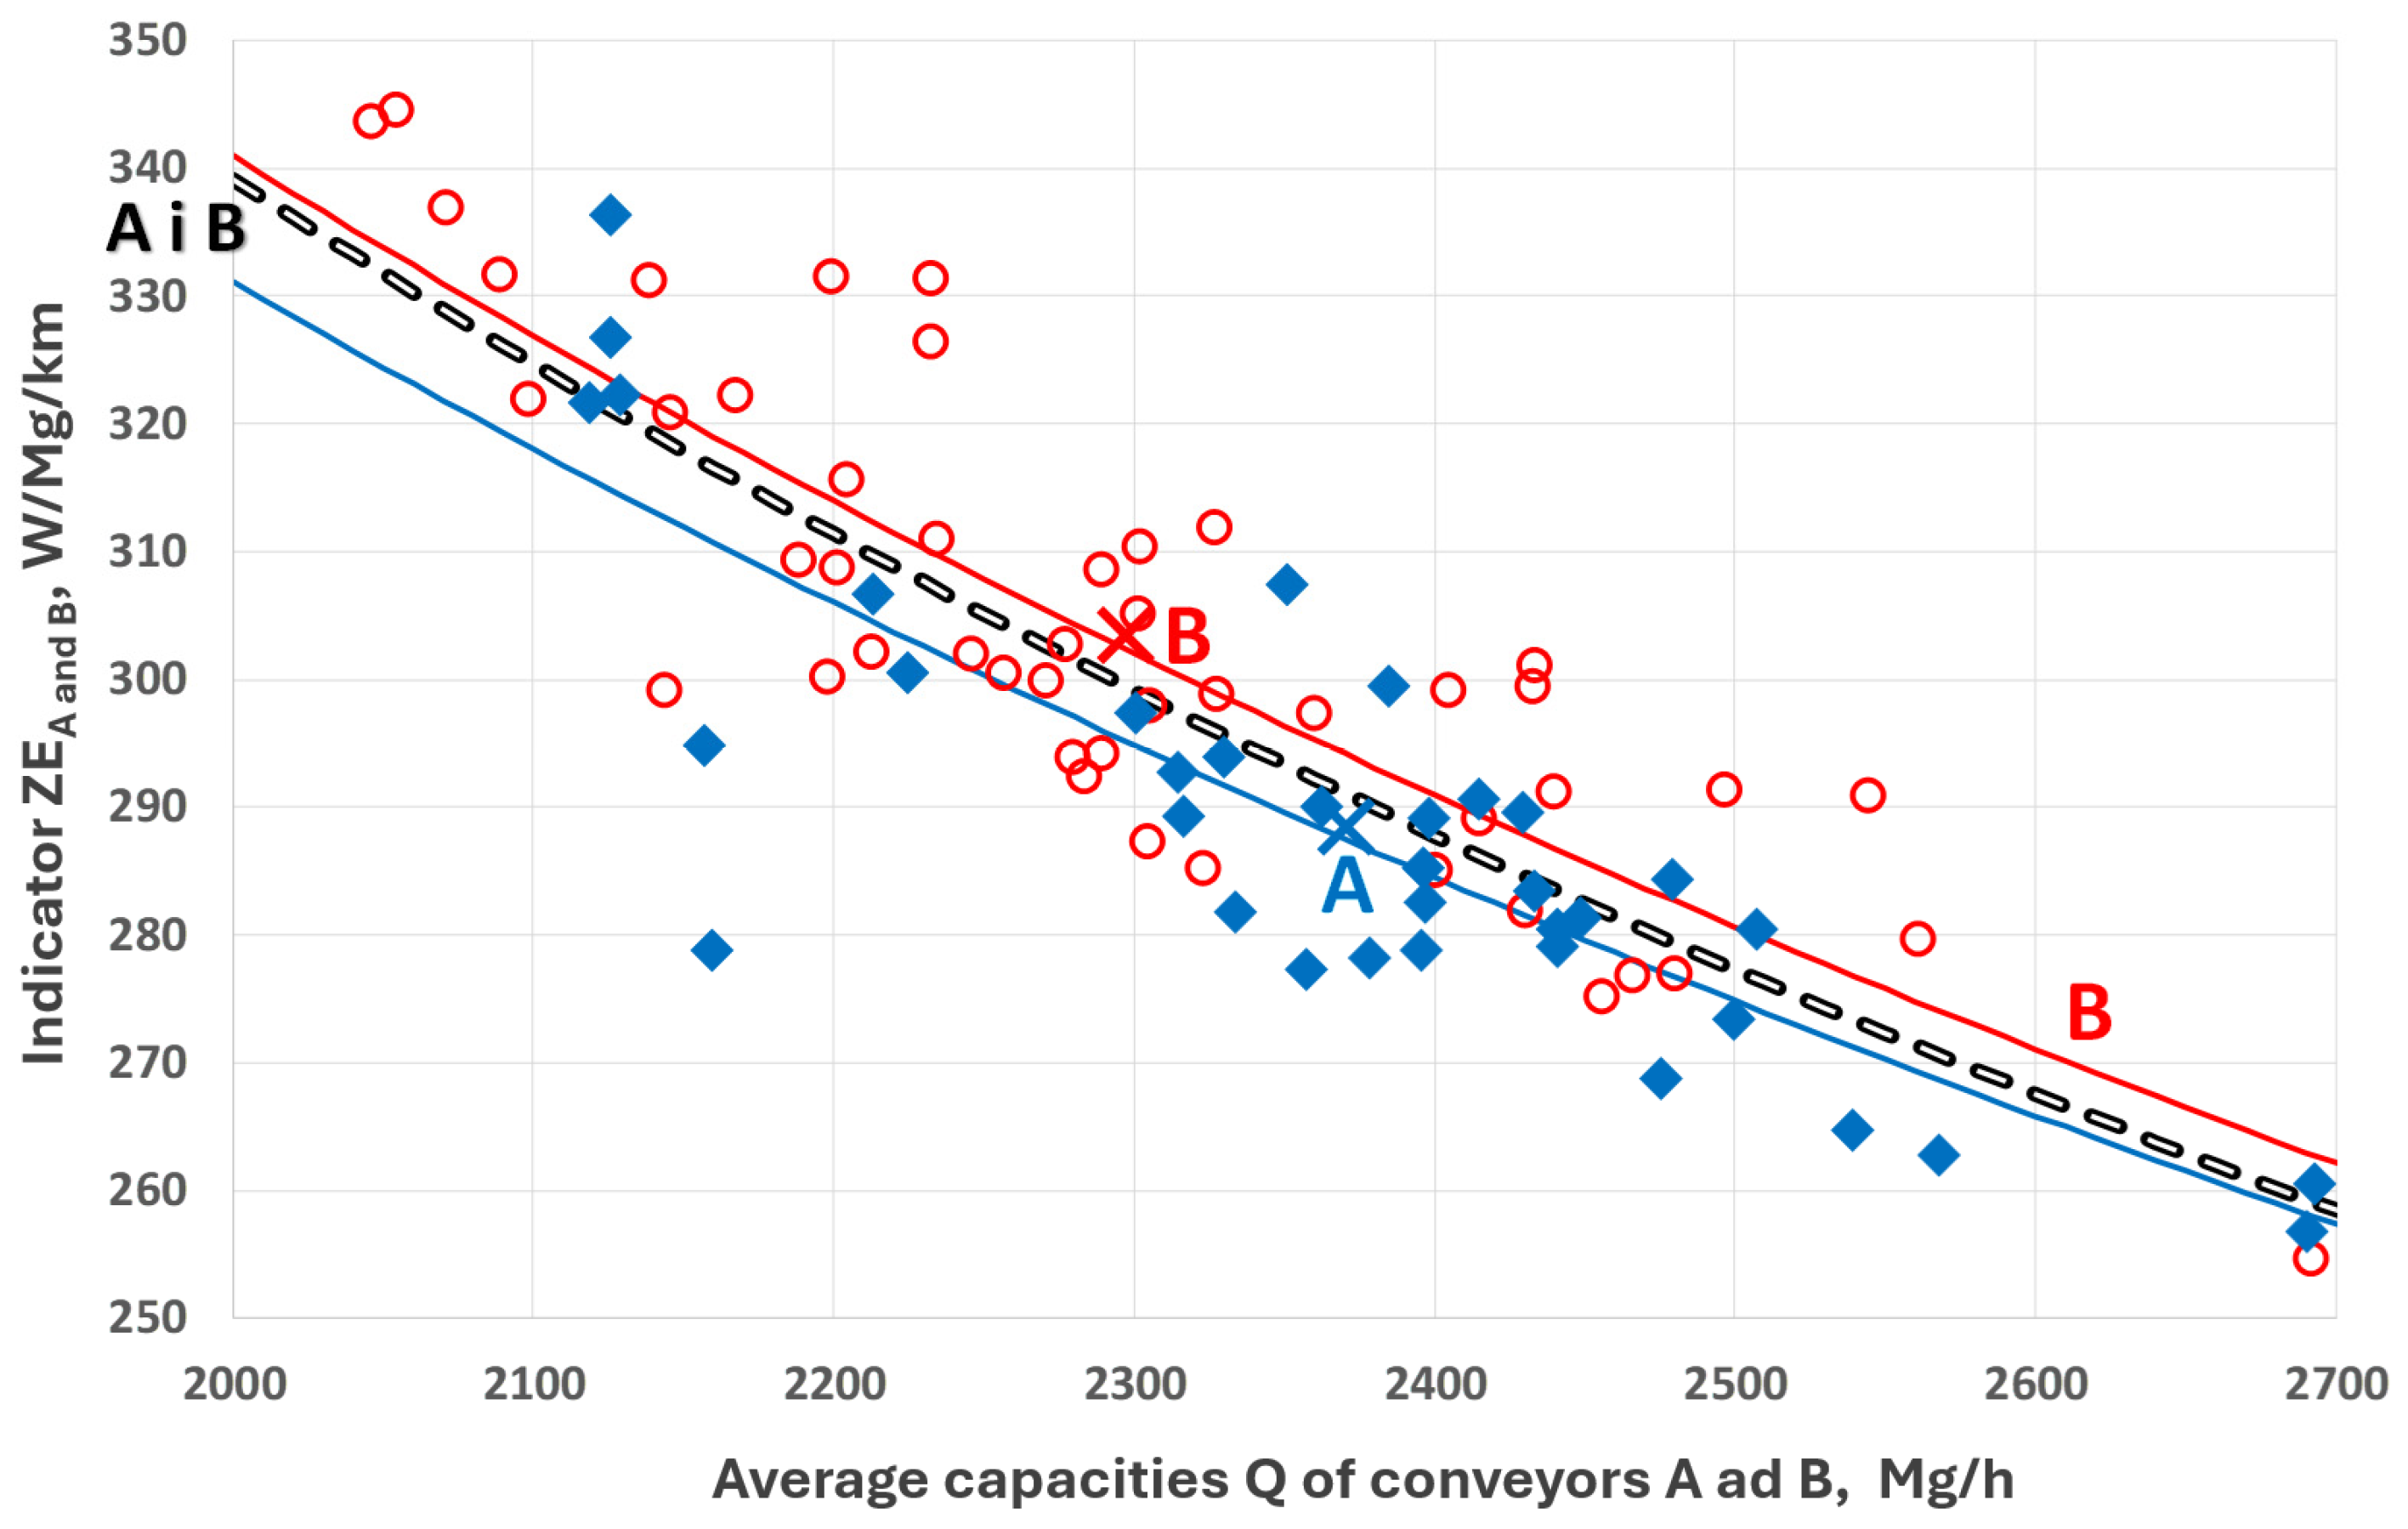
Scatter plot of average capacities Q and energy consumption indicators ZE for each month, with calculated averages (denoted by “X”) for conveyors A and B.
Figure 7.
Scatter plot of average capacities Q and energy consumption indicators ZE for each month, with calculated averages (denoted by “X”) for conveyors A and B.
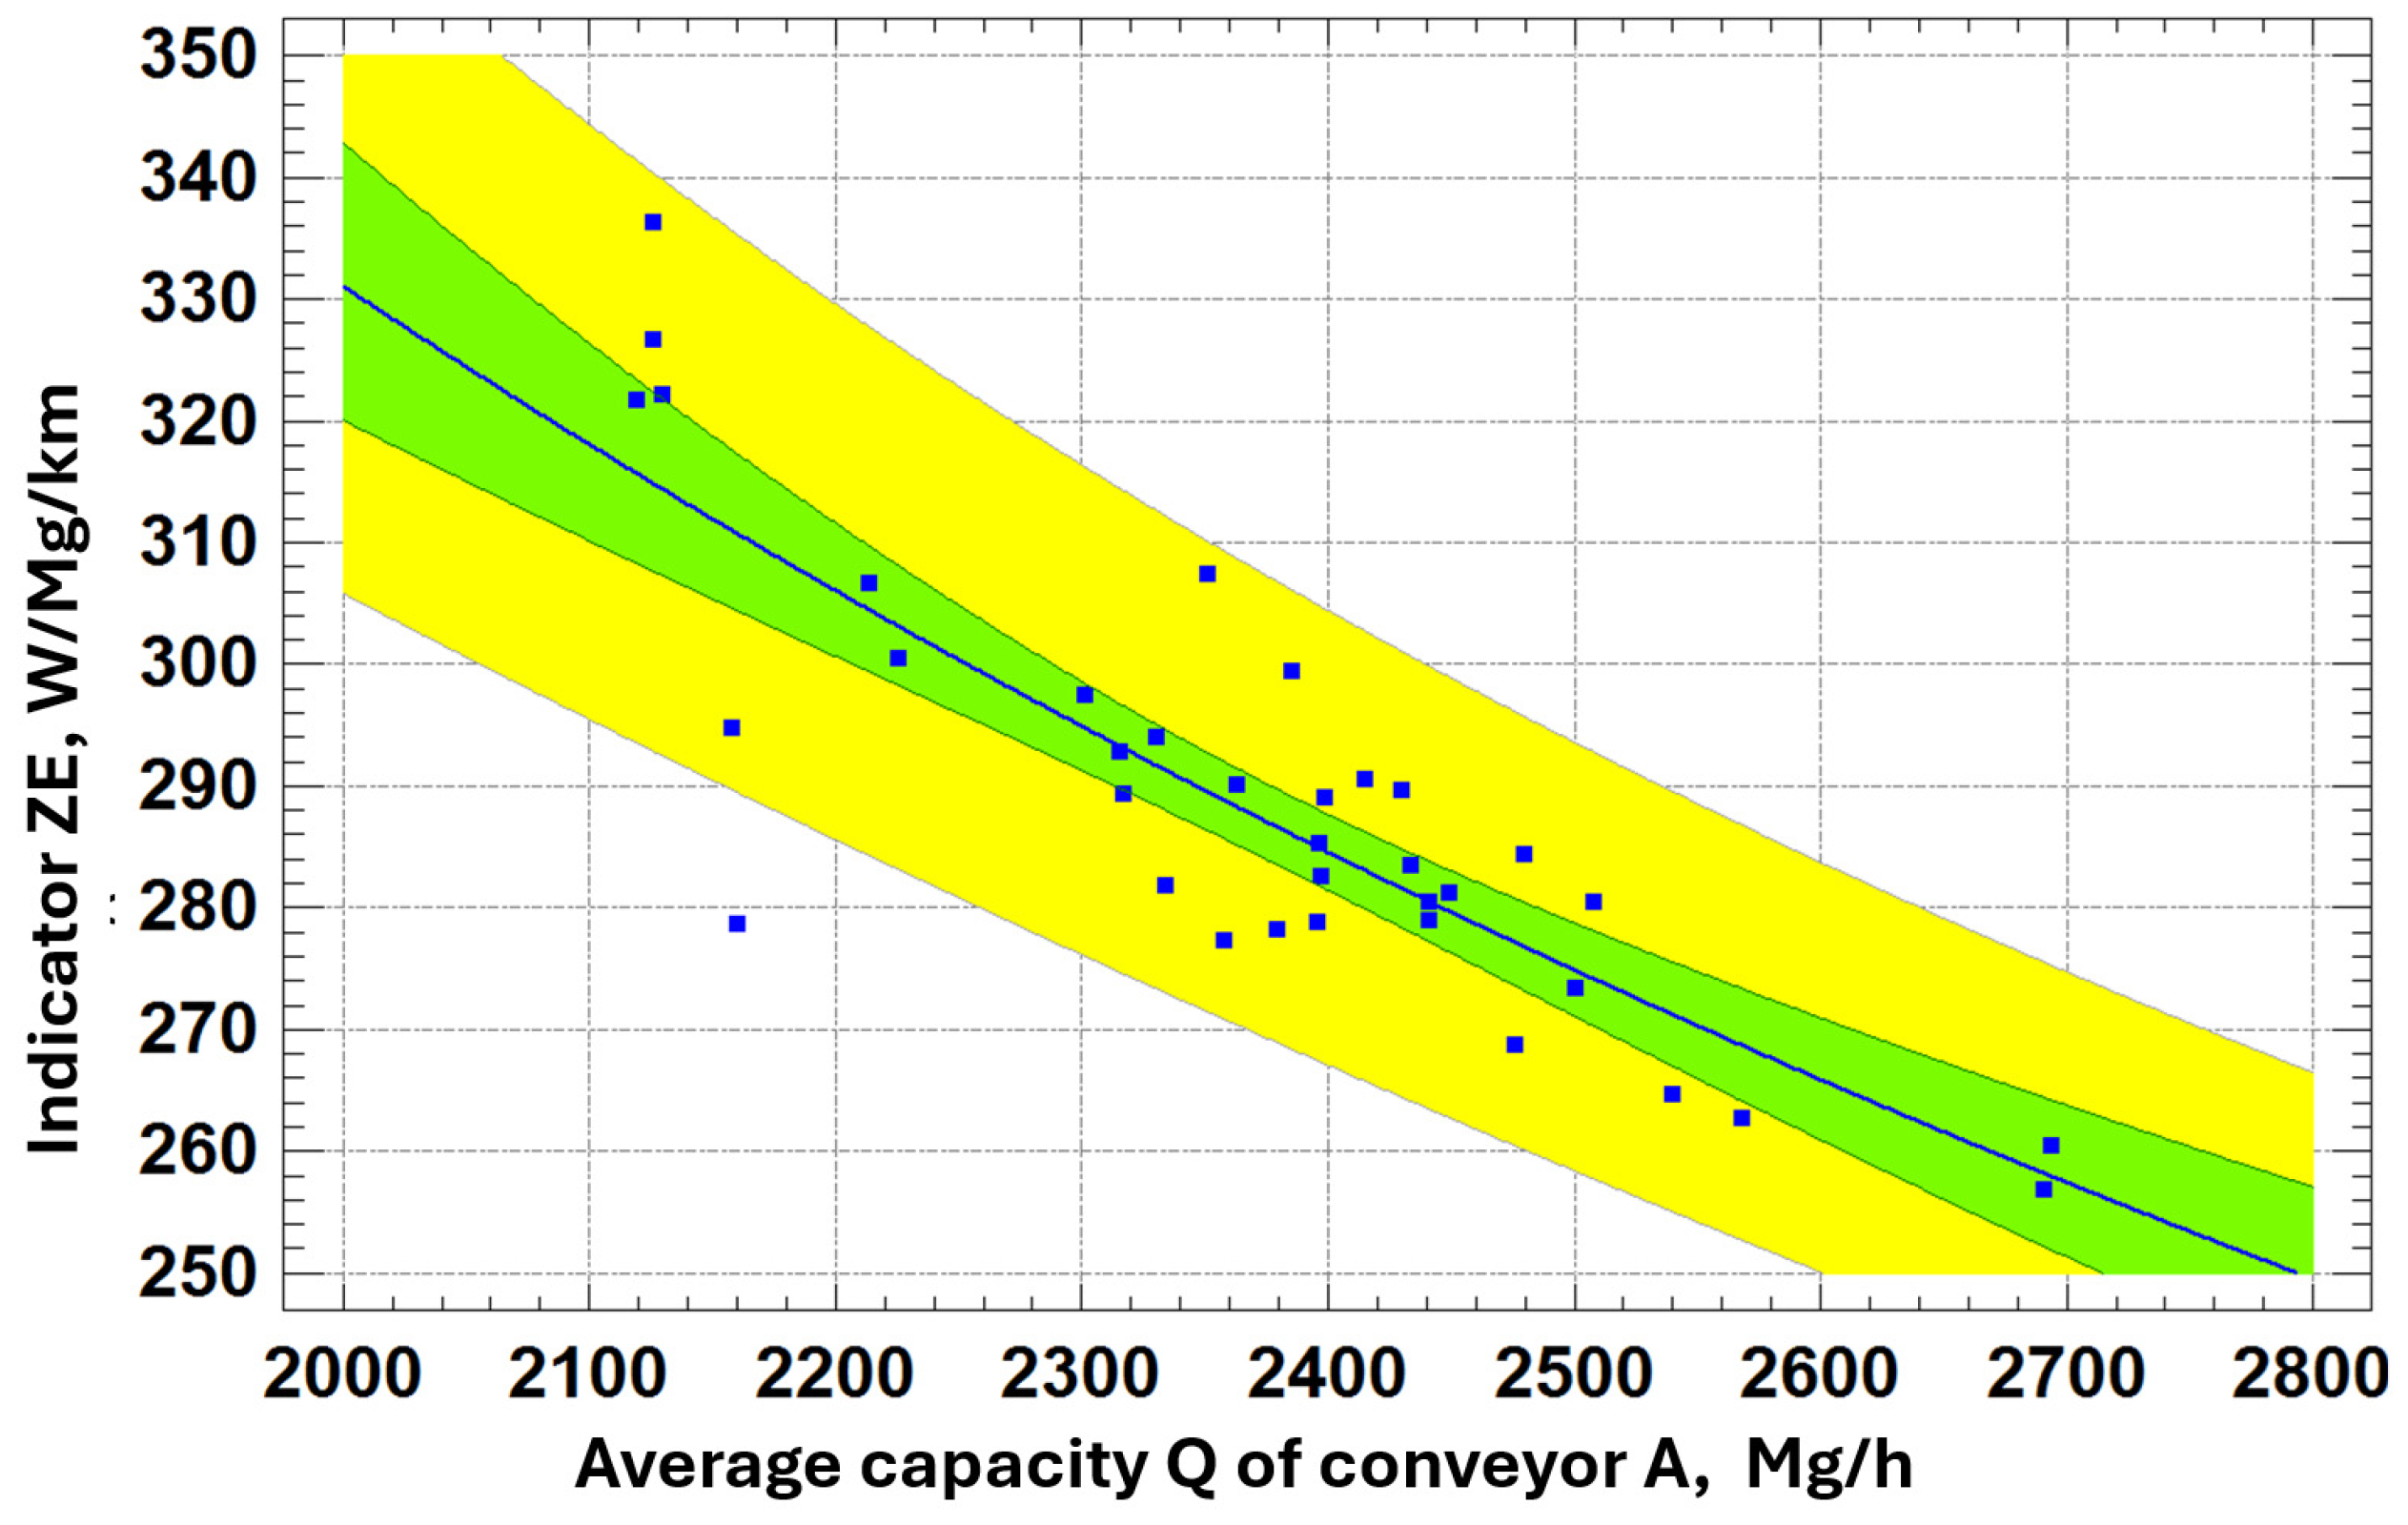
A simple regression test was performed to analyze the relationship between the dependent variable (unit energy consumption indicator ZE) and the independent variable (average efficiency Q) for conveyors A and B separately and together.
For conveyor A, the best-fit model was a hyperbolic function (inverse linear for Y), expressed as Equation (1):
ZEA = 1 / (0.0005512 + 0.000001235 QA)
The estimation analysis, including ANOVA, yielded the following results:
- Correlation coefficient: 0.854862
- R-squared: 73.0789%
- R-squared (df corrected): 72.2871%
- Standard error of estimation: 0.0000796077
- Mean absolute error: 0.0000882741
- Durbin-Watson statistic: 0.909369 (P = 0.00001)
- Residual autocorrelation Lag 1: 0.335697
Since the P-value in the ANOVA table (Table 5) is below 0.05, a statistically significant relationship exists between the indicator ZEA and capacity QA at a 95% confidence level.
Table 5.
Coefficients and variance analysis (Df – degrees of freedom).
| Least squares method | Standard | Statistics | Value | ||
|---|---|---|---|---|---|
| Parameter | Estimate | Error | T | P | |
| Offset | 0.0005512 | 0.00030525 | 1.8057 | 0.0798 | |
| Slope | 0.000001235 | 1.2853 E-7 | 9.6070 | 0.0000 | |
| Variance Analysis | |||||
| Source | Sum of squares | Df | Medium squares | F-statyst. | Value P |
| Model | 0.0000011472 | 1 | 0.0000011472 | 92.30 | 0.0000 |
| The Rest | 4.22607 E-7 | 34 | 1.24296 E-8 | ||
| Together (Corr.) | 0.00000157 | 35 | |||
The R² statistic shows that the model explains 73.1% of the variability in the energy consumption index of conveyor A. The correlation coefficient (0.854862) indicates a moderately strong relationship between the variables. The residuals’ standard deviation is 0.0001115. The mean absolute error (MAE) is 0.000079608, and the Durbin-Watson statistic suggests some serial correlation due to potential seasonal variations in the data.
Figure 8.
A simple regression of ZE for conveyor A against average capacity Q over the analyzed months.
Figure 8.
A simple regression of ZE for conveyor A against average capacity Q over the analyzed months.
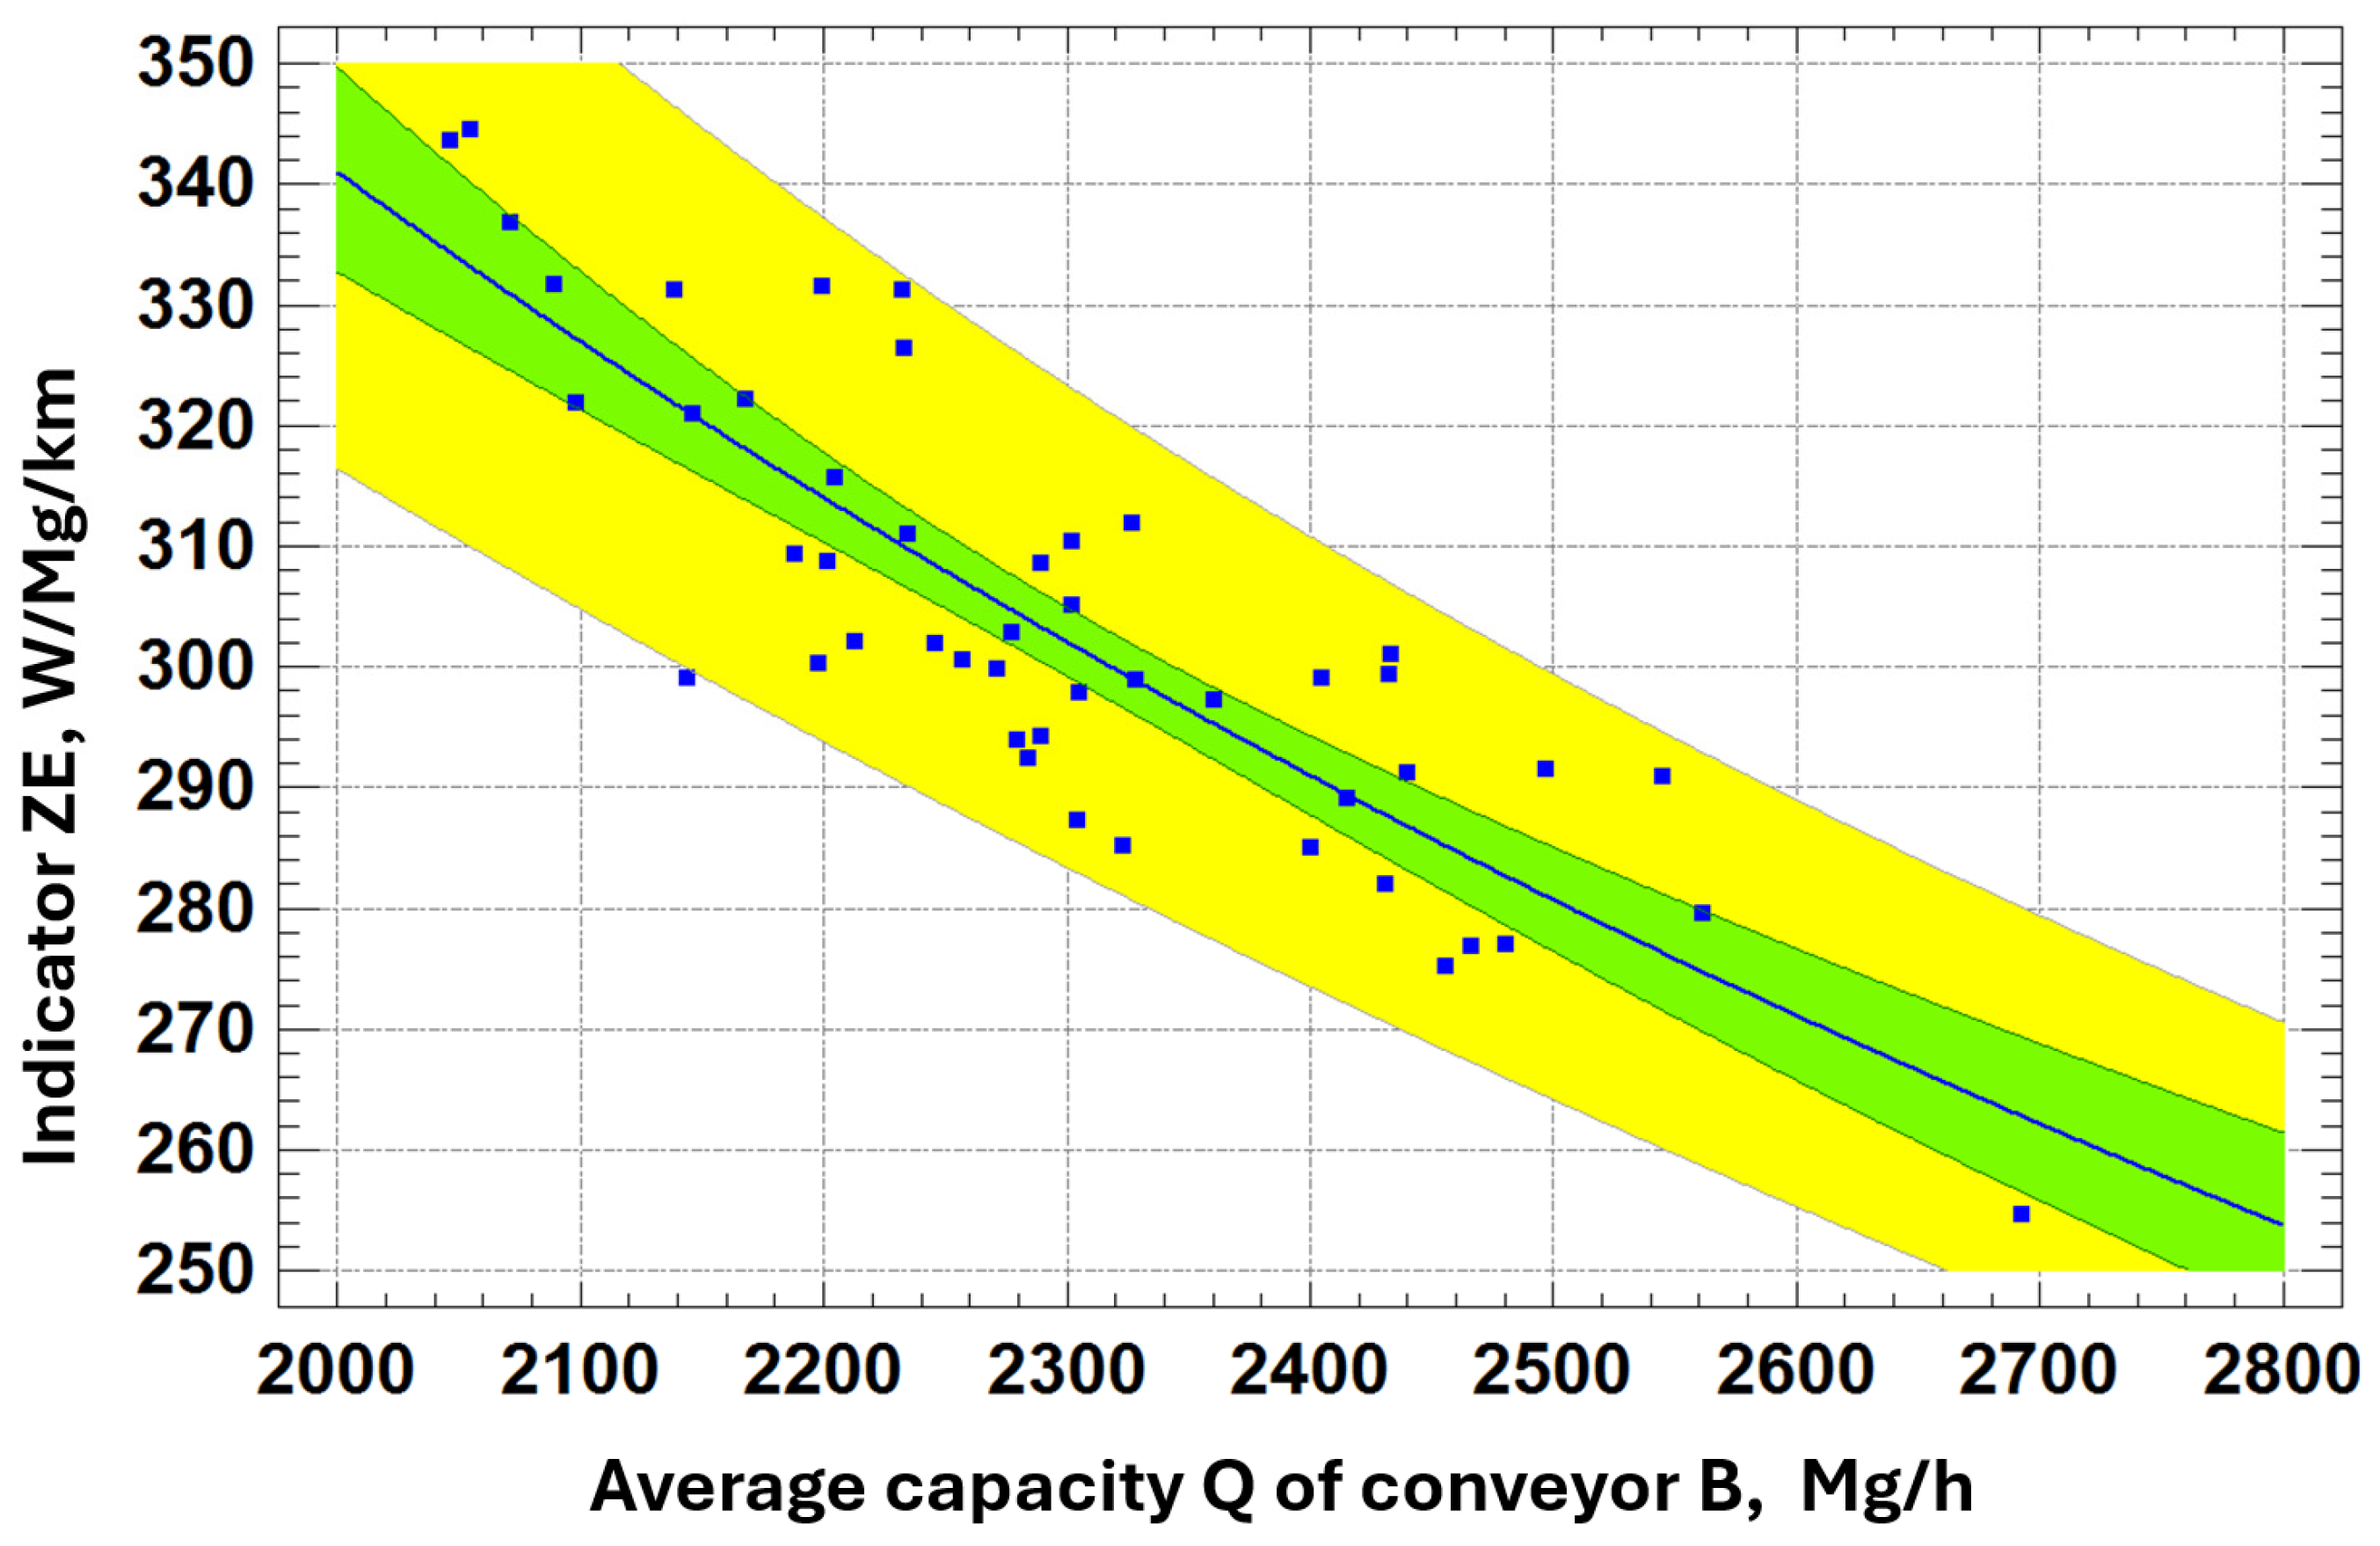
For conveyor B, multiple models were tested (logistic S curve, double hyperbolic, hyperbolic for the logarithm), but differences in correlation coefficients and R² values were minimal. The best correlation coefficient was 0.8616, while the hyperbolic model’s correlation was slightly lower at 0.8603, making it the most comparable model. The Equation (2) is:
ZEB = 1 / (0.0004123 + 0.00000126 QB)
The estimation analysis, including ANOVA, yielded:
- Correlation coefficient: 0.86031
- R-squared: 74.012%
- Standard error of estimation: 0.00010734
- Mean absolute error: 0.000089
- Durbin-Watson statistic: 0.58731 (P = 0.0000)
- Residual autocorrelation Lag 1: 0.66312
Since the P-value in ANOVA (Table 6) is below 0.05, a statistically significant relationship exists between indicator ZEB and QB at a 95% confidence level.
Table 6.
Coefficients and variance analysis (Df – degrees of freedom).
| Least squares method | Standard | Statistics | Value | ||
|---|---|---|---|---|---|
| Parameter | Estimate | Error | T | P | |
| Offset | 0.00041227 | 0.00025337 | 1.6277 | 0.1105 | |
| Slope | 0.0000012602 | 1.10102 E-7 | 11.446 | 0.0000 | |
| Variance Analysis | |||||
| Source | Sum of squares | Df | Medium squares | F-statyst. | Value P |
| Model | 0.0000015094 | 1 | 0.0000015094 | 131.01 | 0.0000 |
| The Rest | 5.29975 E-7 | 46 | 1.15212 E-8 | ||
| Together (Corr.) | 0.000002039 | 47 | |||
Figure 9.
A simple regression of ZE for conveyor B against average capacity Q.
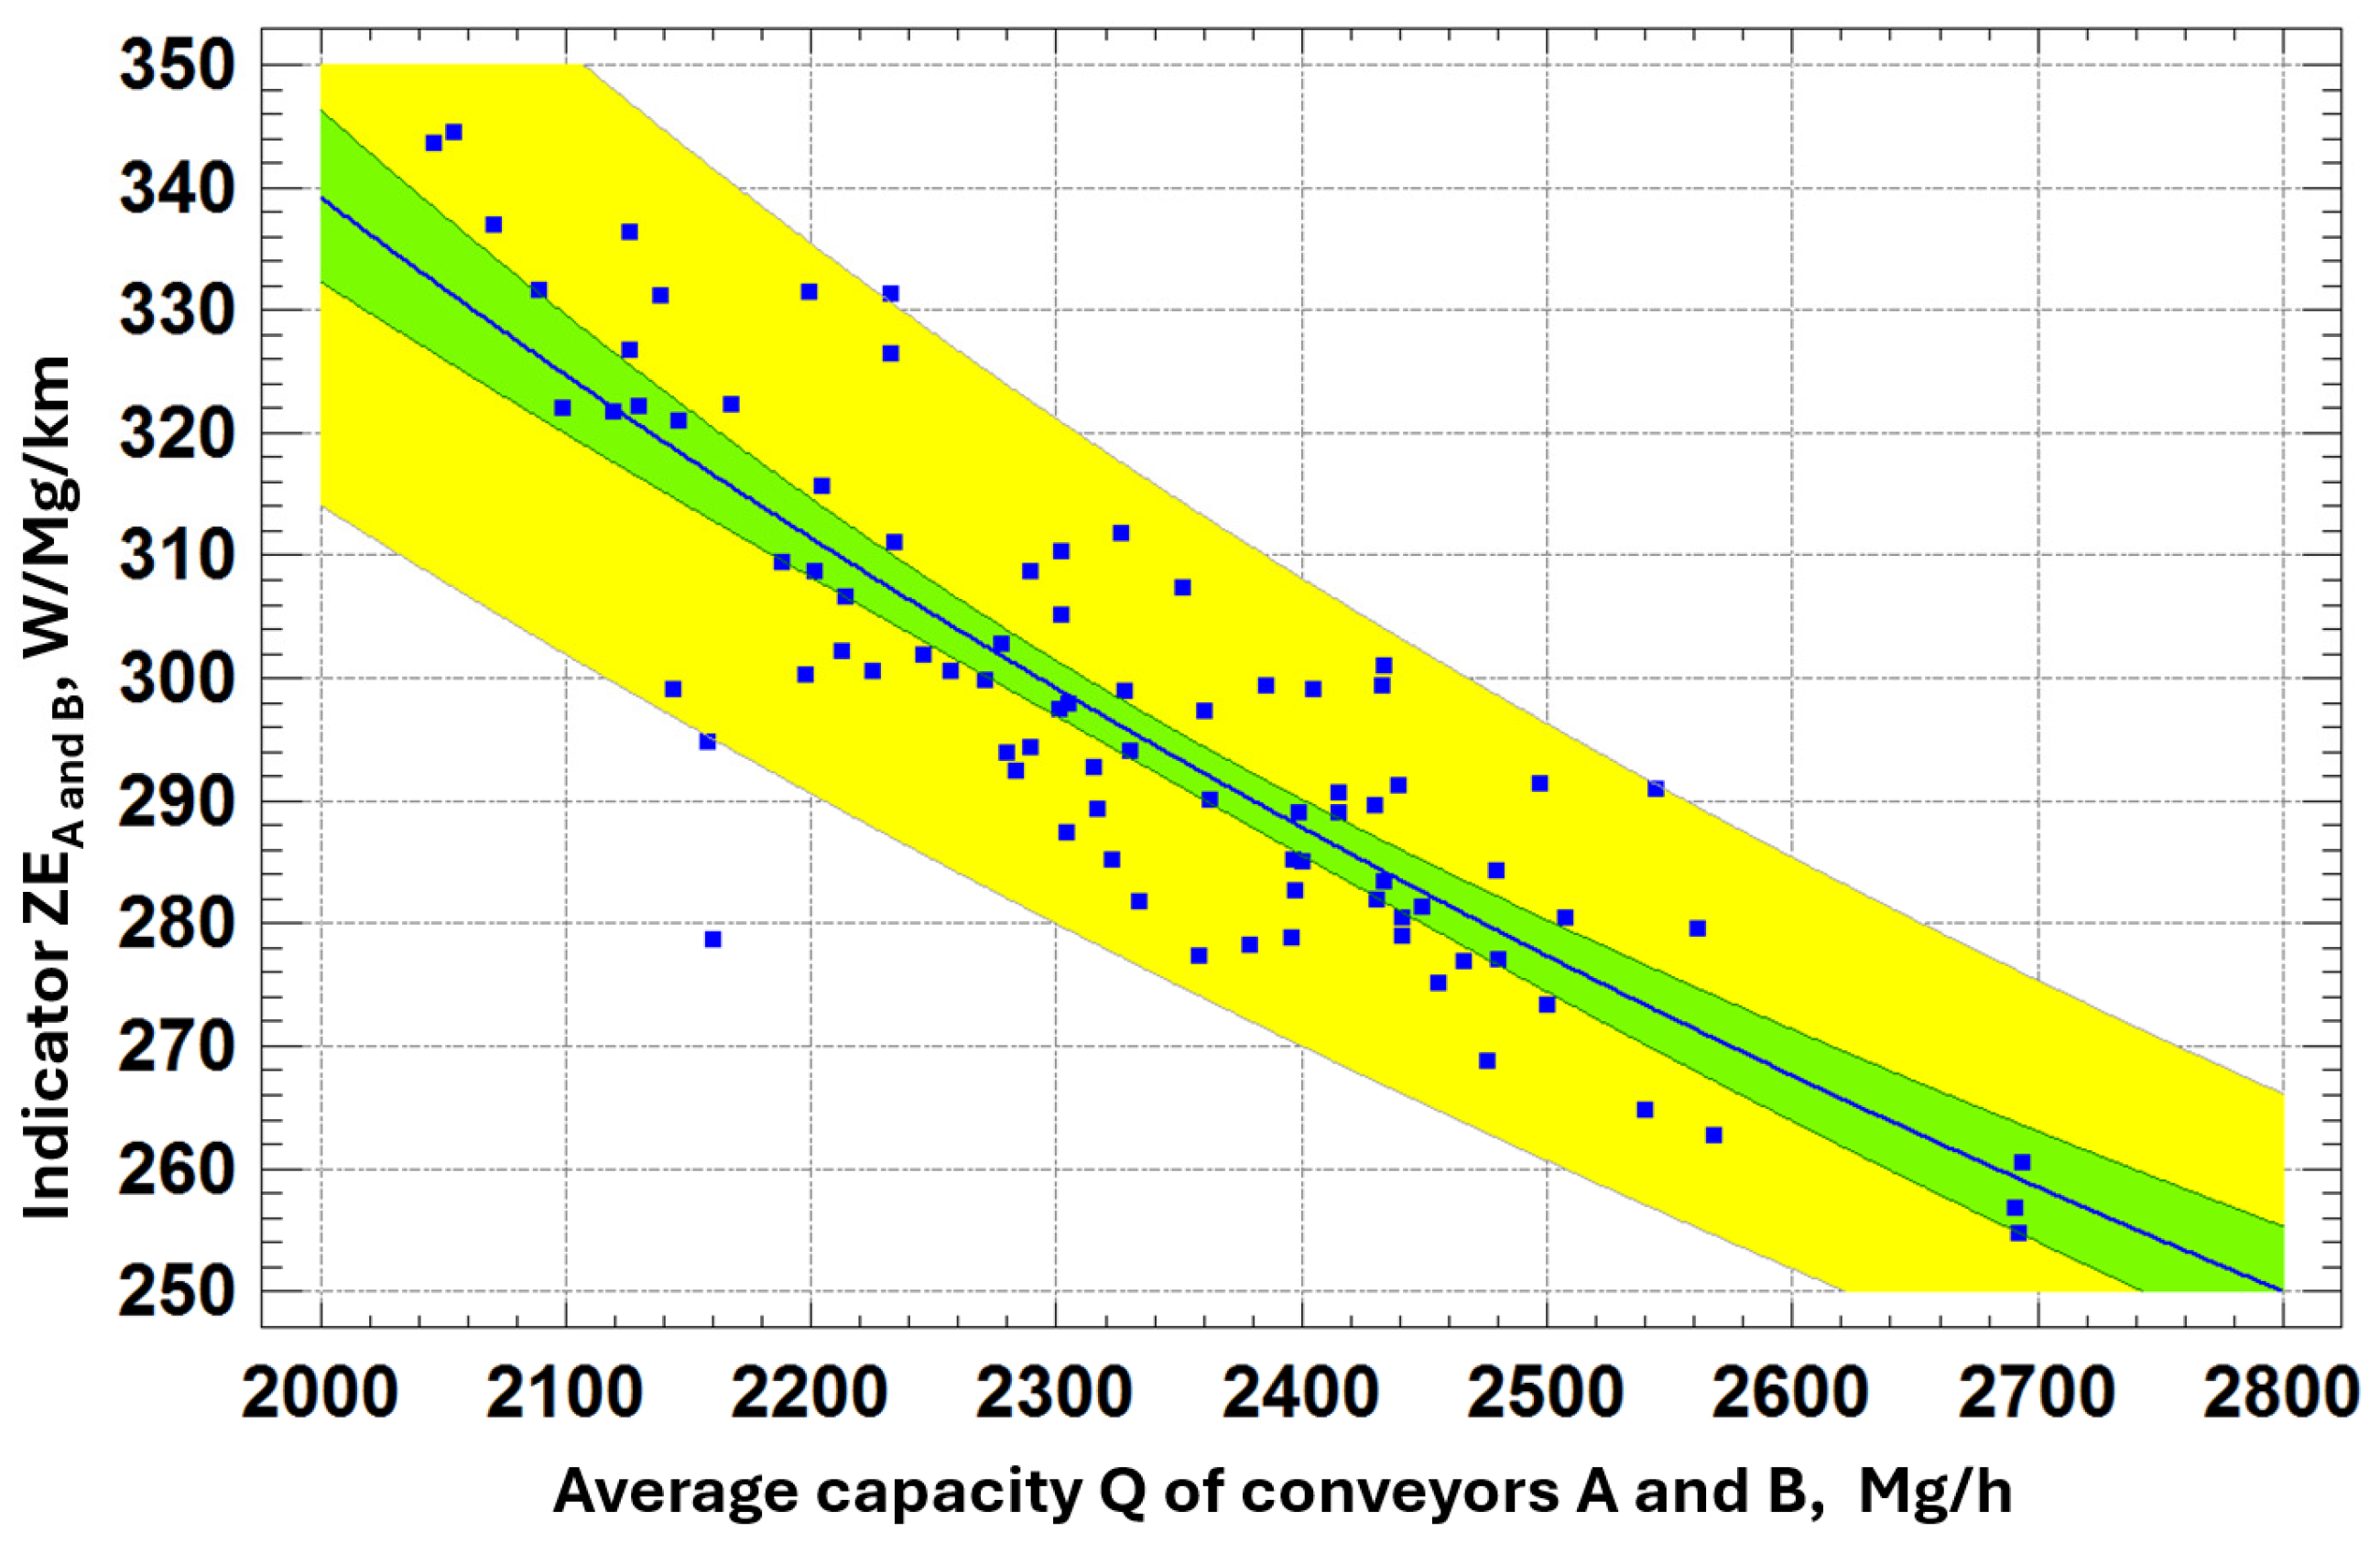
When analyzing data from both conveyors together, the hyperbolic model ranked third after logarithmic and square root hyperbolic models. The minor differences in correlation coefficient (0.0001 lower) and R² index (0.07 lower) made the hyperbolic model suitable for comparative purposes. The Equation (3) is:
ZEA and B = 1 / (0.00031769 + 0.0000013153 QA and B)
The combined regression analysis resulted in:
- Correlation coefficient: 0.86312
- R-squared: 74.498%
- Standard error of estimation: 0.00011448
- Mean absolute error: 0.000088274
- Durbin-Watson statistic: 1.0102 (P = 0.0000)
- Residual autocorrelation Lag 1: 0.46853
The model explains 74.498% of the unit energy consumption indicators variability for both conveyors.
The selected regression curves for conveyors A, B, and combined data were plotted on a standard graph (Figure 10). The regression curves run almost parallel, with minor differences in energy consumption indices. The difference for 2,000 Mg/h is 9.9 Wh/Mg/km, reducing to 4.3 Wh/Mg/km at 2700 Mg/h, a decrease from 3% to 1.7%.
Figure 10.
A simple regression of ZE for conveyors A and B against average capacity Q.
The hyperbolic model fits well, with point dispersion (forecast vs. observed) being mostly uniform, except for a few outliers (Figure 11). However, a variance of up to 30 Wh/Mg/km suggests that factors other than capacity influence energy consumption.
Figure 11.
Comparison of regression models for conveyors A, B, and combined data.
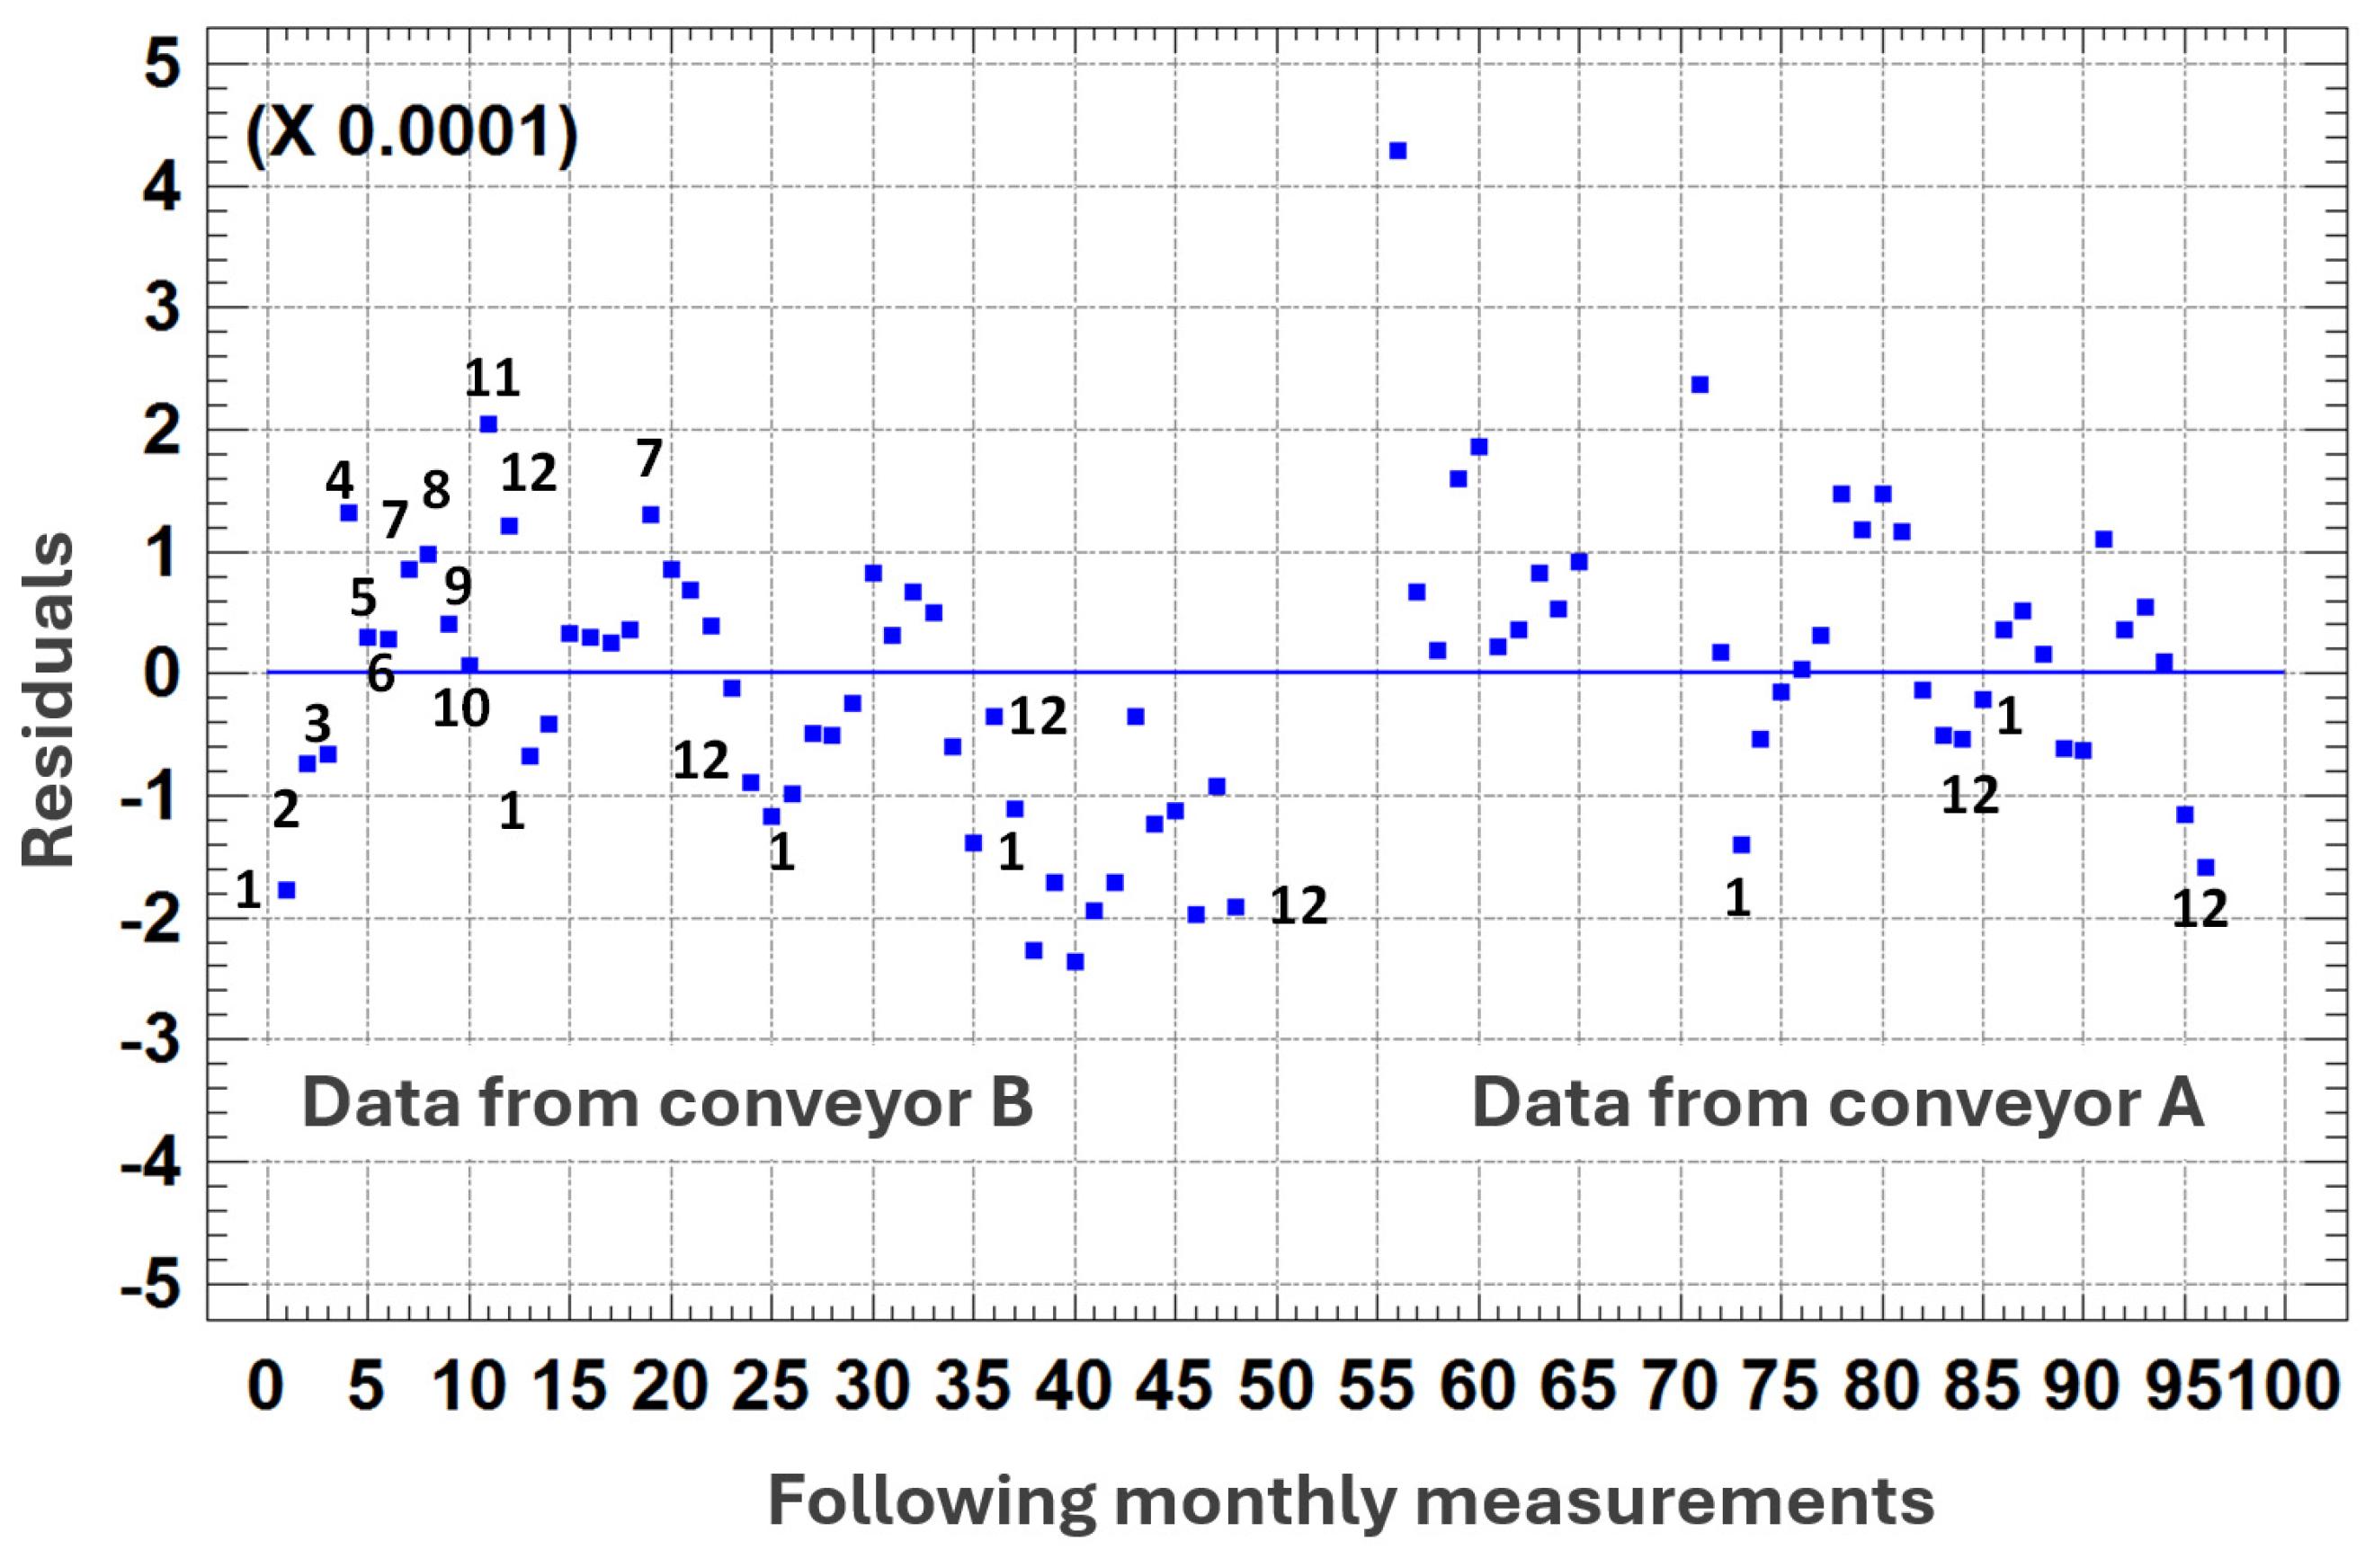
Seasonal temperature variations appear to contribute significantly, with negative residuals in winter-spring and positive ones in summer-autumn (Figure 12). Future analysis will explore the influence of atmospheric conditions.
Figure 12.
Comparison of predicted and observed values.
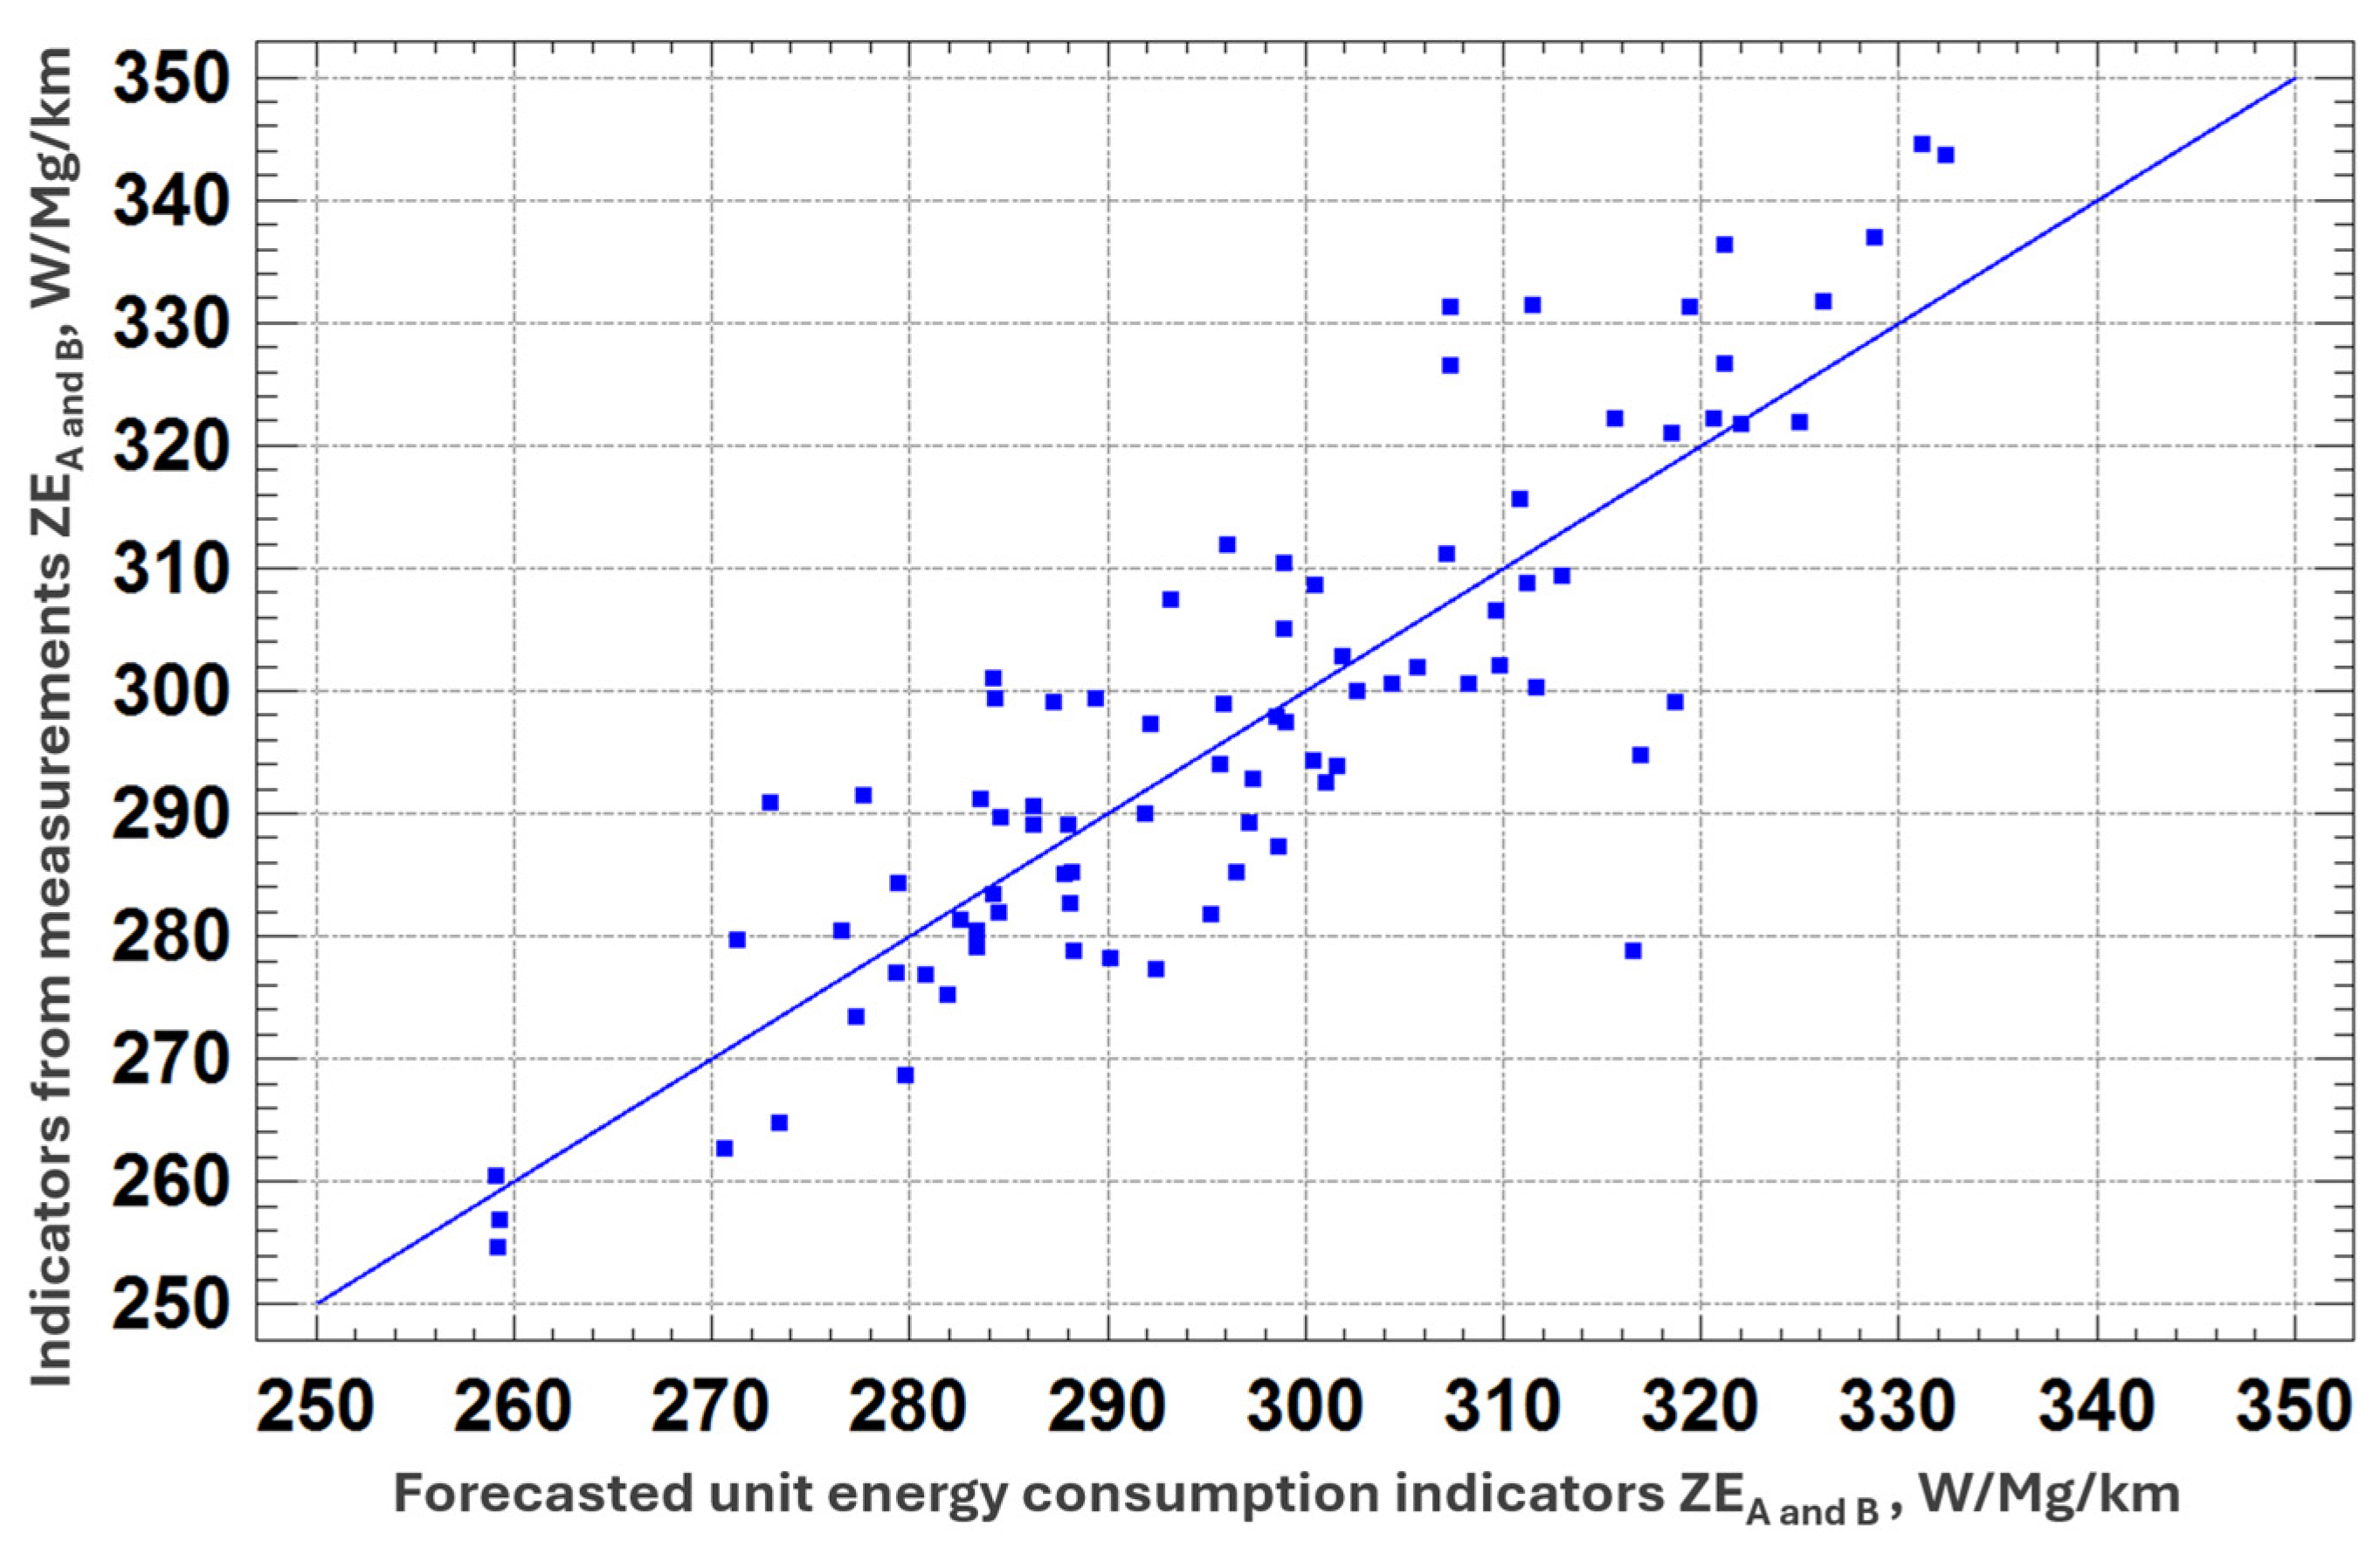
Figure 13.
Distribution of residuals over analyzed months for conveyors A and B.
3. Conclusions
This study demonstrates that variations in conveyor energy consumption primarily result from differences in load distribution. A statistically significant disparity was observed between the average capacities of conveyors A and B, with A operating at 2,381.99 Mg/h and B at 2,309.47 Mg/h—an absolute difference of 72.51 Mg/h (3.04%).
A strong negative correlation was identified between ZE and conveyor capacity (R² = -0.84 and -0.85 for conveyors A and B, respectively). A 35% relative increase in capacity (from 2000 up to 2700 Mg/h) led to a 26% reduction in ZE (from 340 down to 250 Wh/Mg/km), equating to a 90 Wh/Mg/km decrease. Proper load distribution could potentially reduce unit energy consumption by up to 30%.
Optimizing conveyor utilization—such as alternating higher load levels between conveyor lines—can yield substantial energy savings. For instance, instead of running both lines at 30% capacity daily, increasing one line’s load to 60% while idling the other could further reduce energy consumption by as much as 150 Wh/Mg/km. These optimizations require no additional infrastructure investment, making them a cost-effective strategy for improving efficiency.
The Bełchatów power plant receives 30-40 million Mg of coal annually, transported over conveyor lines spanning several dozen kilometers. For 10 million Mg/year over 10 km, this equates to potential energy savings of 9 GWh (or 15 GWh at 60%). Scaling up to actual conditions—four times the coal volume and double the conveyor length—yields estimated savings of 72 GWh (or 120 GWh). Including overburden removal, these estimates could increase further (by multiplication by overburden to coal ratio + 1), emphasizing the potential of improved load management through centralized control in surface mines.
An additional opportunity lies in synchronizing conveyor operations with the daily solar cycle for overburden removal and coal extraction. Excess renewable energy, particularly from PV sources, often results in low or negative electricity prices and RES curtailments. Dynamic load control allows conveyor utilization to maximize this opportunity during peak solar production. A recent study in Energies explored this approach, demonstrating its feasibility in developing the Złoczew lignite deposit [RES].
Future research will investigate additional energy-saving measures, such as energy-saving conveyor belts, and evaluate the benefits of load optimization and technological improvements. Further studies will also assess the impact of environmental factors, particularly temperature, on energy consumption variability, as preliminary findings suggest that up to 75% of ZE fluctuations stem from load variations.
Identifying the primary drivers of conveyor energy consumption under long-term industrial conditions enhances predictive accuracy and highlights significant opportunities for efficiency improvements. These findings provide practical guidelines for reducing operational costs and improving the sustainability of belt conveyor systems in lignite mining operations.
Author Contributions
Conceptualization, L.J. and M.B.; methodology, L.J.; software, L.J.; validation, M.B., L.J., and Z.K.; formal analysis, M.B.; investigation, Z.K.; resources, L.J. and M.B.; data curation, Z.K.; writing—original draft preparation, L.J.; writing—review and editing, M.B.; visualization, L.J.; supervision, M.B.; project administration, M.B.; funding acquisition, M.B. and L.J. All authors have read and agreed to the published version of the manuscript.
Funding
The research work was co-founded with the research subsidy of the Polish Ministry of Science and Higher Education granted for 2025.
Data Availability Statement
The data presented in this study are available on request from the corresponding author.
Acknowledgments
The authors would like to thank the mine management, especially Mr. Zbigniew Konieczka, for providing detailed data on the energy consumption of the analyzed conveyors.
Conflicts of Interest
No potential conflicts of interest were reported by the authors.
References
- Soofastaei, A.; Karimpour, E.; Knights, P., & Kizil, M. Energy-efficient loading and hauling operations. Energy efficiency in the minerals industry: best practices and research directions, 2018, 121-146. [CrossRef]
- De Almeida, C. M.; de Castro Neves, T.; Arroyo, C.; & Campos, P. Truck-and-loader versus conveyor belt system: an environmental and economic comparison. In Proceedings of the 27th International Symposium on Mine Planning and Equipment Selection-MPES, 2018 (pp. 307-318). Cham: Springer International Publishing.
- Carter, R. A. Designing Today’s Conveyor Systems for Tomorrow’s Needs. Engineering and Mining Journal, 2023, 224(10), 24-30.
- Leonida, C. Moving Material More Efficiently. Engineering and Mining Journal, 2023, 224(4), 32-37.
- Bodziony, P.; Patyk, M. The influence of the mining operation environment on the energy consumption and technical availability of truck haulage operations in surface mines. Energies, 2024, 17(11), 2654.
- Krysa, Z.; Bodziony, P.; Patyk, M. Exploitation of Mineral Resources in Conditions of Volatile Energy Prices: Technical and Economic Analysis of Low-Quality Deposits. Energies, 2024, 17(14), 3379.
- Rakhmangulov, A.; Burmistrov, K.; Osintsev, N. Multi-criteria system’s design methodology for selecting open pits dump trucks. Sustainability, 2024, 16(2), 863.
- He, D., Pang, Y., & Lodewijks, G. Green operations of belt conveyors by means of speed control. Applied Energy, 2017, 188, 330-341.
- Bajda, M.; Hardygóra, M.; Marasová, D. Energy efficiency of conveyor belts in raw materials industry. Energies, 2022, 15(9), 3080.
- Szczeszek, P.; Jastrząb, A.; Karkoszka, T.; Prusko, A. Energy and ecological optimization of the belt conveyors’ operation. Journal of Achievements in Materials and Manufacturing Engineering, 2023, 121(1).
- Mathaba, T., & Xia, X. Optimal and energy efficient operation of conveyor belt systems with downhill conveyors. Energy Efficiency, 2017, 10(2), 405-417.
- Kawalec, W.; Król, R.; Suchorab, N. Regenerative belt conveyor versus haul truck-based transport: Polish open-pit mines facing sustainable development challenges. Sustainability, 2020, 12(21), 9215.
- Naworyta, W.; & Sikora, M. Czy możliwa jest budowa elektrowni szczytowo-pompowej na terenach po wydobyciu węgla brunatnego? Analiza zagrożeń, ograniczeń i korzyści. Analiza zagrożeń, ograniczeń i korzyści. Nowa Energia, 2023, 3. (in Polish).
- Jurdziak, L.; Kawalec, W.; Kasztelewicz, Z.; Parczyk, P. Using RES Surpluses to Remove Overburden from Lignite Mines Can Improve the Nation’s Energy Security. Energies, 2024, 18(1), 104.
- Raj, P. P.; Pochont, N. R.; Teja, K. R.; Kumar, G. D. Solar PV Application in Industrial Conveyor System. In IOP Conference Series: Earth and Environmental Science (Vol. 573, No. 1, p. 012046). IOP Publishing, (2020, October).
- Bajda, M.; Jurdziak, L.; Konieczka, Z. Comparison of electricity consumption by belt conveyors in a brown coal mine: Pt 1, Study of statistical significance of differences and correlations. Górnictwo Odkrywkowe, 2018, 26, 263-274 (in Polish).
- Suchorab, N. Specific energy consumption–the comparison of belt conveyors. Mining Science, 2019, 26, 263-274.
- Kawalec, W.; Suchorab, N.; Konieczna-Fuławka, M.; Król, R. Specific energy consumption of a belt conveyor system in a continuous surface mine. Energies, 2020, 13(19), 5214.
- Bajda, M.; Jurdziak, L.; Pactwa, K.; Woźniak, J. Energy-Saving of Conveyor Belts in the Strategy and Reporting of Corporate Social Responsibility Initiatives of Producers. In Global Congress on Manufacturing and Management (2021, June), (pp. 402-414). Cham: Springer International Publishing.
- Köken, E.; Lawal, A. I.; Onifade, M.; Özarslan, A. A comparative study on power calculation methods for conveyor belts in mining industry. International Journal of Mining, Reclamation and Environment 2022, 36(1), 26–45. [Google Scholar] [CrossRef]
- Suchorab-Matuszewska, N. Data-Driven Research on Belt Conveyors Energy Efficiency Classification. Archives of Mining Sciences, 2024, 375-389.
- Blazej, R.; Jurdziak, L.; Kawalec, W. Energy saving solutions for belt conveyors in lignite surface mines. Institute of Mining Engineering, Wroclaw University of Science and Technology, Poland 2015.
- Roumpos, C.; Partsinevelos, P.; Agioutantis, Z.; Makantasis, K.; Vlachou, A. The optimal location of the distribution point of the belt conveyor system in continuous surface mining operations. Simulation Modelling Practice and Theory, 2014, 47, 19-27.
- Youssef, G. Development of Conveyor Belts Design for Reducing Energy Consumption in Mining Applications. Ain Shams University, 2016.
- Zhou, S. J.; Zeng, F.; Du, J.; Wu, Q.; Ren, F. Experimental research on the energy consumption laws and its influencing factors of belt conveyor systems. In 2016 13th International Computer Conference on Wavelet Active Media Technology and Information Processing (ICCWAMTIP), (2016, December), (pp. 395-402).
- Krol, R.; Kawalec, W.; Gladysiewicz, L. An effective belt conveyor for underground ore transportation systems. In IOP Conference Series: Earth and Environmental Science, (2017, December), (Vol. 95, No. 4, p. 042047). IOP Publishing.
- Munzenberger, P.; Wheeler, C. Laboratory measurement of the indentation rolling resistance of conveyor belts. Measurement, 2016, 94, 909-918.
- Woźniak, D. Laboratory tests of indentation rolling resistance of conveyor belts. Measurement 2020, 150, 107065. [Google Scholar] [CrossRef]
- dos Santos e Santos, L.; Ribeiro Filho, P. R. C. F.; Macêdo, E. N. Indentation rolling resistance in pipe conveyor belts: A review. Journal of the Brazilian Society of Mechanical Sciences and Engineering, 2021, 43(4), 230.
- Zhou, L.; Wu, Z.; Li, Y.; Yao, H.; Liu, Y.; Yuan, Y.; Cao, X. Temperature characteristics of indentation rolling resistance of belt conveyor. Journal of Mechanical Science and Technology 2023, 37(8), 4125–4135. [Google Scholar] [CrossRef]
- Wan, L.; Lin, F. Simulation and Experimental Study on Indentation Rolling Resistance of a Belt Conveyor. Machines 2024, 12(11), 778. [Google Scholar] [CrossRef]
- Kulinowski, P.; Kasza, P.; Zarzycki, J. Influence of design parameters of idler bearing units on the energy consumption of a belt conveyor. Sustainability 2021, 13(1), 437. [Google Scholar] [CrossRef]
- Kulinowski, P.; Kasza, P.; Zarzycki, J. Methods of Testing of Roller Rotational Resistance in Aspect of Energy Consumption of a Belt Conveyor. Energies, 2022, 16(1), 26.
- Malakhov, V. A.; Dyachenko, V. Rolling resistance coefficient of belt conveyor rollers as function of operating conditions in mines. Eurasian Mining 2022, 1, 67–71. [Google Scholar] [CrossRef]
- Opasiak, T.; Margielewicz, J.; Gąska, D.; Haniszewski, T. Rollers for belt conveyors in terms of rotation resistance and energy efficiency. Transport Problems 2022, 17(2), 57–68. [Google Scholar] [CrossRef]
- Bajda, M.; Hardygóra, M. Analysis of the Influence of the Type of Belt on the Energy Consumption of Transport Processes in a Belt Conveyor. Energies, 2021, 14(19), 6180.
- Jena, M. C.; Mishra, S. K.; Moharana, H. S. Experimental investigation on maximizing conveying efficiency of belt conveyors used in series application and estimation of power consumption through statistical analysis. Environmental Progress & Sustainable Energy, 2023, 42(3), e14031.
- Wen, L.; Liang, B.; Zhang, L.; Hao, B.; Yang, Z. Research on coal volume detection and energy-saving optimization intelligent control method of belt conveyor based on laser and binocular visual fusion. 2023, IEEE Access.
- Dinolov, O.; Yordanov, R. Tailored Review on the Research in the Electric-Energy Efficiency of Transport Processes (Part 1): Bulk Materials and Fluids. In 2024 9th International Conference on Energy Efficiency and Agricultural Engineering (EE&AE), (2024, June), 1-9.
- Lodewijks, G.; Schott, D. L.; Pang, Y. Energy saving at belt conveyors by speed control. In Proceedings of the Beltcon 16 conference, 2011, 1-10.
- Ji, J.; Miao, C.; Li, X.; Liu, Y. Speed regulation strategy and algorithm for the variable-belt-speed energy-saving control of a belt conveyor based on the material flow rate. Plos one, 2021, 16(2), e0247279.
- Ni, Y.; Chen, L. Research of energy saving control System of Mine belt conveyors. In 2021 International Conference on Intelligent Transportation, Big Data & Smart City (ICITBS), (2021, March), (pp. 579-581). IEEE Access.
- Jena, M. C.; Mishra, S. K.; Moharana, H. S. Experimental investigation on maximizing conveying efficiency of belt conveyors used in series application and estimation of power consumption through statistical analysis. Environmental Progress & Sustainable Energy, 2023, 42(3), e14031.
- Ilic, D.; Wheeler, C. Measurement and simulation of the bulk solid load on a conveyor belt during transportation. Powder Technology, 2017, 307, 190-202.
- Wheeler, C.; Munzenberger, P.; Ausling, D.; Beh, B. Energy efficient belt conveyor design. Tunra Bulk Solids Research Associates, 2018, 27.
- Doroszuk, B.; Krol, R. Analysis of conveyor belt wear caused by material acceleration in transfer stations. Mining Science, 2019, 26, 189-201.
- Doroszuk, B.; Król, R.; Wajs, J. Simple design solution for harsh operating conditions: redesign of conveyor transfer station with reverse engineering and DEM simulations. Energies, 2021, 14(13), 4008.
- Ambriško, Ľ.; Marasová Jr, D.; Klapko, P. Energy Balance of the Dynamic Impact Stressing of Conveyor Belts. Applied Sciences, 2023, 13(7), 4104.
Figure 1.
Shares of different components in the total motion resistance of a belt conveyor http://www.doublearrow.net/en/product/detail/20.html.
Figure 1.
Shares of different components in the total motion resistance of a belt conveyor http://www.doublearrow.net/en/product/detail/20.html.
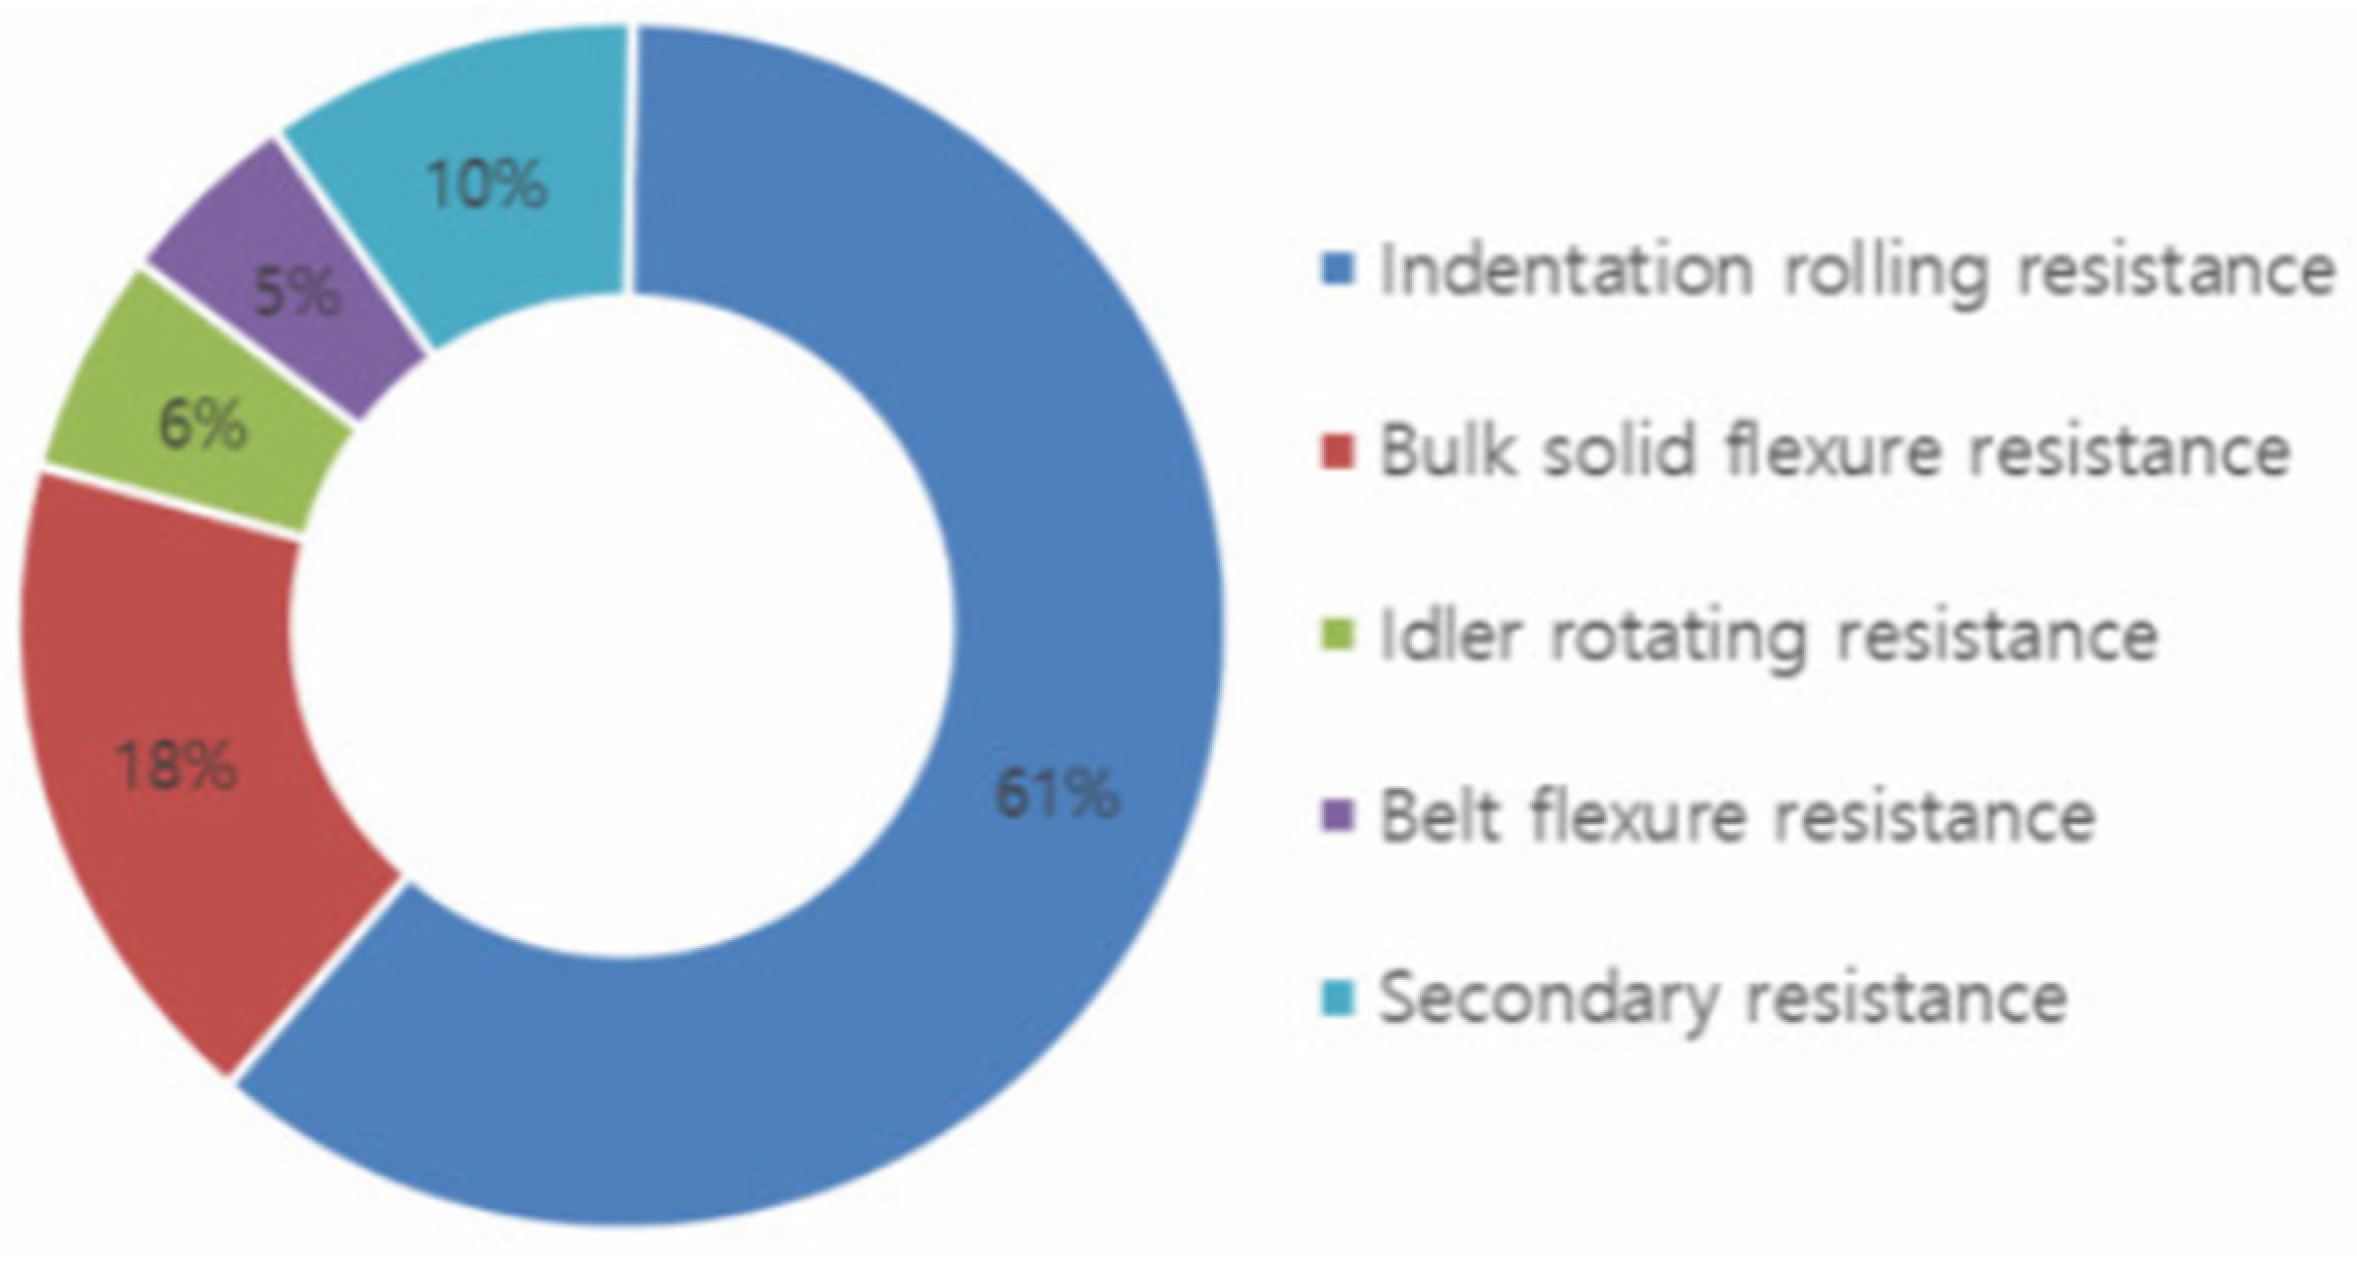
Table 1.
Technical Data of Conveyors A and B.
| Conveyor construction data | A | B |
|---|---|---|
| Length in m | 1012.6 | 1018.5 |
| Belt speed in m/s | 5.24 | 5.24 |
| Theoretical mass capacity in Mg/h | 6400 | 6400 |
| Theoretical volume capacity Mg/h | 8000 | 8000 |
| Number of pulleys in a set | 3 | 3 |
| Idler length in mm | 670 | 670 |
| Idler diameter in mm | 191 | 191 |
| Idler set spacing in m | 1.24 | 1.24 |
| Trough angle | 45 | 45 |
| Belt type | St3150 | St3150 |
| Belt width in mm | 1800 | 1800 |
| Coal bulk density in Mg/m3 | 0.8 | 0.8 |
Table 2.
Collected Operational Data (January 2014 – December 2017).
| Collected operating data | A | B |
|---|---|---|
| Number of monthly measurements | 36* | 48 |
| Total mass transferred in Mg | 42 096 610 | 46 540 032 |
| Total operating time in hours | 17 672.9 | 20 151.84 |
| Total energy consumption in MWh | 12 058.42 | 13 994.02 |
| Average monthly operating time in hours | 490.91 | 419.83 |
| Standard deviation | 60.98 | 91.28 |
| Coefficient of variation in % | 12.42% | 21.74% |
| Minimum | 352.1 | 198.6 |
| Maximum | 629.4 | 584.7 |
| Range of change | 277.3 | 386.1 |
| The average amount of mass transferred in Mg | 1 169 350 | 969 584 |
| Standard deviation | 198 752 | 243 846 |
| Coefficient of variation | 17.00% | 25.15% |
| Minimum | 760 503 | 424 723 |
| Maximum | 1 695 160 | 1 574 020 |
| Range of change | 934 657 | 1 149 297 |
| Average energy consumption in MWh | 334.956 | 291.542 |
| Standard deviation | 43.88 | 62.97 |
| Coefficient of variation | 13.10% | 21.60% |
| Minimum | 212.0 | 140.7 |
| Maximum | 441.6 | 406.5 |
| Range of change | 229.6 | 265.8 |
* During the periods 01-07.2014 and 06-10.2015, mass transfer data for Conveyor A was unavailable due to a scale failure.
Table 3.
Calculated Performance and ZE Indicators.
| Calculated capacities and ZE indicators | A | B |
|---|---|---|
| Average efficiency for total values in Mg/h | 2 381.99 | 2 309.47 |
| The degree to which the theoretical capacity was utilized in % | 37.22% | 36.09% |
| Unit indicator ZE for total energy consumption in Wh/Mg/km | 286.45 | 300.69 |
| Average monthly efficiency Q in Mg/h | 2 370.56 | 2 296.89 |
| Standard deviation | 146.622 | 142.201 |
| Coefficient of variation | 6.19% | 6.19% |
| Minimum | 2 119.17 | 2 045.89 |
| Maximum | 2 693.29 | 2 692.01 |
| Range of change | 574.12 | 646.12 |
| ZE indicator in Wh/Mg/km | 288.57 | 303.58 |
| Standard deviation | 18.18 | 19.12 |
| Coefficient of variation | 6.30% | 6.30% |
| Minimum | 256.87 | 254.7 |
| Maximum | 336.35 | 344.57 |
| Range of change | 79.48 | 89.87 |
Disclaimer/Publisher’s Note: The statements, opinions and data contained in all publications are solely those of the individual author(s) and contributor(s) and not of MDPI and/or the editor(s). MDPI and/or the editor(s) disclaim responsibility for any injury to people or property resulting from any ideas, methods, instructions or products referred to in the content. |
© 2025 by the authors. Licensee MDPI, Basel, Switzerland. This article is an open access article distributed under the terms and conditions of the Creative Commons Attribution (CC BY) license (https://creativecommons.org/licenses/by/4.0/).
Copyright: This open access article is published under a Creative Commons CC BY 4.0 license, which permit the free download, distribution, and reuse, provided that the author and preprint are cited in any reuse.


