Submitted:
28 July 2025
Posted:
30 July 2025
You are already at the latest version
Abstract
Artificial intelligence provides new pathways for enterprises to improve overseas investment resilience through its data-driven capabilities, autonomous decision-making, and deep learning. Based on heterogeneous firm theory and utilizing data from Chinese listed companies during 2010–2023, this study constructs enterprise AI application indices and investment resilience metrics to empirically examine the impact of AI on OFDI resilience. The results demonstrate that enterprises with higher AI application levels exhibit stronger resilience in their outward foreign direct investment (OFDI) when confronting economic cycle fluctuations, policy changes, and sudden shocks. Mechanism analysis reveals that alleviating financing constraints, cost reduction and efficiency enhancement, and optimizing resource allocation help enterprises withstand uncertainty shocks, maintaining investment continuity and stability. Heterogeneity analysis indicates that AI exerts greater effects on the OFDI resilience of private enterprises, manufacturing-sector firms, and firms with advanced AI capabilities. Furthermore, AI demonstrates particularly significant effects during economic downturns and in the operational phase of OFDI projects. This research enriches the theoretical understanding of corporate internationalization resilience in the digital economy era, providing empirical evidence and policy recommendations for governments and enterprises to leverage emerging technologies in enhancing foreign investment risk resistance.
Keywords:
artificial intelligence
; outward foreign direct investment (OFDI)
; investment resilience
; investment risk
; digital transformation
1. Introduction and Literature Review
In recent years, as digitalization rapidly progresses and the global economic landscape undergoes dramatic changes, the environment for Chinese enterprises’ outward foreign direct investment (OFDI) has been significantly altered. Geopolitical conflicts, rising trade protectionism, and other shocks have severely destabilized global industrial and supply chains, creating unprecedented challenges for the resilience of firms’ overseas investments. The report of the 20th National Congress of the Communist Party of China emphasized “advancing high-level opening up, enhancing the synergistic effect of domestic and international markets and resources, and raising the quality and level of trade and investment cooperation.” In this context, how to enhance enterprises’ OFDI resilience—ensuring that firms can maintain strong resistance, recovery, and sustainable development capabilities when encountering external blows—has become an urgent problem for firms venturing abroad. Meanwhile, artificial intelligence (AI), a key digital technology, is increasingly becoming a primary means for enterprises to upgrade capabilities and improve efficiency. Unlike previous technological revolutions, AI features deep learning, autonomous judgment, and data-driven decision-making. It can improve firms’ overall productivity by optimizing production processes, enhancing resource allocation efficiency, and cutting operational costs; in particular, its abilities in data analysis, risk prediction, and decision support greatly strengthen firms’ capacity to adapt to environmental changes and unexpected risks.
Existing studies have focused on how digital transformation affects firm resilience, export resilience, and other aspects of high-quality development, but research on investment resilience remains relatively scarce. Some research finds that digital transformation can significantly enhance firm resilience through ambidextrous innovation; improve OFDI quality by strengthening resource management, easing financing constraints, and boosting innovation performance; increase export resilience by promoting export diversification and product quality; facilitate OFDI’s extensive and intensive margins by raising human capital, regulatory efficiency, and easing financing constraints; and help firms overcome the “pain period” of digital transformation through internal control and resource reallocation.
By definition, a firm’s OFDI resilience is essentially its ability to maintain normal operations and quickly recover when encountering external risk shocks, which directly relates to the shaping and maintaining of the firm’s long-term competitive advantage. Traditional studies on international investment resilience have mostly adopted perspectives of financial factors, location choice, or industrial transfer. However, with the rapid development of the digital economy—especially AI—these traditional approaches no longer fully explain the mechanisms for enhancing OFDI resilience in the new era. AI can impact firms’ overseas investments via both direct and indirect effects. Directly, using digital platforms and automated production lines can reduce costs; indirectly, AI improves data-driven decision-making, reduces financing constraints, fosters innovation, and optimizes the internal labor skill structure, thereby increasing efficiency in cross-border investments and reducing risks in international operations. Specifically, AI effectively alleviates information asymmetry between firms and optimizes global resource allocation, enabling highly digitalized firms to build flexible, responsive supply chain networks that efficiently integrate global resources and address the complexities of regional cooperation. These efficiency gains directly translate into better cost control—AI-driven improvements in supply chain forecasting and inventory management can cut inventory costs by up to 15%—and reduce operating risks and costs stemming from host-country policy changes or market volatility. In addition, AI plays a crucial role in easing financing constraints through intelligent algorithms that optimize financial management; in responding to supply chain disruptions, AI accelerates risk warning and dynamic adjustment, shortening forecasting time. AI can also amplify the redundancy effect of venture capital, consolidating firms’ innovation resilience by improving financing constraint management. In terms of innovation and decision-making, AI not only enhances firms’ technological innovation capacity but also empowers data-driven precise decision-making models, helping firms identify risks in advance and optimize production processes. This directly strengthens firms’ ability to cope with complex overseas environments. Notably, these empowering effects exhibit significant heterogeneity in improving international entrepreneurship of family firms and regional economic resilience.
Current research mainly explores AI’s mechanisms from macroeconomic or micro-production perspectives. However, few studies directly examine how AI specifically enhances firms’ OFDI resilience. Considering Chinese firms’ unique position in the global economy and the rapid development of the digital economy, the literature has yet to provide sufficient empirical evidence and theoretical support on this topic. Therefore, from the perspective of corporate digital transformation, this paper investigates how AI strengthens firms’ OFDI resilience through four potential mechanisms: cost savings, financing relief, resource allocation optimization, and innovation incentives. The marginal contributions of this paper are as follows: First, it expands the theoretical framework of OFDI resilience. Most current studies on overseas investment resilience focus on finance, trade policy, or industrial transfer, with little attention to the role of digital technologies such as AI. By clarifying AI’s role in firms’ digital transformation, this paper analyzes the concrete pathways through which AI affects OFDI resilience. Second, it enriches the theoretical mechanisms of how the digital economy influences firms’ investment behavior. Although existing research, under the backdrop of the digital economy, has noted firms’ location choices and investment resilience, it rarely connects these with specific digital technology characteristics like AI’s autonomy, predictiveness, and intelligent decision-making. This paper incorporates AI’s unique features into the analytical framework of strengthening OFDI resilience, extending theories of the digital economy and international investment. Third, it provides theoretical support and empirical basis for policy-making and business practice. Against a backdrop of frequent global economic risks and rapid digital technology development, this paper clarifies the specific mechanisms by which AI enhances firms’ overseas investment resilience, helping firms formulate more precise international investment strategies and aiding governments in designing targeted support policies to promote high-quality internationalization.
2. Theoretical Model and Hypotheses
2.1. Impact of AI Application on Investment Resilience
We incorporate firm-level AI application into the heterogeneous firm framework of Melitz (2003) by building a theoretical model to examine how AI improves firms’ OFDI resilience. Following the approach of Yu (2024), assume consumers have CES utility preferences:
Here, Ω is the set of product varieties, q(ω) is consumption of variety ω, and ,σ > 1 is the elasticity of substitution between varieties. ρ reflects consumers’ preference for product diversity. Given total expenditure R and price index , utility maximization yields demand for variety ω and expenditure:
On the production side, firms have heterogeneous productivity ϕ. Producing quantity q requires paying a fixed cost f and variable cost (the input of production factors to produce q with productivity ϕ). Firms employ labor L and AI capital K in production. Here K represents key production resources invested through AI applications (e.g., machine learning algorithms, smart equipment). Introducing AI-driven intelligent capital enhances complementarity among inputs like labor, raising productivity and lowering production costs. Thus, the total input required to produce q is , which is decreasing in the level of AI application. Considering AI’s impact on unit factor cost, let c(AI) be the average cost per unit of composite input, which declines as the firm’s AI application increases , (i.e., more AI leads to lower unit input cost). The firm’s total cost function can be expressed as:
where w and r are the prices of labor and AI capital, respectively. Greater AI adoption induces higher intelligent capital investment, helping reduce production costs and improve efficiency; formally, . Given these, the firm’s profit function is:
and the firm chooses $p(\omega)$ to maximize profit. The first-order condition yields the optimal pricing rule . Substituting this into demand from (2) gives the firm’s profit expression:
To examine AI’s impact on profit, differentiate (5) with respect to AI:
Since and , the right-hand side of (6) is positive. This means . In other words, introducing AI raises the firm’s profit level. Higher profits indicate the firm is more stable and growing, reflecting enhanced ability to withstand shocks, recover operations, and sustain long-term development—i.e., improved investment resilience.
Furthermore, consider a dynamic perspective with the possibility of exit under adverse shocks. Assume each period, a firm faces an exogenous adverse shock with probability δ; if hit, the firm exits the market. Without discounting, the incumbent firm’s value can be written as . There exists a cutoff productivity : firms with ϕ* cease OFDI, while those with ϕ > ϕ* continue investing abroad. From the zero-profit condition, we can derive the exit cutoff δ and its derivative with respect to AI:
Equation (7) indicates that raising the firm’s AI application level lowers the cutoff productivity required to continue investing. In other words, when facing external shocks that reduce productivity, a firm with higher AI usage has a greater buffer to remain basically profitable and operational abroad, rather than immediately exiting the foreign market. A lower means a higher likelihood the firm will persist in OFDI despite adversity, demonstrating stronger ability to resist shocks. Based on the above model derivations, we propose Hypothesis 1.
Hypothesis 1.
AI can enhance the stability and shock resistance of firms’ OFDI operations, thereby improving investment resilience.
2.2. Financing Constraint Mechanism
Digital AI is conducive to expanding firms’ financing channels, reducing external financing costs, and improving operational resilience and information transparency, thereby strengthening firms’ ability to retain internal funds. Assume a fraction of a firm’s invested capital comes from internal funds, so represents dependence on external financing; a higher indicates looser internal financing constraints. Let be the additional cost rate of external financing; a higher means more expensive external funds and tighter external financing constraints. Incorporating these financing factors, the firm’s profit function can be written as:
From (9), increasing the internal funding ratio (relaxing internal financing constraints) raises profit; lowering external financing costs (relaxing external constraints) also raises profit, thereby enhancing investment resilience. Considering AI’s applications in finance and management, it is reasonable to believe widespread AI use can ease firms’ financing constraints. AI can improve risk management and credit assessment, increasing financial efficiency so that firms obtain external funds at lower cost (effectively reducing ), while also boosting productivity and profitability to increase internal funds (raising ). Thus, . We therefore propose Hypothesis 2:
Hypothesis 2.
AI adoption alleviates firms’ financing constraints, thereby enhancing the resilience of their OFDI.
2.3. Cost Efficiency Mechanism
From the perspective of operational cost and cost structure: On one hand, AI can substitute intelligent machines for manual labor and automate processes, reducing labor costs and losses from human error. AI endows equipment with autonomous learning and decision-making abilities, making production more efficient and coordinated, thus lowering internal management and coordination costs. On the other hand, AI adoption requires upfront technology acquisition and R&D, which in the short term increases fixed costs. However, such fixed investment can be viewed as a capability enhancement that leads to lower long-run marginal costs. In effect, AI transforms some of the firm’s variable costs into fixed costs. As long as the firm’s output scale is large enough or operations sufficiently stable, this “capital-for-expense” improvement in cost structure will increase profit margins per unit output and reduce variable cost pressures during shocks, helping the firm weather difficult times. From the result of (6), AI significantly lowers the average unit cost c(AI) (), thereby markedly raising profits and lowering the exit threshold . Thus, cost savings are an important mechanism by which AI enhances investment resilience. Accordingly, we propose Hypothesis 3:
Hypothesis 3.
AI adoption helps firms cut costs, improve efficiency, and optimize cost structure, thereby boosting overseas investment resilience.
2.4. Resource Allocation Efficiency Mechanism
From the perspective of resource allocation efficiency: On one hand, AI-driven data analysis and improved decision-making tools can help firms better allocate resources such as capital and labor, reducing idle resources and misallocation. AI algorithms adjust investment across subsidiaries or overseas projects in response to market changes, aligning capital deployment more closely with actual demand. Smart scheduling and supply chain systems improve the coordination of labor and raw materials, reduce waste, and raise factor utilization. Thus, AI optimizes firms’ internal resource allocation efficiency, effectively increasing productivity $\varphi$ so that the firm achieves the same output with fewer inputs. On the other hand, at the industry level, AI adoption helps firms maintain competitive advantages—so that even in adverse overseas market conditions, they retain market share and avoid resources being inefficiently redistributed among weaker firms. This effective resource allocation means firms have the capacity to withstand external shocks and keep projects running. Therefore, higher AI usage reduces firms’ resource misallocation. Improved resource allocation ultimately manifests as greater profitability and resilience. We thus propose Hypothesis 4:
Hypothesis 4.
AI adoption optimizes firms’ capital and labor allocation efficiency, thereby improving investment resilience.
3. Research Design
3.1. Research Sample and Data Sources
Our sample consists of Chinese A-share listed companies on the Shanghai and Shenzhen exchanges from 2010–2023, to study the relationship between enterprise AI adoption and OFDI resilience. To ensure representativeness and data quality, we exclude firms in the financial industry, firms that are ST (Special Treatment) or ST (potentially delisted) status, and firms newly listed in recent years, to avoid extreme disturbances. After these exclusions, we construct a balanced panel of the remaining firms over 2010–2023, yielding a final sample of 500 enterprises with complete annual observations. Firm-level data are mainly sourced from the Wind and CSMAR databases. Macro and regional control variables come from the China Statistical Yearbook (2010–2023), China Digital Economy Development Report (2023), and the World Bank’s Worldwide Governance Indicators (WGI) database—specific indicators include GDP growth rate, digital infrastructure indices, etc. Firms’ annual reports typically detail their operations and strategic layouts, providing a primary source to observe references to “AI” and related information. Patent data are obtained from the China National Intellectual Property Administration and the CCER Financial database; patents are matched to firms by company name. We collect each firm’s published invention and utility patents during the sample period to identify AI-related innovation activities. To ensure accuracy, we drop cases of duplicate firm names or patent transfers, and retain only invention and utility patents (excluding design patents).
3.2. Variable Definition and Measurement
1. Dependent variable: Enterprise OFDI Resilience (RES). “Enterprise OFDI resilience” refers to a firm’s elasticity and recovery ability when conducting OFDI under external shocks—namely the firm’s capacity to resist shocks (such as host-country political risk, global economic turmoil), recover from setbacks, and maintain long-term stable development. Following the measurement approach of Martin et al. (2016) and Qi et al. (2023), we measure resilience as the gap between a firm’s actual change in overseas investment performance and the expected change absent shocks. The basic idea is to examine, for each firm each year and in each host country, the change in its OFDI performance and compare it to the expected change if no shock occurred. The smaller the deviation (or if actual exceeds expected), the greater the resilience.
We first select a firm’s overseas investment net gains (e.g. net profit of overseas subsidiaries, return on overseas investments) as the indicator of OFDI performance. Let i index firms, j index host countries, and t index years. The resilience index RES is calculated as follows:
2. Independent variable: Enterprise AI Application Level. The core independent variable is a firm’s AI application level. Since no unified indicator directly reflects a firm’s AI application, we construct a firm-level AI application index by leveraging annual report and patent text information through machine learning and text analysis methods. This index captures the firm’s use and investment in AI-related technologies in its operations and innovation activities. We use a “keyword counting method” to measure firm AI usage. First, we build an “AI keyword dictionary” by collecting authoritative AI-related terms from sources such as CITIC Securities’ Panorama of AI Industry Chain, industry reports by research institutes, and the World Intellectual Property Organization (WIPO) AI glossary. From these, we select 52 core terms (e.g., “artificial intelligence”, “machine learning”, “Internet of Things”, “cloud computing”) as seed words. For each seed word, we identify the top 10 high-frequency terms with closest semantic similarity to expand the dictionary, then remove duplicates, irrelevant words, and extremely infrequent terms, yielding a final AI keyword dictionary of 78 terms. Next, we segment each firm’s annual report text and count term frequencies. For each firm-year, we count the total occurrences of AI keywords in the annual report; this frequency reflects the firm’s emphasis on AI in its public disclosures. We take the natural log of (AI keyword frequency + 1) to mitigate skewness and extreme values. This forms our primary measure of firm AI application level.
In addition to annual report disclosure, we also measure AI application from a technological innovation angle as an alternative variable. For each firm, we identify patents containing AI keywords in their titles or abstracts over the most recent three years, and count the number of AI-related patent applications each year. We then take the log of (1 + number of AI patents) to construct a patent-based AI index. This captures the firm’s intensity of AI utilization and innovation in R&D. Patent data complement annual report text, since some firms may apply AI in technology but not detail it in reports, or conversely hype AI in reports without substantial R&D investment.
3. Control variables. To account for omitted variable bias, we include a set of control variables, mainly: Firm size (ln total assets), Leverage (debt-to-asset ratio), Growth (revenue growth or asset growth rate), Ownership type (1 = state-owned, 0 = others), Government support (1 = government backing, 0 = none), Governance structure (independent directors ratio), Innovation capability (R&D expenditure/revenue), Firm age (years since establishment or listing), Regional digital infrastructure (provincial digital economy/infrastructure index), and Host-country political risk (WGI political stability index, weighted by investment). See Table 1 for variable definitions.
3.3. Model Specification
We construct the following panel data regression model to test the impact of AI application on firms’ OFDI resilience:
where is the OFDI resilience of firm in year ; is the AI application level (measured by ln AI keyword frequency, or its alternative ln AI patents); is a vector of control variables as defined above, including firm characteristics and external environment factors; and represent firm fixed effects and year fixed effects, respectively; and is the random error term. Model (12) also controls for industry fixed effects and macroeconomic cycle variables (proxied by annual GDP growth or PMI, and we include year×industry interaction terms to test heterogeneity). Standard errors are clustered at the industry level (using primary industry classification) to account for intra-industry correlation. We are primarily interested in the coefficient , which indicates the direction and significance of AI application’s impact on OFDI resilience. We expect and significant: if AI improves decision efficiency, risk identification, and responsiveness, then firms with higher AI usage should exhibit stronger OFDI resilience. Year fixed effects are implemented by including year dummies for 2010–2023 to control for time-varying macro factors. Standard errors are clustered by industry to address within-industry correlations.
4. Empirical Results and Analysis
4.1. Baseline Regression Results
Table 2 reports the baseline regression results of AI application on investment resilience. Column (1) is an OLS regression without fixed effects, and column (2) adds firm fixed effects to control for unobserved heterogeneity; we focus on column (2) as our main result. The coefficient on AI application level is positive and significant at the 1% level in both models. In column (2), a one-unit increase in AI application corresponds to an average increase of about 0.557 units in the resilience index, significant at 1%. This suggests that AI development can improve firms’ overseas investment resilience.
Regarding control variables: Firm size is significantly positively related to resilience, implying larger firms may have more resources and capabilities to cope with external shocks. Leverage is negatively related to resilience, indicating highly leveraged firms show weaker resilience when facing external changes. Additionally, indicators like firm growth, governance structure, innovation capability, and digital infrastructure are all positively associated with resilience, underscoring the importance of internal governance, innovation, and digital infrastructure in enhancing investment resilience. Notably, host-country political risk is significantly negative, meaning an unstable external political environment indeed harms OFDI resilience. Overall, deeper AI adoption, through optimizing decisions and enhancing information processing, enables firms to respond more effectively to external shocks and significantly improves overseas investment resilience. Hypothesis 1 is confirmed.
4.2. Endogeneity Issues
1. Propensity Score Matching (PSM). We treat firms that have adopted AI as the treatment group and those that have not as the control group. Among the 500 firms, some introduced AI during the sample period. A potential sample selection bias exists: firms using AI may systematically differ from non-adopters. We define a binary variable AI Adoption (1 if a firm adopts AI during 2010–2023, 0 otherwise). Initial statistics show significant differences in key characteristics between treatment and control groups before matching: for example, the treatment group’s average initial size and initial resilience are higher than the control group’s; and the proportion of high-technology firms in the treatment group is 54.8%, significantly higher than 16.1% in the control group. This suggests more capable firms are more inclined to adopt AI.
To eliminate these observable differences, we employ PSM. First, we estimate propensity scores for AI adoption using a logit model. The propensity model takes AI Adoption as the dependent variable and includes various initial firm characteristics as covariates (region, industry, ownership, size, initial resilience, etc.). The logit results show these traits significantly affect AI adoption probability—for instance, high-tech firms have a significantly higher propensity score, whereas state-owned firms have a slightly lower score. This confirms that initial heterogeneity influences AI adoption and that selection bias is likely.
Next, we perform one-to-one nearest-neighbor matching on propensity scores between treated and control firms. Replacement is allowed (to maximize control usage), and a caliper is imposed to avoid poor matches. We ensure matching occurs within the same region and similar industries to control for regional and industry fixed effects. After matching, each AI-adopting firm is paired with a non-adopter with the closest propensity score, yielding matched pairs.
Post-matching, we conduct balance tests on key covariates; results are shown in Table 3. Before matching, the treatment vs. control means differ significantly on several variables (e.g., pre-match treatment firm average Size = 0.141 vs. control 0.514, significant at 1%; proportion of high-tech firms 54.8% vs. 16.1%). After PSM, these differences greatly diminish and are no longer significant. The mean differences in initial size, resilience, high-tech capability, etc., between matched treated and control are near zero with no statistical significance. This indicates matching improved comparability and achieved covariate balance.
Finally, we re-estimate the impact of AI on resilience using the matched sample. We perform a simple regression on the 124 matched firms (62 pairs), including only the treatment indicator (AI Adoption = 1) to estimate the average treatment effect $\tau$. Table 4 reports the average treatment effect on the treated (ATT) for the matched sample. The results show that post-matching, the treatment group’s resilience is significantly higher than the control group’s. The ATT is positive (0.218) and significant at 5%, meaning that after controlling for initial differences, firms that adopted AI have on average 0.218 higher resilience than non-adopters. Notably, the matched ATT is somewhat lower than the simple unadjusted difference, but remains significantly positive. This suggests that part of the original OLS effect was due to selection bias, but after PSM correction, AI’s net effect is still positive and economically meaningful (consistent with Hu, 2022). Overall, PSM effectively controlled for initial heterogeneity, making treated and control firms comparable, and supports a causal inference that AI enhances investment resilience.
2. Instrumental Variable (IV) Method. Despite controlling for observable traits, endogeneity may still remain—for example, potential reverse causality: AI adoption may boost resilience, but firms with higher resilience might also have more resources and incentives to invest in AI. If such reverse causality is not fully addressed, estimates will be biased. To further tackle endogeneity, we employ two-stage least squares (2SLS) with instrumental variables. Drawing on Qi and Lu (2025), we choose regional AI policy intensity and industry AI penetration as IVs. During the sample period, provinces like Guangdong and Shanghai introduced “AI+” policies to spur AI applications; firms in those regions saw exogenous boosts to AI adoption. Meanwhile, the average AI adoption rate in each industry (excluding the firm itself) serves as another IV, capturing industry-level technological diffusion pressure and demonstration effects.
The regional AI policy intensity is a dummy indicating whether the firm’s province implemented an “AI+” policy during the period (1 = policy, 0 = none). Such a policy is plausibly unrelated to an individual firm’s resilience but affects the firm’s propensity to adopt AI, satisfying relevance and exogeneity. The industry AI penetration is defined as the average AI adoption rate in the firm’s industry (excluding the firm), capturing exogenous technology progress at the industry level. This variable significantly influences a firm’s AI decision (firms in industries with broader AI uptake face more pressure to adopt), but as an industry average driven by external tech trends, it should not directly affect a single firm’s resilience. Differences in AI uptake across industries and across regions (due to policy push) provide the needed variation for our IVs.
In the first stage, we regress the firm’s AI application level on the two IVs and controls (including size, ownership, etc., that may affect AI adoption). The first-stage results confirm that the IVs strongly explain AI adoption: specifically, the coefficient on regional AI policy is positive and significant at 1%, and industry AI penetration is positive and significant at 5%. The joint F-statistic of the IVs is about 10.48, above common thresholds, rejecting the null of weak instruments. Thus, weak IV is not a concern—the IVs are strongly correlated with the potentially endogenous AI variable. In the second stage, we use the predicted AI level from stage one in the resilience regression. Table 5 compares the OLS baseline and IV-2SLS results. After using IV, the coefficient on AI level is slightly lower but still significant at 1%.
We also conduct overidentification tests to check IV exogeneity. Hansen’s J-statistic test does not reject the hypothesis that the IVs are jointly exogenous, supporting their validity. The Cragg–Donald F-statistic for weak IV also exceeds critical values, confirming sufficient IV strength. Therefore, the IV results are reliable. Through the IV approach, we find that the coefficient on AI application remains positive and highly significant after addressing endogeneity, further confirming the causal effect of AI in promoting investment resilience.
4.3. Robustness Checks
1. Difference-in-Differences (DID). We further exploit a quasi-natural experiment and DID model to test the robustness of AI’s impact. Around the midpoint of our study period (Year 6 in a 10-year panel), some regions introduced supportive “AI+” policies while others did not. This created a shock difference between a “treatment group” (firms in policy provinces) and a “control group” (firms in no-policy provinces) before vs. after policy implementation. We treat the AI policy rollout as a quasi-experiment: prior to the policy, the two groups had similar trends; after the policy, treatment firms, spurred by incentives, increased AI adoption, potentially improving resilience relative to control. Specifically, starting in Year 6, Shanghai launched AI support policies, whereas Anhui had no similar policy. Firms in Shanghai saw a marked increase in AI usage after Year 6, constituting a distinct “shock”.
To estimate the average treatment effect of the policy on resilience, we set up a DID model:
2. Alternative and Lagged Variables Robustness Tests. To ensure the conclusions are robust, we conduct two additional tests using alternative measures and lagged variables:
Alternative indicator: We replace the AI application level with the number of AI-related patents (the count of AI invention patents a firm obtained during the sample period) as a proxy for technological AI input. This alternative captures AI capability from another angle. Column 1 of Table 7 shows that AI patent count has a positive and significant effect on resilience at the 1% level. Firms with more AI patents exhibit greater resilience, supporting our main findings. Using patents yields model fit and significance similar to using AI application level, indicating our results are not driven by a particular measure.
Lagged variable: Considering that AI application and resilience may be simultaneously determined, we use a one-period lag of AI application in the regression. That is, we use to predict . A lagged independent variable mitigates concerns of reverse causality within the same period. If AI’s positive impact persists, the lagged effect should remain significant. Column 2 of Table 7 shows the coefficient on lagged AI level is positive and significant at 1%, with magnitude similar to the baseline. This means even using AI’s effect on resilience remains robustly positive, reducing the likelihood of simultaneity bias.
5. Mechanism Tests
5.1. Financing Constraint Mechanism
We test whether AI enhances resilience by easing financing constraints. The regression results show that AI application level has a significant negative effect on a firm’s financing constraint measure (e.g. reducing the debt-to-equity cost or increasing the internal financing ratio), meaning higher AI usage lowers the degree of financing constraints. Furthermore, when we include the financing constraint index in the resilience regression, Table 8 column (2) shows financing constraints have a significant positive effect on resilience (noting that a lower financing constraint value indicates easier financing, which improves resilience). At the same time, the AI coefficient drops from 0.557 to 0.513 but remains significant. After adding the mediator, AI’s direct effect on resilience decreases by about 7.9%, yet remains significant, indicating a partial mediation: AI adoption partly boosts resilience by alleviating financing constraints. The negative coefficient on the financing constraint index implies that reducing financing constraints helps improve resilience (since a higher value of the constraint index indicates more constraint, which is detrimental). A Sobel test further confirms the mediation effect is significant. Thus, Hypothesis 2 is supported.
5.2. Cost Efficiency Mechanism
We examine whether AI improves resilience by increasing cost efficiency. Separate regressions show that each one-unit increase in AI application significantly reduces unit production cost or raises a cost-efficiency index. In Table 8 column (3), when we include the cost efficiency variable in the resilience regression, its coefficient is 0.231 and significant, indicating improved cost efficiency significantly promotes resilience. Meanwhile, AI’s coefficient falls from 0.557 to 0.487 but remains significant. This suggests AI partly enhances resilience through cost reduction and efficiency gains. AI techniques like machine learning for production scheduling and robotic process automation can cut labor and time costs and boost output efficiency, thereby strengthening firms’ profitability and resilience. Hypothesis 3 is confirmed.
5.3. Resource Allocation Mechanism
We test the impact of AI on resource allocation efficiency. Results show that higher AI usage significantly narrows the gap in marginal product of resources across a firm’s departments, raising a resource allocation efficiency index. In Table 8 column (4), after adding the resource allocation efficiency variable to the resilience regression, its coefficient is 0.194 (significant), and AI’s coefficient drops to 0.485. Compared to the baseline model, AI’s coefficient decreases by about 13% but remains significant at 1%. This indicates AI helps firms optimize resource allocation—for example, through big data-assisted decision-making that directs capital and manpower to higher-return projects, thereby improving overall resilience. Improved resource allocation is thus another key channel for AI’s impact, supporting Hypothesis 4.
In summary, the mediation analysis shows that financing constraints, cost efficiency, and resource allocation all play mediating roles in AI’s effect on resilience. Among these, the roles of reducing financing constraints and improving cost efficiency are particularly prominent. Table 8 summarizes the mechanism regression results. In column (1) without mediators, AI’s coefficient is 0.557. When we control for each mediator separately in columns (2)–(4), AI’s coefficient declines but remains significant, and each mediator itself is significant. This indicates that part of AI’s effect operates through improving those firm performance indicators. Of course, the three mediators together do not fully explain AI’s total effect; direct effects or other channels remain. When we include all three mediators simultaneously, AI’s coefficient further drops to 0.369 (a total reduction of ~34%), with financing constraint, cost efficiency, and resource allocation all significant at 1%. This further corroborates the joint action of multiple mechanisms. In short, AI adoption not only has direct effects but also indirectly promotes resilience by easing financing constraints, lowering operating costs, and optimizing resource allocation.
6. Heterogeneity Analysis
6.1. Ownership: State vs. Private Enterprises
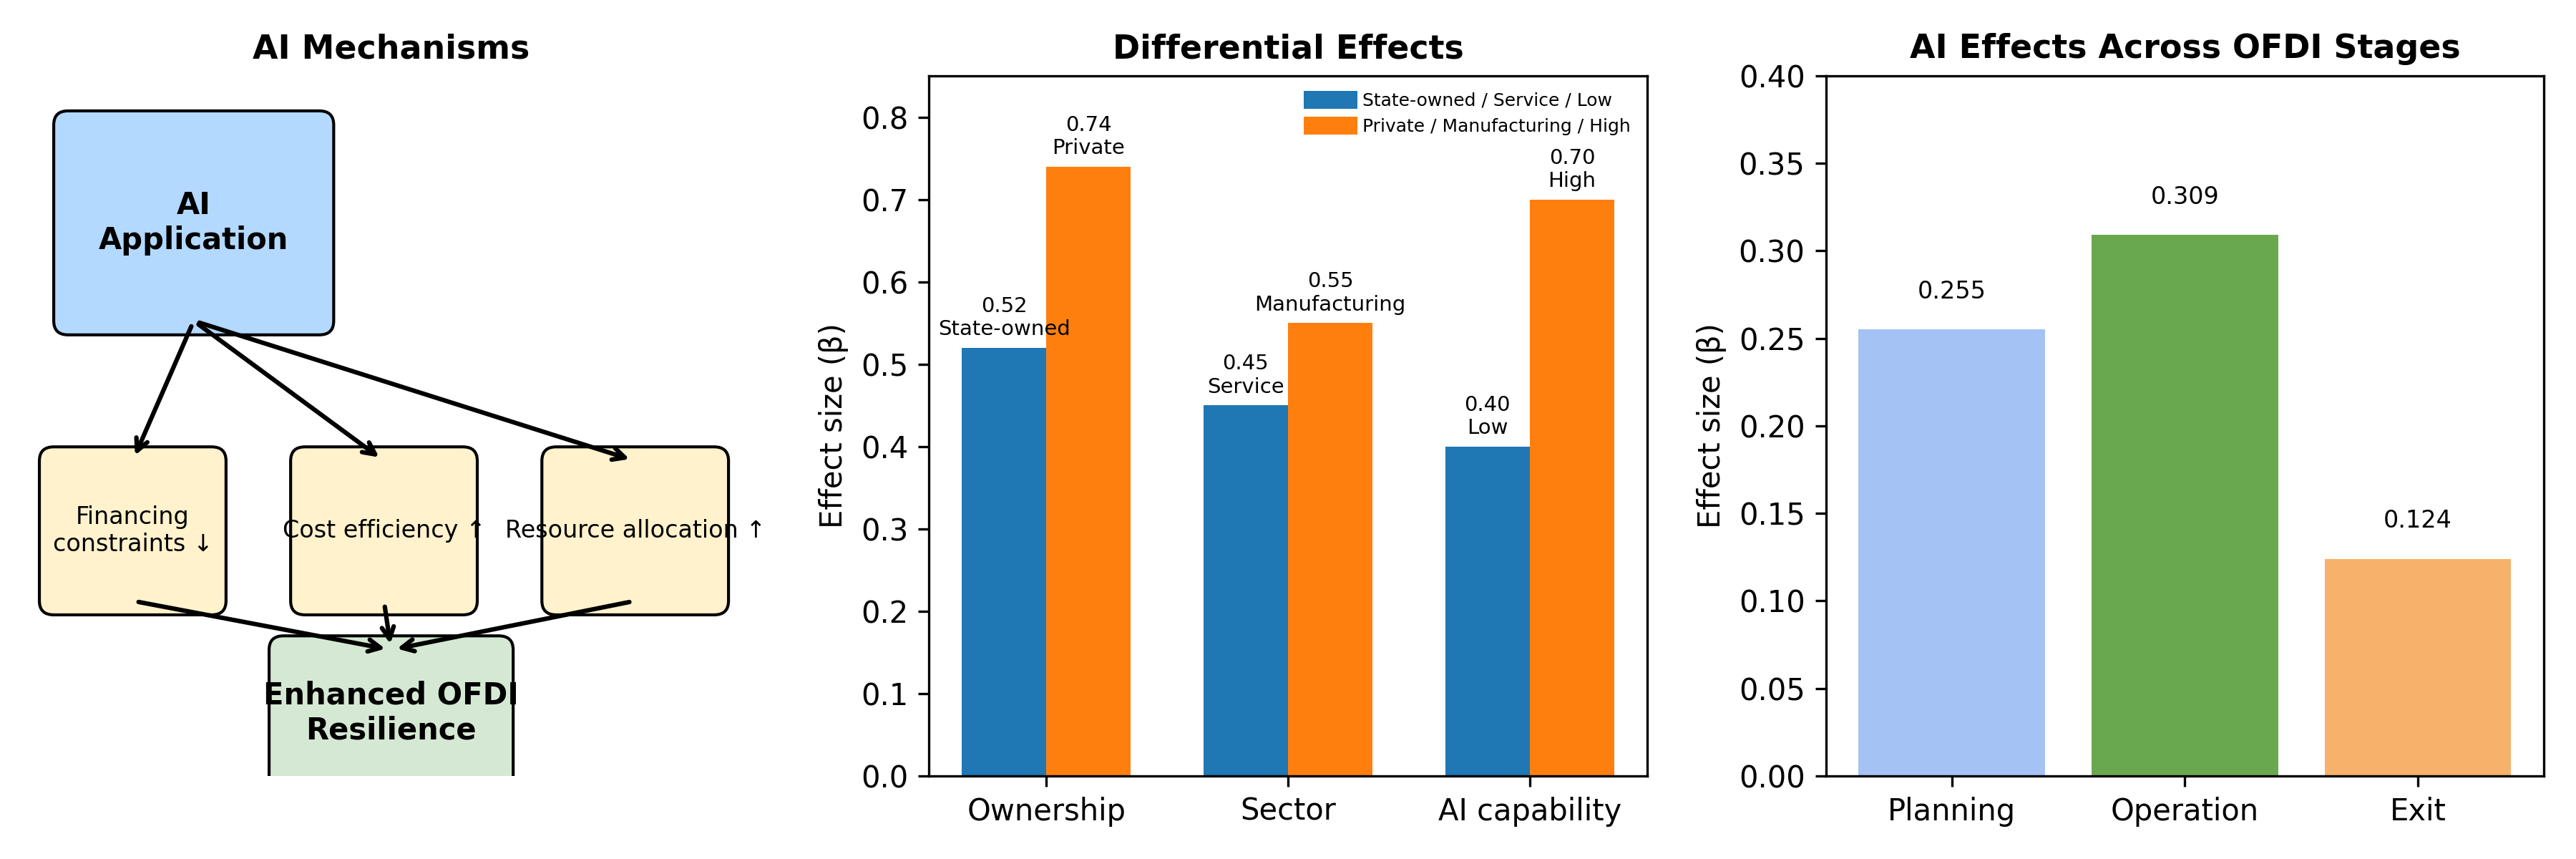
We first examine differences in AI’s effects between state-owned enterprises (SOEs) and private enterprises. Compared to private firms, SOEs (Ownership = 1) have advantages in resource access and policy support but often lower governance efficiency; private firms face more resource constraints but are often more efficient and innovative. Thus, while AI should promote resilience in both, the magnitude may differ. We run fixed-effects regressions separately for the SOE subsample and the non-SOE subsample. Table 9 column (1) shows that AI’s coefficient is positive and significant in both groups, indicating AI empowerment boosts resilience regardless of ownership. However, the AI coefficient for private firms is higher than that for SOEs (though the gap is modest). This suggests AI’s resilience enhancement is relatively stronger for private firms. Private enterprises, being more agile, can fully leverage AI’s efficiency gains; some SOEs, due to institutional constraints, realize slightly smaller improvements in OFDI resilience from AI. Nonetheless, the conclusion holds for both types: AI has universally positive effects.
6.2. Industry: Manufacturing vs. Services
Next, we analyze AI’s impact across industries. We split the sample into manufacturing vs. service firms (with high-tech industries mostly within manufacturing). AI in manufacturing often manifests as automation and “intelligent manufacturing,” expected to significantly boost productivity; in traditional services, AI adoption is less pervasive, so effects may be smaller. Table 9 column (2) shows that AI’s coefficient is positive and significant for both manufacturing and service subsamples. Comparing the two, the coefficient in manufacturing is slightly higher than in services, indicating AI’s contribution to resilience is stronger for manufacturers. In practice, manufacturing processes are more standardized, so AI via industrial robots, smart factories, etc., yields notable cost reduction and efficiency gains; some service sectors rely less on AI, so resilience improvements are smaller. However, even in services, the AI coefficient—albeit lower—is still significant. As services undergo digital and intelligent transformation, AI is becoming a key driver. Thus, firms in both sectors benefit from AI, with manufacturers benefiting the most.
6.3. AI Capability: High vs. Low
Finally, we consider heterogeneity by firms’ own technological capability in AI. We group firms by their AI application ability: specifically, we split the sample at the median of an AI capability index, with the top 50% as the high-AI-capability group and the rest as low (referencing Acemoglu & Restrepo, 2019). High-capability firms may have dedicated AI teams or strong technical foundations to better implement AI strategies; low-capability firms face more limitations in applying AI. Table 9 column (3) shows AI’s effect is positive and significant in both the high and low groups, but notably, the coefficient for the high-capability group is significantly larger than that for the low-capability group. This implies firms with stronger AI foundations reap greater resilience gains from AI adoption. High-capability firms can more fully integrate AI with their business, unlocking greater efficiency, whereas low-capability firms may only use AI minimally and not tap its full potential. Thus, enhancing firms’ internal AI talent and technical management can help them better leverage AI for resilience.
7. Further Analysis
7.1. Effects Under Economic Cycles and Macro Policy Changes
Macro-economic cycles have a significant influence on the external pressure faced by firms’ overseas investments. In economic upswings, market conditions are favorable and AI can enable firms to make more rational expansion decisions abroad. By deeply analyzing massive market data, AI helps firms avoid blind optimism and encourages them to proactively build resilience during boom periods. Conversely, in economic downturns, firms’ overseas operations often encounter shrinking demand and tightening finance. In such times, AI’s self-learning and predictive capabilities markedly enhance firms’ agility in coping with recessions. Firms more fully utilizing AI can not only more quickly offset losses and sustain operations during shocks, but their firm value also exhibits stronger short-term recovery.
Similarly, changes in the macro-policy environment profoundly shape the resilience of firms’ overseas investments. In policy tightening phases, firms may face rising financing costs and stricter approvals; AI can optimize internal capital use and cost control, tapping internal potential when external financing is constrained to ensure sustained overseas project operation. Meanwhile, AI-driven risk forecasting models can promptly detect signs of host-country policy tightening, providing early warnings for firms to adjust strategies and mitigate shocks. In policy loosening periods, AI helps firms precisely identify relevant incentives and reduce overseas operating costs; it can also simulate policy change scenarios to prevent firms from becoming over-reliant on short-term stimuli and overlooking potential risks.
Based on the above, we construct panel data under different economic cycle and policy regimes for 100 firms over 10 years to test AI’s role. As noted, economic downturns or policy tightening exert negative shocks on OFDI, while AI can enhance firms’ shock resistance under such conditions. Thus, we augment our model with interaction terms:
Table 10 presents the regression results. Economic downturns and policy tightening have significant negative effects on OFDI resilience, as expected, and AI application on its own is not significant in the overall sample (since its effect may depend on context). Crucially, the interaction terms are positive and significant at the 10% level. This indicates that under adverse conditions (downturn or tight policy), higher AI usage effectively offsets the negative shocks and improves resilience. When external conditions deteriorate, greater AI adoption helps firms suffer less impact and maintain higher OFDI levels. These results support the hypothesis that AI strengthens firms’ OFDI resilience particularly in adverse macro contexts. The likely reason is that during such periods, AI facilitates scientific data-driven decisions, helps control costs and optimize resources, and improves risk warning and agile response capabilities, thereby mitigating the impact of external deterioration on firms.
7.2. AI’s Moderating Effect at Different OFDI Stages
When firms plan to enter overseas markets, they generally face unfamiliar environments and high initial risks. At this planning stage, AI can assist in scientific decision-making regarding location, industry, and timing. By deeply analyzing host-country economic, political, and market big data, AI helps identify relatively low-risk, high-potential investment targets and windows, effectively avoiding blind entry into high-risk countries or sectors.
Once an overseas project enters the operation stage, the firm must handle dynamic market changes and operational challenges. On one hand, AI-driven supply chain and production management systems can process real-time data to greatly improve demand forecasting accuracy and inventory management efficiency in multinational operations, thereby lowering operating costs and accelerating responses to contingencies. Firms deeply applying AI can significantly reduce logistics costs, improve inventory turnover and service levels (Acharya et al., 2014), building buffers against volatility. On the other hand, AI systems continuously monitor global news, social media, and IoT data to promptly detect early signals of supply chain disruptions or geopolitical risks and trigger contingency plans, reducing potential losses. In digitally advanced host countries, firms can leverage local cutting-edge technology to optimize factor allocation, cut operating costs, and spur innovation, thereby enhancing competitiveness and resilience of overseas investments.
If external upheaval or project underperformance forces the firm to consider contraction or exit, AI-based warning systems can analyze trends of deteriorating financials, competitive dynamics, and policy risks to proactively signal the need for withdrawal, helping management choose the optimal timing to cut losses. Simultaneously, AI algorithms can evaluate different divestment scenarios’ potential impacts on operations and reputation, assisting in selecting the path that minimizes damage, and help efficiently dispose of assets, resettle staff, and protect core IP—thus laying the groundwork for possible re-entry in the future.
We define three OFDI phases: a planning stage (pre-investment preparation for cross-border M&A or entry), an operation stage (after successful entry, ongoing operations), and an exit stage (when withdrawing from a host market). We then test AI’s effects in each stage by interacting AI with stage indicators. Let the planning stage be the baseline category, and include dummies for operation and exit stages. Specifically:
Here, represents the outward foreign direct investment indicator of firm i in stage t. denotes the level of artificial intelligence application of firm i in stage t. is a dummy variable representing different stages of multinational investment, with the planning stage as the baseline group, and the operation and exit stages assigned respective dummy variables.
Table 11 shows stage-specific regression results. AI application level has a significantly positive effect on investment resilience at all three stages, indicating AI effectively improves resilience in each phase. Among these, the AI coefficient in the operation stage is the largest in absolute value, suggesting that intensive AI use during actual operations (like real-time data processing, supply chain optimization, risk monitoring) can markedly reduce earnings volatility and enhance stability of OFDI. The exit stage coefficient is the smallest, implying AI’s role is relatively reduced at this phase. This difference may arise because, in the operation stage, firms can fully embed AI into production and decision-making, where AI’s data-driven risk monitoring, autonomous decision processes, and resource allocation improvements maximally mitigate external uncertainty impacts. In contrast, in the exit stage, firms are often reacting passively to shocks that force contraction; AI’s agency is more limited, primarily providing warnings and optimizing exit strategies to minimize losses, thus its effect on resilience is weakest.
In addition, the interaction terms between AI and firm size are significantly positive in all three stages, indicating that larger firms can utilize AI more effectively to further improve resilience in each stage. Good digital infrastructure also consistently aids AI’s effectiveness (the coefficients for digital infrastructure remain positive and significant across stages), and rising host-country political risk consistently undermines resilience (negative and significant in all stages).
8. Conclusions and Policy Recommendations
Using micro data on Chinese firms’ overseas investments, this paper empirically finds that AI can significantly enhance firms’ OFDI resilience. First, drawing on resilience theory, we construct a firm OFDI resilience index from resistance and recovery dimensions. Second, mechanism analysis shows that AI markedly alleviates financing constraints, cuts operating costs, improves resource deployment efficiency, and rebuilds firms’ decision-making processes, thereby boosting their risk resistance and sustainable development capabilities in international investment and enhancing OFDI resilience. Heterogeneity analysis reveals that AI’s resilience benefits are greater for manufacturing firms than service firms; stronger for private firms than state-owned firms; and the more robust a firm’s AI foundation, the larger the resilience gains from AI. Further analysis indicates that AI, by improving resource allocation efficiency and strengthening risk warning, helps firms counteract the negative impacts of economic cycles and policy changes on overseas investments. Across different OFDI stages, AI’s effect is most pronounced during the operation phase and weakest at the exit phase.
Rather than focusing solely on resilience or productivity, this paper enriches the theoretical research at the intersection of digital technology and firms’ overseas operational resilience, making a marginal contribution to the integration of international business and technology management. Using firm-level data, we provide empirical evidence that AI improves firm-level OFDI resilience, offering insights for how firms can leverage digital strategies to “go global.” The findings also furnish a reference for policymakers and enterprises. Based on our results, we propose the following policy recommendations:
Government support for AI in OFDI: The government should formulate and refine industrial policies that encourage AI integration into foreign investment, especially targeting private enterprises. Increased support—such as tax breaks and special funds—should nurture firms’ overseas digital capabilities and incentivize AI utilization in overseas projects. A national overseas investment risk monitoring and warning platform should be established, using AI to analyze global economic and political risks in real time and provide firms with public warning information services. In terms of OFDI regulation, authorities must keep pace by issuing guidelines on cross-border data flows and AI applications for firms, to ensure data security without over-regulation, thereby fostering a policy environment conducive to resilience.
Enterprise digital transformation strategy: Firms should incorporate AI into the core of their internationalization strategy and comprehensively enhance their digital capabilities. Investment in AI-related talent, technology, and infrastructure needs to be increased, integrating AI tools throughout the entire lifecycle of overseas investments—covering early-stage site selection decisions, mid-stage operational improvements, and late-stage risk handling. For example, firms can deploy AI-driven data analytics platforms to optimize market intelligence gathering abroad, create intelligent supply systems to improve cross-border business flexibility and efficiency, and implement risk forecasting models to monitor changes in overseas operating environments. Firms also need to optimize internal governance to complement AI adoption: decision-makers must fully understand AI-provided information and integrate it into decision processes, while avoiding over-reliance on AI that could introduce biases. By combining human and machine strengths, firms can respond more nimbly to overseas contingencies and significantly bolster the resilience of their OFDI operations.
Enhancing regulatory technology (RegTech): Regulatory agencies should elevate their technological capabilities to meet the demands of OFDI regulation in the AI era. Financial and commerce regulators ought to explore using AI to improve regulatory methods—for instance, developing AI-based abnormal transaction detection and risk prediction systems to strengthen monitoring and forecasting of firms’ overseas investment activities, thereby promptly identifying potential systemic risks. Regulators should also improve communication with enterprises and promote cooperative mechanisms among government, firms, and research institutions, with regular exchanges on best practices of AI in investment risk management. Through innovative regulatory approaches, authorities can ensure financial security and compliance while encouraging firms to boldly apply AI to enhance resilience, thus fortifying the nation’s macro-level firewall against OFDI risks and achieving a steadier opening-up.
Author Contributions
Conceptualization, H.X., J.Z. and R.Y.; methodology, H.X., J.Z.; software, H.X., J.Z.; validation, H.X. and R.Y.; formal analysis, H.X., J.Z.; investigation, R.Y.; resources, R.Y.; data curation, R.Y.; writing—original draft preparation, all authors; writing—review and editing, all authors; visualization, H.X., J.Z.; supervision, H.X., J.Z.; project administration, H.X., J.Z.. All authors have read and agreed to the published version of the manuscript.
Funding
This research was funded by [National Social Science Fund General Project "Research on the Impact of Environment, Society and Governance (ESG) on Chinese Enterprises' Overseas Investment and Countermeasures"] grant number [23BGJ009].
Institutional Review Board Statement
Not applicable.
Informed Consent Statement
Not applicable.
Data Availability Statement
The datasets generated and/or analyzed during the current study are not publicly available because some results are still being analyzed but are available from the corresponding author on reasonable request.
Acknowledgments
Authors of this article would like to thank all the people who participated in this study.
Conflicts of Interest
The authors declare no conflicts of interest.
References
- Qi, J.; Lu, X. Outward Direct Investment Location Shift and Investment Resilience from the Perspective of Digital Economy. International Trade Issues 2025, 4, 1–19. [Google Scholar]
- Yao, J.; Zhang, K.; Guo, L.; Feng, X. How Does Artificial Intelligence Improve Firms’ Production Efficiency?—A Perspective of Labor Skill Structure Adjustment. Management World 2024, 40, 101–116 + 117–122 + 133.
- Jiang, L.; Ling, Y.; Zhang, J.; Lu, J. How Does Digital Transformation Affect Firm Resilience?—An Ambidextrous Innovation Perspective. Technology Economics 2022, 41, 1–11. [Google Scholar]
- Liu, G.; Dong, J. Can Digital Transformation Help Firms’ Outward Direct Investment? Finance & Economy 2023, 53–64. [Google Scholar]
- Wei, Y.; Gong, X.; Liu, C. Can Digital Transformation Improve Enterprise Export Resilience? International Trade Issues 2022, 56–72. [Google Scholar]
- Que, C.; Cui, J.; Ma, B. How Does Corporate Digital Transformation Affect the Extensive and Intensive Margins of OFDI? Research on Financial and Economic Issues 2023, 91–104. [Google Scholar]
- Zhang, P.; Liu, W.; Tang, Y. Improving Firm Export Resilience under Trade Frictions: The Role of Digital Transformation. China Industrial Economics 2023, 155–173. [Google Scholar]
- Sun, L.; Chang, T. Corporate Digital Transformation and Outward Direct Investment. Wuhan University Journal (Philosophy & Social Sciences) 2024, 77, 145–158. [Google Scholar]
- Zhan, X.; Ouyang, Y. New Trends in Global Investment under the Digital Economy and New Strategies for China’s Utilization of Foreign Capital. Management World 2018, 34, 78–86. [Google Scholar]
- Huang, C. Commercial AI Helps Efficient Management. Entrepreneur 2024, 75–76. [Google Scholar]
- Accenture. Six Moves to Cope with ChatGPT. 21st Century Business Review 2023, 88–91.
- Cheng, C.; Wang, Y.; Jiang, Y. Evolution of the Resilience of RCEP Bidirectional Direct Investment Network and Its Effects. Economic Geography 2024, 44, 33–44. [Google Scholar]
- Liang, J.; Liu, T. Enterprise Innovation Resilience and the Impact of Venture Capital: Theory and Evidence. Studies in Science of Science 2024, 42, 205–215. [Google Scholar]
- Ji, S.; Wei, S.; Wang, D. Impact of Outward Direct Investment on the Resilience of Chinese Cities. China Population, Resources and Environment 2024, 34, 175–185. [Google Scholar]
- Wei, L. Analysis of Regional High-Quality Development Based on Economic Resilience under the New Development Pattern—The Case of 8 Provinces and Cities (Beijing, Tianjin, Hebei, Shanghai, Jiangsu, Zhejiang, Anhui, Guangdong. Economic System Reform 2022, 5–12. [Google Scholar]
- Wu, Z.; Dai, J.; Li, S. Long-Term Oriented Investment Resilience, Digital Transformation and International Entrepreneurship of Family Firms. Journal of Shanxi University of Finance and Economics 2023, 45, 99–112. [Google Scholar]
- Zhang, C.; Jiao, W. Venture Capital and Economic Resilience—An Empirical Study Based on a Spatial Durbin Model. Investment Research 2021, 40, 23–39. [Google Scholar]
- Chen, Y.; Lin, C.; Chen, X. Artificial Intelligence, Aging, and Economic Growth. Economic Research Journal 2019, 54, 47–63. [Google Scholar]
- Yu, L.; Gong, Y. Online Incentives, Market Segmentation and Firm Innovation. Modern Economic Science 2024, 46, 76–89. [Google Scholar]
- Wei, L.; Cai, P.; Pan, A. Supply Chain Shocks, Diversification Strategy, and Firm Development Resilience—Evidence from Major Natural Disasters in China. China Industrial Economics 2024, 118–136. [Google Scholar]
- Xie, Q.; Liu, W.; Zhang, P. Embedded Technology of Imported Intermediate Inputs and Firm Productivity. Management World 2021, 37, 66–80 + 6 + 22–23. [Google Scholar]
- Xu, P.; Xu, X. The Logic and Analytical Framework of Enterprise Management Reform in the AI Era. Management World 2020, 36, 122–129 + 238. [Google Scholar]
- Yan, S. Integration Risks and Causes for Knowledge Workers in Different Stages of Entrepreneurial M&As—A Multi-Case Analysis Based on the ASA Model. Management World 2012, 108–123. [Google Scholar]
- Wei, D.; Gu, N.; Han, Y. Has Artificial Intelligence Promoted Industrial Structure Transformation and Upgrading? An Empirical Test Based on China’s Industrial Robot Data. Finance & Economics Science 2021, 70–83. [Google Scholar]
- Hu, D. Analysis of Big Data Text Mining Methods in Finance. Internet Weekly 2022, 12–14. [Google Scholar]
- Ye, K.; Sun, W. Accounting Software Adoption and Firm Productivity—Evidence from Non-Listed Companies. Accounting Research 2019, 45–52. [Google Scholar]
- Pan, S.; Li, J.; Gu, N. Artificial Intelligence, Industry Integration, and Industrial Structure Transformation and Upgrading. China Industrial Economics 2025, 23–41. [Google Scholar]
- Zhao, R.; Gao, M. How Does Industrial Intelligence Affect Labor Skill Structure? Finance & Economics Science 2024, 107–118. [Google Scholar]
- Yu, L.; Wei, X.; Sun, Z.; et al. Industrial Robots, Job Tasks, and Unconventional Skill Premium—Evidence from a “Firm–Worker” Matched Survey in Manufacturing. Management World 2021, 37, 47–59. [Google Scholar]
- Zhang, T.; Gao, T. Fiscal and Tax Policy Incentives, High-Tech Industry Development, and Industrial Structure Adjustment. Economic Research Journal 2012, 47, 58–70. [Google Scholar]
- Zhang, L.; Zhang, S. Technology Empowerment: The Technological Innovation Effect of AI and Industrial Integration Development. Finance & Economics Science 2020, 74–88. [Google Scholar]
- Tu, N.; Zheng, Y.; Guan, B. The Labor Spatial Mobility Effect of Artificial Intelligence. Finance & Economics Science 2024, 96–108. [Google Scholar]
- Zhang, Y.; Lu, Y.; Li, L. The Impact of Big Data Application on Chinese Firms’ Market Value—Evidence from Text Analysis of Listed Companies’ Annual Reports. Economic Research Journal 2021, 56, 42–59. [Google Scholar]
- Huang, X.; Zhu, X.; Wang, J. Has AI Improved the Total Factor Productivity of Chinese Manufacturing Firms? Finance & Economics Science 2023, 138–148. [Google Scholar]
- Melitz, M.J. The Impact of Trade on Intra-Industry Reallocations and Aggregate Industry Productivity. Econometrica 2003, 71, 1695–1725. [Google Scholar] [CrossRef]
- Martin, R.; Sunley, P.; Gardiner, B.; Tyler, P. How Regions React to Recessions: Resilience and the Role of Economic Structure. Regional Studies 2016, 50, 561–585. [Google Scholar] [CrossRef]
- Acemoglu, D.; Restrepo, P. Low-Skill and High-Skill Automation. Journal of Human Capital 2018, 12, 204–232. [Google Scholar] [CrossRef]
- Autor, H.D.; Levy, F.; Murnane, J.R. The Skill Content of Recent Technological Change: An Empirical Exploration. Quarterly Journal of Economics 2003, 118, 1279–1333. [Google Scholar] [CrossRef]
- Acemoglu, D.; Restrepo, P. Automation and New Tasks: How Technology Displaces and Reinstates Labor. Journal of Economic Perspectives 2019, 33, 3–30. [Google Scholar] [CrossRef]
- Acharya, V.V.; Baghai, R.P.; Subramanian, K.V. Wrongful Discharge Laws and Innovation. Review of Financial Studies 2014, 27, 301–346. [Google Scholar] [CrossRef]

Table 1.
Variable Definitions.
| Variable Category | Variable Name | Variable Symbol | Variable Measurement |
| explained variable | Enterprise OFDI resilience | ||
| explanatory variable | Enterprise AI application level | ln(annual report AI word frequency_it +1) | |
| ln(number of AI patent applications in the past three years_it +1) | |||
| control variable | Firm size | Logarithm of total assets: ln(total assets) | |
| Leverage (debt ratio) | Total liabilities / Total assets | ||
| Growth | Operating income growth rate or total asset growth rate | ||
| Ownership (state-owned) | 1 = state-controlled, 0 = others | ||
| Government support | 1 = with government support, 0 = without | ||
| Governance structure | Proportion of independent directors on the board of directors | ||
| Innovation capability | R&D investment / Operating income | ||
| Firm age | Years of establishment or years of listing | ||
| Regional digital infrastructure | Provincial digital economy/infrastructure index released by third parties | ||
| Host-country political risk | World Bank Political Stability Index (host country average weighted by investment amount) |
Table 2.
Baseline regression of AI application level on investment resilience.
| Variable | (1) OLS | (2) FE |
| AI application level | 0.992*** (8.68) |
0.557*** (17.50) |
| Firm size | 0.181*** (3.48) |
0.107*** (3.25) |
| Leverage (debt ratio) | -0.062*** (-2.12) |
-0.045** (-2.00) |
| Growth | 0.089* (1.98) |
0.061* (1.88) |
| State-owned enterprise | -0.015 (-0.28) |
-0.008 (-0.25) |
| Government support | 0.071* (1.85) |
0.045 (1.60) |
| Governance structure | 0.093* (2.14) |
0.054* (1.98) |
| Innovation capability | 0.128** (2.65) |
0.072** (2.32) |
| Firm age | -0.011 (-1.45) |
-0.007 (-1.30) |
| Digital infrastructure | 0.202** (2.33) |
0.118** (2.10) |
| Host-country political risk | -0.144** (-2.05) |
-0.092** (-1.97) |
| Constant | 0.024 (0.14) |
|
| Firm fixed effects | No | Yes |
| Year fixed effects | Yes | Yes |
| Observations | 12412 | 12412 |
| R² (within) | 0.148 | 0.333 |
Note: Robust standard errors clustered at the firm level are in parentheses. Results are reported as marginal effects. *, **, *** indicate significance at the 10%, 5%, and 1% levels, respectively. Parentheses contain t-statistics. The same applies to tables below.
Table 3.
PSM balance test and treatment effect estimation.
| Pre-match Treatment | Pre-match Control | Post-match Treatment | Post-match Control | |
| Firm size (initial) | 0.141 | 0.514** | 0.126 | 0.118 |
| Initial resilience | 0.158 | -0.150** | 0.162 | 0.149 |
| High-tech firm (%) | 54.8%** | 16.1% | 51.6% | 48.4% |
| State-owned firm (%) | 46.3% | 56.5% | 50.0% | 48.4% |
Note: Pre-match differences marked ** are significant at 5% or better. After matching, none of the differences are statistically significant.
Table 4.
Regression of AI treatment effect on matched sample.
| Variable | Investment Resilience(Matched Sample) |
| AI Adoption (Treatment = 1) | 0.218** (2.45) |
| Firm size | 0.152** (2.02) |
| Leverage | -0.048* (-1.66) |
| Growth | 0.073* (1.85) |
| State-owned enterprise | -0.019 (-0.41) |
| Government support | 0.058 (1.61) |
| Governance structure | 0.086** (2.05) |
| Innovation capability | 0.105** (2.21) |
| Firm age | -0.009 (-1.29) |
| Digital infrastructure | 0.185** (2.19) |
| Host-country political risk | -0.121* (-1.94) |
| Constant | 0.031 (0.21) |
| Observations | 124 |
Note: ATT: 0.218, p < 0.05 (significant positive effect of AI on resilience after matching). Robust t-statistics in parentheses. All regressions include the same controls as baseline.
Table 5.
Comparison of baseline OLS and IV regression results.
| Investment Resilience | OLS Baseline | IV-2SLS |
| AI application level | 0.560*** (17.5) |
0.523*** (7.58) |
| Controls included | Yes | Yes |
| Fixed effects | Yes | Yes |
| R² | 0.333 | 0.331 |
| Observations | 12290 | 12290 |
Note: IVs for AI level are regional “AI+” policy dummy and industry AI penetration rate. First-stage F-stat = 10.48. Hansen J-test p > 0.10 (IVs exogenous). All regressions include full controls and FE as in Table 2.
Table 6.
DID regression results for AI policy shock.
| Investment Resilience | DID Estimate(FE Model) | |
| Policy Implementation ×Post | 0.205*** (7.50) |
|
| Firm fixed effects | Yes | |
| Year fixed effects | Yes | |
| Observations | 12291 | |
| R² | 0.155 |
Note: Policy Implementation = 1 for firms in provinces with “AI+” policy (e.g. Shanghai), 0 for control province (e.g. Anhui). Post = 1 for Year 6 onward, 0 for Year 1–5. Robust t-statistic in parentheses.
Table 7.
Robustness regressions with alternative and lagged variables.
| Investment Resilience | Alt. Indicator:AI Patent Count | Lagged AI Application Level |
| AI variable coefficient | 0.082*** (4.50) |
0.528*** (16.0) |
| Controls & fixed effects | Yes | Yes |
| Observations | 9382 | 10281 |
| R² | 0.276 | 0.310 |
Note: Column 1 uses log(AI patent count + 1) in place of AI application level. Column 2 uses AI application level lagged by one period. Both include full controls and firm/year FE.
Table 8.
Regression results for mechanisms of AI’s impact on investment resilience.
| Variable | (1) Baseline | (2) Financing Constraint | (3) Cost Efficiency | (4) Resource Allocation |
| AI application level | 0.557*** (17.5) |
0.513*** (15.1) |
0.487*** (14.4) |
0.485*** (13.9) |
| Financing constraint index | -0.214*** (-7.52) |
|||
| Cost efficiency index | 0.231*** (6.08) |
|||
| Resource allocation index | 0.194*** (6.60) |
|||
| Firm fixed effects | Yes | Yes | Yes | Yes |
| Year fixed effects | Yes | Yes | Yes | Yes |
| Observations | 12412 | 12412 | 12412 | 12412 |
| R² (within) | 0.333 | 0.350 | 0.349 | 0.345 |
Note: Each column adds the indicated mediator(s) to the baseline fixed-effects model. All mediators are scaled such that a higher value indicates improvement (lower financing constraints, higher efficiency). All regressions include controls as in Table 2.
Table 9.
Heterogeneity analysis results.
| Variable | (1) Ownership Group | (2) Industry Group | (3)AI Capa-bility Group |
| SOEs | Non-SOEs | Manufactur-ing | |
| AI application level | 0.517*** (9.76) |
0.743*** (8.35) |
0.552*** (10.63) |
| Firm fixed effects | Yes | Yes | Yes |
| Year fixed effects | Yes | Yes | Yes |
| Observations | 12380 | 12620 | 11880 |
Note: Each column shows fixed-effects regression results for the specified subsample. All models include the full set of controls. AI capability grouping is based on median split of AI index. All coefficients for AI are significant at 1%.
Table 10.
Regression results under macroeconomic fluctuations.
| Variable | Model (1) | Model (2) |
| Constant | 9.996*** (65.840) |
9.996*** (65.840) |
| AI application level | 0.430 (1.541) |
0.430 (1.541) |
| Economic downturn (Down) | -2.092*** (-12.259) |
-2.092*** (-12.259) |
| Policy tightening (Tight) | -1.143*** (-6.683) |
-1.143*** (-6.683) |
| AI × Economic downturn | 0.832* (2.192) |
0.603* (1.878) |
| AI × Policy tightening | 0.294*** (3.291) |
0.751** (2.340) |
| Firm fixed effects | Yes | Yes |
| Year fixed effects | Yes | Yes |
| Observations | 2383 | 2383 |
| R² (within) | 0.45 | 0.45 |
Note: Model (1) and (2) represent different specifications including one or both interaction terms. Down = 1 during economic recession years; Tight = 1 during policy tightening periods. All models include controls as before. Standard errors clustered by firm.
Table 11.
Regression results of AI’s effect in different OFDI stages.
| Variable | Planning Stage (1) | Operation Stage (2) | Exit Stage (3) |
| AI application level | 0.255*** (7.851) |
0.309*** (8.594) |
0.124*** (3.517) |
| Firm size | 0.103** (2.152) |
0.112*** (3.014) |
0.087** (2.009) |
| Leverage | -0.056 (-1.211) |
-0.043 (-0.975) |
-0.079 (-1.596) |
| Growth | 0.041 (1.008) |
0.034 (0.908) |
0.021 (0.527) |
| Digital infrastructure | 0.082** (2.042) |
0.097*** (2.815) |
0.061* (1.894) |
| Host-country political risk | -0.110*** (-3.014) |
-0.125*** (-3.528) |
-0.142*** (-3.916) |
| AI × Firm size | 0.076*** (3.178) |
0.088*** (3.685) |
0.043** (2.124) |
| Constant | -0.422 (-1.435) |
-0.365 (-1.256) |
-0.478 (-1.501) |
| Stage fixed effects | Yes | Yes | Yes |
| Observations (per stage) | 100 | 100 | 100 |
| Adjusted R² | 0.25 | 0.32 | 0.18 |
Note: Each column is a separate regression for the specified stage. “AI × Firm size” is an interaction term included to capture differential AI effects by firm size; it is positive in all stages, indicating larger firms benefit more from AI. All models include firm fixed effects (not shown due to short panel within stage) and are estimated on a balanced sample of 100 firms across 10 periods (split into stages for analysis). Significance: p<0.10, *p<0.05, **p<0.01.
Disclaimer/Publisher’s Note: The statements, opinions and data contained in all publications are solely those of the individual author(s) and contributor(s) and not of MDPI and/or the editor(s). MDPI and/or the editor(s) disclaim responsibility for any injury to people or property resulting from any ideas, methods, instructions or products referred to in the content. |
© 2025 by the authors. Licensee MDPI, Basel, Switzerland. This article is an open access article distributed under the terms and conditions of the Creative Commons Attribution (CC BY) license (http://creativecommons.org/licenses/by/4.0/).
Copyright: This open access article is published under a Creative Commons CC BY 4.0 license, which permit the free download, distribution, and reuse, provided that the author and preprint are cited in any reuse.


