
Submitted:
31 August 2025
Posted:
02 September 2025
You are already at the latest version
Abstract
This paper explores the connection between innovation dynamics and the Bank Capital to Asset Ratio (CAR) in the context of 39 European nations from 2018 to 2025. With a multidimensional panel data approach that incorporates a combination of static and dynamic panel models and machine learning algorithms—specifically Decision Tree Regression—the study conducts a data-oriented analysis of the impact of various types of innovation on the resilience of the banking sector. The study differentiates innovation inputs (e.g., trademark applications, innovator share), outputs (e.g., new-to-marketing and new-to-firm product sales), and productivity factors and factors permitting a finely grained comprehension of innovation inputs and financial consequences. Cluster analysis is applied to classify countries into innovation performance groups and is followed by regression and variable importance calculations. The study identifies that process innovations executed by small and medium enterprises (SMEs) are positively linked with CAR and that information is associated with greater financial stability, whereas innovation outputs and productivity indicators at times relate inversely and register corresponding financial stress in the face of innovation-driven transitions. Further, pre-stage innovation inputs may raise banks' uncertainty and register systematic risk escalation. The model of a Decision Tree also reveals the sales of innovative products and labor productivity to be the most robust determinants of CAR with varied directional impacts between them. These results document the innovation-finance nexus complexity and refute the supposition that innovation equally strengthens economic prudence. The study contributes new knowledge to the literature through the combination of the assessment of financial prudency with the type of innovation and provides clear policy directions for the synchronization of innovation strategies with macroprudency aims across the European region.
Keywords:
innovation
; bank capital
; financial stability
; decision tree regression
; Europe
1. Introduction
In the dynamic environment of European economic governance, innovation and financial stability are two pillars of long-term competitiveness and robustness. Innovation propels technological advancement, productivity improvements, and economic rejuvenation. Financial stability, in turn, guarantees that the transformation occurs in the absence of systemic shocks that could threaten growth. The nexus between the two areas has been gaining saliency in the post-crisis European environment, with particular force, as countries experience concomitant challenges posed by digitalization pressures, sustainability shifts, and financial system adjustments. With this background in mind, the present study examines the nexus between innovation dynamics and banks' capital structures, specifically aiming to determine the determinants of the Bank Capital to Asset Ratio (CAR) through different indicators of innovation in the period between 2018 and 2025 across 39 European nations. The present study is motivated by a primary question of inquiry: how does innovation—with a multitude of input, output, and productivity indicators serving to gauge it— impact the capital adequacy of banks in European nations? More specifically, the study inquires whether economies that exhibit higher rates of innovation are more or less likely to maintain strong bank capital ratios. Last but not least, the study inquires whether the form of innovation—namely, whether it involves firm-level process innovations, trademark activity, or revenue from new products—modulates the relationship in a distinctive fashion? At the bottom, the question is whether innovation acts in a stabilizing fashion on the financial system or, conversely, acts in a volatile fashion that eats into the financial cushions? By virtue of employing the panel data approach across a set of countries and many years, the study seeks to get beyond the level of generalizations and present a disaggregated examination of the relationship between a precise pattern of innovation and a key indicator of financial stability in the form of the capital-to-assets ratio in the banks in support of a more fine-grained knowledge of the complex relationships between them. Its originality resides in three main contributions. Firstly, it does dwell on bank capital adequacy—a rule- and system-ic indicator of financial strength that is other than certain more frequently examined outcomes in the form of GDP growth, R&D spending, patent numbers and the rest—where prior literature has examined the relationship between the development of finance and innovation at great length and wealth but that has been far less examined is that between innovation on the one hand and bank internal resilience on the other. The selection of the Bank Capital to Asset Ratio (CAR) as the dependent variable thus represents a new departure from more typical growth- or investment-driven models. Second, the study breaks new ground by employing a multi-dimensional approach to measuring innovation. Rather than employing a single indicator such as R&D expenditure or patent applications it employs five various indicators of innovation: the share of firms that innovate (INN), the number of trademark applications (TMA), the share of SMEs that introduce business process innovations (SBIN), product sales of new-to-market and new-to-firm products (SNI), and resource and labour productivity (RLP). Such a level of detail enables a more nuanced examination of the interactions between various aspects of innovation—the inputs, outputs, and outcomes—and the strength of the financial system. It is also in line with recent scholarship arguing in favour of a distinction between various forms of innovation in analyzing their economic consequences. Third, the study strengthens its empirical foundation through methodological triangulation by employing fixed-effects, random-effects, and dynamic panel models to test the results for robustness. It also employs machine learning algorithms (such as Decision Tree Regression) and clustering algorithms (such as K-Means) in order to reveal underlying patterns in the data and to anticipate CAR more accurately. Such a hybrid quantitative design—the blending of economic, unsupervised, and supervised learning—remains a rare characteristic of the study of finance and innovation, representing a contribution to the methodological arena of the field. The literature presents valuable yet partial insights into the relationship between innovation and finance. Classically influential pieces from the corpus of financial economics, such as Schumpeter's concept of “creative destruction” and the exogenous growth theories that followed in its wake, suggest that finance underpins innovation through the allocation of capital to high-risk and high-reward projects. More recent scholarship from Rajan and Zingales, as well as Levine and other researchers, has extended that line of reasoning by focusing on the contribution of financial intermediation to the encouragement of innovation and entrepreneurship. But the converse relationship—the effect of innovation upon the institution of finance?—has been the subject of sporadic scholarship only. A small corpus of scholarship suggests that hot innovation has a risk-enhancing effect on lending, distorting the risk-weighted asset profile of banks, and hence putting capital adequacy at risk. Like Beck et al., e.g., argue that innovation has the ability to strain mainstream models of banking through the diversion of the locus of economic activity to intangible assets that cannot be easily collateralized. Likewise, Gambacorta et al. discuss the possibility that financial innovation may create regulatory arbitrage, thereby indirectly eroding capital buffers. Nonetheless, the empirical record remains dispersed. A majority of the studies are either nationwide or limited to narrow innovation indicators, such as R&D expenditure or patent applications. Furthermore, very few studies analyze the variety of innovation outcomes and do not examine the interactive effect of innovation and productivity on the balance sheets of banks. The present paper addresses this lacuna through a holistic and comparative approach, utilizing panel data from nearly four dozen European nations and incorporating both conventional econometric and advanced machine learning methods to achieve robust results. Distinguishing the connection between innovation and bank capitalization has crucial implications for European Union policymakers and beyond. Innovation is a cornerstone of the European Union's long-term competitiveness vision, encapsulated in initiatives such as Horizon Europe and the Digital Single Market. Concurrently, bank capital adequacy is a key item on finance regulators’ agendas, particularly in the wake of recent crises, such as the COVID-19 pandemic, and other ongoing disruptions to the world's geopolitical order. The results of the present study hold promise for shedding light on integrated policy design that balances innovation encouragement with the maintenance of financial stability. For instance, the discovery of a form of innovation that brings a decrease in CAR might prompt the regulators to fine-tune capital buffers or risk-weighting rules in a corresponding fashion. Likewise, the discovery of a kind of process innovation that enhances capital adequacy might refocus innovation support schemes with a special emphasis on improvements of that kind. By bridging two formerly disconnected policy fields—innovation encouragement and bank supervision—the study contributes actionable knowledge pertinent to the design of more integrated economic strategies. The choice of domain for 39 European nations, spanning the period from 2018 to 2025, is both empirical and theoretically motivated. It covers the post-crisis healing years, the implementation of prominent EU strategies for innovation, the COVID-19 shock itself, and the initial phase of the digital and green transitions reshaping the world order. Consequently, it provides a rich setting in which the dynamic interactions between innovation trends and bank resilience can be studied with great effect. The coverage of a broad cross-section of countries also demonstrates the heterogeneity of European innovation systems and financial architectures—from the Nordic innovation leaders to the South and East European catch-up countries—enabling generalizable and heterodox conclusions. At the theoretical level of organization, the paper confronts two rival but intersecting theoretical traditions: innovation systems theory that examines the manner in which national and regional institutions support or hamper innovation through coordinated policies, firm capabilities, and knowledge sharing, and financial resilience theory that focuses on the ability of financial institutions to withstand shocks and maintain functional continuity. Through the unification of the two traditions, the study advocates a new thesis: that innovation systems and financial stability mechanisms are linked. Such linkage is intended to suggest that innovation policy design cannot overlook financial implications, and that financial supervision cannot disregard the dynamic risk environment created by growth fostered through innovation. On the whole, the study innovates through the examination of the effect of heterogeneous innovation activity on a key indicator of financial resilience—bank capital-to-asset ratios—within the European context. Through a comprehensive dataset, a multidimensional innovation framework, and advanced machine learning and econometric methods, it aims to illuminate the situations in which innovation supports or undermines bank sector stability. Through the achievement of the former, the study not only fills a gap in the literature but also yields insightful information for policy leaders as they attempt to reconcile innovation-driven growth with prudent financial governance in rapidly changing situations.
2. Literature Review
The nexus between financial innovation and bank stability has garnered intense academic interest in recent years; however, the corresponding empirical and theoretical underpinnings remain incoherent and often have a context-dependent scope. Marfo-Yiadom and Tweneboah (2022) highlight the intervening role of national culture in the transmission of financial innovation to bank stability, proposing that cultural norms determine the absorption and diffusion of innovation across banks. Although valuable in the diversity of institutions they reveal, their theoretical perspective is of limited empirical depth and fineness compared to our study, which employs a multidimensional panel framework applied across 39 European economies. Likewise, Fukuyama and Tan (2022) focus on performance indicators such as profitability and CSR in the Chinese banking system, proposing that innovation, to some extent, undermines rather than enhances stability. Their conclusion, although derived from a different geographical and regulatory environment, is consistent with the empirical evidence and ours, which highlights that some innovation outputs, such as sales from innovations that are new to the market or productivity surges, are inversely linked to the Capital to Asset Ratio (CAR). This implies a more general phenomenon where innovation-induced transitions actually introduce volatility, rather than stability, into the system, especially when banks deal with burgeoning sectors characterized by uncertain outcomes. Lin, Liu, and Wei (2023), in the excellent review they write of the field, highlight the dual innovator and innovandure role of banks but forward no clear examination of the impact of innovation feedback loops upon core metrics of financial resilience like the CAR and hence our study brings original value by demonstrating through innovation inputs and differentials of innovation outcomes affecting capital adequacy moving beyond the growth-oriented and the tales of technology adoption traditions respectively. Wahab et al. (2022), in a non- European and broader BRICS-level study expand the horizon of analysis into the sustainability objectives and confirm that the support of environmental and financial objectives is derived from the contribution of technological innovation but a macro-level study that does not demystify the micro-level and bottom- line of the financial impacts that banks face and where our study provides more transparent granularity in pinpointing that innovation in the early stage is a source of increased risk in the system. Boachie et al. (2023) explore the interaction between financial inclusion, bank stability, and growth using a dynamic panel approach. Although their methodological choices align with ours, their focus does not extend to disaggregated innovation indicators, leaving a gap that our research directly addresses. Jarvis and Han (2021) and Elsaid (2023) delve into the disruptive potential of FinTech, offering a primarily qualitative perspective on how new entrants reshape banking paradigms. While useful for framing innovation as a systemic shock, they lack the quantitative depth to assess financial soundness, a limitation our study overcomes through econometric modeling and decision-tree algorithms. Stefanelli and Manta (2023) introduce the concept of banking “invisibility” under open banking regimes, implying potential disintermediation risks; however, they stop short of quantifying the impacts on capital reserves. Ozili (2023) offers a more policy-oriented narrative on FinTech and central bank digital currencies, arguing they can enhance financial inclusion and stability. However, our findings challenge the general assumption that innovation uniformly enhances soundness, revealing that its effects are contingent upon type, timing, and institutional context. Finally, Testa et al. (2024) explore the role of total quality management in mitigating banking risks, emphasizing the importance of employee training. This aligns with our observation that process innovation among SMEs positively correlates with CAR, suggesting that innovation focused on internal efficiency may bolster bank resilience. Olalere et al. (2021) explore the relationship between financial innovation, bank competition, and firm value in Malaysia and Nigeria. While their study emphasizes innovation as a driver of firm-level performance, it lacks a system-wide perspective on capital adequacy or resilience, which is central to our research. Nonetheless, their conclusion that innovation’s impact varies by market structure resonates with our evidence of heterogeneity in the innovation-stability nexus across European economies. Mishchenko et al. (2021) adopt a risk management lens, identifying innovation as a dual-edged process that requires active mitigation strategies. This aligns closely with our finding that innovation outputs, especially sales of new-to-market products, can increase systemic vulnerability, thereby necessitating tailored prudential supervision. Daud et al. (2022) offer a more direct approach to financial stability by examining whether FinTech poses a threat or an opportunity. Their thoughtful stance—that the result depends on institutional preparedness— bolsters our result that the type and timing of innovation decisively determine its impact on bank capital adequacy. Likewise, Khattak et al. (2023) analyze digital transformation, diversification, and banking stability, concluding that digitization strengthens resilience only when accompanied by strategic risk management. The insight is analogous to our finding that SMEs’ process innovations contribute positively to CAR and that internal efficiency improvements have a stabilizing effect. Safiullah and Paramati (2024) present strong empirical evidence regarding the impact that FinTech firms have on the financial stability of conventional banks, revealing that higher competition lowers capital buffers. This bolsters our model's negative relationship between some innovation proxies (e.g., TMA, SNI) and CAR, implying that competition emanating from innovation has the power to wreak a destabilizing impact whenever it is not offset by a prudential framework of regulations. Varma et al. (2022) conduct a thematic analysis of the FinTech sector and posit that technological disruption is remaking the banking architecture at the structural level. While the paper is qualitative in approach, it supports the corresponding notion of our decision-tree regression, which suggests that the character of innovation determines the type of financial impact it has. Corbet et al. (2024), in a paper that focuses on China, empirically confirm that financial innovations have both negative and positive impacts on bank performance, depending on the type of innovation employed. The duality is analogous to our main result: not all innovations enhance capital adequacy, and some actually threaten it. Junarsin et al. (2023) present country-level evidence from Indonesia that FinTech lending has a disruptive effect on the financial stability of banks, which is more pronounced, especially where expansion is rapid and uncontrolled. Our discovery of a negative relationship between SNI and CAR emits analogous cautions against the uncontrolled growth of innovative financial products. Finally, the two papers by Banna and coworkers (2021, 2022) focus on the role of financial inclusion during the COVID-19 period and its aftermath, positing that inclusion enhances the stability of banks. While that is thematically proximal, our result cautions against proliferation because a higher level of innovation input or output is synchronized with a lower level of capital buffer, especially in an environment where decent institutional protection is absent. The intersection of digital innovation, evolving regulations, and financial strength continues to enrich contemporary scholarship in banks, with varying degrees of empirical depth and substance, as well as relevance to capital adequacy. Hassan et al. (2024) survey cybersecurity matters in banks from a global perspective, including the Nigerian angle. While indirectly incommensurable with capital proportions, the paper reveals the relevance of system integrity through digit risk management—an underlying dynamic that is also found in our paper's finding that innovation-driven changes (e.g., high levels of SNI and RLP) would introduce volatilities that demand higher operational protection. Iyelolu et al. (2024) cover innovations in the law of FinTech with the thesis that adaptation is a condition without which the virtues of digital finance cannot be realized. This opinion aligns with our finding that the institutional frame mediates the relationships between innovation inputs and financial strength, as displayed in the different directions of the impacts from the panel models of INN, SBIN, and TMA in the European panel of economies. Del Sarto et al. (2025) examine the role of social media in transforming the digital banking landscape, with a focus on consumer participation and reputational interactions. Although situated in the peripheries of capital adequacy, the study reveals that digital adoption introduces new sources of risk exposure, which supports our thesis that not all innovation is strength- enhancing. Del Gaudio et al. (2021) report empirical evidence that the spread of information and communication technologies (ICTs)—specifically mobile and internet banking—has altered the business models of banks. Their finding is relevant to our discovery that innovations of processes by small and medium enterprises (SMBs) in the direction of CAR exhibit a positive relationship where efficiency-directed innovation boosts strength when it is innovated in-house in the form of SBIN, compared with output-directed innovations of SNI that are externally focused. Li et al. (2022) examine the nexus between FinTech and bank risk-taking, as well as early-warning systems, concluding that innovation fuels risk exposure without the corresponding and necessary oversight from relevant regulations. This is in direct accordance with our negative coefficients of SNI and RLP in different panel models, which confirm that the rapid adoption of innovations may lead to more competitive game strategies and less robust buffers. Broby (2021) speculatively predicted the transformative effect of FinTech on future banks. While theoretically compelling, our machine learning framework introduces statistically informed CAR expectations in the face of variability in innovations. Risman et al. (2021) study the macro implications of digital finance for financial stability and find mixed results, acknowledging that system-level outcomes rely on the inclusive or exclusive character of digital adoption. Similarly, our result is that types of innovation must be disaggregated because CAR differs from them considerably. Ali et al. (2025) depart from innovation per se and study the impact of exchange rate regimes on stability. Not directly relevant, but similar, is the focus on the macroeconomic foundations underlying our methodological choice of controlling for cross-country variation with fixed effects and clustering. Abuselidze (2021) connects bank competition with economic growth and financial stability, supporting our result that external market forces, such as competition and innovation pressures, may lead to differentiated capital planning by banks. Finally, Xu et al. (2022) study the role of policy financing in driving green innovation in SMEs and identify the promise of purpose-designed interventions. This provides a prescriptive angle to our empirical result that SBIN has a beneficial effect on CAR, and that driving innovation through guarantees or subsidies raises both innovation and resilience simultaneously (Table 1).
3. Data, Variables, and Analytical Framework
The present section outlines the dataset, variable construction and the statistical approach applied to study the relationship between bank capital adequacy and financial innovation in European economies between 2018 and 2025. The study focuses on the Bank Capital to Assets Ratio (CAR) providing the dependent variable under the form of a main indicator of institutional strength and financial solidity. The innovation and productivity trends are expressed in terms of six autonomous variables: the share of innovating firms (INN), trademark applications (TMA), SMEs that innovate processes (SBIN), sales of new-to-market and new-to-firm innovations (SNI), and a composite resource and labor productivity indicator (RLP). Descriptives and the correlation analysis reveal a complex and often negative relationship between the innovation activity and capital strength and prompt the adoption of non-linear and non-parametric models. In the wake of the detection of the deviation from normality and of the presence of the effect of the outliers, the approach gathers the classic descriptive techniques and the decision tree regression in order to recognize conditional patterns and CAR determinants at various innovation milieus (Table 2).
The descriptive statistics of the dataset encompassing the Bank Capital to Assets Ratio (CAR) and its hypothesized predictors—INN (Innovators), TMA (Trademark Applications), SBIN (SMEs introducing business process innovations), SNI (Sales of new-to-market and new-to-firm innovations), and RLP (Resource and Labour Productivity)—offer several important insights into both the central tendencies and the distributional characteristics of these variables within the European context from 2018 to 2025. Starting with the dependent variable, CAR shows a valid observation count of 216 out of 312, indicating a non-negligible portion of missing values (96). Despite this, the distribution appears fairly symmetrical and moderately dispersed. The mean (8.355) and median (7.921) are close, suggesting near-normality, which is supported by a skewness of 0.723. However, the Shapiro-Wilk test for normality reports a p-value of less than 0.001, indicating a statistically significant deviation from a normal distribution. The coefficient of variation is relatively low at 0.285, confirming moderate variability. The predictor variables present more heterogeneous patterns. INN, with no missing values, displays a left-skewed distribution (skewness 0.298) and a broad range (0 to 220.177), indicating high variability in national innovation profiles. The mean (109.695) and median (119.845) values reflect a slight gap in central tendency, and the coefficient of variation (0.488) suggests substantial dispersion. TMA also displays notable variability with a coefficient of variation of 0.615. The distribution is moderately right-skewed (0.565), with a high maximum value (224.288) and the same number of valid observations as INN. SBIN exhibits a similar profile with a mean of 107.473 and a slightly lower standard deviation. The negative skewness of -0.274 suggests that a majority of countries report higher values for business process innovation among SMEs; however, the Shapiro-Wilk test again rejects the assumption of normality. SNI also exhibits a right-skewed distribution (0.542), characterized by high dispersion across countries. The maximum value is 187.312, while the median is considerably lower (79.551), indicating a concentration of observations on the lower end of the distribution and the presence of innovation leaders pushing the mean upward. From a productivity viewpoint, RLP is very variable, with a coefficient of variation of 0.571 and a wide range of 4.124 to 255.412. Distribution is medium right-skewed (0.423), and a negative kurtosis of -0.627 suggests a flatter distribution compared with a normal distribution. All predictor variables reject the normality null hypothesis using the Shapiro-Wilk test at p < 0.001. Outliers and non-normality of the variables account for the adoption of non-parametric or tree models, such as decision tree regression, in the main analysis. A final comment is that the modes of several variables (most of which are noteworthy, including INN, SBIN, and TMA) are equal to the medians of the corresponding variables. There is a frequent report of zero or limited levels of the corresponding innovation inputs in countries, particularly in the early development stages. This suggests the highly uneven region of Europe's innovation landscape (Table 3).
The covariance and the correlation matrices provided contain useful information about the pattern of relationships between the Bank Capital to Assets Ratio (CAR) and the array of innovation-related and productivity indicators of European nations in the years 2018–2025. We find from the data the direction and strength of the associations that are central to understanding the interactions between innovation and productivity dynamics, and financial stability as reflected in CAR. From the covariance matrix onwards, CAR is negatively correlated with all five autonomous variables: Innovators (INN), Trademark Applications (TMA), SMEs that introduce business process innovations (SBIN), Sales of new-to-market and new-to-firm innovations (SNI), and Resource and Labour Productivity (RLP). The negative correlation is the strongest with TMA (-39.214), followed by RLP (-35.710), and SNI (-25.076). These results suggest that growth in trademark activity, productivity growth, and sales of new innovations are often associated with a decrease in the bank capital ratio. Although the magnitudes of the covariance are scale-dependent and cannot be compared directly across variables with different units of measurement, the persistent negative sign in the covariance magnitudes suggests a potential inverse relationship between CAR and innovation- performance indicators. The matrix of correlations underpins and refines these relationships, presenting standardized coefficients that are understandable in terms of scale. CAR is negatively correlated with all the independent variables, most strongly with TMA (-0.282), RLP (-0.248), and SNI (-0.235). These inverse relationships of moderate strength suggest that higher productivity, higher innovation commercialization rates, and higher formal innovation (as measured by trademarks) are associated with lower bank capital ratios. This could be interpreted as a possible implication that banks in a high-innovation setting may be more willing to opt for riskier portfolios or capital compositions that are less conservative. INN and SBIN also show negative but weaker correlations with CAR (-0.184 and -0.193, respectively). While both are relatively mild relationships, they do suggest that the presence of innovation inputs—of the form of larger percentages of innovative firms or of changes in internal business processes—does not necessarily come with increased capital adequacy for the banks in the industry. Instead, innovation is perhaps linked with increased uncertainty or riskier growth options that can have effects on capital structures and demands on regulatory capital. Examining the correlations between variables, we observe a very strong and statistically significant correlation between INN and SBIN (r = 0.966), indicating that the stock of innovating firms is almost perfectly associated with the rate of SMEs that innovate their business processes. This is a reasonable association because the indicators both measure first-stage or process-level innovation activity and frequently both arise from the same set of firms. We also observe that INN is positively correlated with TMA (0.282) and SNI (0.334), indicating that countries with larger stocks of innovators tend to write more patent applications and achieve more innovative outcomes. The linkage between RLP and the other innovation indicators is typically weak. RLP is weakly and positively correlated with INN (r = 0.121), TMA (r = 0.151), and SBIN (r = 0.163), and is close to zero with SNI (r = 0.018). The conclusion is that resource and labour productivity may function partly independently of the traditional innovation processes and perhaps register structural/technological efficiency factors that are indirectly not associated with the outcomes of innovation. Summarizing the results, a universally negative relationship exists between innovation indicators and CAR of varying intensities. Although the innovation system is dynamic and integrated, the relationship with bank capitalization is complex, and it may involve trade-offs between growth and risk, as well as between financial robustness and risk tolerance. The results of the paper suggest that innovation policy and financial regulation must be highly coordinated to prevent economic modernization from threatening bank stability (Table 4).
Methodology
The method of this study is designed to critically test the relationship between innovation dynamics and the Bank Capital to Assets Ratio (CAR) between 2018 and 2025 in 39 European countries. From a technical and scientific perspective, the study employs a combination of machine learning techniques, panel data methods, and econometric modeling to achieve robust and valid outcomes. The dependent variable, CAR, is defined as the Tier 1 bank capital divided by total assets, serving as a bank sector resilience and financial stability indicator. Explanatory variables are employed to account for different aspects of innovation and productivity, including Innovators (INN), Trademark Applications (TMA), SMEs that innovate business processes (SBIN), Sales of innovations new to market and new to firm (SNI), and Resource and Labour Productivity (RLP). These indicators are primarily sourced from the European Innovation Scoreboard, which provides cross-country standardization of innovation performance comparisons. The econometric estimation begins with panel data regressions that leverage the time-series and cross-sectional dimensions of the dataset. Unobserved country heterogeneity is accounted for through the adoption of fixed-effects and random- effects estimators. The decision between the two estimators is guided by the Hausman test, and the test results suggest that the country effects are indeed linked to the explanatory variables, thereby supporting the application of fixed-effects models. It helps the empirical analysis to account for unobservable institutional, regulatory, and structural variation that would otherwise contaminate the coefficient estimates. To account for persistence in the capital structures of the banks themselves, a one-step dynamic panel model is included that incorporates a lagged dependent variable. The dynamic specification accounts for the path dependence of financial decision-making in the sense that the previous level of CAR determines the current adjustment due to the inertia of regulations, long-term strategic planning, and gradual capital accumulation. In addition to standard econometric methods, the paper incorporates clustering algorithms to uncover latent patterns in the data. Six clustering algorithms—Density-Based Clustering, Fuzzy C-Means, Hierarchical Clustering, Model- Based Clustering, K-Means, and Random Forest Clustering—are compared with each other using normalised performance metrics such as R², Akaike Information Criterion (AIC), Bayesian Information Criterion (BIC), Silhouette Score, Dunn Index, and Calinski-Harabasz Index. Through this comparison of algorithms, it is possible to identify the algorithmic approaches best suited to categorize countries into innovation-finance profiles. K-Means Clustering is the most effective method due to the high explanatory power and stable performance in validity metrics. Clustering serves a twofold methodological purpose: it explains heterogeneity in the dataset and facilitates the interpretation of the results from the econometric estimation by contextualizing the results within a set of structurally comparable countries. The strength of the results is further supported by diagnostic tests. Cross-section dependence is tested to ensure that shocks in one country do not sway results from other countries, a crucial condition in integrated European markets. Autocorrelation and heteroskedasticity are adjusted through robust standard errors. The statistical significance of the coefficient across models represents a repeated validation of the relationship between innovation indicators and CAR, although the effect direction varies depending on the type of innovation. While sales of new-to-market innovations (SNI) and productivity (RLP) possess high predictive ability, for example, they do not necessarily relate positively to financial stability, emphasizing the extremely complex and non-linear relationship of the innovation-finance nexus. From a methodological viewpoint, the strategy is original in its study design, as it is a hybrid approach. By blending machine learning approaches with econometric ones, the study avoids the constraint of the traditional linear models and identifies non-linear relationships, interaction effects, and unobserved heterogeneity more accurately. Such a mixed-methods approach is a source of the study's methodological originality, a characteristic that is scarce in the empirical innovation and bank resilience literature, which links the two concepts. Moreover, by adopting a long-term window that encompasses relevant events such as the COVID-19 pandemic and the initial phase of digital and environmental transitions, the analysis sets its results in a context of severe structural change. Such a context is used to enhance the explanatory power and the policy value of the results found. The method combines econometric rigor and algorithmic discovery within a unified framework to provide a comprehensive and robust picture of the impact of innovation and productivity on bank capital adequacy in Europe. Its intellectual value lies in the unification of innovation studies and the financial and economic communities, and its scientific power is achieved through multi-model estimation, clustering validation, and stringent diagnostic testing. Such a technical architecture yields insightful results with a high level of detail that goes beyond simple econometric work, illustrating the complex ways in which innovation either supports or undermines financial soundness in diversified European economies (Figure 1).
4. Innovation and Financial Stability: A Panel Data Approach to Bank Capital Ratios
This section examines the relationship between innovation dynamics and bank capitalization across 39 European countries from 2018 to 2025. By employing panel data methods, we tabulate the impact of various innovation indicators upon the Bank Capital to Asset Ratio (CAR), a prominent indicator of financial strength. Five innovation variables feature in the model: the percentage of innovative companies (INN), trademark applications (TMA), business procedure innovation in SMEs (SBIN), product innovation in sales (SNI), and resource and Labour productivity (RLP). Through the analysis of this specification of the model, the study aims to determine whether higher innovation strengthens or weakens banks' capital instruments. Given the diversity of the systems of innovation and financial networks in Europe, the present study employs fixed-effects, random-effects, and dynamic panel estimators in order to gauge robustness in the results. The aim is to determine whether the environment of innovation makes a positive contribution to financial strength or, conversely, triggers risks that erode capital adequacy in banks.Specifically we have tested the following equation:
CAR = α + β1(INN)it + β2(TMA)it + β3(SBIN)it + β4(SNI)it + β5(RLP)it
Where i=39 (Countries are Albania, Austria, Belgium, Bosnia & Herzegovina, Bulgaria, Croatia, Cyprus, Czechia, Denmark, Estonia, Finland, France, Germany, Greece, Hungary, Iceland, Ireland, Italy, Latvia, Lithuania, Luxembourg, Malta, Moldova, Montenegro, Netherlands, North Macedonia, Norway, Poland, Portugal, Romania, Serbia, Slovakia, Slovenia, Spain, Sweden, Switzerland, Turkey, Ukraine, United Kingdom) and t=[2018;2025].
The relationship between innovation and financial stability has gained increased focus in recent years, particularly in the European context, where innovation is perceived as the primary source of economic competitiveness. While financial institutional stability is the core of the provision of sustained growth and the avoidance of crisis at the systemic level, the Bank Capital to Asset Ratio (CAR) is universally seen to be a central indicator of the strength of a bank and is perceived to disclose the capacity of a bank to hold loss absorption and engage in risk taking in a cautious and guarded fashion. A larger CAR is perceived to imply a stable financial cushioning effect that raises the level of the banks’ stability. Innovation promises opportunities but also carries the ingredients of risk, uncertainty, and structural change that a system can affect in a myriad of complex ways. The purpose of this paper is to examine the effect of various innovation indicators on CAR in a panel of 39 European countries from 2018 to 2025. The empirical estimation is based on panel data models that account for both the temporal and cross-sectional aspects of the data. The models take into account the dependent variable CAR, which is expressed as a percentage of bank capital relative to the bank's overall assets. Explanatory variables are derived from a set of innovation indicators that cover different dimensions of the innovation ecosystem. These variables are the percentage of firms that are identified innovators (INN), trademark applications (TMA), the percentage of small and medium-sized enterprises that innovate business processes (SBIN), sales that come from products that are new in the market or new in the firm (SNI), and a resource and labour productivity (RLP) indicator. These models employ a random-effects generalized least squares (GLS) estimator, a fixed-effects panel regression, and a one- step dynamic panel model. These models present different perspectives. The random-effects model assumes that the unobserved heterogeneity at the country level is uncorrelated with the regressors. The fixed-effects model controls for unobserved heterogeneity by allowing country-level intercepts. The dynamic model is specified using a lagged dependent variable and controls for the path dependence of capital structure choice in the banking market. The dataset is a balanced panel with a maximum of six time periods per country and a maximum of 210 cross-sectional observations in the cross-sectional models, with the dynamic panel containing a maximum of 136 observations. Descriptive statistics illustrate that the overall average CAR in each set of observations is 8.43 percent with a standard deviation of 2.38 percent, representing moderate variation over time and across countries. The innovation indicators are highly heterogeneous and reflect the diverse capacities and innovation intensities of the various European countries. There are nations with strong innovation systems and high levels of intellectual property generation and process modernization, and nations with low levels of innovation activity. Examining the regression results, the coefficient of INN is consistently negative and statistically significant across all estimation models. In the random effects model, the coefficient is approximately -0.019, with a z-statistic of -3.697, and is therefore robust in indicating an inverse relationship. This suggests that a rise in the percentage of firms that are innovators is followed by a reduction in CAR. While unexpected at first glance, the result could suggest that higher innovation activity brings more financial risk or volatility that undermines banks’ capital cushions. The finding could equally be a reflection of the situation where firms that innovate typically face an uncertain environment that forces banks to invest more capital in order to sustain them or confronts banks with a higher risk of defaults, thereby negatively impacting their capital ratios. Trademark applications (TMAs) are also found to be negatively associated with CAR, with a value of approximately -0.023 in the random-effects model, and this association is highly significant. There may be a likelihood that periods of higher intellectual property registration are associated with higher competitive pressures, a greater risk of investment, and structural adjustments in the economy that compel banks to reposition their capital positions. With the higher rate of innovation, banks may be persuaded to lend to companies in industries with nascent revenue opportunities, compelling them to shift their capital allocation strategies. Conversely, the SBIN variable is statistically significant and positive in all models. In the random-effects model, the value is approximately 0.018, suggesting that a higher percentage of SMEs implementing process innovations is associated with a higher CAR. The result is in line with the notion that business process innovation enhances the efficiency and reliability of a firm's operations, yielding superior financial performance and potentially reducing credit risk for capital suppliers. Banks in economies where business process innovation is prevalent may find that risk exposure is lower, and therefore be encouraged to maintain or even increase capital amounts. The SNI variable of new product sales has a negative and statistically significant coefficient across all models. In the random-effects model, the estimate is approximately -0.011, which supports the same conclusion as the CAR of banks becoming more reliant on revenues from new products. That is a result of the inherent riskiness of innovation outcomes: new products entering the market frequently face volatile demand, protectionist regulation, and technological obsolescence. Exposed banks face greater credit risk or hold less capital because they invest more aggressively. Resource and labour productivity (RLP) is found to have a negative effect on CAR, with a value of approximately -0.031 in the random-effects model and more pronounced in the fixed-effects and dynamic models of the equation. While higher productivity is typically viewed as a positive macroeconomic indicator of economic growth and development, the negative association with CAR could be a harbinger of structural economic restructuring, potentially reducing the role of conventional banks in the economy. As companies become more efficient and less reliant on labor and conventional inputs, the demand for conventional financial services begins to wane, and banks may be induced to restructure their balance sheets in a manner that lowers capital intensity. Alternatively, higher productivity could be achieved by higher leverage or riskier capital management strategies by companies that are translated into riskier banks' risk profiles. The dynamic panel approach provides further insights with the introduction of a lagged dependent variable, CAR(-1), which has a positive and statistically significant coefficient of approximately 0.285. This identifies a very high degree of persistence in bank capital ratios from one period to the next. That is, current CAR levels are somewhat determined by past ones, with the implication that banks gradually adjust their capital structures and do not quickly respond to changes in their operating environment. Such persistence is consistent with the notion of the existence of regulatory constraints, strategic capital planning, and the high associated costs of drastic changes in capital positions. The regression results describe a multifaceted and situation-variant relationship between innovation and bank capitalization. While certain forms of innovation, e.g., business process improvements at the SME level, appear to support strengthened bank capital, other innovation indicators—namely product novelty and intellectual property indicators—are linked with weakened CAR. These findings highlight the importance of distinguishing between different forms of innovation and their potential implications for financial stability (Table 5).
The statistical quality and reliability of the estimated models may be evaluated from the fit indicators and diagnostic tests of a series of models. The first factor to consider is the number of observations and the panel structure. Both the random-effects and fixed-effects models contain 210 observations from the 37 cross-sectional units (i.e., countries), with a time-series span ranging from a minimum of two to a maximum of six years. The dynamic panel model has a more limited dataset, comprising 136 observations for 36 countries, a decrease that is more likely caused by the incorporation of the lagged dependent variable, which reduces the usable time dimension. Moving on to model fit indicators, the log-likelihood is -509.63 in the random-effects model, but improves significantly to -195.13 in the fixed-effects equation, indicating a superior fit for the latter. Confirming this result are the Akaike and the Schwarz information criteria. The Akaike and Schwarz information criteria in the fixed- effects model present values of 474.26 and 614.84, respectively, which are considerably lower than those of the random-effects model, which take values of 1031.27 and 1051.35, respectively. These confirm that the fixed-effects model more effectively accounts for the data's variability. In addition, the standard deviation of the regression improves from 2.77 in the random-effects model to 0.68 in the fixed-effects model and further to 0.47 in the dynamic panel model, indicating a significant increase in explanatory power in each subsequent model compared to the previous ones. Another interesting statistic is the rho coefficient, which has a level of about 0.237 in the random-effects model. What is meant is that the overwhelming majority of the overall variation in the CAR is caused by the country-specific effects. Confirming this explanation is the level of the between-group variance, which is equal to 10.459, whereas the level of the corresponding within-group variance varies significantly and is only at the level of 0.3755. The average level of theta, equal to 0.919, implies considerable intra-group correlation, which supports the necessity of estimating models that consider the panel structure of the information set. The overall significance of the innovation-related regressors is confirmed by the joint tests. In the random-effects model, the test statistic of the Chi- square is 110.51 with a very small p-value of 3.2e-22, whereas in the fixed-effects model, the test statistic of the F is 22.67 with a very small p-value of 2.4e-17. These results indicate that the entire set of regressors collectively has a statistically significant impact on the bank capital-to-asset ratio. The Breusch-Pagan test also supports the presence of significant unobserved heterogeneity. It tests the hypothesis that the variance of the unit-specific error is zero. With a Chi-square of 407.19 and a very small p-value of effectively zero (1.49e-90), the null is very highly rejected. It supports the use of panel models over pooled OLS and emphasizes the need to control for country-level effects. The test for different group intercepts, which examines whether countries possess a common intercept, yields a very high F-statistic (53.45) with a very small p-value of effectively zero (1.95e-74). Such a conclusion supports the existence of systematic cross-country variation in the level of CAR in the averages, emphasizing the need to include country-specific effects in the model. One of the most crucial decisions in panel data analysis is the decision between fixed-effects and random-effects estimators of the parameters of the model of interest. The Hausman test directly addresses that choice by testing whether the random-effects estimator is consistent. The null hypothesis assumes that the regressors and the unobserved individual effects are uncorrelated. The Chi-square statistic is 14.01, and the corresponding p-value is very small (0.0155), sufficient to reject the null hypothesis at the 5 percent level. Such a result supports the fixed-effects model more robustly under the assumption of the correlation of the country-specific effects and the explanatory variables. Such a condition is very reasonable in the European context, where the national institution, the system of bank regulations, and the system of innovation are very highly correlated with indicators of innovation. The dynamic panel model includes the lagged dependent variable CAR(-1), itself statistically significant with a coefficient of approximately 0.285 and a standard error of 0.100. In line with the persistence in the bank capital-to-asset ratio, the result lends support to theories emphasizing regulatory inertia, forward planning, and gradual capital adjustments by banks. In general, the statistical evidence supports the validity of the regression estimates and the appropriateness of the higher panel techniques. The significance of the regressors, the strength of the diagnostic tests, and confirmation of unobserved heterogeneity all indicate that the estimated relationships are statistically well specified. More importantly, the superiority of the fixed-effects model, as evidenced by both the model selection criteria and the Hausman test, serves to underpin the importance of controlling for cross-country variation in the study of the dependence of financial stability on innovation.
5. Clustering Evaluation for Innovation-Finance Profiling: A Comparative Assessment of Algorithms in the European Context
Choosing the right clustering algorithm is a crucial step in any empirical work, particularly when the goal is to uncover latent structure or unobserved heterogeneity in a dataset. With reference to the immediate study at hand, which aims to estimate the determinants of the Bank Capital to Asset Ratio (CAR) using innovation-related indicators in European nations, clustering is of strategic importance. It has the potential to be used for pre-processing data by detecting subgroups of nations that possess comparable innovation and productivity patterns, thereby enhancing the robustness and intelligibility of the econometric model estimation results. Since a normalized set of performance metrics for six different clustering algorithms is provided in the form of Density-Based Clustering, Fuzzy C-Means Clustering, Hierarchical Clustering, Model-Based Clustering, K-Means Clustering, and Random Forest Clustering, a complete assessment is rendered necessary with the intention of identifying the best-performing method in terms of detecting structural patterns in the data that are meaningful (Table 6).
These metrics encompass a comprehensive set of criteria for measurement, including R², Akaike Information Criterion (AIC), Bayesian Information Criterion (BIC), Silhouette score, Maximum Diameter, Minimum Separation, Pearson's gamma, Dunn Index, Entropy, and the Calinski-Harabasz index. Each of them spans a different facet of clustering performance, and together they comprise a multidimensional basis for comparison. R², a well-known indicator in supervised learning, is used here to present the percentage of variance accounted for in the clustering pattern. In this case, a higher R² would imply that the identified clusters account for a greater proportion of the variability in the information on innovation and productivity relevant to the CAR estimation model. Among the six algorithms, K-Means Clustering yields the highest normalized R² of 1.000 and therefore accounts for the highest percentage of variation. Next in line are Fuzzy C-Means (0.892), Model-Based Clustering (0.863), and Random Forest Clustering (0.831). These statistics would then verify that the first four methods are superior in clustering the dataset into internally homogenous groups compared with the other two methods, namely Hierarchical Clustering and Density-Based Clustering, with the former in particular being poorest in this regard (0.000). Supplementing R² are the AIC and BIC, information- theoretic criteria that test model fit with a penalty for complexity. In clustering algorithms, these metrics calculate the balance between the explanatory power (goodness of fit) and the number of model parameters or clustering (with fewer parameters reflecting a more parsimonious model). Lower metrics suggest a more parsimonious and well-fitting model. K-Means again has the lowest (most favorable) of the others, with normalized AIC and BIC of 0.410 and 0.518, respectively, reflecting a good balance between explanatory power and model simplicity. While Fuzzy C-Means has a high R², it performs poorly in terms of AIC and BIC, with normalized values of 0.946 and 0.930, which suggest an excessive R² and possibly corresponding excessive complexity in the clustering setting of the model. Density-Based Clustering has the lowest (most favorable in absolute terms) AIC and BIC (both of the order of 0.000), but this is deceptive because the R² is also of the order of 0.000, and thus the model, while simple, does not significantly explain the data. The Silhouette score provides a geometric interpretation by quantifying the similarity of an object to its own cluster compared to other clusters. A higher silhouette value is a predictor of well-separated and internally compact clusters. K- Means has the highest silhouette value of 0.692, followed by Hierarchical Clustering (0.538) and Model-Based Clustering (0.385). These outcomes confirm the conclusion that K-Means has the most compact and well-separated groups. Density-Based Clustering has the lowest (0.000), and this is another confirmation of the failure of this clustering algorithm in discovering useful groups in this data set. Parameters such as Minimum Separation and Maximum Diameter further detail the geometrically descriptive attributes of the clusters. The former retains the maximum distance between a pair of points sharing the same cluster, with smaller values denoting denser and more compact clusters. K-Means with the value of 0.221 produces the smallest and the most compact clusters. Density-Based Clustering, however, has the maximum diameter (1.000), implying highly diffused or irregular cluster shapes. The Minimum Separation, which addresses the minimum distance between clustering partitions, demonstrates a similar occurrence. Density-Based Clustering has the maximum minimum separation (1.000), but at the result of worsened inner cohesion and overall structurality, as observed in its very low score in almost all other parameters. K-Means maintains a balanced approach, achieving good compactness and a reasonable separation between the clustering partitions. Pearson’s gamma and Dunn Index both estimate the strength of the cluster assignment ability by looking at the relationship between the distances and the cluster labels. Pearson’s gamma measures the strength of consistency between the clustering and the dissimilarity matrix, with higher values indicating a more consistent association. In this respect, Hierarchical Clustering occupies the first rank with 0.779, followed by K-Means (0.661) and Model-Based Clustering (0.509). The Dunn Index, which considers the ratio of the minimum inter-cluster distance to the maximum intra-cluster distance, ranks Density-Based Clustering first (1.000), followed by Hierarchical Clustering (0.822) and Random Forest Clustering (0.442). However, the Dunn Index results should be compared with other measurements. The high Dunn Index in the case of Density-Based Clustering is negated due to the method's failure in other aspects of the evaluation to produce meaningful and well-separated clusters.
Entropy is a measure of cluster purity or uncertainty, and higher values signify more evenly distributed, and hence less deterministic, cluster allocation. K-Means attains the maximum normalized entropy value of 1.000, indicating well-balanced clusters, whereas Density-Based Clustering is scored at 0.000, probably because it does not succeed in allocating most of the points into clear and useful clusters. Likewise, the Calinski-Harabasz index, a popular internal validity measure that compares the ratio of between-cluster dispersion to dispersion within the cluster, favors K-Means with a perfect normalized value of 1.000. This is a very clear indication that the cluster separation achieved by K-Means is not only geometrically valid but also statistically robust. These performance metrics collectively and reliably identify K-Means Clustering as the optimal algorithm for this dataset. Not only does it attain maximum R² (explained variance), but it also possesses the finest fit trade-offs in the model (AIC and BIC), internal cohesiveness (Silhouette), compactness (Maximum Diameter), and segregation (Min Separation). Additionally, it exhibits the finest clustering structure validity in terms of Pearson’s gamma, Dunn Index, Entropy, and Calinski- Harabasz index. With this well-balanced and high-level performance across all dimensions collectively, the recommendation of K-Means becomes quite strong. By comparison, Fuzzy C- Means, despite its high R², is far weaker in model fit criteria and structural validation indices. This implies that although it has effective capture of variance, the final clusters might be too complex, less sharp, or poorly separated, and hence would be difficult to incorporate into econometric modelling. Hierarchical Clustering and Model-Based Clustering perform only moderately to strongly in the majority of metrics, but not strongly enough to overcome K-Means. Random Forest Clustering performs reasonably well in a few metrics, notably Entropy and Calinski-Harabasz, but does not reveal the overall balance of strengths required for it to be the best choice. Lastly, Density-Based Clustering is weaker in almost all metrics, apart from the Dunn Index and Minimum Separation, but has an insufficient ability to overcome the method’s obvious shortcomings. From a theoretical perspective, the choice of K-Means is also supported by the form of the dataset and the study's objectives. The K-Means algorithm is optimal when globular and similarly sized clusters exist, a realistic assumption in economic data where indicators are scaled and standardized. Moreover, the computation and interpretation of the K-Means make it well-suited for large panel datasets, where replicability and a sharp definition of cluster membership are required for regression modeling in the final steps. In conclusion, the comparative analysis of clustering methods using normalized performance criteria and theoretical suitability clearly indicates that the K-Means Clustering is the most effective method for segmenting nations in this article. Its stable and robust results with respect to varied criteria of assessment ensure that the observed clusters not only possess statistical relevance but also possess distinctive practical applications in the exploration of the relationship between innovation and bank capitalization in Europe.
The K-Means clustering provides a fine-grained investigation of the structural variability of the studied nations, aligning with their innovation patterns and bank capital adequacy ratios. The ten- cluster model identifies varied-sized and internally cohesive segments with relevant center values of key variables that distinguish them, including CAR and innovation indicators. Cluster sizes range from a low of six units (Clusters 3 and 5) to a high of 39 (Cluster 8). The range reflects the diversity of the country profiles and the tendency of K-Means to form unequal clusters when applied to complex economic datasets. Despite the inequality, the silhouette statistics reveal that some of the clusters are well-defined and sharp. Specifically, Clusters 3 and 5 exhibit very high silhouette values of 0.780 and 0.851, respectively, with a display of strong internal cohesion and sufficient separation from other clusters. These are also the only ones with low in-cluster sum of squares (0.975 and 0.827), a factor that implies great homogeneity of the members of the respective clusters. Cluster 1, though quite large with a population of 23 units, has a very low silhouette of only 0.202 and the largest in-cluster variance of 67.618, a factor that suggests it has countries that are less similar and more heterogeneous in profile. When we estimate the center values of each cluster, a few patterns in particular stand out. Cluster 9 has the highest positive center value of CAR (1.624), indicating that the countries within the cluster have significantly higher capital-to-asset ratios than other countries. The cluster also has low negative center values for innovation inputs (INN, TMA, SBIN), a small positive center value for RLP, but shows higher capital adequacy in economies that do not have the profile of innovation-driven economies but that do have medium productivity levels. Clusters 4 and 5 exhibit very low center CAR values (-1.070 and -0.894, respectively), which are consistent with very low innovation indicator scores, such as SBIN, SNI, and INN. These two countries appear to have both low capital cushions and underperforming innovation systems, making them vulnerable to structural financial fragility. Cluster 6, the largest with 36 members, has a positive CAR center (0.648) but a clear negative profile in innovation variables, particularly in the INN and SBIN variables. It suggests that while the countries in them enjoy healthy capital ratios, their innovation systems are quite underdeveloped. It might be more typical of conservative banking industries that exist in low-innovation economies. Cluster 7, with a positive CAR center (0.826), exhibits medium-level positive values for the variables of INN and SBIN, and a more balanced profile between financial health and innovation activity. Cluster 3 is the other outlier: despite its small size and low heterogeneity explained, it contains the top innovation scores in all variables, with particularly high ones in the INN (1.612), SBIN (1.135), and RLP (0.965) variables. While the CAR value is modestly positive (0.236), it is a marker of the countries that are innovational leaders, but certainly not in terms of financial capital or superior performance. Cluster 8, the largest and central- most in terms of size (39), is a compromise between the two. Its CAR center is negative (-0.440), and the innovation indicators are a mixed bag, with high values for the INN and the SNI, but negative values for the RLP and TMA. These countries could well be in the in-between phase of becoming innovative but not yet translated into terms of financial strength or productivity advances. Examining the explained proportion of within-cluster heterogeneity confirms these observations. Clusters 1 and 8 account for the largest shares (0.204 and 0.189, respectively), highlighting their significant contribution to the overall model variance. Clusters 3 and 5, although highly cohesive, contribute minimally to the total variance due to their small size and tight internal structure. Overall, the clustering results reveal the ubiquity of a small number of archetypal country profiles. Some of the clusters comprise financially robust but innovation-poor economies, while others are innovation leaders with medium or weak capital adequacy, and some exhibit low performance in both areas. These patterns are relevant for refining policy interventions. Aides to countries in Clusters 4 and 5 are perhaps necessary to support both the financial robustness and the innovation development ecosystems simultaneously. Clusters such as 3 and 7 suggest that innovation is consistent with healthy capital ratios and offer models for combining economic policy and financial regulation. The high level of detail provided with this exercise in clustering renders possible the achievement of an insightful perspective of the interactions between innovation and bank stability in Europe (Table 7).
The interpretation of K-Means clustering output, based on the values of standardized CAR, innovation indicators, and levels of productivity, generates significant information on how various country groups converge in terms of financial stability as well as innovation performance. Each cluster is characterized by a distinct profile highlighting the level of heterogeneity among the 39 European countries under investigation. Cluster 1 is relatively neutral in terms of bank capital adequacy level, as the value for CAR is below the mean. The cluster is characterized by a moderate negative value in innovation input variables such as INN and SBIN, yet is marked by a very high positive value in SNI, indicating intensive sales from new-to-market or new-to-firm innovations. This is characteristic of countries in this group, which are less involved in internal innovation processes yet proficient in commercializing or replicating new products. However, their low value in RLP implies that the level of their productivity is smaller than average, making it challenging to sustain in innovation-driven growth in these countries. Cluster 2 exhibits a low, though weakly positive, CAR, in line with its weak capital adequacy, although balanced innovation performance is observed. Moderately performing in all innovation input, specifically in RLP, in which it possesses the highest level of all clusters' productivity, a low SBIN score, as being as inert, being negative, suggests that while innovation is not diffused in numerous firms, where it is diffused, efficiency is coupled with high productivity. This group can exemplify countries where product-based innovation has improved productivity, despite low overall adoption. Cluster 3 is the most innovative. As a leader in all three indicators — INN, SBIN, and TMA —this cluster possesses bright and thriving innovation systems. But the moderately positive value for CAR suggests that while innovation is flourishing, this is not necessarily being reflected in sophisticated bank capitalization. This can be a trade-off in which a high intensity of innovation means taking on financial risk, or in which innovative industries are less reliant on traditional bank finance. Cluster 4 is perhaps most interesting. The CAR is lowest among all clusters; thus, we identify important weaknesses in banking sector stability, while indicators of innovation are generally good. TMA and RLP are particularly high, reflecting both high productivity and the production of intellectual properties. This paradox can either mean that innovation is concentrated in countries focused on industries that do not support overall resilience in finance, or that structural problems in the banking sector persist, while the economy otherwise functions very well. Cluster 5 is the worst performing in virtually every dimension. Its CAR is very low, as is its performance in innovation inputs, outputs, and productivity. This cluster may comprise nations that suffer from systemic weaknesses in both finances and innovation systems, and would most benefit from comprehensive structural reforms. Group 6 has moderately high CARs, accompanied by consistently low innovation and productivity indicators. Countries in this group appear to achieve capital adequacy not due to innovative exuberance, but rather through prudent financial practices or reduced risk exposure to high-risk sectors. A prudent approach may maintain short-run stability but can impede long-run competitiveness. Cluster 7 has the highest CAR after Cluster 9 and performs well in INN as well as SBIN, with a moderately negative RLP. Firms in this group have balanced their financial power with the level of firm-level innovation, but they lack corresponding productivity breakthroughs. The presence of negative RLP in countries can indicate levels of inefficiency in translating innovations into production within the economy. Cluster 8 has low CAR, which is, however, accompanied by elevated innovation outputs and inputs. INN and SBIN are particularly very high, as is RLP. This type may consist of countries that have budding innovation systems, but their banks are still unresponsive to the needs of a transformed economy. Cluster 9 has the highest level of CAR compared to all other clusters, but performs weakly in most innovation indicators. It is indicative of countries that possess robust financial buffers but weak innovation participation. Such economies can be risk-averse or mature, or those in which the finance sector has become decoupled from the innovation process. Cluster 10 has low CAR and average values in all other parameters. Its unremarkable but balanced performance can suggest transition economies that are still not differentiating themselves through strengths or weaknesses. Overall, the clustering analysis presents a tapestry of country profiles that capture the complex, often non-linear interaction between innovation capacity and bank capital adequacy. Some nations are successful in combining high innovation with financial strength, whereas others excel in one but not the other. These patterns highlight the value added from using country-specific policies that can address both financial stability and the promotion of innovation-driven growth in parallel (Table 8).
Overall, the K-Means clustering analysis throws intriguing insights into diversification in European nations across their level of financial soundness, as provided by the Bank Capital to Asset Ratio, as well as their profiles in innovation. The ten discovered clusters vary from capital-buffered nations with weak systems in innovation to innovation-intensive nations with low levels of financial resilience. Interestingly, as in the instance in Cluster 3, we find instances of high-order innovation potential without any accompanying increase in CAR, leaving open the question of whether innovation is sufficient to provide any level of financial robustness. Conversely, as exemplified in Cluster 9, we find instances in neat financial systems that seem possibly unconnected to the regime of innovation in the economy. The analysis also suggests a balanced constitution, in that soundness and innovation in finances occur in tandem, but this is somewhat limited. Several of the clusters demonstrate underperformance in both directions, suggesting the potential for weaknesses in structure that could benefit from specialized policy interventions. The latter serves to highlight the importance of constructing conjoint policy designs that promote both innovation capacity and strengthen the finance sector's robustness. Through formalization in collectively similar country profiles, the clustering style brings analytical rigor to the research study while enabling the creation of more nuanced, evidence-based policy recommendations that complement the European policymaking process in economics as well as finance. The multi-dimensional angle employed here is thus perfectly amenable in documenting the complexity in the interaction between innovation and finance.
6. Modeling Financial Resilience Through Innovation Metrics: A Decision Tree Approach
When comparing regression models in terms of normalized performance measures, Decision Tree Regression is the most suitable. This is primarily because perfect performance in the R² indicator, which measures the variance explained by the model, has been achieved. A normalized value of the R² indicator in the form of 1.000 implies that Decision Tree Regression is explaining the highest variation in the dependent variable when compared to all other algorithms under evaluation. Other than that, Decision Tree Regression achieves the lowest achievable values among all error indicators, namely MSE, RMSE, MAE/MAD, and MAPE. These results indicate not only excellent explanatory power but also extremely low prediction error, making this model the most accurate and reliable in this sample. The performance of K-Nearest Neighbors (KNN) and Random Forest Regression is equally stellar. KNN is second overall in performance, with extremely low values for MSE, RMSE, and MAE/MAD, and a very high R² value of 0.734. This balance between accuracy and interpretability makes this one highly competitive, especially in situations where local structure in the dataset is important. Random Forest is equally good, to a large extent, in minimizing scaled error metrics while attaining a very high R² value (0.740). Its predictive error, while low, is not as low as that produced by the Decision Tree, and the model is likely to be computationally more intensive. On the other hand, classical linear models, such as linear regression and regularized linear regression, have less explanatory power, in addition to higher error levels. The R² of these models is extremely low in comparison to tree-based models, reflecting their limited potential to capture the extent of complex associations in the data. Although computationally lean and simple to interpret, these models are deficient in predictive accuracy, making them less relevant to situations where accuracy is crucial. Artificial Neural Networks (ANNs) are performing fairly, delivering reasonable values in all metrics without securing top ranks. The comparative complexity of their nature may not be justified by their performance, especially when their performance can be achieved with less computational cost by using simpler models, such as Decision Tree Regression or Random Forest. The worst-performing are the Support Vector Machines (SVM). They are awarded the maximum normalized values in all error metrics, while achieving the minimum R² value, which correlates to the worst fit and maximum error. This can indicate that the algorithm is ill-tuned to this dataset or intrinsically misfit for the data structure. Boosting Regression falls in the middle ground, exhibiting moderate performance across all parameters. While not superior to Decision Trees, in large datasets, through ensemble behavior, there can still be a gain. However, in this evaluation, performance is not worth prioritizing over superior-performing models that are simpler. Overall, Decision Tree Regression is the superior- performing model in terms of both predictive accuracy and explanatory power, making it the best- suited model for this dataset (Table 9).
The Decision Tree Regression model output is extremely descriptive regarding the relative contributions of innovation and productivity indicators to the Bank Capital to Asset Ratio (CAR) in the observed nations. This is a very good model for obtaining non-linear relationships as well as interactions between predictors; therefore, it is best used when working with very complicated economic datasets, such as the interaction between performance in innovation and resilience in finance. Here, the relative importance of the predictors—INN, TMA, SBIN, SNI, and RLP—was computed, along with their corresponding mean dropout losses, providing a clear indication of the extent to which each predictor contributes to the model's predictability. Among the tested variables, we find that the most important predictor is the sales of new-to-market and new-to-firm innovations (SNI), with a relative importance of 31.334 and a maximum mean dropout loss of 2.829. This result suggests that SNI has a significant impact on levels of bank capitalization. A plausible interpretation is that markets where companies are proactive in commercializing new products tend to possess more vigorous and contestable environments. Such environments may, in turn, affect the exposure to risk as well as the capital adequacy of banks. Higher levels of SNI may then go hand in hand with economies that are actively investing in innovation or adopting new technologies at a rapid pace, both of which can impact the asset structure of financial institutions as well as their capital needs. Following closely in terms of significance to SNI is Resource and Labour Productivity (RLP), with a relative significance of 27.913, while the average dropout loss is 2.458. This significant contribution is indicative of the crucial role that resource use efficiency, as well as labor efficiency, plays in determining the extent to which the level of CAR is achieved. Countries that are more productive will tend to have sounder macroeconomic fundamentals whose influence can increase the borrowers' base of creditworthiness as well as reduce the risk-weighted assets held by banks. As a result, banks in more productively supportive environments will have reduced capital buffers or can more effectively consolidate their asset portfolio towards better capital-to-asset ratios. The trademark application (TMA), with a relative importance of 19.502 and a mean dropout loss of 1.352, is third in influencing CAR. TMA is taken as a proxy for formalized intellectual protection endeavors as well as innovation. Its significance suggests that formal protection instruments for innovation through trademark may provide an indirect contribution towards financial soundness through a more structured and predictable regime for innovation. Such formalization can reduce ambiguity for financial institutions, prompting them to provide more credit and, in turn, influencing capital structure decisions. Innovators (INN) and SMEs introducing business process innovations (SBIN) contribute about equally and comparatively less to CAR, with relative importance values of 10.678 and 10.573, respectively, and comparable dropout losses of 1.219. Despite still being statistically significant, their reduced contribution indicates that broad-based innovation, as an activity within SMEs, as well as internal change in business processes, are possibly less correlated with bank capital adequacy than other, more external, observable, and measurable outputs, such as SNI and TMA. That in turn implies that all innovations may not undergo similar pressures or prospects regarding their finances. Broadly, the Decision Tree Regression results provide the subtle connection between innovation indicators and financial health. Specifically, they indicate that individual innovation outputs, such as new product commercialization and the formal use of IP, are significant in their role in affecting bank capital structure compared to extensive innovation inputs or internal process changes. These are important considerations for policymakers seeking to align innovation strategies with financial sector soundness (Table 10).
The results from the implementation of Decision Tree Regression provide a subtle description of the effect that separate indicators for innovation and productivity have on the predicted values of the Bank Capital to Asset Ratio (CAR) in a few sample observation instances. This type of model, which classifies instances using hierarchical decision rules, is particularly well-suited for learning about non-linear connections and complex interactions among variables, provided that the assumptions relevant to the distribution of the underlying data are relaxed. Here, five predictors (INN, TMA, SBIN, SNI, RLP) are used to predict the value of the CAR magnitude, while the base value (8.526) represents the mean prediction that does not account for the effects of the features. The first case has the highest estimated value of the CAR, at 9.993, which is significantly larger than the base value. The only positive coefficient in this case is that for SNI (1.564), suggesting that sales from new-to-market as well as from new-to-firm innovations are correlated with greater bank capital adequacy. This finding is consistent with previous research on the significance of ordering for the model’s feature importance. Here, countries whose companies are commercially successful when new products are introduced tend to have financially stronger banking industries, perhaps because their companies are more competitive, their revenues are rising, or their credit profiles are stronger, all reasons that can contribute to a stronger capital base among banks in the aggregate. The third and fourth cases have divergent expected CAR values of 6.465 and 8.380, respectively, despite these cases sharing some similar characteristics. The two instances both provide zero values for SBIN and INN, with SNI also yielding negative values, as well as moderately positive or negative values for RLP. The discriminating change lies in the TMA: while case 2 yields no contribution to this indicator, case 3 yields a large positive value, specifically 0.983. This appears to entirely negate the negative contribution from SNI, thereby giving rise to a significantly higher expected CAR. The same is seen in case 4, which is identical to case 3, therefore verifying that the decision rule applied by the tree consistently maps this provided combination to the same solution. This discovery adds to the value of TMA as a promising predictor, in that economies that benefit from higher levels of trademark application — capturing formalized innovation as well as intellectual progress in the field of property — may also benefit from higher confidence in the financial system, as well as from stability.
Case 5 has the maximum estimated value of CAR as 10.719, which is more than two points abovet he base. Here, the motivating factor appears to be that of RLP, whose value is remarkably high at 2.207. This indicates that both resource and labour productivity are primarily responsible for raising the level of capital in banks. Though in this case the SNI is almost zero, the stellar performance in terms of productivity appears to hold good in providing a good outlook for capital adequacy. The indication is that in countries where corporations are efficient in their operations and provide more value per unit of input, banks may find less credit risk, thereby encouraging a healthier capital-to- assets ratio.
Overall, these predictions confirm the theory supporting the inclusion of indicators of innovation and productivity in models of estimated CAR. Decision Tree Regression discriminates effectively between the impact of specific sets of variables on financial resilience, making both interpretability and insight difficult. Complementarity between outputs from innovation is captured in the model, while also illustrating that all innovation inputs are equally consequential. Instead, their influences are dependent on the overall performance profile, as seen in how TMA or RLP can suppress or enhance the effect from poorer innovation signals, such as low SNI or SBIN. The decision tree structure thus makes more nuanced analysis feasible, which helps policymakers as well as financial analysts identify which innovation-based approaches are most closely associated with soundness in the banking industry (Table 11).
The tables display the primary splits made by a Decision Tree Regression model in attempting to predict the Bank Capital to Asset Ratio (CAR) from indicators of innovation and productivity. Each row represents a point where the decision tree splits the information based on a particular predictor, aiming to achieve maximum homogeneity in the resultant subsets. The table presents the number of affected observations, the split point in the predictor’s scale, and the respective model performance gain, likely in terms of reduction in mean squared error. These values provide significant insight into the internal structure of the tree, as well as the relative contribution of each predictor at specified stages.
The most frequent variables to appear in splits are SNI (Sales from new-to-market as well as new-to- firm products), RLP (Resource and labour productivity), and TMA (Trademark applications). This suggests that these predictors provide the most transparent partitioning structure for the dataset, allowing for the creation of meaningful subgroups with heterogeneous CAR outcomes. The reappearance of SNI as a split variable at several levels and threshold values points to its multidimensionality. For example, first appearing with a -0.510 split value, impacting 134 cases, and attaining a medium gain of 0.169. Then, it appeared again with a very large positive value, 2.076, this time in only 77 cases, but achieved a larger gain, 0.244. These two values, one negative, one very positive, suggest that SNI divides low-performing from high-performing environments for innovations and that, in all probability, the link between SNI and CAR is non-linear. Correspondingly, RLP appears in various high-impact splits, one amongst the highest in the tree with a gain of 0.343 at split point 1.155 over 47 observations. This indicates that productivity increases above this threshold are significantly correlated with significant changes in levels of CAR. Another high split appears at RLP = -1.256, over 87 observations, with a large gain of 0.275. These outliers indicate that both low and high levels of productivity are significant in segregating the data, as they are most likely indicative of distinct financial profiles in different national contexts. The splits in TMA are also significant, with two split points in particular: one at 0.631 for 40 observations, which leads to an improvement of 0.279, and another at -0.150 for 26 observations, resulting in an improvement in classification accuracy of 0.233. These results indicate that modest differences in the extent of trademark activity can have a significant impact on classification accuracy in predicting CAR. This aligns with the overall insight that trademark applications can serve as useful proxies for formal innovation outputs, whose distribution can effectively distinguish between countries with more mature or institutionalized systems and those lacking strong intellectual property practices.
These observed improvements range from 0.123 to 0.374, indicating that no single split dominates the model. Rather, the tree creates a cumulative structure of moderately informative splits. The optimal single improvement is provided by partitioning SNI in -0.893 for 37 cases, with a value of 0.374. This is a strong indication that countries with particularly low innovation sales are significantly discriminatory in their ratios of banking capital allocation to others. Generally, the cumulative use of SNI, RLP, and TMA to divide the dataset, combined with the moderate to large improvements obtained in every case, suggests a complex yet interpretable relationship between innovation dynamics, productivity, and bank capitalization. The tree is not founded on any single leading indicator, but rather includes heterogeneous indicators from innovation outputs, economic efficiency, and intellectual property indicators to predict CAR. Overall, this approach offers a data-driven and interpretable method for explaining the variations in national capacities for innovation that are reflected in the banking sector's financial resilience (Figure 2).
Overall, the Decision Tree Regression model exhibits outstanding performance in both predictive accuracy and interpretability in modeling the Bank Capital to Asset Ratio (CAR) from indicators of innovation and productivity. Its ideal R² value, as well as low prediction errors in all measures of performance, affirm that the algorithm is capable of effectively grasping the intricacy of the relationship in the dataset. Furthermore, the investigation into case-level as well as feature importance analysis suggests that sales of innovative products (SNI), trademark activity (TMA), and productivity (RLP) are among the variables that are most instrumental in determining financial resilience. The capacity to manage non-linearity, as well as interaction among variables, creates room for subtle, data-driven inferences that render the tree, in addition to being the most precise model, the most analytically informative when guiding financial and innovation policy in the European setting.
7. Toward Resilient Innovation: Policy Strategies for Balancing Innovation and Financial Stability in Europe
There are several significant policy inferences from this study that have significant relevance to policymakers who seek to balance innovation strategy with macroeconomic prudence across the European economies. The empirical evidence suggests that innovation is multifaceted, with multifaceted impacts on the financial sector. Its impact on bank capitalization, as measured by the Bank Capital to Asset Ratio (CAR), is extremely heterogeneous when considering both the type and level of maturity in innovation activity. Such nuanced interaction requires a corresponding diversified policy approach. First, the negative correlation between innovation inputs—the number of innovators (INN) and trademark application rates (TMA)—and CAR suggests that input-based or early-stage innovation can introduce financial volatility. Policymakers should recognize that innovation promotion is not without risk. High spending levels on R&D or trademark registration will not automatically translate into financial robustness immediately; rather, in cases like these, this will increase levels of risk exposure among banks. This requires a more cautious, risk-aware approach to innovation policy that emphasizes innovation while also internalizing risk protection in the financial sector. Banking regulation, for instance, may be tailored to account for high risk-taking in high- innovation environments, possibly through dynamic capital buffers or risk weights related to innovation.
On the other hand, process innovation among SMEs (SBIN) is strongly correlated with bank capitalization. This means that innovation, when directed towards enhancing efficiency as much as towards improving performance in business, can enhance financial resilience. Policymakers ought, therefore, to pay more attention to the extent as well as direction of innovation in line with quantity. Fostering SMEs towards digital technology adoption, enhancing process efficiency, and operational productivity can yield both economic and financial returns. Innovations funding projects can include eligibility priorities that tax operational efficiency as well as measurable progress in performance. New-to-market or new-to-firm sales (NFI) are negatively related to CAR, highlighting the embedded uncertainty relevant to innovation outputs. Despite these innovations being key to competitiveness, they can also open up market volatility and widen the scope of business risk, which affects capital adequacy and lending behavior among banks. Policymakers are supposed to balance instruments in order to mitigate these risks, e.g., innovation insurance products, special credit guarantees, or co- investment agreements that split risk between private banks and public institutions. These instruments will aid in de-risking innovation for financial institutions, as well as fostering sustainable, high- growth lending to businesses. Productivity (RLP) in the models also has a negative impact on CAR, a finding that may seem puzzling. A reason is that increased productivity is indicative of structural evolutions—e.g., through automation or reduced labor use—that change conventional financial intermediation demands. Banks can react by employing leaner capital structures or diversifying towards non-conventional assets. This means that regulatory systems will need to adapt to keep pace with structural economic restructurings. Financial policymakers should ensure that regulation encompasses new commercial models as well as productivity-enhancing technologies, while still exercising prudent risk management. Furthermore, persistence in the long run in CAR, as observed in the large lagged term in the dynamic model, points to the slow and deliberate nature of capital revisions in banking. Innovation policy must therefore be framed in terms that consider long-term impacts rather than sharp transitions that can destabilize financial institutions. Interaction between innovation agencies and banking regulators is therefore crucial to ensure that the economic transformation proceeds in tandem with the banking industry's capability to manage risk. European innovation policy as a whole requires adopting a multi-sided approach that promotes productive and process-based innovation, is cognizant of the economic risks associated with expansion through novelty, and enhances regulatory flexibility to manage structural change. Institutional linkages between financial supervision and systems of innovation that are strengthened can help to build stronger, future-resistant economies.
8. Conclusions
This article is among the very first to systematically map the complex interaction between innovation dynamics and soundness in finance across European economies with particular reference to the Bank Capital to Asset Ratio (CAR) as an indicator of resilience in banking. Utilizing a rich panel dataset covering all 39 European countries between 2018 and 2025, the research examines how various indicators of innovation, ranging from early-stage innovation inputs to late-stage productivity outputs, impact banks' capital position. The article explores a nuanced and complex interaction between banking resilience and innovation, whose theory-driven outcome is complemented by clear practical significance for economic governance. One of this paper's most significant breakthroughs is that the study separates innovation types from their respective financial impacts. The results consistently show that all innovations produce financial soundness. Indeed, a few indicators of innovation—the percentage of innovating companies (INN), trademark applications (TMA), and sales from new-to-market or new-to-firm product innovations (SNI)—converge with a statistically significant negative impact on CAR. That is, economies in which product or product novelty-focused first-stage innovations are very robust—their innovations are in the first phase of developing their product or product novelty-focused—may end up increasing financial volatility. Banks operating in these environments may need to take on more risk or reduce their capital buffers in pursuit of higher revenues, which can destabilize the financial system. Conversely, the study finds that process innovation in SMEs (SBIN) is positively and significantly related to CAR. This highlights the importance of innovation that enhances working efficiency and business reliability, rather than producing new market outputs. SMEs that invest in process modernization are likely contributing to a better, more stable environment in credits through reduced working risks as well as refined repayment capacity, supporting improved capital structure in banks. This offers some validation to the emerging thinking in the world of innovation policy, which suggests that the quality and orientation of innovation are as important—if not more important—than the intensity of spending on innovations or patent production. Another important finding is regarding the role of productivity (RLP). Interestingly, higher resource and labour productivity is found to have a significant downside correlation with CAR in all model specifications. Whereas productivity gains are overwhelmingly viewed as macroeconomic positives, their downside correlation with bank capital ratios can potentially capture broader structural trends in the economy. As businesses become less capital- intensive and less dependent on traditional sources of production, their financing needs evolve. Banks can respond by revising their asset books, reducing capital buffers, or diversifying into other instruments. These sorts of changes can erode the traditional link between bank capital and real economic output, challenging the orthodoxy around financial regulation in more digitalised and automated economies. The paper also employs good methodological triangulation, utilizing fixed- effects, random-effects, and dynamic panel data models to cross-validate the results. For all models, the lagged indicator of CAR is significant and positive, indicating that levels of CAR in the next period are supported by persistence and path dependence in capital structure decision-making in banking. This is significant because capital adequacy doesn't respond rapidly to economy-wide changes, meaning that both policy interventions and innovation shocks can only gradually impact observable financial performance. Complementing the regression analysis, clustering and machine learning approaches, including K-Means and Decision Tree Regression, provide further insights into cross-country variation and the predictive power of multiple innovation variables. From the clustering exercise, ten diversified innovation-finance profiles are found across European countries, with some profiles exhibiting high CAR and low innovation capacities, while others exhibit the reverse. A striking finding is the emergence of finance-weak but innovation-strong clusters, indicating that innovation is not always conducive to financial strength. What these findings underscore is the value added by context-aware policymaking that tailors interventions to fit the idiosyncratic national economic structure. The Decision Tree model assigns the highest weights to the most powerful predictors of CAR, namely sales of new products (SNI), followed by productivity (RLP) and trademark activity (TMA). The success in capturing nonlinear relationships between variables confirms that the role of innovation in financial soundness is not uniform but varies as a function of specific combinations and thresholds. This, in turn, confirms the regression output and highlights the need to respond to policy variations in innovation paths and finance across Europe. Overall, this paper casts doubt on the conventional thinking that innovation always bolsters economic systems. While innovation remains the foundation of competitiveness and growth, its relationship with bank capitalization—and thus with financial stability—is anything other than unidirectional. The evidence convinces policymakers to use more subtle tools of policy, which vary in form, are biased towards productive change, and include regulatory fine-tuning to finance, to meet new realities in the economy. Only through embracing this multi-dimensional, synchronized approach will Europe simultaneously push innovation forward while safeguarding its financial institutions.
References
- Abuselidze, G. The impact of banking competition on economic growth and financial stability: An empirical investigation. European Journal of Sustainable Development 2021, 10, 203–203. [Google Scholar] [CrossRef]
- Ali, A., Anjum, R. M. A., & Irfan, M. Impact of Exchange Rate Regimes on Financial Stability in Developed and Developing Economies. Advance Journal of Econometrics and Finance 2025, 3, 236–246.
- Banna, H., & Alam, M. R. Impact of digital financial inclusion on ASEAN banking stability: implications for the post-Covid-19 era. Studies in Economics and Finance 2021, 38, 504–523.
- Banna, H., Hassan, M. K., Ahmad, R., & Alam, M. R. Islamic banking stability amidst the COVID-19 pandemic: the role of digital financial inclusion. International Journal of Islamic and Middle Eastern Finance and Management 2022, 15, 310–330.
- Boachie, R., Aawaar, G., & Domeher, D. Relationship between financial inclusion, banking stability and economic growth: a dynamic panel approach. Journal of Economic and Administrative Sciences 2023, 39, 655–670.
- Broby, D. Financial technology and the future of banking. Financial Innovation 2021, 7, 47. [Google Scholar] [CrossRef]
- Corbet, S., Hou, Y., Hu, Y., Oxley, L., & Tang, M. Do financial innovations influence bank performance? Evidence from China. Studies in Economics and Finance 2024, 41, 241–267.
- Daud, S. N. M., Khalid, A., & Azman-Saini, W. N. W. FinTech and financial stability: Threat or opportunity? Finance Research Letters 2022, 47, 102667.
- Del Gaudio, B. L., Porzio, C., Sampagnaro, G., & Verdoliva, V. How do mobile, internet and ICT diffusion affect the banking industry? An empirical analysis. European Management Journal 2021, 39, 327–332.
- Del Sarto, N., Bocchialini, E., Gai, L., & Ielasi, F. Digital banking: How social media is shaping the game. Qualitative Research in Financial Markets 2025, 17, 348–369.
- Elsaid, H. M. A review of literature directions regarding the impact of fintech firms on the banking industry. Qualitative Research in Financial Markets 2023, 15, 693–711. [Google Scholar] [CrossRef]
- Fukuyama, H., & Tan, Y. Implementing strategic disposability for performance evaluation: Innovation, stability, profitability and corporate social responsibility in Chinese banking. European Journal of Operational Research 2022, 296, 652–668.
- Hassan, A. O., Ewuga, S. K., Abdul, A. A., Abrahams, T. O., Oladeinde, M., & Dawodu, S. O. Cybersecurity in banking: a global perspective with a focus on Nigerian practices. Computer Science & IT Research Journal 2024, 5, 41–59.
- Iyelolu, T. V., Agu, E. E., Idemudia, C., & Ijomah, T. I. Legal innovations in FinTech: Advancing financial services through regulatory reform. Finance & Accounting Research Journal 2024, 6, 1310–1319.
- Jarvis, R. , & Han, H. (2021). FinTech innovation: Review and future research directions.
- Junarsin, E. , Pelawi, R. Y., Kristanto, J., Marcelin, I., & Pelawi, J. B. (2023). Does fintech lending expansion disturb financial system stability? Evidence from Indonesia. Heliyon, 9(9).
- Khattak, M. A., Ali, M., Azmi, W., & Rizvi, S. A. R. Digital transformation, diversification and stability: What do we know about banks? Economic Analysis and Policy 2023, 78, 122–132.
- Li, G., Elahi, E., & Zhao, L. Fintech, bank risk-taking, and risk-warning for commercial banks in the era of digital technology. Frontiers in psychology 2022, 13, 934053.
- Lin, C., Liu, S., & Wei, L. Banking and innovation: a review. Journal of Chinese Economic and Business Studies 2023, 21, 143–176.
- Marfo-Yiadom, E., & Tweneboah, G. The role of national culture in financial innovation and bank stability transmission. Cogent Economics & Finance 2022, 10, 2111792.
- Mishchenko, S., Naumenkova, S., Mishchenko, V., & Dorofeiev, D. Innovation risk management in financial institutions. Investment Management and Financial Innovations 2021, 18, 191–203.
- OLALERE, O. E., KES, M. S., ISLAM, M. A., & RAHMAN, S. The effect of financial innovation and bank competition on firm value: A comparative study of Malaysian and Nigerian banks. The Journal of Asian Finance, Economics and Business, 2021, 8, 245–253.
- Ozili, P. K. CBDC, Fintech and cryptocurrency for financial inclusion and financial stability. Digital Policy, Regulation and Governance, 2023, 25, 40–57. [Google Scholar] [CrossRef]
- Risman, A., Mulyana, B., Silvatika, B., & Sulaeman, A. The effect of digital finance on financial stability. Management Science Letters 2021, 11, 1979–1984.
- Safiullah, M., & Paramati, S. R. The impact of FinTech firms on bank financial stability. Electronic Commerce Research 2024, 24, 453–475.
- Stefanelli, V. , & Manta, F. (2023). Digital financial services and open banking innovation: are banks becoming ‘invisible’?. Global Business Review, 09721509231151491.
- Testa, M., D'Amato, A., Singh, G., & Festa, G. Innovative profiles of TQM in banking management. The relationship between employee training and risk mitigation. The TQM Journal 2024, 36, 940–957.
- Varma, P., Nijjer, S., Sood, K., Grima, S., & Rupeika-Apoga, R. Thematic analysis of financial technology (Fintech) influence on the banking industry. Risks 2022, 10, 186.
- Wahab, S., Imran, M., Safi, A., Wahab, Z., & Kirikkaleli, D. Role of financial stability, technological innovation, and renewable energy in achieving sustainable development goals in BRICS countries. Environmental Science and Pollution Research 2022, 29, 48827–48838.
- Xu, R., Guo, T., & Zhao, H. Research on the path of policy financing guarantee to promote SMEs’ green technology innovation. Mathematics 2022, 10, 642.
Figure 1.
Integrated Workflow of Cluster Analysis, Panel Data Models, and Machine Learning Regression.
Figure 1.
Integrated Workflow of Cluster Analysis, Panel Data Models, and Machine Learning Regression.
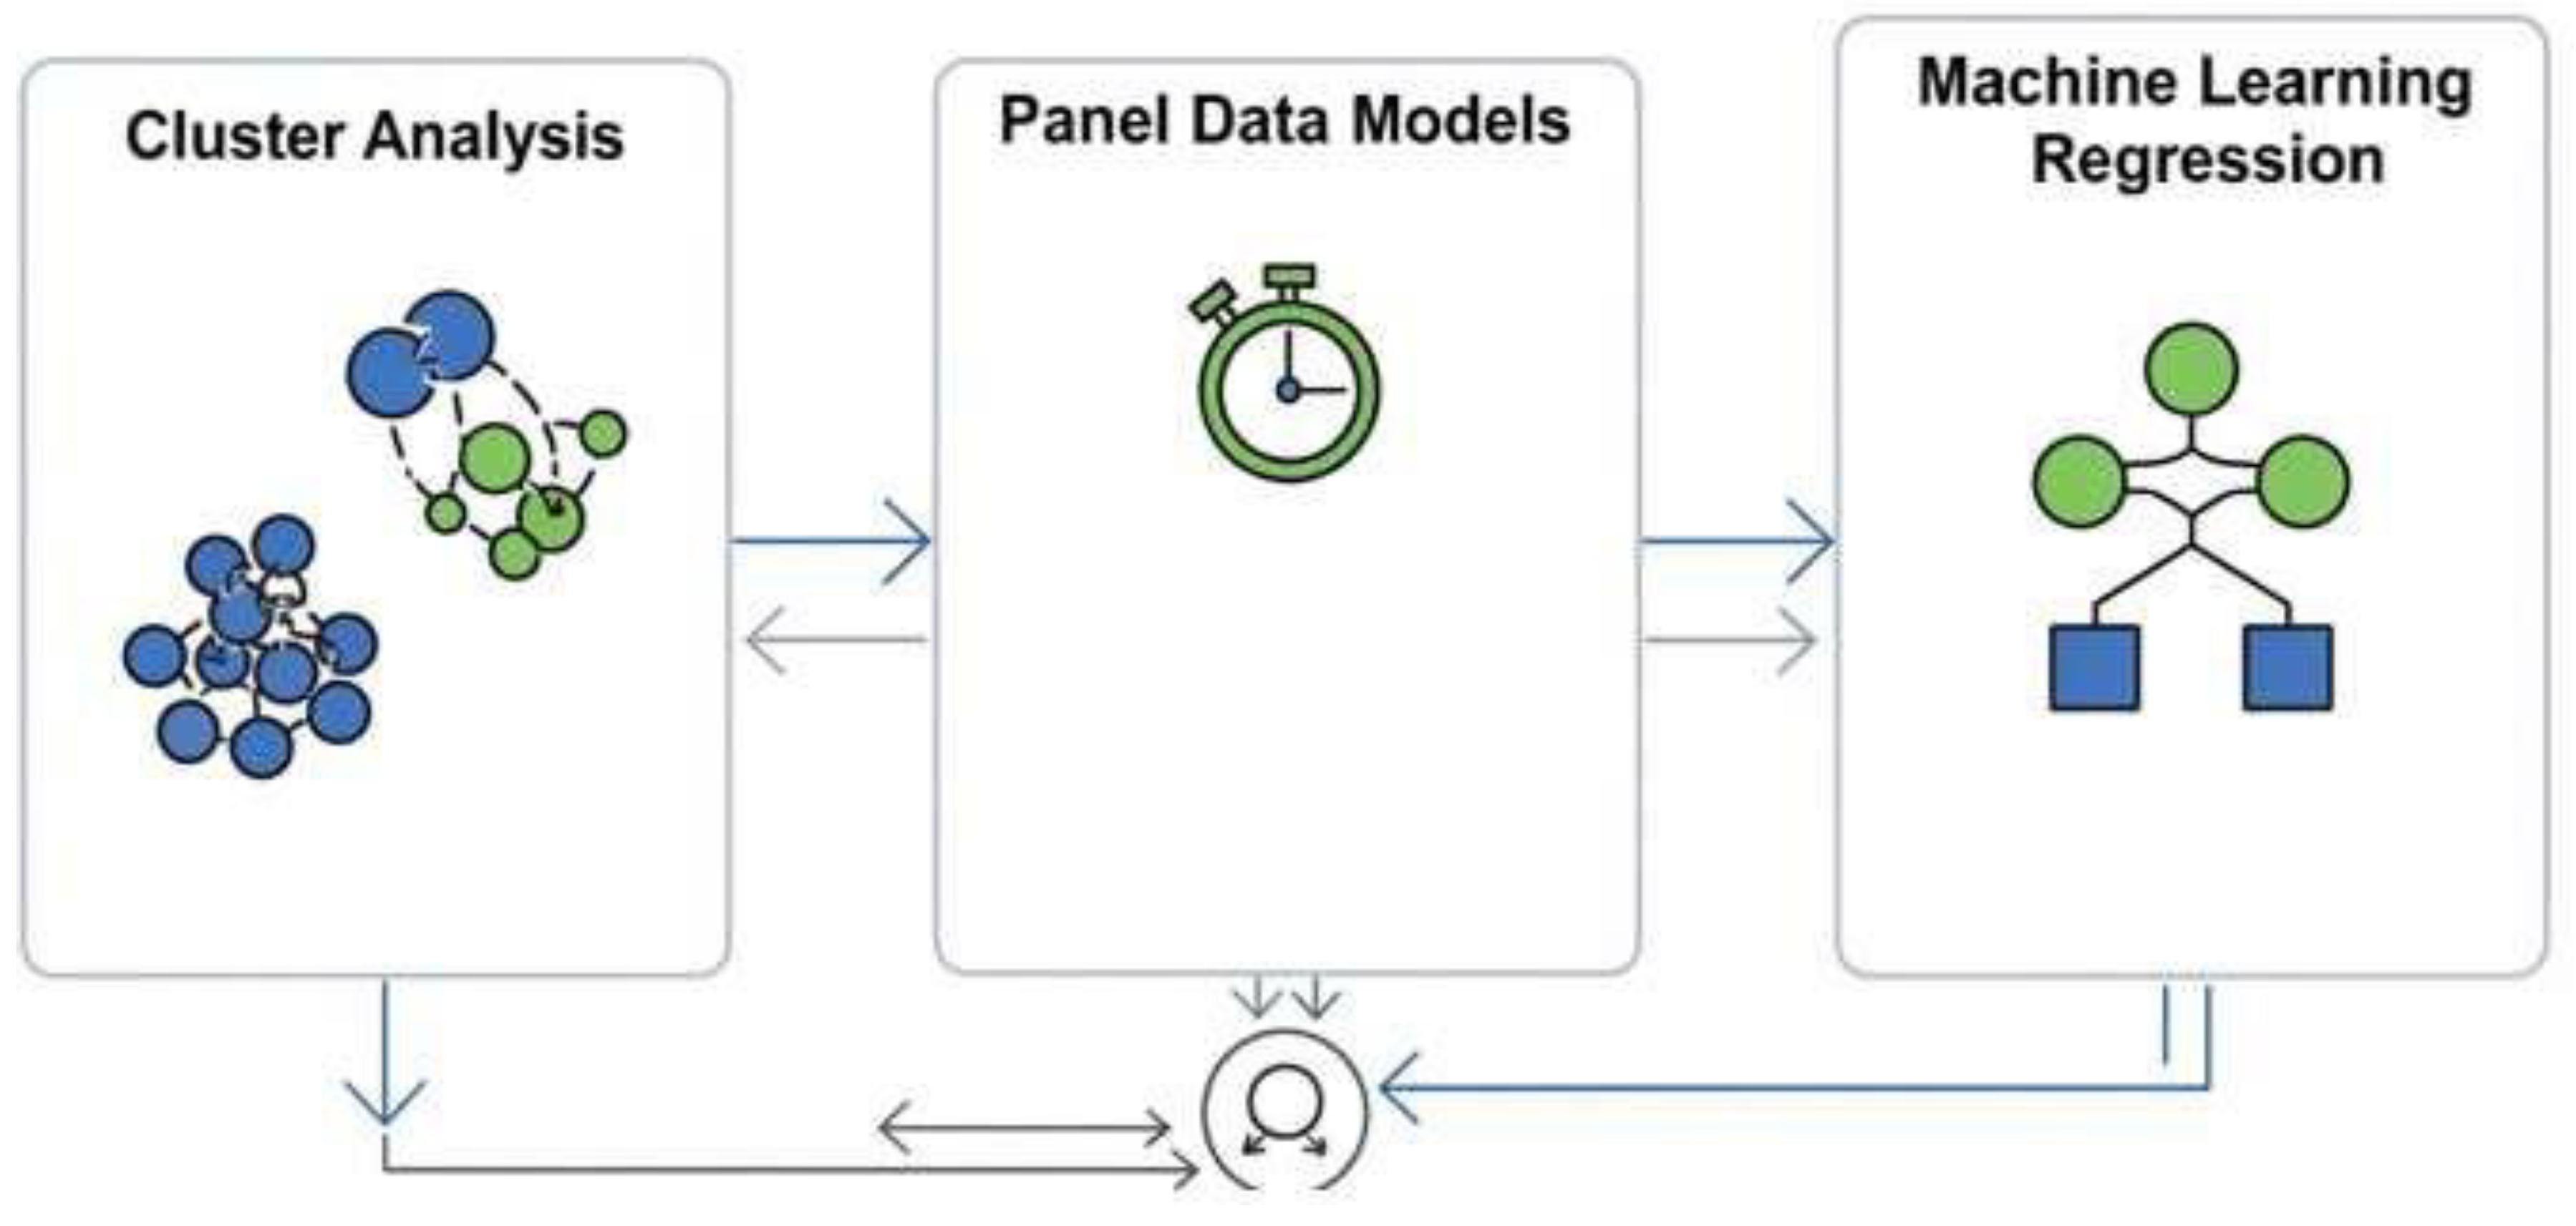
Figure 2.
Decision Tree Visualization with Top Splits and Improvement Scores.
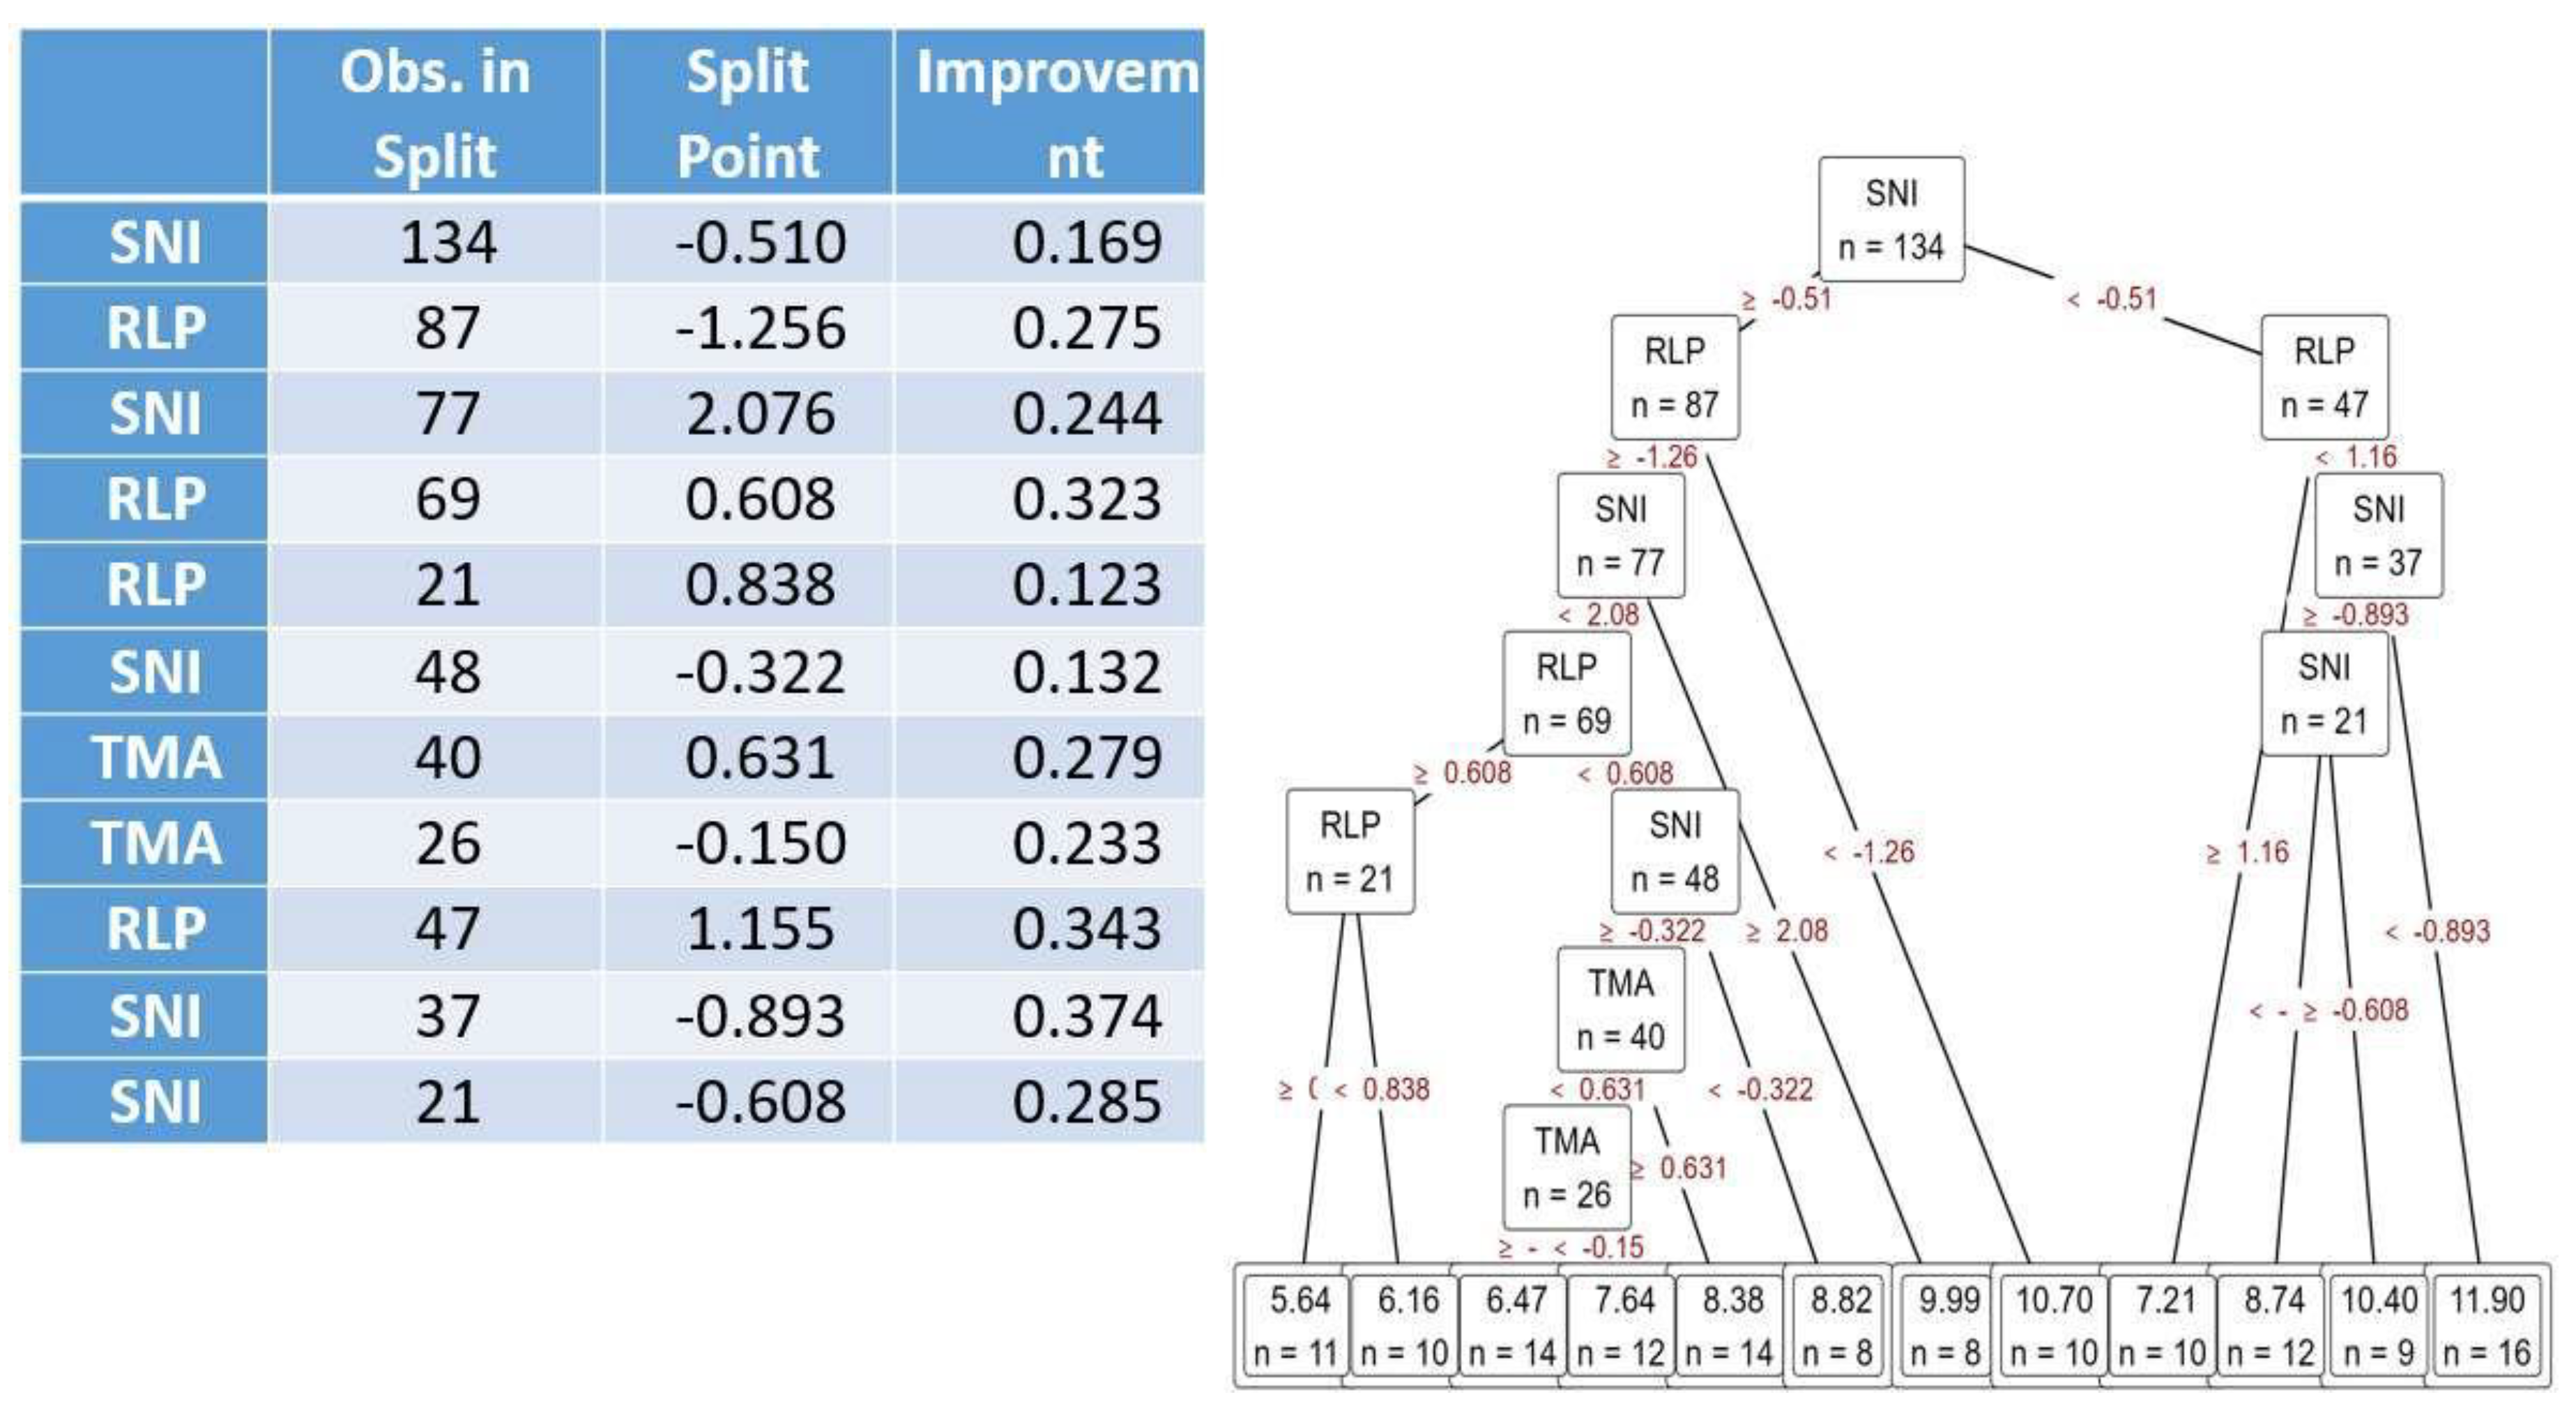

Table 1.
Comparative Synthesis of the Literature on Innovation, FinTech, and Bank Stability: Methods, Findings, and Alignment with This Study.
Table 1.
Comparative Synthesis of the Literature on Innovation, FinTech, and Bank Stability: Methods, Findings, and Alignment with This Study.
| Group of Studies | Representative Authors | Key Methodologies | Main Findings | Critical Comparison with Our Study |
| Innovation, FinTech & Bank Performance | Fukuyama & Tan (2022), Khattak et al. (2023), Safiullah & Paramati (2024), Corbet et al. (2024), Del Gaudio et al. (2021), Varma et al. (2022), Broby (2021) |
Panel regressions, DEA, thematic analysis | Innovation affects performance and stability asymmetrically depending on type and context. | Strong alignment: our study empirically demonstrates that certain innovation outputs (e.g., SNI, RLP) are negatively associated with CAR, confirming the dual nature of innovation found in the literature. |
| FinTech Disruption, Regulation & Risk | Daud et al. (2022), Jarvis & Han (2021), Iyelolu et al. (2024), Li et al. (2022), Junarsin et al. (2023), Mishchenko et al. (2021), Hassan et al. (2024) | Econometric models, case studies, legal/policy analysis | FinTech introduces new systemic risks; regulatory frameworks are critical for mitigating instability. | Our results reinforce these findings: rapid innovation adoption without supervisory adaptation correlates with reduced capital adequacy, highlighting the need for risk- sensitive regulation. |
| Inclusion, Digital Access & Systemic Stability | Banna & Alam (2021), Boachie et al. (2023), Ozili (2023), Wahab et al. (2022), Banna et al. (2022), Xu et al. (2022) | Panel regressions, policy evaluation, mathematical models | Digital inclusion improves stability when backed by structural or institutional support. | While inclusion is not directly modeled in our work, we find that SME process innovations (SBIN) — a form of inclusive internal innovation — are positively related to CAR, supporting similar conclusions. |
| Strategic & Organizational Capabilities | Testa et al. (2024), Elsaid (2023), Del Sarto et al. (2025), Lin et al. (2023), Stefanelli & Manta (2023) |
Reviews, qualitative studies, surveys | Organizational adaptation and employee training strengthen innovation resilience. | Consistent with our findings: process innovation (SBIN) from internal organizational efforts correlates with stronger capital positions, underlining |
| the value of strategic capacity-building. |
||||
| Macroeconomic and Contextual Moderators | Marfo-Yiadom & Tweneboah (2022), Olalere et al. (2021), Abuselidze (2021), Ali et al. (2025) |
Cross-country regressions, cultural/contextual analysis | National culture, competition, and FX regimes influence innovation-stability dynamics. | Our inclusion of fixed effects and regional dummies addresses these contextual moderators, supporting the conclusion that innovation effects on CAR are not uniform across countries. |
Table 2.
Operational definitions of CAR and innovation indicators (INN, TMA, SBIN, SNI, RLP).
| Variable | Definition |
| CAR (Bank Capital to Assets Ratio) | The Bank Capital to Assets Ratio (CAR) is a key measure of capital adequacy that assesses the financial strength and resilience of deposit-taking institutions by comparing Tier 1 capital to total assets. Tier 1 capital, also called core capital, consists of the most stable and loss-absorbing resources, including common equity, disclosed reserves, and retained earnings, alongside certain qualifying instruments under Basel regulations. This capital is considered the highest quality because it is permanent, fully available to absorb unexpected losses, and does not represent obligations that must be repaid. A higher CAR reflects stronger financial stability, ensuring that banks can sustain solvency during economic shocks while maintaining public confidence and fulfilling their role in supporting the wider economy. |
| INN (Innovators) |
This indicator captures the share of enterprises engaged in product, process, marketing, or organizational innovations. It includes both radical and incremental innovations introduced by firms. INN reflects the overall innovation activity within a country’s economy, highlighting the extent to which firms adopt and implement new ideas. |
| TMA (Trademark Applications) |
Trademark applications measure the number of filings for legal protection of brands, goods, or services. Trademarks are an important proxy for intellectual property activity, representing firms’ intent to commercialize and protect innovation outcomes. The indicator reflects the formalization of innovation and market readiness. |
| SBIN (SMEs with Business Process Innovations) |
This indicator captures the proportion of small and medium-sized enterprises (SMEs) that introduce new or significantly improved business processes, such as production methods, supply chain improvements, or digitalization. SBIN reflects efficiency-oriented innovation aimed at increasing productivity and competitiveness. |
| SNI (Sales of New-to- Market and New-to-Firm Innovations) |
SNI measures the share of turnover derived from products newly introduced either to the market or to the firm itself. It highlights the commercial success and diffusion of innovation outputs. SNI is crucial in assessing how innovation translates into economic performance. |
| RLP | This dimension evaluates the efficiency with which economies use natural and human resources. It |
| (Resource and | includes measures of labour productivity, resource productivity, and production-based CO₂ |
| Labour | productivity. RLP reflects structural economic efficiency and its role in sustainable growth. |
| Productivity) |
Note.Source: European Innovation Scoreboard and World Bank.
Table 3.
Descriptive Statistics Summary for CAR, INN, TMA, SBIN, SNI, and RLP Variables.
| CAR | INN | TMA | SBIN | SNI | RLP | |
| Valid | 216 | 312 | 312 | 312 | 312 | 304 |
| Missing | 96 | 0 | 0 | 0 | 0 | 8 |
| Mode | 4.645 | 0.000 | 224.288 | 0.000 | 187.312 | 67.010 |
| Median | 7.921 | 119.845 | 90.956 | 112.845 | 79.551 | 88.402 |
| Mean | 8.355 | 109.695 | 91.824 | 107.473 | 84.144 | 107.317 |
| Std. Error of Mean | 0.162 | 3.033 | 3.199 | 3.099 | 2.515 | 3.512 |
| 95% CI Mean Upper | 8.675 | 115.662 | 98.118 | 113.571 | 89.091 | 114.229 |
| 95% CI Mean Lower | 8.035 | 103.728 | 85.530 | 101.374 | 79.196 | 100.406 |
| Std. Deviation | 2.385 | 53.565 | 56.500 | 54.745 | 44.416 | 61.241 |
| 95% CI Std. Dev. Upper | 2.634 | 58.133 | 61.319 | 59.415 | 48.205 | 66.539 |
| 95% CI Std. Dev. Lower | 2.180 | 49.666 | 52.388 | 50.760 | 41.183 | 56.729 |
| Coefficient of variation | 0.285 | 0.488 | 0.615 | 0.509 | 0.528 | 0.571 |
| MAD | 1.785 | 36.696 | 30.894 | 37.712 | 27.305 | 45.361 |
| MAD robust | 2.646 | 54.406 | 45.804 | 55.912 | 40.482 | 67.252 |
| IQR | 3.683 | 74.279 | 61.501 | 83.133 | 56.146 | 92.977 |
| Variance | 5.689 | 2.869 | 3.192 | 2.997 | 1.972 | 3.750 |
| 95% CI Variance Upper | 6.939 | 3.379 | 3.760 | 3.530 | 2.323 | 44.274 |
| 95% CI Variance Lower | 4.750 | 2.466 | 2.744 | 2.576 | 1.696 | 3.218 |
| Skewness | 0.723 | -0.298 | 0.565 | -0.274 | 0.542 | 0.423 |
| Std. Error of Skewness | 0.166 | 0.138 | 0.138 | 0.138 | 0.138 | 0.140 |
| Kurtosis | 0.091 | -0.601 | 0.222 | -0.612 | 0.052 | -0.627 |
| Std. Error of Kurtosis | 0.330 | 0.275 | 0.275 | 0.275 | 0.275 | 0.279 |
| Shapiro-Wilk | 0.952 | 0.973 | 0.937 | 0.971 | 0.962 | 0.958 |
| P-value of Shapiro-Wilk | < .001 | < .001 | < .001 | < .001 | < .001 | < .001 |
| Range | 11.281 | 220.177 | 224.288 | 218.286 | 187.312 | 251.289 |
| Minimum | 4.645 | 0.000 | 0.000 | 0.000 | 0.000 | 4.124 |
| Maximum | 15.926 | 220.177 | 224.288 | 218.286 | 187.312 | 255.412 |
| 25th percentile | 6.331 | 70.510 | 55.577 | 64.535 | 52.805 | 65.142 |
| 50th percentile | 7.921 | 119.845 | 90.956 | 112.845 | 79.551 | 88.402 |
| 75th percentile | 10.015 | 144.789 | 117.077 | 147.668 | 108.951 | 158.119 |
Table 4.
Covariance and Correlation Matrix of Variables CAR, INN, TMA, SBIN, SNI, and RLP.
| CAR | INN | TMA | SBIN | SNI | RLP | ||
|
Covariance |
CAR | 5.644 | -24.259 | -39.214 | -25.809 | -25.076 | -35.710 |
| INN | -24.259 | 3.092 | 918.859 | 3.026 | 832.323 | 407.326 | |
| TMA | -39.214 | 918.859 | 3.424 | 1.126 | 314.450 | 536.065 | |
| SBIN | -25.809 | 3.026 | 1.126 | 3.172 | 858.566 | 554.167 | |
| SNI | -25.076 | 832.323 | 314.450 | 858.566 | 2.009 | 50.038 | |
| RLP | -35.710 | 407.326 | 536.065 | 554.167 | 50.038 | 3.658 | |
|
Correlation |
CAR | 1.000 | -0.184 | -0.282 | -0.193 | -0.235 | -0.248 |
| INN | -0.184 | 1.000 | 0.282 | 0.966 | 0.334 | 0.121 | |
| TMA | -0.282 | 0.282 | 1.000 | 0.342 | 0.120 | 0.151 | |
| SBIN | -0.193 | 0.966 | 0.342 | 1.000 | 0.340 | 0.163 | |
| SNI | -0.235 | 0.334 | 0.120 | 0.340 | 1.000 | 0.018 | |
| RLP | -0.248 | 0.121 | 0.151 | 0.163 | 0.018 | 1.000 |
Table 5.
Estimation Results for CAR Using Random Effects (GLS), Fixed Effects, and Dynamic Panel Data Models.
Table 5.
Estimation Results for CAR Using Random Effects (GLS), Fixed Effects, and Dynamic Panel Data Models.
|
Random-effects (GLS), using 210 observations Using Nerlove's transformation Included 37 cross-sectional units Time-series length: minimum 2, maximum 6 Dependent variable: CAR |
Fixed-effects, using 210 observations Included 37 cross-sectional units Time-series length: minimum 2, maximum 6 Dependent variable: CAR |
1-step dynamic panel, using 136 observations Included 36 cross-sectional units Time-series length: minimum 1, maximum 4 Dependent variable: CAR |
||||||||
| Coefficient | Std. Error | z | Coefficient | Std. Error | t-ratio | |||||
| const | 14.9235*** | 0.927633 | 16.09 | 16.5927 | 0.902642 | 18.38 | ||||
| INN | −0.0194882*** | 0.00527072 | −3.697 | −0.0174241 | 0.00554645 | −3.141 | −0.0124289*** | 0.00572343 | −2.172 | |
| TMA | −0.0233800*** | 0.00637766 | −3.666 | −0.0319087 | 0.00829740 | −3.846 | −0.0194148** | 0.00971150 | −1.999 | |
| SBIN | 0.0185521*** | 0.00503710 | 3.683 | 0.0179649 | 0.00524846 | 3.423 | 0.0139430** | 0.00523828 | 2.662 | |
| SNI | −0.0113946*** | 0.00359409 | −3.170 | −0.0110795 | 0.00384047 | −2.885 | −0.00778653*** | 0.00343020 | −2.270 | |
| RLP | −0.0313961*** | 0.00532573 | −5.895 | −0.0406619 | 0.00653770 | −6.220 | −0.0365265** | 0.0122734 | −2.976 | |
| CAR(-1) | 0.285091*** | 0.100322 | 2.842 | |||||||
| Statistics | Mean dependent var | 8.430199 | 8.430199 | |||||||
| Sum squared resid | 1576.359 | 78.85641 | 62.00772 | |||||||
| Log-likelihood | −509.6325 | −195.1318 | ||||||||
| Schwarz criterion | 1051.348 | 614.8421 | ||||||||
| rho | 0.237075 | 0.237075 | ||||||||
| S.D. dependent var | 2.375796 | 2.375796 | ||||||||
| S.E. of regression | 2.773005 | 0.685116 | 0.477462 | |||||||
| Akaike criterion | 1031.265 | 474.2636 | ||||||||
| Hannan-Quinn | 1039.384 | 531.0943 | ||||||||
| Durbin-Watson | 1.156668 | 1.156668 | ||||||||
| Tests | 'Between' variance = 10.459 | Joint test on named regressors - | ||||||||
| 'Within' variance = 0.375507 | Test statistic: F(5, 168) = 22.6728 | |||||||||
| mean theta = 0.919458 | with p-value = P(F(5, 168) > 22.6728) = | |||||||||
| Joint test on named regressors - | 2.39297e-17 | |||||||||
| Asymptotic test statistic: Chi-square(5) = | ||||||||||
| 110.508 | ||||||||||
| with p-value = 3.19993e-22 | ||||||||||
| Breusch-Pagan test - | Test for differing group intercepts - | |||||||||
| Null hypothesis: Variance of the unit-specific | Null hypothesis: The groups have a | |||||||||
| error = 0 | common intercept | |||||||||
| Asymptotic test statistic: Chi-square(1) = | Test statistic: F(36, 168) = 53.4471 | |||||||||
| 407.194 | with p-value = P(F(36, 168) > 53.4471) | |||||||||
| with p-value = 1.49612e-90 | = 1.94814e-74 | |||||||||
| Hausman test - | ||||||||||
| Null hypothesis: GLS estimates are consistent | ||||||||||
| Asymptotic test statistic: Chi-square(5) = | ||||||||||
| 14.0123 | ||||||||||
| with p-value = 0.0155317 | ||||||||||
Table 6.
Normalized Evaluation of Clustering Algorithms Based on Internal and External Validity Indices.
Table 6.
Normalized Evaluation of Clustering Algorithms Based on Internal and External Validity Indices.
| Clustering Method | R² | AIC | BIC | Silhouett e | Max Diameter | Min Separatio n |
Pearson's γ | Dunn Index | Entropy | Calinski- Harabasz |
| Density- Based Clustering |
0.000 | 0.000 | 0.000 | 0.000 | 1.000 | 1.000 | 0.000 | 1.000 | 0.000 | 0.000 |
| Fuzzy C- Means Clustering |
0.892 | 0.946 | 0.930 | 0.077 | 0.424 | 0.000 | 0.423 | 0.000 | 0.823 | 0.447 |
| Hierarchic al Clustering |
0.819 | 0.709 | 0.684 | 0.538 | 0.284 | 0.470 | 0.779 | 0.822 | 0.749 | 0.722 |
| Model- Based Clustering |
0.863 | 0.631 | 0.641 | 0.385 | 0.353 | 0.178 | 0.509 | 0.298 | 0.929 | 0.719 |
| K-Means Clustering | 1.000 | 0.410 | 0.518 | 0.692 | 0.221 | 0.212 | 0.661 | 0.397 | 1.000 | 1.000 |
| Random Forest Clustering |
0.831 | 0.726 | 0.716 | 0.308 | 0.355 | 0.302 | 0.434 | 0.442 | 0.942 | 0.610 |
Table 7.
Descriptive Statistics and Centroid Profiles of Clusters Based on CAR, INN, TMA, SBIN, SNI, and RLP Variables.
Table 7.
Descriptive Statistics and Centroid Profiles of Clusters Based on CAR, INN, TMA, SBIN, SNI, and RLP Variables.
| Cluster | 1 | 2 | 3 | 4 | 5 | 6 | 7 | 8 | 9 | 10 |
| Size | 23 | 16 | 6 | 26 | 6 | 36 | 19 | 39 | 18 | 21 |
| Explained proportion within-cluster heterogeneity |
0.204 | 0.081 | 0.003 | 0.099 | 0.002 | 0.166 | 0.105 | 0.189 | 0.087 | 0.065 |
| Within sum of squares | 67.618 | 26.760 | 0.975 | 32.956 | 0.827 | 54.954 | 34.743 | 62.558 | 28.955 | 21.525 |
| Silhouette score | 0.202 | 0.379 | 0.780 | 0.324 | 0.851 | 0.389 | 0.263 | 0.231 | 0.343 | 0.382 |
| Center CAR | -0.024 | -0.093 | 0.236 | -1.070 | -0.894 | 0.648 | 0.826 | -0.440 | 1.624 | -0.824 |
| Center INN | -0.520 | -0.156 | 1.612 | 0.401 | -1.925 | -1.354 | 0.670 | 1.132 | -0.163 | 0.034 |
| Center TMA | -0.350 | 2.153 | -1.156 | 0.251 | -1.473 | -0.381 | -0.802 | 0.665 | -0.629 | -0.135 |
| Center SBIN | -0.537 | -0.061 | 1.135 | 0.334 | -1.864 | -1.407 | 0.492 | 1.234 | 0.063 | 0.050 |
| Center SNI | 1.910 | -0.522 | -0.684 | 0.038 | -1.838 | -0.799 | -0.091 | 0.614 | -0.928 | 0.087 |
| Center RLP | 0.479 | 0.620 | 0.965 | 1.150 | 1.500 | -0.847 | -1.133 | -0.191 | 0.581 | -0.791 |
Table 8.
Standardized Cluster Centroids for CAR, INN, TMA, SBIN, SNI, and RLP Variables.
| CAR | INN | TMA | SBIN | SNI | RLP | |
| Cluster 1 | -0.024 | -0.520 | 0.479 | -0.537 | 1.910 | -0.350 |
| Cluster 2 | -0.093 | -0.156 | 0.620 | -0.061 | -0.522 | 2.153 |
| Cluster 3 | 0.236 | 1.612 | 0.965 | 1.135 | -0.684 | -1.156 |
| Cluster 4 | -1.070 | 0.401 | 1.150 | 0.334 | 0.038 | 0.251 |
| Cluster 5 | -0.894 | -1.925 | 1.500 | -1.864 | -1.838 | -1.473 |
| Cluster 6 | 0.648 | -1.354 | -0.847 | -1.407 | -0.799 | -0.381 |
| Cluster 7 | 0.826 | 0.670 | -1.133 | 0.492 | -0.091 | -0.802 |
| Cluster 8 | -0.440 | 1.132 | -0.191 | 1.234 | 0.614 | 0.665 |
| Cluster 9 | 1.624 | -0.163 | 0.581 | 0.063 | -0.928 | -0.629 |
| Cluster 10 | -0.824 | 0.034 | -0.791 | 0.050 | 0.087 | -0.135 |
Table 9.
Performance Comparison of Regression Models Across Multiple Evaluation Metrics.
| Model | MSE | MSE (scaled) |
RMSE | MAE / MAD | MAPE | R² |
| Boosting Regression | 0.791 | 0.432 | 0.735 | 0.742 | 0.852 | 0.424 |
| Decision Tree Regression | 0.000 | 0.000 | 0.000 | 0.167 | 0.066 | 1.000 |
| KNN | 0.134 | 0.127 | 0.135 | 0.000 | 0.000 | 0.734 |
| Linear Regression | 0.646 | 0.884 | 0.593 | 0.589 | 0.671 | 0.112 |
| ANN | 0.458 | 0.716 | 0.463 | 0.590 | 0.682 | 0.264 |
| Random Forest Regression | 0.226 | 0.125 | 0.300 | 0.340 | 0.129 | 0.740 |
| Regularized Linear Regression | 0.551 | 0.834 | 0.537 | 0.598 | 0.715 | 0.235 |
| SVM | 1.000 | 1.000 | 1.000 | 1.000 | 1.000 | 0.000 |
Table 10.
Relative Importance and Mean Dropout Loss of Predictor Variables.
| Relative Importance | Mean dropout loss | |
| SNI | 31.334 | 2.829 |
| RLP | 27.913 | 2.458 |
| TMA | 19.502 | 1.352 |
| INN | 10.678 | 1.219 |
| SBIN | 10.573 | 1.219 |
Table 11.
Case-Level Prediction Breakdown Showing Feature Contributions Relative to Base Value.
| Case | Predicted | Base | INN | TMA | SBIN | SNI | RLP |
| 1 | 9.993 | 8.526 | 0.000 | 0.000 | 0.000 | 1.564 | -0.098 |
| 2 | 6.465 | 8.526 | 0.000 | -0.931 | 0.000 | -1.232 | 0.103 |
| 3 | 8.380 | 8.526 | 0.000 | 0.983 | 0.000 | -1.232 | 0.103 |
| 4 | 8.380 | 8.526 | 0.000 | 0.983 | 0.000 | -1.232 | 0.103 |
| 5 | 10.719 | 8.526 | 0.000 | 0.000 | 0.000 | -0.014 | 2.207 |
Disclaimer/Publisher’s Note: The statements, opinions and data contained in all publications are solely those of the individual author(s) and contributor(s) and not of MDPI and/or the editor(s). MDPI and/or the editor(s) disclaim responsibility for any injury to people or property resulting from any ideas, methods, instructions or products referred to in the content. |
© 2025 by the authors. Licensee MDPI, Basel, Switzerland. This article is an open access article distributed under the terms and conditions of the Creative Commons Attribution (CC BY) license (http://creativecommons.org/licenses/by/4.0/).
Copyright: This open access article is published under a Creative Commons CC BY 4.0 license, which permit the free download, distribution, and reuse, provided that the author and preprint are cited in any reuse.


