
Submitted:
25 July 2025
Posted:
28 July 2025
You are already at the latest version
Abstract
GATA transcription factors play an important role in plant growth and devel- opment, nutrient metabolism and environmental stress responses. Currently, there are few studies on the gene families of mangrove plants. In this study, bioinformatics methods were used to identify GATA family genes in Acanthus ilicifolius, and their subfamily classification, gene structure and phylogenetic characteristics were analyzed. The structure showed that a total of 95 GATA family genes were identified and divided into 4 subfamilies, and they had GATA conserved functional domains. Analysis of physical and chemical properties showed that its ORF was 231-1653 bp, the number of encoded amino acids was 77-551 aa, and the theoretical isoelectric point was 4.9-10.8. Gene structure and motif analysis showed that GATA genes in the same subfamily maintained consistent gene structure and conserved motifs, and amino acid homology alignment showed that there was a GATA conserved zinc finger domain. Chromosomal localization GATA transcription factors are distributed on 42 chromosomes of Acanthus ilicifolius, and a pair of biosynthetic cluster genes were found in the chromosome 34. Transcript data and qRT-PCR results showed that GATA expression was tissue-specific, GATA expression was strongly induced under high salinity stress, and there was expression was significantly up-regulated in roots at 12 h and significantly expressed in stems at 48 h. These results provide a theoretical and scientific basis for exploring the regulatory functions of GATA gene in the growth and development of Acanthus ilicifolius.
Keywords:
mangroves
; Acanthus ilicifolius
; GATA
; transcription factors
; expression pattern
; salinity stress
1. Introduction
Transcription factors (TFs) are a diverse class of protein that play crucial roles in regulating gene expression by binding to cis-regulatory elements in promoter regions or forming transcriptional complexes to modulate gene activation or repression [1,2]. In eukaryotic plants, transcriptional regulation is tightly associated with cis-regulatory elements, including promoters, enhancers, and silencers, which orchestrate the spatial and temporal expression of genes [3]. TFs are central to plant growth and development, regulating plant cell differentiation, physiological metabolism, signal transduction and other functions [4,5]. Based on their structural and functional characteristics, TFs are classified into several families, including bHLH, AP2/ERF, SPL, Bzip,and others [6,7].
GATA TFs are widespread regulators in eukaryotes and are evolutionarily conserved in animals, fungi and plants [8,9]. GATA transcription factor family is characterized by its highly conserved zinc finger domains, which specifically binds to the consensus T/A-GATA-A/G sequence in the promoter region [9,10]. This domain comprises one or two conserved CX2-CX17-20-C-X2 motifs and a DNA-binding region [11].The conserved structure of GATA TFs varies across kingdoms—CX17 in fungi, and CX18 or CX20 in plants [3,12]. In angiosperms, GATA TFs can be divided into four major classes and seven structural subfamilies [8,13]. The first GATA TFs in plants, NTL1, was identified in tobacco in 1993. In recent years, multi-species GATA gene families have been systematically identified, including model plant Arabidopsis thaliana (29 members) and rice (Oryza sativa, 28 members) [14]. Similarly, GATA TFs have been described in economically and ecologically significant crops such as soybean (Glycine max) [15,16], sorghum (Sorghum bicolor) [16], pepper (Capsicum annuum) [17], and peanut (Arachis hypogaea) [18]. More recently, genome-wide studies have further expanded the catalog of GATA TFs in economic crops and woody plants, including Wolfberry (Lycium Barbarum L.) [19], wheat (Triticum aestivum) [20], cucumber (Cucumis sativus) [21], cotton (Gossypium genus) [22], and poplar (Populus) [23]. These studies demonstrated the existence of species specificity in the GATA family and are important in revealing the contribution of gene duplication events and subfunctionalization to family expansion [24,25].
In higher plants, GATA TFs have been implicated in diverse biological processes, including growth and development, stress responses, hormone signaling and metabolic regulation. Among the most extensively studied GATA TFs are GNC and GNL in A. thaliana, which modulate key hormonal pathways involving auxin, cytokinin, brassinosteroids, and gibberellins [26,27]. These TFs regulate processes such as chloroplast development, carbon-nitrogen metabolism, starch biosynthesis, light-mediated morphogenesis, flowering, and senescence [28,29,30]. In rice, specific GATA family members, such as SNFL1, influence leaf morphology [30], while CGA1 regulates chloroplast development through hormone-responsive pathways and photomorphogenesis [31]. GATA TFs plays other key roles in abiotic stresses such as salt, drought, and osmosis. Rice GATA TFs, such as OsGATA23a, OsGATA16, and OsGATA12, have been shown to respond to salt stress, drought, and hormonal stimuli such as abscisic acid (ABA) and jasmonic acid (JA) [31,32,33]. Potato GATA TFs respond to salt stress [34,35], and wheat GATA TFs are involved in salt and drought tolerance regulation [21]. GATA gene expression was also induced by hormones such as salicylic acid (SA), methyl jasmonate (MeJA) and abscisic acid (ABA) [36]. In conclusion, these studies mentioned above have demonstrated the critical roles of GATA TFs in plant development, nutrient metabolism, hormone crosstalk and stress tolerance. Despite their significance, there is still much to uncover regarding the specific roles and regulatory mechanisms of GATA TFs in different plant species. Mangroves, a unique group of plants thriving in intertidal zones, are vital for coastal ecosystems, providing services such as climate regulation, shoreline stabilization, and biodiversity conservation [37]. However, the degradation of mangrove forests leads to reduced ecological benefits, including diminished resilience to natural disasters such as tsunamis and tropical storms [38,39]. Acanthus ilicifolius L., a true mangrove species belonging to the Acanthaceae family, represents a key component of mangrove ecosystems. This upright shrub, typically found in high intertidal zones and areas influenced by tidal rivers, exhibits remarkable physiological and structural adaptations to saline and inundated environments [40,41]. Despite its ecological importance, the molecular mechanisms underpinning its stress tolerance, particularly the roles of TFs such as the GATA family, remain poorly understood.
To date, the GATA gene family has not been systematically characterized in A. ilicifolius or other mangrove species. This study aims to address this gap by performing a comprehensive genome-wide analysis of GATA TFs in A. ilicifolius. We identified and characterized GATA family members, focusing on their physicochemical properties, chromosomal distribution, gene structure, conserved motifs, promoter cis element analysis and phylogenetic relationships. Furthermore, we analyzed the expression profiles of GATA genes under different salinity stress conditions across various tissues to identify candidate TFs associated with salinity tolerance. This study provides valuable insights into the molecular basis of stress adaptation in mangrove plants and identifies key regulatory genes that may be harnessed to enhance stress resilience in other plant species.
2. Materials and Methods
2.1. Experimental Materials, Design, and Processing Methods
In the study, six-month-old A. ilicifolius seedlings were used as test materials, taken from the Tong-ming river in Zhanjiang, Guangdong province (20°59’19” N, 110°09’33” E), with an average plant height of 8-9 cm. The seedlings were cleaned and placed in a hydroponic box for 15 days, and were subjected to salt stress treatment with solutions with salinity of 4.5 ‰ and 13.5 ‰, respectively. Each treatment consisted of 5 replicates. Root, stem, and leaf tissues were collected respectively, treated for 12 h and 48 h. Each combination treatment used for transcriptional expression analysis was mixed into a pooled sample according to equal mass, with three or more replicates. And the tissue samples were quickly put into liquid nitrogen and stored at -80℃.
2.2. Screening and Physicochemical Properties Analysis of the GATA Gene Family
Based on the transcriptome data obtained by the research team in the previous treatment of different experimental groups of A. ilicifolius (Table S1), the physical and chemical property parameters of A. ilicifolius GATA protein were mapped and predicted through the Exasy website (https://web.expasy.org/protparam/, access on 7 January 2025) to predict its amino acid number, molecular weight, theoretical isoelectric point, protein stability index and other information, and the software Wolf PSORT (https://wolffpsort.hgc.jp/, access on 7 January 2025) was used to analyze and predict the subcellular localization of GATA protein, and SOMPA predicted the secondary structure (Table S2).
2.3. Analysis of GATA Gene Structure, Conserved Domain, and Motif
The GATA gene structure is predicted online through the GSDS (http://gsds.cbi.pku.edu.cn, access on 9 January 2025). The conserved domains were predicted and analyzed using the online software Pfam and NCBI’s CDD-search (https://www.ncbi.nlm.nih.gov/cdd, access on 20 January 2025) to screen protein sequences containing the GATA protein domain. Conservative motifs use the MEME suite (meme-suite.org/meme, access on 11 February 2025) online prediction Motif module, set the number of motifs to 10, and other parameters are the default, detect the conserved domain units of the GATA gene, and use TBtools software to visually analyze the above results.
2.4. GATA Phylogeny and Amino Acid Homology Alignment
Through the TAIR (http://www.arabidopsis.org/, access on 14 February 2025) and RAPDB (https://rapdb.dna.affrc.go.jp/, access on 14 February 2025), the GATA TF gene sequence data of A. thaliana and Oryza sativa were obtained, respectively. ClustalW in MEGA11 software was used for multiple sequence alignment, the evolutionary tree was constructed by the N-J method (bootstrap method set to 1000, P-distance model), and then the evolutionary tree was modified and beautified using the online tool iTOL (http://itol.emb.de/, access on 17 February 2025). The conserved structural domains of GATA TFs of different subfamilies were visualized, the amino acid sequence of GATA family proteins was compared through MGEA software, and the output files were imported into DNA-man software to obtain visualization results.
2.5. Prediction and Analysis of Cis-Acting Elements in GATA Promoter
The 2 kb region upstream of the GATA transcription factor family gene was used as its promoter region. The promoter sequence was extracted using TBtools software, and the extracted sequence file was then uploaded to the PlantCARE website (http://bioinformations.psb.ugent.be/webtools/plantcare/html/, access on 16 May 2025). Finally, the prediction result file is visualized in TBtools software.
2.6. Heat Map Analysis of GATA Gene Expression
The roots, stems, and leaves of A. ilicifolius tissues with salinity of 4.5 ‰ and 13.5 ‰ were collected respectively, total RNA was extracted for RNA-seq sequencing, and the transcriptome library was sequenced using the Illumina Novaseq 6000 system to obtain high-quality raw data in FASTQ format. The data were quality-controlled and evaluated. Using the DESeq2 tool to calculate differentially expressed genes, using the FPKM value as a criterion for gene expression levels, screening differentially expressed genes DEGs with FDR < 0.05, log2FC > 1, and < 1, and using TBtools software to draw a gene expression heat map.
2.7. RNA Extraction and cDNA Synthesis
A 0.1 g tissue sample was placed in liquid nitrogen for quick freezing, quickly ground, and total RNA was extracted using a one-step plant RNA extraction kit (Sangon, Shanghai, China). The integrity of the total RNA was detected by 1% agarose gel electrophoresis. The OD value of the RNA was detected by a spectrophotometer, and the reverse transcription kit (TOYOBO, Shanghai, China) was used for reverse transcription to obtain cDNA. qPCR-specific primers (Table S3) were designed using Primer 5 and synthesized by Shenzhen Hua da Biotechnology Co., Ltd. Subsequently, the cDNA product was diluted proportionally and used as a template for qRT-PCR.
2.8. Real-Time Quantitative PCR (qRT-PCR)
Using actin as the internal reference gene, fluorescent quantitative PCR analysis was carried out using SYBR green qPCR SuperMix (TransGen, Beijing, China). The reaction system was 1.0 μL template cDNA, 10 μL SYBR Master Mix premix, 0.5 μL upstream primers and downstream (10 μmol/L), 8 μL ddH2O, and the total system was 20 μL. qPCR was performed using CFX96 PCR (Bio-Rad, Hercules, CA, USA), with 3 independent biological replicates set up in each group. The relative expression of genes was calculated using the 2-ΔΔCt method, 4.5 ‰ salt treatment was used as the control group, and 13.5‰ salt treatment was used as the treatment groups.
2.9. Interaction Network of GATA Transcription Factors
The interaction network analysis of the GATA family of A. thaliana was carried out through the STRING (https://cn.string-db.org/, access on 14 May 2025), and AI software was used for image processing and beautification.
2.10. Data Statistics and Analysis
Microsoft Excel 2019 software is used for data entry and statistical analysis. Analysis of variance (ANOVA) was performed using SPSS 26.0. A histogram was drawn using GraphPad Prism 7.0 software for qPCR, and the results were expressed as mean ± standard deviation (SD).
3. Results
3.1. Physical and Chemical Properties Analysis of GATA Transcription Factors
Through BLAST analysis, 95 members of the GATA transcription factor family were identified in the in the A. ilicifolius genome (Table S1). Analysis of the physical and chemical properties revealed that the open reading frame (ORF) lengths of these transcription factors ranged from 231 to 1653 bp, encoding proteins with lengths varying from 77 to 551 amino acids. Notably, the smallest protein, encoded by Ail10G008670 (AilGATA23), consists of 77 amino acids, whereas four genes Ail11G014140 (AilGATA28), Ail23G014400 (AilGATA47), Ail35G012750 (AilGATA78), and Ail47G014800 (AilGATA94)—encode proteins exceeding 500 amino acids, with molecular weights reaching approximately 61 kDa.
The theoretical isoelectric points of the GATA proteins spanned a wide range 4.9–10.8, reflecting significant bipolar differences. In terms of stability, nine proteins were relatively conserved, while the remaining proteins exhibited low stability. The least stable protein, encoded by Ail23G005320 (AilGATA43), demonstrated an instability index of 91.25, indicating conformational instability and potential functional diversity. Regarding hydrophilicity, all proteins were classified as hydrophilic. Secondary structure predictions (Table S2) reveal distinct physicochemical properties within the GATA protein family, suggesting that these variations may result from evolutionary diversification among GATA subfamilies or functional adaptations to distinct regulatory roles.
3.2. Prediction and Analysis of GATA Gene Structure, Conserved Motifs, and Conserved Domains
The gene structures, conserved motifs, and functional domains of the GATA transcription factor family in A.ilicifolius were analyzed using TBtools software (Figure 1). Phylogenetic analysis of all GATA transcription factors revealed the presence of four distinct subfamilies. Subfamily I comprises 44 genes, each containing two or three exons, with the second exon near the 3’ end encoding a zinc finger structure characterized by a CX₂-CX₁₈-CX₂-C motif with 18 residues. Subfamily II includes 46 genes with either two or three exons, also featuring a zinc finger loop containing 18 residues. Subfamily III contains one genes with eight exons, and its amino acid terminus is associated with a structural domain bearing the CX₂-CX₁₈-CX₂-C zinc finger superfamily motif. Subfamily IV consists of four genes, each with seven exons, and exhibits a zinc finger structure with 20 residues (CX₂-CX₂₀-CX₂-C) located in the fifth exon region. Additionally, this subfamily contains a conserved CCT and titf structural domain, which, according to BLAST-based predictive analysis, may regulate flowering cycles in plants. The results of the conserved motif analysis are presented in Figure S1.
3.3. Phylogenetic Evolution and Conservative Structural Domain Analysis of GATA
Transcription factor (TF) families play crucial roles in gene regulation, with their functions primarily mediated by conserved structural domains. These domains, preserved across species, are essential for recognizing specific DNA sequences and ensuring precise transcriptional regulation [42,43]. To classify and characterize TF families, amino acid homology analysis serves as a critical tool. This method not only elucidates evolutionary relationships and conserved functional elements but also aids in distinguishing TF subgroups, thereby providing valuable insights into the functional diversification and evolutionary divergence of TFs across various species [13,44].
In this study, sequences of the GATA transcription factor family in Oryza sativa and A. thaliana were analyzed (Figure 2). Phylogenetic results revealed that GATA transcription factors in A. ilicifolius are categorized into four subfamilies. Among these, the Class II subfamily exhibited the highest number of members, comprising 46 GATA transcription factors, followed by Class I with 44, Class IV with 4, and Class III with only 1 member. This phylogenetic distribution was consistent with the classification observed in rice and Arabidopsis. Furthermore, amino acid homology analysis confirmed the presence of the conserved GATA functional domain (CX2-CX18-CX2), indicative of its functional conservation in A. ilicifolius. This conserved domain underscores its role as a transcription factor in this species. The results of the amino acid homology comparison are presented in Figure S2.
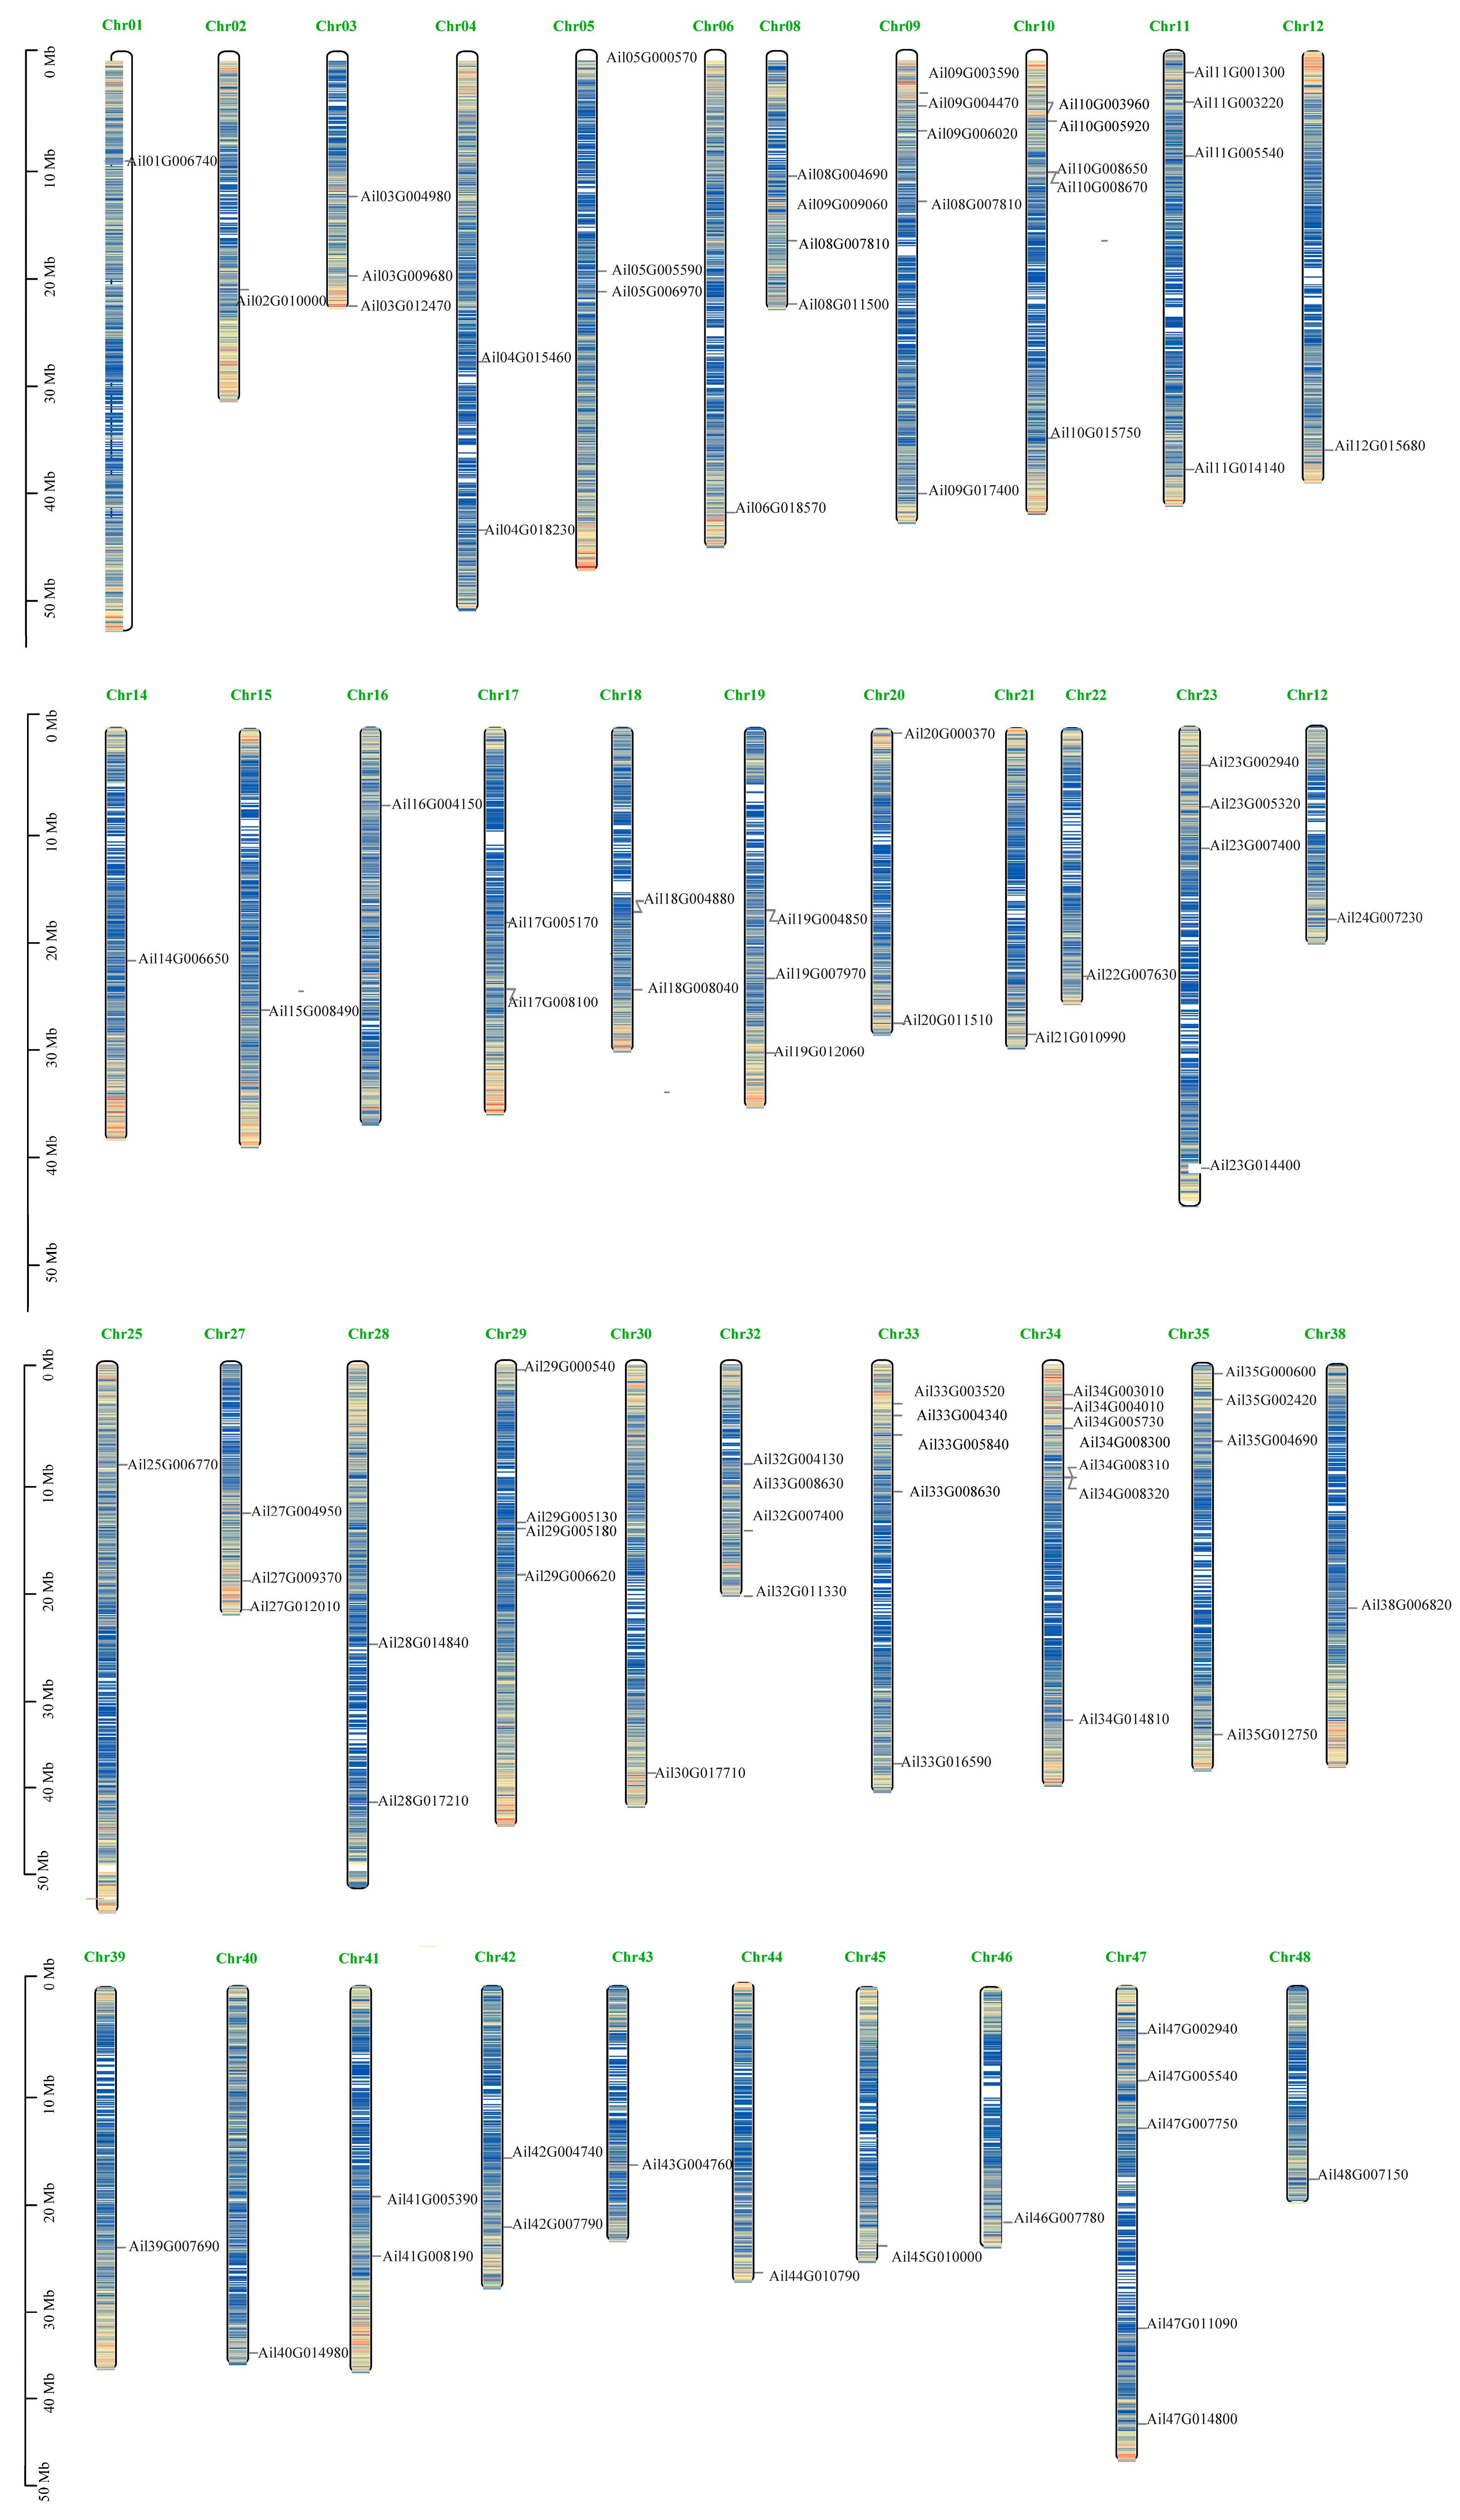
3.4. GATA Chromosome Location Analysis
The positional distribution of these 95 GATA transcription factor genes on A. ilicifolius chromosomes was analyzed (Figure. 3). The results showed that GATA transcription factors were distributed on 42 chromosomes. Among them, one GATA transcription factor was distributed on chromosome 21, two on chromosome 7, three on chromosome 6, four on chromosome 4, five or more on chromosome 5, and the highest number of transcription factors was seven on chromosome 34. Among these, Ail34G008300, Ail34G008310 and Ail34G008320 form biosynthetic clusters, indicating that GATA transcription factors have undergone genome-wide replication and evolution in A. ilicifolius. This evolutionary process indicates that GATA transcription factors play roles in stress responses, ion transport, signal transduction, and energy metabolism pathways, with their functions preserved through replication.
Figure 3.
Chromosomal distribution of GATA family.
3.5. Analysis of Homeopathic Regulatory Elements in the GATA Promoter
The 2 kb region upstream of GATA transcription factor was extracted for predictive analysis of promoter cis-elements. As a result, in addition to core regulatory elements, a total of 10 representative cis-acting elements were identified (Figure 4A). Among them, the number of light-responsive elements was the largest, followed by anaerobic and meristematic expression elements. There are also 4 GATA genes with seed-specific expression elements. In addition, the GATA promoter has regulatory elements that respond to multiple hormones, including 42 genes with ABA-response elements, 16 genes with auxin response elements, 32 genes with gibberellin response elements, 25 genes with MeJA-response elements, and 22 genes with salicylic acid response elements. Venn diagram results show that the GATA promoter region mainly contains growth and development, hormone response elements and stress response elements, and the growth and development elements mainly include light responsive elements, zein metabolism regulation, circadian control, endosperm expression and meristem expression. Hormone responsive elements mainly include auxin, gibberellin, MeJA, salicylic acid and abscisic acid element etc. Stress response components are mainly defense stress, anaerobic induction, low temperature and drought inducibility element (Figure 4B). The above results comprehensively show that there are multiple regulatory response elements in the GATA promoter regulating plant growth and development and responding to exogenous hormones, providing important ideas and directions for in-depth research on the function of GATA transcription factors.
3.6. GATA Expression Heatmap Analysis
A two-factor experimental design was implemented to study the effects of salt and flooding stress on A. ilicifolius. The treatments included two types of waterlogging (whole-plant waterlogging and root waterlogging) and two salinity concentrations (4.5 ‰ and 13.5 ‰). The tissue samples were collected from the roots, stems, and leaves samples after 12 and 48 h streess treatment for RNA-seq sequencing analysis, respectively. The expression data of GATA gene family were further extracted, and the FPKM values of different samples were log2(FPKM) normalized to generate a heatmap of differentially expressed genes (DEGs) (Figure 5). The results showed that the differential gene expression levels of GATA in various tissues were significantly up-regulated after 12 h high salinity treatment. Specifically, 10 genes were significantly up-regulated in roots and stems, 17 genes in leaves, while 15 genes were significantly down-regulated in roots and 2 genes in stems. After 48 h of high salinity treatment, the expression levels of GATA genes in all tissues were either down-regulated or suppressed under high salinity. This trend suggests that prolonged exposure to high salinity induces salt ion toxicity, which negatively impacts plant growth and development.
3.7. Venn Diagram of GATA Differentially Expressed Genes
Venn diagram analysis of GATA DEGs revealed distinct expression patterns under salt stress. After 12 hours of treatment, 12 GATA DEGs were downregulated in roots, stems, and leaves, while only 1 DEG was upregulated. In contrast, after 48 hours of treatment, 8 DEGs were upregulated, and 6 were downregulated. These results indicate that gene expression was initially suppressed within the first 12 hours of salt stress, leading to an increase in downregulated DEGs. However, after 48 hours, the plant responded more actively to the high-salinity environment by mediating multiple stress-response pathways (Figure 6).”
3.8. qPCRAnalysis of Differential Gene Expression in GATA Under Salt Stress
6-month-old A. ilicifolius seedlings (approximately 8–9 cm in height) were used as plant materials. The roots of the seedlings were subjected to flooding treatments with 4.5 ‰ low salinity and 13.5‰ high salinity, and root, stem, and leaf tissues were collected for RT-qPCR analysis after 12 and 48 hours of salt treatment, respectively. Eight GATA family genes were selected for RT-qPCR analysis (Figure 7).
The results showed that the expression levels of GATA genes increased in roots but decreased in leaves and stems after 12 h salt treatment. This suggests that GATA gene expression in root tissues is transiently induced under high salt stress, enabling the roots to absorb high concentrations of exogenous salt ions. After 48 h salt treatment, only three genes remained upregulated in roots, among which Ail42g007790 showed significant and sustained upregulation. This indicates that Ail42g007790 may be a key transcription factor involved in salt tolerance regulation, warranting further functional validation through in-depth experiments. In contrast, the expression levels of the other five genes were suppressed.
In leaves, GATA gene expression was consistently downregulated, while in stems, it was significantly upregulated. This suggests that high concentrations of salt ions absorbed by the root tissues are transported upward through vascular tissues to the aerial parts of the plant. In summary, these experimental results reveal a critical mechanism by which A. ilicifolius responds to salt stress, highlighting the involvement of GATA transcription factors in salt tolerance regulation. This finding has significant implications for understanding plant salt tolerance mechanisms.
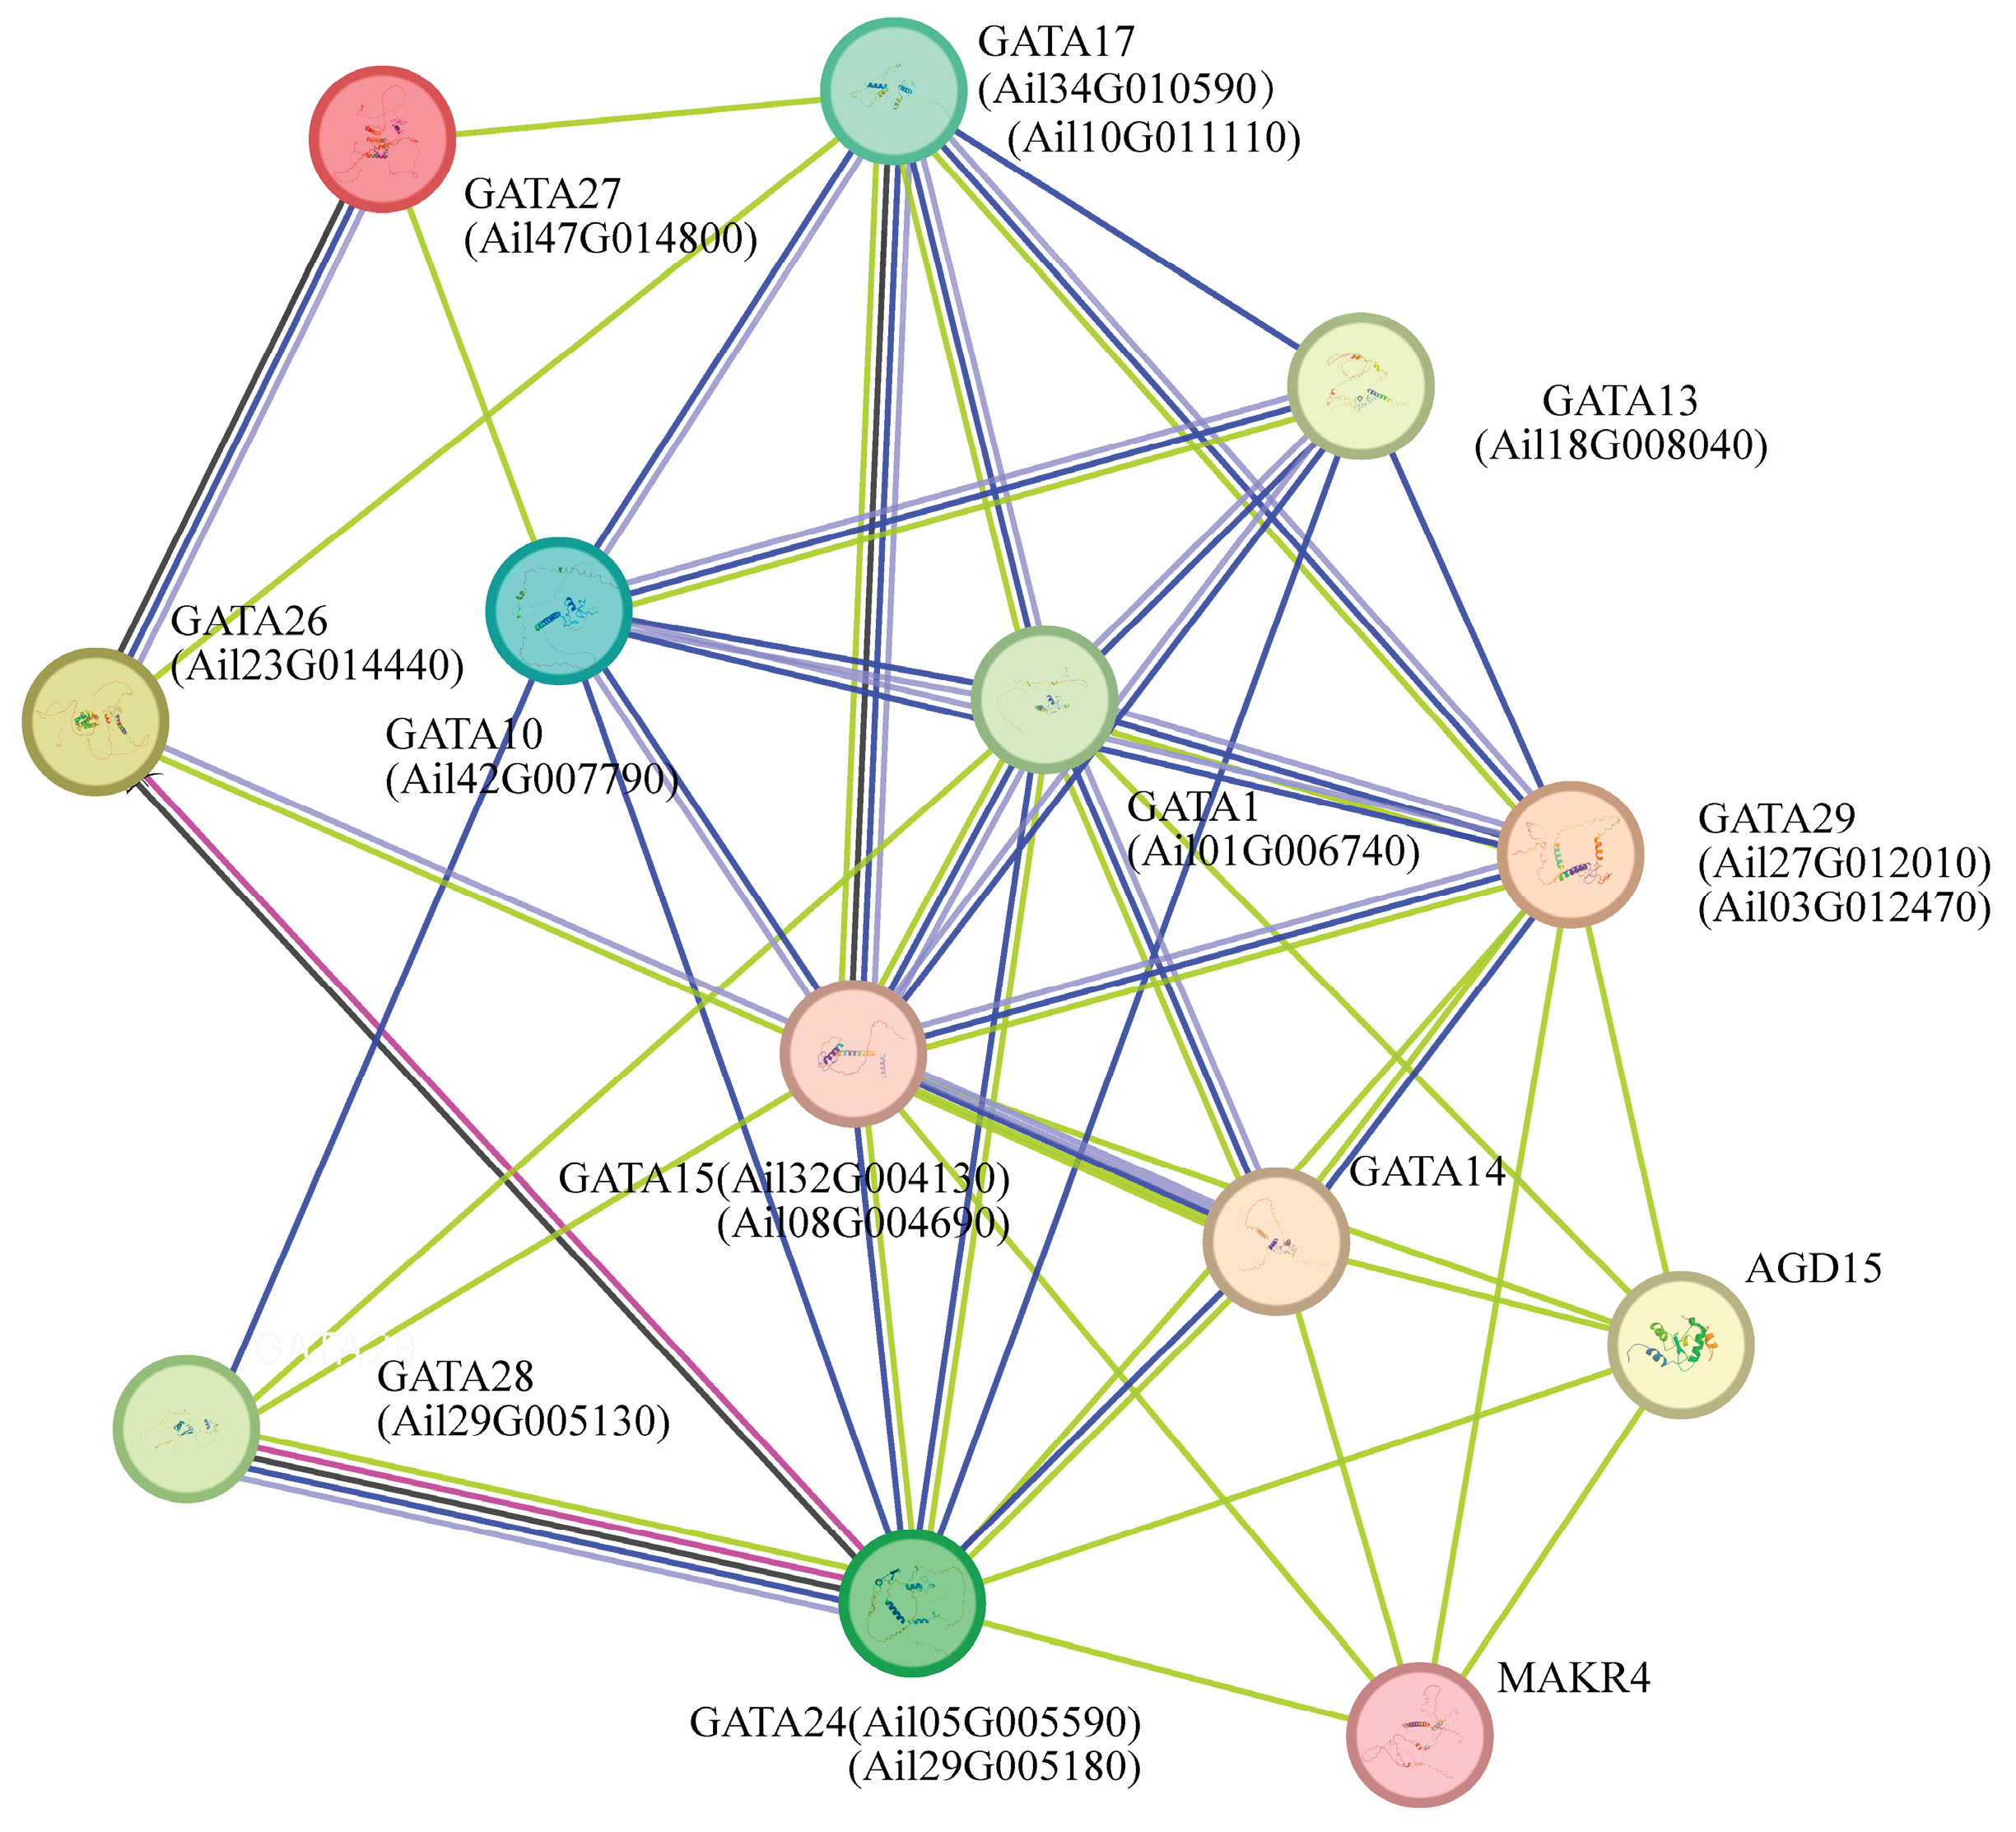
3.9. Interaction Network of GATA Transcription Factors in Arabidopsis
The analysis of the interaction network of the GATA transcription factor family in A. thaliana revealed extensive interactions among multiple GATA family members. Notably, GATA24 exhibited strong interactions with GATA28 and GATA26, while GATA26 also interacted with GATA27. Additionally, GATA1 was predicted to interact with GATA15, GATA17, GATA13, GATA10, GATA14, and GATA29. These findings suggest that GATA transcription factors function synergistically to respond to abiotic stress (Figure 8). By interacting with one another and activating downstream kinase pathways, GATA transcription factors play a critical role in mitigating the adverse effects of abiotic stress.
4. Discussion
GATA transcription factors are a family of zinc finger proteins that play essential roles in regulating gene expression during embryonic development, tissue differentiation, organogenesis and responses to environmental signals [11,13,45]. Genome-wide analysis of the GATA gene family has been completed for several plant species, and these genes play different functions in plant growth and development and stress response. 40, 39, 23, 22, 18 and 25 members of the GATA transcription factor family have been identified in Camellia Sinensis [46], Populus[25], Eucalyptus [47], Phoebe bournei[48], Liriodendron [49], and Uncaria rhynchophylla [50], respectively. A. ilicifolius grow under environmental conditions of highly salinized soil and long-term erosion by seawater, they have formed a unique set of salt-tolerance characteristics that are different from terrestrial freshwater plants. Therefore, the genome-wide identification and expression analysis of the GATA gene family of A. ilicifolius will help further clarify the function of the GATA gene. In this study, 95 GATA genes were identified from the A.ilicifolius, exceeding the GATA genes found in the above mentioned species. Most of these genes are distributed on 41 chromosomes. Among them, biosynthetic clusters exist on chromosomes 19 and 34, indicating that gene duplication events occurred during their evolution. This clustering pattern is usually caused by either tandem duplication or segment duplication and is an important mechanism for gene family expansion. Gene family expansion is a key evolutionary force in plants, driving genetic diversity and enabling new functions [51,52,53]. Evolutionary phylogenetic analysis of the GATA gene family revealed the classification of the GATA gene family into four subfamilies (Figure 2), which is consistent with the family classification of species such as A. thaliana and Oryza sativa.
Gene structure and conserved motifs are key features that help reveal the function and evolutionary history of gene families[54,55]. Exon-intron organization is often conserved within subgroups of a gene family, reflecting shared ancestry and functional conservation[56]. Conserved protein motifs, especially in functionally important domains, are critical for maintaining gene family functions[56,57]. Genes with similar structures and conserved motifs are often grouped together, and these groups tend to share similar functions[55,56,58]. In this study, a total of 10 conserved motifs, ranging from 15 to 50 amino acid residues in length, all retained the CX2-CX18-CX2 zinc finger domain and were relatively evolutionarily conservative. This is consistent with the distribution trend of the GATA family in cucumbers [22] and tomatoes[59]. The A. ilicifolius GATA family is larger and more diverse, probably expanded through gene duplication and exon shuffling[10,11,31,45].
GATA transcription factor genes not only control processes such as photomorpho- genesis, chlorophyll biosynthesis, chloroplast development, photosynthesis, stomatal formation, and root, leaf, and flower development [11,25,31,34,45] . Many GATA genes are induced or repressed by abiotic stresses such as drought, salinity, and light quality, contributing to stress tolerance and adaptability in crops [25,31,34,60].
Mangroves grow under environmental conditions of highly salinized soil and long-term erosion by sea water, they have formed a unique set of salt-tolerance characteristics that are different from terrestrial freshwater plants. In order to explore the expression response of GATA gene to salt stress, through heatmap of DEGs and RT-qPCR analysis, 8 DEGs were screened for qPCR verification. It was significantly expressed in roots after 12 h treatment and was up-regulated in stems after 48 h treatment. With the extension of treatment time, the expression level of plant tissues under high salt treatment varied, with the expression level in roots ranging from high to low and the expression level in stem tissue ranging from low to high. In addition, it is speculated that Ail42g007790, as a key transcription factor in the GATA family’s salt tolerance, regulates the salt secretion mechanism and metabolic process of A. ilicifolius.
GATA transcription factors have been found to respond to salt stress in wheat [61] and legumes [62]. GATA genes are also induced by abscisic acid (ABA) and jasmonic acid (JA), hormones central to stress responses [31,35,59,61,63]. Overexpression of certain GATA genes upregulates ABA/JA signaling pathway genes, which helps plants manage salt-induced stress [25,31,61,63,64,65]. GATA transcription factors enhance the activity and expression of antioxidant enzymes such as superoxide dismutase (SOD), peroxidase (POD), and catalase (CAT), reducing oxidative damage from salt stress [35,63]
Some GATA factors interact with proteins like COP9-5a, which further modulate ABA signaling and reactive oxygen species (ROS) accumulation, contributing to improved stress tolerance [63,65]. The GATAs family may play a synergistic role in participating in salt stress. Analysis of the predicted GATA family interaction network in Arabidopsis shows that AtGATA24 interacts strongly with AtGATA26 and AtGATA28, AtGATA26 and AtGATA27 also interact with each other, and other GATAs also interact (Figure 9). The MBS elements of TaGATA62, TaGATA73 and TaGATA74 in wheat play a synergistic role to regulate salt tolerance in wheat [61].
When the plants are subjected to high salt stress, ROS and ABA signals are tempo-rarily activated. High-salt conditions induce ABA accumulation, helping to regulate stress-responsive genes and physiological processes [66,67,68,69,70,71,72]. High-salt also stimulate the production of ROS, including H₂O₂, which serve as secondary messengers in stress sig- naling [66,67,68,69,70,71,72,73,74,75]. ABA and ROS production are tightly linked: ABA can promote ROS gen- eration by upregulating NADPH oxidases, while ROS can further enhance ABA biosyn- thesis, creating a positive feedback loop that amplifies the stress response [66,67,68,69,70,71,73,74]. While the generated superoxide anions further induce an increase in cytoplasmic Ca2+ concentration [76,77,78,79]. The Ca2+/CaM (calmodulin proteins act) as a second messenger can activate Ca2+/calmodulin-dependent protein kinases (CaMKs), which then stimulate MAPK kinase kinases (MAPKKKs), leading to the activation of the MAPK cascade [80,81].
It has been shown that the main role of the MAPK cascade is to phosphorylate and activate specific transcription factors [82,83,84,85,86], which regulate the expression of stress-responsive genes by binding to specific cis-regulatory elements [82]. MAPK cascades are essential for converting external stress signals into appropriate gene expression changes by activating downstream transcription factors. While GATA factors are not specifically detailed, the mechanism involves MAPK-mediated phosphorylation of transcription factors, which is critical for plant stress adaptation. Our study on the A. ilicifolius key transcription factors in response to high-salt stress such as GATA transcription factors also contributes to improve the in-depth understanding of the mechanism of salt tolerance in mangrove A. ilicifolius.
5. Conclusions
A. ilicifolius is a typical true mangroves species with important ecological and medicinal values. In this study, 95 GATA family transcription factors were identified in the mangrove A. ilicifolius, and bioinformatics analysis and expression pattern analysis of gene families were carried out. Evolutionary analysis showed that they were divided into 4 subfamilies. Amino acid homology analysis showed that they had a highly conserved zinc finger domain. Gene structure analysis identified multiple conserved motifs, revealing the important biological functions of the GATA gene family in plant growth and development and abiotic stress responses. Expression heatmaps and qRT-PCR results showed that the GATA gene responded to salt stress. The expression of GATA differential genes was significantly up-regulated in roots after 12 h salt treatment, and the GATA genes was significantly up-regulated in stems after 48 h salt treatment. Notably, Ail42g007790 may be a key regulatory factor involved in salt tolerance, and its biochemical function and molecular regulation mechanism will be further studied. These results provide a theoretical basis for further exploring the function of the GATA gene family in the growth and development of A. ilicifolius and environmental stress response.
Supplementary Materials
The following supporting information can be downloaded at the website of this paper posted on Preprints.org, Figure S1: GATA TF protein conserved motif sequence. Figure S2: Amino acid homology alignment of the GATA protein. Table S1: Analysis of secondary structure of GATA TFs; Table S2: Physical and chemical properties analysis of GATA transcription factor. Table S3: List of qRT-PCR primer sequences.
Author Contributions
X.L. designed the study. X.S. and Y.W. helped to conceive the research. X.L. analyzed the data and wrote the paper, discussed the results, and made comments on the manuscript. Z.W. participated in the research design and coordination, and provided revision and guidance of manuscripts. All authors have read and agreed to the published version of the manuscript.
Funding
This study was funded by the Fundamental Research Funds for the Central Non-profit Research Institution of Chinese Academy of Forestry (CAFYBB2022MA005) and the Key-Area Research and Development Program of Guangdong Province (no. 2020B020214001-ZKT03).
Data Availability Statement
All raw transcriptome sequences were deposited in the Sequence Read Archive at the National Center for Biotechnology Information (NCBI)( PRJNA1287084).
Acknowledgments
No applicable.
Conflicts of Interest
The authors declare no conflicts of interest.
References
- Riechmann, J.L.; Heard, J.; Martin, G.; Reuber, L.; Jiang, C.-Z.; Keddie, J.; Adam, L.; Pineda, O.; Ratcliffe, O.J.; Samaha, R.R.; et al. Arabidopsis Transcription Factors: Genome-Wide Comparative Analysis among Eukaryotes. Science 2000, 290, 2105–2110. [CrossRef]
- Fan, Y.; Yan, J.; Lai, D.; Yang, H.; Xue, G.; He, A.; Guo, T.; Chen, L.; Cheng, X.; Xiang, D.; et al. Genome-Wide Identification, Expression Analysis, and Functional Study of the GRAS Transcription Factor Family and Its Response to Abiotic Stress in Sorghum [Sorghum Bicolor (L.) Moench]. BMC Genomics 2021, 22, 509. [CrossRef]
- Yao, X.; Zhou, M.; Ruan, J.; He, A.; Ma, C.; Wu, W.; Lai, D.; Fan, Y.; Gao, A.; Weng, W.; et al. Genome-Wide Identification, Evolution, and Expression Pattern Analysis of the GATA Gene Family in Tartary Buckwheat (Fagopyrum Tataricum). IJMS 2022, 23, 12434. [CrossRef]
- Rueda-López, M.; Cañas, R.A.; Canales, J.; Cánovas, F.M.; Ávila, C. The Overexpression of the Pine Transcription Factor PpDof 5 in Arabidopsis Leads to Increased Lignin Content and Affects Carbon and Nitrogen Metabolism. Physiol. Plant. 2015, 155, 369–383. [CrossRef]
- Darigh, F.; Iranbakhsh, A.; Oraghi Ardebili, Z.; Ebadi, M.; Hassanpour, H. Simulated Microgravity Contributed to Modification of Callogenesis Performance and Secondary Metabolite Production in Cannabis Indica. Plant Physiol. Biochem. 2022, 186, 157–168. [CrossRef]
- Bose, C.; Das, P.K.; Roylawar, P.; Rupawate, P.; Khandagale, K.; Nanda, S.; Gawande, S. Identification and Analysis of the GATA Gene Family in Onion (Allium Cepa L.) in Response to Chromium and Salt Stress. BMC Genomics 2025, 26, 201. [CrossRef]
- Strader, L.; Weijers, D.; Wagner, D. Plant Transcription Factors — Being in the Right Place with the Right Company. Curr. Opin. Plant Biol. 2022, 65, 102136. [CrossRef]
- Schwechheimer, C.; Schroder, P.M.; Blaby-Haas, C.E. Plant GATA Factors: Their Biology, Phylogeny, and Phylogenomics. Annu Rev Plant Biol 2022, 73, 123–148. [CrossRef]
- Virolainen, P.A.; Chekunova, E.M. GATA Family Transcription Factors in Alga Chlamydomonas Reinhardtii. Curr Genet 2024, 70, 1. [CrossRef]
- Kim, M.; Xi, H.; Park, S.; Yun, Y.; Park, J. Genome-Wide Comparative Analyses of GATA Transcription Factors among Seven Populus Genomes. Sci Rep 2021, 11, 16578. [CrossRef]
- Schwechheimer, C.; Schröder, P.M.; Blaby-Haas, C.E. Plant GATA Factors: Their Biology, Phylogeny, and Phylogenomics. Annu. Rev. Plant Biol. 2022, 73, 123–148. [CrossRef]
- Shi, M.; Huang, Q.; Wang, Y.; Wang, C.; Zhu, R.; Zhang, S.; Kai, G. Genome-Wide Survey of the GATA Gene Family in Camptothecin-Producing Plant Ophiorrhiza Pumila. BMC Genomics 2022, 23, 256. [CrossRef]
- Kim, M. Comparative Analysis of Amino Acid Sequence Level in Plant GATA Transcription Factors. Sci Rep 2024, 14, 29786. [CrossRef]
- Zhang, C.; Hou, Y.; Hao, Q.; Chen, H.; Chen, L.; Yuan, S.; Shan, Z.; Zhang, X.; Yang, Z.; Qiu, D.; et al. Genome-Wide Survey of the Soybean GATA Transcription Factor Gene Family and Expression Analysis under Low Nitrogen Stress. PLoS ONE 2015, 10, e0125174. [CrossRef]
- Chen, Z.; Zhong, W.; Zhou, Y.; Ji, P.; Wan, Y.; Shi, S.; Yang, Z.; Gong, Y.; Mu, F.; Chen, S. Integrative Analysis of Metabolome and Transcriptome Reveals the Improvements of Seed Quality in Vegetable Soybean (Glycine Max (L.) Merr.). Phytochemistry 2022, 200. [CrossRef]
- Yao, X.; Lai, D.; Zhou, M.; Ruan, J.; Ma, C.; Wu, W.; Weng, W.; Fan, Y.; Cheng, J. Genome-Wide Identification, Evolution and Expression Pattern Analysis of the GATA Gene Family in Sorghum Bicolor. Front. Plant Sci. 2023, 14, 1163357. [CrossRef]
- Yu, C.; Li, N.; Yin, Y.; Wang, F.; Gao, S.; Jiao, C.; Yao, M. Genome-Wide Identification and Function Characterization of GATA Transcription Factors during Development and in Response to Abiotic Stresses and Hormone Treatments in Pepper. J Appl Genetics 2021, 62, 265–280. [CrossRef]
- Li, C.; Lai, X.; Luo, K.; Zheng, Y.; Liu, K.; Wan, X. Integrated Metabolomic and Transcriptomic Analyses of Two Peanut (Arachis Hypogaea L.) Cultivars Differing in Amino Acid Metabolism of the Seeds. Plant Physiology and Biochemistry 2022, 185, 132–143. [CrossRef]
- Zhang, F.; Wu, Y.; Shi, X.; Wang, X.; Yin, Y. Comparative Analysis of the GATA Transcription Factors in Five Solanaceae Species and Their Responses to Salt Stress in Wolfberry (Lycium Barbarum L.). Genes 2023, 14, 1943. [CrossRef]
- Feng, X.; Yu, Q.; Zeng, J.; He, X.; Liu, W. Genome-Wide Identification and Characterization of GATA Family Genes in Wheat. BMC Plant Biol 2022, 22, 372. [CrossRef]
- Zhang, K.; Jia, L.; Yang, D.; Hu, Y.; Njogu, M.K.; Wang, P.; Lu, X.; Yan, C. Genome-Wide Identification, Phylogenetic and Expression Pattern Analysis of GATA Family Genes in Cucumber (Cucumis Sativus L.). Plants 2021, 10, 1626. [CrossRef]
- Zhang, Z.; Zou, X.; Huang, Z.; Fan, S.; Qun, G.; Liu, A.; Gong, J.; Li, J.; Gong, W.; Shi, Y.; et al. Genome-Wide Identification and Analysis of the Evolution and Expression Patterns of the GATA Transcription Factors in Three Species of Gossypium Genus. Gene 2019, 680, 72–83. [CrossRef]
- An, Y.; Zhou, Y.; Han, X.; Shen, C.; Wang, S.; Liu, C.; Yin, W.; Xia, X. The GATA Transcription Factor GNC Plays an Important Role in Photosynthesis and Growth in Poplar. Journal of Experimental Botany 2020, 71, 1969–1984. [CrossRef]
- Peng, W.; Li, W.; Song, N.; Tang, Z.; Liu, J.; Wang, Y.; Pan, S.; Dai, L.; Wang, B. Genome-Wide Characterization, Evolution, and Expression Profile Analysis of GATA Transcription Factors in Brachypodium Distachyon. Int J Mol Sci 2021, 22. [CrossRef]
- Zhao, K.; Nan, S.; Li, Y.; Yu, C.; Zhou, L.; Hu, J.; Jin, X.; Han, Y.; Wang, S. Comprehensive Analysis and Characterization of the GATA Gene Family, with Emphasis on the GATA6 Transcription Factor in Poplar. IJMS 2023, 24, 14118. [CrossRef]
- Chiang, Y.-H.; Zubo, Y.O.; Tapken, W.; Kim, H.J.; Lavanway, A.M.; Howard, L.; Pilon, M.; Kieber, J.J.; Schaller, G.E. Functional Characterization of the GATA Transcription Factors GNC and CGA1 Reveals Their Key Role in Chloroplast Development, Growth, and Division in Arabidopsis. Plant Physiology 2012, 160, 332–348. [CrossRef]
- Richter, R.; Behringer, C.; Zourelidou, M.; Schwechheimer, C. Convergence of Auxin and Gibberellin Signaling on the Regulation of the GATA Transcription Factors GNC and GNL in Arabidopsis Thaliana. Proc. Natl. Acad. Sci. U.S.A. 2013, 110, 13192–13197. [CrossRef]
- Luo, X.-M.; Lin, W.-H.; Zhu, S.; Zhu, J.-Y.; Sun, Y.; Fan, X.-Y.; Cheng, M.; Hao, Y.; Oh, E.; Tian, M.; et al. Integration of Light- and Brassinosteroid-Signaling Pathways by a GATA Transcription Factor in Arabidopsis. Developmental Cell 2010, 19, 872–883. [CrossRef]
- Zubo, Y.O.; Blakley, I.C.; Franco-Zorrilla, J.M.; Yamburenko, M.V.; Solano, R.; Kieber, J.J.; Loraine, A.E.; Schaller, G.E. Coordination of Chloroplast Development through the Action of the GNC and GLK Transcription Factor Families. Plant Physiol. 2018, 178, 130–147. [CrossRef]
- He, P.; Wang, X.; Zhang, X.; Jiang, Y.; Tian, W.; Zhang, X.; Li, Y.; Sun, Y.; Xie, J.; Ni, J.; et al. Short and Narrow Flag Leaf1, a GATA Zinc Finger Domain-Containing Protein, Regulates Flag Leaf Size in Rice (Oryza Sativa). BMC Plant Biol 2018, 18, 273. [CrossRef]
- Gupta, P.; Nutan, K.K.; Singla-Pareek, S.L.; Pareek, A. Abiotic Stresses Cause Differential Regulation of Alternative Splice Forms of GATA Transcription Factor in Rice. Front. Plant Sci. 2017, 8, 1944. [CrossRef]
- Lu, G.; Casaretto, J.A.; Ying, S.; Mahmood, K.; Liu, F.; Bi, Y.-M.; Rothstein, S.J. Overexpression of OsGATA12 Regulates Chlorophyll Content, Delays Plant Senescence and Improves Rice Yield under High Density Planting. Plant Mol Biol 2017, 94, 215–227. [CrossRef]
- Zhang, H.; Wu, T.; Li, Z.; Huang, K.; Kim, N.-E.; Ma, Z.; Kwon, S.-W.; Jiang, W.; Du, X. OsGATA16, a GATA Transcription Factor, Confers Cold Tolerance by Repressing OsWRKY45–1 at the Seedling Stage in Rice. Rice 2021, 14, 42. [CrossRef]
- Aksoy, E.; Yavuz, C.; Yagiz, A.K.; Unel, N.M.; Baloglu, M.C. Genome-Wide Characterization and Expression Analysis of GATA Transcription Factors under Combination of Light Wavelengths and Drought Stress in Potato. Plant Direct 2024, 8, e569. [CrossRef]
- Zhu, X.; Duan, H.; Zhang, N.; Majeed, Y.; Jin, H.; Li, W.; Chen, Z.; Chen, S.; Tang, J.; Zhang, Y.; et al. Genome-Wide Identification of GATA Family Genes in Potato and Characterization of StGATA12 in Response to Salinity and Osmotic Stress. Int J Mol Sci 2024, 25. [CrossRef]
- Manzoor, M.A.; Sabir, I.A.; Shah, I.H.; Wang, H.; Yu, Z.; Rasool, F.; Mazhar, M.Z.; Younas, S.; Abdullah, M.; Cai, Y. Comprehensive Comparative Analysis of the GATA Transcription Factors in Four Rosaceae Species and Phytohormonal Response in Chinese Pear (Pyrus Bretschneideri) Fruit. Int J Mol Sci 2021, 22. [CrossRef]
- Donato, D.C.; Kauffman, J.B.; Murdiyarso, D.; Kurnianto, S.; Stidham, M.; Kanninen, M. Mangroves among the Most Carbon-Rich Forests in the Tropics. Nat. Geosci. 2011, 4, 293–297. [CrossRef]
- Parida, A.K.; Jha, B. Salt Tolerance Mechanisms in Mangroves: A Review. Trees 2010, 24, 199–217. [CrossRef]
- Friess, D.A.; Rogers, K.; Lovelock, C.E.; Krauss, K.W.; Hamilton, S.E.; Lee, S.Y.; Lucas, R.; Primavera, J.; Rajkaran, A.; Shi, S. The State of the World’s Mangrove Forests: Past, Present, and Future. Annu. Rev. Environ. Resour. 2019, 44, 89–115. [CrossRef]
- Sahu, S.K.; Singh, R.; Kathiresan, K. Multi-Gene Phylogenetic Analysis Reveals the Multiple Origin and Evolution of Mangrove Physiological Traits through Exaptation. Estuarine Coastal Shelf Sci. 2016, 183, 41–51. [CrossRef]
- Wu, Z.; Wang, Z.; Xie, Y.; Liu, G.; Shang, X.; Zhan, N. Transcriptome and Metabolome Profiling Provide Insights into Flavonoid Synthesis in Acanthus Ilicifolius Linn. Genes 2023, 14, 752. [CrossRef]
- Lowry, J.A.; Atchley, W.R. Molecular Evolution of the GATA Family of Transcription Factors: Conservation Within the DNA-Binding Domain. J Mol Evol 2000, 50, 103–115. [CrossRef]
- Hao, Y.; Zong, X.; Ren, P.; Qian, Y.; Fu, A. Basic Helix-Loop-Helix (bHLH) Transcription Factors Regulate a Wide Range of Functions in Arabidopsis. IJMS 2021, 22, 7152. [CrossRef]
- Atchley, W.; Fitch, W. A Natural Classification of the Basic Helix-Loop-Helix Class of Transcription Factors. Proceedings of the National Academy of Sciences of the United States of America 1997, 94 10, 5172–5176. [CrossRef]
- Behringer, C.; Schwechheimer, C. B-GATA Transcription Factors – Insights into Their Structure, Regulation, and Role in Plant Development. Front. Plant Sci. 2015, 6, 90. [CrossRef]
- Gao, Y.; Sun, C.; Zhang, X.; Fu, M.; Yang, Q.; Liu, L.; Wan, X.; Chen, Q. Identification of the GATA Transcription Factor Family in Tea Plant (Camellia Sinensis) and the Characterizations in Nitrogen Metabolism. Plant Physiology and Biochemistry 2025, 221, 109661. [CrossRef]
- Du, K.; Xia, Y.; Zhan, D.; Xu, T.; Lu, T.; Yang, J.; Kang, X. Genome-Wide Identification of the Eucalyptus Urophylla GATA Gene Family and Its Diverse Roles in Chlorophyll Biosynthesis. IJMS 2022, 23, 5251. [CrossRef]
- Yin, Z.; Liao, W.; Li, J.; Pan, J.; Yang, S.; Chen, S.; Cao, S. Genome-Wide Identification of GATA Family Genes in Phoebe Bournei and Their Transcriptional Analysis under Abiotic Stresses. IJMS 2023, 24, 10342. [CrossRef]
- Hwarari, D.; Radani, Y.; Guan, Y.; Chen, J.; Liming, Y. Systematic Characterization of GATA Transcription Factors in Liriodendron Chinense and Functional Validation in Abiotic Stresses. Plants 2023, 12, 2349. [CrossRef]
- Shao, Y.; Zhou, Y.; Yang, L.; Mu, D.; Wilson, I.W.; Zhang, Y.; Zhu, L.; Liu, X.; Luo, L.; He, J.; et al. Genome-Wide Identification of GATA Transcription Factor Family and the Effect of Different Light Quality on the Accumulation of Terpenoid Indole Alkaloids in Uncaria Rhynchophylla. Plant Mol Biol 2024, 114, 15. [CrossRef]
- Jiang, C.-K.; Rao, G.-Y. Insights into the Diversification and Evolution of R2R3-MYB Transcription Factors in Plants. Plant Physiol. 2020, 183, 637–655. [CrossRef]
- Wang, J.-L.; Wang, H.-W.; Cao, Y.-N.; Kan, S.-L.; Liu, Y.-Y. Comprehensive Evolutionary Analysis of the TCP Gene Family: Further Insights for Its Origin, Expansion, and Diversification. Front. Plant Sci. 2022, 13, 994567. [CrossRef]
- Wu, T.; Yang, Q.; Zhou, R.; Yu, T.; Shen, S.; Cao, R.; Ma, X.; Song, X. Large-scale Analysis of Trihelix Transcription Factors Reveals Their Expansion and Evolutionary Footprint in Plants. Physiologia Plantarum 2023, 175, e14039. [CrossRef]
- Mengarelli, D.A.; Zanor, M.I. Genome-Wide Characterization and Analysis of the CCT Motif Family Genes in Soybean (Glycine Max). Planta 2021, 253, 15. [CrossRef]
- Fang, Y.; Tai, Z.; Hu, K.; Luo, L.; Yang, S.; Liu, M.; Xie, X. Comprehensive Review on Plant Cytochrome P450 Evolution: Copy Number, Diversity, and Motif Analysis From Chlorophyta to Dicotyledoneae. Genome Biol. Evol. 2024, 16, evae240. [CrossRef]
- Jiang, C.; Gu, X.; Peterson, T. Identification of Conserved Gene Structures and Carboxy-Terminal Motifs in the Myb Gene Family of Arabidopsis and Oryza Sativa L. Ssp. Indica. Genome Biol 2004, 5, R46. [CrossRef]
- Gushchina, L.V.; Kwiatkowski, T.A.; Bhattacharya, S.; Weisleder, N.L. Conserved Structural and Functional Aspects of the Tripartite Motif Gene Family Point towards Therapeutic Applications in Multiple Diseases. Pharmacology & Therapeutics 2018, 185, 12–25. [CrossRef]
- Corbin, C.; Drouet, S.; Markulin, L.; Auguin, D.; Lainé, É.; Davin, L.B.; Cort, J.R.; Lewis, N.G.; Hano, C. A Genome-Wide Analysis of the Flax (Linum Usitatissimum L.) Dirigent Protein Family: From Gene Identification and Evolution to Differential Regulation. Plant Mol Biol 2018, 97, 73–101. [CrossRef]
- Du, X.; Lu, Y.; Sun, H.; Duan, W.; Hu, Y.; Yan, Y. Genome-Wide Analysis of Wheat GATA Transcription Factor Genes Reveals Their Molecular Evolutionary Characteristics and Involvement in Salt and Drought Tolerance. IJMS 2022, 24, 27. [CrossRef]
- Guo, J.; Bai, X.; Dai, K.; Yuan, X.; Guo, P.; Zhou, M.; Shi, W.; Hao, C. Identification of GATA Transcription Factors in Brachypodium Distachyon and Functional Characterization of BdGATA13 in Drought Tolerance and Response to Gibberellins. Front Plant Sci 2021, 12, 763665. [CrossRef]
- Abdulla, M.F.; Mostafa, K.; Aydin, A.; Kavas, M.; Aksoy, E. GATA Transcription Factor in Common Bean: A Comprehensive Genome-Wide Functional Characterization, Identification, and Abiotic Stress Response Evaluation. Plant Mol Biol 2024, 114, 43. [CrossRef]
- Li, J.; Wang, X.; Zhang, Y.; Jia, H.; Bi, Y. cGMP Regulates Hydrogen Peroxide Accumulation in Calcium-Dependent Salt Resistance Pathway in Arabidopsis Thaliana Roots. Planta 2011, 234, 709–722. [CrossRef]
- Zhu, H.; Zhai, H.; He, S.; Zhang, H.; Gao, S.; Liu, Q. A Novel Sweetpotato GATA Transcription Factor, IbGATA24, Interacting with IbCOP9-5a Positively Regulates Drought and Salt Tolerance. Environmental and Experimental Botany 2022, 194, 104735. [CrossRef]
- Zhao, Y.; Jia, K.; Tian, Y.; Han, K.; El-Kassaby, Y.A.; Yang, H.; Si, H.; Sun, Y.; Li, Y. Time-Course Transcriptomics Analysis Reveals Key Responses of Populus to Salt Stress. Industrial Crops and Products 2023, 194, 116278. [CrossRef]
- Zhang, F.; Wu, Y.; Shi, X.; Wang, X.; Yin, Y. Comparative Analysis of the GATA Transcription Factors in Five Solanaceae Species and Their Responses to Salt Stress in Wolfberry (Lycium Barbarum L.). Genes 2023, 14, 1943. [CrossRef]
- Gémes, K.; Poór, P.; Horváth, E.; Kolbert, Z.; Szopkó, D.; Szepesi, Á.; Tari, I. Cross-talk between Salicylic Acid and NaCl-generated Reactive Oxygen Species and Nitric Oxide in Tomato during Acclimation to High Salinity. Physiologia Plantarum 2011, 142, 179–192. [CrossRef]
- Meng, X.; Cai, J.; Deng, L.; Li, G.; Sun, J.; Han, Y.; Dong, T.; Liu, Y.; Xu, T.; Liu, S.; et al. SlSTE1 Promotes Abscisic Acid-dependent Salt Stress-responsive Pathways via Improving Ion Homeostasis and Reactive Oxygen Species Scavenging in Tomato. JIPB 2020, 62, 1942–1966.
- Julkowska, M.M.; Testerink, C. Tuning Plant Signaling and Growth to Survive Salt. Trends in Plant Science 2015, 20, 586–594. [CrossRef]
- He, Q.Y.; Jin, J.F.; Lou, H.Q.; Dang, F.F.; Xu, J.M.; Zheng, S.J.; Yang, J.L. Abscisic Acid-dependent PMT1 Expression Regulates Salt Tolerance by Alleviating Abscisic Acid-mediated Reactive Oxygen Species Production in Arabidopsis. JIPB 2022, 64, 1803–1820. [CrossRef]
- Li, S.; Wang, N.; Ji, D.; Zhang, W.; Wang, Y.; Yu, Y.; Zhao, S.; Lyu, M.; You, J.; Zhang, Y.; et al. A GmSIN1/GmNCED3s/GmRbohBs Feed-Forward Loop Acts as a Signal Amplifier That Regulates Root Growth in Soybean Exposed to Salt Stress. Plant Cell 2019, 31, 2107–2130. [CrossRef]
- Lu, C.; Tian, Y.; Hou, X.; Hou, X.; Jia, Z.; Li, M.; Hao, M.; Jiang, Y.; Wang, Q.; Pu, Q.; et al. Multiple Forms of Vitamin B6 Regulate Salt Tolerance by Balancing ROS and Abscisic Acid Levels in Maize Root. Stress Biology 2022, 2, 39. [CrossRef]
- Ding, F.; Zhang, B.-L.; Li, F.; Li, Y.-R.; Li, J.-H.; Lu, Y.-T. General Control Non-Repressible 20 Functions in the Salt Stress Response of Arabidopsis Seedling by Modulating ABA Accumulation. Environmental and Experimental Botany 2022, 198, 104856. [CrossRef]
- Zhang, H.; Deng, C.; Yao, J.; Zhang, Y.-L.; Zhang, Y.-N.; Deng, S.; Zhao, N.; Sa, G.; Zhou, X.; Lu, C.; et al. Populus Euphratica JRL Mediates ABA Response, Ionic and ROS Homeostasis in Arabidopsis under Salt Stress. IJMS 2019, 20, 815. [CrossRef]
- Sakamoto, H.; Matsuda, O.; Iba, K. ITN1 , a Novel Gene Encoding an Ankyrin-repeat Protein That Affects the ABA-mediated Production of Reactive Oxygen Species and Is Involved in Salt-stress Tolerance in Arabidopsis Thaliana. The Plant Journal 2008, 56, 411–422. [CrossRef]
- Rachowka, J.; Anielska-Mazur, A.; Bucholc, M.; Stephenson, K.; Kulik, A. SnRK2.10 Kinase Differentially Modulates Expression of Hub WRKY Transcription Factors Genes under Salinity and Oxidative Stress in Arabidopsis Thaliana. Front. Plant Sci. 2023, 14, 1135240. [CrossRef]
- Laohavisit, A.; Shang, Z.; Rubio, L.; Cuin, T.A.; Véry, A.-A.; Wang, A.; Mortimer, J.C.; Macpherson, N.; Coxon, K.M.; Battey, N.H.; et al. Arabidopsis Annexin1 Mediates the Radical-Activated Plasma Membrane Ca2+ - and K+ -Permeable Conductance in Root Cells. Plant Cell 2012, 24, 1522–1533. [CrossRef]
- Price, A.H.; Taylor, A.; Ripley, S.J.; Griffiths, A.; Trewavas, A.J.; Knight, M.R. Oxidative Signals in Tobacco Increase Cytosolic Calcium. Plant Cell 1994, 1301–1310. [CrossRef]
- Lee, H.-J.; Seo, P.J. Ca2+talyzing Initial Responses to Environmental Stresses. Trends in Plant Science 2021, 26, 849–870. [CrossRef]
- Li, Y.; Liu, Y.; Jin, L.; Peng, R. Crosstalk between Ca2+ and Other Regulators Assists Plants in Responding to Abiotic Stress. Plants 2022, 11, 1351. [CrossRef]
- Wu, G.-Y.; Deisseroth, K.; Tsien, R.W. Activity-Dependent CREB Phosphorylation: Convergence of a Fast, Sensitive Calmodulin Kinase Pathway and a Slow, Less Sensitive Mitogen-Activated Protein Kinase Pathway. Proc. Natl. Acad. Sci. U.S.A. 2001, 98, 2808–2813. [CrossRef]
- Tanaka-Hino, M.; Sagasti, A.; Hisamoto, N.; Kawasaki, M.; Nakano, S.; Ninomiya-Tsuji, J.; Bargmann, C.I.; Matsumoto, K. SEK-1 MAPKK Mediates Ca2+ Signaling to Determine Neuronal Asymmetric Development in Caenorhabditis Elegans. EMBO Reports 2002, 3, 56–62. [CrossRef]
- Li, S.; Han, X.; Lu, Z.; Qiu, W.; Yu, M.; Li, H.; He, Z.; Zhuo, R. MAPK Cascades and Transcriptional Factors: Regulation of Heavy Metal Tolerance in Plants. IJMS 2022, 23, 4463. [CrossRef]
- Lin, L.; Wu, J.; Jiang, M.; Wang, Y. Plant Mitogen-Activated Protein Kinase Cascades in Environmental Stresses. IJMS 2021, 22, 1543. [CrossRef]
- He, X.; Wang, C.; Wang, H.; Li, L.; Wang, C. The Function of MAPK Cascades in Response to Various Stresses in Horticultural Plants. Front. Plant Sci. 2020, 11, 952. [CrossRef]
- Mo, S.; Qian, Y.; Zhang, W.; Qian, L.; Wang, Y.; Cailin, G.; Ding, H. Mitogen-Activated Protein Kinase Action in Plant Response to High-Temperature Stress: A Mini Review. Protoplasma 2021, 258, 477–482. [CrossRef]
- Taj, G.; Agarwal, P.; Grant, M.; Kumar, A. MAPK Machinery in Plants: Recognition and Response to Different Stresses through Multiple Signal Transduction Pathways. Plant Signaling & Behavior 2010, 5, 1370–1378. [CrossRef]
Figure 1.
Evolutionary analysis of the GATA transcription factors family (a) conserved motifs (b) functional domains (c), and schematic diagram of gene structure (d).
Figure 1.
Evolutionary analysis of the GATA transcription factors family (a) conserved motifs (b) functional domains (c), and schematic diagram of gene structure (d).
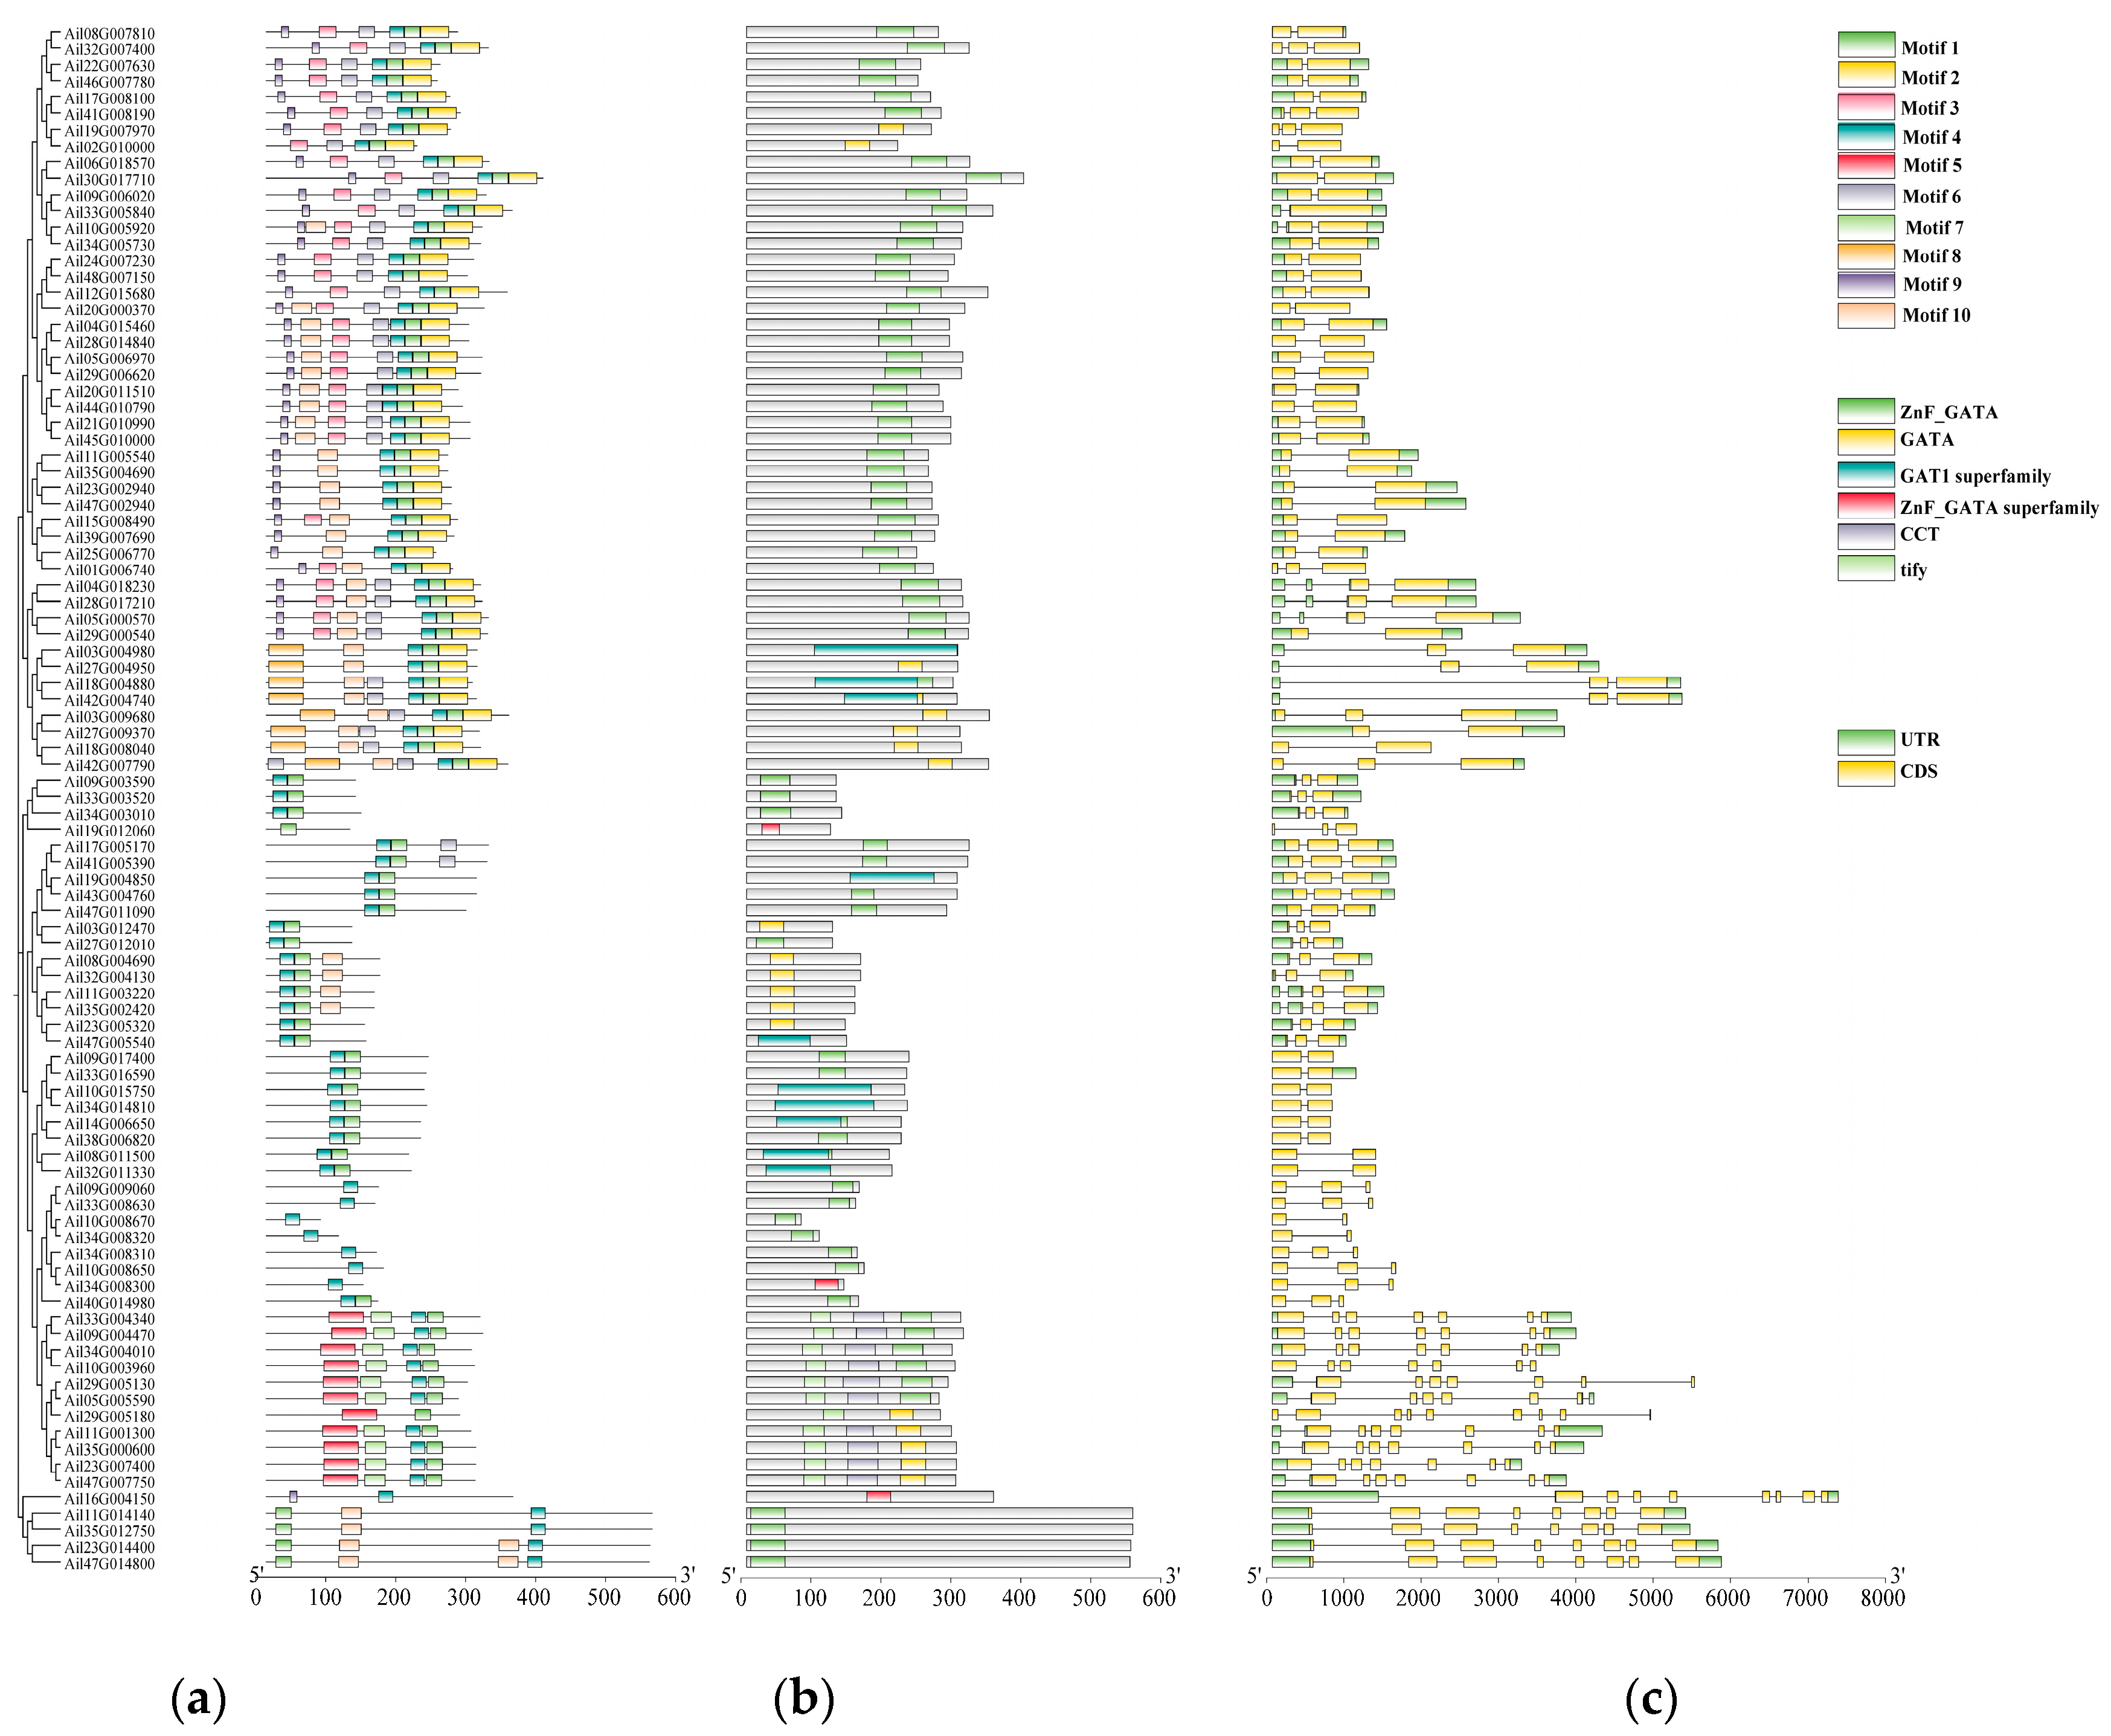
Figure 2.
Phylogenetic tree analysis of the GATA family. ● Represents Oryza sativa ■ Represents Arabidopsis thaliana ★ Represents A. ilicifolius.
Figure 2.
Phylogenetic tree analysis of the GATA family. ● Represents Oryza sativa ■ Represents Arabidopsis thaliana ★ Represents A. ilicifolius.
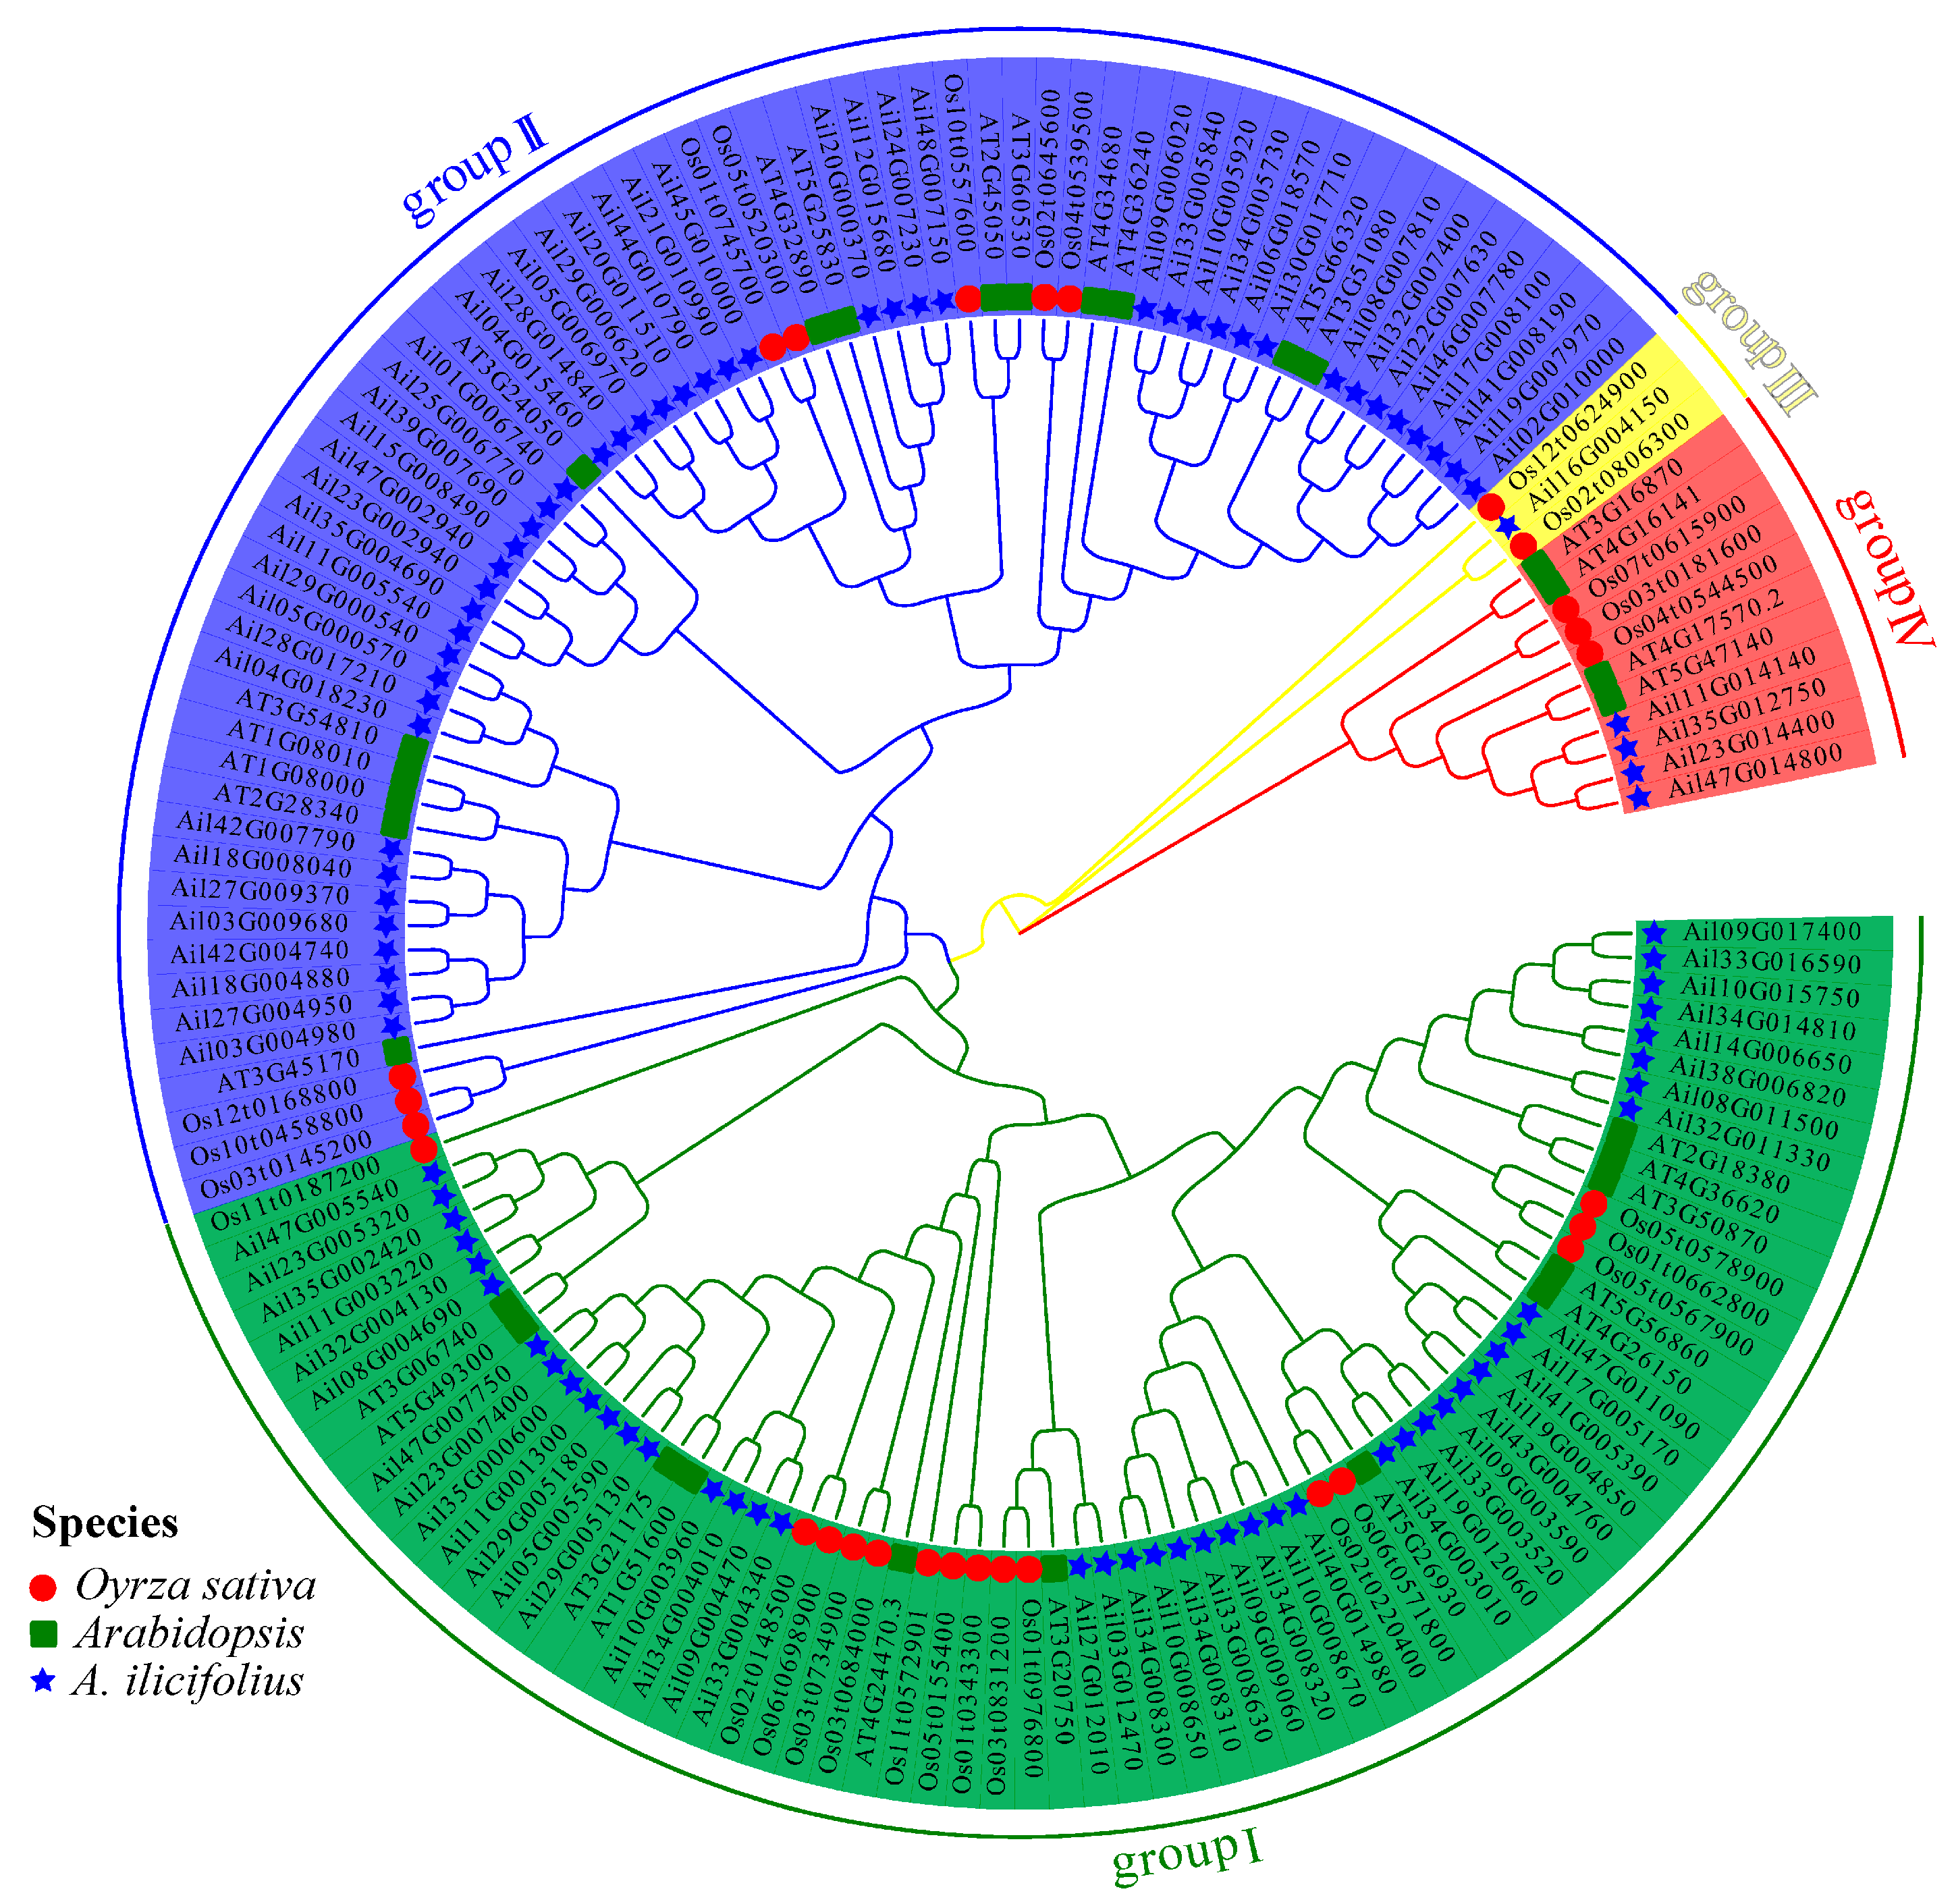
Figure 4.
Prediction and analysis of cis-acting elements in GATA promoter (a) and Cis-acting original classification Venn diagram (b).
Figure 4.
Prediction and analysis of cis-acting elements in GATA promoter (a) and Cis-acting original classification Venn diagram (b).
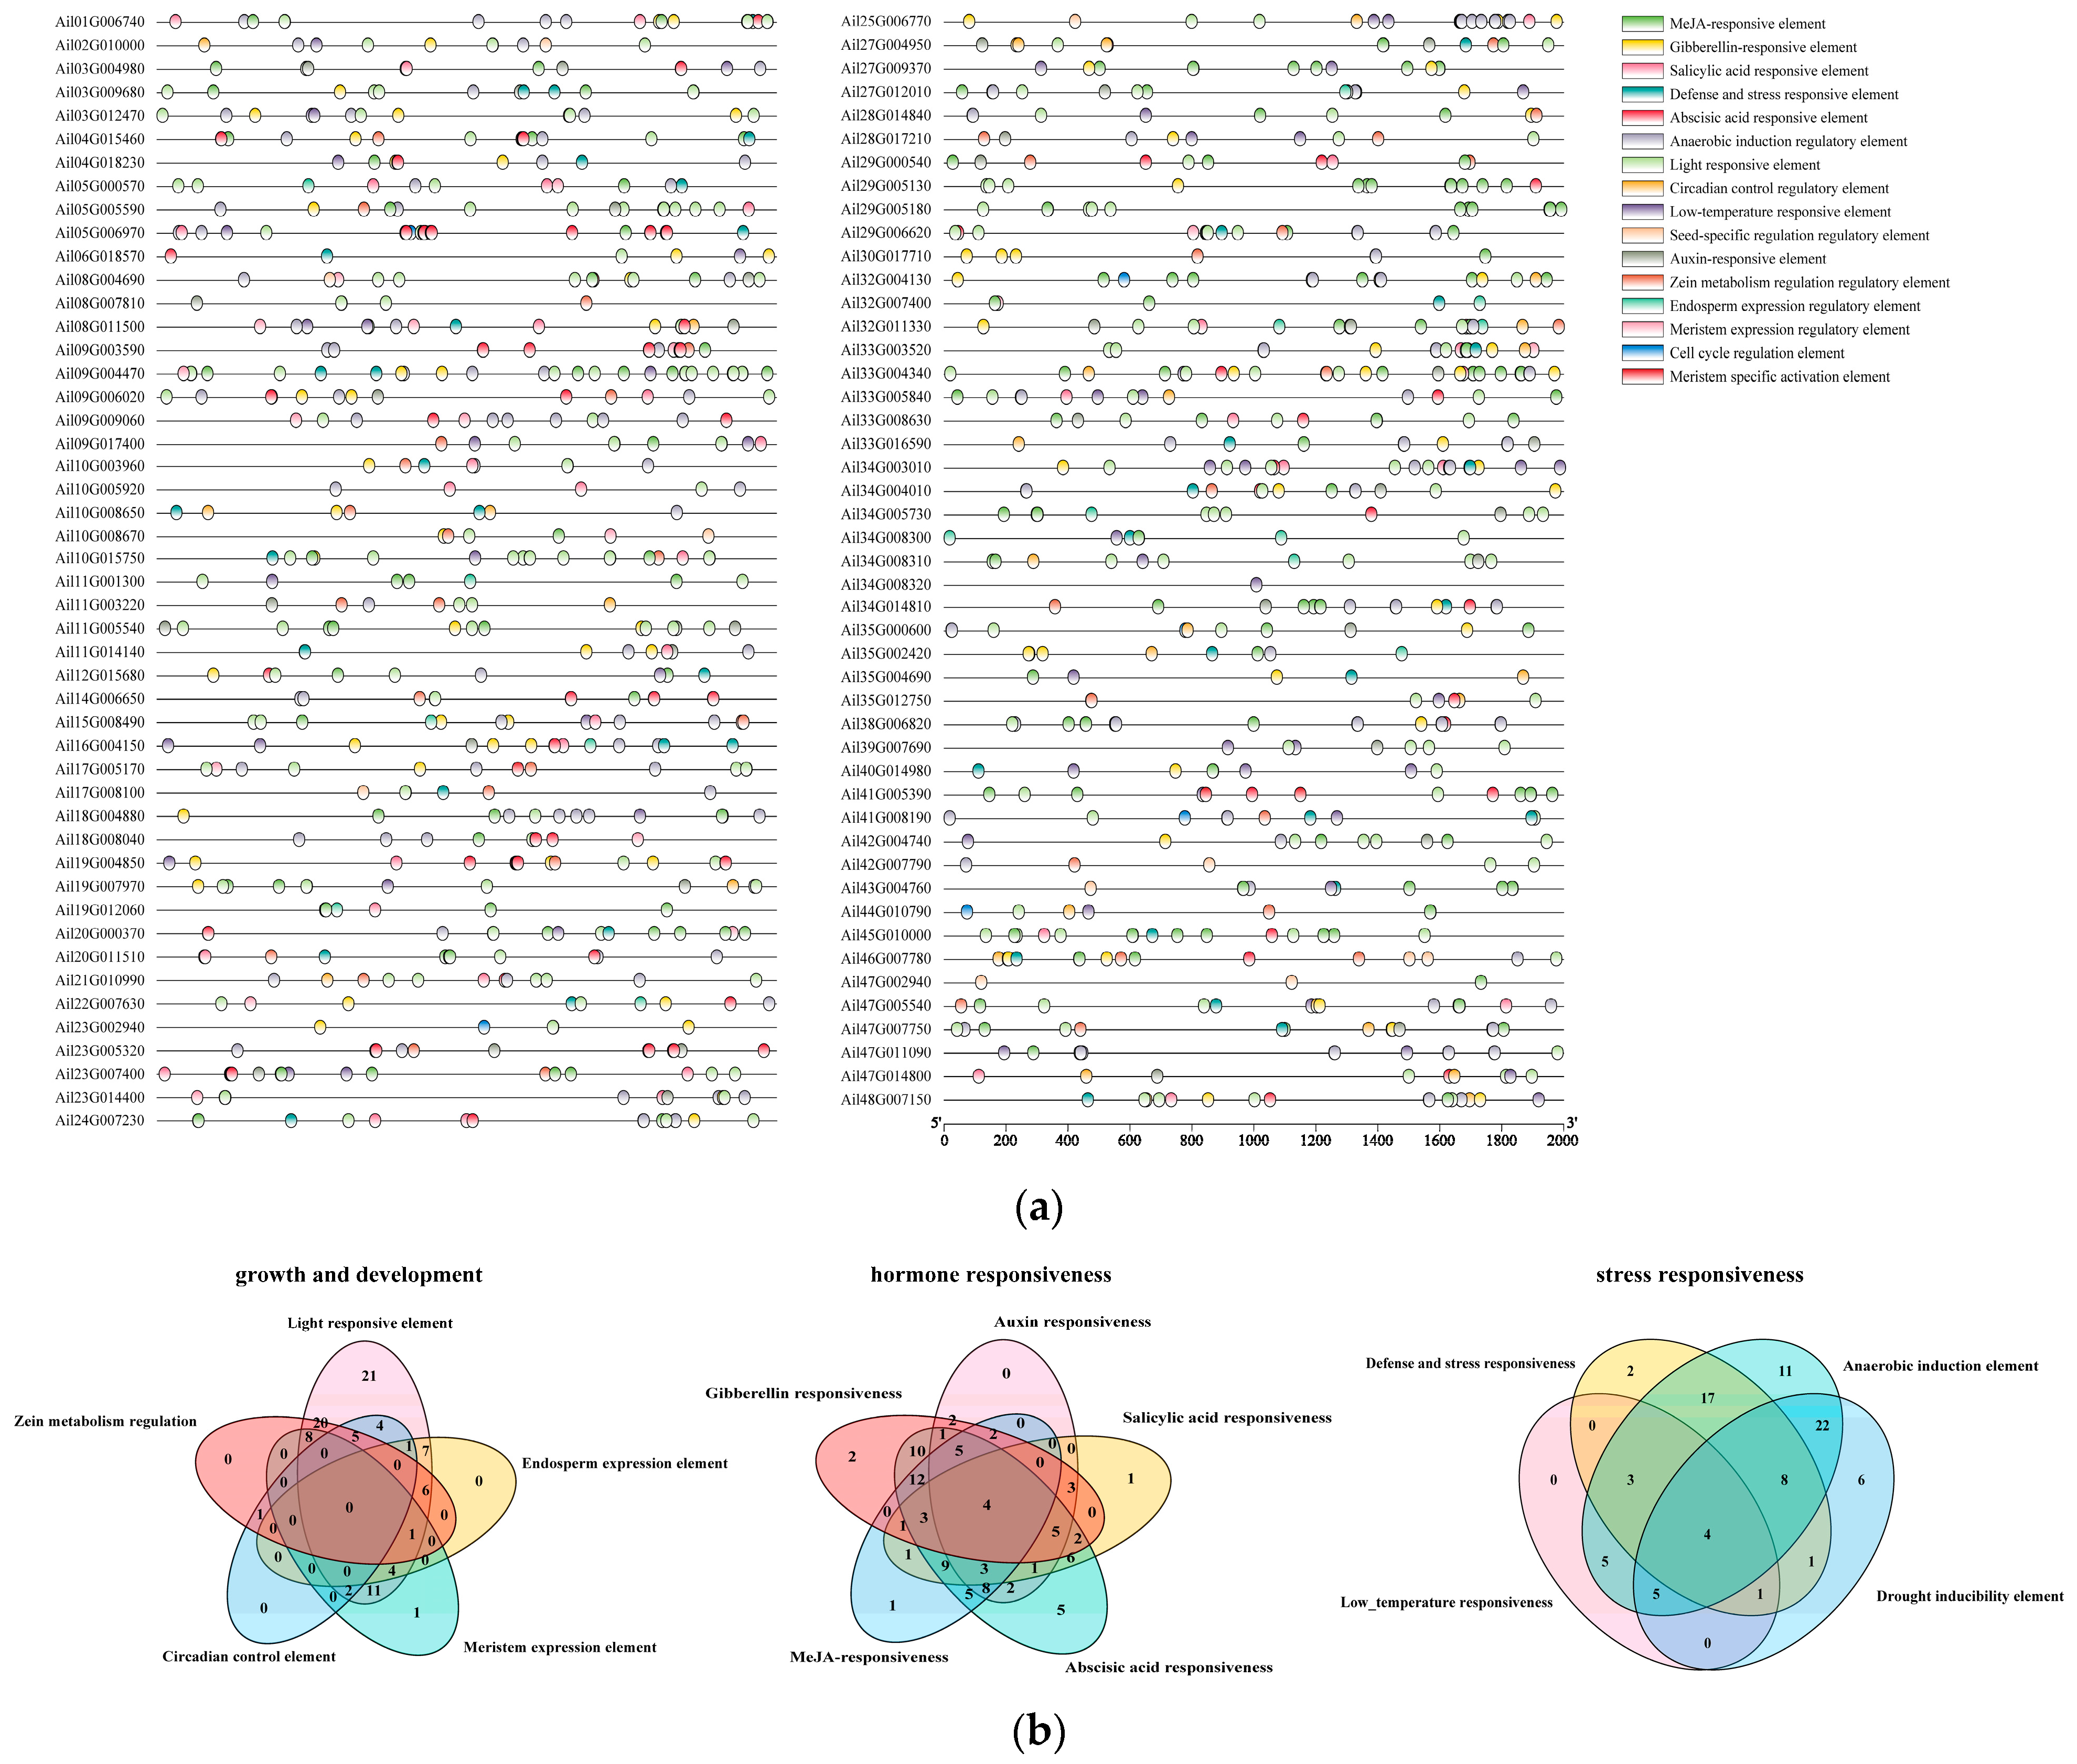
Figure 5.
Expression heatmap of GATA transcription factor under different stress treatments. (a) Heat map of GATA expression after 12 h salt treatment; (b) Heat map of GATA expression after 48 h salt treatment. H and L represent high salinity and low salinity; L, S, and R represent the leaves, stems, and roots tissues of A. ilicifolius respectively.
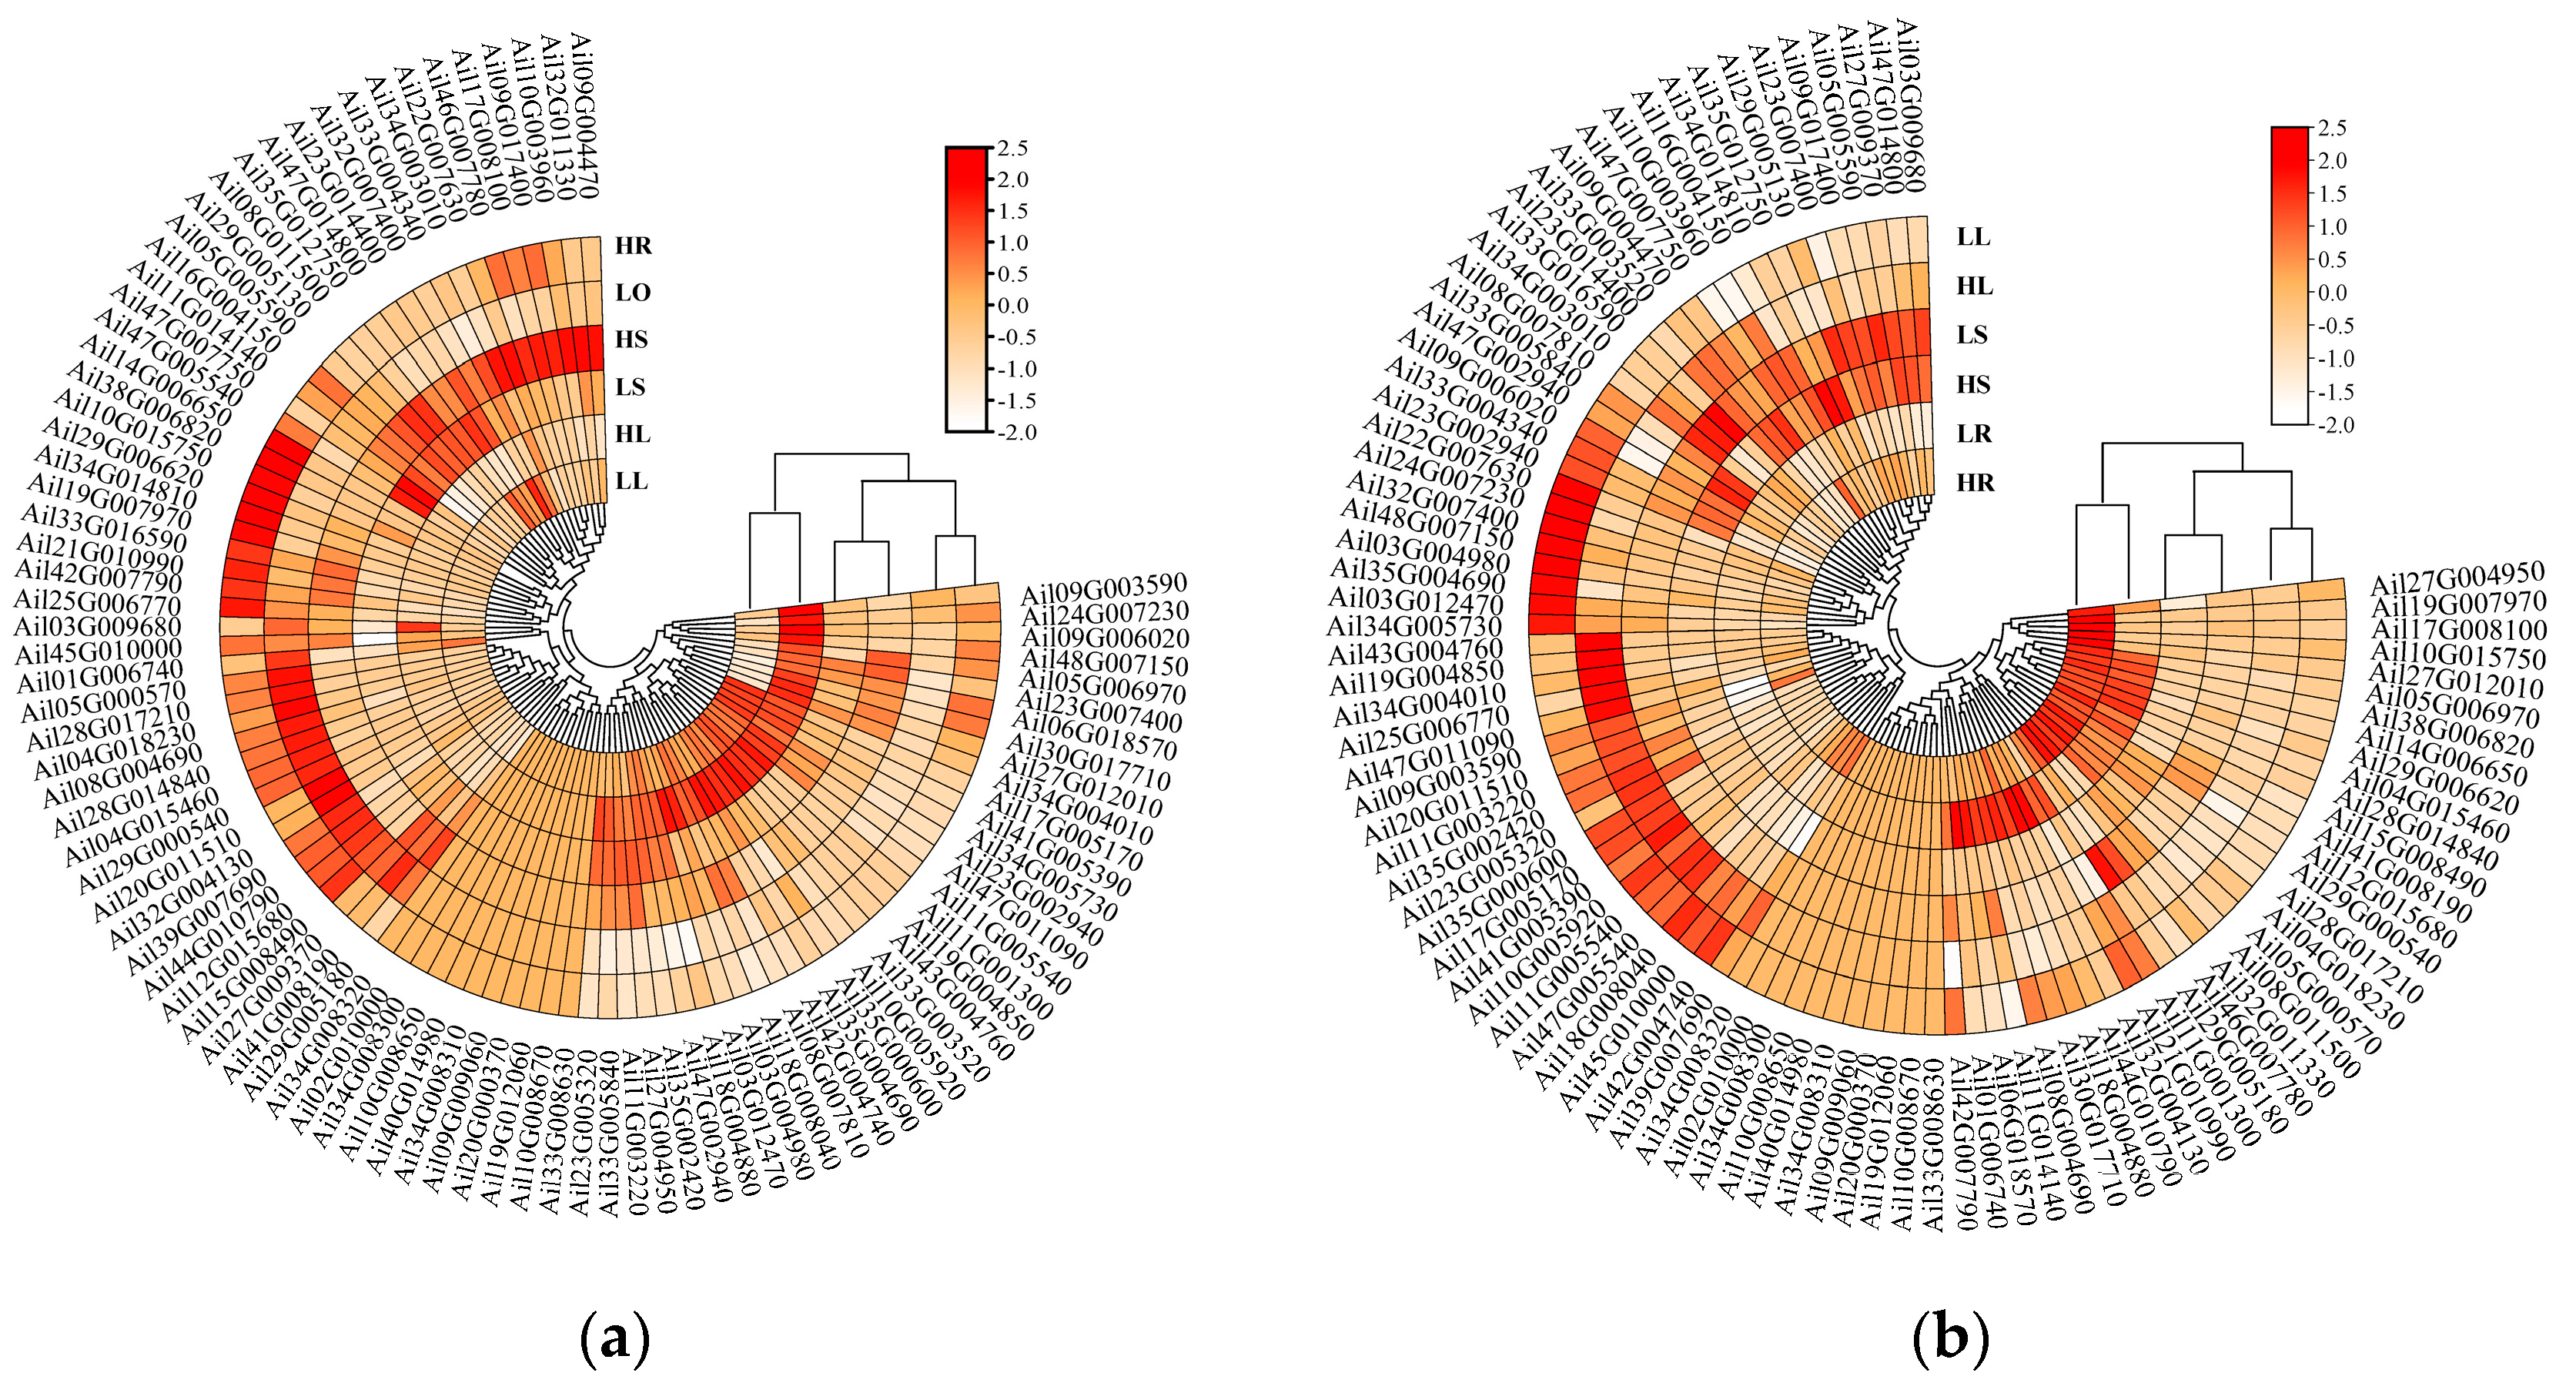
Figure 6.
Venn diagrams of GATA DEGs under different treatments: (a) the number of up regulated genes after 12 h treatment. (b) : the number of down regulated genes after 12 h treatment. (c) : the number of up regulated genes after 48 h treatment. (d) : the number of down regulated genes after 48 h treatment.
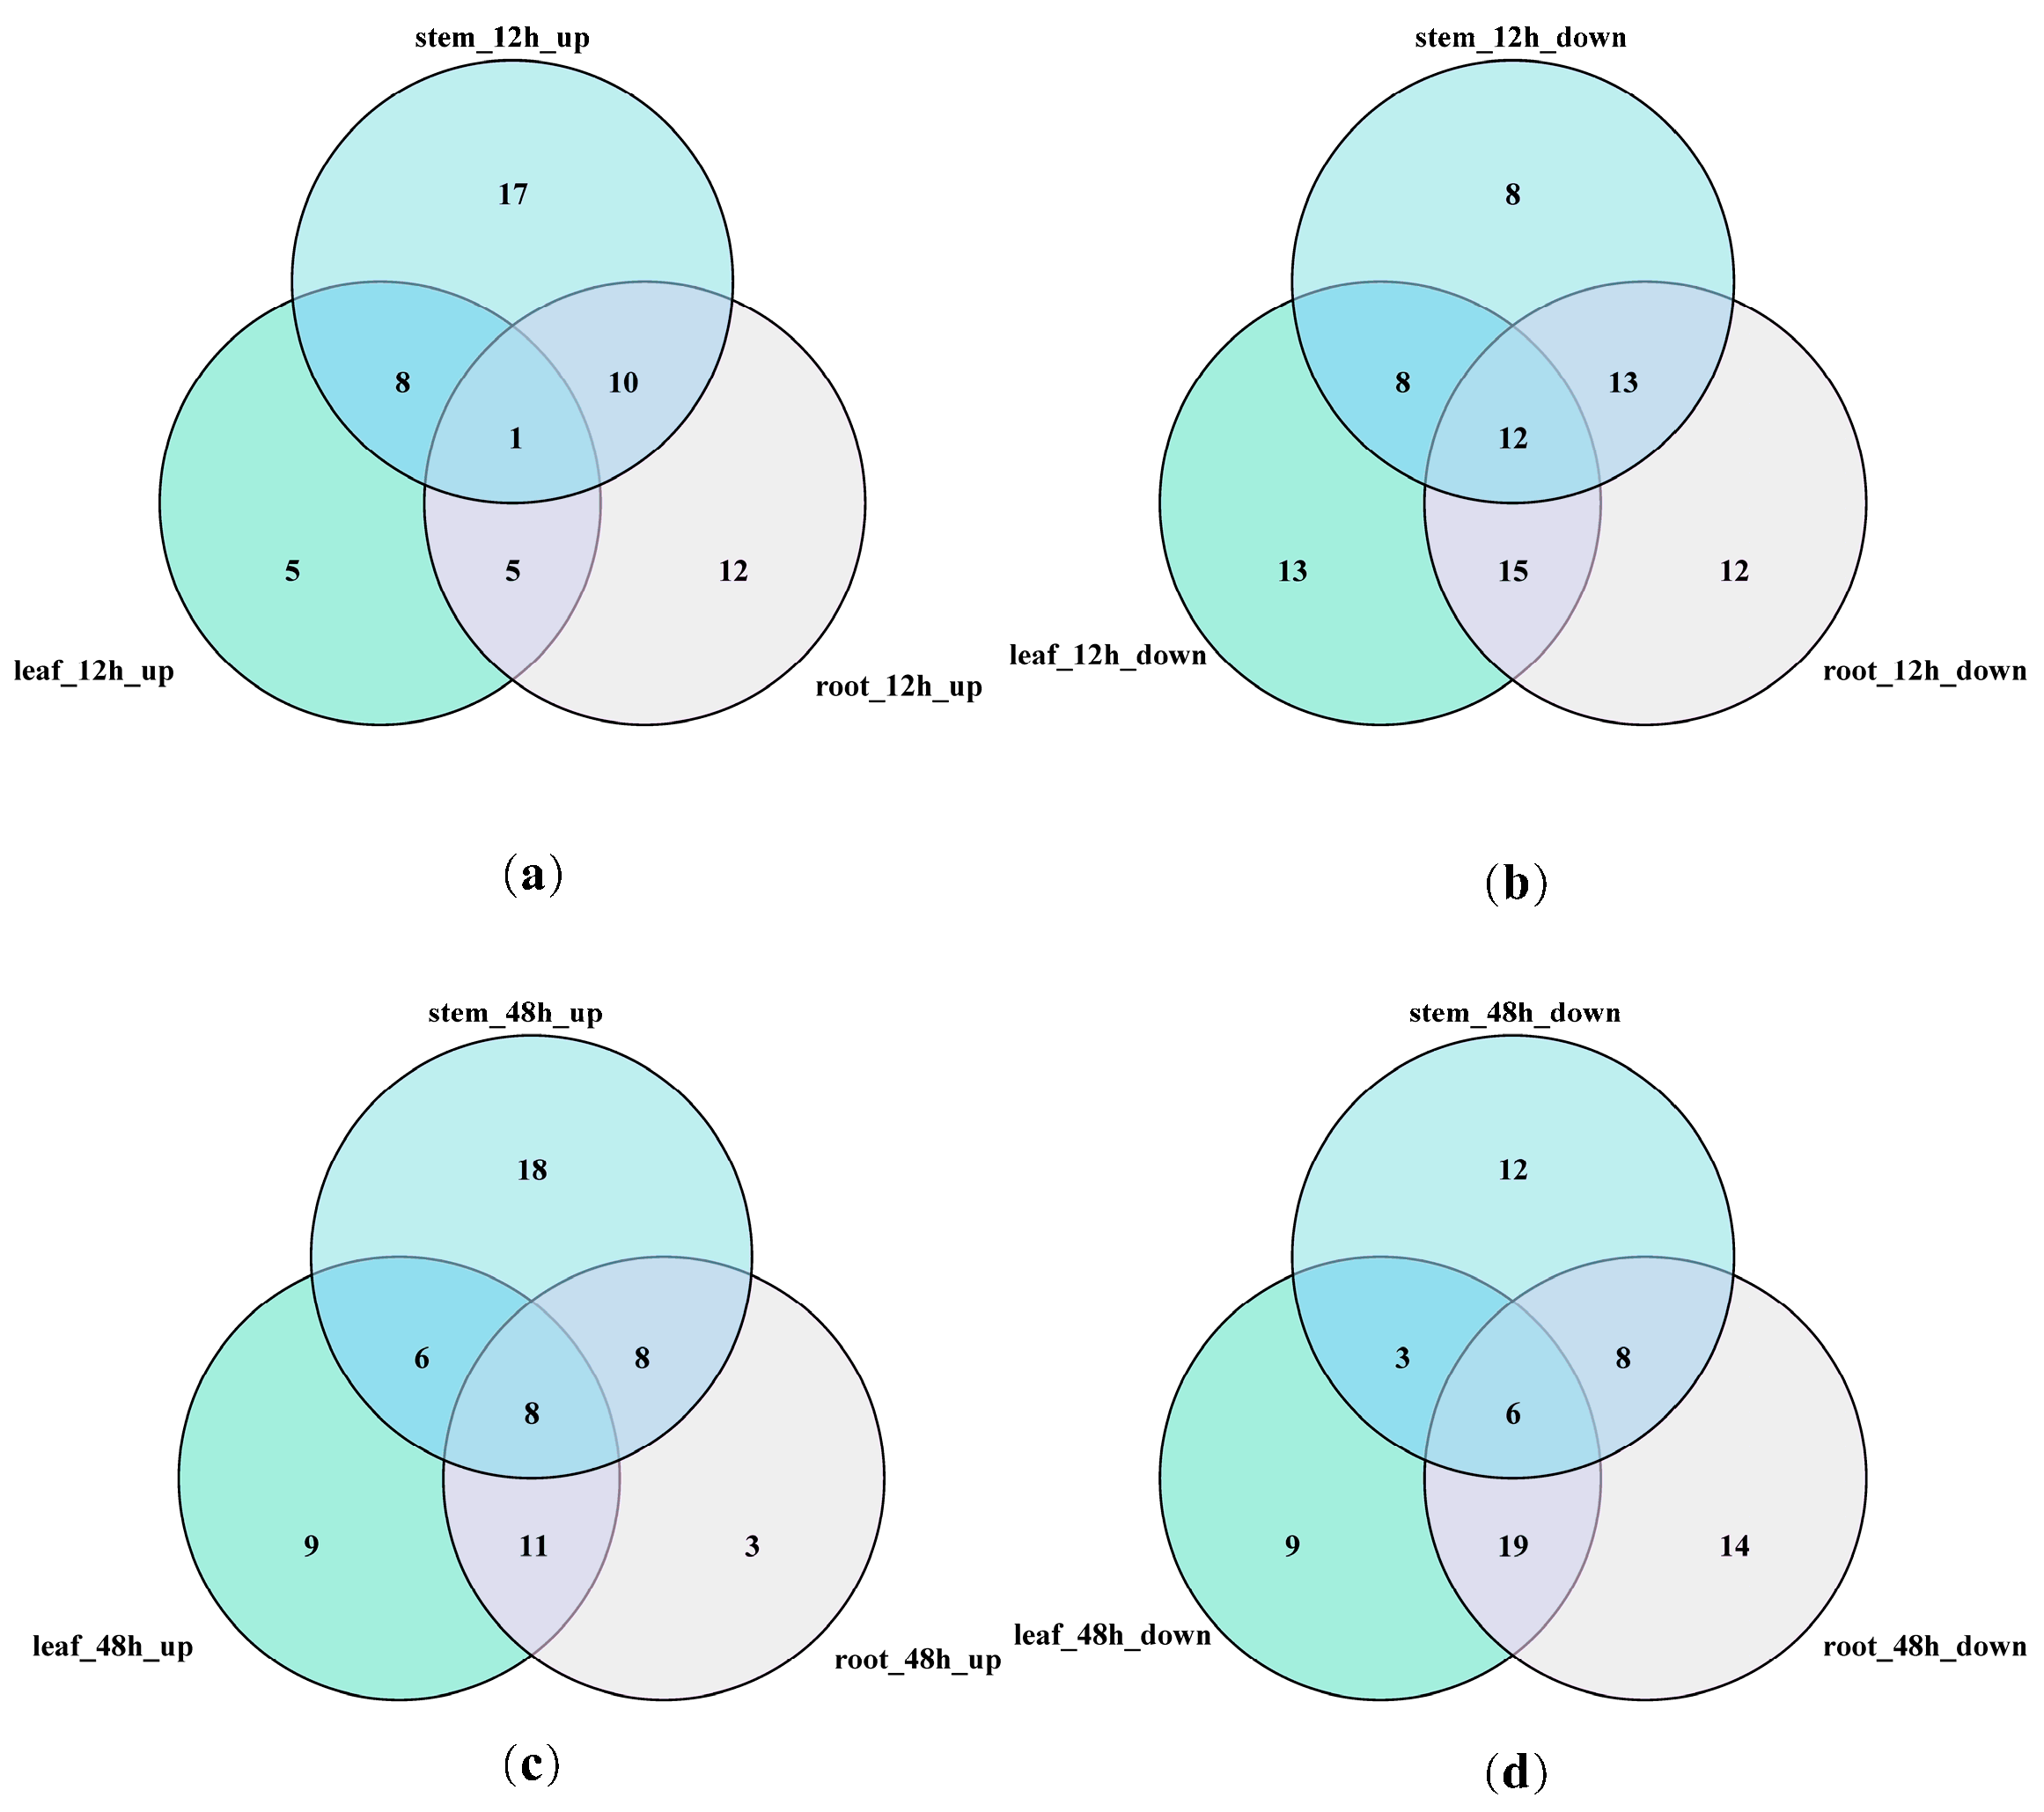
Figure 7.
Real-time fluorescence quantitative PCR verification of 8 differentially expressed genes under salt stress: (a) Gene expression levels after 12 h treatment under different salinity; (b) Gene expression levels after 48 h treatment under different salinity.
Figure 7.
Real-time fluorescence quantitative PCR verification of 8 differentially expressed genes under salt stress: (a) Gene expression levels after 12 h treatment under different salinity; (b) Gene expression levels after 48 h treatment under different salinity.
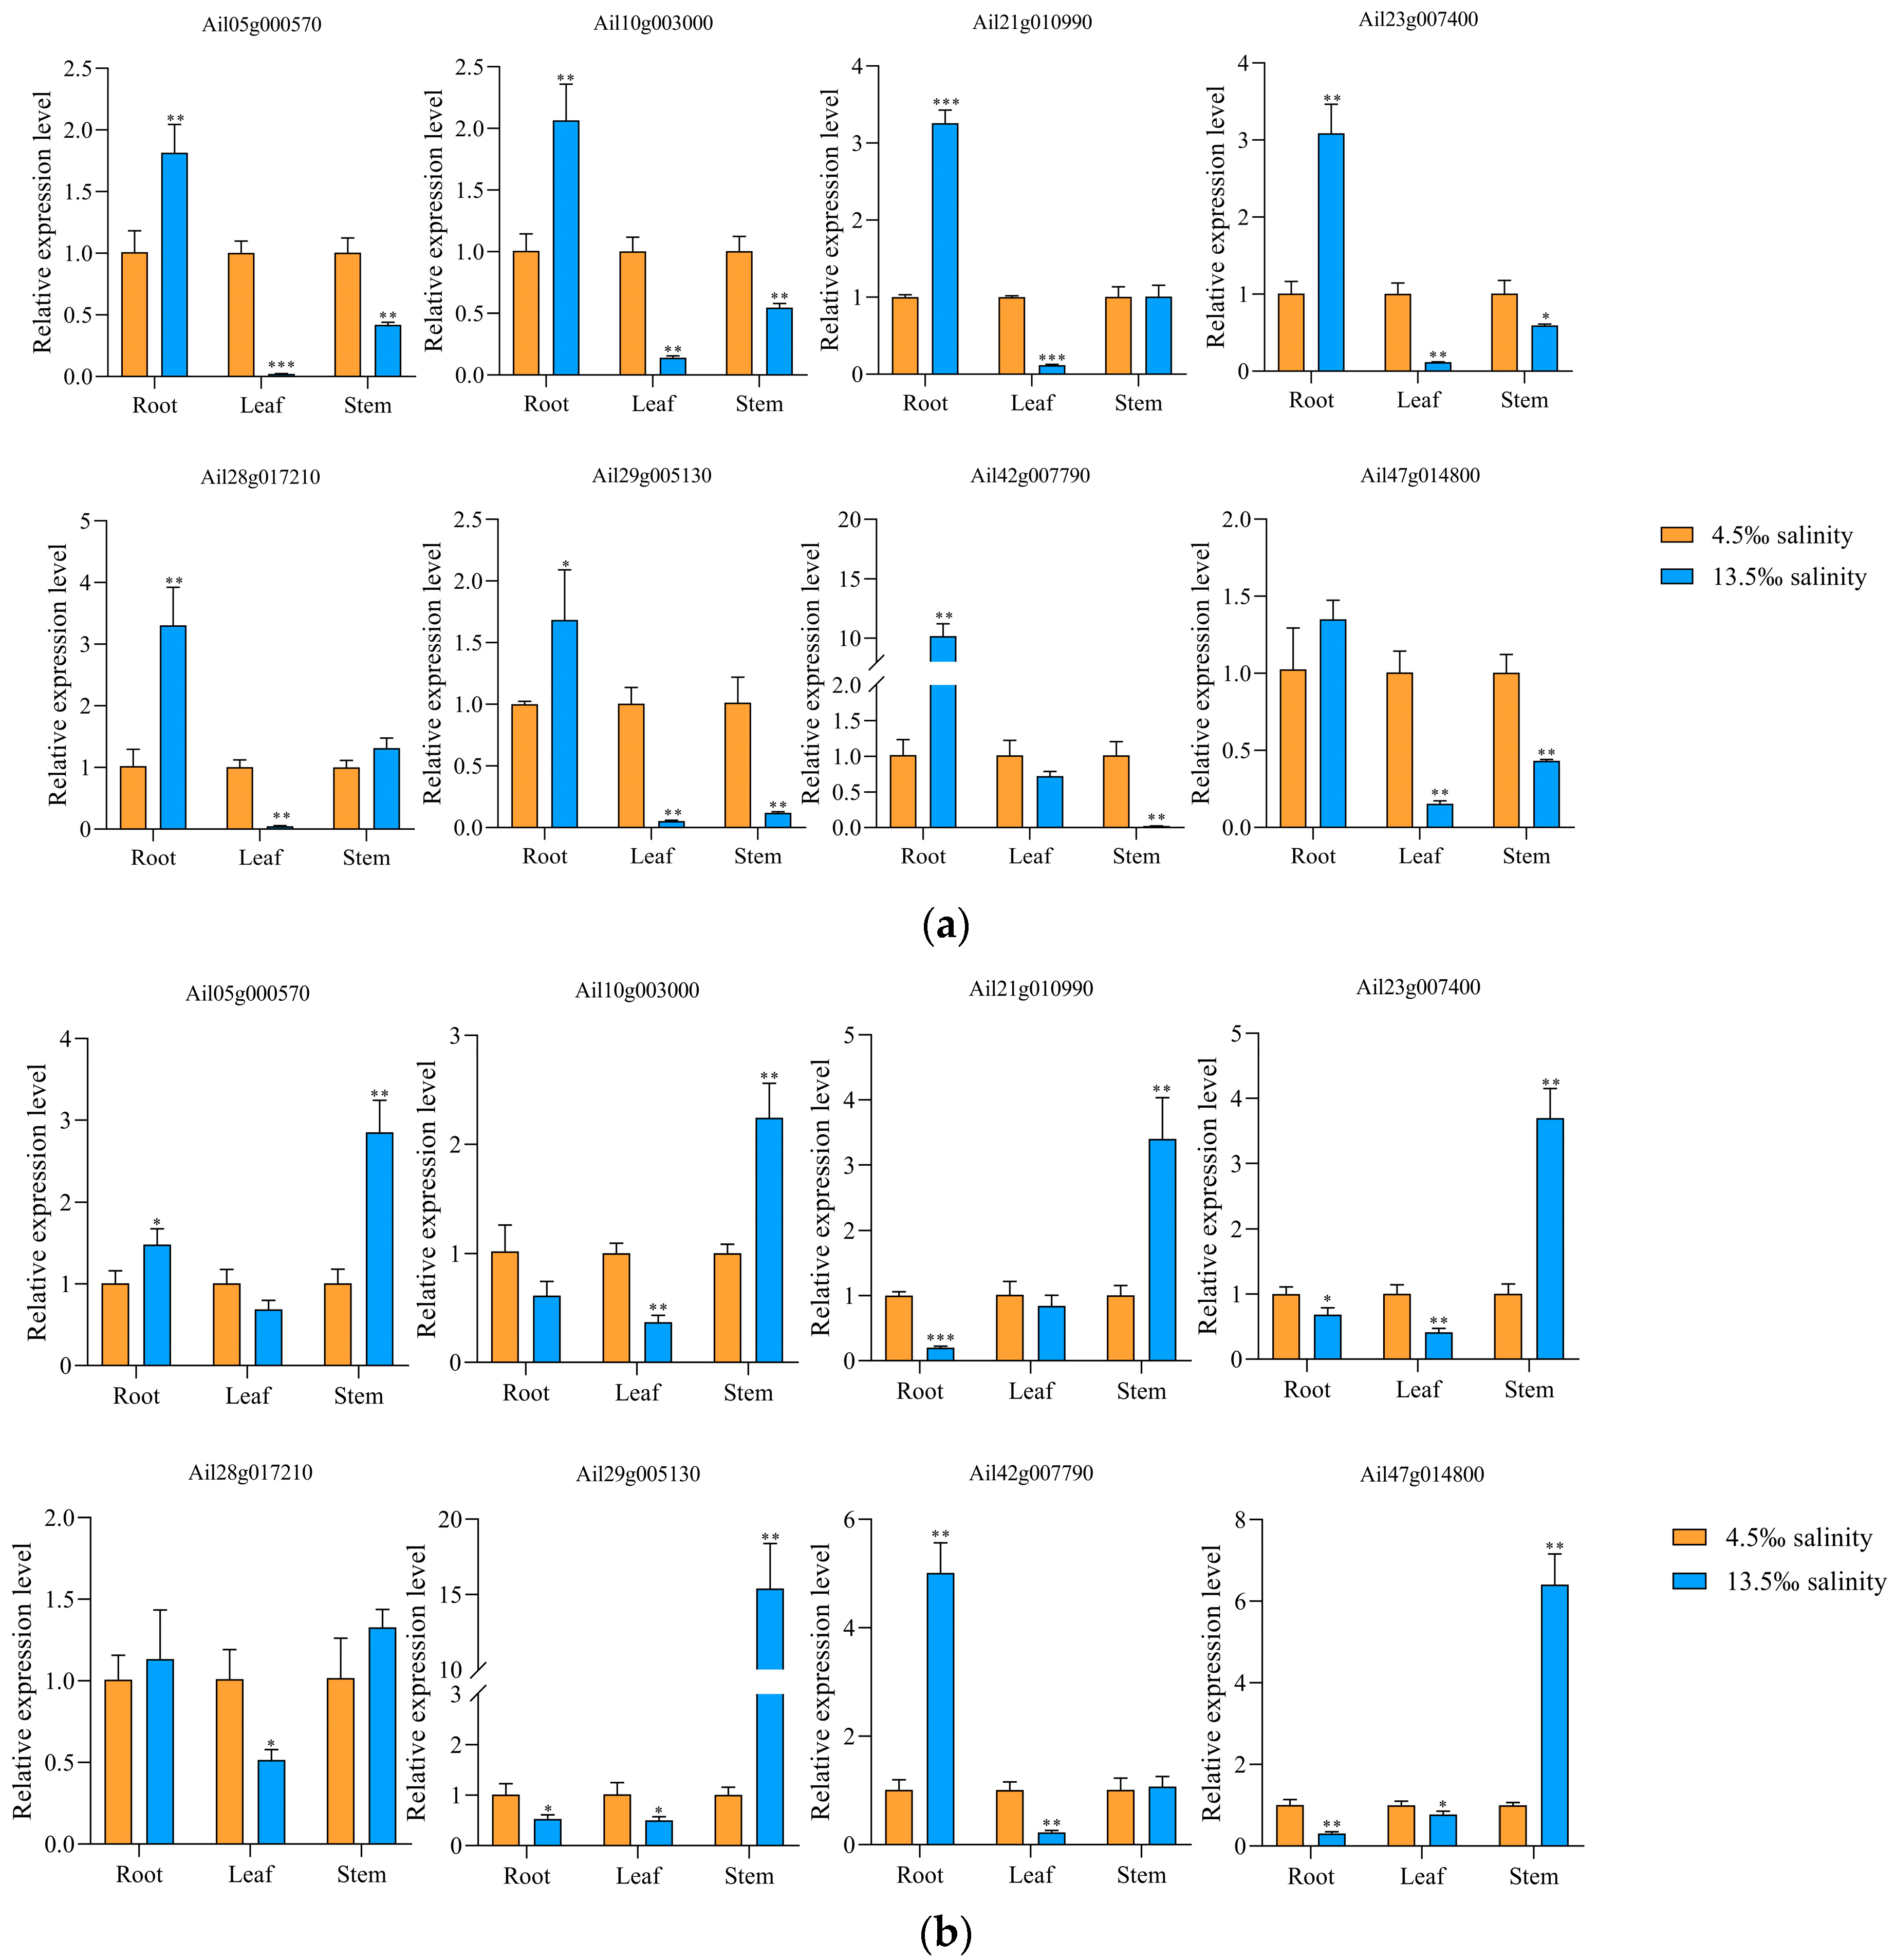
Figure 8.
Interaction network of GATA transcription factors in Arabidopsis. The brackets represent the corresponding GATA gene of A. ilicifolius.
Figure 8.
Interaction network of GATA transcription factors in Arabidopsis. The brackets represent the corresponding GATA gene of A. ilicifolius.
Disclaimer/Publisher’s Note: The statements, opinions and data contained in all publications are solely those of the individual author(s) and contributor(s) and not of MDPI and/or the editor(s). MDPI and/or the editor(s) disclaim responsibility for any injury to people or property resulting from any ideas, methods, instructions or products referred to in the content. |
© 2025 by the authors. Licensee MDPI, Basel, Switzerland. This article is an open access article distributed under the terms and conditions of the Creative Commons Attribution (CC BY) license (http://creativecommons.org/licenses/by/4.0/).
Copyright: This open access article is published under a Creative Commons CC BY 4.0 license, which permit the free download, distribution, and reuse, provided that the author and preprint are cited in any reuse.


