
Submitted:
23 July 2025
Posted:
24 July 2025
You are already at the latest version
Abstract
Territorial resilience is becoming increasingly recognised in contemporary spatial planning, referring to a territory’s capacity to withstand, adapt to, recover from, and transform in response to environmental, social, and economic pressures. However, several constraints limit its operationalisation in planning. A key element to addressing this gap is to investigate where and which interventions are most urgently needed to tackle the impact of hazards on territories. This can be achieved by understanding and localising the vulnerabilities of territorial systems, thereby enabling the definition of appropriate mitigation and adaptation measures. This paper presents the application of R3C-GeoResilience, an open-source GIS tool and its methodological framework, which enables mapping territorial vulnerabilities across different geographical contexts and spatial scales. The methodology is applied to the Italian case of the Union of Bassa Romagna (UBR), aiming to build capacity for local practitioners to implement resilience thinking in decision-making processes. Findings underscore the potential of R3C-GeoResilience to enhance evidence-based planning and policymaking, supporting adaptive and transformative strategies for tackling territorial vulnerabilities. The application of the research demonstrates the replicability and adaptability of the methodological framework for integrating participatory vulnerability mapping into local governance and urban planning strategies, thereby enhancing the resilience of territories.
Keywords:
urban resilience
; vulnerability
; policy making
; urban planning
; R3C-GeoResilience
1. Introduction
Contemporary cities are navigating a landscape marked by an unprecedented state of uncertainty, complexity, and surprise. In this context, resilience is increasingly prescribed as a toolkit to tackle the current state of crisis, both by the academic community and policy arenas, particularly in dealing with the systemic challenges of cities. Recent advancements in resilience thinking reflect a paradigmatic shift: moving away from a static, equilibrium-based understanding of resilience, which promotes bouncing back to normality, toward a more dynamic perspective that emphasises the capacity to adapt, transform, and even flourish. This reconceptualisation happens in line with a broader paradigm shift that views the world as complex, non-linear, and constantly evolving, rather than as orderly, mechanical, and predictable. In this context, the frameworks of social-ecological resilience [1], evolutionary resilience [2,3] and co-evolutionary resilience [4,5] have emerged as important contributions to this evolving theoretical landscape.
However, this conceptual innovation has not yet been adequately matched by operational effectiveness through context-specific actions for enhancing resilience in cities. This gap stems from several limitations, including the lack of robust methodologies for identifying meaningful measures of resilience that consider the spatial dimension and the geographical distribution of factors affecting resilience. Currently, several valuable frameworks exist that analyse resilience or vulnerability in different ways. For example, the JRC Resilience Dashboards define indicators of capacities and vulnerabilities to evaluate resilience as the ability to advance toward policy objectives [6]. The Building Resilient Neighbourhoods initiative identifies key community aspects that contribute to neighbourhood resilience and offers a checklist for analysis [7]. MCR2030 proposes a three-stage 'resilience roadmap' to guide cities in enhancing resilience over time [8].
While these frameworks provide valuable insights into various factors that support community resilience, they do not address the spatial dimension at the local scale in their analyses. The other limitation regards the failure to account for the complexity and interconnectedness of negative trends, systemic disruptions, and hazards that influence the systems. More in detail, the increasing frequency and severity of natural and human-induced disasters, alongside widening inequalities, fractured social fabrics, and escalating geopolitical tensions, are co-evolving and mutually reinforcing each other and creating a complex web of systemic vulnerability [9]. While these challenges are deeply interconnected, policy responses often remain fragmented and siloed. Even when such disruptions occur at different points in time, they are usually systemically linked, with the potential to reproduce or intensify one another.
To address the aforementioned scientific challenges, it is essential to identify which dimensions of the urban or territorial system can be spatially measured to support policymakers and planners in building preparedness capacities. This is crucial for designing interventions that not only prevent undesirable trends and catastrophic events but also enable structural transformations that strengthen long-term resilience. Accordingly, vulnerability is the analytical entry point for understanding where and how systems are most at risk, providing the necessary basis for targeted, context-based resilience strategies. To be more specific, vulnerability is one of the three dimensions of risk, together with exposure and hazard. Vulnerability can be defined as the propensity or predisposition to be adversely affected and the lack of capacity to cope and adapt [10]. It represents the likelihood that assets will be damaged when exposed to a hazard [11]. Vulnerability encompasses "the conditions determined by physical, social, economic and environmental factors or processes, which increase the susceptibility of a community to the impact of hazards” [12]. The degree of vulnerability of a territorial system directly affects its resilience, making it crucial to adopt targeted adaptation measures to enhance its response and transformation capacities [5].
This research aims to present a methodological approach and a place-based vulnerability mapping plugin in QGIS, called R3C-GeoResilience, which favours the expertise of local practitioners and addresses the complexity and interconnectedness of environmental, infrastructural, and socio-economic factors. It particularly moves beyond fragmented and reactive responses, enabling more anticipatory and proactive planning through a multi-risk analysis. The article introduces the plugin as a tool developed to operationalise this conceptual framework and support institutions in designing place-based pathways toward territorial resilience [13]. To do so, the Union of Bassa Romagna (UBR) is selected as the case study for the vulnerability analysis.
UBR is a public body established in 2008 to coordinate territorial governance and improve service delivery across nine municipalities. Located in the heart of the province of Ravenna, approximately 40 kilometres from the Adriatic Sea, the UBR lies within the vast alluvial plains that precede the Romagna hills. Its strategic position offers relatively good accessibility, benefiting from proximity to key regional economic hubs such as Bologna and other centres along the Via Emilia, as well as its connection to the E55 highway. Despite its modest population size, around 100,000 inhabitants, the UBR plays a crucial role in regional governance. Among the municipalities participating in the UBR, Lugo is the most populous municipality, with 31,854 residents, while Bagnara di Romagna is the smallest, with 2,425 inhabitants [14]. The area's landscape has been historically shaped by an extensive network of canals and wetlands, reinforcing its strong agricultural identity. However, its geomorphological characteristics, situated between the hills and the Adriatic Sea, make it particularly vulnerable to extreme weather events, most notably – but not limited to – flooding and hydraulic risk, which frequently cause environmental, economic, and social disruptions. As shown in Figure 1, more than 45 per cent of the Emilia-Romagna Region is exposed to low- and medium-probability hazards (LPH and MPH), while over 10 per cent of the Region is exposed to high-probability hazards (HPH). This makes the Region rank first among Italian regions in terms of exposure to flood risk [15]. In recent years, the region has faced increasingly severe flooding events, particularly in May 2023 and September 2024, when extreme meteorological phenomena caused widespread devastation in large portions of Romagna. These crises have underscored the need to reassess the governance model of the UBR, utilising its multi-municipal structure to develop coordinated strategies for disaster resilience. The declared goal is to develop long-term adaptation solutions that address the challenges of a shared governance system. Currently, the UBR manages 29 municipal services, with key investments in social welfare, environmental management, urban planning, and security, ensuring strong institutional support and proximity to citizens [16]. Moreover, the UBR plays a fundamental role in coordinating Civil Protection efforts: while operational responsibilities remain with individual mayors, strategic disaster management is handled by UBR-appointed officials. In this sense, the UBR not only acts as an implementing actor but also as an intermediary between global climate policy frameworks and local realities, helping translate high-level strategies into context-sensitive actions that respond to the specific vulnerabilities and capacities of the territory, which proves its key role in the multi-level governance structure of the area. Within this framework, the UBR is also developing its General Urban Plan, which integrates measures to improve territorial development and enhance resilience. Recognising the growing challenges posed by climate change, the capacity building initiative VALUE4UCBR has been launched which aims to equip public administrators and technical professionals with the tools and knowledge necessary to address territorial vulnerabilities and enhance disaster preparedness and long-term resilience. This is part of an effort to foster collaborative governance and strengthen institutional capacity, enabling UBR to turn existing challenges into opportunities and ensure a more resilient and sustainable future for the region.
The initiative has delivered three different capacity-building activities. The first action concerned information and training. This phase was dedicated to the theoretical and conceptual foundation of resilience. Public officials and administrators were trained through expert-led seminars and online sessions, equipping them with up-to-date knowledge on resilience strategies and best practices. The implementation of the territorial resilience lab activity followed it. Technical professionals were engaged in hands-on workshops to test and apply vulnerability analysis methodologies using the R3C-GeoResilience tool. Participants gained insights into data collection, scenario analysis, and resilience analysis frameworks. In parallel, the GIS-based mapping for territorial vulnerabilities was performed. The initiative lays the foundation for addressing the territorial vulnerabilities and subsequently facilitates informed decision-making, effective risk management, and sustainable urban planning by equipping policymakers and local practitioners with the necessary skills and analytical tools.
The following sections will first present the methodological approach and a detailed explanation of the GIS tool. Subsequently, the role of the training program and the capacity-building workshop with local practitioners in refining the research will be discussed. The paper concludes with the presentation of the main results and key insights emerging from the study.
2. Materials and Methods
The methodology adopts two key international frameworks, both of which conceptualise risk as a compound factor. First, according to the United Nations Office for Disaster Risk Reduction (UNDRR) [12], to improve understanding of disaster risk, it is necessary to break it down into three dimensions: exposure, vulnerability, and hazard characteristics. Vulnerability, as one of the three risk dimensions, is defined as “the conditions determined by physical, social, economic and environmental factors or processes, which increase the susceptibility of a community to the impact of hazards”. In the same vein, the Intergovernmental Panel on Climate Change - IPCC [10], clarifies that “risks result from dynamic interactions between climate-related hazards with the exposure and vulnerability of the affected human or ecological system to the hazards.” This threefold conceptualisation of risk and the definition of each dimension is represented in Table 1.
Among these three dimensions of risk, we choose vulnerability to study and measure. To measure vulnerability, two fundamental questions must be answered: first, vulnerability of what, and second, vulnerability to what. To address the vulnerability of what, we refer to the territorial system's physical, socio-economic, and environmental characteristics (the system's conditions), and to address the vulnerability to what, we consider the impacts of the hazard (either trends or events).
In other words, analysing vulnerabilities of territorial systems requires an integrated understanding of both system conditions and hazards. Conditions refer to the inherent characteristics of a territorial system that influence its susceptibility to disturbances. These include physical, social, and environmental attributes— such as demographic composition, land use, soil consumption, the quality of the built environment and building stock, and the state of infrastructure —which together define the system’s baseline fragility. These conditions then need to be correlated with the short-term and long-term hazards, which encompass trends and events that can stress or disrupt the system. Trends act as gradual stressors, such as economic decline, rapid urbanisation, natural and built environmental degradation, and energy demand increase due to climate change [17], while events refer to sudden shocks like earthquakes, floods, or extreme weather occurrences.
The tool operationalises this framework by evaluating the interplay between the system’s conditions and hazards through a matrix-based weighting system (hereafter referred to as the correlation matrix). To achieve this, indicators referring to conditions of the system are systematically linked to trends and events, enabling the quantification of their cumulative impact [13]. Table 2 represents a prototype of the correlation matrix, which, in the first two columns, presents the conditions of the system divided into three components that define the fundamental characteristics of a territory, which are influential on its vulnerability. These components include (A) natural environment & landscape; (B) built environment, cultural heritage & infrastructure; and (C) economy & society. In addition, the hazards to which vulnerability is analysed are divided into trends and events.
The correlation matrix serves as a weighting mechanism, enabling the consideration of expert assessments to assign relative importance to the intersections between condition indicators (the rows) and hazard indicators (the columns). These weights are based on an ordinal scale, where experts evaluate the strength of the relationship as none, weak, strong, or very strong, corresponding to the values 0, 1, 2, and 3, respectively. In other words, experts assess the extent to which the system conditions represented by each indicator may influence—positively or negatively—the territorial resilience in response to each trend or event. For each indicator—whether related to conditions or hazards—a GIS representation is provided using 500 × 500 meter geographical units. These maps, on one hand, and the weights from the correlation matrix, on the other, are then integrated using the spatial overlay technique to generate the vulnerability index. More specifically, for each geographical unit or map cell, the vulnerability index is calculated by summing the products of all possible pairs of condition and hazard indicator values, each multiplied by the corresponding weight from the correlation matrix.
Building on the mathematical framework, the QGIS plugin (Figure 2) operationalises the vulnerability assessment in a user-friendly and flexible environment. It allows users to define and update spatial indicators based on local conditions, integrate new data, and visualise vulnerability maps. Developed in Python with Qt libraries, the plugin accepts input via Excel, applies the correlation matrix for calculations, and supports interactive visualisation and integration with web-based geospatial services. Validated through training workshops, it supports real-world planning by helping practitioners refine indicators and develop locally grounded adaptation strategies.
As illustrated in the previous section, vulnerability is a place-based concept that, when it comes to its measurement, requires flexibility in the selection and application of spatial indicators. In this context, the plugin proves particularly effective, as it allows both the flexibility to define new indicators for each component based on the specific characteristics of the territory and the capacity to enable continuous updates of the spatial indicators being monitored. New indicators can be easily introduced and inserted in place of the old ones if new data becomes available or scientific advancements are made in the field, leading to more solid and holistic indicators. Additionally, the plugin’s flexibility enables the timely integration of new data as soon as it becomes available.
The development of the plugin was not only a technical endeavour but also a key component of a broader participatory process aimed at embedding the tool within real-world planning practices. To ensure its effective application and local relevance, the plugin and its methodological framework were tested and validated through a dedicated training program and capacity-building workshop with local practitioners. The following paragraphs outline the structure and implementation of this process within the capacity-building initiative, highlighting the active involvement of public officials in refining indicators, applying the tool, and shaping locally relevant adaptation strategies.
The involvement of local practitioners was an integral component of the research conducted within the VALUE4UCBR. This involvement had two main objectives: first, to engage local practitioners in selecting the most representative indicators for a context-based analysis of vulnerability; and second, to inform and train public officials and administrators of the UBR on territorial resilience by providing both theoretical foundations and practical strategies to support decision-making.
Therefore, local practitioners actively contributed to the selection of indicators. The indicators employed in this analysis were defined during a preliminary phase of desk research, where the availability of data was also considered, and subsequently supported by feedback from UBR local practitioners to verify their local relevance. The spatial data were extracted from open-access GIS dataset sources [18,19,20,21,22,23,24,25,26,27,28,29] or provided directly by the UBR. The finalised indicators were systematically structured, in accordance with the established methodological framework, into the three dimensions: the conditions of the systems, trends, and events. The following step, an in-person workshop, played a pivotal role in refining the methodological approach, facilitating the validation and further calibration of the indicators through several feedback sessions with local practitioners of UBR. The outcome of this iterative process is a finalised set of indicators, presented in Table 3. A detailed breakdown of these categories and their associated indicators, along with the source of the spatial data used to calculate the indicators, is presented in Table S1. In addition, the maps related to each indicator are presented in Figures S1 to S25 in the Supplementary Material.
Additionally, local practitioners of UBR received training designed to enhance their capacity for resilience-oriented decision-making. The training was structured into two phases: an initial series of theoretical and technical lectures followed by a hands-on workshop. The first phase consisted of four online sessions, which introduced key concepts and methodologies for measuring and mapping vulnerabilities, as well as presenting the methodology and the QGIS tool. The sessions covered several themes, including resilience in spatial planning, the analysis of territorial vulnerabilities, and the methodological approach developed for mapping these vulnerabilities. The second phase consisted of an in-person workshop held over two days, designed to translate theoretical knowledge into practice, as shown in Figure 3. During the workshop, an introduction to the methodology was provided, and each spatial indicator was presented and discussed. The participants' feedback was collected in real-time using the MIRO platform. This enabled the final selection and refinement of the indicators inserted into the plugin, which were used to calculate and map the vulnerability index. Following this, the Excel-based correlation matrix was shared with every participant, and they individually attributed the relationship values between the indicators as explained in the methodology section. This process played a crucial role in refining the vulnerability analysis by integrating expert knowledge with local insights. By inserting the indicators and the outcome of the correlation matrix filled out by the participants, overall vulnerability maps were generated in real-time and presented.
Following the workshop, a final online session was held to present and discuss the outcomes of the experimental phase. The key objective was to translate the insights gained from the vulnerability analysis into actionable strategies for mitigation and adaptation, which will be explained in the results and discussions section.
3. Results and Discussions
During the workshop, each participant was asked to complete the vulnerability correlation matrix independently, assigning values from 0 to 3 to reflect the relationship between system conditions indicators and trends and events indicators. This approach allowed for an individualised analysis of indicator importance based on personal expertise. Once all individual matrices were completed, a final summary matrix (as shown in Table 4) was generated by averaging the values assigned by each participant and normalising them. By incorporating local knowledge, the weighting exercise ensured that the most relevant factors influencing vulnerability were emphasised, aligning the analysis with the real dynamics of the territory. The final weighting, therefore, represents a balanced synthesis of local knowledge, contributing to a more context-sensitive and locally informed vulnerability analysis.
Once the indicators and vulnerability matrix are inserted into the plugin, it automatically processes the data and generates weighted vulnerability maps, considering the values of the correlation matrix. The resulting vulnerability maps, presented in Figure 4, show the spatial distribution of vulnerabilities across the study area using the plugin. In particular, the first map represents the Total Vulnerability Index, while the following three maps represent the vulnerability regarding single components of the territorial system. This is achieved by assigning different weights in the last tab of the plugin (see Figure 2). The Total Vulnerability Index is generated by setting all values to 1. Component B Vulnerability, representing only environmental factors, is generated by setting the first two values to 1 and the remaining values to 0. The subsequent two maps are generated following the same principle. This feature of the plugin allows users to quickly identify vulnerable areas across the territory, either by considering all contributing factors or by isolating specific dimensions of the system.
As presented in the maps of Figure 4, a particularly illustrative case, but not limited to, can be the municipality of Lugo, the most populous area within the UBR. The Total Vulnerability Index map indicates that the southern area of Lugo consistently exhibits high vulnerability levels, which warrants further investigation by examining the individual indicators and component-specific maps, which reveal significant nuances. From an environmental perspective (Component A), Lugo's vulnerability is increased by a relatively low Permeable Land Surface Index (PLSI) and low Weighted Green Infrastructure Availability Index (WGIAI). In contrast, Component B – representing Built Environment, Cultural Heritage & Infrastructure – shows lower vulnerability, suggesting that Lugo benefits from relatively robust infrastructural conditions, including denser road networks (WRNDI) and better coverage of educational and healthcare facilities (ESDI and HFDI). Although even here, the Building Construction Characteristics (BCC) shows that the area is concentrated with old building stock. From a socio-economic perspective (Component C), the city exhibits lower capacities, characterised by a high Elderly Population Ratio (EPR), which amplifies vulnerability in the face of various hazards, including floods, heatwaves, and public health crises.
This example illustrates the importance of integrated and holistic vulnerability analysis in guiding targeted and effective resilience strategies. Even when one component in a city, such as infrastructure, performs well, the overall risk may remain high due to weaknesses in environmental or social dimensions.
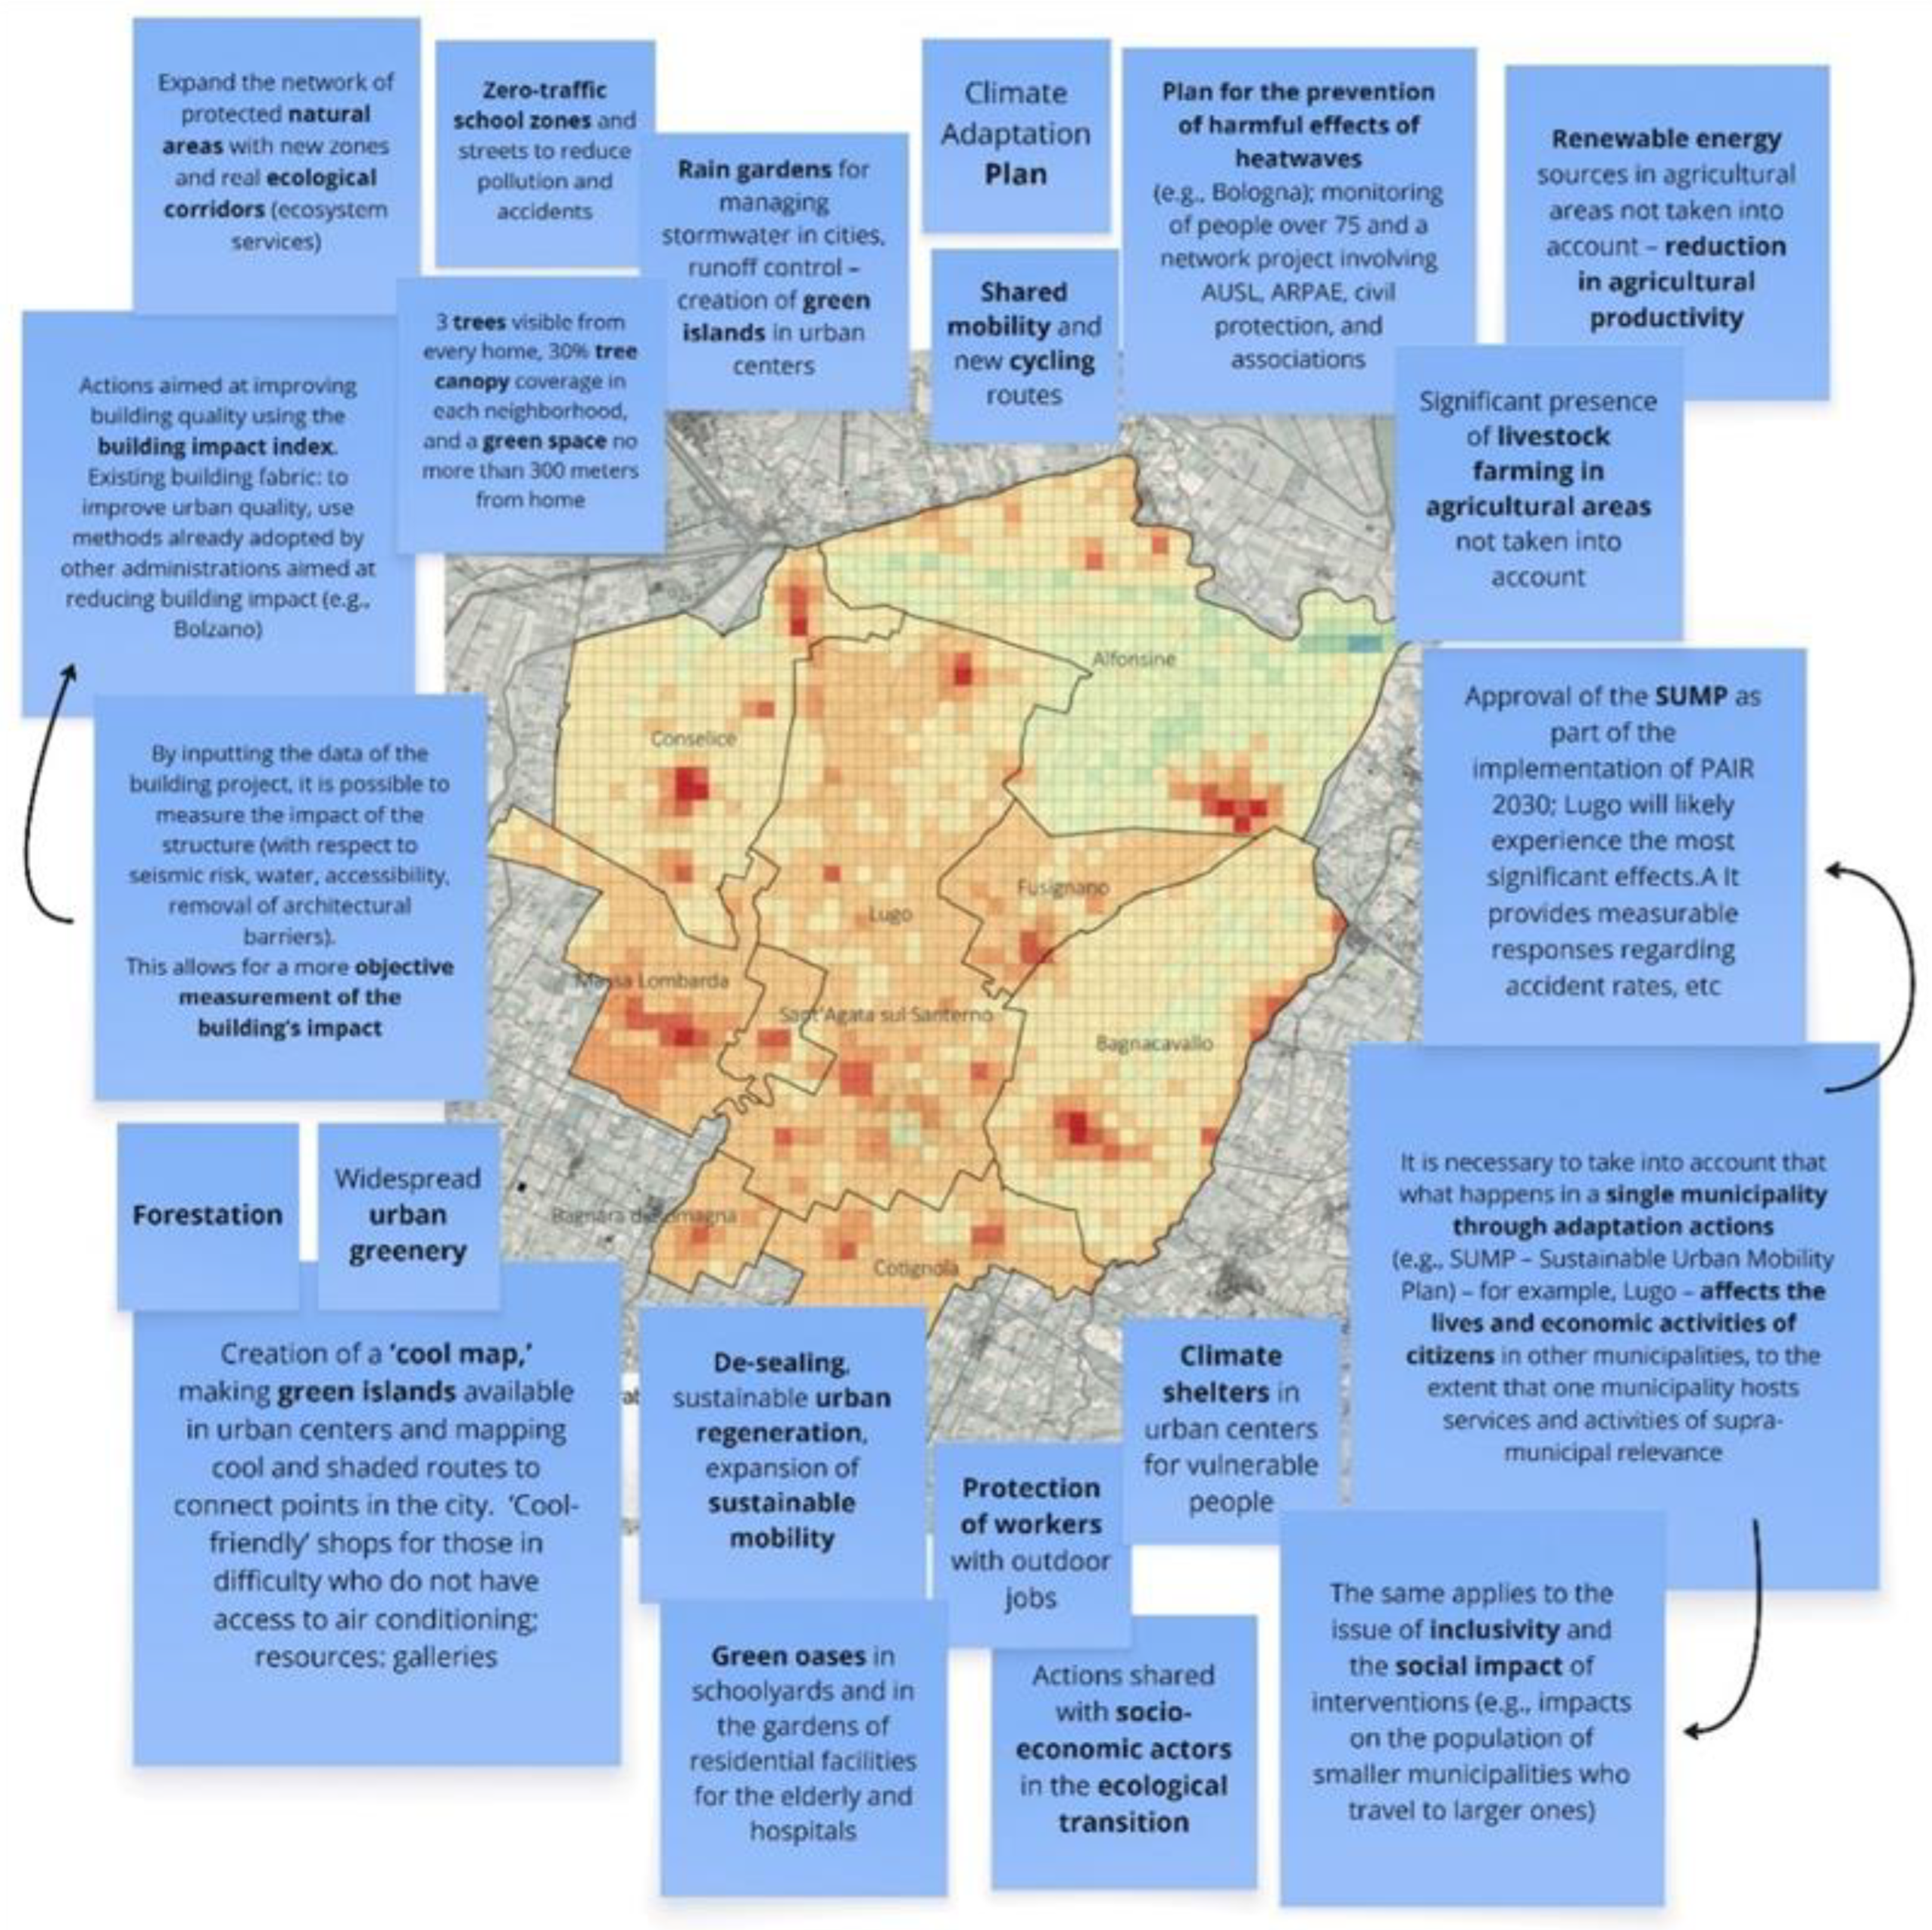
Accordingly, the final phase of the participatory process involved a brainstorming session aimed at identifying potential adaptation and mitigation actions to enhance territorial resilience, based on the insights derived from the vulnerability maps. Among the proposed actions by the UBR local practitioners, participants emphasised the importance of nature-based solutions, such as implementing rain gardens for stormwater management and improved runoff control. They also recommended creating green islands and expanding urban green spaces, with a particular focus on developing a 'cool map' that highlights areas with naturally lower temperatures and facilitates prioritising urban spaces for cooling interventions, ultimately contributing to the mitigation of heat-related risks. Furthermore, it was proposed to expand natural areas, enhance urban quality by reducing building impacts, and promote new cycling paths to improve both mobility and sustainability. These proposals, as illustrated in Figure 5, represent a comprehensive, locally informed approach to addressing the territory’s challenges, integrating environmental, social, and infrastructural considerations to foster more resilient urban spaces.
4. Conclusions
This study presents the application of the methodology and a developed GIS plugin as a spatially explicit and participatory tool for mapping place-based territorial vulnerabilities. The analysis, conducted across nine municipalities of the Union of Bassa Romagna (UBR), highlights that territorial vulnerability cannot be fully understood and practically addressed by analysing isolated dimensions or individual risks. Instead, a multi-risk and cross-sectoral analysis offers a more comprehensive foundation for strategic and context-sensitive interventions for urban resilience policymaking. The empirical research conducted demonstrates several benefits that help fill the gap between the conceptualisation and operationalisation of resilience, which are outlined below.
First, the participatory approach, by integrating local knowledge into the process of quantitative analysis of vulnerabilities, generated place-based evidence for the research. The VALUE4UCBR also served as a capacity-building initiative, providing a resilience-oriented lens to decision-making. Therefore, this initiative, shaped by a set of online courses and in-person workshops, generated mutual benefits for both academia and public administration. Participants, having a direct understanding of the territory, were able to identify context-specific dynamics, critical interrelations, and spatial patterns that external observers might have overlooked. Their contributions ensured that the methodological steps, such as indicator selection, weighting of indicators and the overall vulnerability analysis, were grounded in real-world territorial conditions, rather than relying solely on desk research. In addition to improving the methodology's accuracy and robustness, this cooperative process gave local practitioners a sense of shared accountability, which raised the possibility of successful and locally relevant adaptation and mitigation plans.
Second, the replicability and intuitiveness of the tool are particularly valuable as an instrument for constructing local value through place-based vulnerability analysis. In other words, vulnerability is context-specific and results from the interplay of various dimensions and components. Therefore, it is essential to develop a methodology that can be effectively applied across different places and contexts. In this way, the plugin’s automation of technical steps streamlines the vulnerability mapping process, while its intuitive interface supports decision-making by enabling scenario analysis and immediate visualisation of maps across different components, including natural environment, built environment, and socio-economic conditions.
Third, this study emphasises the value of an integrated and participatory mapping approach in enhancing resilient, context-specific strategies from the perspective of policymaking. It emphasises how open-source mapping tools can improve cost-effectiveness and replicability, especially when used to implement local planning procedures for resilient transformation. It is necessary to read vulnerability knowledge from an integrated systemic perspective since the study of vulnerability must incorporate local, technical, and scientific knowledge to inform policymaking effectively.
Future research directions emerging from this study include tracking changes in territorial resilience over time through comparative mapping or the integration of dynamic spatial indicators that could inform the implementation of decision-making for resilient transitions. The research also highlights the need for ex-post evaluation to assess the impact of adaptation and mitigation measures, supporting adaptive policymaking for long-term trends in land use, climate adaptation, and local development.
Supplementary Materials
The following supporting information can be downloaded at the website of this paper posted on Preprints.org. Supporting information is provided in Table S1, which includes the list of indicators used to calculate the vulnerability index, along with detailed information on how each indicator is calculated and the data sources used. In addition, Figures S1 to S25 present the individual maps created for each of these indicators as follows: Table S1: List of indicators calculated to measure the vulnerability index. Figure S1: A1-Permeable Land Surface Index (PLSI). Figure S2: A2-Weighted Green Infrastructure Availability Index (WGIAI). Figure S3: A3-Cycling Infrastructure Density Index (CIDI). Figure S4: B1-Weighted Road Network Density Index (WRNDI). Figure S5: B2-Educational Services Density Index (ESDI). Figure S6: B3-Healthcare Facility Density Index (HFDI). Figure S7: B4-Building construction characteristics (BCC). Figure S8: B5-Cultural Heritage Sites Density Index (CHSDI). Figure S9: C1-Residential Population Density Index (RPDI). Figure S10: C2-Elderly Population Ratio (EPR). Figure S11: C3-Foreign Resident Incidence Index (FRII). Figure S12: C4-Economic Activity Density Index (EADI). Figure S13: C5-Active Population Employment Rate (APER). Figure S14: C6-Territorial Property Value Index (TPVI). Figure S15: T1-Structural Dependency Index (SDI). Figure S16: T2-Migration Dynamics Index (MDI)
Figure S17: T3-Land Consumption Change Index (LCCI). Figure S18: T4-Aging Dynamics Index (ADI). Figure S19: T5-Chronic Air Pollution Exposure Index (CAPEI). Figure S20: E1-Historical Flood Frequency Index (HFFI). Figure S21: E2-Inundation Hazard Level Index (IHLI). Figure S22: E3-Bioclimatic Stress Index (BSI) . Figure S23: E4- Seismic Liquefaction Risk Index (SLRI). Figure S24: E5-Industrial Accident Risk Index (IARI). Figure S25: E6-Short-Term Air Pollution Exposure Index (STAPEI)
Author Contributions
Conceptualization, B.G.; methodology, B.G., P.F., and MD.D.; software, G.G.; validation, M.D.D., and B.E.; formal analysis, MD.D. and T.C.; investigation, MD.D., B.E., P.B., and T.C.; data curation, T.C.; writing—original draft preparation, B.G., MD.D., B.E., G.G., and P.F.; writing—review and editing, P.B. and T.C.; visualization, P.B. and T.C.; supervision, B.G.; project administration, B.E. All authors have read and agreed to the published version of the manuscript.
Funding
This research received no external funding
Data Availability Statement
The data, source code, and QGIS plugin developed and used in this study are openly available at https://github.com/R3C-GeoResilience/R3C_GeoResilience
Conflicts of Interest
The authors declare no conflict of interest.
References
- Folke, C.; Carpenter, S.R.; Walker, B.; Scheffer, M.; Chapin, T.; Rockstrom, J. Resilience Thinking: Integrating Resilience, Adaptability and Transformability. ECOL SOC 2010, 15, no.4.
- Davoudi, S.; Shaw, K.; Haider, L.J.; Quinlan, A.E.; Peterson, G.D.; Wilkinson, C.; Fünfgeld, H.; McEvoy, D.; Porter, L. Resilience: A Bridging Concept or a Dead End? “Reframing” Resilience: Challenges for Planning Theory and Practice Interacting Traps: Resilience Assessment of a Pasture Management System in Northern Afghanistan Urban Resilience: What Does It Mean in Planning Practice? Resilience as a Useful Concept for Climate Change Adaptation? The Politics of Resilience for Planning: A Cautionary Note. PTP 2012, 13, 299–333. [CrossRef]
- Simmie, J.; Martin, R. The Economic Resilience of Regions: Towards an Evolutionary Approach. Cambridge Journal of Regions, Econ Soc 2010, 3, 27–43. [CrossRef]
- Brunetta, G. Dall’emergenza Post-Disastro All’adattamento. Conoscere La Vulnerabilità per La Resilienza Trasformativa Dei Territori. In Il rischio ambientale Prevenzione, comunicazione, gestione dell’emergenza; Mela, A., Mugnano, S., Eds.; Carocci Editore Studi Superiori, 2025; ISBN 978-88-290-2819-1.
- Brunetta, G.; Ceravolo, R.; Barbieri, C.A.; Borghini, A.; de Carlo, F.; Mela, A.; Beltramo, S.; Longhi, A.; De Lucia, G.; Ferraris, S.; et al. Territorial Resilience: Toward a Proactive Meaning for Spatial Planning. Sustain 2019, Vol. 11, Page 2286 2019, 11, 2286. [CrossRef]
- EUROPEAN COMMISSION RESILIENCE DASHBOARDS FOR THE SOCIAL AND ECONOMIC, GREEN, DIGITAL, AND GEOPOLITICAL DIMENSIONS. Available online: https://commission.europa.eu/strategy-and-policy/strategic-foresight/2020-strategic-foresight-report/resilience-dashboards_en (accessed on 23 May 2025).
- Building Resilient Neighbourhoods Characteristics of Resilience Checklist. Available online: https://www.resilientneighbourhoods.ca/ (accessed on 23 May 2025).
- MCR2030 Resilience Roadmap: Resilience Roadmap Stage Assessment | Making Cities Resilient 2030. Available online: https://mcr2030.undrr.org/resilience-roadmap (accessed on 23 May 2025).
- Mohabat Doost, D.; Brunetta, G.; Caldarice, O. In Search of Equitable Resilience: Unravelling the Links between Urban Resilience Planning and Social Equity. Sustain 2023, 15. [CrossRef]
- Möller, V.; van Diemen, R.; Matthews, J.B.R.; Méndez, C.; Semenov, S.; Fuglestvedt, J.S.; Reisinger, A. IPCC Annex II: Glossary. In Climate Change 2022: Impacts, Adaptation and Vulnerability. Contribution of Working Group II to the Sixth Assessment Report of the Intergovernmental Panel on Climate Change; Pörtner, H.-O., Roberts, D.C., Tignor, M., Poloczanska, E.S., Mintenbeck, K., Alegría, A., Craig, M., Langsdorf, S., Löschke, S., Möller, V., Okem, A., Rama, B., Eds.; Cambridge University Press: Cambridge, UK and New York, NY, USA, 2022; pp. 2897–2930.
- Haraguchi, M.; Nishino, A.; Kodaka, A.; Allaire, M.; Lall, U.; Kuei-Hsien, L.; Onda, K.; Tsubouchi, K.; Kohtake, N. Human Mobility Data and Analysis for Urban Resilience: A Systematic Review. Environ Plan B Urban Anal City Sci 2022, 49, 1507–1535, doi:10.1177/23998083221075634/ASSET/98DF6428-4AC6-4100-BCC3-13B0BF681210/ASSETS/IMAGES/LARGE/10.1177_23998083221075634-FIG3.JPG.
- United Nations Office for Disaster Risk Reduction (UNDRR) The Sendai Framework Terminology on Disaster Risk Reduction. “Vulnerability”. Accessed 15 May 2025. https://www.undrr.org/terminology/vulnerability. 2017.
- Mohabat Doost, D.; Pincegher, B.; Garnero, G.; Pellerey, F.; Brunetta, G. R3C-GeoResilience. Il Plugin Open-Source per Mappare Le Vulnerabilità Territoriali. Urban Inform 2024, 317, 122–124. ISSN 2239-4222. - ELETTRONICO. - 317:(2024), pp. 122-124.
- Unione dei Comuni della Bassa Romagna Tavolo 3 – Approfondimenti Socio-Demografici: Documento per Il Confronto Con i Comuni. Available online: https://www.labassaromagna.it/ocmultibinary/download/4071/111055/4/49e4c88dbf2bc730fb3952a959b7379b.pdf/file/BARO_Tavolo3_SOCIODEMOGR_20210427.pdf (accessed on 21 May 2025).
- De Corso, S.; De Benedetti, A.A.; Cimini, A.; d’Antona, M.; De Fioravante; Di Leginio, M.; Finocchiaro, G.; Vaccaro, L.; Giunta, M.; Munafò, M. Atlante dei Dati Ambientali. Edizione 2024; 2024, available here: https://www.isprambiente.gov.it/it/pubblicazioni/pubblicazioni-di-pregio/atlante-dei-dati-ambientali-edizione-2024 (accessed on 27 May 2025).
- Cotella, G.; Berisha, E. Inter-Municipal Spatial Planning as a Tool to Prevent Small-Town Competition : The Case of the Emilia-Romagna Region. The Routledge Handbook of Small Towns 2021, 313–329. [CrossRef]
- Tootkaboni, M.P.; Ballarini, I.; Corrado, V. Towards Climate Resilient and Energy-Efficient Buildings: A Sensitivity Analysis on Building Components and Cooling Strategies. Build Environ 2025, 270. [CrossRef]
- Agenzia delle Entrate Quotazioni Immobiliari OMI – Osservatorio Del Mercato Immobiliare. Geoportale OMI. Available online: https://www1.agenziaentrate.gov.it/servizi/geopoi_omi/index.php (accessed on 27 May 2025).
- ARPAE Emilia-Romagna Microzonazione Sismica (MS) – Dati Ambientali Emilia-Romagna. Webbook ARPAE. Available online: https://webbook.arpae.it/indicatore/Microzonazione-Sismica-MS-00001/?id=0fd14d2b-8438-11e8-bbf3-11c9866a0f33 (accessed on 27 May 2025).
- ARPAE Emilia-Romagna Indice Di Disagio Bioclimatico Di Thom – ERG5. Dati Meteoclimatici Comunali. Available online: https://dati.arpae.it/dataset/dati-meteoclimatici-comunali (accessed on 27 May 2025).
- ARPAE Emilia-Romagna Qualità Dell’aria: Valutazioni Annuali Delle Concentrazioni Di Fondo. Dati Ambientali Regionali. Available online: https://dati.arpae.it/dataset/qualita-dell-aria-valutazioni-annuali-delle-concentrazioni-di-fondo (accessed on 27 May 2025).
- Autorità di Bacino Distrettuale del Fiume Po, R.E.-R.; Mappe Della Pericolosità e Del Rischio Di Alluvioni – PGRA Secondo Ciclo. Piano Di Gestione Del Rischio Alluvioni – Direttiva 2007/60/CE. Available online: https://ambiente.regione.emilia-romagna.it/it/suolo-bacino/sezioni/piano-di-gestione-del-rischio-alluvioni/layer-cartografici-taglio-per-comune#ravenna (accessed on 27 May 2025).
- ISPRA Carta Nazionale Del Consumo Di Suolo – Edizione 2018. Uso, Copertura e Consumo Di Suolo. Available online: https://groupware.sinanet.isprambiente.it/uso-copertura-e-consumo-di-suolo/library/consumo-di-suolo (accessed on 27 May 2025).
- ISPRA Carta Nazionale Del Consumo Di Suolo – Edizione 2022. Uso, Copertura e Consumo Di Suolo. Available online: https://groupware.sinanet.isprambiente.it/uso-copertura-e-consumo-di-suolo/library/consumo-di-suolo (accessed on 27 May 2025).
- ISTAT - The Italian National Institute of Statistics Censimento Permanente Della Popolazione e Delle Abitazioni – Risultati 2021. Available online: https://www.istat.it/notizia/dati-per-sezioni-di-censimento/ (accessed on 27 May 2025).
- ISTAT - The Italian National Institute of Statistics Censimento Della Popolazione e Delle Abitazioni – Risultati 2011. 2011. Available here: https://www.istat.it/statistiche-per-temi/censimenti/censimenti-storici/popolazione-e-abitazioni/popolazione-2011/ (accessed on 27 May 2025).
- Regione Emilia-Romagna Coperture Vettoriali Uso Del Suolo Di Dettaglio – Edizione 2023. Geoportale Regione Emilia-Romagna, Pianificazione e Catasto. Available online: https://geoportale.regione.emilia-romagna.it/catalogo/dati-cartografici/pianificazione-e-catasto/uso-del-suolo/layer-14 (accessed on 27 May 2025).
- Regione Emilia-Romagna Infrastrutture Sanitarie – Raccolta Di Dataset Open Data. Catalogo Dati Regione Emilia-Romagna. Available online: https://datacatalog.regione.emilia-romagna.it/catalogCTA/dataset?q=-num_resources%3A0&vocab_ico_sottocategoria_gemet=infrastruttura+sanitaria (accessed on 27 May 2025).
- Regione Emilia-Romagna Patrimonio Culturale ER – Portale TourER. Base Dati Georeferenziata Sul Patrimonio Architettonico Tutelato a Norma Del Codice Dei Beni Culturali Della Regione Emilia-Romagna. Agenzia Regionale per La Sicurezza Territoriale e La Protezione Civile. Available online: https://datacatalog.regione.emilia-romagna.it/catalogCTA/dataset/arlst_2024-04-23t185044 (accessed on 27 May 2025).
Figure 1.
Map of areas potentially subject to flooding under different probability scenarios, based on flood hazard maps prepared by the River Basin District Authorities [15]. Map edited by the authors.
Figure 1.
Map of areas potentially subject to flooding under different probability scenarios, based on flood hazard maps prepared by the River Basin District Authorities [15]. Map edited by the authors.
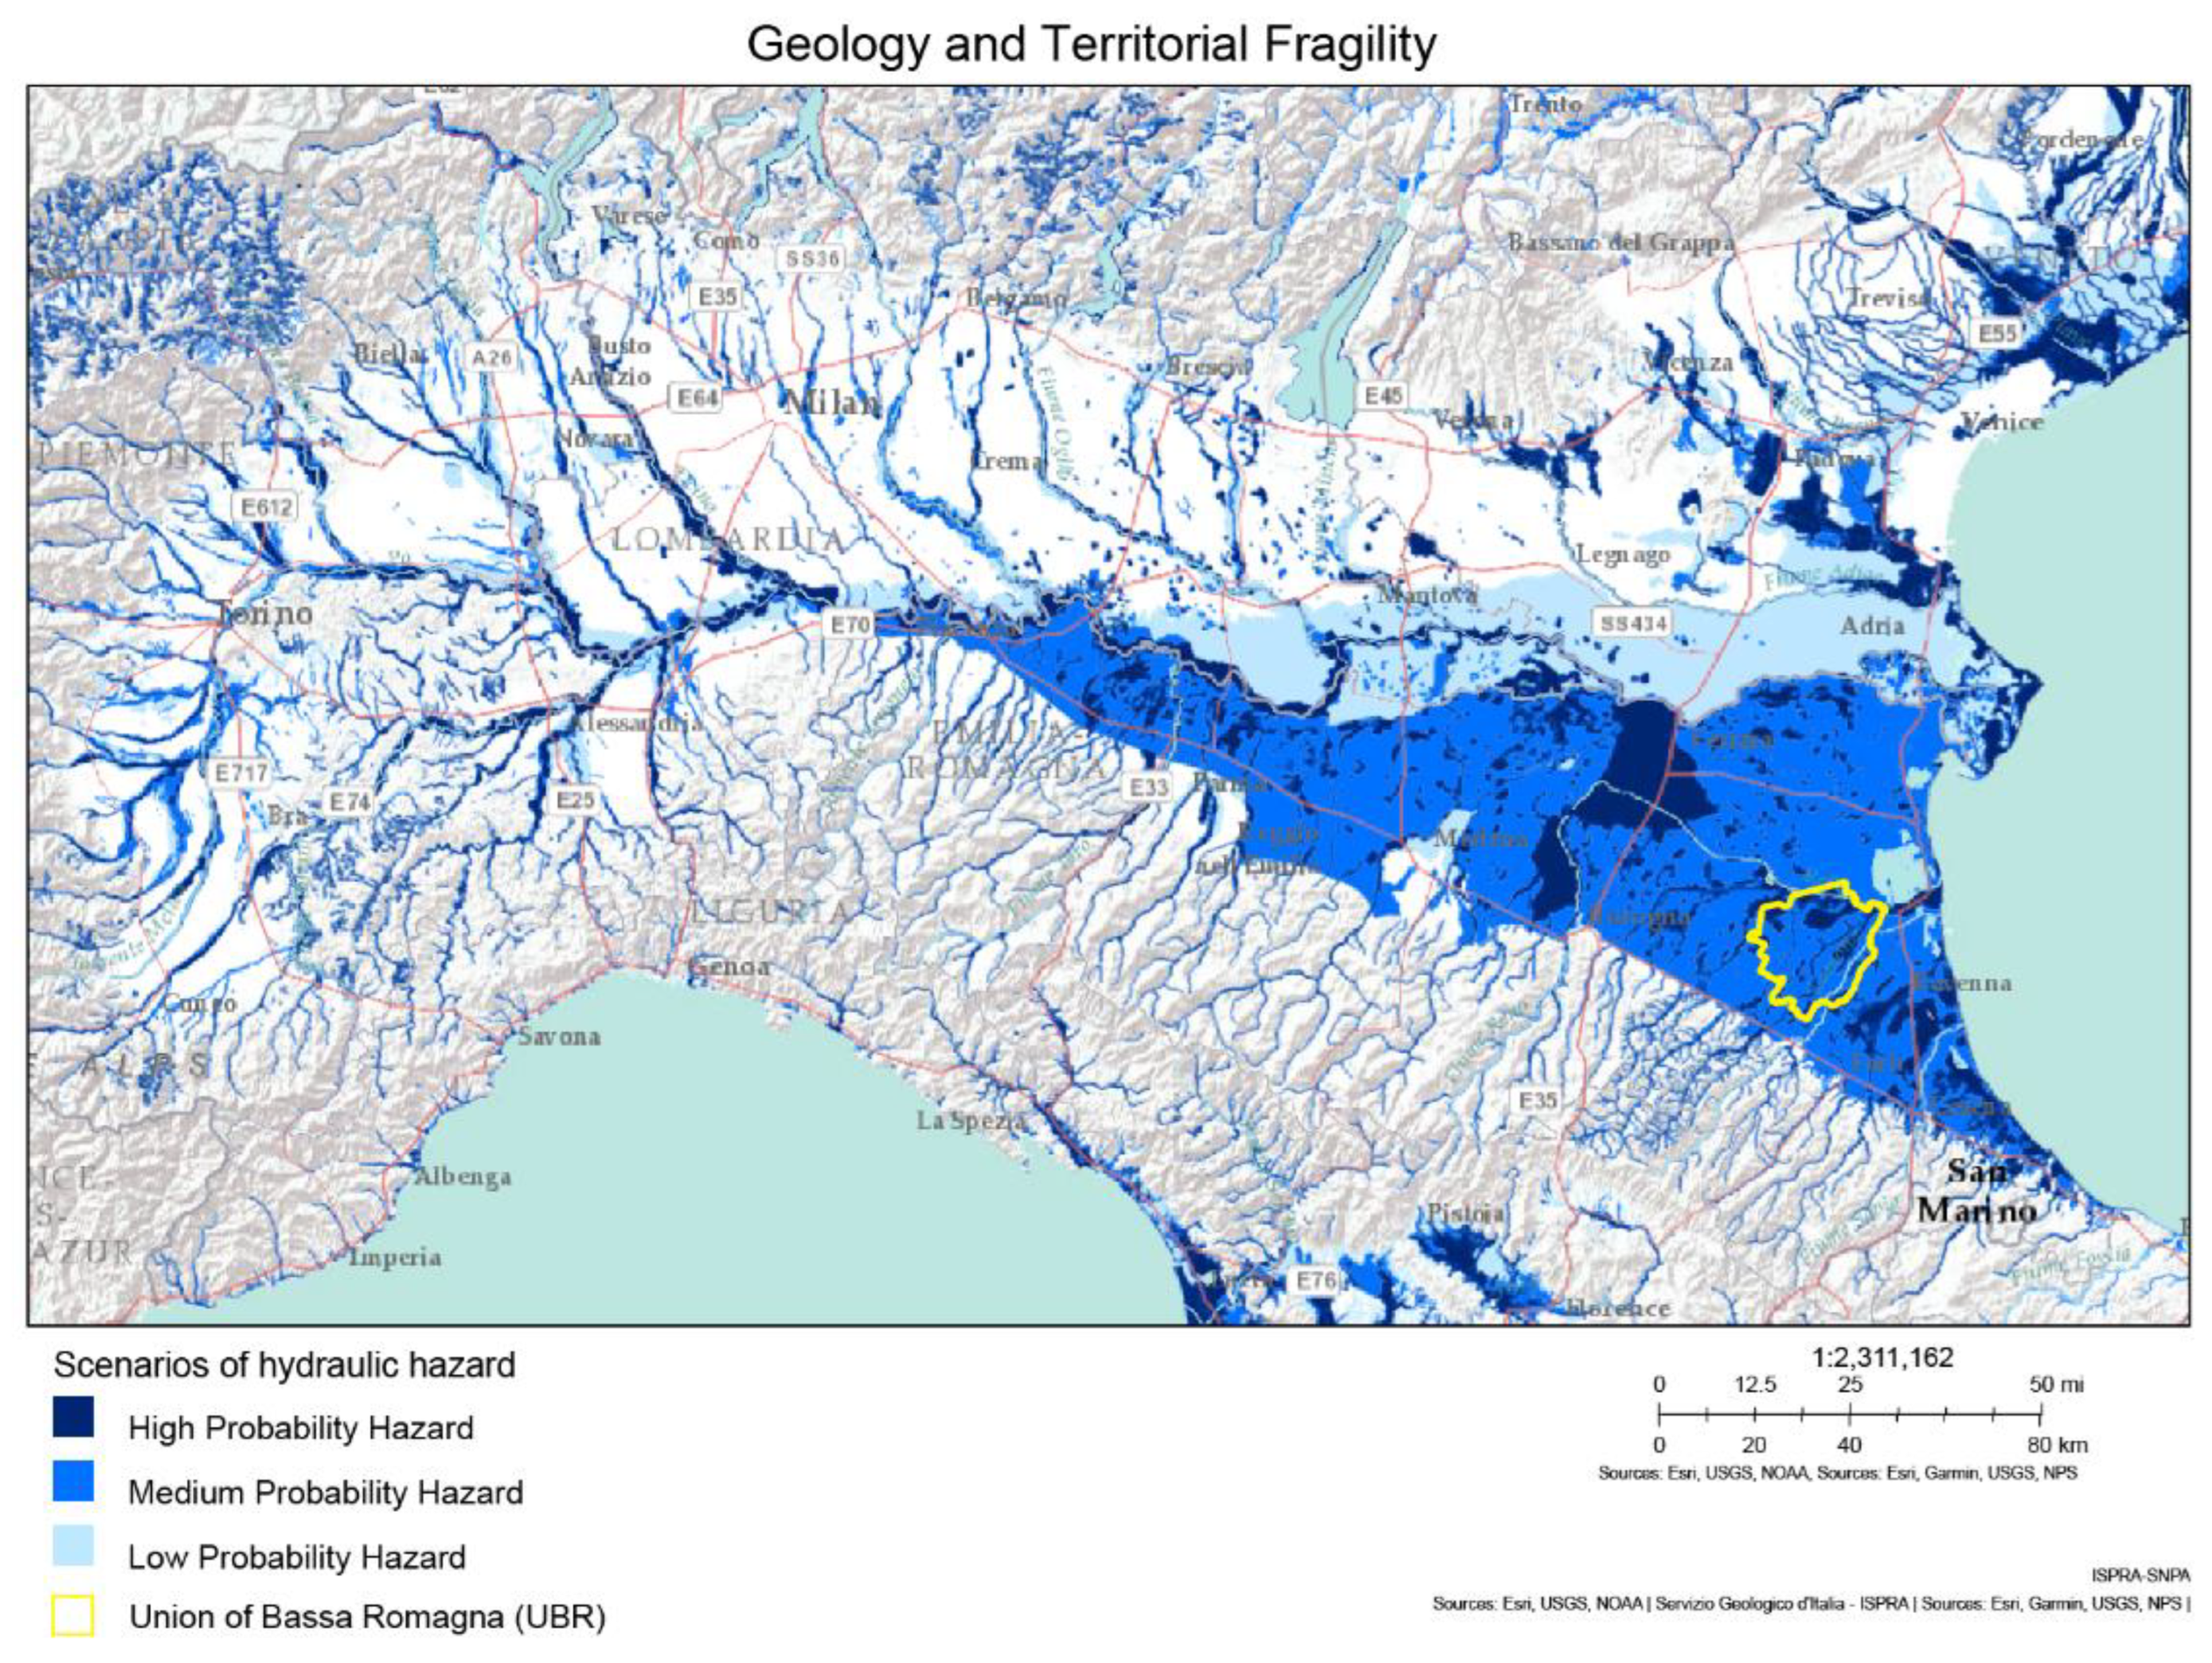
Figure 2.
Visualisation of the three main tabs of the R3C GeoResilience Plugin. From top to bottom: the first tab is used to insert input data; the second tab allows visualisation of individual maps representing each component of the system's conditions, trends, and events; the third tab displays the final vulnerability map after clicking the 'Run Calculation' button.
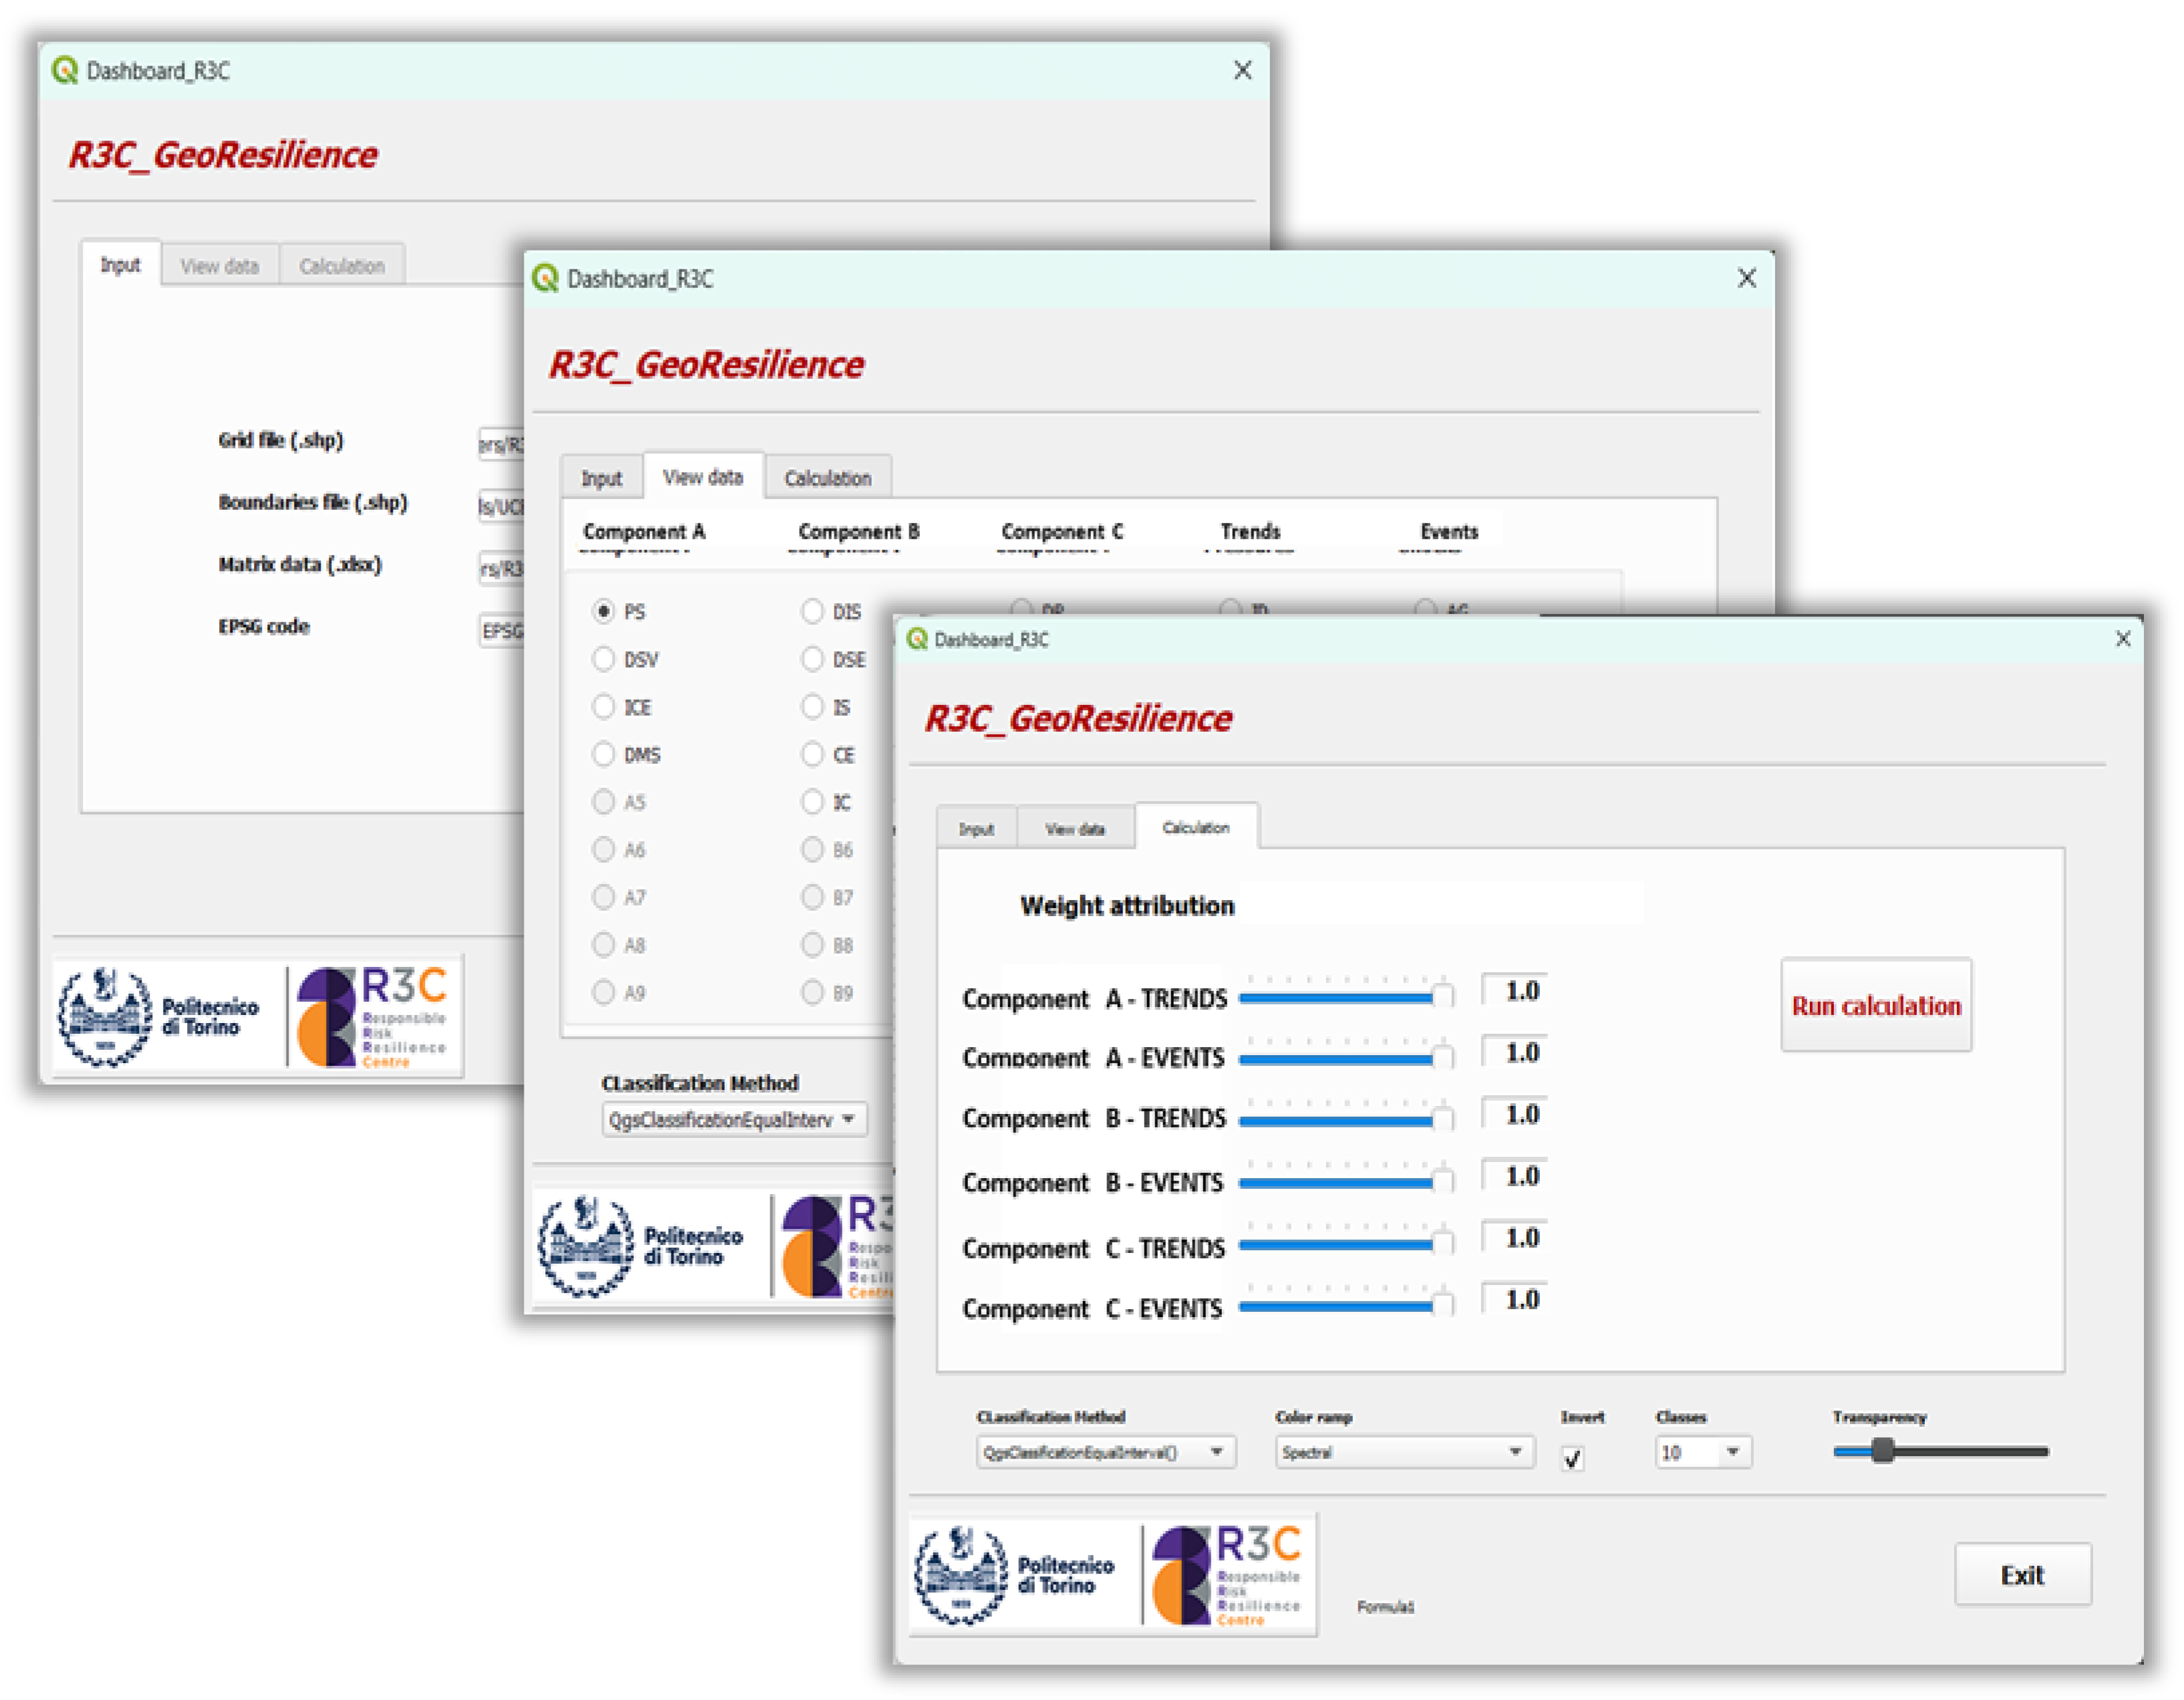
Figure 3.
Interactive workshop in UBR session where local practitioners refined territorial indicators through collaborative tools and their local expertise, and where they weighted the correlation matrix
Figure 3.
Interactive workshop in UBR session where local practitioners refined territorial indicators through collaborative tools and their local expertise, and where they weighted the correlation matrix
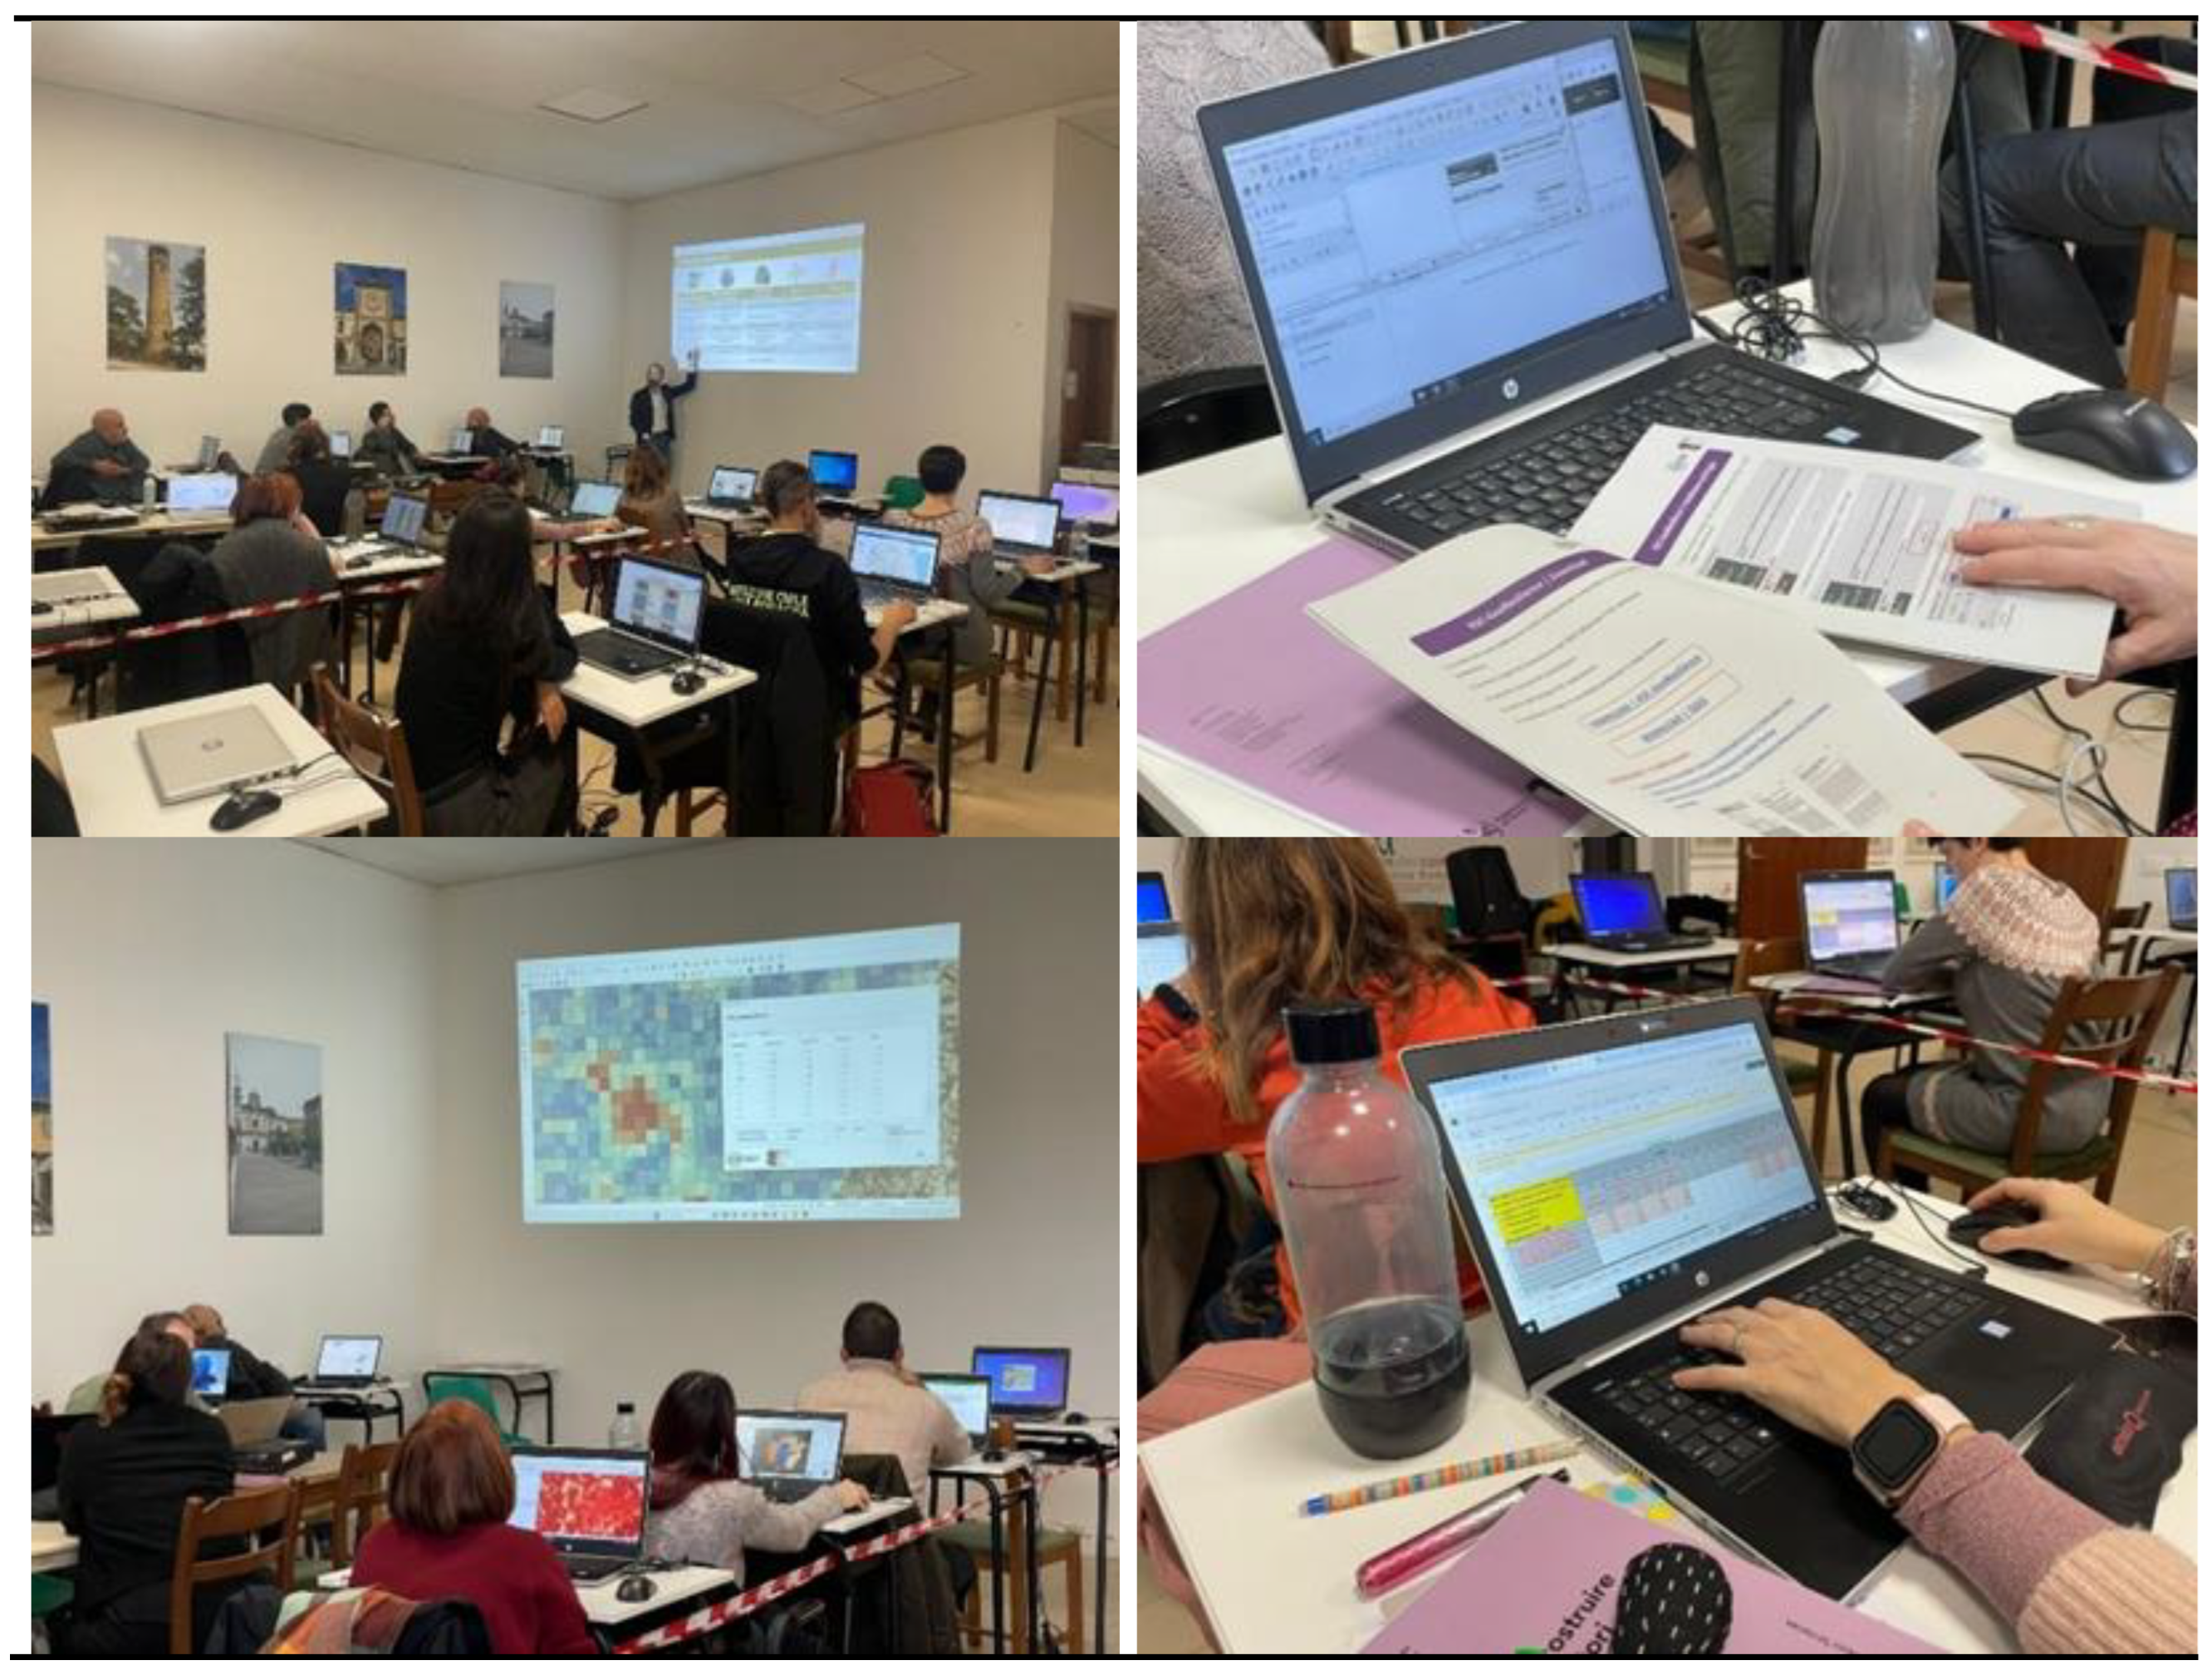
Figure 4.
The vulnerability maps generated using the Plugin.
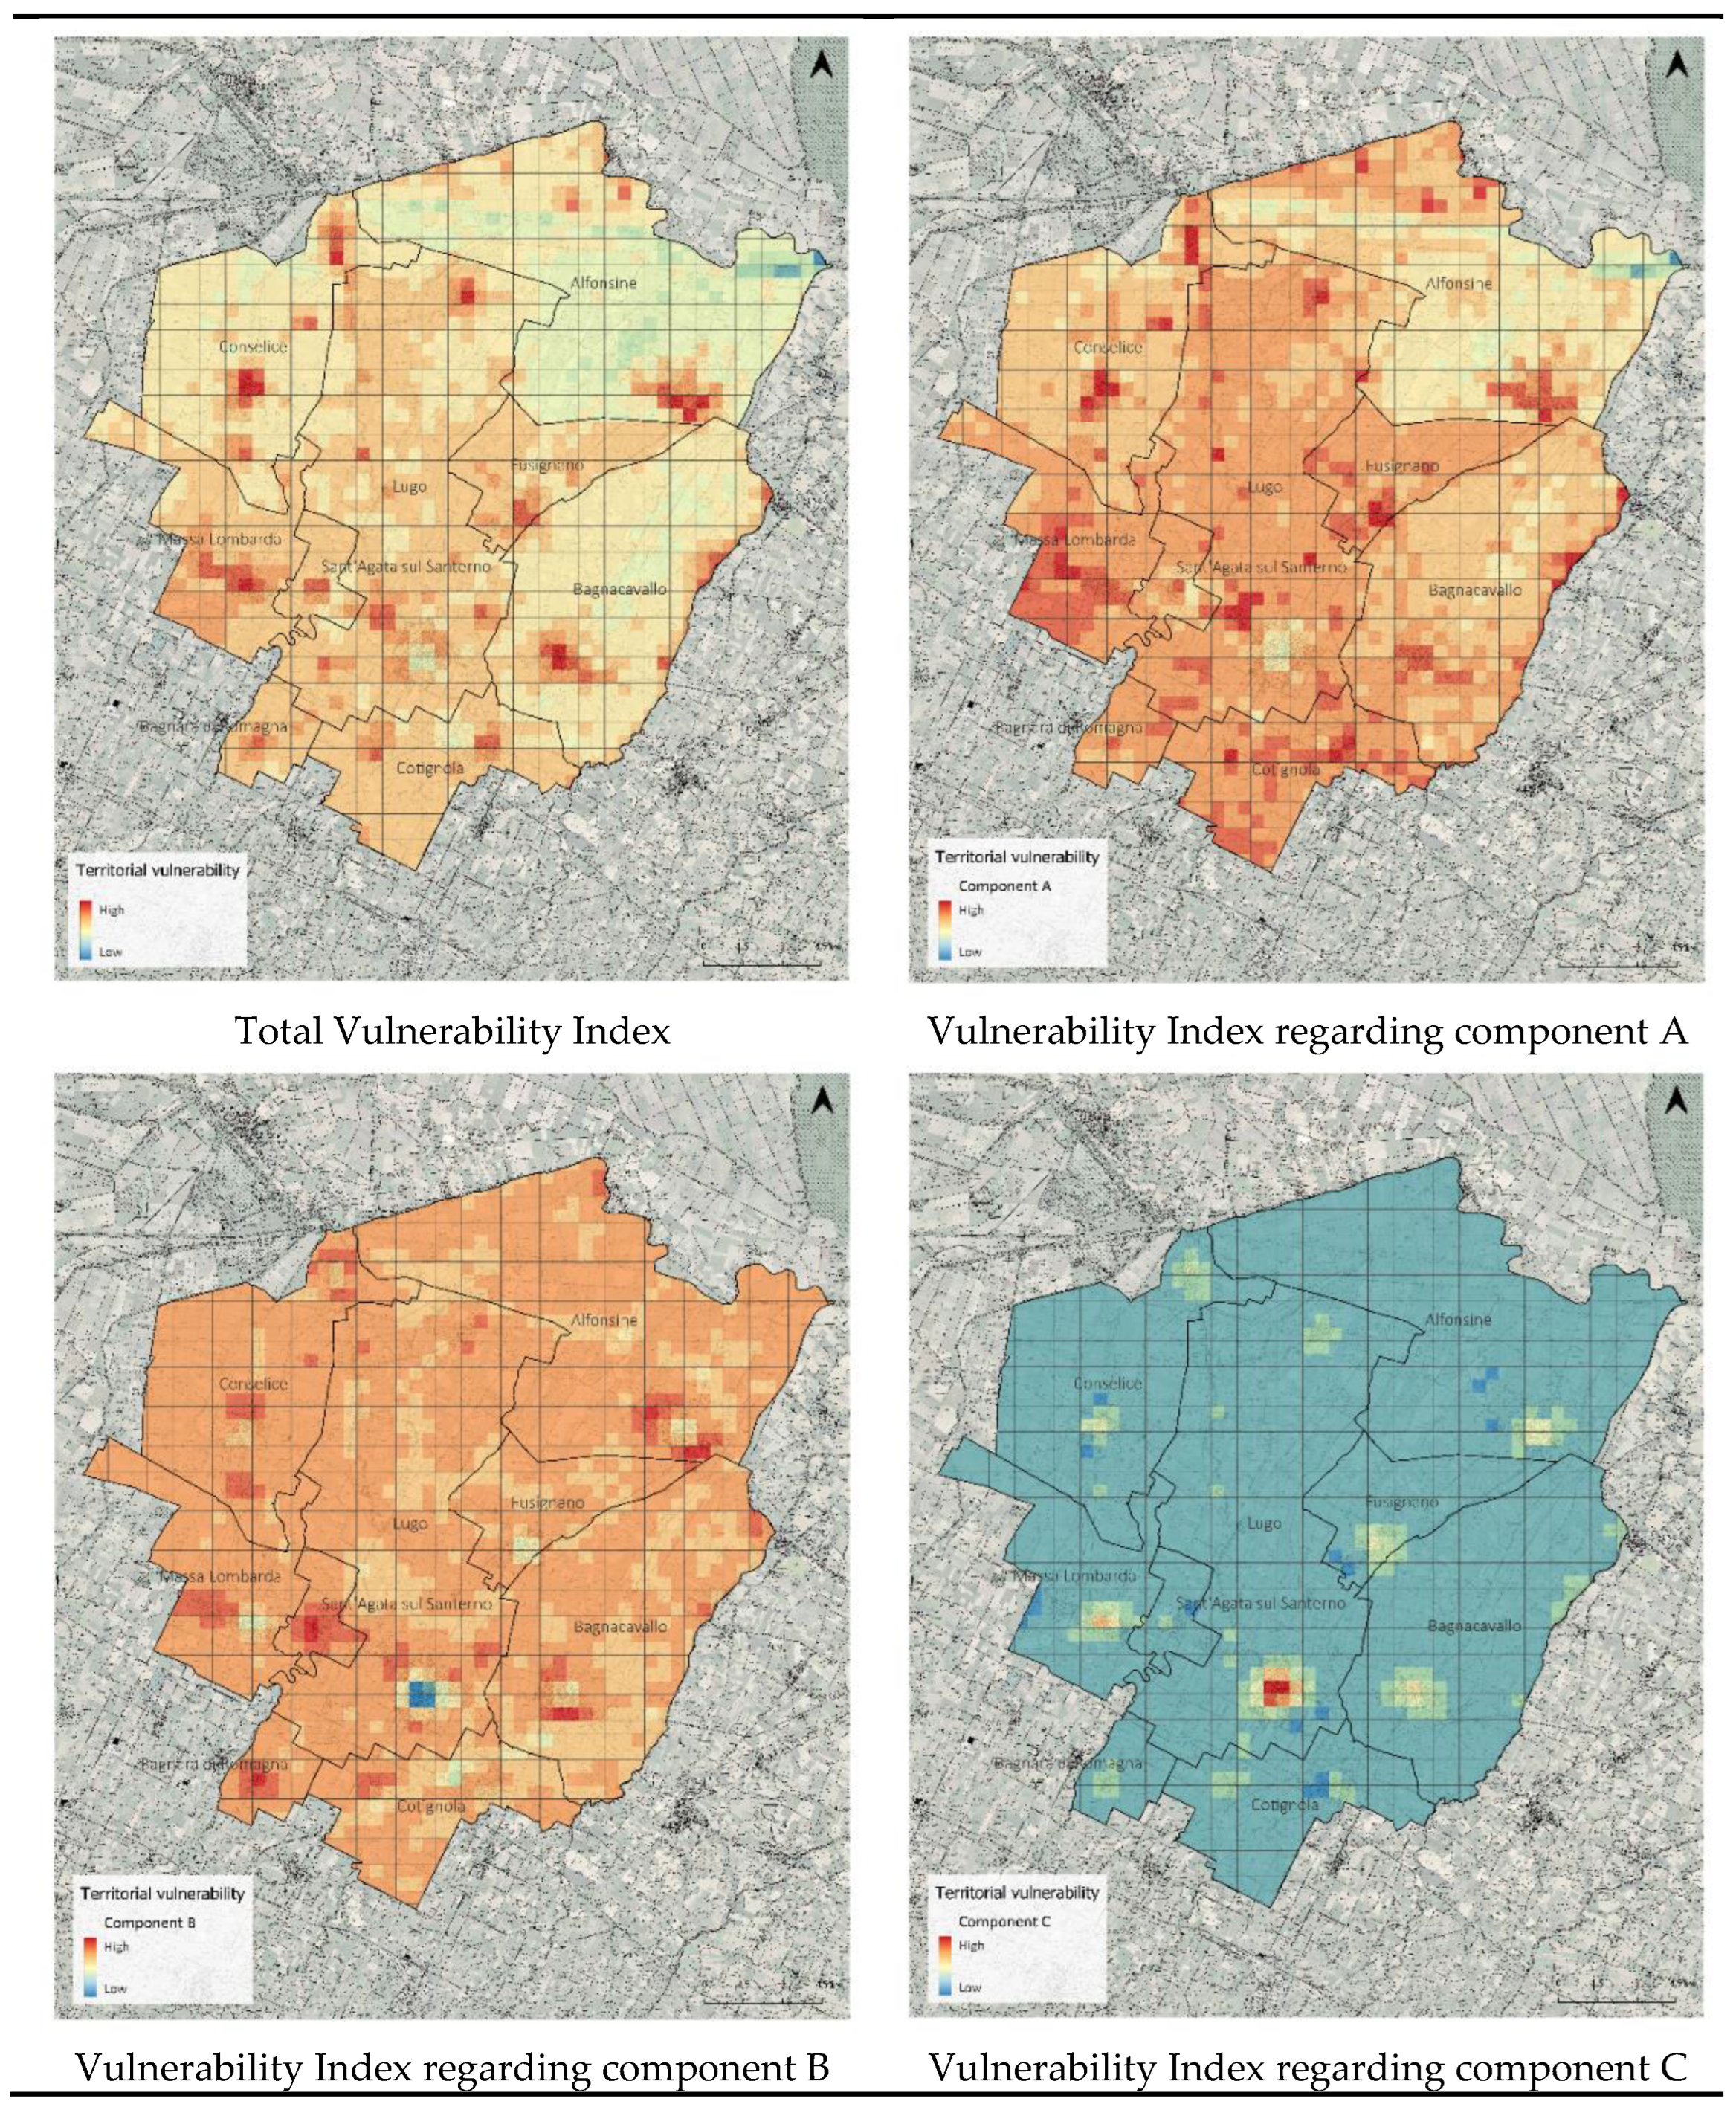
Figure 5.
The results of the brainstorming session in the Miro Platform aimed at identifying potential adaptation and mitigation actions to enhance territorial resilience based on the generated vulnerability maps. Comments have been translated from Italian to English by the authors.
Figure 5.
The results of the brainstorming session in the Miro Platform aimed at identifying potential adaptation and mitigation actions to enhance territorial resilience based on the generated vulnerability maps. Comments have been translated from Italian to English by the authors.

| Concept | Definition |
|
RISK F (Hazard, Exposure, Vulnerability) |
The potential for adverse consequences for human or ecological systems, recognising the diversity of values and objectives associated with such systems. risks result from dynamic interactions between climate-related hazards with the exposure and vulnerability of the affected human or ecological system to the hazards. |
| HAZARD | The potential occurrence of a natural or human-induced physical event or trend or physical impact that may cause loss of life, injury, or other health impacts, as well as damage and loss to property, infrastructure, livelihoods, service provision, ecosystems, and environmental resources. |
| EXPOSURE | The presence of people, livelihoods, species or ecosystems, environmental functions, services, and resources, infrastructure, or economic, social, or cultural assets in places and settings that could be adversely affected. |
| VULNERABILITY | The conditions determined by physical, social, economic and environmental factors or processes, which increase the susceptibility of a community to the impact of hazards |
Table 2.
The prototype of the correlation matrix, which correlates the indicators representing the conditions of the territorial systems with those of hazards (both trends and events)
Table 2.
The prototype of the correlation matrix, which correlates the indicators representing the conditions of the territorial systems with those of hazards (both trends and events)
| Components | Conditions of the system | Hazards | ||||||
| Trends | Events | |||||||
| T1 | T2 | T3 | E1 | E2 | E3 | E4 | ||
| A: Natural environment & landscape | A1 | |||||||
| A2 | ||||||||
|
B: Built environment, cultural heritage & infrastructure |
B1 | |||||||
| B2 | ||||||||
| B3 | ||||||||
| C: Economy & Society | C1 | |||||||
| C2 | ||||||||
Table 3.
List of the indicators defined and calculated regarding the three components of the system’s conditions, trends, and events
Table 3.
List of the indicators defined and calculated regarding the three components of the system’s conditions, trends, and events
| Conditions of the System | Hazards | ||||||||
| COMPONENT A: Natural Environment & Landscape | COMPONENT B: Built Environment, Cultural Heritage & Infrastructure |
COMPONENT C: Economy & Society | Trends | Events | |||||
| A1 | Permeable Land Surface Index (PLSI) | B1 | Weighted Road Network Density Index (WRNDI) | C1 | Residential Population Density Index (RPDI) | T1 | Structural Dependency Index (SDI) | E1 | Historical Flood Frequency Index (HFFI) |
| A2 | Weighted Green Infrastructure Availability Index (WGIAI) | B2 | Educational Services Density Index (ESDI) | C2 | Elderly Population Ratio (EPR) | T2 | Migration Dynamics Index (MDI) | E2 | Inundation Hazard Level Index (IHLI) |
| A3 | Cycling Infrastructure Density Index (CIDI) | B3 | Healthcare Facility Density Index (HFDI) | C3 | Foreign Resident Incidence Index (FRII) | T3 | Land Consumption Change Index (LCCI) | E3 | Bioclimatic Stress Index (BSI) |
| B4 | Building construction characteristics (BCC) | C4 | Economic Activity Density Index (EADI) | T4 | Aging Dynamics Index (ADI) | E4 | Seismic Liquefaction Risk Index (SLRI) | ||
| B5 | Cultural Heritage Sites Density Index (CHSDI) | C5 | Active Population Employment Rate (APER) | T5 | Chronic Air Pollution Exposure Index (CAPEI) | E5 | Industrial Accident Risk Index (IARI) | ||
| C6 | Territorial Property Value Index (TPVI) | E6 | Short-Term Air Pollution Exposure Index (STAPEI) | ||||||
Table 4.
Vulnerability correlation matrix representing the normalised values of the average evaluation of the local practitioner during the workshop. For the full name of the indicators, look at Table 3
Table 4.
Vulnerability correlation matrix representing the normalised values of the average evaluation of the local practitioner during the workshop. For the full name of the indicators, look at Table 3
| TRENDS | EVENTS | ||||||||||||
| SDI | MDI | LCCI | ADI | CAPEI | HFFI | IHLI | BSI | SLRI | IARI | STAPEI | |||
| CONDITIONS OF THE SYSTEM | COMPONENT A: Natural Environment & Landscape | PLSI | 0,00 | 0,00 | 0,78 | 0,15 | 0,42 | 1,00 | 0,96 | 0,89 | 0,67 | 0,63 | 0,50 |
| WGIAI | 0,41 | 0,26 | 0,78 | 0,44 | 0,92 | 0,96 | 0,93 | 1,00 | 0,48 | 0,19 | 0,83 | ||
| MEDD | 0,37 | 0,41 | 0,78 | 0,33 | 0,92 | 0,15 | 0,11 | 0,78 | 0,19 | 0,33 | 0,78 | ||
| COMPONENT B: Built Environment, Cultural Heritage & Infrastructure | WRNDI | 0,44 | 0,30 | 0,93 | 0,19 | 0,75 | 0,78 | 0,78 | 0,70 | 0,44 | 0,37 | 0,83 | |
| ESDI | 0,85 | 0,85 | 0,19 | 0,59 | 0,17 | 0,07 | 0,07 | 0,15 | 0,26 | 0,22 | 0,22 | ||
| HFDI | 0,93 | 0,70 | 0,30 | 1,00 | 0,08 | 0,41 | 0,41 | 0,52 | 0,56 | 0,56 | 0,28 | ||
| BCC | 0,15 | 0,37 | 0,67 | 0,37 | 0,67 | 0,44 | 0,44 | 0,81 | 0,85 | 0,07 | 0,56 | ||
| CHSDI | 0,07 | 0,07 | 0,19 | 0,15 | 0,08 | 0,44 | 0,44 | 0,00 | 0,70 | 0,04 | 0,17 | ||
| COMPONENT C: Economy & Society | RPDI | 0,83 | 0,92 | 0,88 | 0,83 | 0,67 | 0,88 | 0,92 | 0,88 | 0,83 | 0,79 | 0,80 | |
| EPR | 0,79 | 0,46 | 0,50 | 1,00 | 0,33 | 0,63 | 0,67 | 0,75 | 0,79 | 0,50 | 0,60 | ||
| FRII | 0,58 | 0,92 | 0,38 | 0,71 | 0,00 | 0,25 | 0,25 | 0,17 | 0,17 | 0,17 | 0,13 | ||
| EADI | 0,42 | 0,58 | 0,88 | 0,25 | 1,00 | 0,67 | 0,71 | 0,96 | 0,63 | 1,00 | 1,00 | ||
| APER | 0,83 | 0,88 | 0,50 | 0,71 | 0,11 | 0,21 | 0,21 | 0,17 | 0,17 | 0,29 | 0,13 | ||
| TPVI | 0,42 | 0,88 | 0,92 | 0,63 | 0,22 | 0,54 | 0,63 | 0,54 | 0,54 | 0,33 | 0,27 | ||
Disclaimer/Publisher’s Note: The statements, opinions and data contained in all publications are solely those of the individual author(s) and contributor(s) and not of MDPI and/or the editor(s). MDPI and/or the editor(s) disclaim responsibility for any injury to people or property resulting from any ideas, methods, instructions or products referred to in the content. |
© 2025 by the authors. Licensee MDPI, Basel, Switzerland. This article is an open access article distributed under the terms and conditions of the Creative Commons Attribution (CC BY) license (http://creativecommons.org/licenses/by/4.0/).
Copyright: This open access article is published under a Creative Commons CC BY 4.0 license, which permit the free download, distribution, and reuse, provided that the author and preprint are cited in any reuse.


