
Submitted:
23 July 2025
Posted:
24 July 2025
You are already at the latest version
Abstract
Seed-associated microbiomes represent a critical yet underutilised frontier in synthetic community (SynCom) design, particularly in forage legumes such as lucerne (Medicago sativa L.), where early microbial assembly can shape plant development. We developed ecologically-informed SynComs using seed-derived bacterial isolates from Medicago crop wild relatives (CWRs), prioritising genera that co-occur with the cultivated lucerne seed microbiota. Two three-strain SynComs and one six-strain ‘Mix’ SynCom were applied via seed inoculation. Plants were glasshouse-grown; a subset was transferred to a separate phenomics facility, exposed to contrasting water regimes, and later returned to the glasshouse for post-stress recovery. A multi-tiered approach combining phenotyping, high-throughput imaging, and 16S rRNA profiling captured plant–microbiome dynamics. SynCom inoculation consistently enhanced germination and early growth, with the ‘Mix’ SynCom producing the strongest early-stage phenotypic gains. Microbiome profiling revealed treatment-specific restructuring, showing selective enrichment and microbial coalescence. While SynCom effects were most pronounced early, their influence under drought and later stages was variable and context dependent. This study positions seed-based, CWR-derived SynComs as effective modulators of early plant–microbiome interactions. By integrating ecological selection with temporal phenotyping, we present a scalable framework for microbiome-informed crop improvement and a translational path toward seed-based microbial solutions in sustainable agriculture.
Keywords:
Synthetic bacterial communities
; SynComs
; Medicago sativa
; plant–microbe interactions
; plant growth promotion
; microbiome
; high-throughput phenotyping
; 16S rRNA gene sequencing
; drought stress
; plant phenomics
1. Introduction
Plants interact with diverse microbial communities that influence nutrient acquisition, stress adaptation, and immune regulation, forming intricate ecological networks. These interactions are governed by the host genotype (GP), microbiome composition (GM), and environmental conditions (E)—a framework conceptualised as plant health = GP × GM × E [1-3]. Although extensive research has focused on the rhizosphere and phyllosphere microbiomes, the seed microbiome remains an underexplored yet foundational determinant of plant health, influencing early microbial assembly and plant development [4-7]. However, its potential for microbiome engineering remains largely untapped, partly due to the complexity of plant–microbe and microbe–microbe interactions [8].
Recent advances in microbiome research have enabled the development of synthetic microbial communities (SynComs), providing a controlled and reproducible approach for studying plant–microbe interactions and manipulating microbiome with precision [9,10]. SynCom applications across a range of crops have demonstrated their potential to enhance plant fitness, microbial stability, and soil health. For instance, in cotton (Gossypium hirsutum), seed-applied SynComs improved germination, biomass accumulation, and yield, while modulating beneficial rhizosphere taxa [11]. In walnuts (Juglans regia), a three-strain Bacillus-based SynCom (B. safensis 5-49, B. halotolerans 6-30, and B. stratosphericus 5-54) significantly enhanced seedling biomass and nutrient mobilisation through microbial interactions [12]. Similarly, in sorghum (Sorghum bicolor L.) SynCom studies have identified key bacterial taxa that influence root system development and drought adaptation [13]. While these studies demonstrate the potential of SynComs to support plant growth, they also imply a broader functional role in shaping microbial community assembly—an ecological dimension that remains incompletely characterised.
Despite these advances, most SynComs to date have been derived from root-associated microbiota, with relatively little attention given to seed-origin microbial consortia. A recent study demonstrated that a seed-derived SynCom in radish (Raphanus sativus) effectively shaped both seed and seedling microbiota, reinforcing its potential to guide early-stage microbial assembly [14]. However, this approach remains underutilised in cultivated lucerne (Medicago sativa L., hereinafter referred to as lucerne), where research has predominantly focused on root-derived consortia rather than seed-associated microbial communities. For instance, a four-strain, nodule-derived SynCom in lucerne was shown to alleviate heavy metal, salinity, drought, and temperature stresses by enhancing antioxidant activity, photosynthesis, biomass, nodulation, and nitrogen fixation [15]. While these findings highlight the benefits of SynComs, the potential of seed-derived SynComs in lucerne remains largely unexplored, warranting further investigation into their role in microbiome assembly, plant resilience, and long-term stability.
Lucerne or alfalfa is a globally significant forage legume, critical to the dairy industry owing to its high nutritional value, digestibility, and palatability [16,17]. Its productivity is closely linked to microbial symbiosis, particularly biological nitrogen fixation and other root-associated mutualisms [18,19]. Based on findings from our microbiome profiling study (manuscript under review in Frontiers in Microbiology), Medicago crop wild relatives (CWRs), including M. laciniata and M. littoralis, harbour distinct seed microbiota and exhibit unique adaptations to diverse ecological conditions. These wild taxa may act as reservoirs of beneficial microbes that contribute to microbiome stability and adaptive resilience. However, their translational potential remains largely untapped [20]. Whether CWR-derived microbes can integrate into the lucerne microbiome and modulate community structure to confer agronomic benefits remains an unresolved question. Addressing this knowledge gap is essential to determine whether SynComs act merely as biofertilisers or serve as tools for targeted microbiome engineering.
To investigate the role of seed-derived microbial communities in microbiome assembly, we adopted an ecologically informed, reductionist SynCom design strategy that diverges from conventional trait-based approaches. SynComs were constructed exclusively from seed-associated bacterial isolates obtained from M. laciniata and M. littoralis. Constituent taxa were selected based on consistent co-occurrence across wild relatives and lucerne, as well as high genomic similarity to lucerne-associated strains. This compatibility-informed approach contrasts with conventional, combinatorial methods and introduces a new paradigm for SynCom development that prioritises ecological fitness and evolutionary continuity.
We hypothesised that CWR-derived microbes would enhance lucerne microbiome stability by selectively enriching functionally compatible taxa, thereby influencing seedling establishment and plant growth under both well-watered and drought conditions. Each SynCom, comprising three bacterial species per CWR, was applied via seed inoculation, and plant responses were evaluated across multiple developmental stages. A comprehensive experimental framework integrating morphometric analysis, biomass assessment, 16S rRNA gene sequencing, and high-throughput phenotyping (HTP) was employed to capture both plant phenotypic responses and microbial community shifts. Collectively, these approaches enabled us to evaluate whether CWR-derived SynComs act not merely as biofertilisers, but as modulators of microbial assembly and plant–microbe interactions. This work advances SynCom development from empirical selection toward ecologically-informed design, offering a reproducible model for microbiome-guided improvement of lucerne and other forage crops.
2. Materials and Methods
2.1. Selection of Bacterial Strains and SynCom Inoculum Preparation
Six bacterial strains were selected from a previously constructed library of 530 seed-derived bacterial isolates from lucerne and its CWRs (Table 1). The library was established through culture-based isolation, and 315 isolates were taxonomically classified using 16S rRNA Sanger sequencing. A subset of 34 representative isolates underwent whole-genome sequencing to investigate their comparative genomic relationships and potential functional roles in lucerne. Average Nucleotide Identity (ANI)-based genomic analysis identified taxa that were consistently present across lucerne and its CWRs—M. laciniata and M. littoralis [21]. These CWRs were selected for their distinct ecological adaptations: M. laciniata exhibits strong drought resilience [22,23], while M. littoralis demonstrates moderate salt tolerance [24]. Comparative analysis revealed that certain microbial taxa were dominant in both lucerne and CWRs, suggesting a potential role in microbiome stability.
To construct SynComs, three formulations were developed: (i) a Laciniata (LA) consortium, comprising three bacterial strains from M. laciniata; (ii) a Littoralis (LT) consortium, consisting of three bacterial strains from M. littoralis; and (iii) a Mix consortium, combining all six bacterial strains from LA and LT consortia (Supplementary Table S1). To assemble these SynComs, cryopreserved bacterial isolates were revived on nutrient agar and subsequently cultured in 40 mL of nutrient broth (NB) at 28±1 °C with constant agitation at 150 revolutions per minute (rpm) in a shaker incubator. Following overnight incubation, bacterial cell densities were adjusted to an optical density at 600 nm (OD600) of approximately 0.3–0.5, ensuring uniform cell density across strains. Equal volumes (20 mL) of each adjusted culture were pooled under sterile conditions to assemble the final SynCom inoculums (Figure 1).
2.1.1. Cultivar Selection and Germination
Lucerne cultivar ‘Aurora’ (Australian Wheatgrass Company) was selected for in planta evaluation of SynCom treatments. Seeds were surface rinsed four times with autoclaved reverse osmosis (RO) water and imbibed in each bacterial consortium solution for 2 hours with constant agitation at 150 rpm prior to germination. Control seeds underwent identical treatment but were imbibed in sterile NB. Germination rates were manually recorded at 7 days after planting (DAP).
2.2. Overview of the Conventional Phenotyping and HTP Imaging of the SynCom Effects Across Developmental Stages
To assess stage-specific effects of SynCom treatments, all plants were germinated as a single batch in a controlled glasshouse facility at the Centre for AgriBioscience in Bundoora, Victoria, Australia (37°41’51” S, 145°04’38” E). At 7 DAP, a subset of seedlings (n = 20 per treatment) was transferred to the Plant Phenomics Victoria (PPV) facility in Horsham, Victoria, Australia (36°43’13.8” S, 142°10’25.3” E), where they were transplanted into pots and maintained for HTP imaging until 63 DAP (Figure 2A–D). The remaining seedlings continued to grow in the Bundoora glasshouse, where early-stage phenotyping was conducted at 24 DAP. Following mid-stage phenotyping (63 DAP) in the PPV facility under both well-watered and drought conditions, a subset of plants was transported back to the Bundoora glasshouse and maintained under standard glasshouse conditions until 76 DAP, when post-stress recovery measurements were collected.
2.2.1. Early Seedling Growth Under Glasshouse Conditions
SynCom-inoculated and Control treatment seeds were germinated and grown in 100-cell seedling trays filled with standard potting mix (Van Schaik’s Bio Gro Pty. Ltd., Dandenong South, Victoria, Australia; composition details in Supplementary Section S1) for 24 days. The potting substrate was amended with extra-coarse vermiculite, Macracote Blue Coloniser Plus (Sunpalm Australia Pty. Ltd, Wangara, Western Australia, Australia), nitrogen fertiliser (Sirflo Plus N, 39.5% N), water-retaining crystals (Seasol, Boronia, Victoria, Australia), and garden lime. A total of 40 seedlings (10 replicates per treatment) were maintained in the glasshouse under controlled conditions: 22 °C daytime temperature (6:00 to 20:00), with artificial lighting activated when ambient light intensity dropped below 170 W/m2, and nighttime temperatures of 14 °C, with relative humidity maintained at 50–60%.
2.2.2. Controlled Environments and Phenotyping Setup at PPV Facility, Horsham
At 7 DAP, seedlings were transported in their original trays to the PPV facility in Horsham, where they were transplanted into 200 mm diameter white plastic pots (catalogue P200E04, Garden City Planters Pty. Ltd., Dandenong South, Victoria, Australia) filled with the same potting mix as previously described. To minimise foliage overhang and ensure uninterrupted imaging accuracy, a powder-coated blue (Reichs-Ausschuss für Lieferbedingungen [RAL] 5012 ‘Light Blue’) resin wire cage was installed in each pot at the time of transplantation. Each pot was placed in an individual carrier equipped with a radio frequency identification (RFID) chip and loaded onto the LemnaTec Scanalyser 3D (LemnaTec GmbH, Aachen, Germany) HTP phenomics platform to evaluate SynCom effects on lucerne. The seedlings were grown in a climate-controlled glasshouse at 23 °C from 7:00 to 20:00 and 15 °C from 20:00 to 7:00 without supplemental light. The glasshouse was clad in ‘plexiglass’ (poly(methyl methacrylate)) double-walled sheeting that allowed the full spectrum of sunlight to pass through.
Each treatment group consisted of 20 replicates, evenly divided between two watering conditions: 10 replicates were maintained under well-watered conditions (80% soil gravimetric water content, SGWC), while the remaining 10 were subjected to drought conditions (40% SGWC). To ensure uniform establishment post-transplantation, all plants were initially irrigated to 80% SGWC twice daily for the first week (see Supplementary Section S2 for SGWC details). This acclimation phase was implemented to support root system establishment and minimise transplant shock, as sudden exposure to severe water stress can negatively impact seedling survival and early growth. Following the acclimation phase, watering in the drought treatment was gradually reduced to 40% SGWC, while plants in the well-watered treatment were maintained at 80% SGWC. Watering was applied by the LemnaTec Scanalyser, which used pot weight to determine the amount of water to be applied for each treatment on a daily basis.
2.2.3. Early-Stage Phenotyping at Glasshouse, Bundoora (24 DAP)
At 24 DAP, seedlings were harvested (n = 10 per treatment) for shoot and root measurements, and tissue samples were collected for 16S rRNA gene sequencing.
2.2.4. Mid-Stage Phenotyping at PPV, Horsham (63 DAP)
Each treatment–watering condition combination consisted of ten biological replicates, from which five plants (n = 5) were randomly selected for biomass assessment. Aerial tissues were harvested and immediately weighed to record fresh/wet biomass. Samples were subsequently oven-dried at 70 °C for three days, after which dry biomass was recorded.
2.2.5. Late-Stage Phenotyping at Glasshouse, Bundoora (76 DAP)
Following mid-stage phenotyping at 63 DAP, three plants per treatment (n = 3) were transferred to the Bundoora glasshouse and maintained under standard watering conditions for an additional 13 days. Root and shoot biomass and length were measured, and tissue samples were collected for 16S rRNA gene sequencing. However, sequencing data from this time point were excluded from downstream analysis due to limited replication and variable taxonomic profiles.
2.3. HTP Image Analysis
Each plant was imaged twice weekly using the LemnaTec Scanalyser 3D phenotyping platform. Imaging was conducted under controlled lighting conditions within an enclosed cabinet, using visible-spectrum (red–green–blue, RGB) cameras (Prosilica GT, Allied Vision Technologies GmbH, Stadtroda, Germany) equipped with 50 mm focal length lens (T* 250 ZF, Carl Zeiss AG, Oberkochen, Germany). RGB images were captured from a top-down (top view, TV) perspective as well as from three lateral angles (0°, 120°, 240°) to provide a comprehensive view of plant architecture. Snapshot images were stored as blob files within a PostgreSQL database. A modified version of the PlantCV ‘Data Science Tools’ module was used to extract each snapshot as a series of six 24-bit Portable Network Graphic (PNG) images (4384 × 6576 pixels). A customised PlantCV [25] analysis pipeline was then developed to carry out the image analysis. This was run using PlantCV version 4.5.1, OpenCV version 4.10.0.84, and Python version 3.12.10 within a CentOS Linux version 7.9.2009 environment on the Biosciences Advanced Scientific Computer (BASC) cluster at the Centre for AgriBioscience in Bundoora, Victoria, Australia.
For each snapshot, PNG images were read into the pipeline and processed. The images were cropped to isolate plants from the side-view, to standardise them for further processing. Side-view RGB images were converted to CMYK colour space (cyan, magenta, yellow, and black bands), where the Y channel was particularly effective in isolating the plant from its background under constant lighting conditions across all images, by applying a fixed grey-level threshold of 71. The C channel was used to detect the blue plant support cage via a threshold of 75, followed by a 5 × 5 dilation, while the L channel enabled isolation of the carrier (potholder) using a threshold of 41 and the same dilation step. These binary masks (cage and carrier) were combined using a logical-OR operation. The carrier plate, located at the top of the carrier, was isolated using a threshold of 31 on the M channel, followed by a 5-pixel morphological opening, and added to the previous mask using another logical OR operation. This composite mask was used to subtract the carrier, cage and cage plate from the plant mask. Finally, a 3 × 3 dilation was applied to the binary mask to define the final region of interest for further analysis. To isolate plants from top-view images, RGB images were converted to l*a*b colour space. The *a channel allowed for clear plant–background separation using a fixed grey-level threshold of 120, followed by inversion. To exclude tracks, carrier and potting mix from the imaging chamber, the RGB images were also converted to HSV (hue, saturation, value) colour space, and a threshold of 60 was applied. Two rounds of 9 × 9 dilations were then performed to generate a binary mask, which was subtracted from the top-view plant mask to accurately identify a foreground region-of-interest for top-view images.
Digital volume, calculated as the sum of green pixel areas from three side views and one top view per time point, was used as a proxy for biomass. This metric, derived using the VLemnaTec formula [26], has been independently validated to correlate with actual plant biomass.
2.4. DNA Extraction, 16S rRNA Amplicon Library Preparation and Sequencing
Root and shoot samples collected at 24 DAP and 76 DAP were used for DNA extraction and 16S rRNA amplicon library preparation, which was performed using a modified Qiagen® MagAttract® protocol. The sequencing was conducted on an Illumina MiSeq platform (2 × 300 bp). Detailed library preparation and sequencing protocols are provided in Supplementary Section S3.
2.5. Data Analysis
2.5.1. Statistical Analysis for Conventional Phenotyping Measurements
All statistical analysis and visualisations were conducted using R (version 4.4.2, R Core Team, 2024) with tidyverse [27], car [28], FSA [29], emmeans and multcompView [30] packages. The datasets from different phenotyping timepoints were reshaped to a long format using pivot_longer function (tidyr), with treatment labels harmonised using recode. Descriptive statistics including means, standard deviations (SD), standard errors (SE) and fold changes were calculated for each treatment and condition. Assumption testing was performed using the Shapiro-Wilk test [31,32] for normality and Levene’s test [33] for homogeneity of variances. Where assumptions were met, one-way analysis of variance (ANOVA) [34] was performed, followed by Tukey’s Honest Significant Difference (HSD) test (Tukey HSD) [35] for pairwise comparisons. For data that did not satisfy these assumptions, a Kruskal-Wallis test was applied, with pairwise Wilcoxon rank-sum tests used for post-hoc comparisons with Bonferroni correction [36]. Fold changes in mean values were calculated to compare the treatment effects across time points, while statistical significance was assessed using ANOVA or Kruskal-Wallis tests, as appropriate. A threshold of p < 0.05 was used to determine statistical significance.
2.5.2. Validation of HTP-Derived Biomass Estimates
To evaluate the relationship between digital volume estimates from HTP and conventional biomass measurements, wet aerial biomass at 63 DAP was compared against pixel-derived digital volume data. Both datasets were analysed in their original units to retain scale integrity. A linear regression model was applied in R (v4.4.2), and model fit was assessed using the coefficient of determination (R2). An identity line (wet biomass regressed against itself) was included for reference. Data reshaping and preparation were performed using the dplyr [37] and tidyr [27] packages, and visualisations were generated using ggplot2 [38].
2.5.3. Microbiome Data Processing and Statistical Analysis
Microbiome analysis was conducted using a combination of QIIME2 (Quantitative Insights Into Microbial Ecology 2; v2021.4) and R, to process, filter, and analyse the 16S rRNA sequencing data. Raw paired-end reads were initially merged and error-corrected using PEAR (Paired-End reAd mergeR; v0.9.10) with default parameters [39]. The merged sequences were imported into QIIME2 using the manifest format as single-read FASTQ files. To remove primer sequences, the q2-Cutadapt plugin was applied with an error rate of 0.2 and the parameters: error rate-0.2, flags; adapter-wildcards, read-wildcards, and discard-untrimmed. Demultiplexed raw sequences were processed, where low-quality reads were trimmed, and sequences were denoised using DADA2 (Divisive Amplicon Denoising Algorithm 2) [40] to infer amplicon sequence variants (ASVs) while simultaneously filtering out chimeric sequences. Taxonomic classification was performed using a Naïve Bayes classifier trained on the SILVA 138 database at a 99% identity threshold [41]. To ensure accurate representation of microbial communities, cytoplasmic contaminants such as chloroplast, mitochondria, or eukaryotic sequences were removed from the dataset. The filtered ASV table, taxonomy assignments, and associated metadata were then imported into R for downstream analyses using the phyloseq [42], microbiome [43], vegan [44], and indicspecies packages [45,46].
Alpha diversity metrics [47], including Shannon, Simpson, Chao1, and Observed ASVs, were calculated to assess within-sample microbial diversity using the phyloseq and vegan packages. Observed ASVs and Chao1 reflect species richness, while Shannon and Simpson indices incorporate both richness and evenness. Differences in alpha diversity between treatments were statistically tested using Kruskal-Wallis tests, followed by pairwise Wilcoxon rank-sum tests with Benjamini-Hochberg correction for multiple comparisons [48]. Core microbiome analysis was performed in R using the phyloseq package, applying a prevalence threshold of 50% (i.e., taxa present in at least 50% of samples within a group) and an abundance detection threshold of 0.001. Indicator species analysis was performed using the indicspecies package in R to identify microbial taxa significantly associated with specific SynCom treatments, with statistical significance assessed using 999 permutations. This method was selected as it is well-established for detecting treatment-specific microbial signatures in SynCom studies [11]. Data visualisation and statistical analyses were conducted in R, with ggplot2 and ggpubr used for diversity plots and statistical comparisons [49]. Core microbiome overlaps were visualised using the VennDiagram package [50]. Relative abundance transformations were applied where necessary to ensure valid comparisons across samples
3. Results
3.1. Microbiome Dynamics at 24 DAP
3.1.1. Microbiome Sequencing and Data Processing
A total of 43,159,116 raw reads were generated across all samples (Supplementary Table S2). After quality filtering, 10,461,259 high-quality reads were retained. Removal of plant-derived sequences resulted in 9,521,338 non-plant microbial reads. Prior to rarefaction, sequencing depth varied substantially across samples, from 0 to 504,125 reads per sample, with a median 28,893. To ensure comparability, samples were rarefied to 20,000 reads, retaining 47 samples for downstream analyses. The resulting dataset comprised 940,000 sequences and 3,299 ASVs, capturing representative microbial diversity for robust analysis.
3.1.2. Microbial Diversity Analysis
Alpha diversity was assessed using Observed ASVs, Chao1, Shannon and Simpson indices to evaluate microbial richness and evenness across treatments (n = 10 per treatment group). While statistical analysis revealed no significant differences in alpha diversity among treatments (Observed ASVs: p = 0.280, Chao1: p = 0.424, Shannon: p = 0.197, Simpson: p = 0.196), descriptive patterns/trends observed in richness and diversity metrics suggest potential ecological shifts in microbial community composition among SynCom-inoculated samples compared to Control. LT exhibited the highest values for both richness and diversity indices, followed by LA and Mix, with the relative ranking differing slightly across indices. The Control consistently showed the lowest values across all metrics (Figure 3A–D).
3.1.3. Core Microbiome Analysis
To further characterise microbial community composition, core taxa were identified and compared between the Control and SynCom-treated groups, as well as among SynCom treatments. Core taxa were defined as ASVs present in ≥ 50% of samples within each group at a detection threshold of 0.001. A total of 137 ASVs were consistently shared across all treatments, including the Control. These belonged to the classes Alphaproteobacteria (Allorhizobium–Neorhizobium–Pararhizobium–Rhizobium group [ANPR], Azospirillum, Bradyrhizobium, Novosphingobium, Pseudolabrys, Sphingomonas), Gammaproteobacteria (Massilia, Pantoea, Pseudomonas), Actinobacteria (Streptomyces, Cellulomonas), and additional members from Bacteroidia, Bacilli, Bdellovibrionia, Holophagae, Myxococcia, Polyangia, Saccharimonadia, Thermoleophila and Verrucomicrobiae (Figure 4A; a complete taxonomic list is available in Supplementary Table S3). Taxonomic annotations for ASVs were assigned using standard classification algorithms against the SILVA database (v138), and reflect the most probable phylogenetic affiliations based on available reference sequences. These labels will be used throughout the discussion to aid in interpreting potential ecological roles, while acknowledging the limitations of inference based solely on taxonomic assignment.
The total number of core ASVs detected was 208 in LT, 206 in LA, 199 in Mix, and 208 in the Control group. Pairwise comparisons with the Control revealed a substantial overlap in core taxa, with shared ASVs ranging from 65.7% to 72.6% (Table 2). The LA treatment showed the highest overlap with the Control (72.6%), followed by Mix (66.8%) and LT (65.7%) (Figure 4B). LT also contained a larger proportion of unique ASVs (30.7%) compared to Control, a difference that was statistically significant (Fisher’s Exact Test: p = 3.02 × 10⁻¹²; Chi-square: p = 8.18 × 10⁻¹¹), indicating the introduction or enrichment of distinct taxa in this treatment. The Mix treatment also harboured 20.9% unique ASVs, though this difference was marginally non-significant (p = 0.0502).
Comparisons among SynCom treatments revealed moderate overlap in core taxa (65.4%–68.0%), with LT again showing the highest proportion of unique ASVs—27.5% compared to LA and 26.6% compared to Mix (Table 2; Figure 4C). These differences were statistically significant (Fisher’s Exact Test: LT vs LA: p = 6.14 × 10⁻⁹; LT vs Mix: p = 3.09 × 10⁻⁶), indicating treatment-specific microbial associations in the LT group. In contrast, Mix treatment exhibited the lowest proportion of unique core taxa (8.0%), consistent with its previously observed lower alpha diversity.
A total of 149 ASVs, representing Alphaproteobacteria, Gammaproteobacteria, Actinobacteria, Bdellovibrionia, Verrucomicrobiae, Holophagae, Myxococcia, Polyangia, Saccharimonadia, and Bacilli, were shared across all three SynCom treatments (complete taxonomic list is provided in Supplementary Table S4). Additionally, 12 ASVs were uniquely detected in SynCom treatments but absent in the Control. These included taxa from Novosphingobium, Pseudolabrys, Bdellovibrio, Solirubrobacterales_67–14, Microscillaceae (uncultured), Rhizobiacea (unclassified), LWQ8, Pedosphaeraceae (uncultured) and Opitutaceae (uncultured) (see Supplementary Table S5).
3.1.4. Indicator Taxa Analysis
Indicator taxa analysis was performed using the indicspecies package to identify microbial groups significantly associated with specific SynCom treatments and abundant within communities. Rather than broadly profiling differential abundance across the community, this approach focused on detecting microbial taxa with high fidelity and specificity to individual treatments. A total of 27 bacterial orders were detected across all samples (Figure 5). The microbial community composition revealed distinct treatment-specific signatures, with certain orders significantly associated with particular SynCom inoculations.
Importantly, indicator taxa identified here are not the inoculated SynCom members themselves, but native or coalesced taxa whose abundance was significantly associated with specific treatments. This distinction highlights the capacity of SynComs to modulate broader microbiome assembly without necessarily dominating the community.
The Control group was strongly dominated by Azospirillales, comprising over 75% of the total relative abundance. In contrast, the LA treatment exhibited a notable shift, with enrichment of Sphingomonadales (36.19%) and Burkholderiales (4.56%) compared to the Control. The LT treatment displayed the greatest diversity of indicator taxa among all treatment groups, with Azospirillales (19.01%), Cytophagales (9.20%), and Chitinophagales (8.82%) emerging as dominant contributors. This broader distribution of taxa suggests a more extensive microbial restructuring in response to LT inoculation. The Mix treatment presented a distinct microbial profile, dominated by Rhizobiales, which constituted 71.01% of the total community composition (see Supplementary Table S6 for the complete list of indicator taxa and their relative abundances).
3.2. Overview of Conventional Phenotyping Measurements
Conventional (destructive) phenotyping was performed to assess the effects of SynCom treatments on lucerne growth and biomass accumulation across different developmental stages and watering regimes. Growth parameters were measured at three time points (24, 63 and 76 DAP) in lucerne cultivar ‘Aurora’. At 24 DAP, root and shoot lengths were measured under standard glasshouse conditions, capturing seedling establishment and early growth responses. At 63 DAP, wet and dry aerial biomass measurements were recorded at the PPV facility under well-watered and drought conditions to assess mid-stage treatment responses to water availability. At 76 DAP, following re-establishment in the glasshouse, root and shoot length and biomass were measured to evaluate post-stress growth recovery.
3.2.1. Evaluating the Impact of SynCom Treatments on Germination and Early-Stage Plant Growth
The Mix treatment exhibited the highest germination rate (82%), followed by LA (76%), LT (75%), and Control (72%) (Figure 6A). As differences were minimal and not central to the study’s primary objective, no statistical analysis was performed. At 24 DAP, root and shoot lengths were measured to assess treatment effects on early growth (Figure 6B). Both datasets met assumptions of normality (Shapiro-Wilk test, p > 0.05) and homogeneity of variance (Levene’s test, p > 0.05), allowing the use of one-way ANOVA.
The Mix treatment exhibited the greatest mean root (123.7 ± 8.8 mm) and shoot lengths (186.1 ± 9.2 mm) significantly exceeding the Control (root: 95 ± 6.6 mm; shoot: 143.5 ± 11.8 mm) (Figure 6B; see Supplementary Table S7 for descriptive statistics summary of 24 DAP measurements). ANOVA revealed statistically significant differences among treatment groups for both root length (F = 5.95, df = 3, p = 0.002) and shoot length (F = 3.54, df = 3, p = 0.024). Post hoc Tukey’s HSD confirmed that Mix treatment differed significantly from the Control in both root (p = 0.019) and shoot (p = 0.019) measurements. The LA and LT treatments exhibited intermediate growth responses that were not statistically distinct from the Control.
3.2.2. Evaluating Plant Aerial Biomass at 63 DAP across SynCom Treatments and Watering Conditions
As expected, plants grown under well-watered condition accumulated more aerial biomass than those under drought conditions (Refer to Supplementary Table S8 for descriptive statistics summary of 63 DAP measurements). The data met assumptions of normality
(Shapiro-Wilk test, p > 0.05) and homogeneity of variance (Levene’s test, p > 0.05), allowing one-way ANOVA. No statistically significant differences were observed among treatments for either parameter under either watering conditions (p > 0.05). However, box plot visualisations (Figure 7) revealed a modest increase in both wet and dry biomass in SynCom-treated plants compared to the Control, particularly under well-watered conditions, with opposite trends seen under drought conditions. Among SynComs, LT showed the greatest mean biomass under optimal watering. Under drought conditions, all SynCom treated plants showed similarly low biomass values, suggesting that inoculation did not enhance growth under water-limited conditions (Supplementary Table S8).
3.2.3. Post-Stress Recovery and Growth Progression Across Timepoints
To explore potential longer-term effects of SynCom treatments under post-stress conditions, a small subset of plants (n = 3) was phenotyped at 76 DAP. Due to the limited replication, these observations are exploratory and warrant cautious interpretation. Full data and statistical details are provided in Supplementary Section S4.
Among plants previously maintained under well-watered conditions in the PPV facility, LA-treated plants exhibited the highest root length, shoot length, and shoot biomass, while LT-treated plants showed the greatest root biomass. In previously drought-treated subset, the Mix yielded the greatest root length, LA maintained the highest root biomass, and the Control group exhibited the greatest shoot length and shoot biomass (Supplementary Section S4: Figure S2). Microbiome results are not presented for this time point, as the data were excluded from analysis (see Methods Section 2.2.5)
Fold change analysis between 24 DAP and 76 DAP revealed the largest increase in root length in LT-treated plants, and the greatest increase in shoot length in the Control group. Between 63 DAP and 76 DAP, the LA treatment showed the highest gain in wet aerial biomass, followed by Mix, LT, and Control. Although no statistically significant differences were observed due to the small sample size, these trends provide exploratory insights into treatment-specific recovery dynamics (see Supplementary Section S5 for full analysis).
3.3. Overview of HTP Phenotyping Using Image-Based Analysis
HTP imaging was conducted over a 55-day period at the PPV facility, with images captured at 17 time points. To validate the reliability of digital volume as a proxy for aerial biomass, pixel-derived values from HTP imaging were compared with conventional wet biomass measurements obtained at 63 DAP.
3.3.1. Validation of HTP Imaging Against Conventional Biomass Measurements
A strong positive correlation was observed between HTP-derived digital volume and conventionally measured wet aerial biomass across all treatment groups. Linear regression analysis yielded a R2 of 0.98, indicating that 98% of the variation in the wet aerial biomass was explained by image-based estimates (Figure 8).
This strong alignment supports the use of pixel-derived measurements as a robust proxy for biomass throughout the imaging period. The consistency in treatment-level trends between adjusted pixel values (calculated by summing pixel data from four camera angles; top view, 0°, 120°, and 240°) and conventional biomass measurements is further illustrated in the comparative bar plot (Supplementary Figure S1).
3.3.2. Early-Phase Imaging Analysis (Day 1–17)
To facilitate interpretation, the imaging data were divided into two temporal phases. The early phase comprised six imaging time points, during which all plants were uniformly irrigated. At Day 1 in the PPV, the Control (n = 20, mean = 1452.1) group exhibited the highest mean aerial biomass (digital volume), followed by LA (1428.9), Mix (1408.5), and LT (1245.1), indicating similar baseline growth across all treatments (Figure 9A). However, by Day 2, LA (mean = 2104.9, p = 0.157) and Mix (mean = 2074.4, p = 0.516)) treatments exceeded the Control (mean =1936.5). Overall, LA treatment showed a trend toward enhanced growth.
From Day 7 onwards, following the onset of differential watering, SynCom-specific effects became more pronounced. From Day 7 to Day 17 all SynCom treatments consistently outperformed the Control under both watering conditions, with the Mix treatment exhibiting the highest mean aerial biomass accumulation across this period. Time-series data for all early-phase time points are summarised in Supplementary Table S10. Day 17 at the PPV corresponds to 24 DAP in the conventional phenotyping timeline. Trends observed in HTP imaging values at this timepoint were consistent with destructive phenotyping results, where the Mix treatment also showed significantly greater shoot and root growth compared to the Control (Figure 6B; Supplementary Table S7). A significant drought effect was confirmed by Day 17 (p = 0.033), validating the effectiveness of the stress protocol and justifying continued analysis into the late-phase.
3.3.3. Late-Phase Imaging Analysis (Day 24 to Day 55)
The late phase comprised 11 imaging time points, during which half of the plants continued under well-watered conditions, and the remaining half were subjected to drought according to the defined drought protocol. Under well-watered conditions, all SynCom treatments exhibited higher biomass accumulation than the Control (n = 10), with the exception of three specific days. At Day 45 and Day 48, only the LT treatment exceeded Control, while at Day 52, both LT and LA showed greater biomass than the Day 52-Control (Figure 9B; Supplementary Table S10).
Under drought conditions, all SynCom treatments outperformed the Control at Day 24. By Day 28, only the LA and Mix maintained higher aerial biomass than the Control, and by Day 31, this trend persisted exclusively in the LA treatment. From Day 35 onwards through to Day 55, the Control treatment exhibited the highest biomass across all treatments.
4. Discussion
4.1. A Holistic/Multifaceted Approach to Evaluating SynCom Efficacy on Lucerne Growth
This study employed an integrative phenotyping–microbiome framework to assess effects of SynComs, derived from Medicago wild relatives, on lucerne growth across multiple developmental stages under varying environmental and watering conditions. Conventional phenotyping enabled precise, trait-specific measurements of root and shoot development, biomass accumulation, and recovery dynamics. In parallel, HTP imaging offered a non-destructive, time-resolved platform to monitor temporal growth trajectories with temporal resolution [51]. The combined use of these methodologies provided a comprehensive view of SynCom efficacy, capturing both early physiological responses and mid- to late-stage plant developmental outcomes. Similar dual-phenotyping strategies have been successfully applied in other crops, such as maize (Zea mays) [52], cotton [11] and soybean (Glycine max) [53]. The application of HTP in microbial inoculation studies has been valuable in sorghum [13,54] and maize [55], allowing precise quantification of temporal growth trends and plant–microbe interactions under different environmental conditions. In this context, the integration of microbiome profiling at 24 DAP further extended the analytical resolution of the study by linking early growth responses with microbial community dynamics. Collectively, this multifaceted approach enabled the evaluation of stage-specific SynCom performance, the functional relevance of microbial diversity within consortia, and treatment responses under both well-watered and drought conditions.
4.2. Functional Microbiome Restructuring Underpins Early Growth Responses
SynCom inoculation notably influenced early lucerne growth, with the Mix treatment yielding the highest germination rates and significantly enhanced root and shoot elongation. These findings align with previous studies showing that microbial consortia can promote germination by breaking dormancy and accelerating metabolic activity, often through the production of phytohormones such as auxins (indole-3-acetic acid, IAA) and gibberellins (GA), which regulate root elongation and nutrient uptake [56-59]. Similar trends have been observed in wheat [60] and cotton [11], where SynCom application improved early growth through plant hormonal signalling and nutrient solubilisation. At 24 DAP, conventional phenotyping confirmed statistically significant improvements in root and shoot lengths under the Mix treatment, while HTP captured sustained aerial biomass gains from as early as 7 DAP (Figure 6B and Figure 9A). Together, these results suggest that early-stage plant responses are strongly influenced by microbial colonisation dynamics.
Microbiome analysis at 24 DAP revealed that SynCom inoculation altered microbial community composition in treatment-specific way, reinforcing the hypothesis that early plant development is influenced by microbiome restructuring. Although alpha diversity indices did not show statistically significant differences, treatment-specific trends in microbial richness and evenness were evident (Figure 3). Notably, the Mix treatment, despite its superior growth effects, exhibited the lowest microbial richness among SynComs. These findings indicate that functional selectivity rather than taxonomic diversity, is a key driver of early plant performance, likely shaped by competitive exclusion of non-beneficial microbes and priority effects, whereby early colonising taxa influence the assembly and function of the subsequent microbial community [61-63].
Indicator taxa analysis provides insights into microbial shifts associated with specific treatments, highlighting taxa that are selectively enriched or diminished following inoculation. These taxa are not the inoculated strains themselves, but rather native or coalesced microbes that respond predictably to treatment. As ecological markers, they reflect microbial adaptation, functional contributions to plant–microbe interactions, and potential mechanisms underlying SynCom-mediated plant benefits [11,64]. Identifying such taxa enable evaluation of SynCom efficacy beyond overall microbial diversity, helping to pinpoint microbial groups involved in nutrient cycling, pathogen suppression, or microbiome stabilisation. The Mix treatment exhibited the most pronounced microbial shift, with Rhizobiales identified as the most dominant indicator group (Figure 5). This group is well known for biological nitrogen fixation, root colonisation, and phytohormone production, all contributing to enhanced plant growth. This dominance aligns with previous studies where SynCom inoculation enhanced plant growth through microbially driven nitrogen availability and metabolic interactions in the rhizosphere [65,66]. In addition, the Mix treatment showed enrichment of Streptomycetales, while Vermiphilaceae and Kapabacteriales, which were detected in the other SynCom treatments and the Control, were notably absent. These patterns suggest that the Mix SynCom exerted distinct selective pressures, leading to a more streamlined yet functionally optimised microbiome.
Core microbiome analysis provides further evidence that treatment-specific microbial assemblages influence plant responses. Across all treatments, 137 ASVs were consistently shared (Figure 4A), suggesting that a stable core microbiome persists regardless of SynCom inoculation. These taxa likely represent ubiquitous microbial members of the plant microbiome with conserved ecological roles. Key shared taxa included Pseudomonas, Bradyrhizobium, ANPR-complex, Massilia, Novosphingobium, and Streptomyces, which are broadly associated with nitrogen fixation, plant growth promotion, and stress resilience [67-71]. Their consistent presence across treatments suggests that SynComs integrate with native microbiomes rather than fully displacing them, contributing to microbial coalescence and influencing community assembly through priority effects [62]. Beyond the shared core microbiome, a total of 149 ASVs were detected exclusively in SynCom-treated plants but were absent from the Control, indicating that SynCom inoculation selectively recruited or maintained certain microbes. Notable taxa among these included Azospirillum, Sphingomonas, Burkholderiales, Flavobacterium, and Streptomyces, which contribute to nutrient cycling, pathogen suppression, and microbiome stability [69,72-75]. These findings align with previous studies demonstrating that SynComs facilitate beneficial microbial interactions that improve plant establishment [11,76]. These compositional trends also align with alpha diversity patterns. LT-treated plants exhibited both higher species richness and a greater number of unique core ASVs, suggesting broad microbial recruitment or retention. In contrast, the Mix SynCom (combination of LA and LT consortia), despite its superior growth effects, supported a more compositionally constrained microbiome, with fewer unique ASVs and lower diversity indices. This pattern suggests functional streamlining rather than taxonomic breadth.
Distinct patterns in microbiome composition were observed across SynCom treatments. The LA-inoculated plants were enriched in Novosphingobium [77] and Thiomonas [78], which have been associated with nutrient cycling and soil health, albeit with less well-defined roles in plant growth. In contrast, the LT treatment exhibited the highest microbial richness, yet this was not reflected in enhanced plant growth. This divergence further supports the interpretation that taxonomic diversity alone does not equate to functional efficacy. In addition to the broader microbiome shifts, 12 ASVs, including Bdellovibrio, Pedosphaera, and unclassified Rhizobiaceae, were uniquely detected in SynCom-treated plants and were absent from the Control. Bdellovibrio is a known bacterial predator with potential roles in pathogen suppression [79], while Pedosphaera contributes to soil health and organic matter decomposition [80]. The selective enrichment of these taxa highlights the potential for SynComs to actively shape microbial communities and enhance beneficial interactions within the plant rhizosphere.
While these findings demonstrate clear microbiome compositional shifts at 24 DAP, it remains unclear whether such restructuring persists or contributes to long-term plant performance. Due to sequencing limitations, microbiome profiling was not extended beyond this time point. Given these early microbial shifts, the following sections explore whether such restructuring translated into sustained phenotypic advantages under varying environmental conditions.
4.3. Temporal Dynamics of SynCom-Mediated Growth Under Contrasting Water Regimes
At 63 DAP, an intermediate growth stage of lucerne, biomass accumulation was assessed under well-watered and drought conditions to evaluate SynCom-mediated plant responses prior to maturity. Conventional phenotyping revealed no statistically significant differences among treatments; however, SynCom-inoculated plants generally exhibited higher biomass than the Control, particularly under well-watered conditions (Figure 7). HTP imaging further supported this trend, capturing temporal growth dynamics not fully resolved by conventional phenotyping. Under well-watered conditions, all SynCom treatments outperformed the Control at specific time points, with LT exhibiting the most consistent performance (Figure 9). This may be attributed to the enrichment of Cytophagales, Chitinophagales, and Saccharimonadales observed at 24 DAP, taxa known to enhance nutrient availability, organic matter accumulation, microbiome stability, and hormone regulation, potentially contributing to sustained biomass production [81-83]. These findings align with previous studies demonstrating that microbial consortia can improve biomass accumulation by facilitating nutrient uptake, modulating hormone signalling, and optimising root system architecture under favourable conditions [53,60,84,85].
Under drought conditions, SynCom treatments did not confer a significant aerial biomass advantage over Control. Interestingly, Control plants exhibited higher biomass at later time points, which may be partially explained by the elevated relative abundance of Azospirillum in the Control microbiome at 24 DAP. Azospirillum spp. are well-characterised for their drought adaptation mechanisms, including the production of osmoprotectants (e.g., proline and betaine), modulation of root architecture, and regulation of phytohormones such as auxins, GA, and cytokinins [86,87]. These functions contribute to enhanced water-use efficiency and stress mitigation. Additionally, their nitrogen fixation, phosphorus solubilisation, and ACC deaminase activity improve nutrient access under water-limited conditions, while biofilm formation stabilises their rhizosphere presence [86]. Positive growth responses to Azospirillum inoculation under drought have been widely documented in crops such as maize and wheat [86,88].
Among SynCom-treated plants, the LA treatment sustained higher biomass accumulation for up to 24 days after drought initiation, supporting the hypothesis that drought-adapted microbes from M. laciniata contribute to early stress resilience. Microbiome profiling at 24 DAP corroborates this interpretation; LA-treated plants exhibited the highest relative abundance of Azospirillum among SynComs, along with enrichment in Sphingomonadales and Burkholderiales—microbial groups associated with drought adaptation in wheat and sugarcane (Saccharum officinarum) [87,89,90]. These taxa are known to improve water-use efficiency, regulate stress-responsive signalling, and facilitate beneficial root-microbe interactions, potentially contributing to the biomass retention observed in LA-inoculated plants under drought. However, beyond Day 35, Control plants maintained the highest aerial biomass, suggesting that intrinsic plant adaptation mechanisms, possibly suppressed by SynCom inoculation, may underlie long-term drought resilience. The transient performance advantage observed in LA-treated plants under drought highlights an important consideration: early SynCom benefits may not always translate into prolonged functional gains under persistent abiotic stress. This underscores the need to assess SynCom performance across developmental stages and stress durations to capture their full potential.
More broadly, these observations reinforce the complexity of plant–microbiome–environment interactions. SynCom performance is shaped not only by inoculant composition, but by its compatibility with host genotype and environment context—a relationship often conceptualised as GP × GM × E [1-3], as outlined in the introduction. Future optimisation of SynComs will require design strategies that account for this dynamic triad, particularly under variable field conditions where microbial contributions to stress resilience may fluctuate over time.
4.4. SynCom Performance During Post-Stress Recovery and Later Growth Stages
Following the exploratory phenotyping at 76 DAP (see Section 3.2.3), we examined potential treatment-specific trends in post-stress recovery. While replication was limited, the patterns observed offer preliminary insights into SynCom-associated growth trajectories under fluctuating conditions.
The transition from the PPV facility to glasshouse included a four-hour transport and acclimation period, which may have introduced mechanically induced stress (MIS), followed by adjustment to new watering and light regimes. Plants experiencing MIS often activate defence signalling pathways, including the accumulation of ascorbic acid and polyphenolic compounds, which contribute to stress adaptation and recovery [91]. These external factors may have influenced recovery outcomes, highlighting both plant resilience and the potential role of SynComs in facilitating post-stress adaptation.
At 76 DAP, conventional phenotyping indicated treatment-specific trends in post-stress recovery. LA-inoculated plants that were previously well-watered showed comparatively improved root and shoot traits, suggesting enhanced biomass recovery (Supplementary Section S4: Figure S2). In contrast, LT-treated plants exhibited a more root-centric growth strategy, potentially supporting long-term nutrient acquisition and physiological stability. This trend may relate to the early enrichment of Cytophagales, Chitinophagales, and Saccharimonadales observed at 24 DAP—microbial groups associated with nutrient cycling, hormone regulation, and root development [81-83].
Post-stress recovery is increasingly recognised as a relevant yet underexplored phenotype in plant–microbiome research, particularly for crops exposed to variable environmental conditions. In this study, SynCom treatments offered limited aboveground recovery in drought-affected plants. Notably, Control plants outperformed SynCom-treated groups in shoot biomass, aligning with previous findings by Yadav, et al. [92], who reported variable SynCom effects on recovery. However, root-level advantages were apparent in some treatments: Mix-inoculated plants exhibited the greatest root length, while LT-treated plants recorded the highest root biomass, potentially indicating an adaptive shift toward belowground investment during recovery.
The limited aboveground recovery observed in SynCom-treated drought plants may reflect a lack of specific functional traits, such as osmoprotectant synthesis, rapid reactivation under stress, or efficient water-use strategies required for effective post-stress resilience. These observations reinforce the importance of designing SynComs not only for initial colonisation or drought adaptation, but also for functional persistence during recovery. The comparatively reduced performance of Mix-treated plants, despite strong early-stage outcomes, could be attributed to functional redundancy, insufficient microbial activation under later growth conditions, or competitive suppression by native microbiota in a changing environment.
Microbiome insights from 24 DAP offer a possible mechanistic basis for these phenotypic patterns. LA-inoculated plants, which appeared to recover more robustly, had previously shown enrichment in Azospirillum, Sphingomonadales, and Burkholderiales—taxa widely associated with drought adaptation, osmoprotection, and microbiome stabilisation [86,87,89]. Although microbiome profiling was limited to 24 DAP, the phenotypic trends observed at 76 DAP suggest that early microbial signatures may have had lingering effects in some treatments (e.g., LA), even as community composition likely evolved. In contrast, the reduced biomass response in Mix-treated plants indicated that early benefits may not be sustained without continued compatibility or functional expression over time. Comparative analysis of root and shoot fold changes between 24 DAP and 76 DAP suggested stage-dependent SynCom efficacy. LT-inoculated plants exhibited the greatest increase in root fold change (Supplementary Section S5: Figure S3), while Mix-treated plants showed the lowest fold changes for both root and shoot traits, consistent with a decline in SynCom efficacy at later developmental stages. Similar trends have been reported in cotton [11], where early SynCom benefits diminished over time, possibly due to host filtering or microbial competition with native soil microbiota [93]. As plants transition to reproductive phases, resource allocation often shifts away from vegetative growth, contributing to slower biomass accumulation [93,94]. Additionally, premature flowering has been associated with reduced vegetative growth, which may partially explain the lower shoot biomass observed in later stages [95].
Further comparison of wet aerial biomass between 63 DAP (well-watered) and 76 DAP (recovery under normal watering) showed biomass increases across all treatments. Among SynCom-inoculated groups, the LA-treated plants exhibited the highest fold increase, further suggesting a modest advantage in recovery potential. While these findings remain exploratory due to small sample size, they highlight the potential of drought-adapted SynComs, such as those derived from M. laciniata (LA), to support resilience beyond the immediate recovery phase.
4.5. Insights from Phenotyping and Microbiome Approaches in Evaluating Syncom Efficacy
In addition to the biological interpretations discussed above, this study offers reflections on the methodological framework used to evaluate SynCom efficacy. Although microbiome analysis was conducted at two time points (24 and 76 DAP), only the 24 DAP data were included in the final analysis due to limited replication at 76 DAP (n = 3). Future studies would benefit from increased replication to improve the reliability of microbiome inferences and to better capture temporal shifts. Nevertheless, integrating early microbiome data with time-resolved phenotyping enabled a multi-dimensional interpretation of SynCom effects across developmental stages and watering regimes, offering a scalable and informative framework for evaluating SynCom efficacy in diverse plant systems.
The integration of conventional and HTP methods enabled a comprehensive assessment of SynCom performance in lucerne. Conventional phenotyping facilitated precise, trait-specific measurements at key developmental stages, offering valuable insights into root and shoot responses to inoculation. However, its labour-intensive nature and limited scalability constrained the ability to detect fine-scale growth dynamics and treatment responses over time [51,96]. By contrast, HTP imaging allowed for non-destructive, high-resolution biomass estimation, enabling the detection of temporal trends and subtle treatment-induced effects that conventional phenotyping could not fully resolve [97,98]. Imaging sensor-based HTP platforms have demonstrated robust performance across diverse crops such as rice [99], maize [100], and wheat [101], and strong correlation observed in the study between pixel-derived biomass and conventional wet biomass (Figure 8) affirms the reliability of this approach [51]. The ability of HTP to resolve stage-specific SynCom effects, particularly between 7 DAP to 63 DAP, underscores its utility in microbial efficacy studies, where automation and time-resolved measurements are critical [55,96,98]. Capturing these temporal responses enabled a deeper understanding of SynCom performance under both optimal and stress conditions [102]. While HTP imaging proved valuable for monitoring shoot development, several limitations warrant consideration. Root traits were not captured, and pixel-based biomass estimates can be influenced by variability in plant architecture or image noise. However, potential confounding effects due to uneven lighting conditions were minimised through randomised layout of plants in the PPV glasshouse; replicates from each treatment were spatially distributed rather than grouped together, thereby reducing potential bias. Nevertheless, the clear and reproducible trends observed suggest that HTP platforms remain highly useful when complemented with conventional measurements and well-defined experimental controls.
5. Conclusions
This study advances a new paradigm for SynCom design—one that prioritises ecological relevance over trait-based assembly. By constructing SynComs exclusively from seed-associated microbes of Medicago CWRs, and selecting strains with high genomic similarity to core taxa in lucerne, we demonstrate that evolutionary aligned, ecologically co-occurring microbial consortia can modulate early plant growth and restructure the host microbiome. Rather than acting solely as biofertilisers, these SynComs functioned as ecological filters, selectively shaping microbial communities in ways that aligned with early-stage phenotypic responses.
Importantly, our findings challenge the assumption that greater microbial diversity inherently leads to better plant outcomes [103]. Instead, we show that SynComs with lower taxonomic richness, but stronger ecological coherence can deliver more consistent effects. These results reposition SynComs not as additive tools, but as targeted interventions that engage selectively with host microbiomes during critical developmental windows. The integration of conventional phenotyping, HTP imaging, and early microbiome profiling enabled a high-resolution, time-resolved view of SynCom efficacy. While no statistically significant improvements were observed under drought conditions, consistent microbiome modulation across treatments and time points supports the value of assessing SynCom performance through ecological and community level metrics—not just biomass. Although the study was limited by sequencing at a single time point and modest replication at later stages, the reproducibility of SynCom-driven trends validates the experimental framework. Future work should explore longitudinal microbiome profiling to track SynCom persistence, and apply strain-resolved methods such as metagenomics, qPCR tagging, or transcriptomics to unravel the mechanistic basis of microbe–host interactions. Expanding trials across diverse Medicago genotypes and field environments will be essential to test scalability and robustness. Moreover, refining seed-coating and delivery platforms will support translational deployment under real-world conditions.
More broadly, this work lays a conceptual and methodological foundation for next-generation SynCom design—one that leverages ecological co-occurrence, evolutionary compatibility, and host–microbiome continuity to guide targeted microbiome interventions in agriculture. It highlights the untapped potential of CWRs not only as genetic resources, but as microbial reservoirs that can inform the development of scalable, seed-based solutions for sustainable crop production. In the face of climate variability, declining soil health, and rising input costs, microbiome-informed strategies such as these offer a timely and resilient path forward—supporting input reduction, stress tolerance, and productivity in forage systems and beyond. By bridging ecological insight with practical SynCom deployment, this study helps inform the development of microbial tools for more sustainable agriculture.
Supplementary Materials
The following supporting information can be downloaded at: https://www.mdpi.com/article/doi/, Table S1: Constituent bacterial isolates of the synthetic communities (SynComs) designed in the study; Table S2: Summary of 16S rRNA gene sequencing and rarefaction results for samples collected at 24 days after planting (DAP) in the glasshouse (Bundoora, Victoria, Australia); Table S3: Amplicon sequence variants (ASVs) shared across all SynCom treatments and Control groups based on 16S rRNA gene profiling at 24 days after planting (DAP); Table S4: Amplicon sequence variants (ASVs) shared across all SynCom-treated groups based on 16S rRNA gene profiling at 24 days after planting (DAP); Table S5: Amplicon sequence variants (ASVs) uniquely detected in SynCom-treated groups based on 16S rRNA gene profiling at 24 days after planting (DAP); Table S6: Order-level indicator taxa and their relative abundance (%) in SynCom-treated and Control plants at 24 DAP; Table S7: Descriptive statistics summary of root and shoot measurements across treatment groups at 24 DAP; Table S8: Descriptive statistics summary of aerial biomass at 63 DAP across treatment groups and watering conditions; Table S9: Descriptive statistics (means ± SD) of growth parameters at 76 DAP under post-stress recovery conditions for different treatment groups and watering conditions; Table S10: Mean adjusted pixel counts (digital volume) across treatments under both well-watered (WW) and drought (DRT) conditions at 17 time points, measured using the LemnaTec 3D Scanalyser at the Plant Phenomics Victoria (PPV) facility. Figure S1: Validation of image-derived biomass estimates against conventional biomass measurements at 63 DAP. Bar plot showing individual-level comparisons of adjusted pixel values and wet biomass for lucerne plants under different SynCom treatments and watering regimes. Each bar represents a single biological replicate (n = 5 per treatment), with values grouped by treatment and condition (well-watered and drought). Adjusted pixel values were derived from LemnaTec Scanalyser 3D imaging, and wet biomass was recorded via destructive phenotyping. Data were collected at the PPV facility; Figure S2. Root and shoot growth responses of lucerne seedlings at 76 DAP under different SynCom treatments. (A) Root length, (B) root biomass, (C) shoot length, and (D) shoot biomass was measured in plants treated with Control and SynCom treatments: Laciniata, Littoralis, and Mix. Bars represent mean ± standard error (SE). Measurements indicate post-stress recovery dynamics following different SynCom inoculations; Figure S3. Fold change analysis of plant growth across developmental stages. (A) Root and shoot length fold changes from 24 DAP and 76 DAP across Control, Laciniata, Littoralis, and Mix treatments. Fold changes were calculated as the ration of mean measurements at 76 DAP relative to 24 DAP. (B) Fold changes in wet aerial biomass between 63 DAP to 76 DAP across treatments. Bars represent mean fold change values; Section S1: The composition of the standard potting mix used in glasshouse and plant phenomics studies; Section S2: Soil gravimetric water content (SGWC) determination and drought application; Section S3: DNA extraction, 16S rRNA amplicon library preparation and sequencing; Section S4: Evaluating the effects of SynCom treatments on plant growth and biomass at 76 DAP under post-stress recovery conditions; Section S5: Comparison of growth parameters across time-points.
Author Contributions
SH conducted all laboratory and in planta experiments. SH was also responsible for 16S rRNA gene sequencing, data curation, formal analysis, project administration and preparation of the manuscript. The study was conceptualised by TS. The experimental design was jointly developed by SH, JK, TL, and TS. JK and TL assisted SH with the setup of HTP in planta assays and tissue harvesting. AD provided scientific and technical guidance for the HTP assay, developed the analysis algorithms, supplied the raw HTP data, and drafted the HTP image analysis Methods section. TS performed initial HTP data analysis. TS and JK supervised the overall study. All authors contributed to the critical revision of the manuscript. All authors have read and agreed to the published version of the manuscript.
Funding
This research was funded through the DairyBio21–26 Future Forages Program (Project: DB F.2 – Genomic Selection of Alfalfa & Lucerne), a joint initiative of Dairy Australia Limited, the Geoffrey Gardiner Dairy Foundation Limited, and Agriculture Victoria Research through the Department of Energy, Environment and Climate Action (DEECA). SH received La Trobe University Full-Fee Research Scholarship, La Trobe University Postgraduate Research Scholarship, and DairyBio Scholarship.
Institutional Review Board Statement
Not applicable.
Informed Consent Statement
Not applicable.
Data Availability Statement
The full-length 16S rRNA gene sequences of the constituent bacterial strains used in the synthetic communities (SynComs) have been deposited in the NCBI GenBank under the BioProject PRJNA1180717.
Acknowledgments
The authors wish to thank Emily L Thoday-Kennedy who maintained the lucerne plants for high-throughput phenotyping experiment on the LemnaTec Scanalyser 3D platform at Plant Phenomics Victoria.
Conflicts of Interest
The authors declare no conflicts of interest. The funders had no role in the design of the study; in the collection, analyses, or interpretation of data; in the writing of the manuscript; or in the decision to publish the results.
Abbreviations
The following abbreviations are used in this manuscript:
| 16S rRNA | 16S ribosomal ribonucleic acid |
| ANI | Average nucleotide identity |
| ANOVA | Analysis of variance |
| ANPR | Allorhizobium–Neorhizobium–Pararhizobium–Rhizobium |
| ASV | Amplicon sequence variant |
| CWRs | Crop wild relatives |
| DAP | Days after planting |
| DNA | Deoxyribonucleic acid |
| GA | Gibberellins |
| HTP | High-throughput phenotyping |
| IAA | Indole-3-acetic acid |
| LA | Laciniata SynCom (three-strain SynCom from M. laciniata) |
| LT | Littoralis SynCom (three-strain SynCom from M. littoralis) |
| Mix | Mix SynCom (six-strain SynCom combining LA and LT) |
| NB | Nutrient broth |
| NCBI | National Centre for Biotechnology Information |
| PPV | Plant Phenomics Victoria |
| QIIME2 | Quantitative Insights Into Microbial Ecology 2 |
| SGWC | Soil gravimetric water content |
| SynComs | Synthetic communities |
References
- Agler, M.T.; Ruhe, J.; Kroll, S.; Morhenn, C.; Kim, S.-T.; Weigel, D.; Kemen, E.M. Microbial hub taxa link host and abiotic factors to plant microbiome variation. PLoS Biol. 2016, 14, e1002352. [Google Scholar] [CrossRef] [PubMed]
- Rolli, E.; Marasco, R.; Vigani, G.; Ettoumi, B.; Mapelli, F.; Deangelis, M.L.; Gandolfi, C.; Casati, E.; Previtali, F.; Gerbino, R.; et al. Improved plant resistance to drought is promoted by the root-associated microbiome as a water stress-dependent trait. Environ. Microbiol. 2015, 17, 316–331. [Google Scholar] [CrossRef] [PubMed]
- Buée, M.; De Boer, W.; Martin, F.; van Overbeek, L.; Jurkevitch, E. The rhizosphere zoo: An overview of plant-associated communities of microorganisms, including phages, bacteria, archaea, and fungi, and of some of their structuring factors. Plant Soil 2009, 321, 189–212. [Google Scholar] [CrossRef]
- Rodríguez, C.E.; Antonielli, L.; Mitter, B.; Trognitz, F.; Sessitsch, A. Heritability and functional importance of the Setaria viridis bacterial seed microbiome. Phytobiomes J. 2020, 4, 40–52. [Google Scholar] [CrossRef]
- Pal, G.; Kumar, K.; Verma, A.; Verma, S.K. Seed inhabiting bacterial endophytes of maize promote seedling establishment and provide protection against fungal disease. Microbiol. Res. 2022, 255, 126926. [Google Scholar] [CrossRef]
- Shade, A.; Jacques, M.-A.; Barret, M. Ecological patterns of seed microbiome diversity, transmission, and assembly. Curr. Opin. Microbiol. 2017, 37, 15–22. [Google Scholar] [CrossRef]
- Johnston-Monje, D.; Raizada, M.N. Conservation and diversity of seed associated endophytes in Zea across boundaries of evolution, ethnography and ecology. PLOS ONE 2011, 6, e20396. [Google Scholar] [CrossRef]
- Tariq, A.; Guo, S.; Farhat, F.; Shen, X. Engineering synthetic microbial communities: Diversity and applications in soil for plant resilience. Agronomy 2025, 15, 513. [Google Scholar] [CrossRef]
- Khan, S.T. Consortia-based microbial inoculants for sustaining agricultural activities. Appl. Soil Ecol. 2022, 176, 104503. [Google Scholar] [CrossRef]
- de Souza, R.S.C.; Armanhi, J.S.L.; Arruda, P. From microbiome to traits: Designing synthetic microbial communities for improved crop resiliency. Front. Plant Sci. 2020, 11, 1179. [Google Scholar] [CrossRef]
- Kaur, S.; Egidi, E.; Qiu, Z.; Macdonald, C.A.; Verma, J.P.; Trivedi, P.; Wang, J.; Liu, H.; Singh, B.K. Synthetic community improves crop performance and alters rhizosphere microbial communities. J. Sustain. Agric. Environ. 2022, 1, 118–131. [Google Scholar] [CrossRef]
- Cheng, Q.; Sun, S.; Ning, X.; Qiao, M.; Chen, W.; Zhang, P.; Liu, K.; Ding, Y. A synergistic indole-3-acetic acid-producing synthetic bacterial consortium benefits walnut seedling growth. Agronomy 2024, 14, 1657. [Google Scholar] [CrossRef]
- Qi, M.; Berry, J.C.; Veley, K.W.; O’Connor, L.; Finkel, O.M.; Salas-González, I.; Kuhs, M.; Jupe, J.; Holcomb, E.; Glavina del Rio, T.; et al. Identification of beneficial and detrimental bacteria impacting sorghum responses to drought using multi-scale and multi-system microbiome comparisons. ISME J. 2022, 16, 1957–1969. [Google Scholar] [CrossRef] [PubMed]
- Simonin, M.; Préveaux, A.; Marais, C.; Garin, T.; Arnault, G.; Sarniguet, A.; Barret, M. Transmission of synthetic seed bacterial communities to radish seedlings: Impact on microbiota assembly and plant phenotype. Peer Community J. 2023, 3, 329. [Google Scholar] [CrossRef]
- Flores-Duarte, N.J.; Navarro-Torre, S.; Mateos-Naranjo, E.; Redondo-Gómez, S.; Pajuelo, E.; Rodríguez-Llorente, I.D. Nodule synthetic bacterial community as legume biofertilizer under abiotic stress in estuarine soils. Plants 2023, 12, 2083. [Google Scholar] [CrossRef]
- Kulkarni, K.P.; Tayade, R.; Asekova, S.; Song, J.T.; Shannon, J.G.; Lee, J.-D. Harnessing the potential of forage legumes, alfalfa, soybean, and cowpea for sustainable agriculture and global food security. Front. Plant Sci. 2018, 9, 1314. [Google Scholar] [CrossRef]
- Lei, Y.; Hannoufa, A.; Yu, P. The use of gene modification and advanced molecular structure analyses towards improving alfalfa forage. Int. J. Mol. Sci. 2017, 18, 298. [Google Scholar] [CrossRef]
- Wigley, K.; Moot, D.; Wakelin, S.A.; Laugraud, A.; Blond, C.; Seth, K.; Ridgway, H. Diverse bacterial taxa inhabit root nodules of lucerne (Medicago sativa L.) in New Zealand pastoral soils. Plant Soil 2017, 420, 253–262. [Google Scholar] [CrossRef]
- Le, X.H.; Franco, C.M.M.; Ballard, R.A.; Drew, E.A. Isolation and characterisation of endophytic actinobacteria and their effect on the early growth and nodulation of lucerne (Medicago sativa L.). Plant Soil 2016, 405, 13–24. [Google Scholar] [CrossRef]
- Herath Dissanayakalage, S.S.; Kaur, J.; Achari, S.R.; Sawbridge, T.I. Identification of in planta bioprotectants against Fusarium wilt in Medicago sativa L. (lucerne) from a collection of bacterial isolates derived from Medicago seeds. Front. Microbiol. 2025, 16, 1544521. [Google Scholar] [CrossRef]
- Herath Dissanayakalage, S.S.; Kaur, J.; Sawbridge, T.I. Genotype-driven shifts in the Medicago seed microbiome reveal diversity loss during domestication from wild relatives to lucerne (Medicago sativa). 2025.
- Yousfi, N.; Sihem, N.; Ramzi, A.; Abdelly, C. Growth, photosynthesis and water relations as affected by different drought regimes and subsequent recovery in Medicago laciniata (L.) populations. J. Plant Biol. 2016, 59, 33–43. [Google Scholar] [CrossRef]
- Badri, M.; Arraouadi, S.; Huguet, T.; Aouani, M. Comparative effects of water deficit on Medicago laciniata and Medicago truncatula lines sampled from sympatric populations. J. Plant Breed. Crop Sci. 2010, 2, 259–266. [Google Scholar]
- Friesen, M.L.; von Wettberg, E.J.B.; Badri, M.; Moriuchi, K.S.; Barhoumi, F.; Chang, P.L.; Cuellar-Ortiz, S.; Cordeiro, M.A.; Vu, W.T.; Arraouadi, S.; et al. The ecological genomic basis of salinity adaptation in Tunisian Medicago truncatula. BMC Genomics 2014, 15, 1160. [Google Scholar] [CrossRef] [PubMed]
- Gehan, M.A.; Fahlgren, N.; Abbasi, A.; Berry, J.C.; Callen, S.T.; Chavez, L.; Doust, A.N.; Feldman, M.J.; Gilbert, K.B.; Hodge, J.G.; et al. PlantCV v2: Image analysis software for high-throughput plant phenotyping. PeerJ 2017, 5, e4088. [Google Scholar] [CrossRef]
- Klukas, C.; Chen, D.; Pape, J.-M. Integrated analysis platform: An open-source information system for high-throughput plant phenotyping. Plant Physiol. 2014, 165, 506–518. [Google Scholar] [CrossRef]
- Wickham, H.; Vaughan, D.; Girlich, M. tidyr: Tidy Messy Data, Version 1.3.1. (accessed on 30 May 2025).
- Fox, J.; Weisberg, S. The car Package: Companion to Applied Regression, Version 3.1-3. Available online: https://cran.r-project.org/web/packages/car/car.pdf (accessed on 30 May 2025).
- Ogle, D.H.; Doll, J.C.; Wheeler, A.P.; Dinno, A. FSA: Simple Fisheries Stock Assessment Methods, Version 0.10.0. Available online: https://cran.r-project.org/web/packages/FSA/FSA.pdf (accessed on 30 May 2025).
- Graves, S.; Piepho, H.-P.; Selzer, M.L. multcompView: Visualizations of Paired Comparisons, Version 0.1-10. Available online: https://cran.r-project.org/web/packages/multcompView/multcompView.pdf (accessed on 30 May 2025).
- Hanusz, Z.; Tarasinska, J.; Zielinski, W. Shapiro–Wilk test with known mean. REVSTAT Stat. J. 2016, 14, 89–100. [Google Scholar] [CrossRef]
- Yap, B.W.; Sim, C.H. Comparisons of various types of normality tests. J. Stat. Comput. Simul. 2011, 81, 2141–2155. [Google Scholar] [CrossRef]
- Gastwirth, J.L.; Gel, Y.R.; Miao, W. The impact of Levene’s test of equality of variances on statistical theory and practice. Stat. Sci. 2009, 24, 343–360. [Google Scholar] [CrossRef]
- Ståhle, L.; Wold, S. Analysis of variance (ANOVA). Chemom. Intell. Lab. Syst. 1989, 6, 259–272. [Google Scholar] [CrossRef]
- Abdi, H.; Williams, L.J. Tukey’s honestly significant difference (HSD) test. In Encyclopedia of research design; Salkind, N., Ed.; Sage: Thousand Oaks, CA, USA, 2010; Volume 3, pp. 1–5. [Google Scholar]
- Kumar-M, P.; Mishra, A. Inferential statistics for the hypothesis testing of non-parametric data. In R for Basic Biostatistics in Medical Research; Srinivasan, A., Mishra, A., Kumar-M, P., Eds.; Springer Nature Singapore, Singapore, 2024; pp. 157–197.
- Yarberry, W. DPLYR. In CRAN Recipes: DPLYR. In CRAN Recipes: DPLYR; Stringr, Lubridate, and RegEx in R, Ed.; Apress: Berkeley, CA, USA, 2021; pp. 1–58. [Google Scholar]
- Wickham, H. ggplot2. WIREs Comput. Stat. 2011, 3, 180–185. [Google Scholar] [CrossRef]
- Zhang, J.; Kobert, K.; Flouri, T.; Stamatakis, A. PEAR: a fast and accurate Illumina Paired-End reAd mergeR. Bioinformatics 2013, 30, 614–620. [Google Scholar] [CrossRef]
- Bolyen, E.; Rideout, J.R.; Dillon, M.R.; Bokulich, N.A.; Abnet, C.C.; Al-Ghalith, G.A.; Alexander, H.; Alm, E.J.; Arumugam, M.; Asnicar, F.; et al. Reproducible, interactive, scalable and extensible microbiome data science using QIIME 2. Nat. Biotechnol. 2019, 37, 852–857. [Google Scholar] [CrossRef]
- Bokulich, N.A.; Kaehler, B.D.; Rideout, J.R.; Dillon, M.; Bolyen, E.; Knight, R.; Huttley, G.A.; Gregory Caporaso, J. Optimizing taxonomic classification of marker-gene amplicon sequences with QIIME 2’s q2-feature-classifier plugin. Microbiome 2018, 6, 90. [Google Scholar] [CrossRef]
- McMurdie, P.J.; Holmes, S. phyloseq: An R package for reproducible interactive analysis and graphics of microbiome census data. PLoS One 2013, 8, e61217. [Google Scholar] [CrossRef]
- Lahti, L.; Shetty, S. Tools for microbiome analysis in R. Microbiome package version 2017.
- Dixon, P. VEGAN, a package of R functions for community ecology. J. Veg. Sci. 2003, 14, 927–930. [Google Scholar] [CrossRef]
- Cáceres, M.D.; Legendre, P. Associations between species and groups of sites: Indices and statistical inference. Ecology 2009, 90, 3566–3574. [Google Scholar] [CrossRef] [PubMed]
- De Cáceres, M.; Legendre, P.; Moretti, M. Improving indicator species analysis by combining groups of sites. Oikos 2010, 119, 1674–1684. [Google Scholar] [CrossRef]
- Willis, A.D. Rarefaction, alpha diversity, and statistics. Front. Microbiol. 2019, 10, 2407. [Google Scholar] [CrossRef]
- Foster, Z.S.L.; Sharpton, T.J.; Grünwald, N.J. Metacoder: An R package for visualization and manipulation of community taxonomic diversity data. PLoS Comput. Biol. 2017, 13, e1005404. [Google Scholar] [CrossRef]
- Coleman, A.; Bose, A.; Mitra, S. Metagenomics data visualization using R. In Metagenomic Data Analysis; Mitra, S., Ed.; Springer US: New York, NY, USA, 2023; pp. 359–392. [Google Scholar]
- Chen, H.; Boutros, P.C. VennDiagram: A package for the generation of highly-customizable Venn and Euler diagrams in R. BMC Bioinformatics 2011, 12, 35. [Google Scholar] [CrossRef]
- Fahlgren, N.; Gehan, M.A.; Baxter, I. Lights, camera, action: High-throughput plant phenotyping is ready for a close-up. Curr. Opin. Plant Biol. 2015, 24, 93–99. [Google Scholar] [CrossRef] [PubMed]
- Figueiredo dos Santos, L.; Fernandes Souta, J.; de Paula Soares, C.; Oliveira da Rocha, L.; Luiza Carvalho Santos, M.; Grativol, C.; Fernando Wurdig Roesch, L.; Lopes Olivares, F. Insights into the structure and role of seed-borne bacteriome during maize germination. FEMS Microbiol. Ecol. 2021, 97, fiab024. [Google Scholar] [CrossRef] [PubMed]
- Wang, C.; Li, Y.; Li, M.; Zhang, K.; Ma, W.; Zheng, L.; Xu, H.; Cui, B.; Liu, R.; Yang, Y.; et al. Functional assembly of root-associated microbial consortia improves nutrient efficiency and yield in soybean. J. Integr. Plant Biol. 2021, 63, 1021–1035. [Google Scholar] [CrossRef] [PubMed]
- Chai, Y.N.; Ge, Y.; Stoerger, V.; Schachtman, D.P. High-resolution phenotyping of sorghum genotypic and phenotypic responses to low nitrogen and synthetic microbial communities. Plant Cell Environ. 2021, 44, 1611–1626. [Google Scholar] [CrossRef]
- Yassue, R.M.; Galli, G.; Borsato Jr., R.; Cheng, H.; Morota, G.; Fritsche-Neto, R. A low-cost greenhouse-based high-throughput phenotyping platform for genetic studies: A case study in maize under inoculation with plant growth-promoting bacteria. Plant Phenom. J. 2022, 5, e20043. [Google Scholar] [CrossRef]
- Rostamikia, Y.; Kouchaksaraei, M.T.; Asgharzadeh, A.; Rahmani, A. Effect of plant growth promoting rhizobacteria (PGPR) and cold stratification on seed germination and early growth of Corylus avellana L. Austrian J. For. Sci. 2016, 4, 337–352. [Google Scholar]
- Garcia-Lemos, A.M.; Großkinsky, D.K.; Saleem Akhtar, S.; Nicolaisen, M.H.; Roitsch, T.; Nybroe, O.; Veierskov, B. Identification of root-associated bacteria that influence plant physiology, increase seed germination, or promote growth of the christmas tree species Abies nordmanniana. Front. Microbiol. 2020, 11, 566613. [Google Scholar] [CrossRef]
- Ravindran, P.; Kumar, P.P. Regulation of seed germination: The involvement of multiple forces exerted via gibberellic acid signaling. Mol. Plant 2019, 12, 24–26. [Google Scholar] [CrossRef]
- Xie, J.; Li, Y.; Jiang, G.; Sun, H.; Liu, X.; Han, L. Seed color represents salt resistance of alfalfa seeds (Medicago sativa L.): Based on the analysis of germination characteristics, seedling growth and seed traits. Front. Plant Sci. 2023, 14, 1104948. [Google Scholar] [CrossRef]
- Liu, H.; Qiu, Z.; Ye, J.; Verma, J.P.; Li, J.; Singh, B.K. Effective colonisation by a bacterial synthetic community promotes plant growth and alters soil microbial community. J. Sustain. Agric. Environ. 2022, 1, 30–42. [Google Scholar] [CrossRef]
- Chaparro, J.M.; Badri, D.V.; Vivanco, J.M. Rhizosphere microbiome assemblage is affected by plant development. ISME J. 2013, 8, 790–803. [Google Scholar] [CrossRef] [PubMed]
- Arnault, G.; Marais, C.; Préveaux, A.; Briand, M.; Poisson, A.-S.; Sarniguet, A.; Barret, M.; Simonin, M. Seedling microbiota engineering using bacterial synthetic community inoculation on seeds. FEMS Microbiol. Ecol. 2024, 100. [Google Scholar] [CrossRef] [PubMed]
- Marín, O.; González, B.; Poupin, M.J. From microbial dynamics to functionality in the rhizosphere: A systematic review of the opportunities with synthetic microbial communities. Front. Plant Sci. 2021, 12. [Google Scholar] [CrossRef]
- Bakker, J.D. Increasing the utility of indicator species analysis. J. Appl. Ecol. 2008, 45, 1829–1835. [Google Scholar] [CrossRef]
- Tran, V.C.; Nguyen, T.H.; Hoang, T.L.A.; Pham, T.T.M.; Nguyen, T.M.; Tran, T.D.; Nguyen, T.H.G.; Han, V.-C.; Tran, A.T.; La, V.H. Harnessing synthetic microbial communities with nitrogen-fixing activity to promote rice growth. Open Agric. 2024, 9, 20220392. [Google Scholar] [CrossRef]
- Li, Y.; Li, R.; Liu, R.; Shi, J.; Qiu, X.; Lei, J.; Zhao, X.; Wang, C.; Ge, M.; Xu, H.; et al. A simplified SynCom based on core–helper strain interactions enhances symbiotic nitrogen fixation in soybean. J. Integr. Plant Biol. 2025, 1–17. [Google Scholar] [CrossRef]
- Compant, S.; Samad, A.; Faist, H.; Sessitsch, A. A review on the plant microbiome: Ecology, functions, and emerging trends in microbial application. J. Adv. Res. 2019, 19, 29–37. [Google Scholar] [CrossRef]
- Pfeiffer, S.; Mitter, B.; Oswald, A.; Schloter-Hai, B.; Schloter, M.; Declerck, S.; Sessitsch, A. Rhizosphere microbiomes of potato cultivated in the High Andes show stable and dynamic core microbiomes with different responses to plant development. FEMS Microbiol. Ecol. 2016, 93, fiw242. [Google Scholar] [CrossRef]
- Abbasi, S.; Spor, A.; Sadeghi, A.; Safaie, N. Streptomyces strains modulate dynamics of soil bacterial communities and their efficacy in disease suppression caused by Phytophthora capsici. Sci. Rep. 2021, 11, 9317. [Google Scholar] [CrossRef]
- Schlatter, D.C.; Yin, C.; Hulbert, S.; Paulitz, T.C. Core rhizosphere microbiomes of dryland wheat are influenced by location and land use history. Appl. Environ. Microbiol. 2020, 86, e02135–02119. [Google Scholar] [CrossRef] [PubMed]
- Huang, X.; Zhou, W.; Zhang, Y.; Yang, Q.; Yang, B.; Liang, T.; Ling, J.; Dong, J. Keystone PGPR ecological effect: An inoculation case study of diazotrophic Novosphingobium sp. N034 on mangrove plant Kandelia obovate. Appl. Soil Ecol. 2024, 202, 105567. [Google Scholar] [CrossRef]
- Kolton, M.; Erlacher, A.; Berg, G.; Cytryn, E. The Flavobacterium genus in the plant holobiont: Ecological, physiological, and applicative insights. In Microbial Models: From Environmental to Industrial Sustainability; Castro-Sowinski, S., Ed.; Springer Singapore: Singapore, Singapore, 2016; pp. 189–207. [Google Scholar]
- Bashan, Y.; de-Bashan, L.E. Chapter two - How the plant growth-promoting bacterium Azospirillum promotes plant growth—A critical assessment. In Advances in Agronomy; Sparks, D.L., Ed.; Academic Press: San Diego, CA, USA, 2010; Volume 108, pp. 77–136. [Google Scholar]
- Asaf, S.; Numan, M.; Khan, A.L.; Al-Harrasi, A. Sphingomonas: From diversity and genomics to functional role in environmental remediation and plant growth. Crit. Rev. Biotechnol. 2020, 40, 138–152. [Google Scholar] [CrossRef] [PubMed]
- Pal, G.; Saxena, S.; Kumar, K.; Verma, A.; Sahu, P.K.; Pandey, A.; White, J.F.; Verma, S.K. Endophytic Burkholderia: Multifunctional roles in plant growth promotion and stress tolerance. Microbiol. Res. 2022, 265, 127201. [Google Scholar] [CrossRef]
- Hao, X.; Wang, X.; Chen, C.; Liu, R.; Yin, Y.; Yao, J.; Xiao, Z.; Liu, X.; Shen, X.; Liu, X. Synthetic bacterial communities reshape microbial communities and enhance nutrient supply in desertified land of Northwest China. Appl. Soil Ecol. 2023, 189, 104972. [Google Scholar] [CrossRef]
- Molina, L.; Udaondo, Z.; Montero-Curiel, M.; Wittich, R.-M.; García-Puente, A.; Segura, A. Clover root exudates favor Novosphingobium sp. HR1a establishment in the rhizosphere and promote phenanthrene rhizoremediation. mSphere 2021, 6, 00412–00421. [Google Scholar] [CrossRef]
- Wang, Y.-w.; Bai, D.-s.; Yang, X.; Zhang, Y.; Luo, X.-g. Soil sulfur cycle bacteria and metabolites affected by soil depth and afforestation conditions in high-sulfur coal mining areas. Appl. Soil Ecol. 2023, 185, 104802. [Google Scholar] [CrossRef]
- Jurkevitch, E.; Minz, D.; Ramati, B.; Barel, G. Prey range characterization, ribotyping, and diversity of soil and rhizosphere Bdellovibrio spp. isolated on phytopathogenic bacteria. Appl. Environ. Microbiol. 2000, 66, 2365–2371. [Google Scholar] [CrossRef]
- Liu, J.; He, X.; Sun, J.; Ma, Y. A degeneration gradient of poplar trees contributes to the taxonomic, functional, and resistome diversity of bacterial communities in rhizosphere soils. Int. J. Mol. Sci. 2021, 22, 3438. [Google Scholar] [CrossRef]
- Ikeda, S.; Okazaki, K.; Takahashi, H.; Tsurumaru, H.; Minamisawa, K. Seasonal shifts in bacterial community structures in the lateral root of sugar beet grown in an andosol field in Japan. Microbes Environ. 2023, 38, ME22071. [Google Scholar] [CrossRef]
- Kim, H.S.; Kim, J.-S.; Suh, M.K.; Eom, M.K.; Lee, J.; Lee, J.-S. A novel plant growth-promoting rhizobacterium, Rhizosphaericola mali gen. nov., sp. nov., isolated from healthy apple tree soil. Sci. Rep. 2024, 14, 1038. [Google Scholar] [CrossRef]
- Sun, C.; Xiao, J.; Bai, L.; Bai, J.; Liu, J.; Geng, L.; Zhang, Y. Defined and natural PAH contaminations shift PAH-degrading bacterial community in rhizosphere of ornamental plant species Echinacea purpurea L. Environ. Technol. Innov. 2023, 31, 103189. [Google Scholar] [CrossRef]
- Schmitz, L.; Yan, Z.; Schneijderberg, M.; de Roij, M.; Pijnenburg, R.; Zheng, Q.; Franken, C.; Dechesne, A.; Trindade, L.M.; van Velzen, R.; et al. Synthetic bacterial community derived from a desert rhizosphere confers salt stress resilience to tomato in the presence of a soil microbiome. ISME J. 2022, 16, 1907–1920. [Google Scholar] [CrossRef] [PubMed]
- Mažylytė, R.; Kailiuvienė, J.; Mažonienė, E.; Orola, L.; Kaziūnienė, J.; Mažylytė, K.; Lastauskienė, E.; Gegeckas, A. The co-inoculation effect on Triticum aestivum growth with synthetic microbial communities (SynComs) and their potential in agrobiotechnology. Plants 2024, 13, 1716. [Google Scholar] [CrossRef] [PubMed]
- Bano, Q.; Ilyas, N.; Bano, A.; Zafar, N.; Akram, A.; Hassan, F. Effect of Azospirillum inoculation on maize (Zea mays L.) under drought stress. Pak J Bot.
- Arzanesh, M.H.; Alikhani, H.A.; Khavazi, K.; Rahimian, H.A.; Miransari, M. Wheat (Triticum aestivum L.) growth enhancement by Azospirillum sp. under drought stress. World J. Microbiol. Biotechnol. 2011, 27, 197–205. [Google Scholar] [CrossRef]
- Kasim, W.A.; Osman, M.E.H.; Omar, M.N.; Salama, S. Enhancement of drought tolerance in Triticum aestivum L. seedlings using Azospirillum brasilense NO40 and Stenotrophomonas maltophilia B11. Bull. Natl. Res. Cent. 2021, 45, 95. [Google Scholar] [CrossRef]
- Jha, Y.; Subramanian, R.B. Plant microbiome: Stress response. In Interaction to Gene Induction: An Ecofriendly Mechanism of PGPR-mediated Stress Management in the Plant; Egamberdieva, D., Ahmad, P., Eds.; Springer: Singapore, 2018; pp. 217–232. [Google Scholar]
- Liu, Q.; Zhao, X.; Liu, Y.; Xie, S.; Xing, Y.; Dao, J.; Wei, B.; Peng, Y.; Duan, W.; Wang, Z. Response of sugarcane rhizosphere bacterial community to drought stress. Front. Microbiol. 2021, 12, 716196. [Google Scholar] [CrossRef]
- Šic Žlabur, J.; Radman, S.; Fabek Uher, S.; Opačić, N.; Benko, B.; Galić, A.; Samirić, P.; Voća, S. Plant response to mechanically-induced stress: A case study on specialized metabolites of leafy vegetables. Plants 2021, 10, 2650. [Google Scholar] [CrossRef]
- Yadav, A.; Chen, M.; Acharya, S.M.; Yang, Y.; Zhao, T.Z.; Chakraborty, R. A stable 15-member bacterial SynCom promotes Brachypodium growth under drought stress. bioRxiv 2024. [CrossRef]
- Pereg, L.; McMillan, M. Scoping the potential uses of beneficial microorganisms for increasing productivity in cotton cropping systems. Soil Biol. Biochem. 2015, 80, 349–358. [Google Scholar] [CrossRef]
- Berg, G.; Rybakova, D.; Grube, M.; Köberl, M. The plant microbiome explored: Implications for experimental botany. J. Exp. Bot. 2015, 67, 995–1002. [Google Scholar] [CrossRef]
- Jiang, X.; Yang, T.; Zhang, F.; Yang, X.; Yang, C.; He, F.; Long, R.; Gao, T.; Jiang, Y.; Yang, Q.; et al. RAD-seq-based high-density linkage maps construction and quantitative trait loci mapping of flowering time trait in alfalfa (Medicago sativa L.). Front. Plant Sci. 2022, 13, 899681. [Google Scholar] [CrossRef] [PubMed]
- Tardieu, F.; Cabrera-Bosquet, L.; Pridmore, T.; Bennett, M. Plant phenomics, from sensors to knowledge. Curr. Biol. 2017, 27, R770–R783. [Google Scholar] [CrossRef] [PubMed]
- Okada, M.; Barras, C.; Toda, Y.; Hamazaki, K.; Ohmori, Y.; Yamasaki, Y.; Takahashi, H.; Takanashi, H.; Tsuda, M.; Hirai, M.Y.; et al. High-throughput phenotyping of soybean biomass: Conventional trait estimation and novel latent feature extraction using UAV remote sensing and deep learning models. Plant Phenom. 2024, 6, 0244. [Google Scholar] [CrossRef] [PubMed]
- Yang, W.; Duan, L.; Chen, G.; Xiong, L.; Liu, Q. Plant phenomics and high-throughput phenotyping: Accelerating rice functional genomics using multidisciplinary technologies. Curr. Opin. Plant Biol. 2013, 16, 180–187. [Google Scholar] [CrossRef]
- Elangovan, A.; Duc, N.T.; Raju, D.; Kumar, S.; Singh, B.; Vishwakarma, C.; Gopala Krishnan, S.; Ellur, R.K.; Dalal, M.; Swain, P.; et al. Imaging sensor-based high-throughput measurement of biomass using machine learning models in rice. Agriculture 2023, 13, 852. [Google Scholar] [CrossRef]
- Klukas, C.; Chen, D.; Pape, J.-M. Integrated analysis platform: An open-source information system for high-throughput plant phenotyping. Plant Physiol. 2014, 165, 506–518. [Google Scholar] [CrossRef]
- Golzarian, M.R.; Frick, R.A.; Rajendran, K.; Berger, B.; Roy, S.; Tester, M.; Lun, D.S. Accurate inference of shoot biomass from high-throughput images of cereal plants. Plant Methods 2011, 7, 2. [Google Scholar] [CrossRef]
- LemnaTec. Advanced Plant Phenotyping. Available online: https://www.lemnatec.com/applications/advanced-plant-phenotyping/ (accessed on 18 March 2025).
- Delgado-Baquerizo, M.; Trivedi, P.; Trivedi, C.; Eldridge, D.J.; Reich, P.B.; Jeffries, T.C.; Singh, B.K. Microbial richness and composition independently drive soil multifunctionality. Funct. Ecol. 2017, 31, 2330–2343. [Google Scholar] [CrossRef]
Figure 1.
Schematic overview of the synthetic community (SynCom) experimental workflow. Bacterial isolates from Medicago crop wild relatives (CWRs) were cultured and pooled into SynComs based on optical density. Lucerne seeds were inoculated via seed imbibition and germinated for 7 days. A subset of seedlings (n = 10 seedlings per treatment) was retained in the glasshouse for early-stage phenotyping and microbiome analysis at 24 days after planting (DAP), while the remainder was transferred to the Plant Phenomics Victoria (PPV) facility and imaged under two watering regimes until 63 DAP. At 63 DAP, subsets were harvested for biomass measurement or returned to the glasshouse for recovery. Late-stage growth and microbiome analysis were conducted at 76 DAP. Microbiome profiling was based on 16S rRNA sequencing and analysed using QIIME2 and R. Icons adapted from BioRender.com; figure assembled in Microsoft PowerPoint.
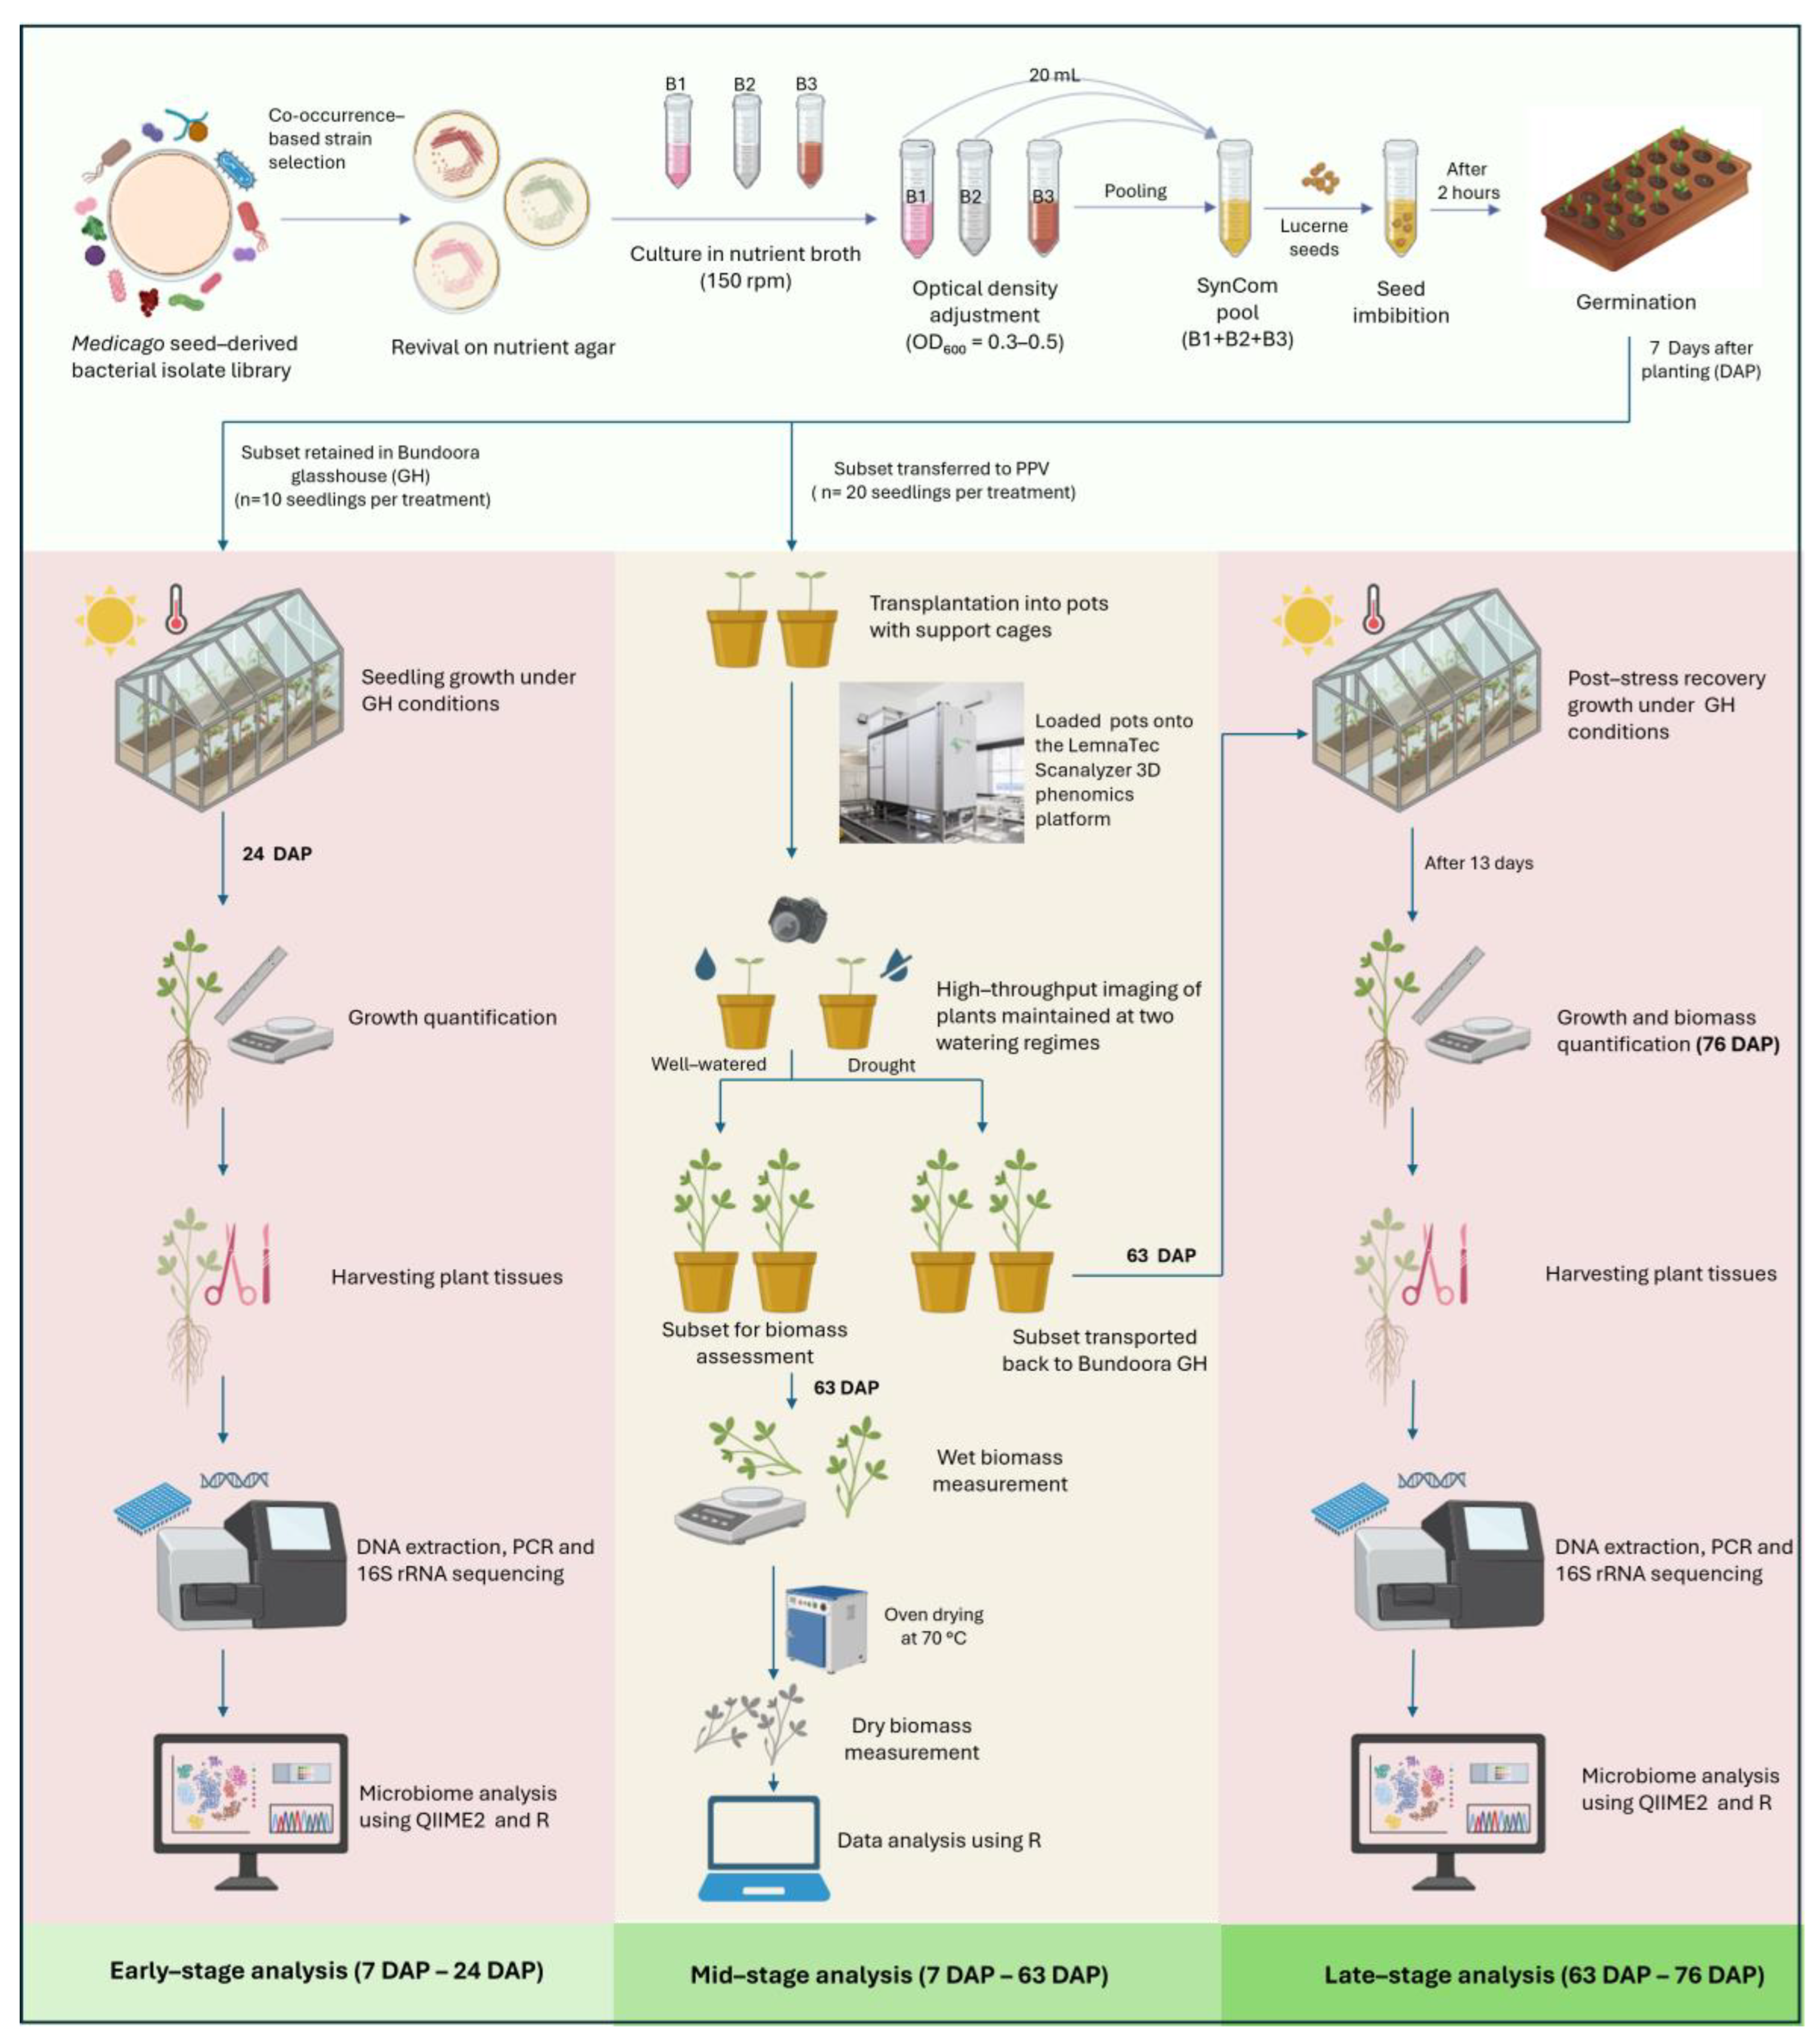
Figure 2.
(A) Seed germination of lucerne cultivar ‘Aurora’ in 100-cell trays at 7 DAP in the glasshouse at Bundoora, Victoria, Australia. (B) A typical RGB (Red–Green–Blue) image of a lucerne plant captured by LemnaTec Scanalyser 3D high-throughput phenotyping platform at PPV, Horsham, Victoria, Australia. (C) Plants growing in the PPV facility at 41 DAP under defined watering regimes. (D) Representative plants at 63 DAP, immediately prior to harvesting for destructive biomass measurements. Each treatment group consisted of 20 replicates, evenly divided between two watering conditions: 10 replicates were maintained under well-watered conditions (80% soil gravimetric water content, SGWC), while the remaining 10 were subjected to drought conditions.

Figure 3.
Alpha diversity of microbial communities associated with lucerne plant tissue samples at 24 DAP under different SynCom treatments. Boxplots show (A) Observed ASVs, (B) Chao1 richness, (C) Shannon diversity index, and (D) Simpson index for four treatment groups: Control, Laciniata, Littoralis, and Mix. Diversity metrics were calculated from rarefied amplicon sequence variants (ASV) tables. Boxes represent interquartile range (IQR), with the horizontal line indicating median; whiskers extend to 1.5 × IQR. Individual points represent potential outliers.
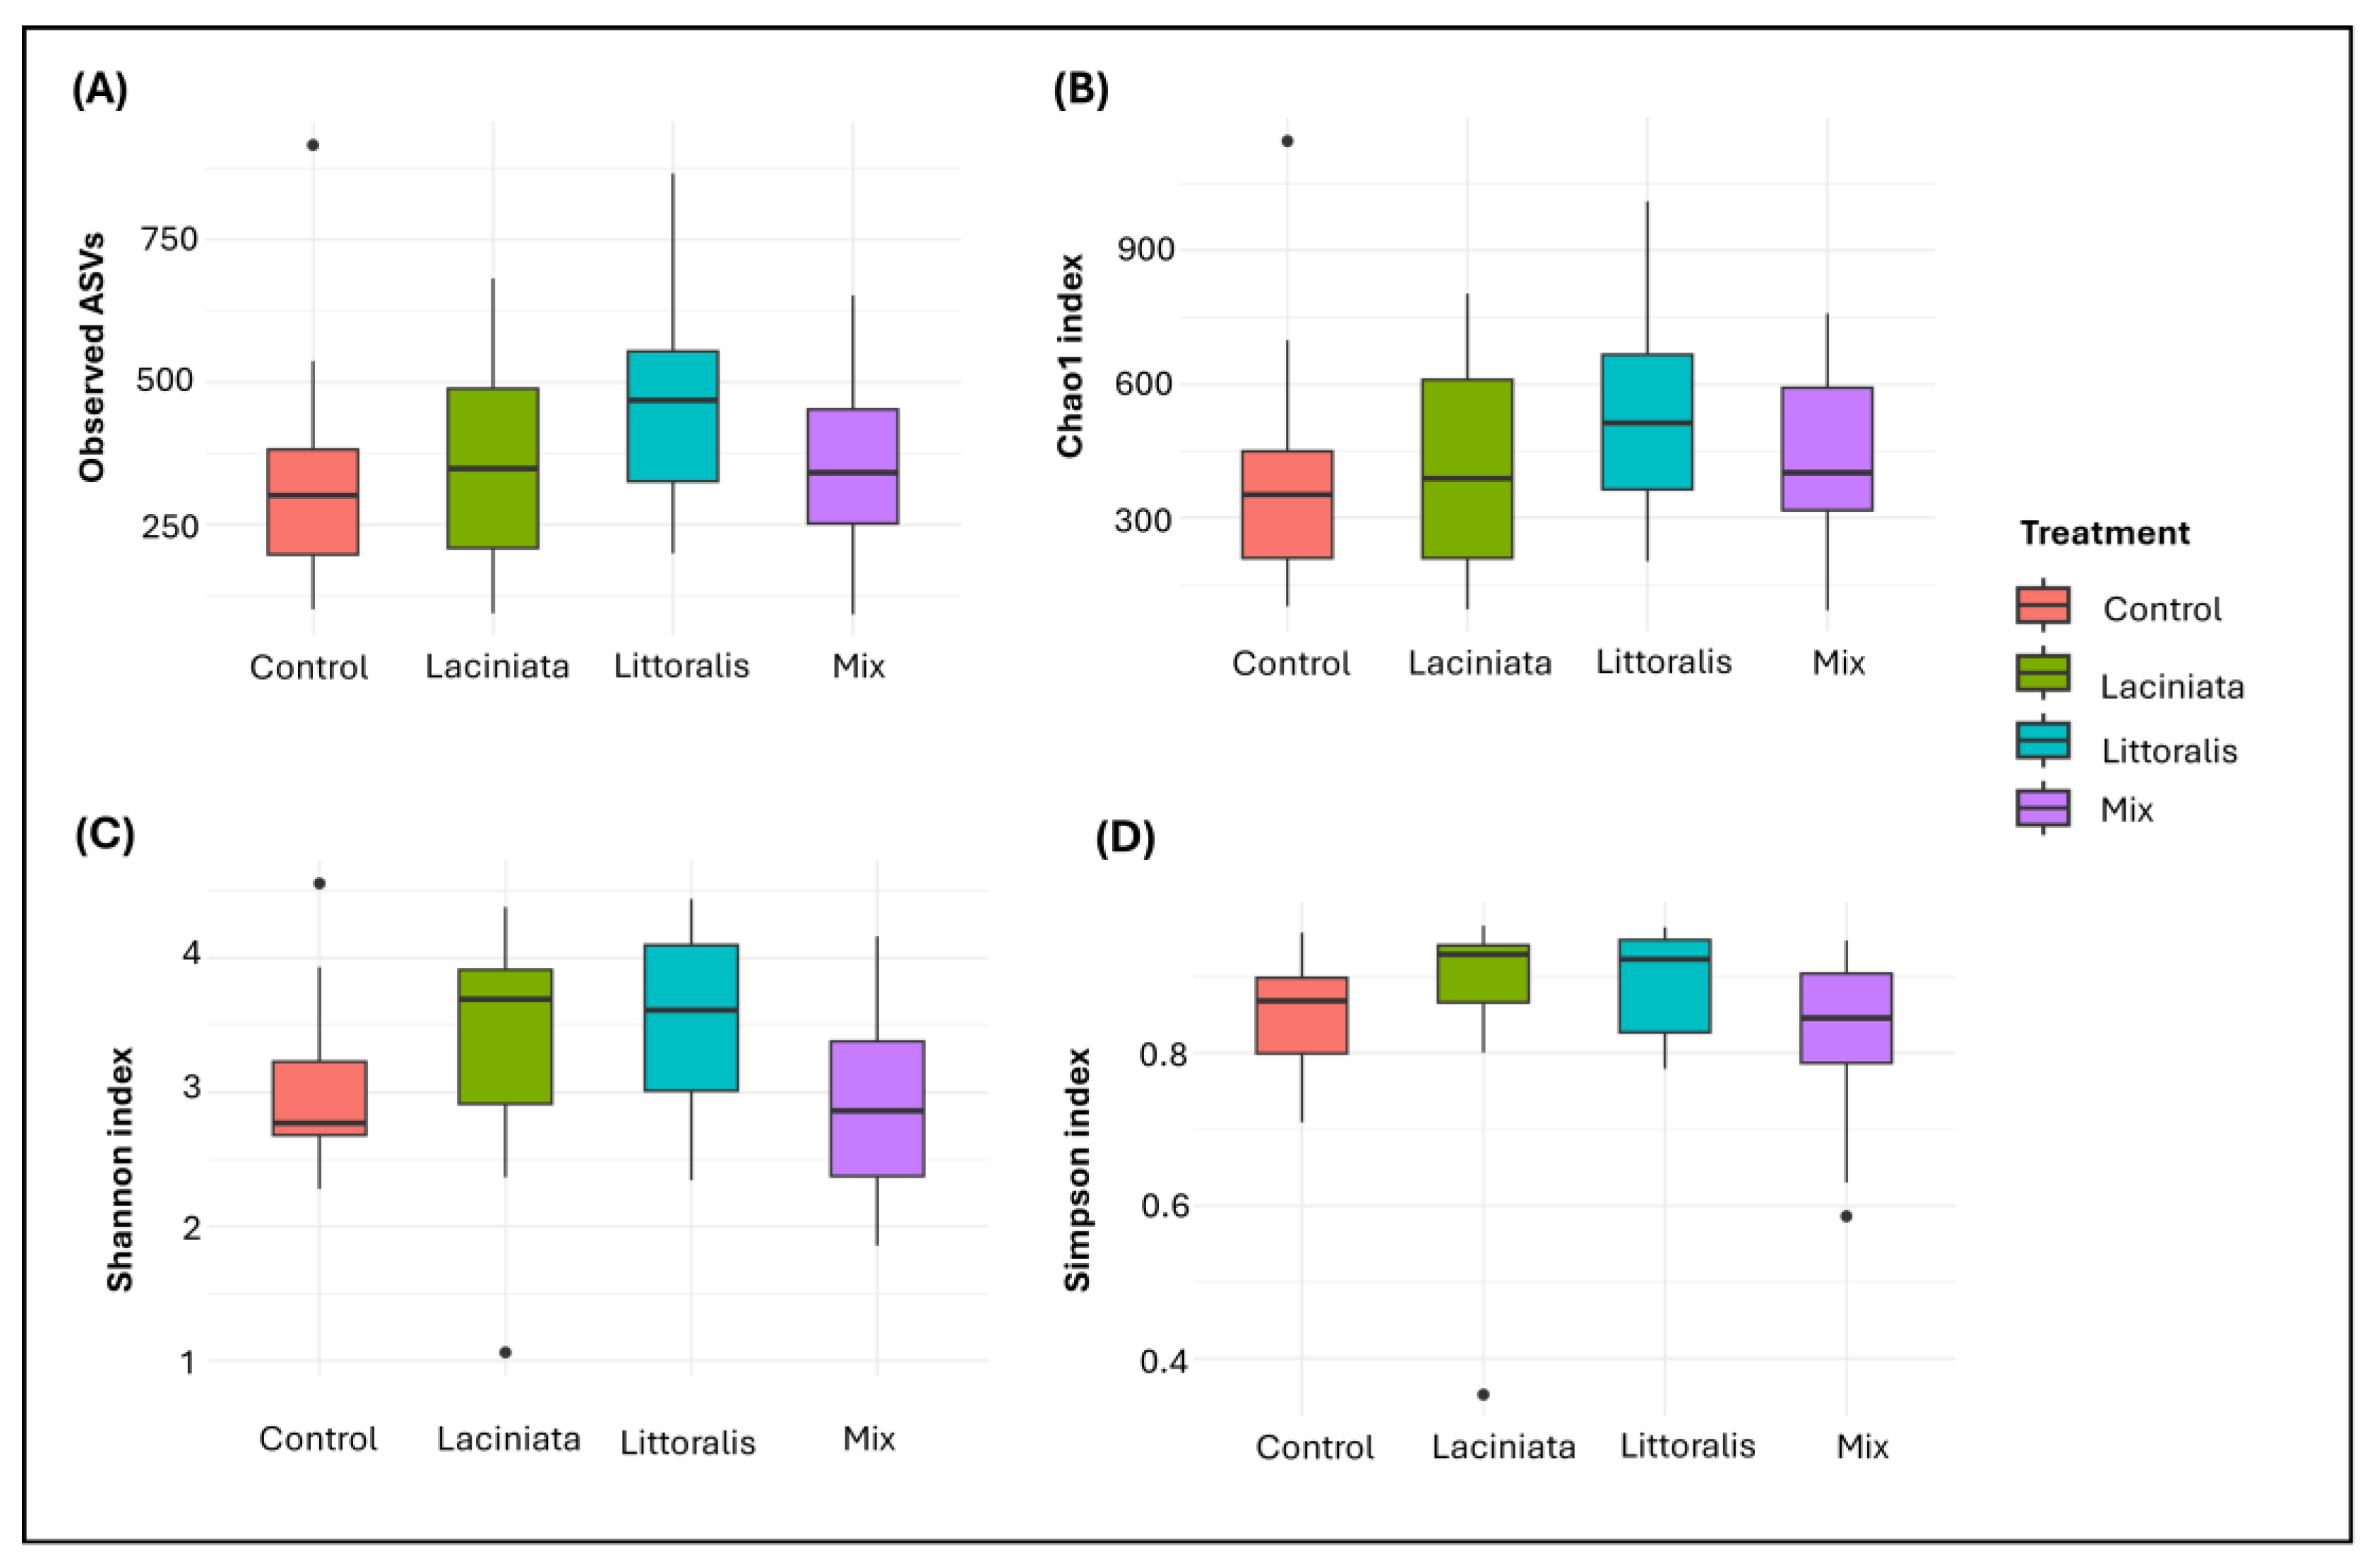
Figure 4.
Core microbial ASVs shared across treatments at 24 DAP. (A) Four-way Venn diagram showing the number of core ASVs shared among Control, Laciniata, Littoralis, and Mix treatments. Core ASVs were defined as ASVs present in ≥ 50% of samples within each group at a detection threshold of 0.001. (B) Pairwise Venn diagram comparing core ASVs between each SynCom treatment and Control: Laciniata vs Control (left), Littoralis vs Control (middle), and Mix vs Control (right). (C) Pairwise comparisons of core ASVs among SynCom treatments: Littoralis vs Laciniata (left), Mix vs Laciniata (middle), and Littoralis vs Mix (right).
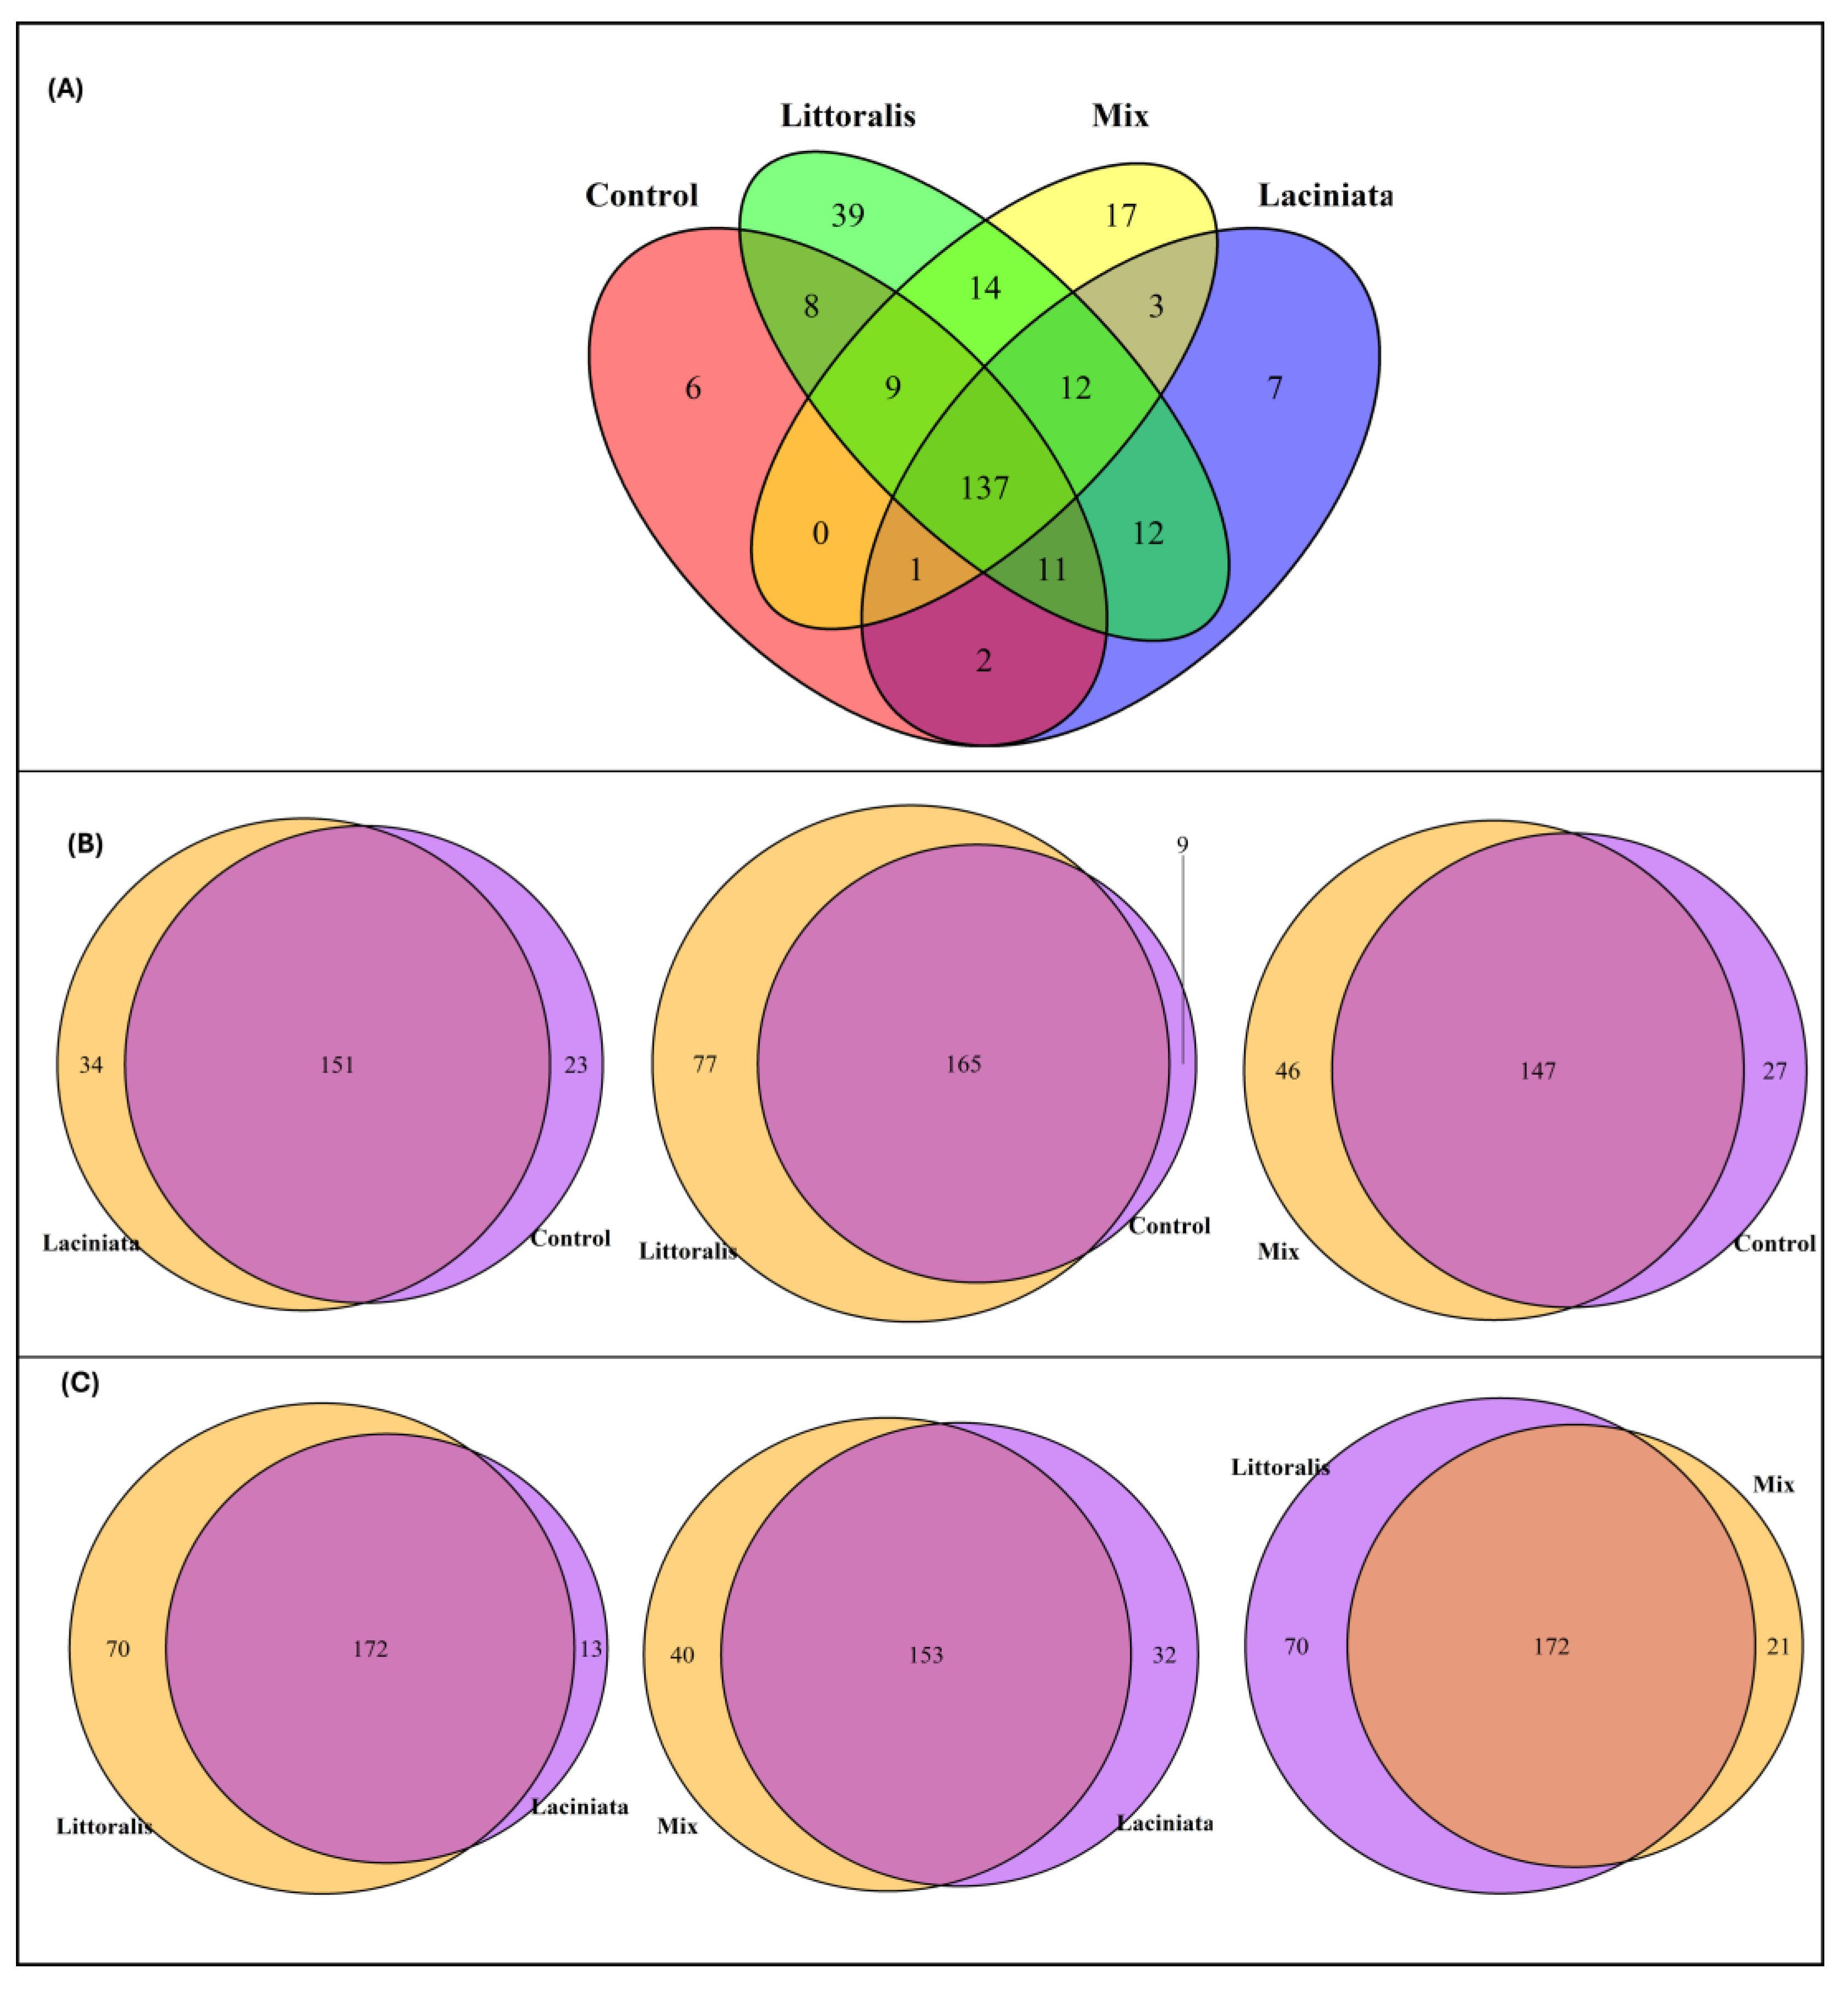
Figure 5.
Relative abundance of indicator bacterial taxa identified across SynCom treatments at 24 DAP. Indicator taxa were determined using indicator species analysis (indicspecies package in R, 999 permutations), based on their specificity and fidelity to each treatment. Taxa were reported at the lowest available taxonomic level, with labels reflecting hierarchical annotation (Order–Family–Genus). A prevalence threshold of ≥ 50%, and a relative abundance threshold of ≥ 0.001 were applied. Bars represent the relative abundance of each indicator taxon in lucerne across replicates (n = 10 per treatment) for Control, Laciniata, Littoralis, and Mix treatments.
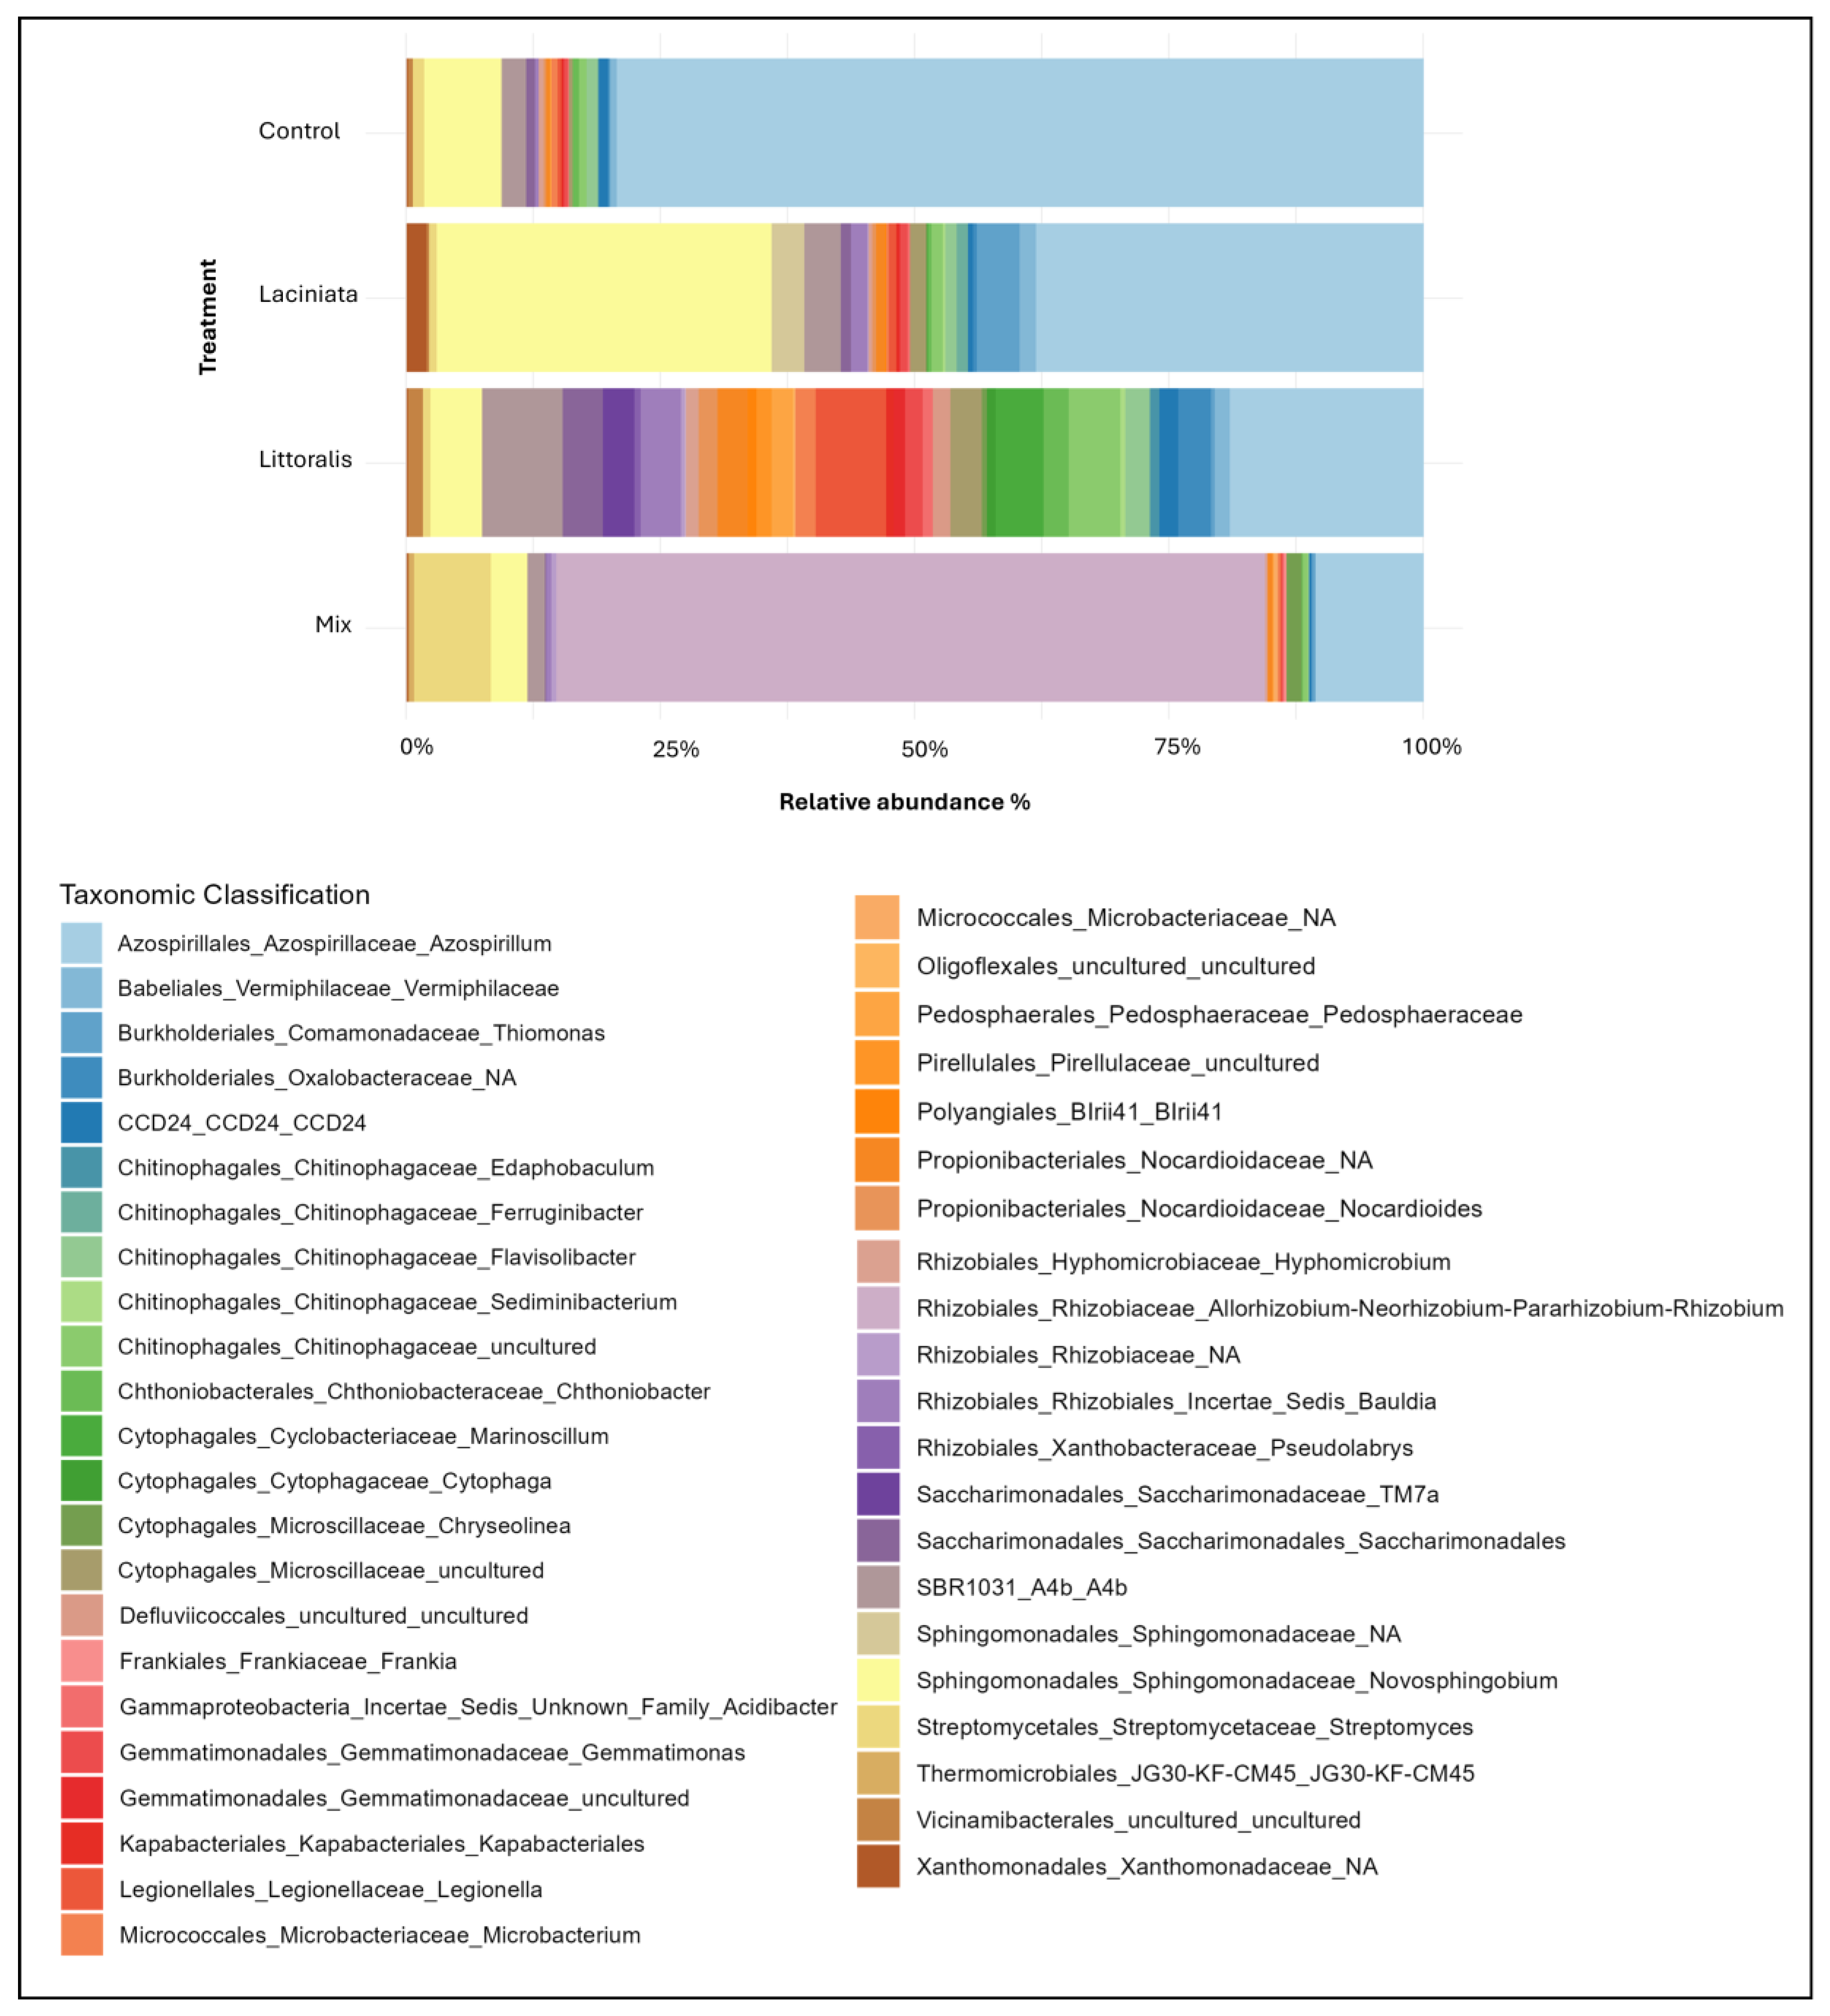
Figure 6.
Germination percentage and early-stage growth responses of lucerne seedlings under SynCom treatments. (A) Germination percentage (%) at 7 DAP for lucerne seeds treated with three SynComs: Laciniata, Littoralis, and Mix compared to an uninoculated Control (n =100 seeds per treatment). (B) Root and shoot lengths at 24 DAP across treatments. Bars heights indicate mean values (n = 10 per treatment) ± standard error (SE). A mirrored bar plot was used to display root length (below x-axis) and shoot length (above). Different letters denote statistically significant differences among treatments (Tukey’s HSD test, p < 0.05).
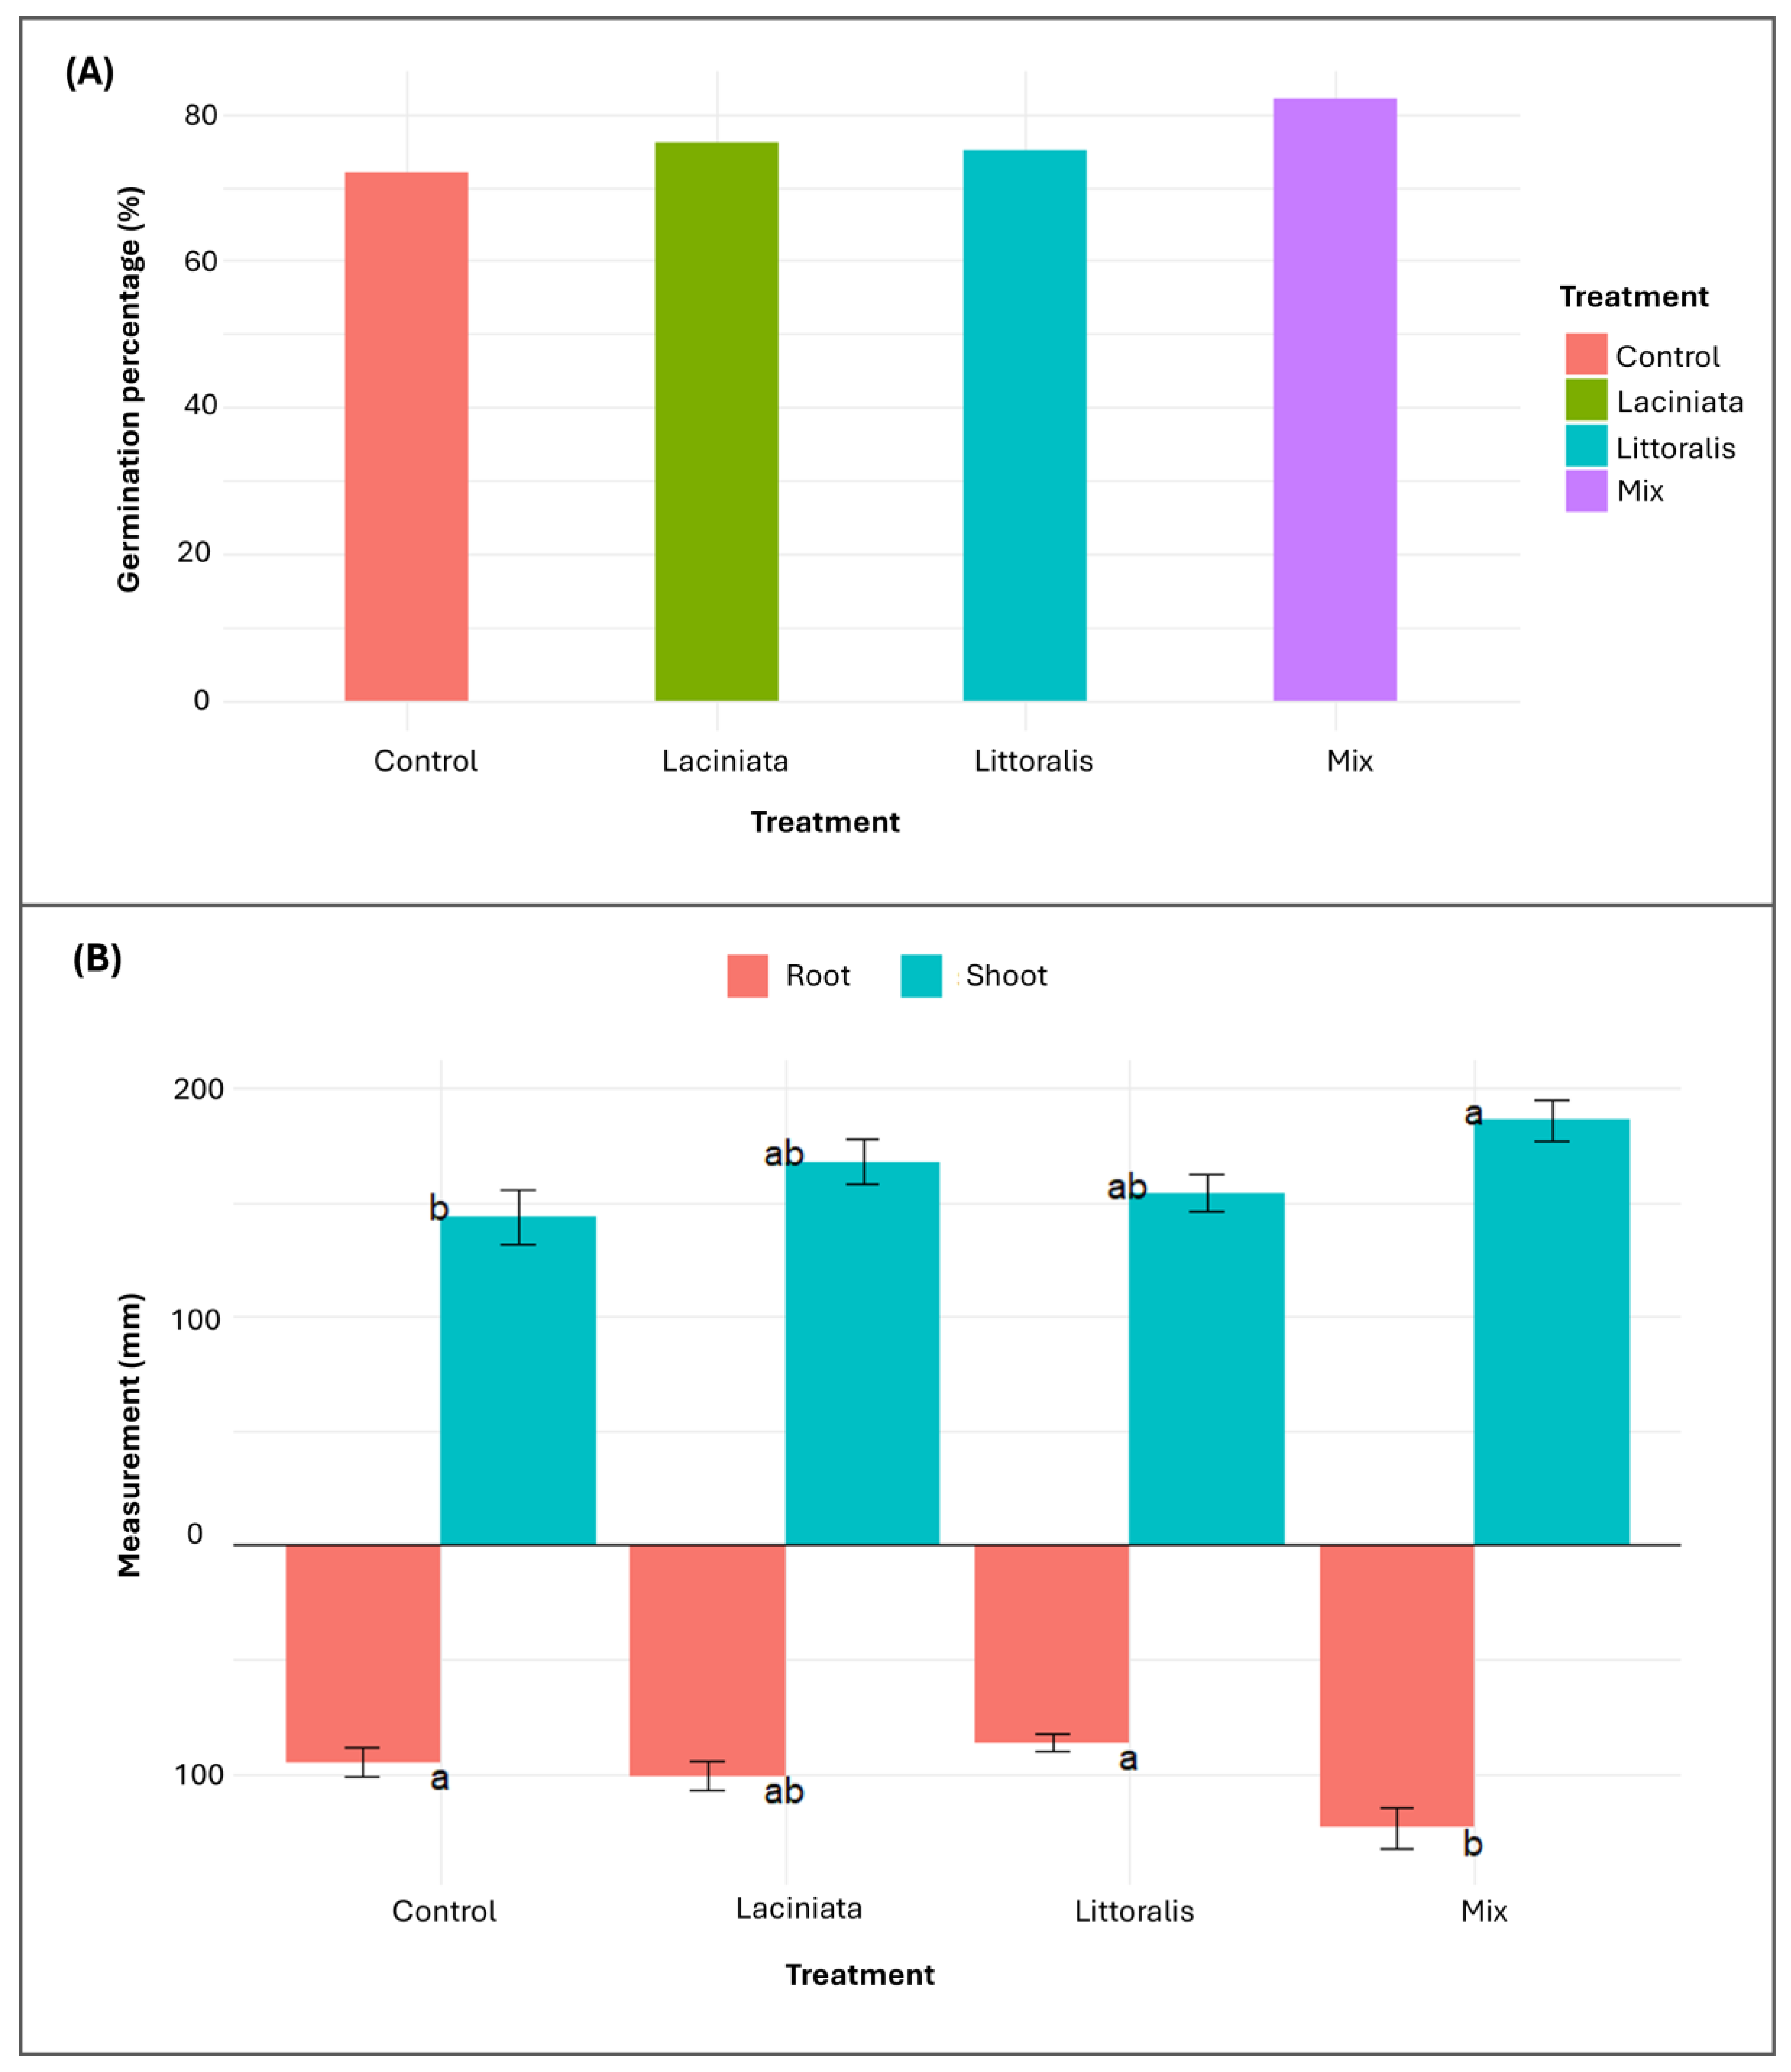
Figure 7.
Aerial biomass of lucerne plants at 63 DAP under well-watered and drought conditions across SynCom treatments: Laciniata, Littoralis and Mix and uninoculated Control. Boxplots represent dry (top panel) and wet (bottom panel) shoot biomass for each SynCom treatment and Control. Plants were grown under automated watering regimes in the PPV facility at Horsham, Victoria, Australia. Measurements were conducted under two watering regimes: drought (left side) and well-watered (right side). Each box represents the interquartile range (IQR), with the horizontal line indicating the median. Whiskers extend to 1.5 × IQR, and individual points represent statistical outliers. Each treatment group includes 10 biological replicates. Biomass values are expressed in grams (g).
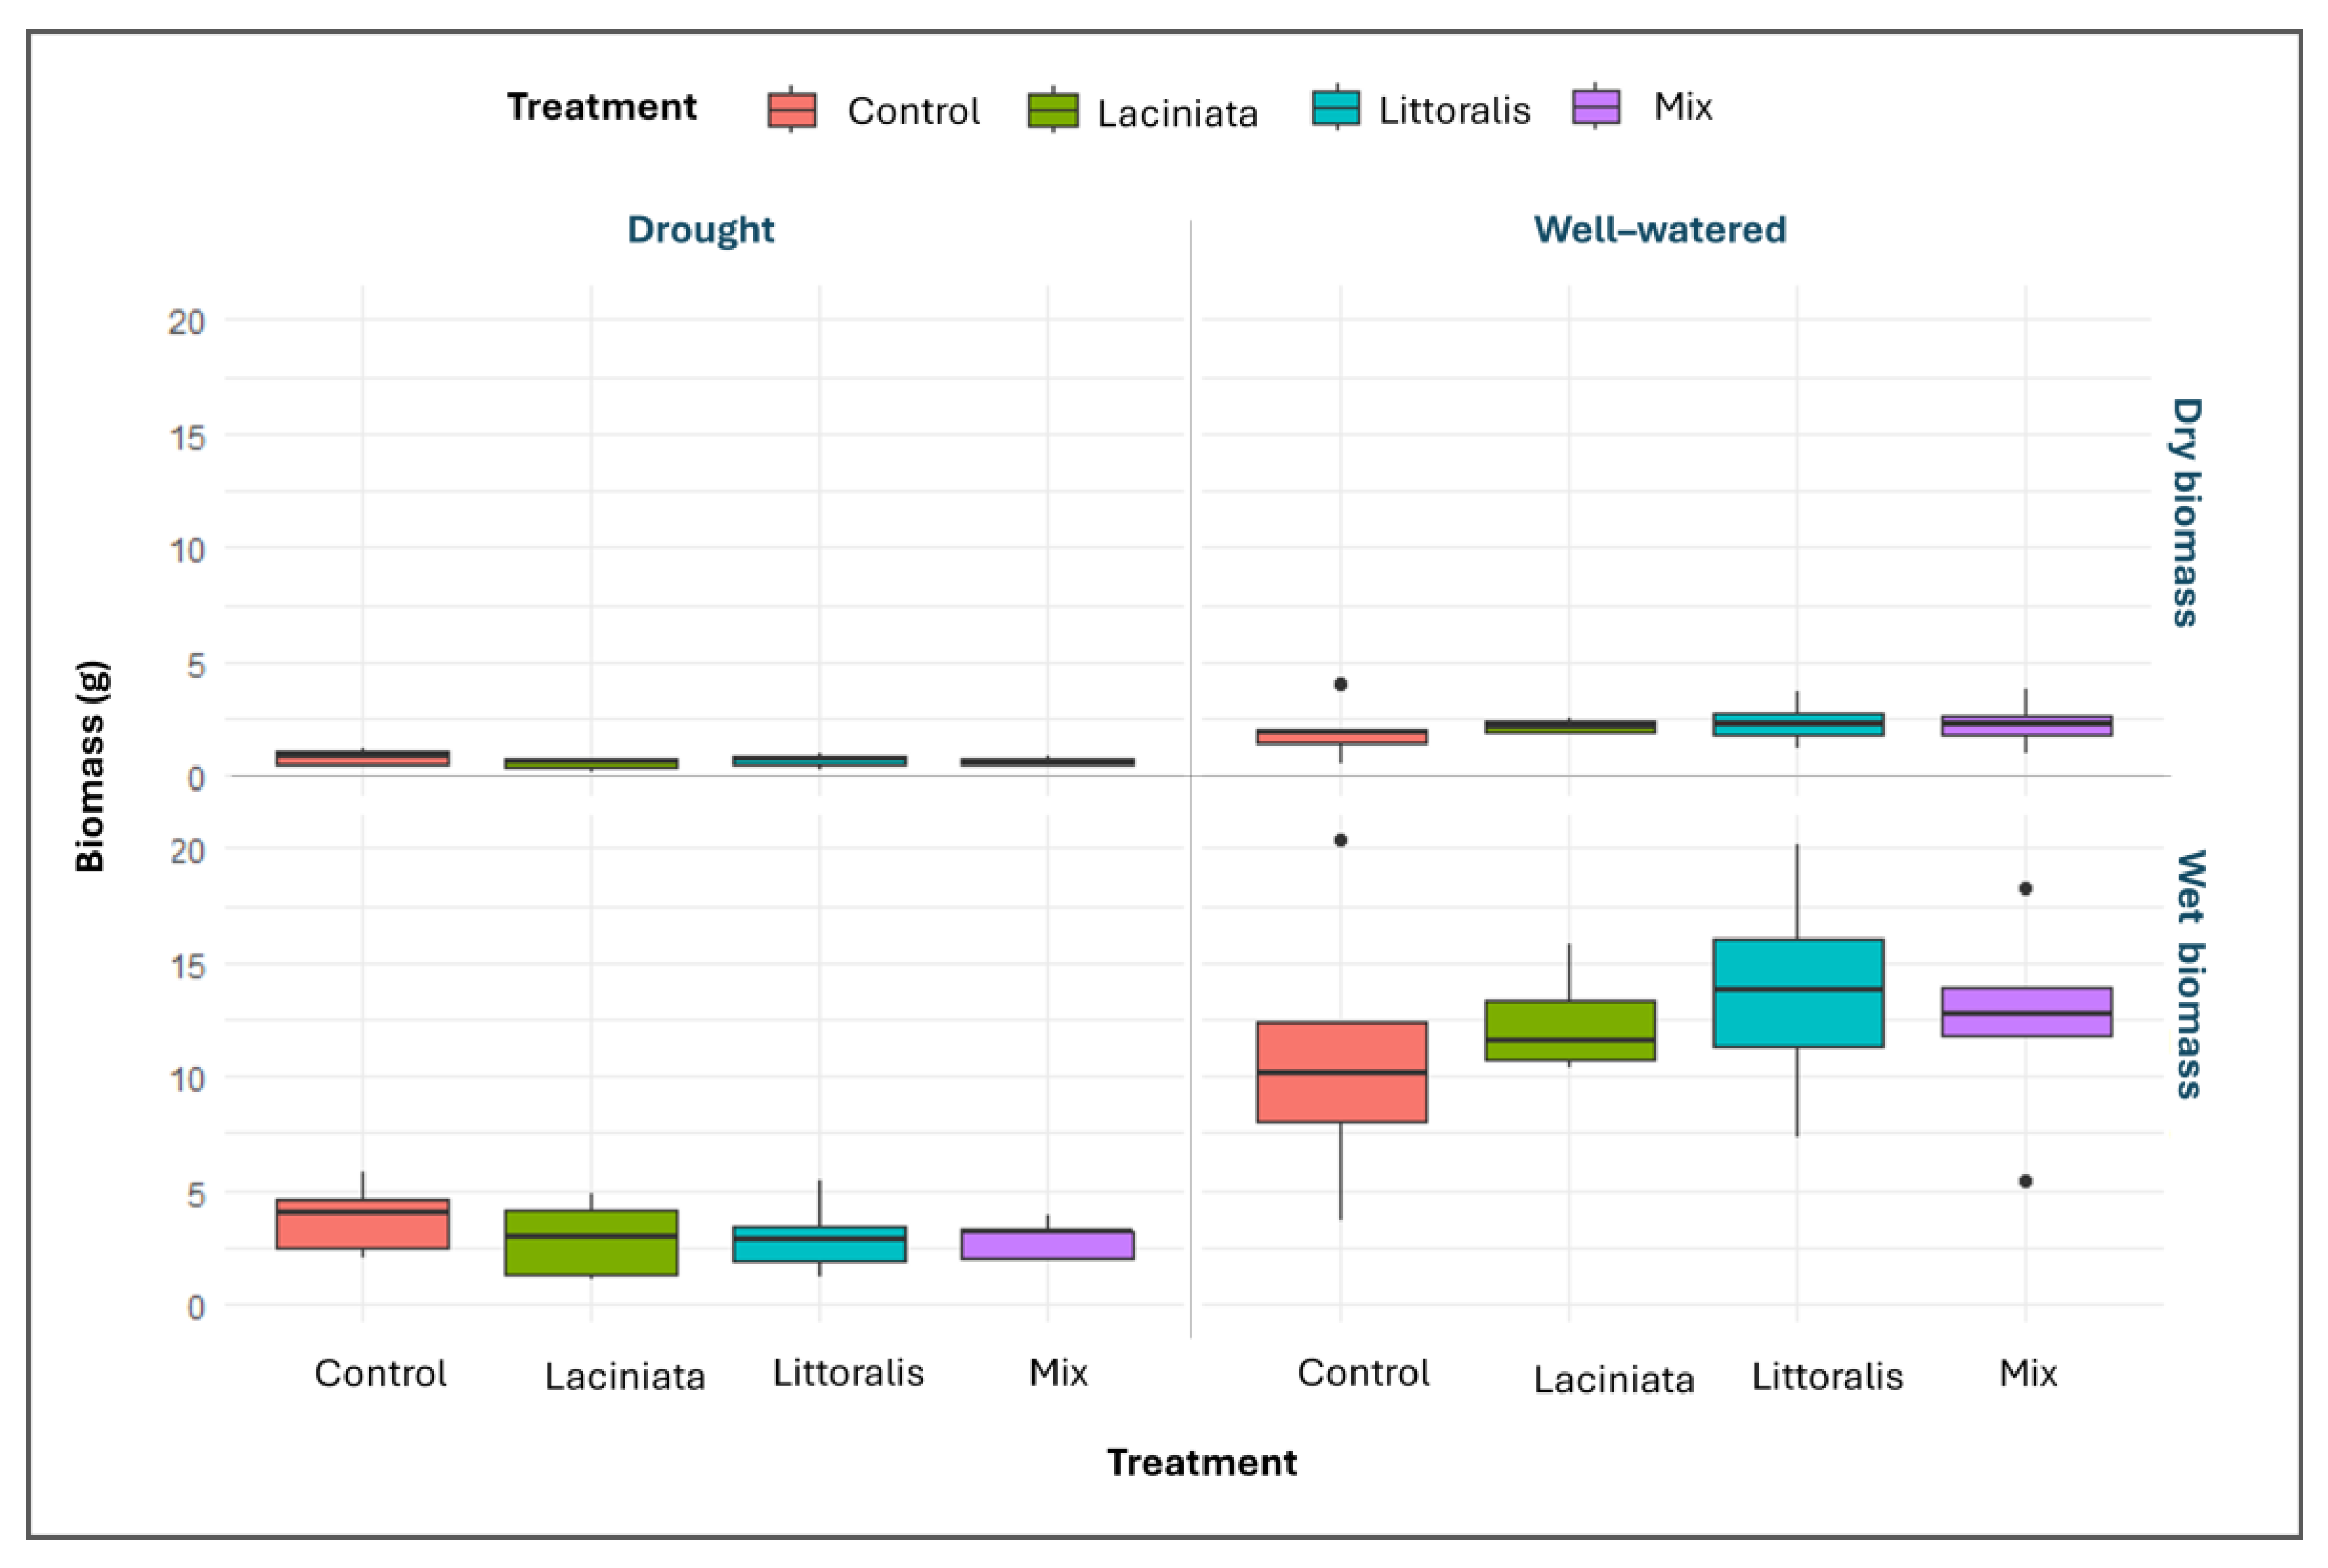
Figure 8.
Validation of image-derived biomass estimates against conventional biomass measurements at 63 DAP. Linear regression comparing adjusted pixel values (red) from high-throughput phenotyping (HTP) with conventionally measured wet aerial biomass (g) across all treatments. Pixel-derived estimates show a strong linear relationship with wet biomass (R2 = 0.98). The red regression line is shown with 95% confidence intervals. A 1:1 reference line (blue) is included for comparison.
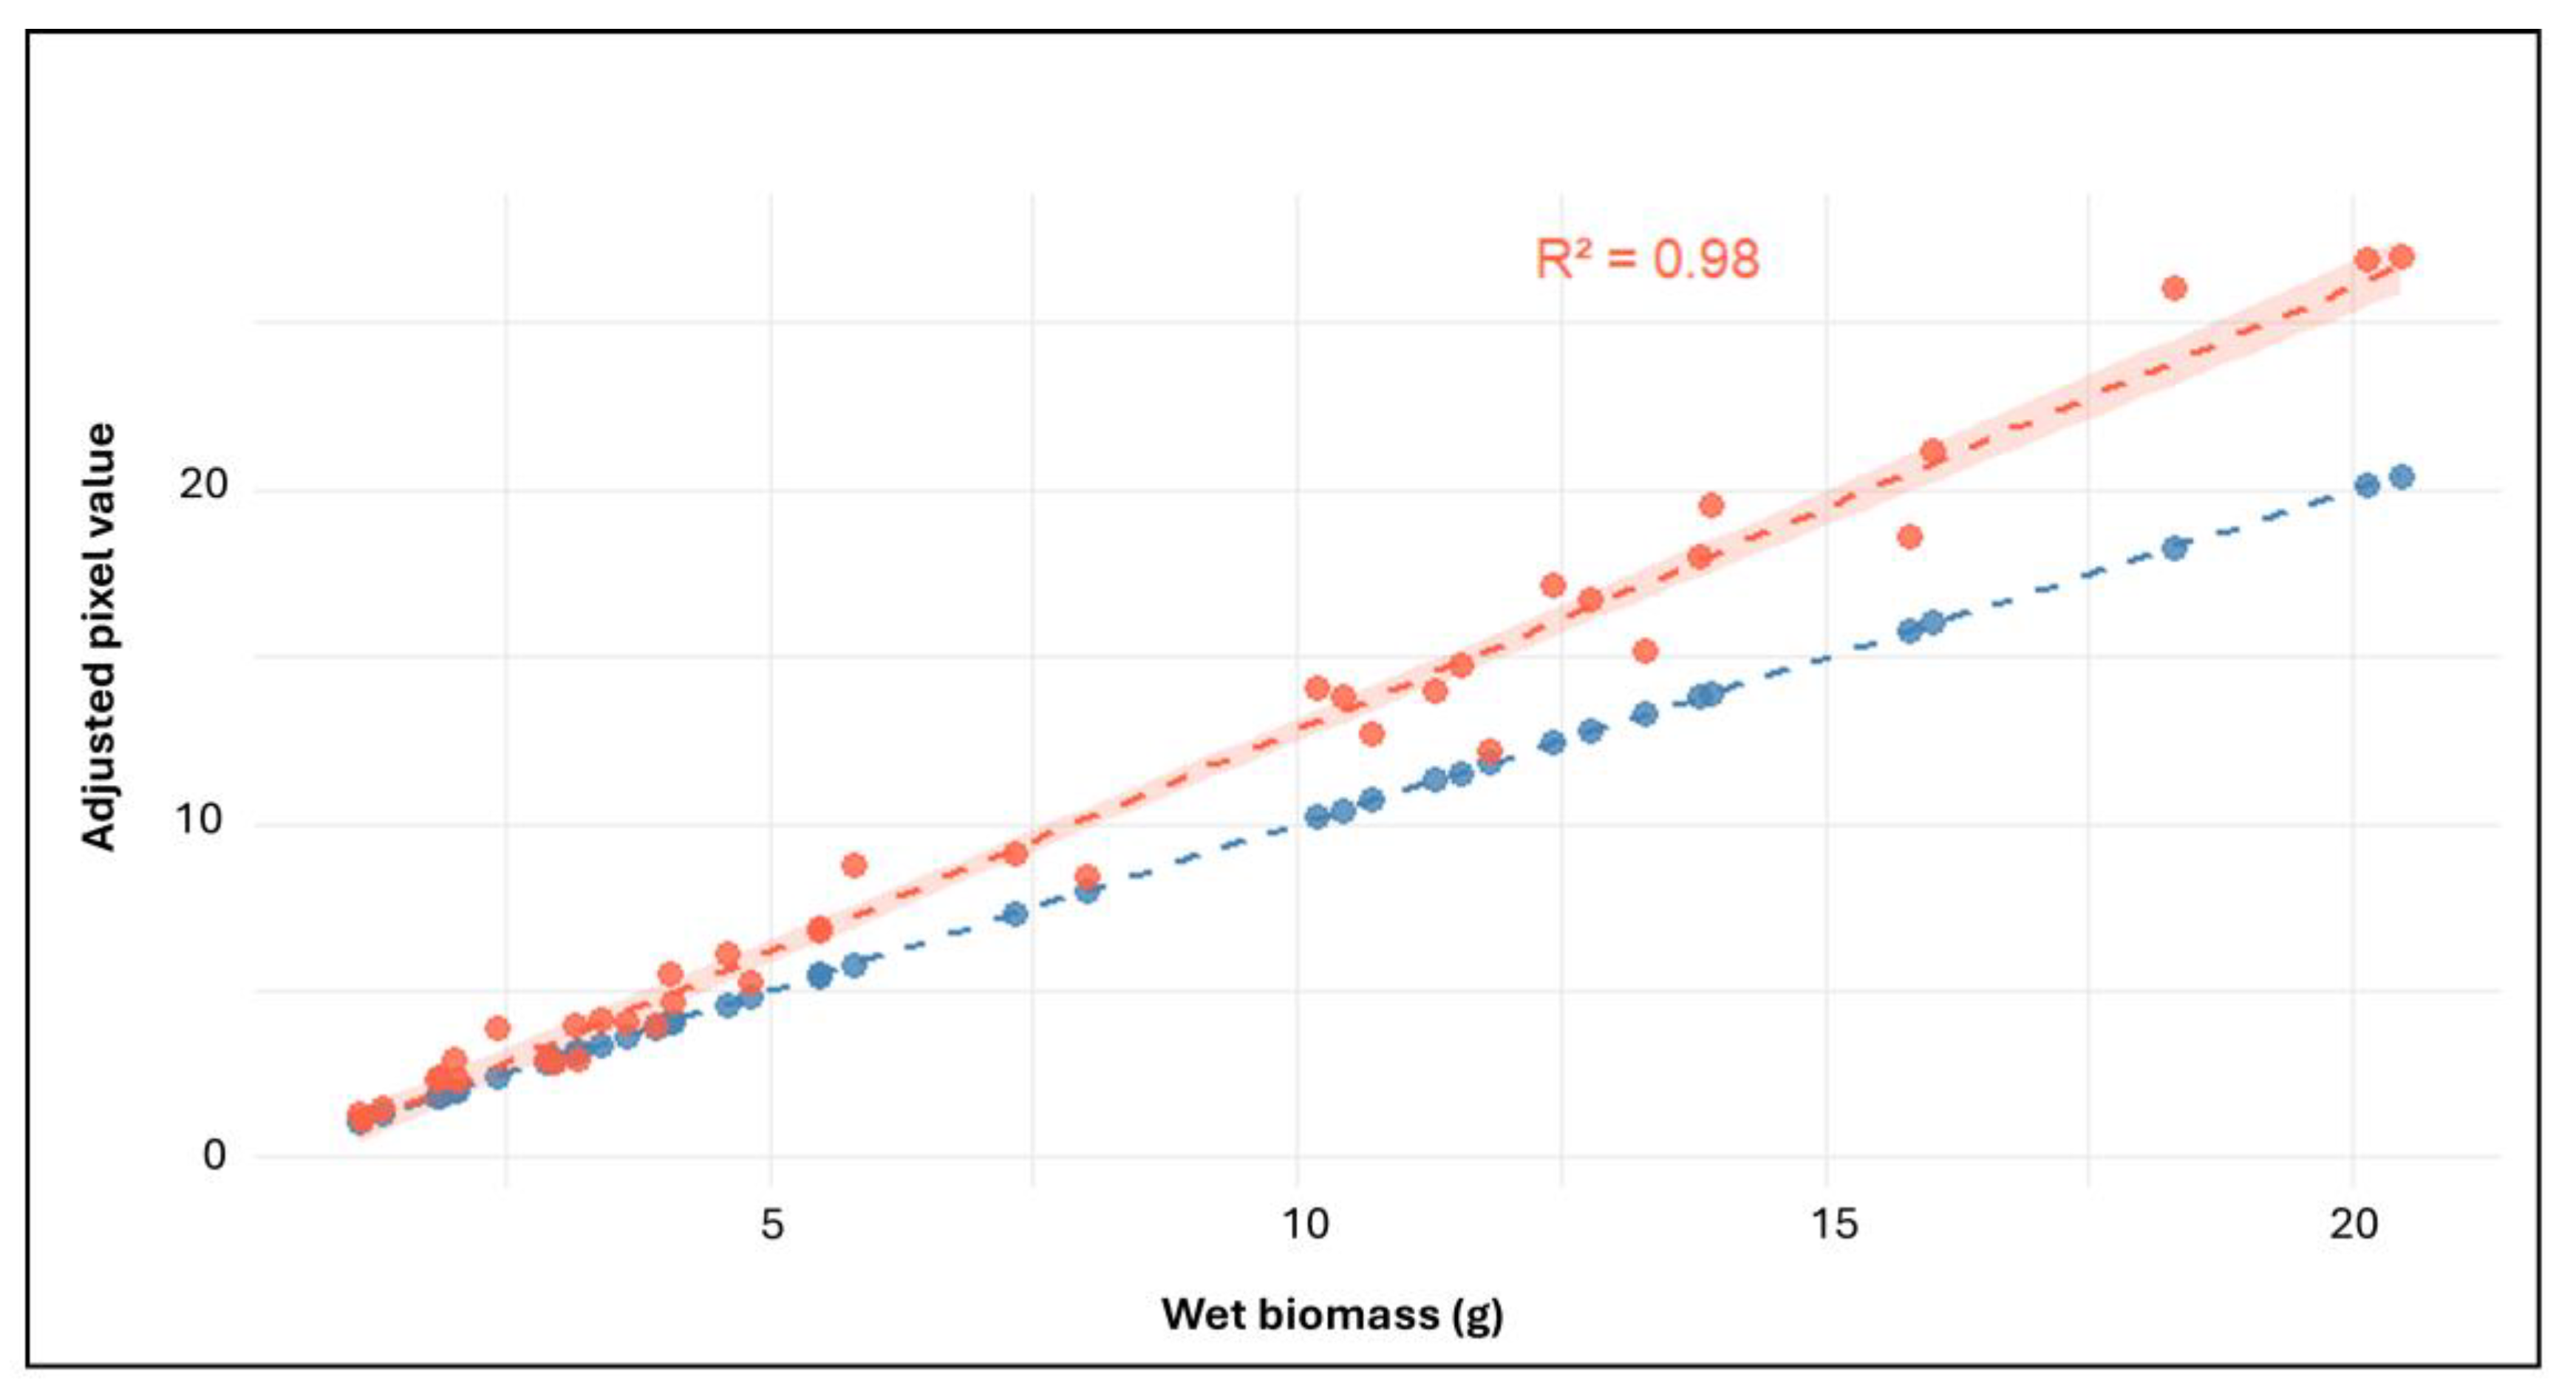
Figure 9.
Temporal dynamics of aerial biomass accumulation in lucerne under well-watered and drought conditions. Bar plots show mean pixel-derived biomass values from HTP imaging. The treatments include uninoculated Control (CT), Laciniata (LA), Littoralis (LT), and Mix, each grown under well-watered (WW; 80% soil gravimetric water content [SGWC]) or drought (DRT; 40% SGWC) conditions. Drought stress was initiated seven days after the start of imaging at the PPV facility. (A) Early-phase growth responses (Day 1 to Day 17), prior to or during early drought onset. (B) Later-phase responses (Day 24 to Day 55), capturing the effects of prolonged watering regimes on biomass accumulation. Each bar represents the mean value per time point (n = 10 per treatment per watering condition).
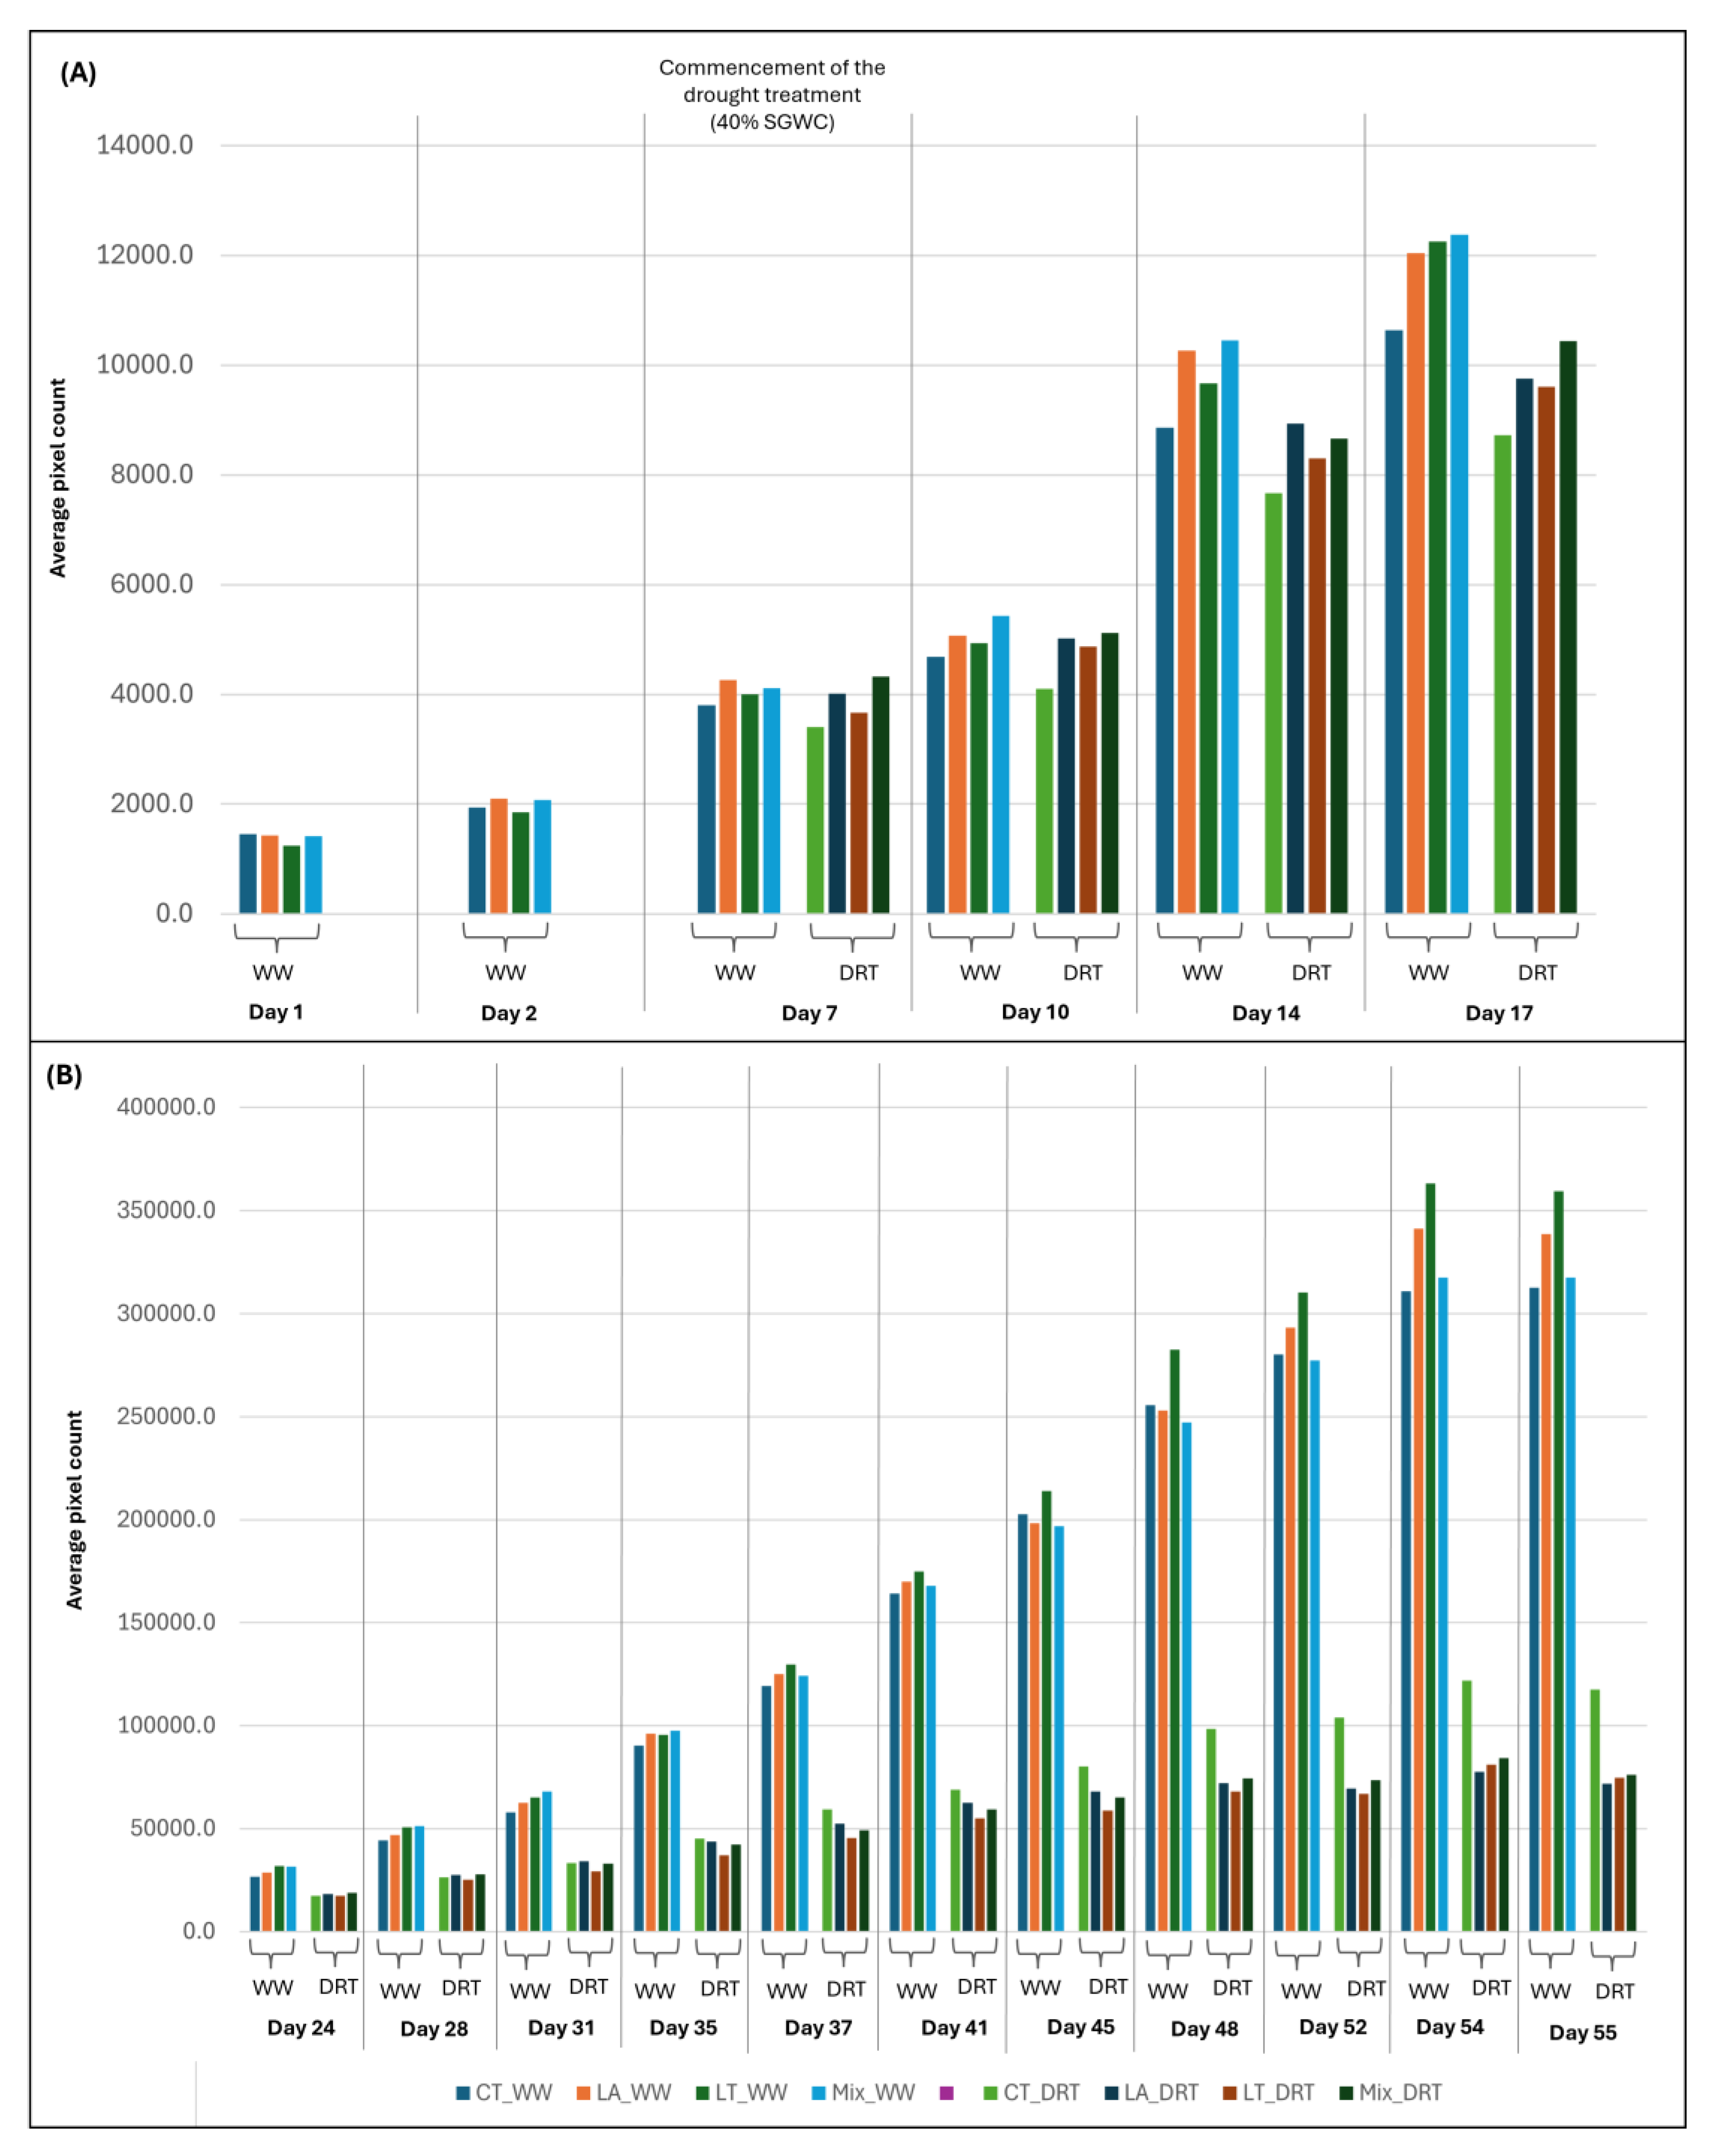

Table 1.
Taxonomic identity and genomic features of seed-derived bacterial isolates used in SynCom design.
Table 1.
Taxonomic identity and genomic features of seed-derived bacterial isolates used in SynCom design.
| Bacterial isolate lab ID and NCBI accession number | Isolation source (host plant species) |
Taxonomic classification (Kraken database) |
ANI % | NCBI reference genome ID |
|---|---|---|---|---|
| Lu_LA164_003 (PQ756890) |
M. laciniata | Pantoea agglomerans pv. betae | 97.41% | Pantoea agglomerans (GCF_019048385.1) |
| Lu_LA841_009 (PQ756893) |
Pantoea allii | 99.80% | Pantoea allii (GCF_003148935.1) | |
| Lu_LA164_012 (PQ756889) |
Pseudomonas graminis | 85.93% | Pseudomonas graminis DSM 11363 (GCF_900111735.1) | |
| Lu_LT198_003 (PQ756897) |
M. littoralis | Pantoea agglomerans pv. betae | 97.43% | Pantoea agglomerans (GCF_019048385.1) |
| Lu_LT198_002 (PQ756896) |
Pantoea allii | 80.43% | Pantoea allii (GCF_003148935.1) | |
| Lu_LT198_W003 (PQ756901) |
Pseudomonas graminis | 99.85% | Pseudomonas graminis DSM 11363 (GCF_900111735.1) |
*Isolates were taxonomically classified using Kraken2 with the NCBI RefSeq bacterial genome database (build date: March 2023). Average Nucleotide Identity (ANI) was calculated against the closest NCBI reference genome. The NCBI reference genome ID and the GenBank accession numbers of each isolate are provided for reproducibility.
Table 2.
Core microbiome composition and statistical comparison of ASVs overlap across treatments. Statistical significance p < 0.001.
Table 2.
Core microbiome composition and statistical comparison of ASVs overlap across treatments. Statistical significance p < 0.001.
| Control vs SynCom-treated groups | |||||
| Comparison | Shared taxa | Unique to Control | Unique to Treatment | Fisher’s Exact test | Chi-square test |
| CT vs LA | 72.6% | 11.1% | 16.3% | 0.1958 | 0.2331 |
| CT vs LT | 65.7% | 3.6% | 30.7% | 3.02 × 10⁻¹² | 8.18 × 10⁻¹¹ |
| CT vs Mix | 66.8% | 12.3% | 20.9% | 0.0502 | 0.0626 |
| Among SynCom treated groups | |||||
| LT vs LA | 67.45% | 27.5% (LT) | 5.1% (LA) | 6.14 × 10⁻⁹ | 2.97 × 10⁻⁸ |
| LT vs MIX | 65.40% | 26.6% (LT) | 8.00% (Mix) | 3.09 × 10⁻⁶ | 7.52 × 10⁻⁶ |
| LA vs MIX | 68.00% | 14.22% (LA) | 17.78% (Mix) | 0.4331 | 0.4731 |
Disclaimer/Publisher’s Note: The statements, opinions and data contained in all publications are solely those of the individual author(s) and contributor(s) and not of MDPI and/or the editor(s). MDPI and/or the editor(s) disclaim responsibility for any injury to people or property resulting from any ideas, methods, instructions or products referred to in the content. |
© 2025 by the authors. Licensee MDPI, Basel, Switzerland. This article is an open access article distributed under the terms and conditions of the Creative Commons Attribution (CC BY) license (http://creativecommons.org/licenses/by/4.0/).
Copyright: This open access article is published under a Creative Commons CC BY 4.0 license, which permit the free download, distribution, and reuse, provided that the author and preprint are cited in any reuse.


