Submitted:
18 July 2025
Posted:
18 July 2025
You are already at the latest version
Abstract
This study conducted 1000-hour durability tests on four different single proton exchange membrane fuel cells (PEMFCs). The overall performance degradation of the cells was evaluated, and the evolution of two key dynamic response parameters—undershoot voltage and stabilization time—was analyzed during current density transients over time. The results showed that fuel cells with better mass transport properties consumed reactant gases more significantly in the upstream region during current transitions, leading to higher undershoot voltages. At higher current densities, the imbalance between gas supply and demand became more pronounced, further amplifying the undershoot. As the cell activation process progressed, partial internal performance improved, resulting in a decreasing trend in undershoot voltage. Stabilization time does not exhibit a clear correlation with load magnitude, but its increasing trend is closely related to the degradation of the cell's steady-state performance. These findings reveal a strong connection between dynamic response characteristics and performance decay, providing meaningful insights for the design, application, and health assessment of high-performance fuel cells.
Keywords:
dynamic response characteristics
; proton exchange membrane fuel cell
; stabilization time
; undershoot voltage
1. Introduction
Proton exchange membrane fuel cells (PEMFCs) are highly efficient and clean energy conversion devices. Owing to their significant advantages, such as zero emissions, high power density, and low-temperature startup, they have demonstrated immense development potential and wide-ranging applications in various fields, including new energy vehicles, portable electronics, stationary power stations, and backup power systems [1]. However, in practical applications, fuel cell systems often need to cope with frequent and rapid load changes, such as vehicle acceleration and deceleration or fluctuations in power demand from portable devices. Such dynamic conditions pose severe challenges to the voltage stability, response speed, and long-term durability of the fuel cell. Therefore, understanding the dynamic response of PEMFCs is crucial for achieving longer fuel cell lifetimes and better performance [2].
During a step increase in current density, the output voltage of a fuel cell typically experiences a sharp drop (voltage undershoot), followed by a partial recovery, and then gradually stabilizes at a new operating point. The magnitude of this voltage recovery, i.e., the portion that rebounds from the lowest point, is defined as the “undershoot voltage.” The time required for the voltage to complete this characteristic recovery process is defined as “stabilization time.” These two parameters are key indicators for characterizing the dynamic response of a fuel cell, reflecting the complex coupled multiphysics processes within the cell, including electrochemical reactions, mass transport, and heat management. A schematic diagram is shown in Figure 1.
Previous literature has extensively investigated the transient behavior of PEMFCs, particularly the phenomenon of voltage or current undershoot. Kim et al. [3] examined the effect of reactant gas stoichiometry on the dynamic response characteristics of a fuel cell under fixed reactant gas flow rates and proposed a second-order lead/lag (SO L/L) response system to describe the dynamic response process. Cho et al. [4] used large-area and transparent PEMFCs to study the dynamic response by varying reactant gas stoichiometry, operating temperature, humidity conditions, and the degree of cathode flooding. They found that the voltage undershoot behavior consists of two stages with different time delays: one of about 1 s and another of 10 s. Pei et al. [5] experimentally studied the effect of different operating conditions on the dynamic response of an air-cooled PEMFC stack and found that at higher ambient temperatures, the undershoot voltage after loading was smaller, and the time required for the fuel cell to return to a stable level was shorter. Chen et al. [6] used printed circuit board (PCB) technology to segment the fuel cell into 16 sections and analyzed the transient response of local currents, finding that the non-uniformity of in-plane gas distribution caused differences in mass transport capability, which affected the overall performance and degradation inconsistency. Yan et al. [7] found through experiments that the faster the load was applied, the larger the undershoot voltage during the dynamic response. Loo et al. [8] developed a one-dimensional, two-phase dynamic model of a PEMFC to explain its dynamic behavior.
While existing research has thoroughly investigated the mechanisms of voltage undershoot during the dynamic response of PEMFCs, there is a lack of research on the relationship between PEMFC durability and its dynamic response capability. This study conducts a systematic experimental investigation and comparative analysis of the undershoot voltage and stabilization time of four different single cells under various current densities and long-term durability testing conditions. The aim is to deepen the understanding of the dynamic response characteristics of PEMFCs and provide a reference for the design and application of high-performance fuel cells.
2. Experimental Setup
This study utilized four different fuel cells, labeled A, B, C, and D, as test subjects. The single-cell test fixture mainly consisted of end plates, current collector plates, and flow field plates. The flow field plates were made of dense graphite with a triple-serpentine flow field, featuring a channel width of 0.8 mm, a depth of 1.1 mm, and a land width of 0.9 mm, using a surface sealing method. A Greenlight Innovation G60 test station was used for the durability tests. The relevant parameters of the fuel cells are shown in Table 1.
Durability tests were conducted on cells A, B, C, and D according to the Chinese national standard GB/Z 44116-2024 [9]. Before the durability test and every 100 h during the test, polarization curve tests were performed on the four cells. Before each polarization curve test, the fuel cell was activated and conditioned at a current density of 0.6 A/cm2 for 20 min, followed by a shutdown and purge until the voltage dropped below 0.1 V. The polarization curve test was performed in current-controlled mode with a step of 0.2 A/cm2. The results were based on the load-increasing process, with data for each operating point averaged from 11 s to 70 s after the current step. The operating parameters of the test stand are listed in Table 2.
The durability cycle conditions used in the fuel cell durability test and the reversible recovery procedure, which was performed every 200 h of cumulative testing, followed Appendices E and F of GB/Z 44116-2024. The fuel cell durability cycle profile is shown in Figure 4. The reversible recovery procedure is detailed in Table 3.
3. Results and Discussion
3.1. Overall Performance Degradation
3.1.1. Subsubsection
After 1000 h of durability testing, the polarization curves for cells A, B, C, and D at different durability test durations were obtained, as shown in Figure 5(a–d), respectively.
As shown in Figure 5 after 1000 h of testing, Cell A exhibited the smallest performance change among the four cells, indicating its relatively superior durability. The open-circuit voltage and performance in the high current density region (concentration polarization) of Cell B showed a significant decline, suggesting that after 1000 h, its proton exchange membrane had degraded more than the others, leading to increased hydrogen crossover and reduced mass transport performance at high current densities. Cell C also showed a noticeable performance drop at high current densities, indicating a significant decline in its mass transport performance. Cell D showed the worst durability, with significant performance degradation across the open-circuit voltage, activation, ohmic, and concentration polarization regions after 1000 h.
To further analyze the performance changes, the voltage of each cell at its rated current density was plotted against the durability test duration, as shown in Figure 6(a–d).
As seen in Figure 6, the voltage of Cell A at its rated current density of 1.6 A/cm2 showed a clear downward trend with increasing durability test duration. For Cells B, C, and D, the voltage at their respective rated current densities initially showed an upward trend, indicating that they were still in an activation process during the early stages of the durability test. Performance degradation began only after a certain duration. Therefore, Cell B was likely in an activation state for the first 100 h, Cell C for the first 400 h, and Cell D for the first 300 h.
3.2. Undershoot Voltage Analysis
Undershoot voltage is a crucial indicator for evaluating the dynamic response characteristics of a fuel cell. A significant voltage undershoot phenomenon was observed at the current density transition points in the raw data from the polarization curves measured after the durability tests. The undershoot voltages for the four cells at various current densities and durability test durations were extracted and are shown in Figure 7.
Comparing the different cells, the undershoot voltage values for Cells A, B, and C at high current densities were larger than those for Cell D. This may be related to the better steady-state performance of Cells A, B, and C in the high current density region (concentration polarization). During a current density transition at high current densities, Cells A, B, and C could deliver more reactant gas to the catalytic sites compared to Cell D, consuming more reactants in the upstream region of the flow field. This temporarily exacerbates reactant starvation downstream, making it more difficult for reactants to reach the catalytic active sites in a timely and uniform manner, thus resulting in a larger undershoot voltage.
To more clearly represent the relationship between undershoot voltage and current density for the four cells, the average undershoot voltage at each current density across all durability test durations was calculated, as shown in Figure 8.
The results in Figure 8 show that, except for Cell D, the undershoot voltage of Cells A, B, and C generally tended to increase with increasing current density. It is worth noting that this experiment was conducted under a constant stoichiometric ratio with an ample supply of reactant gas, which differs from many previous studies that used constant gas flow rates. For instance, Kim et al. [10] studied the current density undershoot phenomenon using a constant reactant gas flow rate, where higher cell output current densities led to more severe reactant starvation.
Under a constant stoichiometric ratio control strategy, when the load (current density) changes, the supply of reactant gases (air and hydrogen) must be adjusted accordingly to maintain the set stoichiometry. However, the regulation of gas flow and its stabilization within the flow channels take a certain amount of time. Therefore, at the moment of a current density transition, a temporary gas supply shortage may still occur due to the delayed response of the gas flow, even under a constant stoichiometry control strategy. A larger current density implies a greater demand for reactants, and this temporary mismatch between gas supply and demand may be more significant during the transition, leading to an increase in the undershoot voltage.
To more clearly represent the relationship between undershoot voltage and durability test duration, the average undershoot voltage at each durability test duration across all current densities was calculated, as shown in Figure 9.
As shown in Figure 9, the trend of undershoot voltage with durability test duration was not as uniform as its trend with current density. The undershoot voltage of Cell B generally showed a decreasing trend in the first 100 h of the durability test and an increasing trend from 100 h to 1000 h. The undershoot voltage of Cell C showed a decreasing trend in the first 400 h, while that of Cell D showed a decreasing trend in the first 300 h. As previously mentioned, Cells B, C, and D had activation periods of 100 h, 400 h, and 300 h, respectively, which correspond to the trends in their undershoot voltage with durability test duration. This suggests to some extent that an increase in undershoot voltage reflects a decline in cell durability. At the same time, these observations strongly indicate that certain changes occurring within the cell during the activation process (such as catalyst wetting, ion channel formation, etc.) are closely related to the changes in undershoot voltage. The activation process is usually accompanied by an improvement in electrochemical performance, which may help mitigate voltage fluctuations during current density transitions.
The undershoot voltage of Cell A showed a decreasing trend with durability test duration, which contradicts the trend of its performance degradation. Further electrochemical characterization tests could be designed to investigate this anomalous trend for Cell A and the relationship between cell activation and undershoot voltage.
3.3. Stabilization Time Analysis
Stabilization time reflects the speed at which the fuel cell voltage recovers after a current density transition and is an important parameter for measuring its dynamic response speed. The stabilization times for the four cells at various current densities and durability test durations were extracted and are shown in Figure 10.
The 3D bar charts of the stabilization time distribution for each cell do not clearly show the trends with durability test duration and current density. To more clearly represent the relationship between stabilization time and current density, the average stabilization time at each current density across all durability test durations was calculated, as shown in Figure 11.
Unlike the undershoot voltage, the trend of stabilization time with current density was not obvious in this study. This may imply that within the tested current density range, the main factors affecting stabilization time are more related to the aging state and inherent mass transport characteristics of the fuel cell, rather than being directly determined by the magnitude of the current density. To more clearly represent the relationship between stabilization time and durability test duration, the average stabilization time at each durability test duration across all current densities was calculated, as shown in Figure 12.
A comprehensive analysis of the data for Cells A, B, C, and D shows that the stabilization time generally tended to increase with increasing durability test duration. This indicates that as the cells age, their voltage response speed tends to slow down during current density transitions. This phenomenon can be explained by the cumulative changes that may occur inside the cell as the durability test proceeds, such as catalyst agglomeration or loss, degradation of the electrolyte membrane, or a decline in the water management capability of the gas diffusion layer and microporous layer. All these changes can cause the speed at which reactant gases reach the catalyst active sites to lag behind the rapid changes in load demand. In particular, the deterioration of the cell’s internal water management capability can significantly hinder the rapid response and adjustment of the gas flow field during a current transition, causing the fuel and air to take longer to refill the entire flow channel and effectively penetrate to the catalyst active sites, thereby leading to an extension of the stabilization time.
4. Conclusions
This study systematically analyzed the overall performance degradation of four groups of proton exchange membrane fuel cells through 1000-hour durability tests, with a focus on revealing the evolution of key dynamic response parameters (undershoot voltage and stabilization time) with current density and operating time under current density step changes. The main conclusions are as follows:
(1) Cells with stronger mass transport performance consume more reactant gases in the upstream region of the flow field during a current density step, exacerbating reactant starvation downstream and leading to a larger voltage undershoot.
(2) Even under constant stoichiometric control with an ample supply of reactant gas, a fuel cell will experience a higher undershoot voltage during a current density transition at high current densities. This is because the reactant gas supply cannot keep up with the rate of change in demand, and the supply-demand mismatch is exacerbated at higher current densities.
(3) During the dynamic response of a fuel cell, the improvement in internal performance due to cell activation leads to a decreasing trend in the undershoot voltage.
(4) The magnitude of the current density is not the main factor affecting the voltage stabilization time during the dynamic response of a fuel cell. The main factors are more related to the aging state and inherent mass transport characteristics of the fuel cell.
(5) There is a correlation between the extension of the stabilization time during the dynamic response of a fuel cell and the degradation of its steady-state performance.
These findings are of significant theoretical and practical value for a deeper understanding of the dynamic behavior of fuel cells under actual operating conditions, for assessing their performance degradation, and for developing better cell management and control systems. Future work could further incorporate microstructural and electrochemical characterization tests to more comprehensively reveal the underlying mechanisms of undershoot voltage and the corresponding stabilization time.
Author Contributions
Conceptualization, Z.Q. and W.P.; data curation, X.C.; methodology, Z.Q.; validation, Z.Q., Y.H. and R.W.; writing—original draft preparation, Z.Q.; writing—review and editing, D.H.;supervision, Y.H.; funding acquisition, Y.H. All authors have read and agreed to the published version of the manuscript.
Funding
This research was funded by National Key Research and Development Program of China, grant number No.2023YFE0109200.
Data Availability Statement
The data presented in this study are available on request from the corresponding author due to commercial restrictions.
Conflicts of Interest
The authors declare that they have no known competing financial interests or personal relationships that could have appeared to influence the work reported in this paper.
References
- Lu, Y.; Hou, Y.; Zhao, H.; et al. Life prediction model of automotive fuel cell based on LSTM-Transformer hybrid neural network. Int. J. Hydrog. Energy 2025, 135, 182–194. [Google Scholar] [CrossRef]
- Espiari, S.; Aleyaasin, M. Transient response of PEM fuel cells during sudden load change. In Proceedings of the 2010 IEEE International Energy Conference, Manama, Bahrain, 18–22 December 2010; pp. 211–216. [Google Scholar]
- Kim, S.; Shimpalee, S.; Van Zee, J.W. The effect of reservoirs and fuel dilution on the dynamic behavior of a PEMFC. J. Power Sources 2004, 137, 43–52. [Google Scholar] [CrossRef]
- Cho, J.; Kim, H.S.; Min, K. Transient response of a unit proton-exchange membrane fuel cell under various operating conditions. J. Power Sources 2008, 185, 118–128. [Google Scholar] [CrossRef]
- Pei, H.; Liu, Z.; Chen, J.; et al. Dynamic response study of air-cooled proton exchange membrane fuel cell stack. Prog. Nat. Sci. Mater. Int. 2024, 34, 1318–1326. [Google Scholar] [CrossRef]
- Chen, H.; Shi, E.; Zhang, R.; et al. Mechanisms and characterization of interzone mass transfer inhomogeneity in PEM fuel cells. Chem. Eng. J. 2024, 500, 157063. [Google Scholar] [CrossRef]
- Yan, X.; Hou, M.; Sun, L.; et al. The study on transient characteristic of proton exchange membrane fuel cell stack during dynamic loading. J. Power Sources 2007, 163, 966–970. [Google Scholar] [CrossRef]
- Loo, K.H.; Wong, K.H.; Tan, S.C.; et al. Characterization of the dynamic response of proton exchange membrane fuel cells–a numerical study. Int. J. Hydrog. Energy 2010, 35, 11861–11877. [Google Scholar] [CrossRef]
- National Technical Committee of Auto Standardization. GB/Z 44116-2024 Fuel cell engines and their key components—Durability test methods; Standardization Administration of China: Beijing, China, 2024. [Google Scholar]
- Kim, S.; Shimpalee, S.; Van Zee, J.W. Effect of flow field design and voltage change range on the dynamic behavior of PEMFCs. J. Electrochem. Soc. 2005, 152, A1265. [Google Scholar] [CrossRef]
Figure 1.
Schematic of undershoot voltage (a) and stabilization time (b) during the dynamic response of a fuel cell.
Figure 1.
Schematic of undershoot voltage (a) and stabilization time (b) during the dynamic response of a fuel cell.
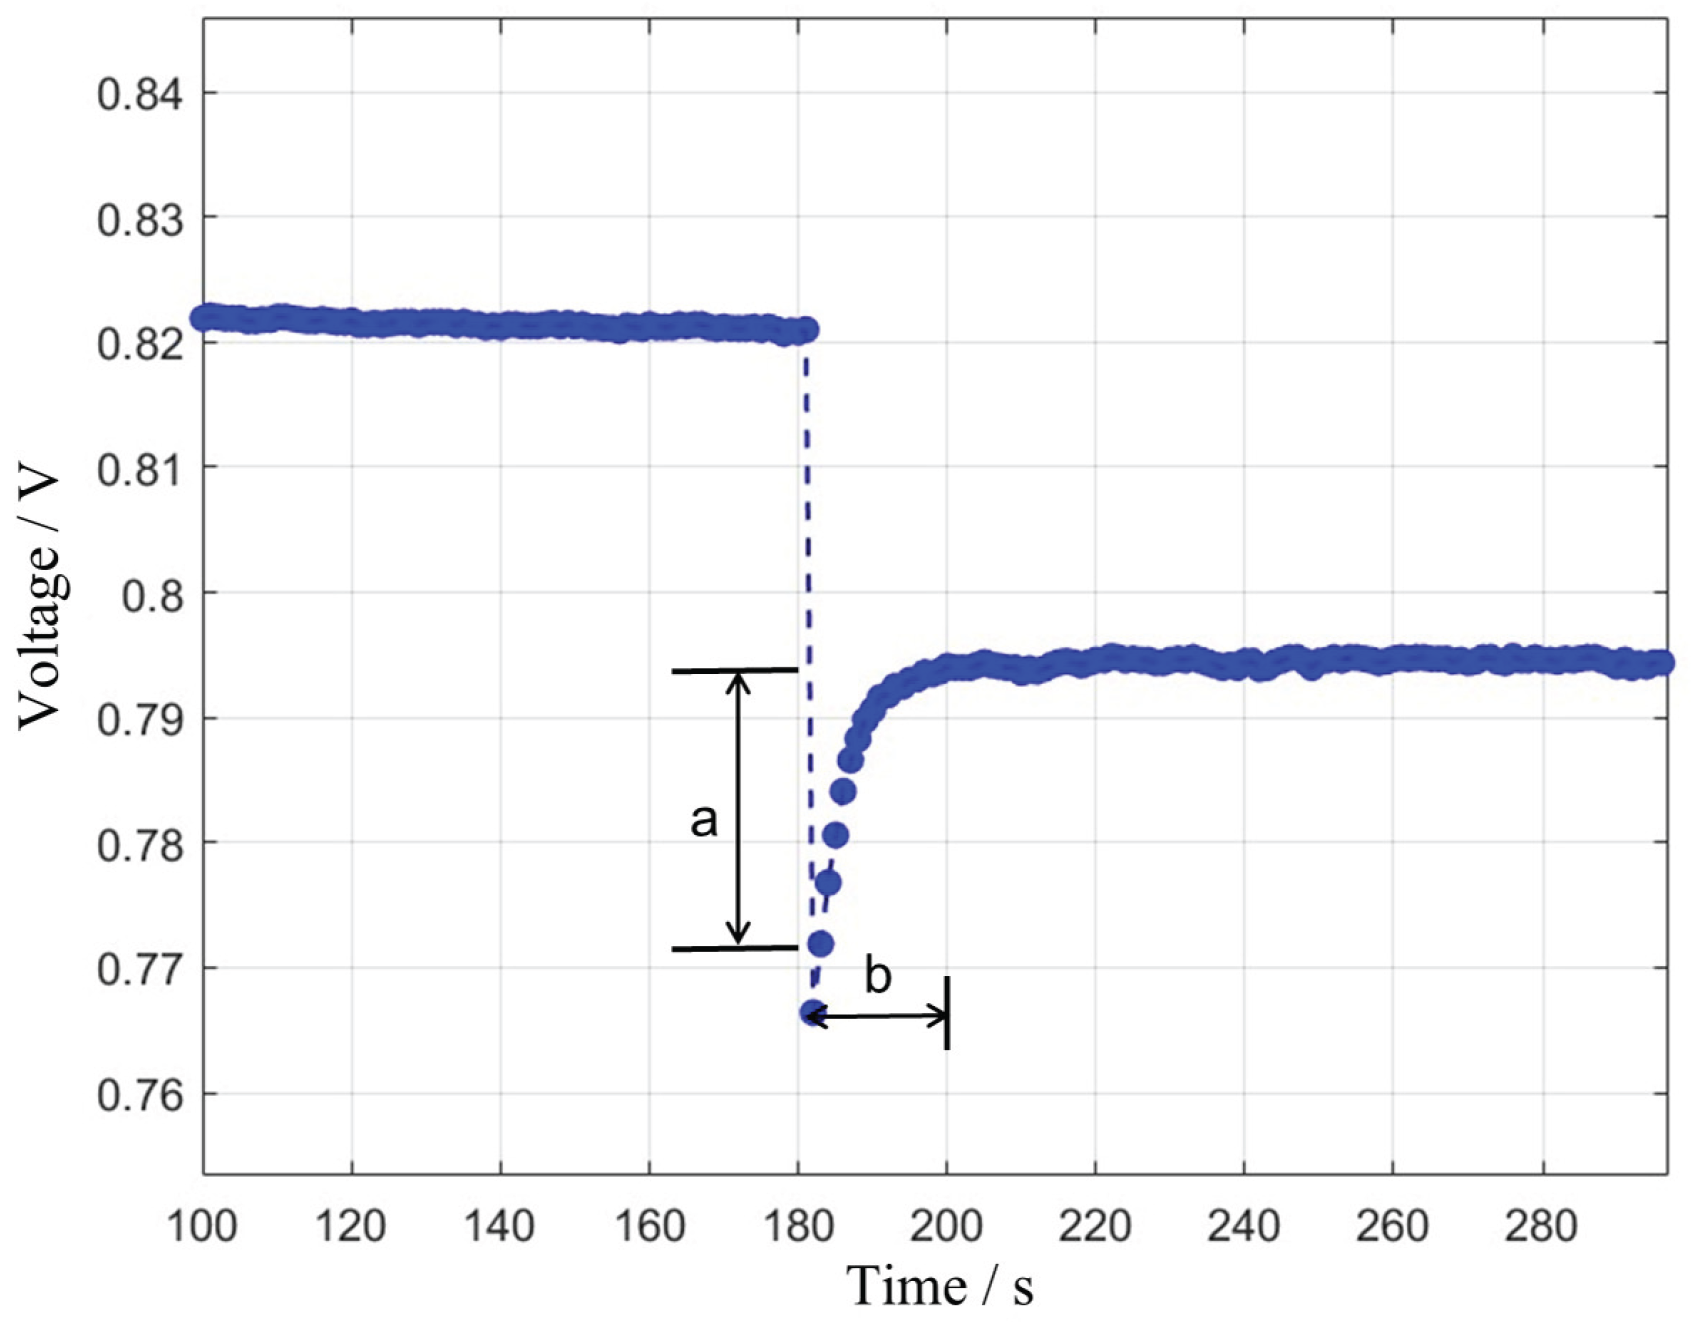
Figure 2.
Durability test setup.
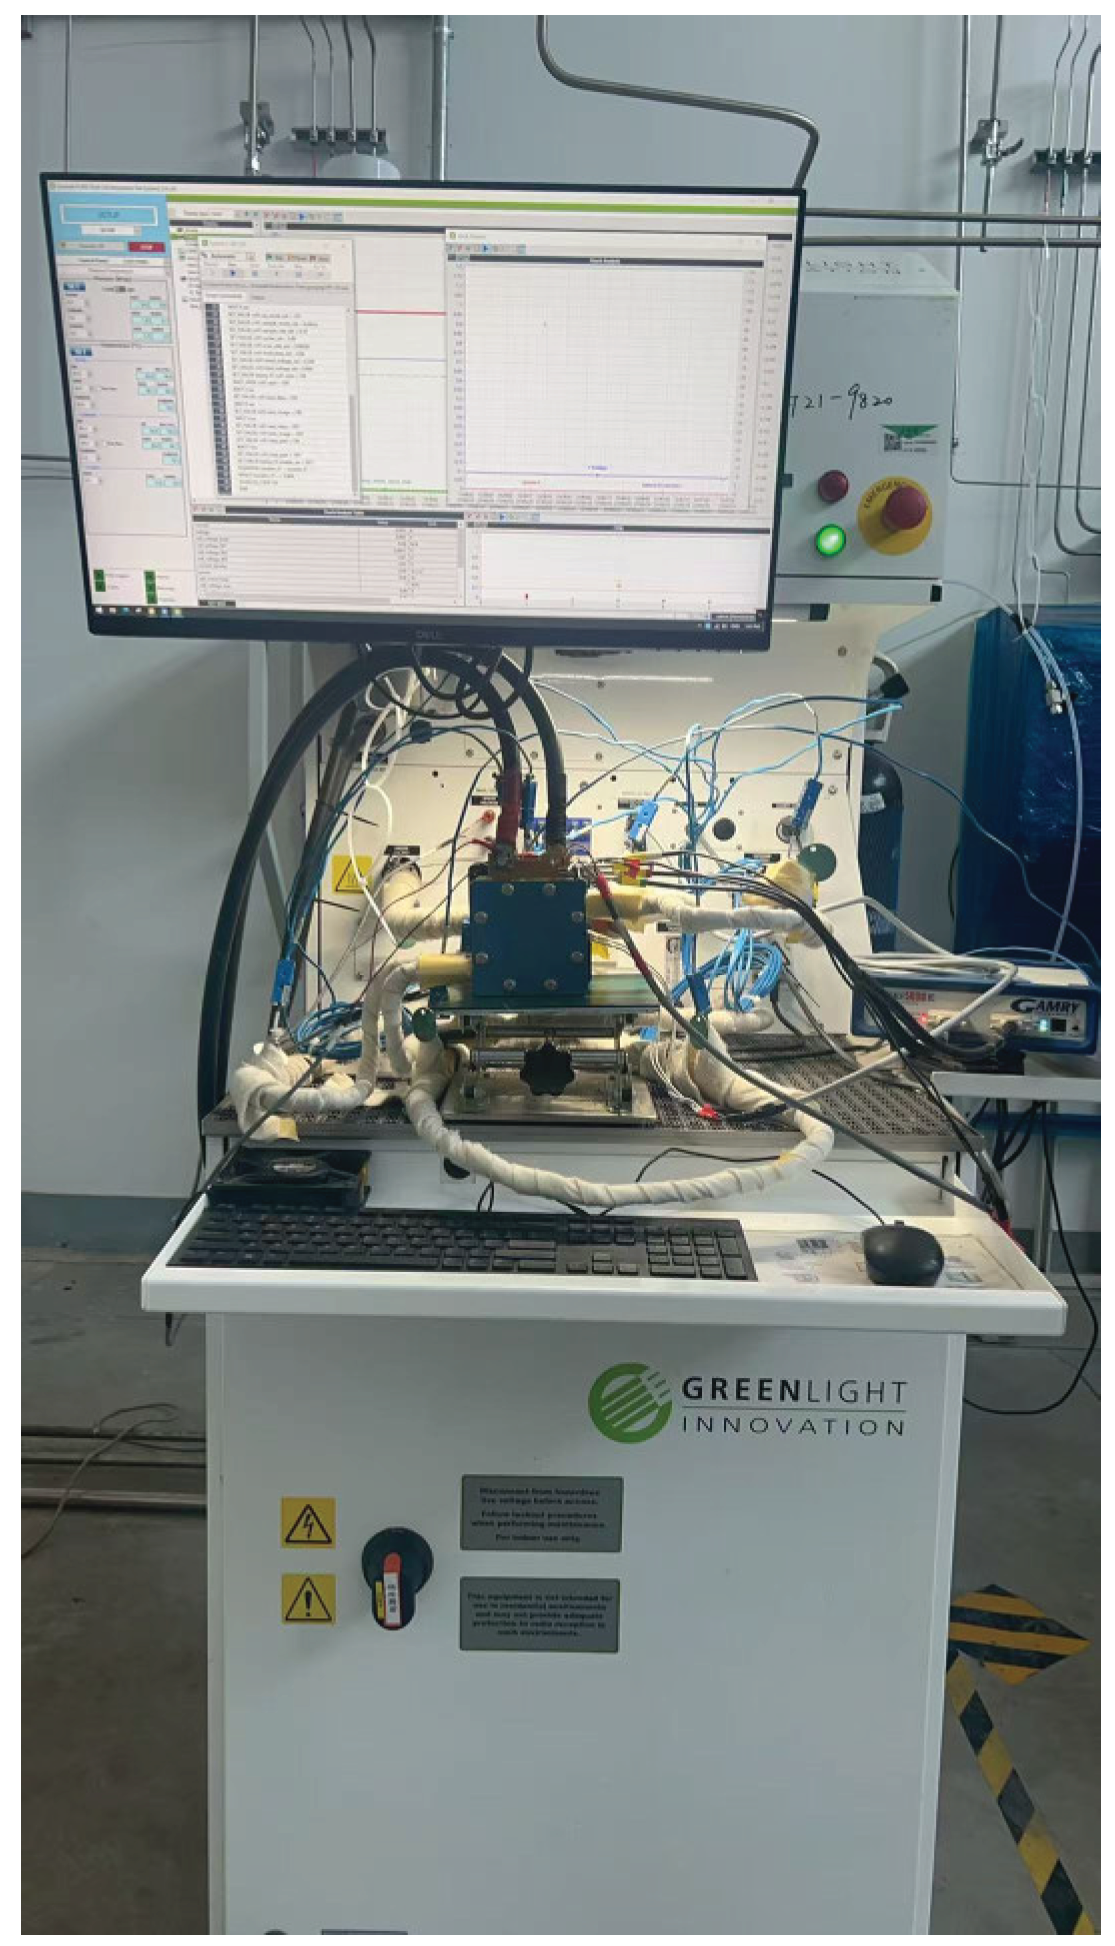
Figure 3.
The fuel cell used in the experiment.
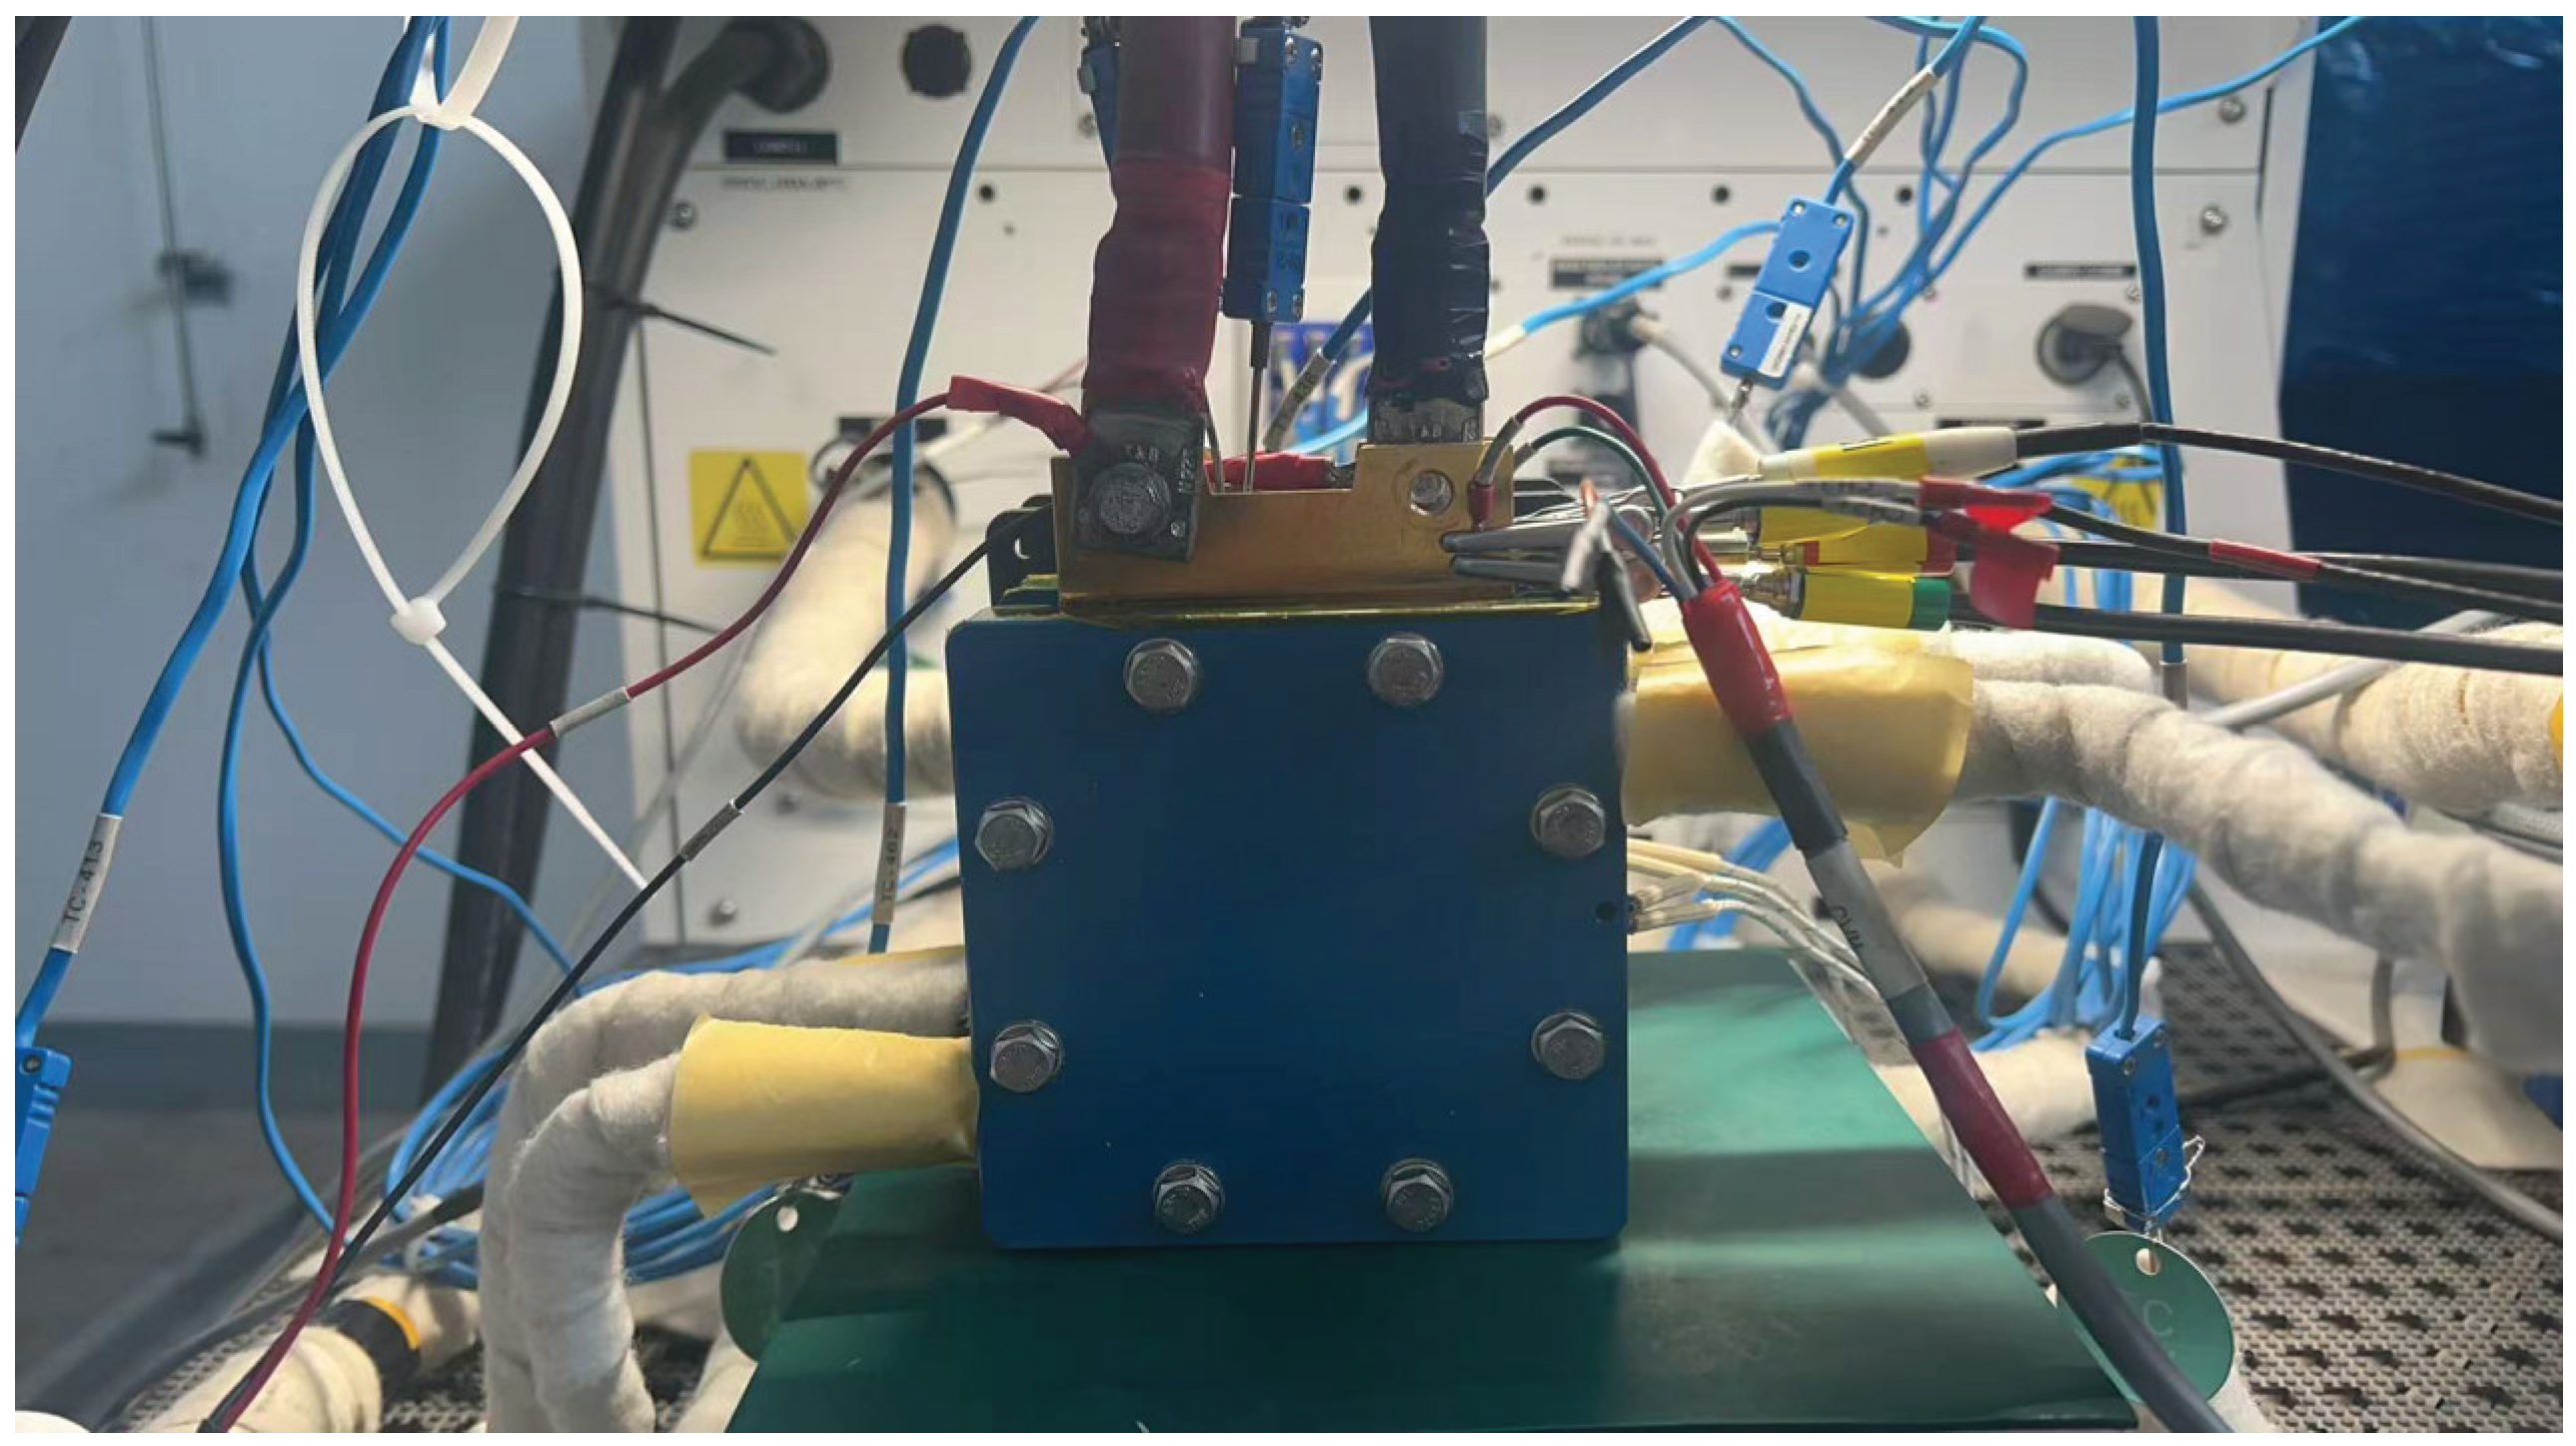
Figure 4.
Fuel cell durability cycle conditions.
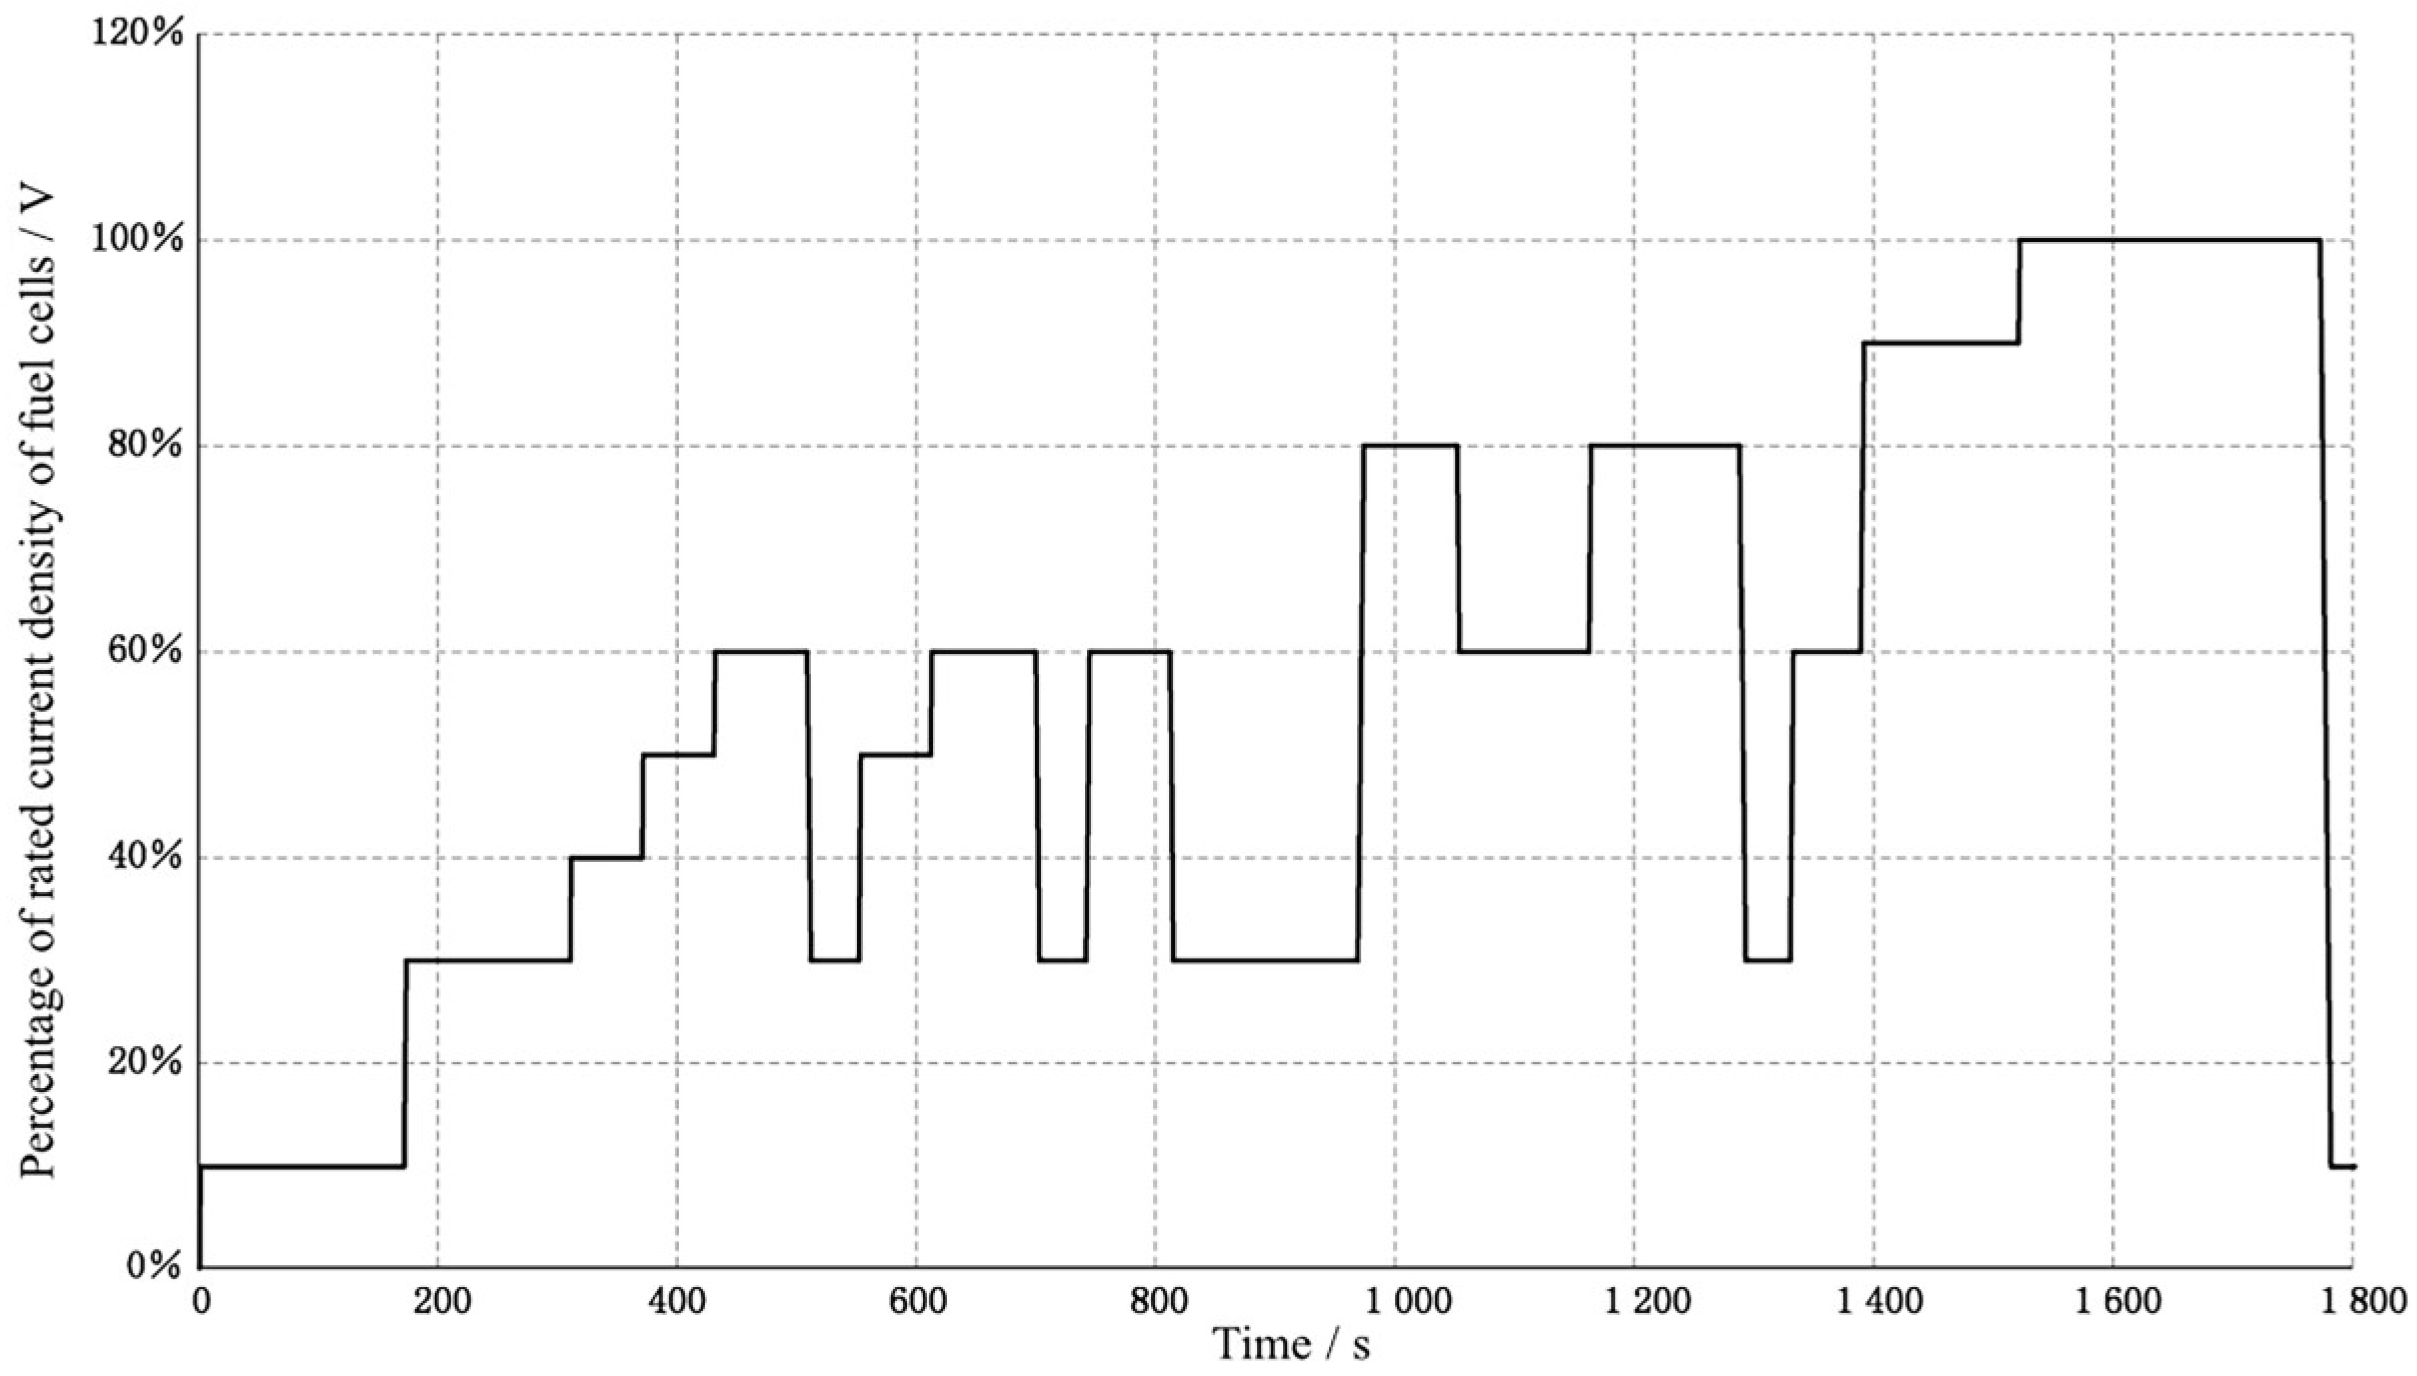
Figure 5.
Polarization curves at different durability test durations: (a) Cell A; (b) Cell B; (c) Cell C; (d) Cell D.
Figure 5.
Polarization curves at different durability test durations: (a) Cell A; (b) Cell B; (c) Cell C; (d) Cell D.
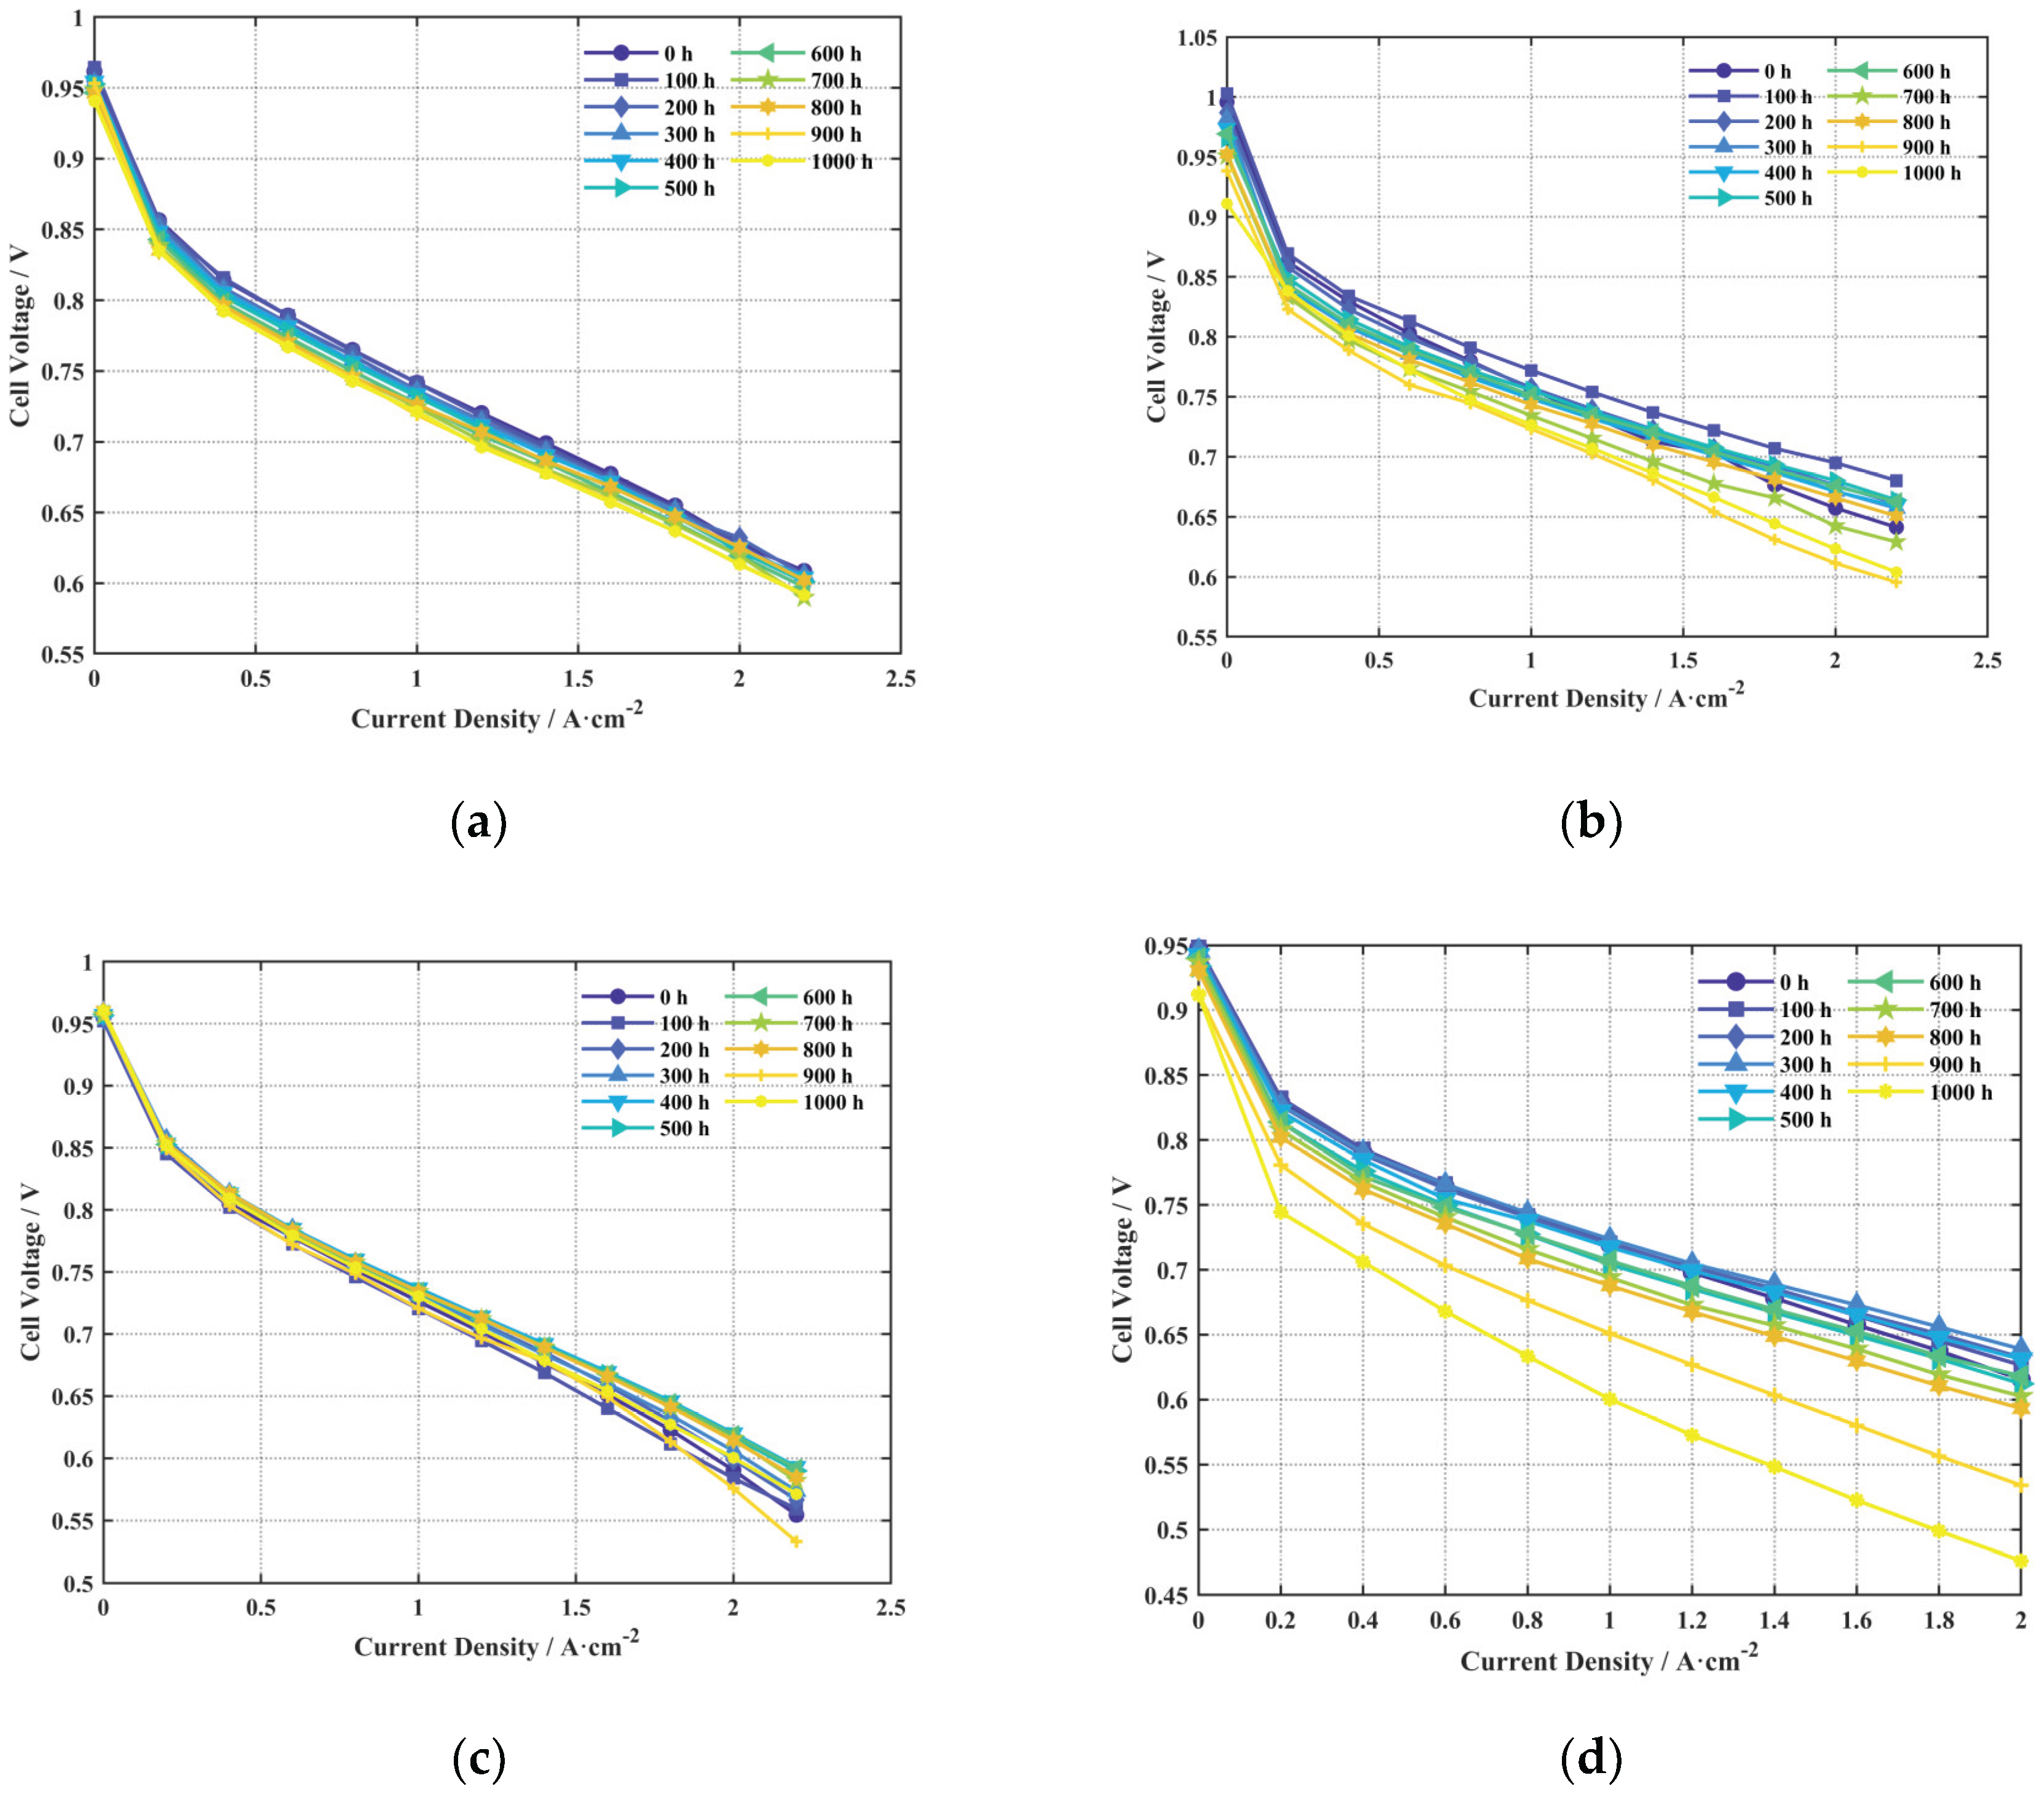
Figure 6.
Voltage vs. durability test duration at rated current density for (a) Cell A, (b) Cell B, (c) Cell C, and (d) Cell D.
Figure 6.
Voltage vs. durability test duration at rated current density for (a) Cell A, (b) Cell B, (c) Cell C, and (d) Cell D.
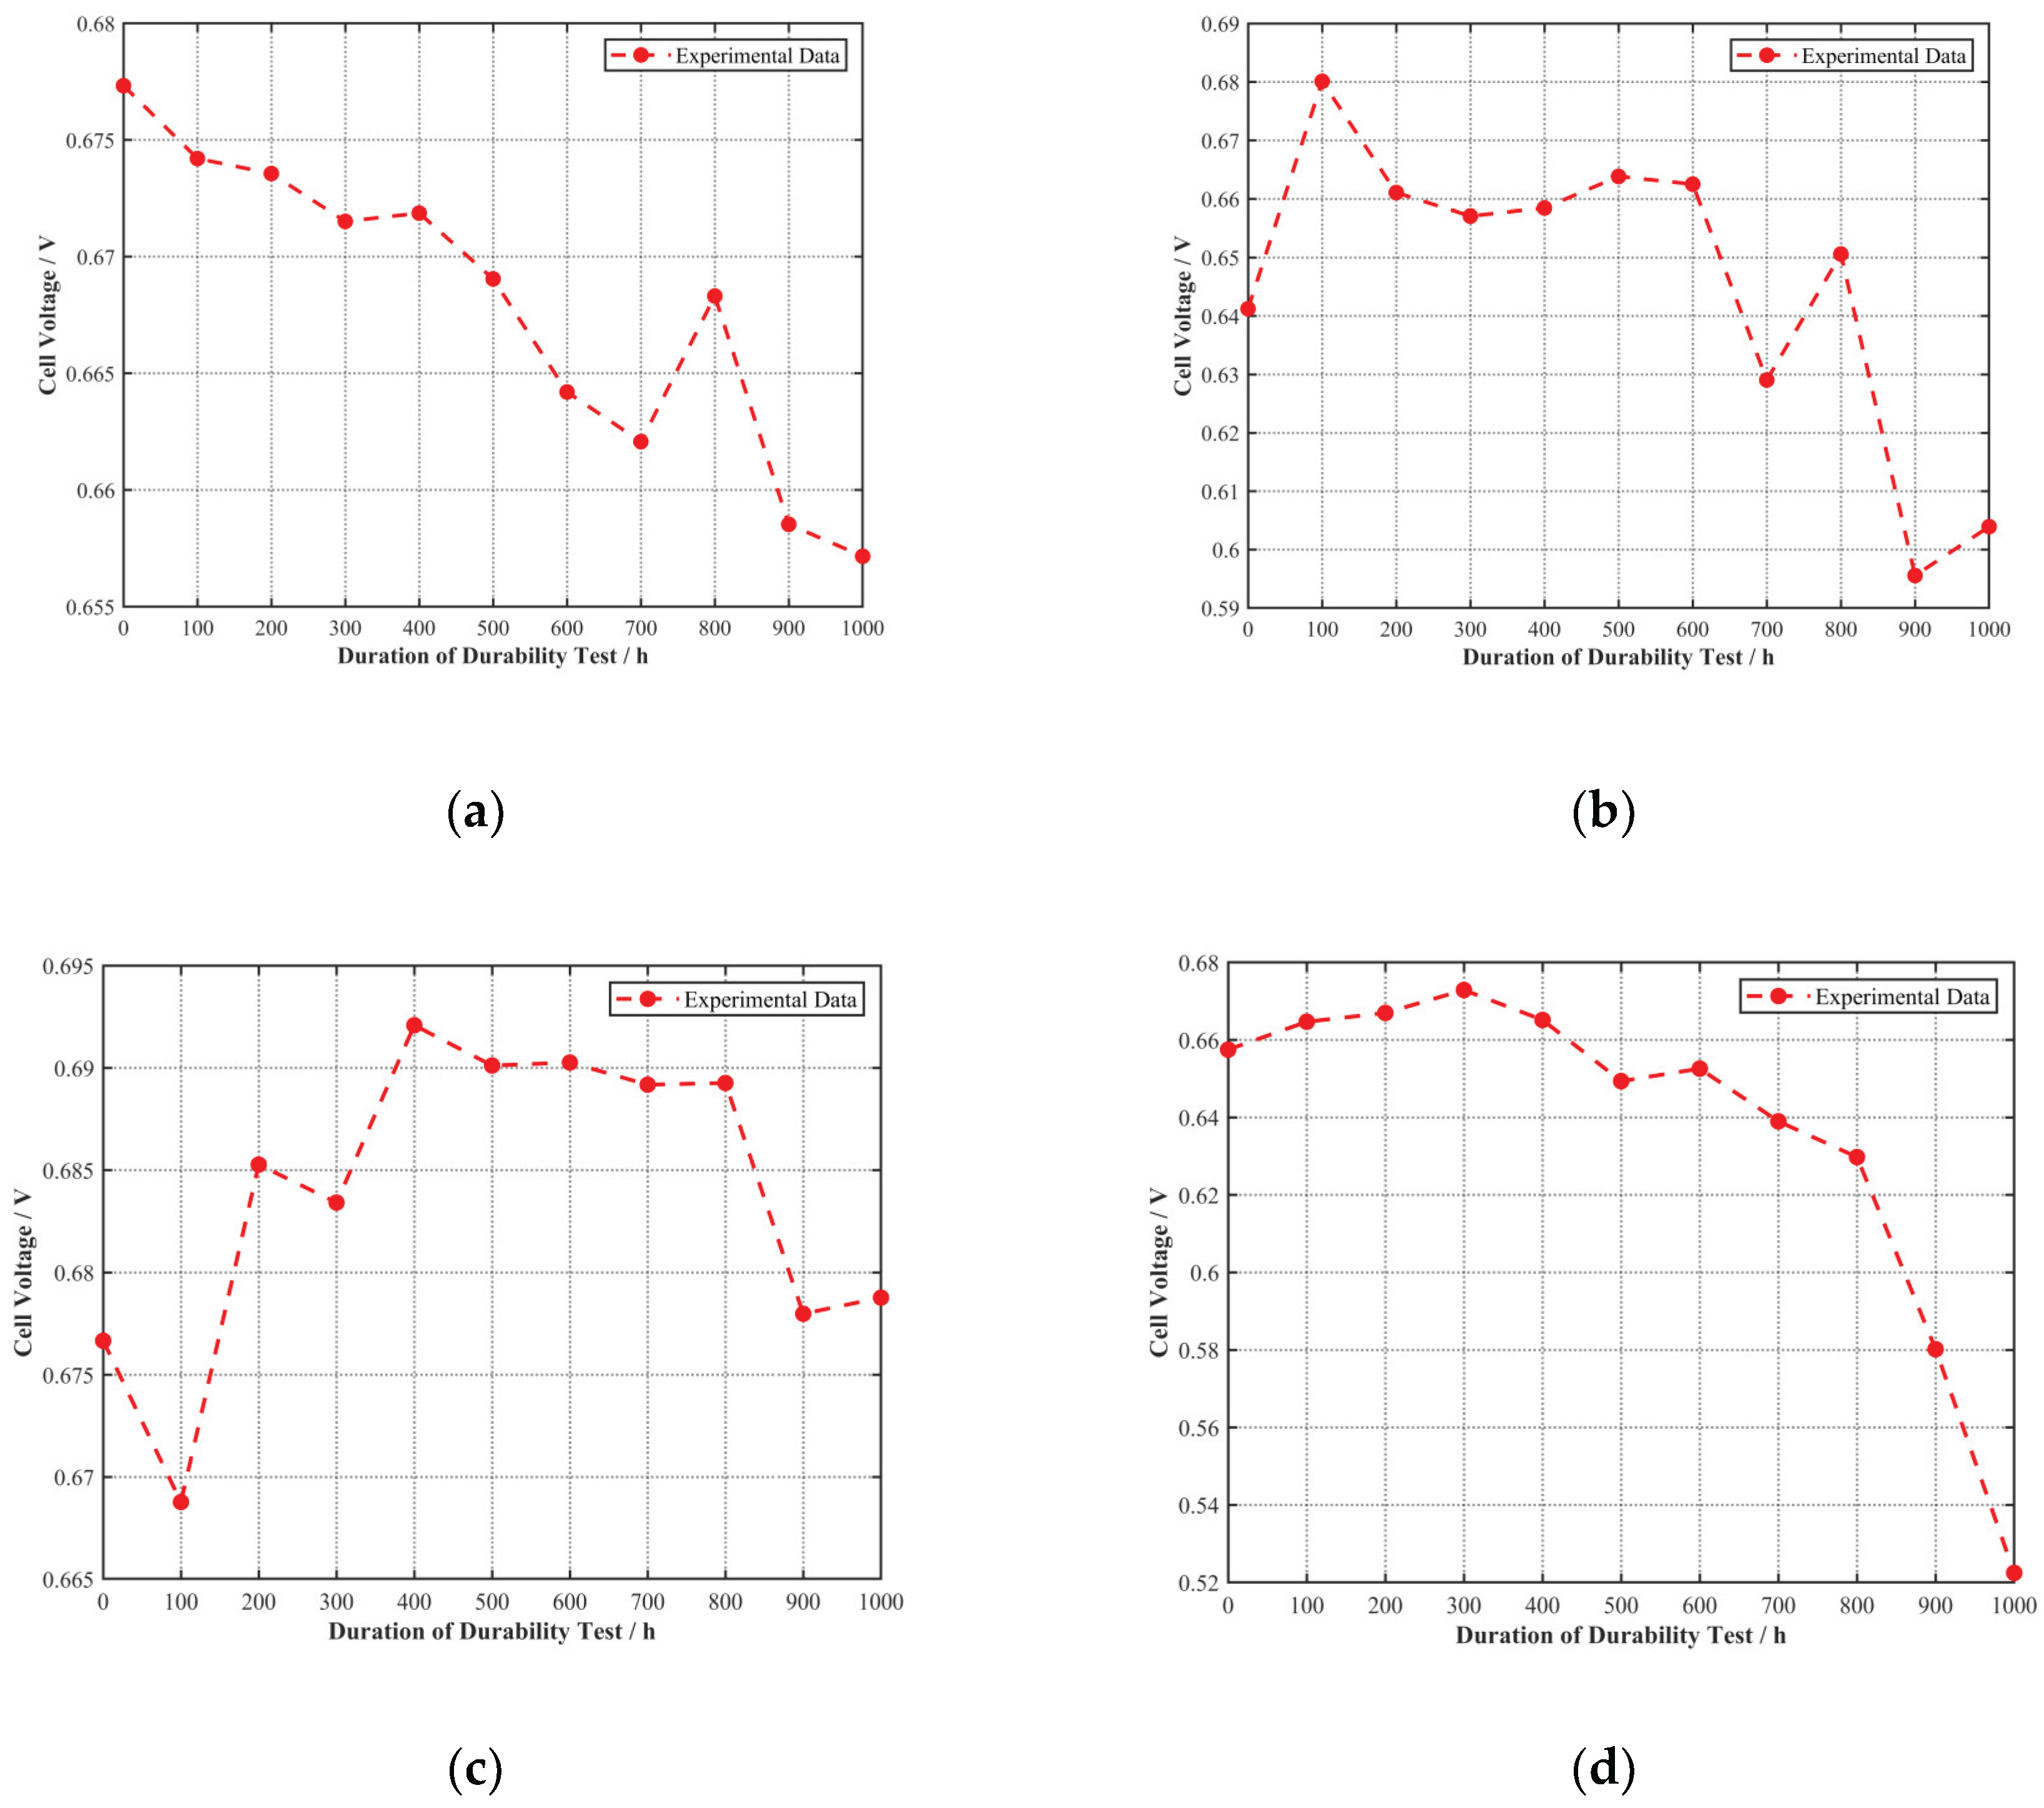
Figure 7.
Undershoot voltage distribution for (a) Cell A, (b) Cell B, (c) Cell C, and (d) Cell D.
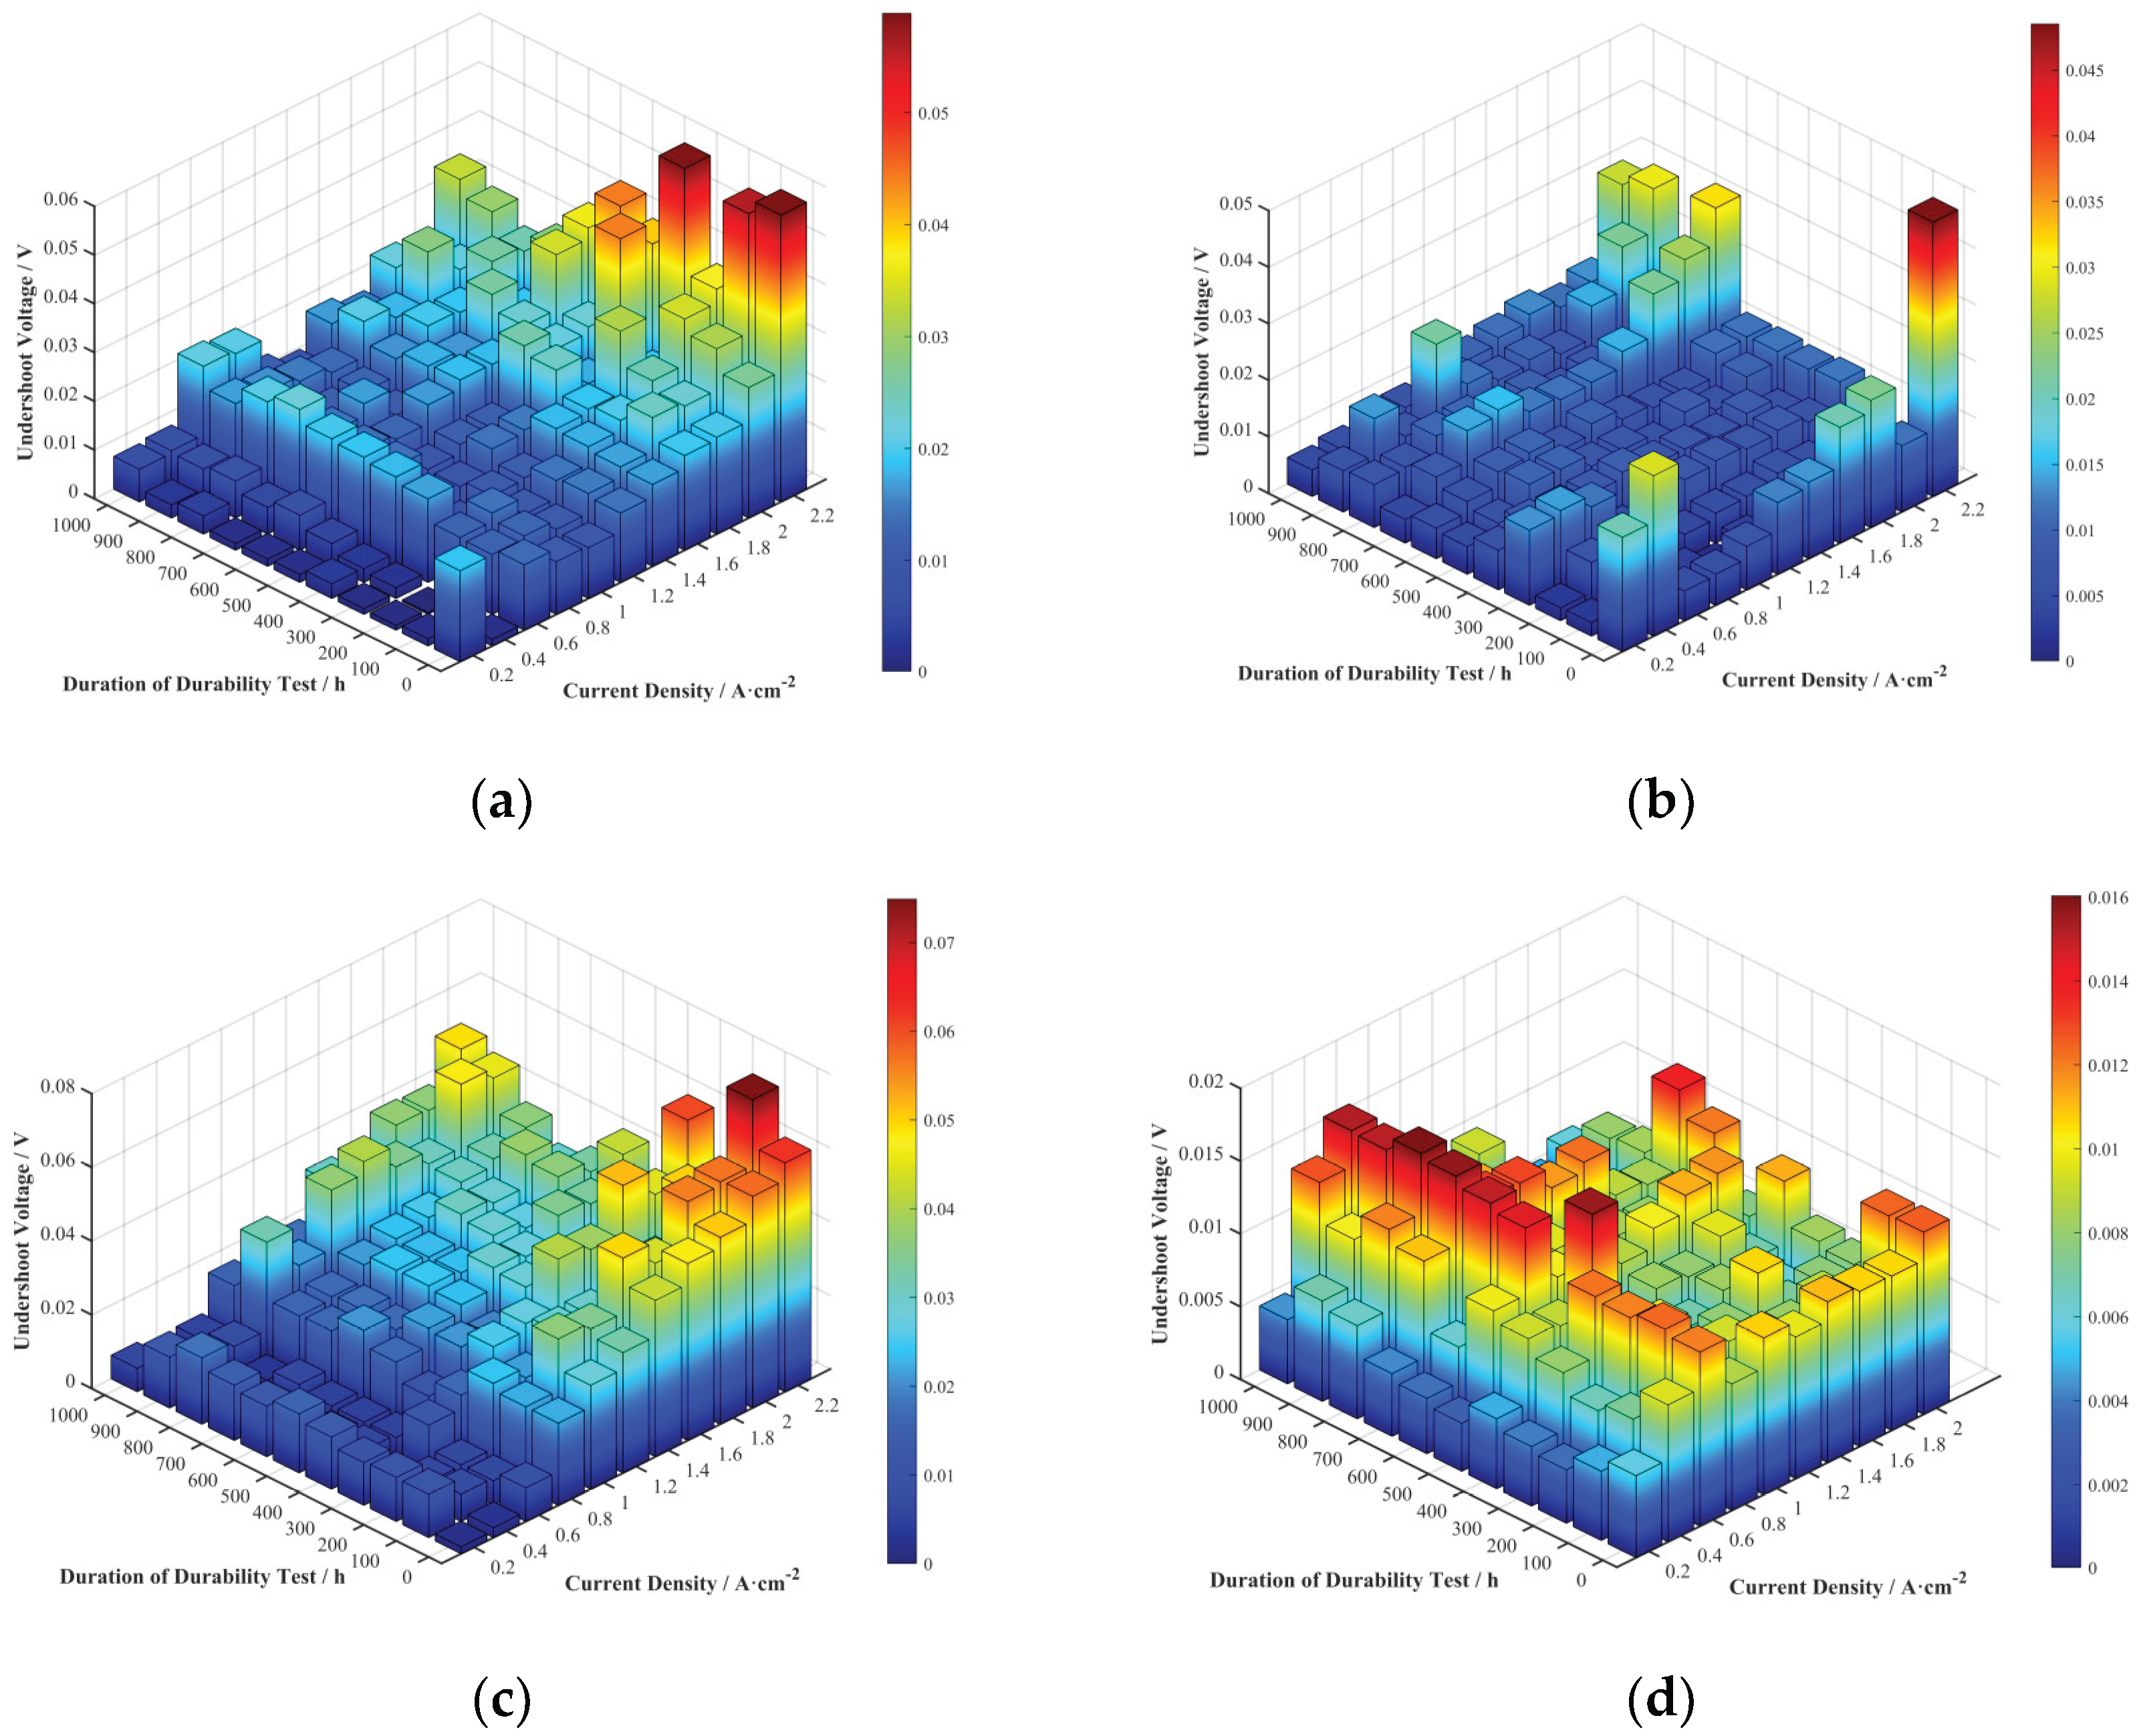
Figure 8.
Average undershoot voltage at each current density (averaged over all durability test durations) for (a) Cell A, (b) Cell B, (c) Cell C, and (d) Cell D.
Figure 8.
Average undershoot voltage at each current density (averaged over all durability test durations) for (a) Cell A, (b) Cell B, (c) Cell C, and (d) Cell D.
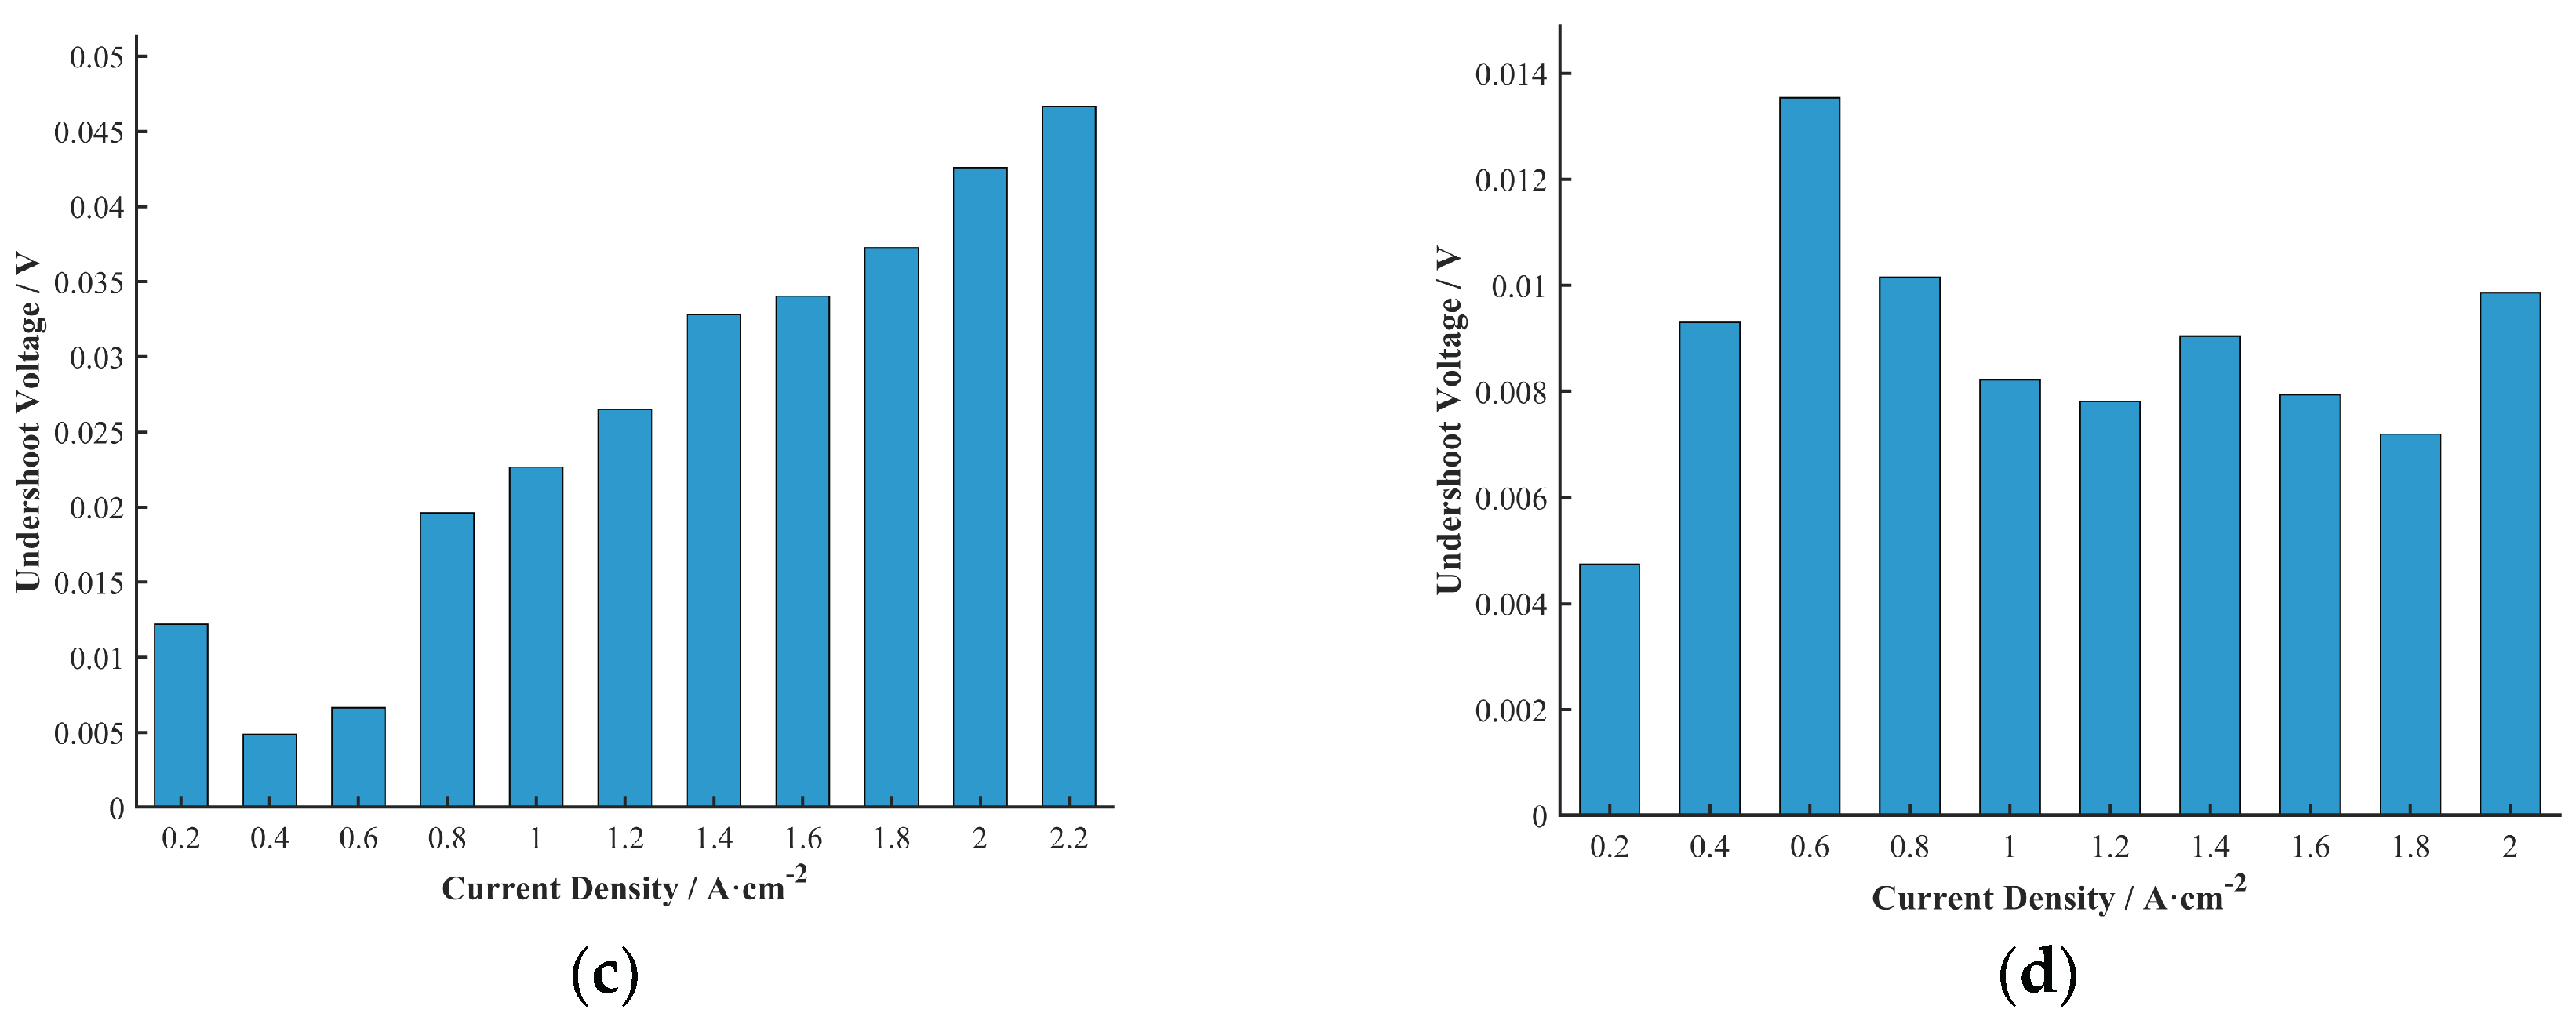
Figure 9.
Average undershoot voltage at each durability test duration (averaged over all current densities) for (a) Cell A, (b) Cell B, (c) Cell C, and (d) Cell D.
Figure 9.
Average undershoot voltage at each durability test duration (averaged over all current densities) for (a) Cell A, (b) Cell B, (c) Cell C, and (d) Cell D.
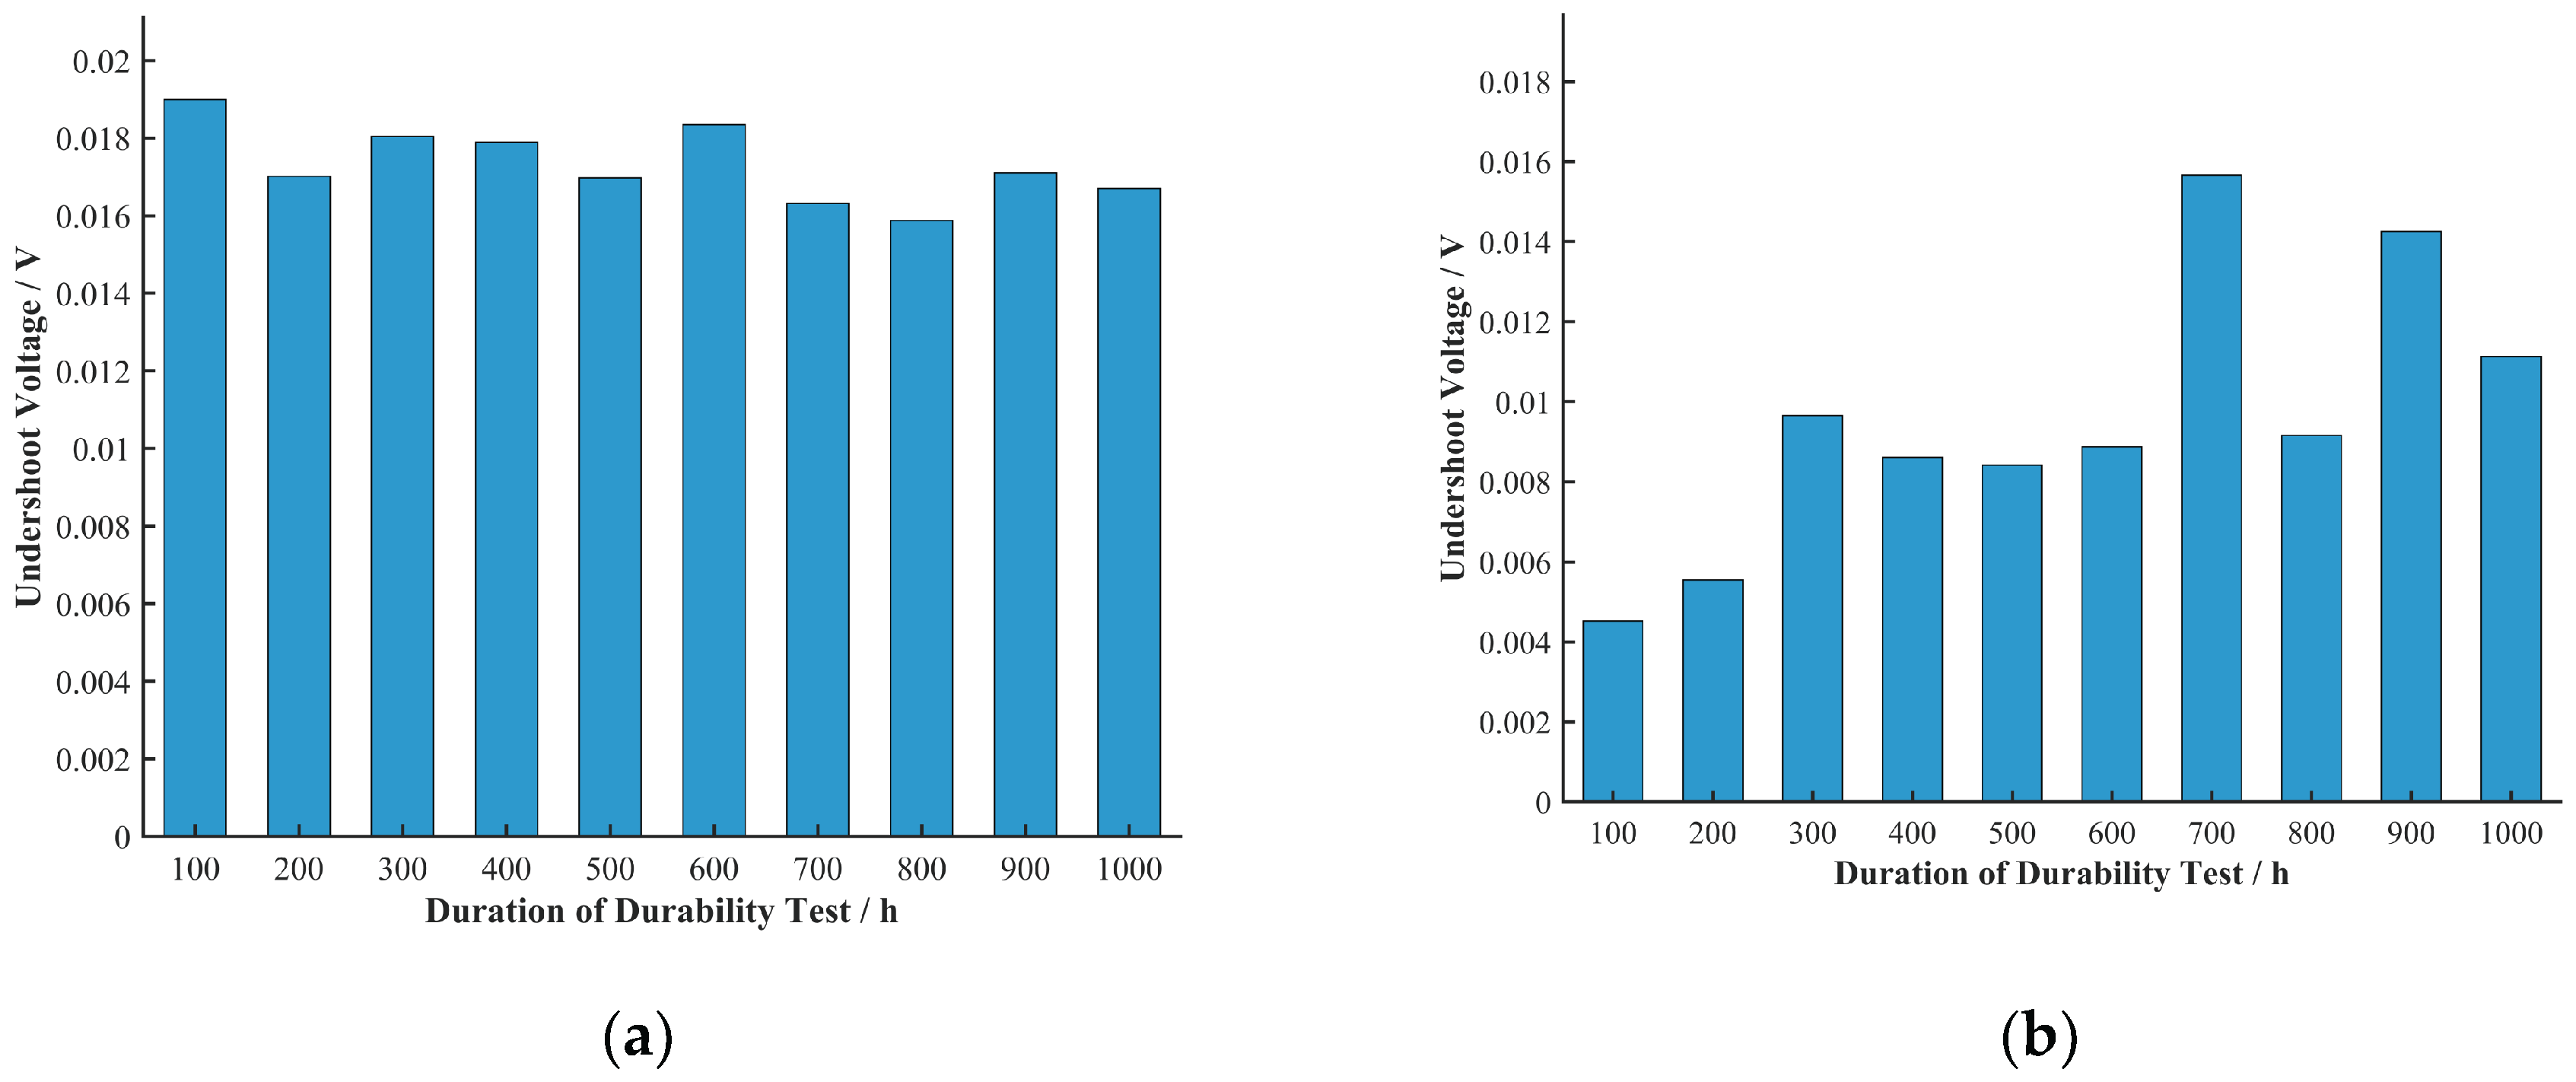
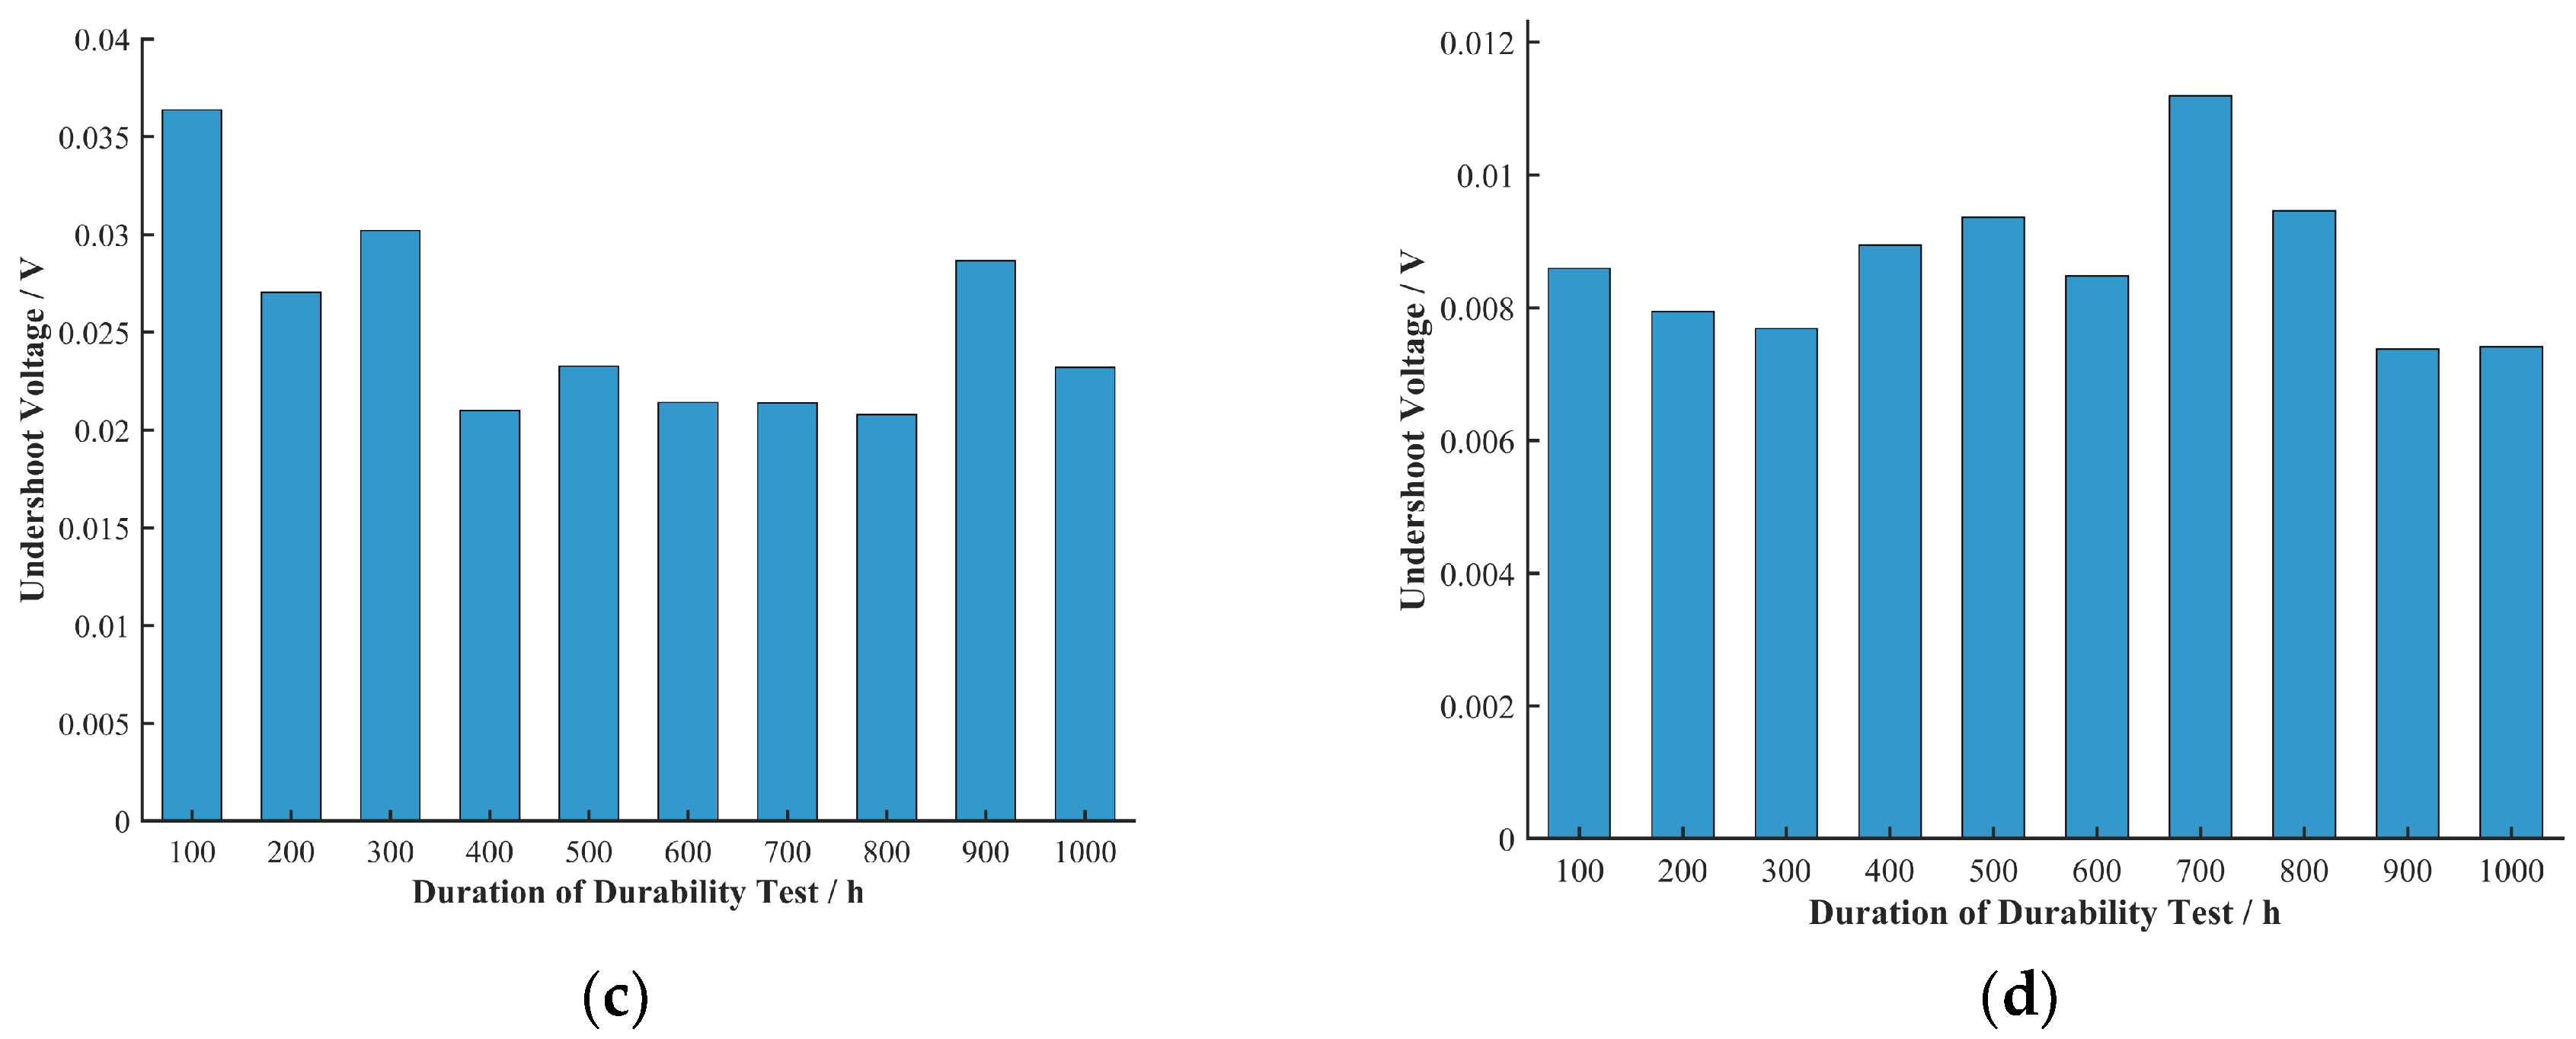
Figure 10.
Stabilization time distribution for (a) Cell A, (b) Cell B, (c) Cell C, and (d) Cell D.
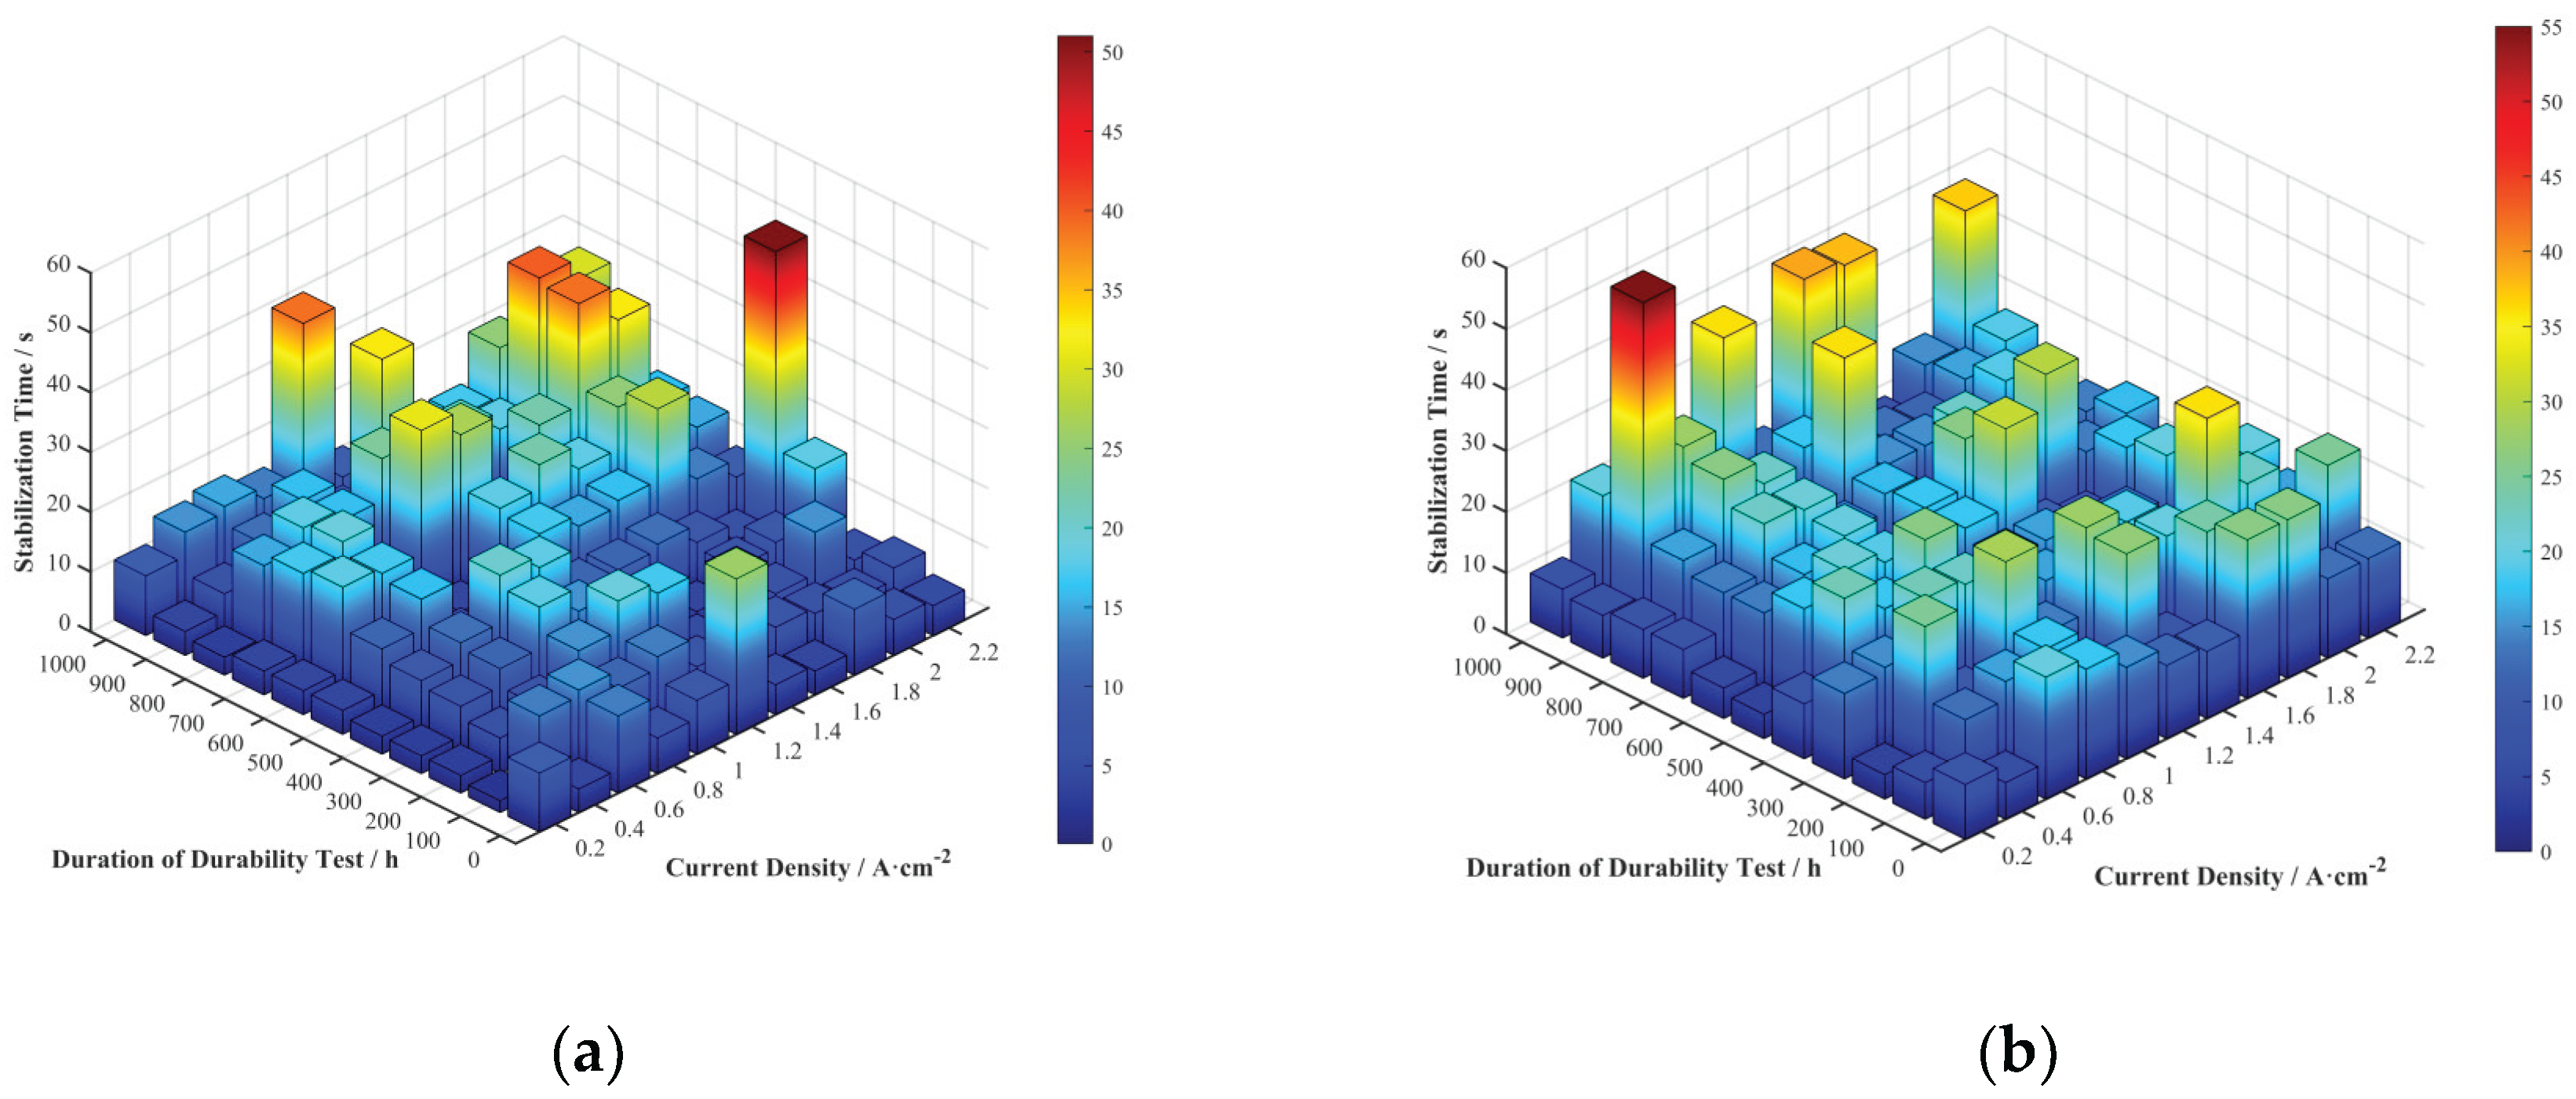
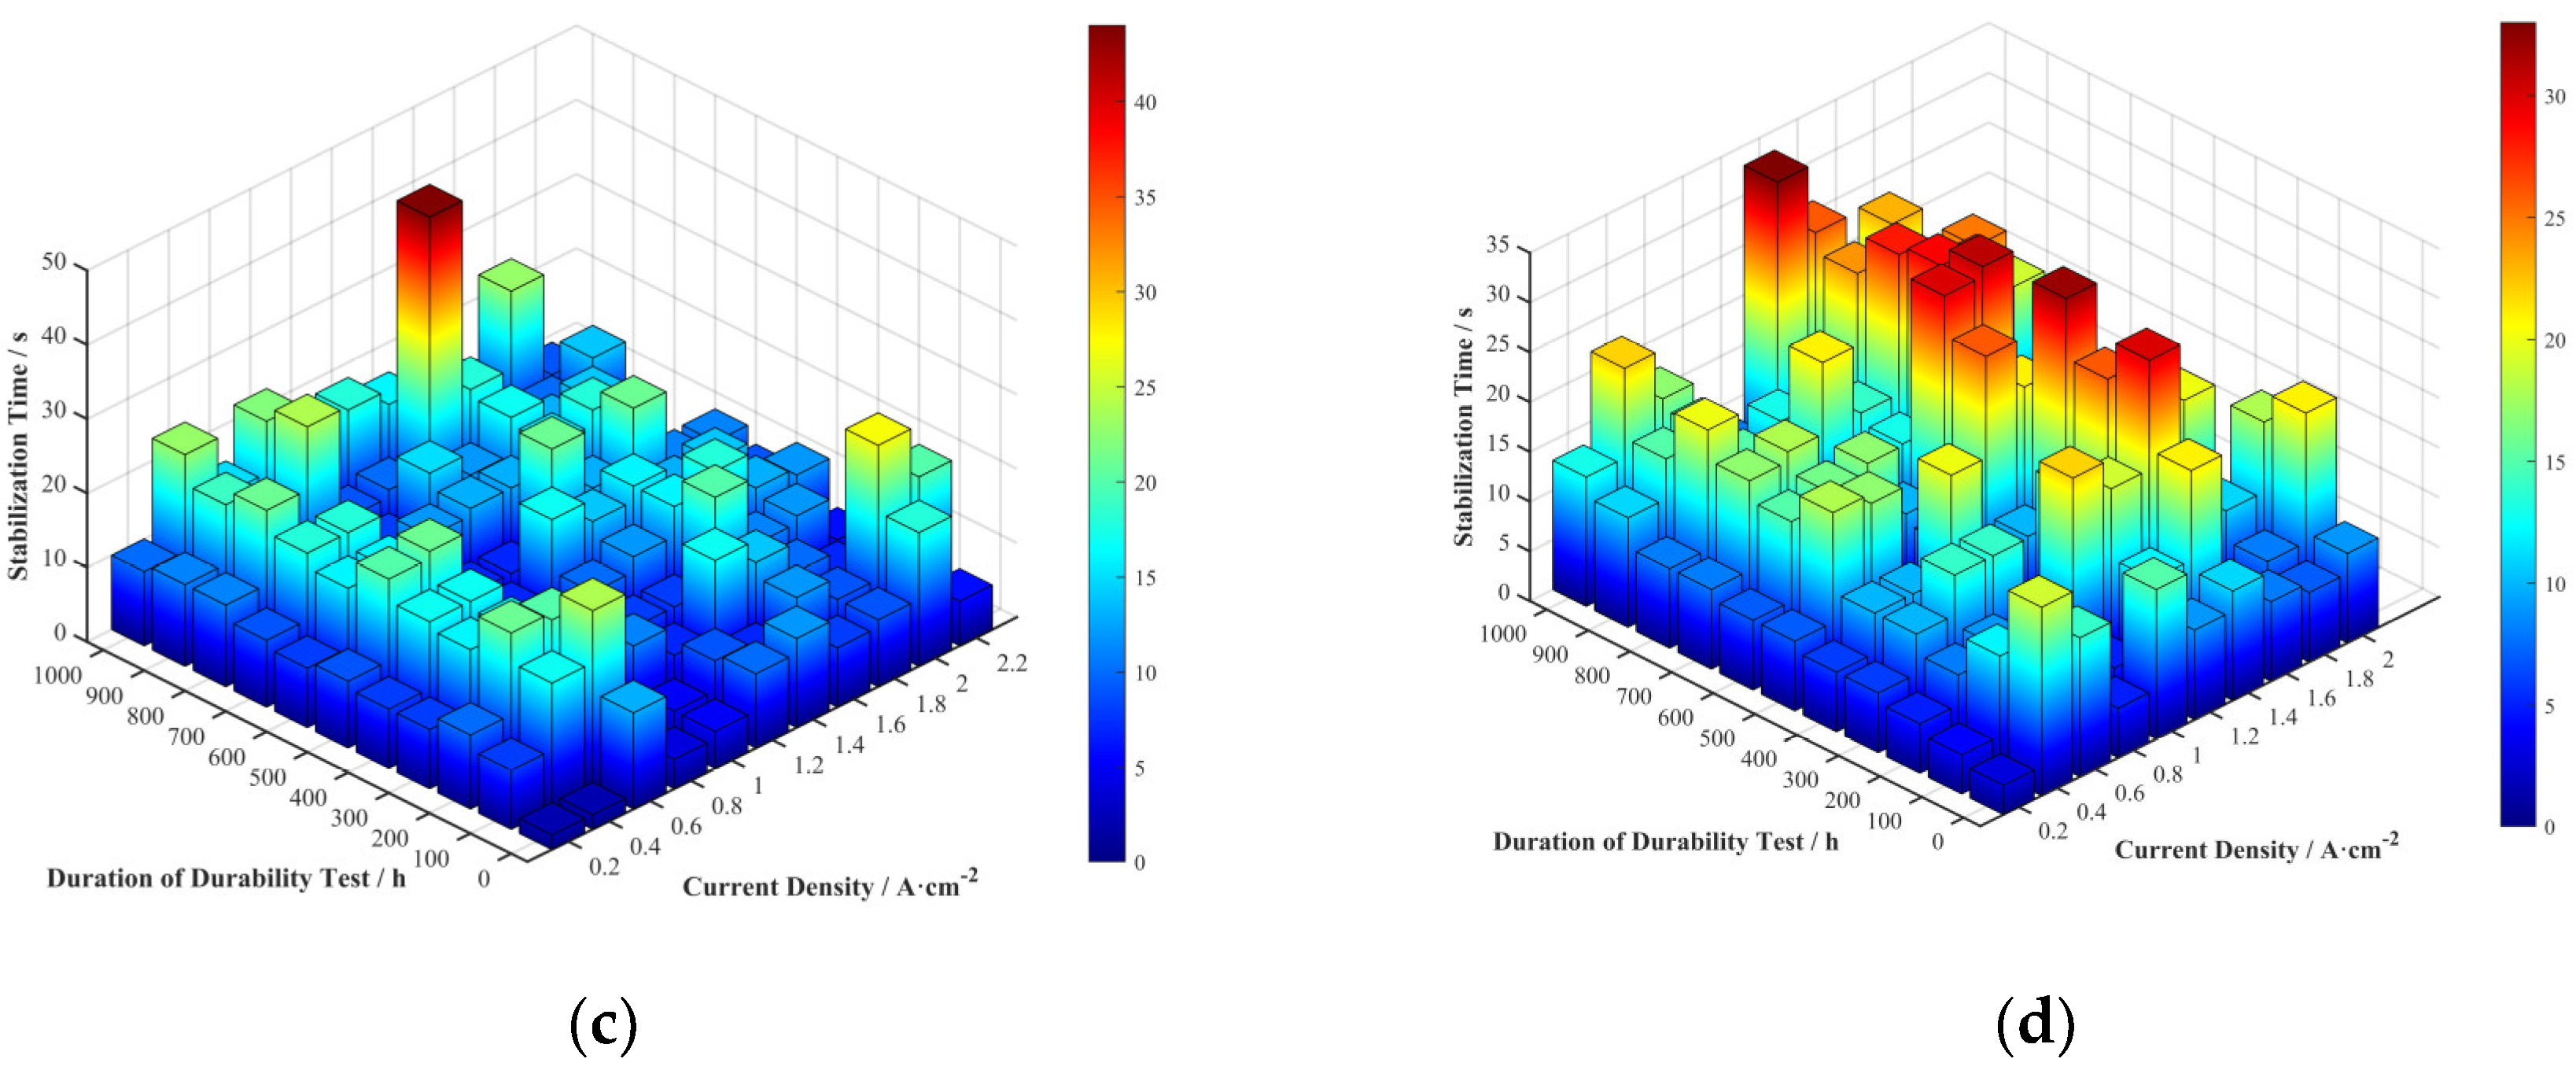
Figure 11.
Average stabilization time at each current density (averaged over all durability test durations) for (a) Cell A, (b) Cell B, (c) Cell C, and (d) Cell D.
Figure 11.
Average stabilization time at each current density (averaged over all durability test durations) for (a) Cell A, (b) Cell B, (c) Cell C, and (d) Cell D.
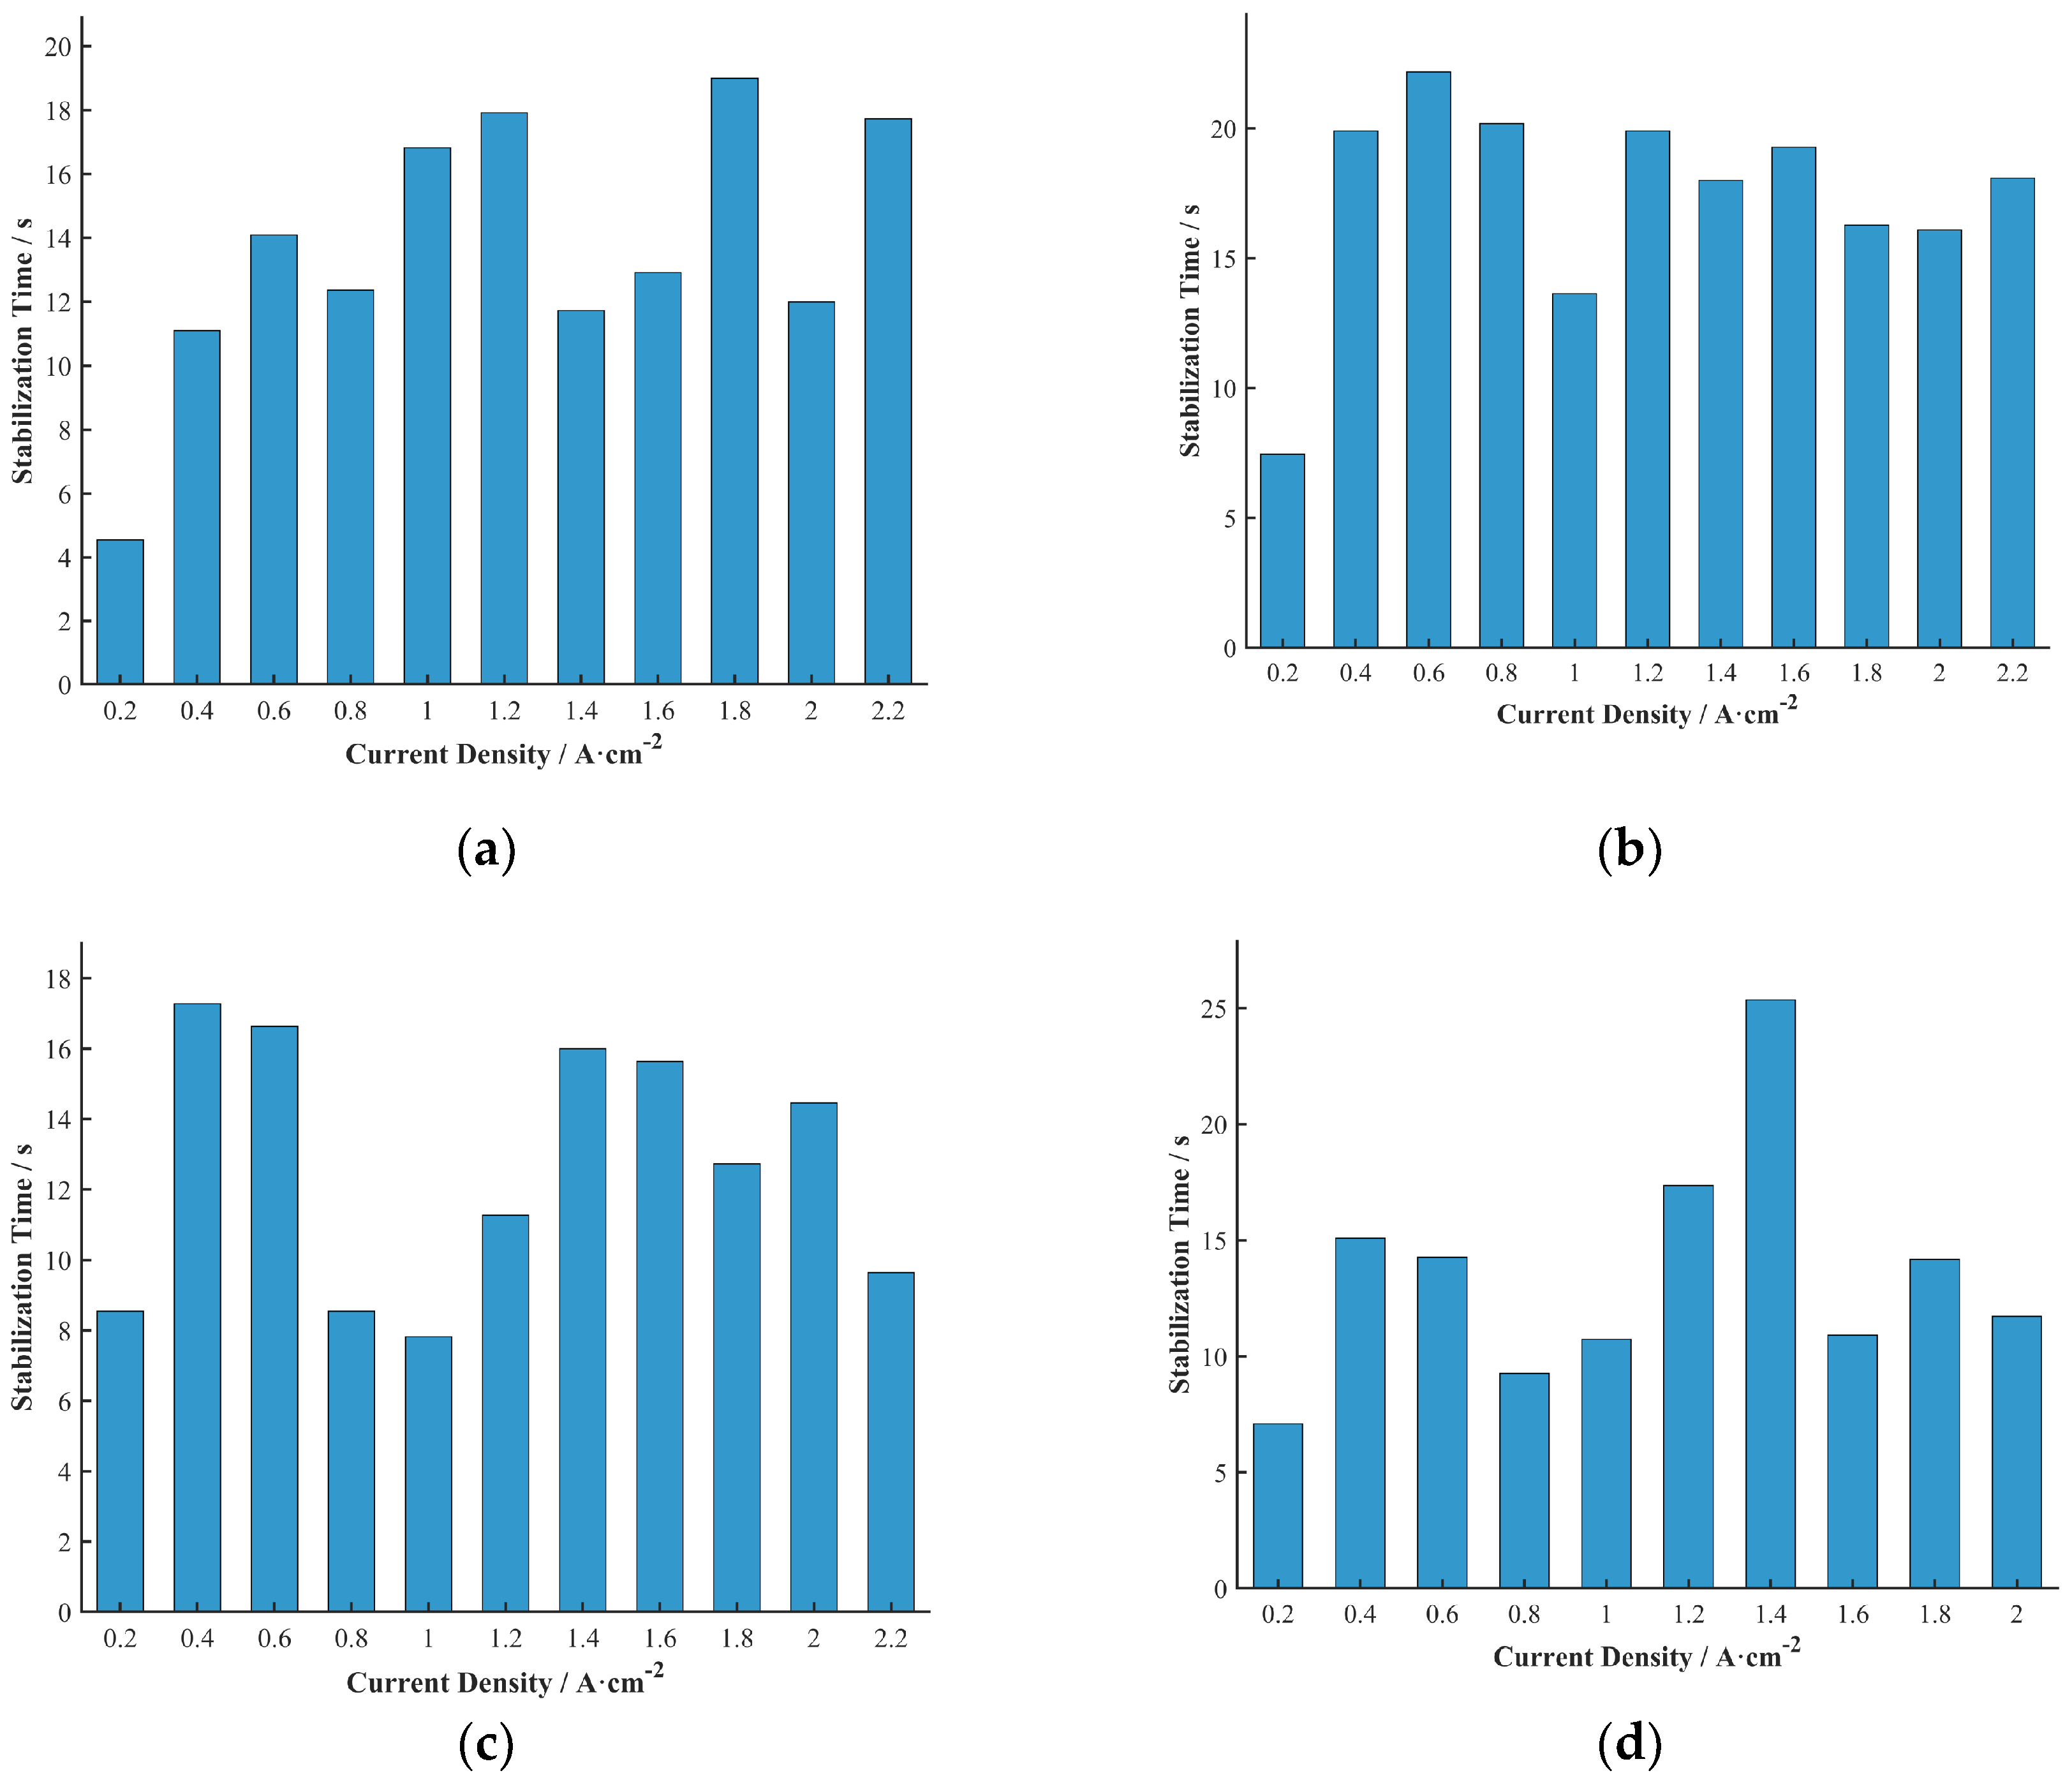
Figure 12.
Average stabilization time at each durability test duration (averaged over all current densities) for (a) Cell A, (b) Cell B, (c) Cell C, and (d) Cell D.
Figure 12.
Average stabilization time at each durability test duration (averaged over all current densities) for (a) Cell A, (b) Cell B, (c) Cell C, and (d) Cell D.
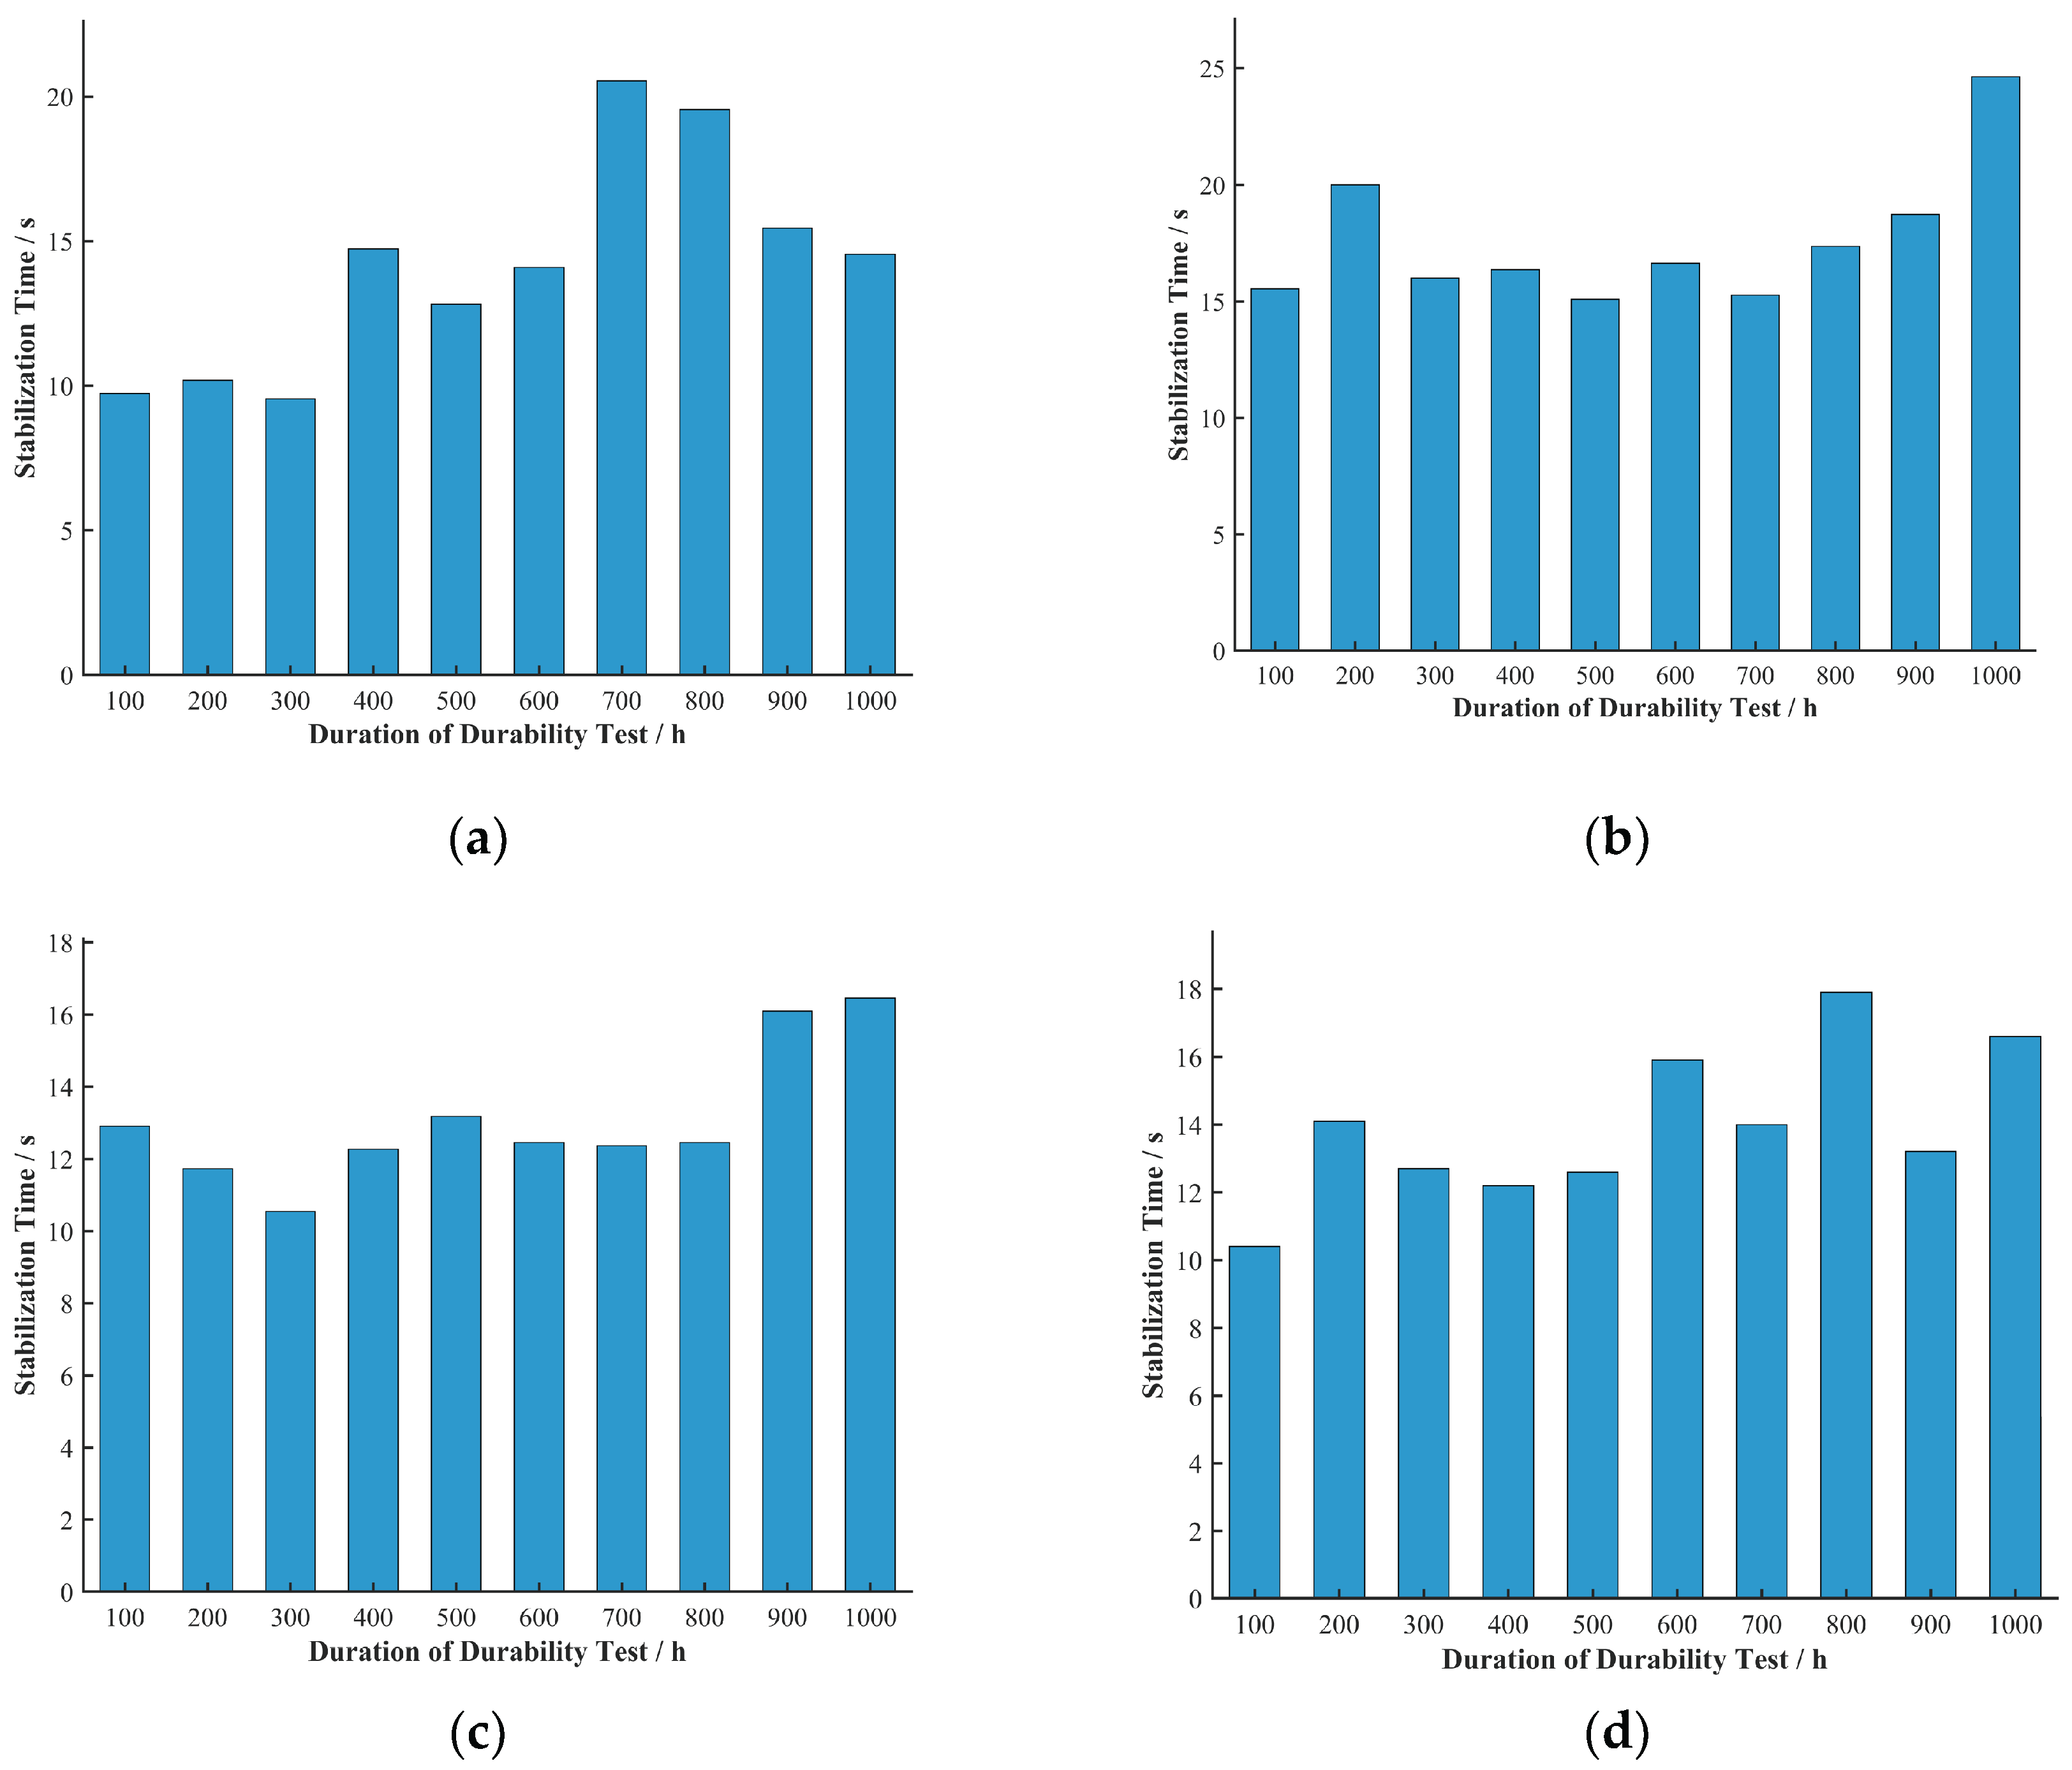

Table 1.
Key parameters of the tested fuel cells.
| Cell A | Cell B | Cell C | Cell D | |
|---|---|---|---|---|
| Rated current density (A/cm2) | 1.6 | 2.2 | 1.4 | 1.6 |
| Active area (cm2) | 25 | 25 | 25 | 25 |
Table 2.
Operating parameters for the polarization curve tests.
| Activation | Purge | Polarization curve test | |
|---|---|---|---|
| Anode gas | H2 | H2 | H2 |
| Cathode gas | Air | N2 | Air |
| Anode stoichiometry | ≤ 1.8 | -- | ≤ 1.8 |
| Cathode stoichiometry | ≤ 2.0 | -- | ≤ 2.0 |
| Anode flow rate (NLPM) | -- | 0.13 | -- |
| Cathode flow rate (NLPM) | -- | 0.35 | -- |
| Anode/Cathode Inlet Temp. (°C) | 80 | 80 | 80 |
| Anode/Cathode Relative Humidity (%) | 30~100 | 30~100 | 30~100 |
| Anode/Cathode Inlet Pressure (kPag) | 150 | 150 | 150 |
Table 3.
Reversible recovery procedure.
| Procedure | Anode gas (Flow, L/min) | Cathode gas (Flow, L/min) | Duration (s) | |
|---|---|---|---|---|
| 1 | N2 purge | N2 (1) | N2 (2) | 240 |
| 2 | Air purge | None (0) | Air (4) | 900 |
| 3 | N2 purge | N2 (1) | N2 (2) | 240 |
| 4 | H2 purge | H2 (2) | None (0) | 600 |
| 5 | H2/Air purge | H2 (2) | Air (4) | 5 |
Disclaimer/Publisher’s Note: The statements, opinions and data contained in all publications are solely those of the individual author(s) and contributor(s) and not of MDPI and/or the editor(s). MDPI and/or the editor(s) disclaim responsibility for any injury to people or property resulting from any ideas, methods, instructions or products referred to in the content. |
© 2025 by the authors. Licensee MDPI, Basel, Switzerland. This article is an open access article distributed under the terms and conditions of the Creative Commons Attribution (CC BY) license (http://creativecommons.org/licenses/by/4.0/).
Copyright: This open access article is published under a Creative Commons CC BY 4.0 license, which permit the free download, distribution, and reuse, provided that the author and preprint are cited in any reuse.


