Submitted:
15 July 2025
Posted:
16 July 2025
You are already at the latest version
Abstract
Environmental salinity is a critical factor influencing the physiological and metabolic processes of teleosts. Despite its importance, the molecular mechanisms underlying these responses, particularly those involving specific signaling pathways and gene expression regulation, remain poorly understood. To elucidate the role of lipid metabolism in osmotic regulation, the present study investigated the effects of varying salinity levels (2, 20, 40, and 60 ppt) on growth performance and metabolic status, including the biosynthesis of long-chain (LC-FA) and very long-chain fatty acids (VLC-FA) in neural tissues (brain and eyes), of the euryhaline fish Fundulus heteroclitus over a 62-day period. The findings revealed multiple physiological adaptations to salinity variation, encompassing both molecular and metabolic responses. Salinity had a significant impact on growth performance, with fish exposed to the highest salinity level (60 ppt) exhibiting reduced growth. At this salinity, plasma levels of lipid-related metabolites, i.e., triglycerides and cholesterol, were decreased, whereas both osmolality and cortisol levels increased. Hepatic glucose and lactate levels increased with rising salinity, while glucose and triglyceride concentrations in muscle tissue declined. Additionally, intestinal lipase activity was significantly higher at 60 ppt. Althought no significant differences were observed in the total unsaturated fatty acid (UFA) content of both tissues, in the brain significant differences were detected in the levels of 16:1n-7, 18:1n-9, 18:2n-6, 20:3n-3, 20:4n-6, and 20:5n-3, whereas in the eye differences were observed only for 16:1n-7 and 20:5n-3. Gene expression analysis revealed that salinity exerts a regulatory effect on the expression of fads2b and elovl4a in the eye, with up-regulation observed at 60 ppt. In contrast, no significant changes in the expression of fads or elovl genes were detected in the brain. These findings highlight the contribution of non-osmoregulatory organs, such as the brain and eyes, in the osmotic adaptation of teleosts. Collectively, the results suggest that lipid metabolism plays a key regulatory role in the adaptation of F. heteroclitus to salinity fluctuations.
Keywords:
teleost
; lipids
; metabolism
; osmoregulation
; fatty acids
; neural tissues
1. Introduction
Environmental salinity is a key factor that impacts fish’s physiological and metabolic processes [1,2]. In the natural environment, water salinity can fluctuate in response to the rainfall regime, the annual thermal season, or the tidal cycle, with these fluctuations being intensified as a result of climate change [3], affecting even food production systems as aquaculture [4]. This is especially relevant in estuaries or salt marshes, where hypo- and hyper-salinity conditions occur regularly and the dynamics of the rivers are highly influenced by the weather [5,6]. Euryhaline species, in particular, can adapt to varying salinity levels, showing a strong capability for osmoregulation even under acute and prolonged osmotic stress [7,8]. While most research on salinity adaptation emphasizes osmoregulation [9,10], there is limited focus on the role of energy metabolism associated with this process [11]. Existing studies on energy metabolism primarily examine physiological responses to osmotic pressure [8,12,13]. However, little is known at the molecular level, such as changes in specific signaling pathways and gene expression regulation [9,11].
To maintain homeostasis, defined as the ability to regulate the internal milieu under osmotic stress, fish spend a high amount of energy, which in some species can account for up to 50% of their total energy budget [9,12]. Efficient energy acquisition from aquafeeds requires prior digestion to break down macronutrients into absorbable units: proteins into amino acids (AAs), lipids into fatty acids (FAs) and glycerol, and carbohydrates into monosaccharides such as glucose. The availability of these bioenergetic substrates (e.g., glucose, AAs, lactate, and FAs) is essential for maintaining plasma osmolality at optimal levels, typically around one-third of seawater salinity, and for achieving a specific ionic composition in body fluids, including reduced concentrations of divalent ions [14,15]. In this context, the cell membrane plays a fundamental role in regulating the osmotic balance of water and solutes, acting as a semi-permeable barrier between the intracellular and extracellular environments [11,16]. In fish, lipids are not only a major source of metabolic energy but also key components of cell membranes and precursors of essential metabolites [17,18]. Thus, phospholipids and cholesterol, the main lipid components of the cell membrane, interact to form a bilayer structure that regulates membrane permeability and fluidity, thereby influencing proper cellular development and function [19].
Moreover, fatty acids (FAs) released from lipid hydrolysis serve as important energy substrates supporting fish growth and development [20], particularly long-chain polyunsaturated fatty acids (LC-PUFAs) such as arachidonic acid (ARA; 20:4n-6), eicosapentaenoic acid (EPA; 20:5n-3), and docosahexaenoic acid (DHA; 22:6n-3). Consequently, a deeper understanding of how lipid metabolism contributes to salinity acclimation in fish may be crucial for elucidating their physiological plasticity and adaptive capacity. Recently, several studies have investigated the relationship between osmotic stress and lipid metabolism in cultured teleosts, including Oncorhynchus mykiss [21],Scatophagus argus[11], and Paralichtys orbignyanus [22]. All of them highlight the key role that the liver plays as a metabolic organ in osmoregulation and salinity adaptation in fish through glycogen breakdown, subsequently increasing blood glucose levels, and finally supplying energy to the gills and other osmoregulatory organs [11,23,24]. However, little attention has been given to the relationship between salinity stress and the molecular mechanisms occurring in fish neural tissues, such as the brain and eyes. In these key organs for the cognitive system and correct fish behavior [25,26], lipids play a crucial role during optimum development and functionality, where LC-PUFAs are specifically accumulated [27,28,29].
The Atlantic killifish or mummichog (Fundulus heteroclitus) is an euryhaline species capable of tolerating significant variations in environmental salinity [30]. Its remarkable ability to adapt to different salinity levels, along with its ease of handling in experimental conditions and physiological similarities to other fish species, makes it an excellent biological model for studying how teleosts adapt to changes in environmental salinity [31,32,33]. Research using this species has contributed to our understanding of the osmoregulation process in fish [34,35]. Thereby, F. heteroclitus can be a good model for providing knowledge about the regulation of lipid metabolism in response to changes in environmental salinity. Furthermore, the results obtained from F. heteroclitus assays underscore the potential importance of fatty acid (FA) biosynthesis capabilities in enabling marine fish to successfully colonize freshwater environments [22,36]. Likewise, applying this knowledge may contribute to more sustainable aquaculture practices by reducing dependence on fish oil in aquafeeds, through evaluating the capacity of certain species to modulate the biosynthesis of essential long-chain polyunsaturated fatty acids (LC-PUFAs) under varying salinity conditions [22].
Accordingly, to better understand the molecular mechanisms underlying salinity adaptation in teleosts, particularly the relationship between salinity stress and lipid metabolism, this study evaluated the effects of different environmental salinities (2, 20, 40, and 60 ppt) on the lipid metabolic status of F. heteroclitus, used as a model fish species. Growth performance, as well as dynamic changes in metabolic parameters in plasma, liver, and muscle, were assessed. Additionally, plasma osmolality, total bile acids (TBA), and intestinal lipase activity were measured. The study also analyzed the influence of salinity on fatty acid composition and the expression of key genes involved in long-chain and very long-chain fatty acid biosynthesis (fads and elovl families) in neural tissues, specifically the brain and eyes, which an optimum levels of FAs are essentials for their correct development and functionality [27,28,29].
2. Materials and Methods
2.1. Fish Maintenance and Experimental Design
Atlantic killifish (F. heteroclitus) were obtained from a stock population kept in seawater (~35 ppt) from the University of Cadiz (UCA) facilities (Puerto Real, Cadiz, Spain). Fish were gradually acclimated to the designated salinities over a two-week period prior to the experimental assays. Then, a total of 180 killifish were individually weighed (4.3 ± 0.5 g) and randomly distributed in twelve 80 L fiber-glass tanks (15 fish per tank) in a close-recirculatory system provided with mechanical and biological filtration (EHEIM eXperience 250, Ref. 2424020), which allowed to maintain the four experimental salinities. All fish were kept at 19-20 °C with constant control of pH, nitrite, nitrate, and ammonia levels, oxygen saturation, and a 12L:12D photoperiod. Animals were fed with commercial feed (Skretting: 57 % protein, 15 % lipid, and 10.5 % minerals) twice a day (10:00 and 15:00 h) until apparent visual satiation (ad libitum). Thus, F. heteroclitus were kept to 2, 20, 40, and 60 ppt environmental salinities, in triplicate, for 62 days (from March to May 2023). Experimental salinities were prepared by mixing seawater and dechlorinated freshwater to obtain 2 and 20 ppt, whereas the 40 and 60 ppt were made with seawater and natural seapond salt. For each experimental tank, a 10 % daily water renovation was performed. This assay involving fish was performed according with the guidelines for animal research set forth by the Ethics and Animal Welfare Committee of the University of Cadiz (UCA), in strict agreement with the Guidelines established by the European Union (2010/63/UE) and the Spanish legislation (RD 1201/2005 and RD 53/2013) for the use of laboratory animals.
2.2. Sampling Protocols
After the experimental trial, fish were subjected to a 24-h fasting period before the final sampling. Then, all fish (45 fish/salinity group) were sacrificed with a lethal dose of 2-phenoxyethanol (1 mL L-1) and individually weighed (wet mass; WM) and measured (total length; TL). Subsequently, 24 fish (8 fish/tank) from each experimental group were randomly sampled, as described below, to obtain biological samples for later analysis in the laboratory. Blood was collected from the caudal vessel using heparinized syringes (25,000 units/3 mL in 0.9 % NaCl) and centrifuged in 1.5 mL Eppendorf tubes at 13,000 g for 3 min at 4 °C to obtain plasma. Subsequently, fish were cervically sectioned to obtain different tissues. To obtain somatic indices, the liver and gut were removed and individually weighed. Next, biopsies of liver and white muscle (~ 0.5 g) were collected for metabolite analysis. The whole intestine, from the pyloric caeca to the rectum, was removed, and its length was measured. Then, intestinal samples were collected to determine lipase activity. For unsaturated fatty acids (UFA) and gene expression analysis, the brain and eye were dissected and processed individually due to the importance of polyunsaturated fatty acids (PUFA) in the correct functionality and development of neural tissues [27,28,37,38].
All samples for metabolites (plasma, liver, and muscle), lipase (whole intestine), and FA (brain and eye) analysis were instantly snap-frozen in liquid nitrogen and stored at -80 °C until further analysis. For gene expression analysis, the brain and eye were immediately kept in Eppendorf tubes containing 0.5 mL of RNAlater® (Invitrogen™, Thermo Fisher Scientific), maintained for 24 h at 4 °C, and then stored at -20 °C until further processed.
2.3. Growth Performance and Somatic Indices
The following growth parameters were evaluated according to the following equations [39]:
- -
- (K) = (100 × body mass)/fork length3
- -
- Mass gain (MG) = (100 × body mass increase)/initial body mass
- -
- Specific growth rate (SGR) = (100 × (ln final body mass - ln initial body mass))/days
- -
- Feed efficiency (FE) = mass gain/total feed intake
Furthermore, organosomatic indices from the liver, viscera, and intestine were estimated according to the following equations [40]:
- -
- Hepatosomatic index (HSI) = (100 × liver mass)/fish mass
- -
- Viscerosomatic index (VSI) = (100 × gut mass)/fish mass
- -
- Intestine length index (ILI) = (100 × intestine length)/fork body length
2.4. Plasma and Tissue Parameters
Biochemical parameters were evaluated in duplicate using a spectrophotometric method (PowerWave™ 340 microplate spectrophotometer, BioTek Instruments, Winooski, VT, USA), controlled by KCjunior Software for Microsoft® Windows (BioTek Instruments, version 1.4), according to the methodology described in Barany et al. [9].
Briefly, metabolites in plasma, liver, and muscle were analysed using commercial kits (SpinReact SA, St. Esteve d’en Bas, Girona, Spain), adapted for use in 96-well microplates. These biological compounds included glucose (Ref. 1001200), lactate (Ref. 1001330), cholesterol (Ref. 41021), and triglycerides (Ref. 1001311). Plasma total protein concentration was determined with the bicinchoninic acid method using the commercial BCA kit (BCA™ Protein assay kit, Pierce, Rockford, USA). Plasma osmolality was evaluated in 20 µL samples using a Fiske One-Ten vapor pressure osmometer (Fiske Associates, Advanced Instruments, Norwood, MA, USA). Plasma cortisol levels were evaluated, as described in Molina-Roque et al. [41], with the commercial Cortisol Enzyme Immunoassay Kit (Arbor Assays, K003-H1W; Ann Arbor, Michigan, USA) according to the manufacturer’s indications. Plasma total bile acids were evaluated with the commercial TBA Kit (SpinReact SA; Ref. 1001030) using a serum calibrator (TBA CAL; Ref. 1002290) according to the manufacturer’s indications. To analyse the metabolic parameters in liver and muscle, frozen samples were homogenized and processed according to Barany et al. [9]. The method described by Keppler and Decker [42] was used to determine the tissue glycogen amount, where the glucose obtained by later glycogen breakdown with amyloglucosidase (Sigma-Aldrich, Ref. A7420) was quantified with the same glucose commercial kit (SpinReact SA; Ref. 1001200).
2.4. Intestinal Lipase Activity
Lipase activity in the intestine was measured using Lipase Activity Assay Kit (Sigma-Aldrich®, Cat. MAK046) following the manufacturer’s instructions. The crude extracts were diluted before each analysis, and the enzyme activity was measured as an initial rate. The samples were measured in triplicate. Briefly, the lipase substrate was heated (80-100 °C, 1 min), vortexed, and aliquoted. Standards were prepared by diluting the 100 mM glycerol stock to obtain a calibration curve (0-10 nmol glycerol). Each reaction well contained 100 µL reaction mix (93 µL buffer, 2 µL peroxidase, 2 µL enzyme mix, 3 µL lipase substrate), to which 10-50 µL of sample or control was added. Reactions were incubated at 37 °C, and the colorimetric product was read at 570 nm. One unit of enzyme activity (U) was defined as the change in absorbance per minute per mL (∆Abs min-1 mL-1). All assays were performed using a Bio-Tek PowerWave 340 Microplate spectrophotometer using Gen5 data analysis software.
2.5. Fatty Acid Analysis
Due to the small amount of brain and eye samples (previously freeze-dried) from F. heteroclitus, FAME (fatty acid methyl ester) was obtained through an adapted direct transmethylation method [43] as described in Garrido et al. [44]. Subsequently, FA composition was determined by gas chromatography (GC) using a SYNAPT G2-S QTOF, APGC mode, chromatograph (Waters Corporation, Milford, USA) using helium as carrier gas (2 mL min−1 constant flow) in a GC column Agilent DB-WAX 30 m, 0.32 mm, 0.50 μm w/ Smart Key (Agilent Technologies, LifeSciences, Santa Clara, CA, USA). Sample injections (1 μL) were performed on-column, and a thermal gradient from 80 °C to 240 °C was applied over a 7-minute period. FAMES, reported as % of total fatty acids, were identified with a standard FAMEs pattern (Supelco 37 component FAME Mix, CRM47885).
2.6. Gene Expression
2.6.1. RNA Extraction and cDNA Synthesis
Whole brain and eye from F. heteroclitus were individually processed for total RNA extraction, after RNAlater® was eliminated, using lint-free laboratory wipes, employing an Ultra Turrax® T25 (IKA®-Werke) with a dispersing tool S25N-8G, and the NucleoSpin® kit (Macherey Nagel, Düren, Germany). In all cases, a RNase-free DNase on-column digestion was used to eliminate genomic DNA contamination. Finally, RNA samples were stored at -80 °C. RNA concentrations were measured with a Qubit® 2.0 fluorimeter and the Qubit™ RNA BR kit (Invitrogen, Thermo Fisher Scientific, Walthem, MA, USA), while their qualities were assessed with a Bioanalyzer 2100 and the RNA 6000 Nano kit (Agilent Technologies, LifeSciences, Santa Clara, CA, USA). Reverse transcription was performed with the qScript™ cDNA synthesis kit (Quanta BioScience, Beverly, MA, USA) using only samples revealing an RNA integrity number greater than 8.0 and at least 100 ng of total RNA. Each reaction was carried out in a volume of 20 μL, according to the manufacturer’s instructions, and it was diluted 1/10 with 10 mM Tris-HCl, 0.1 mM EDTA (pH = 8) to get a final concentration of 500 pg μL-1 from input total RNA.
2.6.2. Real-Time PCR
Primers for real-time PCR were designed using Primer3 software (v.0.4.0) available at http://bioinfo.ut.ee/primer3/, from the sequences available in GenBank (Table 1) taking into account the position of introns (through blast analysis against the whole genomic sequences for this species) to leave at least one intron between forward and reverse primers, thus avoiding any potential genomic DNA contamination. Two internal reference genes, actin beta (actb) and eukaryotic elongation factor 1 alpha (eef1a), were used as internal reference genes owing to their lower than 0.5 target stability M value and lower than 0.25 CVs. All reactions were performed in a CFX Connect™ Real-Time Detection System with BioRad CFX Maestro Software v2.3 (BioRad Laboratories, Hercules, CA, USA). A pool of cDNAs from all brain and eye samples was used as a calibrator to correct inter-assay and intra-assay errors.
Before sample analyses, 1/10 serial dilutions (from 2 ng to 20 fg) of cDNA were carried out to verify amplification efficiency and to produce a calibration curve. Those pairs of primers that showed an efficiency (E) between 90 and 110 %, a determination coefficient (R2) higher than 0.980, and a calibration curve interpolating at least three points over six were chosen for real-time PCR reactions. A negative control with the highest input of total RNA (2 ng) without reverse transcription was used to check for genomic DNA contamination. Negative control with water was also useful to determine the existence of artefacts like primer-dimers.
Each reaction mixture contained 0.5 μL of each specific forward and reverse primer at their best concentration, 5 μL of iQ™ SYBR® Green Supermix (BioRad Laboratories), and 4 μL of cDNA (input from 2 ng of total RNA). Reactions were accomplished in a volume of 10 μL using Hard-Shell® Low-Profile Thin-Wall 96 White-Well Skirted PCR plates (BioRad Laboratories) covered with Microseal® B Adhesive Seals (BioRad Laboratories). PCRs were performed with an initial denaturation and polymerase activation at 95 °C for 10 min, followed by 40 cycles of denaturation in 15 s at 95 °C, annealing and extension at 60 °C for 30 s, and finishing with a melting curve from 60 to 95 °C increasing 0.5 °C every 5 s. ΔΔCT method [45], corrected for efficiencies [46] and normalized by geometric averaging of the two internal control genes [47], i.e., actb and eef1a, were adopted for relative gene quantification. Table 1 displays primer sequences for qPCR, amplicon size (bp), and GenBank accession number for genes analysed.
2.7. Statistical Analysis
All data were checked for normality and homogeneity of variance using Kolmogorov-Smirnov and Levene’s tests, respectively. Outliers were identified by ROUT method at Q = 1 %. Differences among environmental salinities for all given results were analysed by one-way analysis of variance (ANOVA, p ≤ 0.05) followed by Tukey HSD post-hoc test. All data are shown as the mean ± SEM (Standard Error of the Mean). The statistical software package GraphPad Prism 8.0 (GraphPad Software Inc., San Diego, CA, USA) was used to perform all statistical analyses and design figures.
3. Results
3.1. Growth Parameters and Somatic Indices
No mortality was observed during the assay period across all tested salinity levels. Growth parameters and somatic indices are presented in Table 2. Environmental salinity significantly affected growth performance. Fish acclimated to low salinity levels (2 and 20 ppt) exhibited the highest values for condition factor (K), mass gain (MG), and specific growth rate (SGR), with significant differences compared to the 60 ppt group. Feed efficiency (FE) was lowest in fish reared at 60 ppt, differing significantly from those maintained at other environmental salinities (2, 20, and 40 ppt). Somatic index analysis revealed significant differences between the 40 and 60 ppt groups, with the former showing higher hepatosomatic (HSI) and viscerosomatic indices (VSI). However, no significant differences in the intestine length index (ILI) were observed among the salinity treatments.
3.2. Plasma and Tissue Biochemistry Results
Biochemical results for plasma, liver, and muscle are presented in Table 3. In plasma, no significant differences were observed in total bile acids (TBA), total proteins, glucose, or lactate levels across the different salinity conditions. However, plasma osmolality showed a U-shaped relationship regarding the environmental salinities tested. This parameter presented the highest value at 60 ppt, with significant differences respect to 20 and 40 ppt groups, though no differences were observed between the 2 and 60 ppt groups. Plasma cortisol levels increased at 60 ppt compared to lower salinities, with significant differences detected only between the extreme salinities (2 vs 60 ppt). Lipid metabolites revealed a similar pattern for triglycerides and cholesterol, with their lowest plasma concentrations at 60 ppt.
No significant differences were found in hepatic glycogen, triglycerides, or cholesterol levels among salinity groups. Lactate and free glucose levels followed a similar trend, with the lowest concentrations at 2 and 20 ppt, and the highest at 40 and 60 ppt. In muscle tissue, lactate and cholesterol levels remained unaffected by salinity. However, glucose and triglycerides exhibited an inverse linear relationship with respect to environmental salinity, with the highest concentrations observed at 2 ppt and the lowest at 60 ppt. Additionally, muscle glycogen levels showed significant variation, peaking at 40 ppt.
3.3. Intestinal Lipase Activity
Gut lipolytic activity in F. heteroclitus varied significantly across the environmental salinities tested. Lipase activity increased progressively with rising salinity, reaching its highest level at 60 ppt (Figure 1).
3.4. Fatty Acid Composition
No significant differences were observed in the total unsaturated fatty acid (UFA) content, including total monounsaturated fatty acids (MUFA) and polyunsaturated fatty acids (PUFA) in the brain (Table 4) and eye (Table 5) of F. heteroclitus acclimated to different environmental salinities (2, 20, 40, and 60 ppt). In the brain, significant differences were detected in 16:1n-7, 18:1n-9, 18:2n-6, 20:3n-3, 20:4n-6, and 20:5n-3 (EPA) levels. Except for EPA, which peaked at 40 ppt, the highest concentrations of these fatty acids were found at 60 ppt. Although not statistically significant, brain levels of 22:6n-3 (DHA) exhibited an increasing trend with rising salinity, with the lowest and highest values at 2 and 60 ppt, respectively (Table 4).
In the eye, significant differences were observed only for 16:1n-7 and 20:5n-3 (EPA). Notably, EPA levels exhibited an inverse trend to that observed in the brain, decreasing with increasing salinity and reaching the highest concentration at 2 ppt and the lowest at 60 ppt (Table 5).
3.5. Gene Expression
In the brain, no significant differences were observed in the expression levels of the genes analyzed (Figure 2). Similarly, in the eye, the expression of fads2a, fads2c, elovl5, and elovl4b did not vary significantly across salinity conditions (Figure 3A, C, D, F). However, fads2b and elovl4a expression levels exhibited an upward trend, with expression levels progressively increasing from the lowest at 2 ppt to the highest at 60 ppt (Figure 3B, E).
4. Discussion
It is known that environmental salinity influences growth and metabolism in fish [7,12,48]. Fundulus heteroclitus exhibits the broadest range of salinity tolerance within the genus Fundulus [49,50]. Nevertheless, its phenotype is characterized by an expanded osmotic plasticity, particularly toward lower salinity levels [51]. In this sense, and according to previous salinity tolerance assays carried out with this fish [52,53], our growth results denote significant differences between experimental groups, showing the lowest growth and feed efficiency in those fish kept at high salinity levels. According with described relationship between teleost growth and environment salinity [12], the lowest growth rate observed in our 60 ppt fish group could be related with the high energy rate that this fish use in osmoregulatory process, around 20-50 % of the total fish energy [12,54], and the activation of the synthesis and release of hormones involved in growth control (GH and IGF-1) in fish adapted to hypo-osmotic environment [55,56]. Thus, bioenergy would be redirected to the homeostatic maintenance of osmoregulation, a highly energy-consumptive process [57], to the detriment of fish growth [11,58,59]. Additionally, the observed differences in hepatosomatic and viscerosomatic indices suggest a potentially important role for the liver and gut, organs whose involvement in fish osmoregulation remains poorly understood [11], in supporting metabolic and physiological adaptation to adverse salinity conditions in teleosts [60,61,62].
Moreover, the higher accumulation of glucose and lactate, considered as two common biological stress indicators in fish [63], could denote the prevalence of the glucose biosynthesis by anaerobic pathways as that described through Cori cycle [64,65] or even by gluconeogenesis from non-lactate substrates [66], especially in the liver of fish kept at 40 and 60 ppt. Similar results were found in Seriola dumerili acclimated to high environmental salinities, where free glucose was significantly accumulated at the hepatic level [9]. Even more, although carbohydrates regulation in teleost is not well clarified [67,68,69], our results suggest that glucose is an important metabolic substrate that can be mobilized during fish osmotic acclimation in response to environmental salinities changes [9,68], serving as fuel for osmoregulatory homeostasis and activation of osmoregulatory organs as gills, kidney and intestine [62].
In fish, changes in plasma osmolality respond to osmotic stress [70]. Our results denoted that F. heteroclitus kept in extreme salinity water (2 and 60 ppt) showed the highest plasma osmolality values, especially those acclimated to 60 ppt, mirroring the typical U-shape response found for important transporters involved in the regulation of ion trafficking, as the Na-K-ATPase. This hyperosmotic stress could be associated with tissue dehydration [9]. Due to the vital role that metabolic water plays in maintaining physiological functions and the improved growth rates observed, the results suggest that intermediate salinity levels, around 20 ppt, are optimal for this euryhaline fish allowing for better water balance regulation [71,72], as also demonstrated in other teleosts [12,73,74]. In accordance, the highest cortisol levels, a hormone associated with hyperosmotic stress [70], were detected in the plasma of the 60 ppt fish group. Cortisol is considered the major stress hormone in fish [75] and plays a key role in the long-term osmo-response modulating ion transport capacity via regulation of transport protein expression and synthesis, cell proliferation, and differentiation [76,77]. Thus, the increase in plasmatic cortisol levels associated to salinity is as consequence of chronic osmotic stress, in which fish are subjected to hypersaline conditions and, consequently, the need for higher energy mobilization for homeostatic balance of osmoregulation, thus highly influencing growth performance parameters (see above). In this sense, high plasmatic cortisol levels could be associated with an increase in liver gluconeogenesis and immunosuppressive processes [75,78,79,80].
Attending to lipid metabolism, digestive lipases, as pancreatic and lipases activated by bile salts, are enzymes responsible for hydrolyzing the dietary lipids, obtaining energy for the development and growth of fish [81]. Its activity depends on intestinal pH (7 to 9 in fish) and Na+ and Ca2+ ion concentration in the intestine [82]. Moreover, bile acids complement lipases ‘action as lipid emulsifier [81]. In this sense, although no significant differences were detected in plasmatic TBA levels attending to salinity water, the increase of intestinal lipase activity observed in 60 ppt fish groups could suggest a higher demand of lipid substrates in response to an increase of energy requirements for sustaining over time the osmoregulation processes consequent from salinity stress [83]. Thus, as described in other aquatic organisms [84,85,86,87], environmental salinity can have significant effects on intestinal lipase activity in F. heteroclitus, enhancing lipid digestion efficiency under hyperosmotic stress conditions.
As mentioned above, LC-PUFAs obtained through lipid hydrolysis play a crucial role as energy sources for fish growth and development [20], acquiring special relevance ARA, EPA, and DHA, which are considered key molecules for the correct functionality of neural tissues, where these compounds are rapidly bioaccumulated [38,88]. These compounds can be incorporated through the diet and/or biosynthesized de novo from C18 PUFA precursors through enzymatic reactions carried out by fatty acyl desaturases (Fads), which introduce double bonds or unsaturations into PUFA substrates, with the subsequent elongation of very long-chain fatty acid (Elovl) proteins, which extending FA chain adding two carbons atoms [18,89]. In this way, although with a notable functional diversity attending to the position where double bonds are introduced by these proteins into the fatty acyl chain, i.e., Δ4, Δ5, Δ6, and Δ8 activities [90,91], virtually all Fads-like desaturases from fish are Fads2 orthologues. In F. heteroclitus, Δ4/Δ6 Fads2 activity has been described [92,93], denoting its capacity for DHA biosynthesis via Δ6 “Sprecher pathway” [94] and more directly by the”Δ4 pathway” [91]. However, despite of the key role that DHA play in the correct development and functionality of fish brain [25,26,88], no significant differences have been detected in the expression of elovl5 and fads2 genes (a, b, c isoforms), at least after a medium-term acclimation period, although its shorter-term effect during the first days of acclimatization cannot be ruled out. Curiously, significant differences were detected in eye fads2b expression, peaking in the 60 ppt fish group. This could suggest that fads2b respond positively to high levels of environmental salinity activating its transcription to support the biosynthesis of LC-PUFA and maintaining an enough reserve of DHA in order to be incorporated in specific tissues with high requirements of PUFA as retina [28,95], assuring the functionality of visual system in a hyperosmotic environment. In addition to that, both in the brain and eyes, the predominant MUFA was the palmitoleic acid (16:1n-7), showing the highest values of this compound in fish acclimated to 60 ppt. Palmitoleic acid is commonly associated with the structural phospholipids present in neural tissues [29,96]. Thus, these results could be associated with maintaining the structural integrity and functionality of neural cells in response to hyperosmotic stress. Similar results are observed for n-6 fatty acids ARA (20:4n-6) and its precursor linoleic acid (18:2n-6) in fish brain, both directly related to correct integrity and water-permeability cells [97], suggesting the regulatory role that these compounds play in salinity adaptation of F. heteroclitus. Moreover, our results also showed differences in the EPA content of eyes from fish acclimated to 2 and 60 ppt, showing its highest values in the 2 ppt fish group. Thus, the differences observed in the PUFA content of several essential nutrients as linoleic acid, ARA (in brain) and EPA (in eyes), ligated to the lack of differences in the expression of genes involved in its biosynthesis, suggest that these differences could be due to the effects of osmotic stress on other metabolic pathways, the capacity to accumulate FA in specific tissues, as well as the energy mobilization and expenditure to maintaining homeostatic balance as a consequence of osmoregulation.
Attending to Elovl4 proteins, functional assays carried out in several fish species have demonstrated that both Elovl4 isoforms have the capability to elongate long-chain fatty acids (LC-FA), endogenous precursors to very long-chain fatty acids (VLC-FA) [18,37,38,89,98,99]. Elovl4 products, which are very long-chain saturated fatty acids (VLC-SFA) and very long-chain polyunsaturated fatty acids (VLC-PUFA), perform vital roles in vertebrate development by ensuring the optimum formation and functionality of neural tissues, where elovl4 genes are mainly expressed and these compounds are accumulated [100,101]. Although previous assays performed with other teleosts suggest that both isoforms can participate in VLC-PUFA and VLC-SFA elongation [98,99,102,103], Elovl4a seems to be more efficient than Elovl4b at elongating VLC-SFA [89,98]. Despite the specific role of VLC-FA in vertebrates remaining not fully elucidated, and their identification in fish is still limited [104], it is known that VLC-SFA are mostly incorporated into sphingolipids in the central nervous system [101]. In mammals, these are essential for facilitating membrane fusion of synaptic vesicles during neurotransmission processes [105,106]. In teleosts, the retina undergoes continuous neurogenesis throughout the fish’s lifespan and has the capacity to regenerate retinal cells lost due to various types of damage [107,108]. This process requires sustained biosynthesis and tissue-specific assimilation of essential compounds, including very long-chain fatty acids (VLC-FA). Consistently, the expression pattern of elovl4 observed in neural tissues of F. heteroclitus suggests the relationship between salinity adaptation and the elovl4a up-regulation in fish eyes. In accordance, this observation would be associated with a predictable up-regulation in the biosynthesis of Elovl4a proteins, which points to a potential implication of Elovl4a and its main synthesis products, i.e., endogenous VLC-SFA, in the correct maintenance and functionality of cognitive systems from teleost in response to salinity stress. These findings highlight the critical role of the visual system to assure an adequate lifestyle, including feeding and predator evasion behavior, in fish exposed to osmotic stress, where impaired ocular acuity may compromise normal development and performance [37,38,98].
5. Conclusions
This study highlights the complex physiological and molecular adaptations of F. heteroclitus to varying salinity conditions, demonstrating that lipid metabolism plays a pivotal role in osmoregulation and overall metabolic homeostasis. Our findings confirm that high salinity (60 ppt) induces significant metabolic stress, as reflected by elevated plasma osmolality and cortisol levels, reduced growth performance, and increased energy mobilization. These effects are accompanied by increased intestinal lipase activity, suggesting a greater reliance on lipid-based energy substrates under hyperosmotic conditions.
Despite minimal changes in the overall fatty acid profiles of neural tissues, specific variations in key PUFAs such as EPA and ARA suggest localized regulation or differential tissue accumulation linked to environmental salinity. Importantly, the upregulation of elovl4a in the eyes of fish acclimated to high salinity points to a tissue-specific regulatory mechanism that supports the biosynthesis of VLC-SFA, which may be critical for maintaining visual system function under osmotic stress.
Taken together, these results provide new insights into the physiological plasticity of euryhaline teleosts and underscore the essential role of lipid metabolism and neural-specific biosynthetic pathways in salinity acclimation. Further research is warranted to clarify the roles of VLC-FA in neural function and to explore the potential of these metabolic markers in assessing fish adaptation to environmental stressors.
Author Contributions
Conceptualization, M.T; methodology, M.T., G.M.-R, J.A.M.-S; software, M.T.; formal analysis, M.T. and L.R.-V.; investigation, M.T.; resources, J.A.M.-S. and J.M.M.; data curation, M.T.; writing—original draft preparation, M.T.; writing—review and editing, G.M.-R, J.A.M.-S, L.R.-V, J.M.M.; visualization, M.T.; supervision, J.A.M.-S.; funding acquisition, J.A.M.-S. All authors have read and agreed to the published version of the manuscript.
Funding
This research was funded under the postdoctoral research support program (PAID-PD-22) of the Office of the Vice-Rector for Research at the Universitat Politècnica de València (UPV).
Institutional Review Board Statement
This assay was performed according with the guidelines for animal research set forth by the Ethics and Animal Welfare Committee of the University of Cadiz (UCA), in strict agreement with the Guidelines established by the European Union (2010/63/UE) and the Spanish legislation (RD 1201/2005 and RD 53/2013) for the use of laboratory animals.
Informed Consent Statement
Not applicable.
Data Availability Statement
Data generated in this study are available on request from the corresponding author (Miguel Torres; email: miguel.torres.rodriguez@juntadeandalucia.es).
Conflicts of Interest
The authors declare no conflicts of interest.
References
- Evans, T. G.; Kültz, D. The cellular stress response in fish exposed to salinity fluctuations. Journal of Experimental Zoology Part A: Ecological and Integrative Physiology 2020, 333(6), 421-435.
- Wu, H.; Liu, J.; Lu, Z.; Xu, L.; Ji, C.; Wang, Q.; Zhao, J. Metabolite and gene expression responses in juvenile flounder Paralichthys olivaceus exposed to reduced salinities. Fish Shellfish Immunology 2017, 63, 417-423. [CrossRef]
- Jeppesen, E.; Erik, J.; Meryem, B.; Korhan, Ö.; Zuhal, A. Salinization increase due to climate change will have substantial negative effects on inland waters: a call for multifaceted research at the local and global scale. The Innovation 2020, 1(2), 100030.
- Maulu, S.; Hasimuna, O.J.; Haambiya, L.H.; Monde, C.; Musuka, C.G.; Makorwa, T.H.; Munganga, B.P.; Phiri, K.J.; Nsekanabo, J.D. Climate change effects on aquaculture production: sustainability implications, mitigation, and adaptations. Frontiers in Sustainable Food Systems 2021, 5, 609097. [CrossRef]
- Telesh, I.V.; Khlebovich, V.V. Principal processes within the estuarine salinity gradient: a review. Marine Pollution Bulletin 2010, 61(4-6), 149-155. [CrossRef]
- Wetz, M.S.; Yoskowitz, D.W. An ‘extreme’future for estuaries? Effects of extreme climatic events on estuarine water quality and ecology. Marine Pollution Bulletin 2013, 69(1-2), 7-18. [CrossRef]
- González, R.J. The physiology of hyper-salinity tolerance in teleost fish: a review. Journal of Comparative Physiology B 2012, 182, 321-329. [CrossRef]
- Kültz, D. Physiological mechanisms used by fish to cope with salinity stress. The Journal of Experimental Biology 2015, 218(12), 1907-1914. [CrossRef]
- Barany, A.; Gilannejad, N.; Alameda-López, M.; Rodríguez-Velásquez, L.; Astola, A.; Martínez-Rodríguez, G.; Roo, J.; Muñoz, J.L.; Mancera, J.M. Osmoregulatory plasticity of juvenile greater amberjack (Seriola dumerili) to environmental salinity. Animals 2021, 11(9), 2607. [CrossRef]
- Seale, A.P.; Breves, J.P. Endocrine and osmoregulatory responses to tidally-changing salinities in fishes. General and Comparative Endocrinology 2022, 326, 114071. [CrossRef]
- Chen, J.; Cai, B.; Tian, C.; Jiang, D.; Shi, H.; Huang, Y.; Zhu, C.; Li, G.; Deng, S. RNA sequencing (RNA-Seq) analysis reveals liver lipid metabolism divergent adaptive response to low-and high-salinity stress in spotted scat (Scatophagus argus). Animals 2023, 13(9), 1503. [CrossRef]
- Bœuf, G.; Payan, P. How should salinity influence fish growth?. Comparative Biochemistry and Physiology Part C: Toxicology & Pharmacology 2001, 130(4), 411-423.
- Soengas, J.L.; Sangiao-Alvarellos, S.; Laiz-Carrión, R.; Mancera, J.M. Energy metabolism and osmotic acclimation in teleost fish. In Fish osmoregulation; Baldisserotto, B., Mancera, J.M., Kapoor, B.G., Eds.; CRC Press: Boca Ratón, FL, USA, 2019; pp. 277-307.
- Gregorio, S.F.; Carvalho, E.S.M.; Encarnacao, S.; Wilson, J.M.; Power, D.M.; Canario, A.V.M.; Fuentes, J. Adaptation to different salinities exposes functional specialization in the intestine of the sea bream (Sparus aurata L.). The Journal of Experimental Biology 2012, 216(3), 470-479. [CrossRef]
- Alves, A.; Gregório, S.F.; Egger, R.C.; Fuentes, J. Molecular and functional regionalization of bicarbonate secretion cascade in the intestine of the European sea bass (Dicentrarchus labrax). Comparative Biochemistry and Physiology Part A: Molecular & Integrative Physiology 2019, 233, 53-64. [CrossRef]
- Larsen, E. H.; Deaton, L. E.; Onken, H.; O’Donnell, M.; Grosell, M.; Dantzler, W.H.; Weihrauch, D. Osmoregulation and excretion. Comprehensive Physioly 2011, 4, 405-573. [CrossRef]
- Sargent, J.; McEvoy, L.; Estevez, A.; Bell, G.; Bell, M.; Henderson, J.; Tocher, D. Lipid nutrition of marine fish during early development: current status and future directions. Aquaculture 1999, 179 (1-4), 217-229. [CrossRef]
- Monroig, Ó.; Tocher, D.R.; Castro, L.F.C. Polyunsaturated Fatty Acid Biosynthesis and Metabolism in Fish. In Polyunsaturated Fatty Acid Metabolism; Burdge, G.C., Ed.; Elsevier: Amsterdam, The Netherlands, 2018; pp. 31-60.
- Frallicciardi, J.; Melcr, J.; Siginou, P.; Marrink, S.J.; Poolman, B. Membrane thickness, lipid phase and sterol type are determining factors in the permeability of membranes to small solutes. Nature Communications 2022, 13, 1605. [CrossRef]
- Hamre, K.; Yúfera, M.; Rønnestad, I.; Boglione, C.; Conceição, L.E.; Izquierdo, M. Fish larval nutrition and feed formulation: knowledge gaps and bottlenecks for advances in larval rearing. Reviews in Aquaculture. 2013, 5, S26-S58. [CrossRef]
- Xiong, Y.; Dong, S.; Huang, M.; Li, Y.; Wang, X.; Wang, F.; Ma, S.; Zhou, Y. Growth, osmoregulatory response, adenine nucleotide contents, and liver transcriptome analysis of steelhead trout (Oncorhynchus mykiss) under different salinity acclimation methods. Aquaculture 2020, 520, 734937. [CrossRef]
- Fernandez-López, E.; Panzera, Y.; Bessonart, M.; Marandino, A.; Féola, F.; Gadea, J.; Magnone, L.; Salhi, M. Effect of salinity on fads2 and elovl gene expression and fatty acid profile of the euryhaline flatfish Paralichthys orbignyanus. Aquaculture 2024, 583, 740585. [CrossRef]
- Shi, K.-P.; Dong, S.-L.; Zhou, Y.-G.; Li, Y.; Gao, Q.-F.; Sun, D.-J. RNA-seq reveals temporal differences in the transcriptome response to acute heat stress in the Atlantic salmon (Salmo salar). Comparative Biochemistry and Physiology Part D: Genomics and Proteomics 2019, 30, 169-178. [CrossRef]
- Zhang, X.; Wen, H.; Wang, H.; Ren, Y.; Zhao, J.; Li, Y. RNA-Seq analysis of salinity stress–responsive transcriptome in the liver of spotted sea bass (Lateolabrax maculatus). PLoS One 2017, 12, e0173238. [CrossRef]
- Bell, M.V.; Tocher, D.R. Molecular species composition of the major phospholipids in brain and retina from rainbow trout (Salmo gairdneri). Occurrence of high levels of di-(n-3) polyunsaturated fatty acid species. Biochemical Journal. 1989, 264 (3), 909-915.
- Bell, M.V.; Batty, R.S.; Dick, J.R.; Fretwell, K.; Navarro, J.C.; Sargent, J.R. Dietary deficiency of docosahexaenoic acid impairs vision at low light intensities in juvenile herring (Clupea harengus L.). Lipids 1995, 30 (5), 443-449. [CrossRef]
- Dyall, S.C. Long-chain omega-3 fatty acids and the brain: A review of the independent and shared effects of EPA. DPA and DHA. Frontiers in Aging Neuroscience 2015, 7, 1-15. [CrossRef]
- Gawrisch, K.; Eldho, N.V.; Holte, L.L. The structure of DHA in phospholipid membranes. Lipids 2003, 38 (4), 445-452. [CrossRef]
- Hong, H.; Zhou, Y.; Wu, H.; Luo, Y.; Shen, H. Lipid content and fatty acid profile of muscle, brain and eyes of seven freshwater fish: a comparative study. Journal of the American Oil Chemists’ Society 2014, 91(5), 795-804. [CrossRef]
- Marshall, W.S.; Emberley, T.R.; Singer, T.D.; Bryson, S.E.; McCormick, S.D. Time course of salinity adaptation in a strongly euryhaline estuarine teleost, Fundulus heteroclitus: a multivariable approach. Journal of Experimental Biology 1999, 202(11), 1535-1544. [CrossRef]
- Marshall, W.S.; Bryson, S.E. Transport mechanisms of seawater teleost chloride cells: an inclusive model of a multifunctional cell. Comparative Biochemistry and Physiology Part A: Molecular & Integrative Physiology 1998, 119(1), 97-106. [CrossRef]
- Martos-Sitcha, J.A., Martínez-Rodríguez, G.; Mancera, J.M.; Fuentes, J. AVT and IT regulate ion transport across the opercular epithelium of killifish (F. heteroclitus) and gilthead sea bream (S. aurata). Comparative Biochemistry and Physiology Part A: Molecular & Integrative Physiology 2015, 182, 93-101.
- Wood, C.M.; Marshall, W.S. Ion balance, acid-base regulation, and chloride cell function in the common killifish, Fundulus heteroclitus, a euryhaline estuarine teleost. Estuaries 1994, 17, 34-52. [CrossRef]
- Genz, J.; Grosell, M. Fundulus heteroclitus acutely transferred from seawater to high salinity require few adjustments to intestinal transport associated with osmoregulation. Comparative Biochemistry and Physiology Part A: Molecular & Integrative Physiology 2011, 160(2), 156-165. [CrossRef]
- Kidder III, G.W.; Petersen, C.W.; Preston, R.L. Energetics of osmoregulation: Water flux and osmoregulatory work in the euryhaline fish, Fundulus heteroclitus. Journal of Experimental Zoology Part A: Comparative Experimental Biology 2006, 305(4), 318-327.
- Matsushita, Y.; Miyoshi, K.; Kabeya, N.; Sanada, S.; Yazawa, R.; Haga, Y.; Satoh, S.; Yamamoto, Y.; Strüssmann, C.A.; Luckenbach, J.A.; Yoshizaki, G. Flatfishes colonised freshwater environments by acquisition of various DHA biosynthetic pathways. Communications Biology 2020, 3, 4-5. [CrossRef]
- Torres, M.; Navarro, J.C.; Varó, I.; Monroig, Ó.; Hontoria, F. Nutritional regulation of genes responsible for long-chain (C20-24) and very long-chain (> C24) polyunsaturated fatty acid biosynthesis in post-larvae of gilthead seabream (Sparus aurata) and Senegalese sole (Solea senegalensis). Aquaculture 2020a, 525, 735314. [CrossRef]
- Torres, M.; Navarro, J.C.; Varó, I.; Agulleiro, M.J.; Morais, S.; Monroig, Ó.; Hontoria, F. Expression of genes related to long-chain (C18-22) and very long-chain (> C24) fatty acid biosynthesis in gilthead seabream (Sparus aurata) and Senegalese sole (Solea senegalensis) larvae: Investigating early ontogeny and nutritional regulation. Aquaculture 2020b, 520, 734949. [CrossRef]
- Lugert, V.; Thaller, G.; Tetens, J.; Schulz, C.; Krieter, J. A review on fish growth calculation: multiple functions in fish production and their specific application. Reviews in Aquaculture 2016, 8, 30-42. [CrossRef]
- García-Márquez, J.; Domínguez-Maqueda, M.; Torres, M.; Cerezo, I.M.; Ramos, E.; Alarcón, F.J.; Mancera, J.M.; Martos-Sitcha, J.A.; Moriñigo, M.A.; Balebona, M.C. Potential Effects of microalgae-supplemented diets on the growth, blood parameters, and the activity of the intestinal microbiota in Sparus aurata and Mugil cephalus. Fishes 2023, 8(8), 409.
- Molina-Roque, L.; Bárany, A.; Sáez, M.I.; Alarcón, F.J.; Tapia, S.T.; Fuentes, J.; Mancera, J.M.; Perera, E.; Martos-Sitcha, J.A. Biotechnological treatment of microalgae enhances growth performance, hepatic carbohydrate metabolism and intestinal physiology in gilthead seabream (Sparus aurata) juveniles close to commercial size. Aquaculture Reports 2022, 25, 101248. [CrossRef]
- Keppler, D.; Decker, K. Glycogen. Determination with Amyloglucosidase. Methods of Enzymatic Analysis 1974, 3, 1127-1131.
- O’Fallon, J.V.; Busboom, J.R.; Nelson, M.L.; Gaskins, C.T. A direct method for fatty acid methyl ester synthesis: Application to wet meat tissues, oils, and feedstuffs. Journal of animal science 2007, 85(6), 1511-1521. [CrossRef]
- Garrido, D.; Navarro, J.C.; Perales-Raya, C.; Nande, M.; Martín, M.V.; Iglesias, J.; Bartolomé, A.; Roura, A.; Varó, I.; Otero, J.J.; González, F.; Rodríguez, C.; Almansa, E. Fatty acid composition and age estimation of wild Octopus vulgaris paralarvae. Aquaculture 2016, 464, 564-569. [CrossRef]
- Livak, K.J.; Schmittgen, T.D. Analysis of relative gene expression data using real-time quantitative PCR and the 2-DDCT method. Methods 2001, 25, 402-408.
- Pfaffl, M.W. A new mathematical model for relative quantification in real-time RT-PCR. Nucleic Acids Research 2001, 29, e45. [CrossRef]
- Vandesompele, J.; De Preter, K.; Pattyn, F.; Poppe, B.; Van Roy, N.; De Paepe, A.; Speleman, F. Accurate normalization of real-time quantitative RT-PCR data by geometric averaging of multiple internal control genes. Genome Biology 2002, 3, 1-12.
- Vargas-Chacoff, L.; Saavedra, E.; Oyarzún, R.; Martínez-Montaño, E.; Pontigo, J.P.; Yáñez, A.; Ruiz-Jarabo, I.; Mancera, J.M.; Bertrán, C. Effects on the metabolism, growth, digestive capacity and osmoregulation of juvenile of Sub-Antarctic Notothenioid fish Eleginops maclovinus acclimated at different salinities. Fish physiology and biochemistry 2015, 41, 1369-1381. [CrossRef]
- Griffith, R.W. Environment and salinity tolerance in the genus Fundulus. Copeia 1974, 2, 319-331. [CrossRef]
- Yetsko, K.; Sancho, G. The effects of salinity on swimming performance of two estuarine fishes, Fundulus heteroclitus and Fundulus majalis. Journal of Fish Biology 2015, 86(2), 827-833. [CrossRef]
- Whitehead, A.; Zhang, S.; Roach, J.L.; Galvez, F. Common functional targets of adaptive micro- and macro-evolutionary divergence in killifish. Molecular Ecology 2013, 22, 3780-3796. [CrossRef]
- Joseph, E.B.; Saksena, V.P. Determination of salinity tolerances in mummichog (Fundulus heteroclitus) larvae obtained from hormone-induced spawning. Chesapeake Science 1966, 7(4), 193-197. [CrossRef]
- Thompson, J.S. Salinity affects growth but not thermal preference of adult mummichogs Fundulus heteroclitus. Journal of Fish Biology 2019, 95(4), 1107-1115. [CrossRef]
- Morgan, J. D. Energetic aspects of osmoregulation in fish. Doctoral Thesis, University of British Columbia, Vancouver, Canada, 1998.
- Mancera, J.M.; Fernandez-Llebrez, P.; Perez-Figares, J.M. Effect of decreased environmental salinity on growth hormone cells in the gilthead sea bream (Sparus aurata). Journal of fish biology 1995, 46(3), 494-500. [CrossRef]
- Mancera, J.M.; McCormick, S.D. Evidence for growth hormone/insulin-like growth factor I axis regulation of seawater acclimation in the Euryhaline Teleost Fundulus heteroclitus. General and comparative endocrinology 1998, 111(2), 103-112. [CrossRef]
- Evans, D.H.; Piermarini, P.M; Choe, K.P. The multifunctional fish gill: dominant site of gas exchange, osmoregulation, acid-base regulation, and excretion of nitrogenous waste. Physiological Reviews 2005, 85, 97-177. [CrossRef]
- Blanco-Garcia, A.; Partridge, G.J.; Flik, G.; Roques, J.A.; Abbink, W. Ambient salinity and osmoregulation, energy metabolism and growth in juvenile yellowtail kingfish (Seriola lalandi Valenciennes 1833) in a recirculating aquaculture system. Aquaculture Research 2015, 46(11), 2789-2797.
- O’Neill, B.; De Raedemaecker, F.; McGrath, D.; Brophy, D. An experimental investigation of salinity effects on growth, development and condition in the European flounder (Platichthys flesus L.). Journal of Experimental Marine Biology and Ecology 2011, 410, 39-44.
- Butt, R.L.; Volkoff, H. Gut microbiota and energy homeostasis in fish. Frontiers in endocrinology 2019, 10 (9), 1-12. [CrossRef]
- Chang, J.C.H.; Wu, S.M.; Tseng, Y.C.; Lee, Y.C.; Baba, O.; Hwang, P.P. Regulation of glycogen metabolism in gills and liver of the euryhaline tilapia (Oreochromis mossambicus) during acclimation to seawater. Journal of Experimental Biology 2007, 210(19), 3494-3504. [CrossRef]
- Tseng, Y.C.; Hwang, P.P. Some insights into energy metabolism for osmoregulation in fish. Comparative Biochemistry and Physiology Part C: Toxicology & Pharmacology 2008, 148(4), 419-429.
- Tsui, W.C.; Chen, J.C.; Cheng, S.Y. The effects of a sudden salinity change on cortisol, glucose, lactate, and osmolality levels in grouper Epinephelus malabaricus. Fish physiology and biochemistry 2012, 38, 1323-1329. [CrossRef]
- De Backer, D. Lactic acidosis. Intensive care medicine 2003, 29, 699-702.
- Driedzic, W.R.; Hochachka, P.W. Metabolism in fish during exercise. In Fish physiology; Hoar, W.S., Randall, D.J., Eds.; Academic Press: Cambridge, Massachusetts, USA, 1978; Volume 7, pp. 503-543.
- Schwalme, K.; Mackay, W. C. Mechanisms that elevate the glucose concentration of muscle and liver in yellow perch (Perca flavescens Mitchill) after exercise–handling stress. Canadian journal of zoology 1991, 69(2), 456-461. [CrossRef]
- Polakof, S.; Mommsen, T.P.; Soengas, J.L. Glucosensing and glucose homeostasis: from fish to mammals. Comparative Biochemistry Physiology Part B: Biochemistry and Molecular Biology 2011 160, 123-149.
- Polakof, S.; Panserat, S.; Soengas, J.L.; Moon, T.W. Glucose metabolism in fish: a review. Journal of Comparative Physiology B 2012, 182, 1015-1045.
- Stone DAJ (2003) Dietary carbohydrate utilization by fish. Reviews in Fisheries Sciences 2003, 11, 337-369.
- Fiol, D.F.; Kültz, D. Osmotic stress sensing and signaling in fishes. The FEBS journal 2007, 274(22), 5790-5798. [CrossRef]
- Fritz, E.S.; Garside, E.T. Salinity preferences of Fundulus heteroclitus and F. diaphanus (Pisces: Cyprinodontidae): their role in geographic distribution. Canadian Journal of Zoology 1974, 52(8), 997-1003.
- Whitehead, A. The evolutionary radiation of diverse osmotolerant physiologies in killifish (Fundulus sp.). Evolution 2010, 64(7), 2070-2085.
- Gaumet, F.; Boeuf, G.; Severe, A.; Le Roux, A.; Mayer-Gostan, N. Effects of salinity on the ionic balance and growth of juvenile turbot. Journal of Fish Biology 1995, 47(5), 865-876. [CrossRef]
- Imsland, A.K.; Foss, A.; Gunnarsson, S.; Berntssen, M.H.; FitzGerald, R.; Bonga, S.W.; Ham, E.V.; Naevdal, G.; Stefansson, S.O. The interaction of temperature and salinity on growth and food conversion in juvenile turbot (Scophthalmus maximus). Aquaculture 2001, 198(3-4), 353-367. [CrossRef]
- Sadoul, B.; Geffroy, B. Measuring cortisol, the major stress hormone in fishes. Journal of Fish Biology 2019, 94(4), 540-555. [CrossRef]
- Evans D.H.; Rose R.E.; Roeser J.M.; Stidham J.D. NaCl transport across the opercular epithelium of Fundulus heteroclitus is inhibited by an endothelin to NO, superoxide, and prostanoid signaling axis. American Journal of Physiology; Regulatory, Integrative and Comparative Physiology 2004, 286, R560-R568.
- McCormick, S.D.; Bradshaw, D. Hormonal control of salt and water balance in vertebrates. General and Comparative Endocrinology 2006, 147, 3-8. [CrossRef]
- Fries, C.R. Effects of environmental stressors and immunosuppressants on immunity in Fundulus heteroclitus. American Zoologist 1986, 26(1), 271-282. [CrossRef]
- Mommsen, T.P.; Vijayan, M.M.; Moon, T.W. Cortisol in teleosts: dynamics, mechanisms of action and metabolic regulation. Reviews in Fish Biology and Fisheries 1999, 9, 211-268.
- Tahir, D.; Shariff, M.; Syukri, F.; Yusoff, F.M. Serum cortisol level and survival rate of juvenile Epinephelus fuscoguttatus following exposure to different salinities. Veterinary World 2018, 11(3), 327. [CrossRef]
- Nolasco-Soria, H. Fish digestive lipase quantification methods used in aquaculture studies. Frontiers in Aquaculture 2023, 2, 1225216. [CrossRef]
- Nolasco-Soria, H. Improving and standardizing protocols for alkaline protease quantification in fish. Reviews in Aquaculture 2021, 13(1), 43-65. [CrossRef]
- El-Leithy, A.A.; Hemeda, S.A.; El Naby, W.S.A.; El Nahas, A.F.; Hassan, S.A.; Awad, S.T.; El-Deeb, S.I.; Helmy, Z.A. Optimum salinity for Nile tilapia (Oreochromis niloticus) growth and mRNA transcripts of ion-regulation, inflammatory, stress-and immune-related genes. Fish physiology and biochemistry 2019, 45, 1217-1232. [CrossRef]
- Chen, J.; Wang, H.; Yuan, H.; Hu, N.; Zou, F.; Li, C.; Shi, L.; Tan, B.; Zhang, S. Effects of dietary Clostridium autoethanogenum protein on the growth, disease resistance, intestinal digestion, immunity and microbiota structure of Litopenaeus vannamei reared at different water salinities. Frontiers in Immunology 2022, 13, 1034994. [CrossRef]
- Liu, Z.F., Gao, X.Q., Yu, J.X., Qian, X.M., Xue, G.P., Zhang, Q.Y.; Liu, B.L.; Hong, L. Effects of different salinities on growth performance, survival, digestive enzyme activity, immune response, and muscle fatty acid composition in juvenile American shad (Alosa sapidissima). Fish physiology and biochemistry 2017, 43, 761-773. [CrossRef]
- Liu, J.; Ai, T.; Yang, J.; Shang, M.; Jiang, K.; Yin, Y.; Gao, L.; Jiang, W.; Zhao, N.; Ju, J.; Qin, B. Effects of salinity on growth, digestive enzyme activity, and antioxidant capacity of spotbanded scat (Selenotoca multifasciata) Juveniles. Fishes 2024, 9(8), 309.
- Zhang, N.; Yang, R.; Fu, Z.; Yu, G.; Ma, Z. Mechanisms of digestive enzyme response to acute salinity stress in juvenile yellowfin tuna (Thunnus albacares). Animals 2023, 13(22), 3454. [CrossRef]
- Stoknes, I.S.; Økland, H.M.; Falch, E.; Synnes, M. Fatty acid and lipid class composition in eyes and brain from teleosts and elasmobranchs. Comparative Biochemistry and Physiology Part B: Biochemistry and Molecular Biology 2004, 138(2), 183-191. [CrossRef]
- Morais, S.; Torres, M.; Hontoria, F.; Monroig, Ó.; Varó, I.; Agulleiro, M.J.; Navarro, J.C. Molecular and functional characterization of Elovl4 genes in Sparus aurata and Solea senegalensis pointing to a critical role in very long-chain (> C24) fatty acid synthesis during early neural development of fish. International Journal of Molecular Sciences 2020, 21(10), 3514. [CrossRef]
- Castro, L.F.C.; Tocher, D.R.; Monroig, Ó. Long-chain polyunsaturated fatty acid biosynthesis in chordates: Insights into the evolution of Fads and Elovl gene repertoire. Progress in Lipid Research 2016, 62, 25-40. [CrossRef]
- Monroig, Ó.; Shu-Chien, A.C.; Kabeya, N.; Tocher, D.R.; Castro, L.F.C. Desaturases and elongases involved in long-chain polyunsaturated fatty acid biosynthesis in aquatic animals: From genes to functions. Progress in lipid research 2022, 86, 101157. [CrossRef]
- Oboh, A.; Kabeya, N.; Carmona-Antoñanzas, G.; Castro, L.F.C.; Dick, J.R., Tocher, D.R.; Monroig, O. Two alternative pathways for docosahexaenoic acid (DHA, 22: 6n-3) biosynthesis are widespread among teleost fish. Scientific reports 2017a, 7(1), 3889.
- Rivera-Pérez, C.; Valenzuela-Quiñonez, F.; Caraveo-Patiño, J. Comparative and functional analysis of desaturase FADS1 (∆5) and FADS2 (∆6) orthologues of marine organisms. Comparative Biochemistry and Physiology Part D: Genomics and Proteomics 2020, 35, 100704. [CrossRef]
- Sprecher, H. Metabolism of highly unsaturated n-3 and n-6 fatty acids. Biochimica et Biophysica Acta (BBA)-Molecular and Cell Biology of Lipids 2000, 1486(2-3), 219-231.
- Suh, M.; Clandinin, M.T. 20:5n-3 but not 22:6n-3 is a preferred substrate for synthesis of n-3 Very-Long-Chain Fatty Acids (C24-C36) in Retina. Current Eye Research 2005, 30, 959-968.
- Ge, L.; Yang, H.; Lu, W.; Cui, Y.; Jian, S.; Song, G.; Xue, J.; He, X.; Wang, Q.; Shen, Q. Identification and comparison of palmitoleic acid (C16: 1 n-7)-derived lipids in marine fish by-products by UHPLC-Q-exactive orbitrap mass spectrometry. Journal of Food Composition and Analysis 2023, 115, 104925. [CrossRef]
- Le, H.D.; Meisel, J.A.; de Meijer, V.E.; Gura, K.M.; Puder, M. The essentiality of arachidonic acid and docosahexaenoic acid. Prostaglandins, Leukotrienes and Essential Fatty Acids 2009, 81(2-3), 165-170. [CrossRef]
- Monroig, Ó.; Rotllant, J.; Cerdá-Reverter, J.M.; Dick, J.R.; Figueras, A.; Tocher, D.R. Expression and role of Elovl4 elongases in biosynthesis of very long-chain fatty acids during zebrafish Danio rerio early embryonic development. Biochimica et Biophysica Acta-Molecular and Cell Biology of Lipids 2010, 1801, 1145-1154. [CrossRef]
- Oboh, A.; Navarro, J.C.; Tocher, D.R.; Monroig, Ó. Elongation of very long-chain (>C24) fatty acids in Clarias gariepinus: Cloning, functional characterization and tissue expression of elovl4 elongases. Lipids 2017b, 52, 837-848.
- Agbaga, M.P.; Mandal, M.N.A.; Anderson, R.E. Retinal very long-chain PUFAs: New insights from studies on ELOVL4 protein. Journal of Lipid Research 2010, 51, 1624-1642. [CrossRef]
- Deák, F.; Anderson, R.E.; Fessler, J.L.; Sherry, D.M. Novel cellular functions of very long chain-fatty acids: Insight from ELOVL4 mutations. Frontiers in Cellular Neuroscience 2019, 13, 428. [CrossRef]
- Jin, M.; Monroig, Ó.; Navarro, J.C.; Tocher, D.R.; Zhou, Q.C. Molecular and functional characterisation of two elovl4 elongases involved in the biosynthesis of very long-chain (>C24) polyunsaturated fatty acids in black seabream Acanthopagrus schlegelii. Comparative Biochemistry and Physiology Part B: Biochemistry and Molecular Biology 2017, 212, 41-50. [CrossRef]
- Li, S.; Monroig, Ó.; Wang, T.; Yuan, Y.; Navarro, J.C.; Hontoria, F.; Liao, K.; Tocher, D.R.; Mai, K.; Xu, W.; et al. Functional characterization and differential nutritional regulation of putative Elovl5 and Elovl4 elongases in large yellow croaker (Larimichthys crocea). Scientific Reports 2017, 7, 1-15. [CrossRef]
- Garlito, B.; Portolés, T.; Niessen, W.M.A.; Navarro, J.C.; Hontoria, F.; Monroig, Ó.; Varó, I.; Serrano, R. Identification of very long-chain (>C24) fatty acid methyl esters using gas chromatography coupled to quadrupole/time-of-flight mass spectrometry with atmospheric pressure chemical ionization source. Analytica Chimica Acta 2019, 1051, 103-109. [CrossRef]
- Hopiavuori, B.R.; Deák, F.; Wilkerson, J.L.; Brush, R.S.; Rocha-Hopiavuori, N.A.; Hopiavuori, A. R.; Ozan, K.G.; Sullivan, M.T.; Wren, J.D.; Georgescu, C.; Szweda, L.; Awasthi, V.; Towner, R.; Sherry, D.M.; Anderson, R.E.; Agbaga M.P. Homozygous expression of mutant ELOVL4 leads to seizures and death in a novel animal model of very long-chain fatty acid deficiency. Molecular Neurobiology 2018, 55, 1795-1813. [CrossRef]
- Hopiavuori, B.R.; Anderson, R.E.; Agbaga, M.P. ELOVL4: Very long chain fatty acids serve an eclectic role in mammalian health and function. Progress in Retinal and Eye Research 2019, 69, 137-158. [CrossRef]
- Bejarano-Escobar, R.; Blasco, M.; DeGrip, W.; Oyola-Velasco, J.; Martin-Partido, G.; Francisco-Morcillo, J. Eye development and retinal differentiation in an altricial fish species, the Senegalese sole (Solea senegalensis, Kaup 1858). Journal of Experimental Zoology Part B: Molecular and Developmental Evolution 2010, 314 (7), 580-605.
- Vihtelic, T.S.; Soverly, J.E.; Kassen, S.C.; Hyde, D.R. Retinal regional differences in photoreceptor cell death and regeneration in light-lesioned albino zebrafish. Experimental Eye Research 2006, 82, 558-575. [CrossRef]
Figure 1.
Lipase activity in the intestine of Fundulus heteroclitus acclimated to different environmental salinities (2, 20, 40, and 60 ppt) for 62 days. Data are presented as the mean ± SEM (n = 12). Different superscript letters (a, b) indicate significant differences among salinities based on one-way ANOVA and Tukey’s test (p ≤ 0.05).
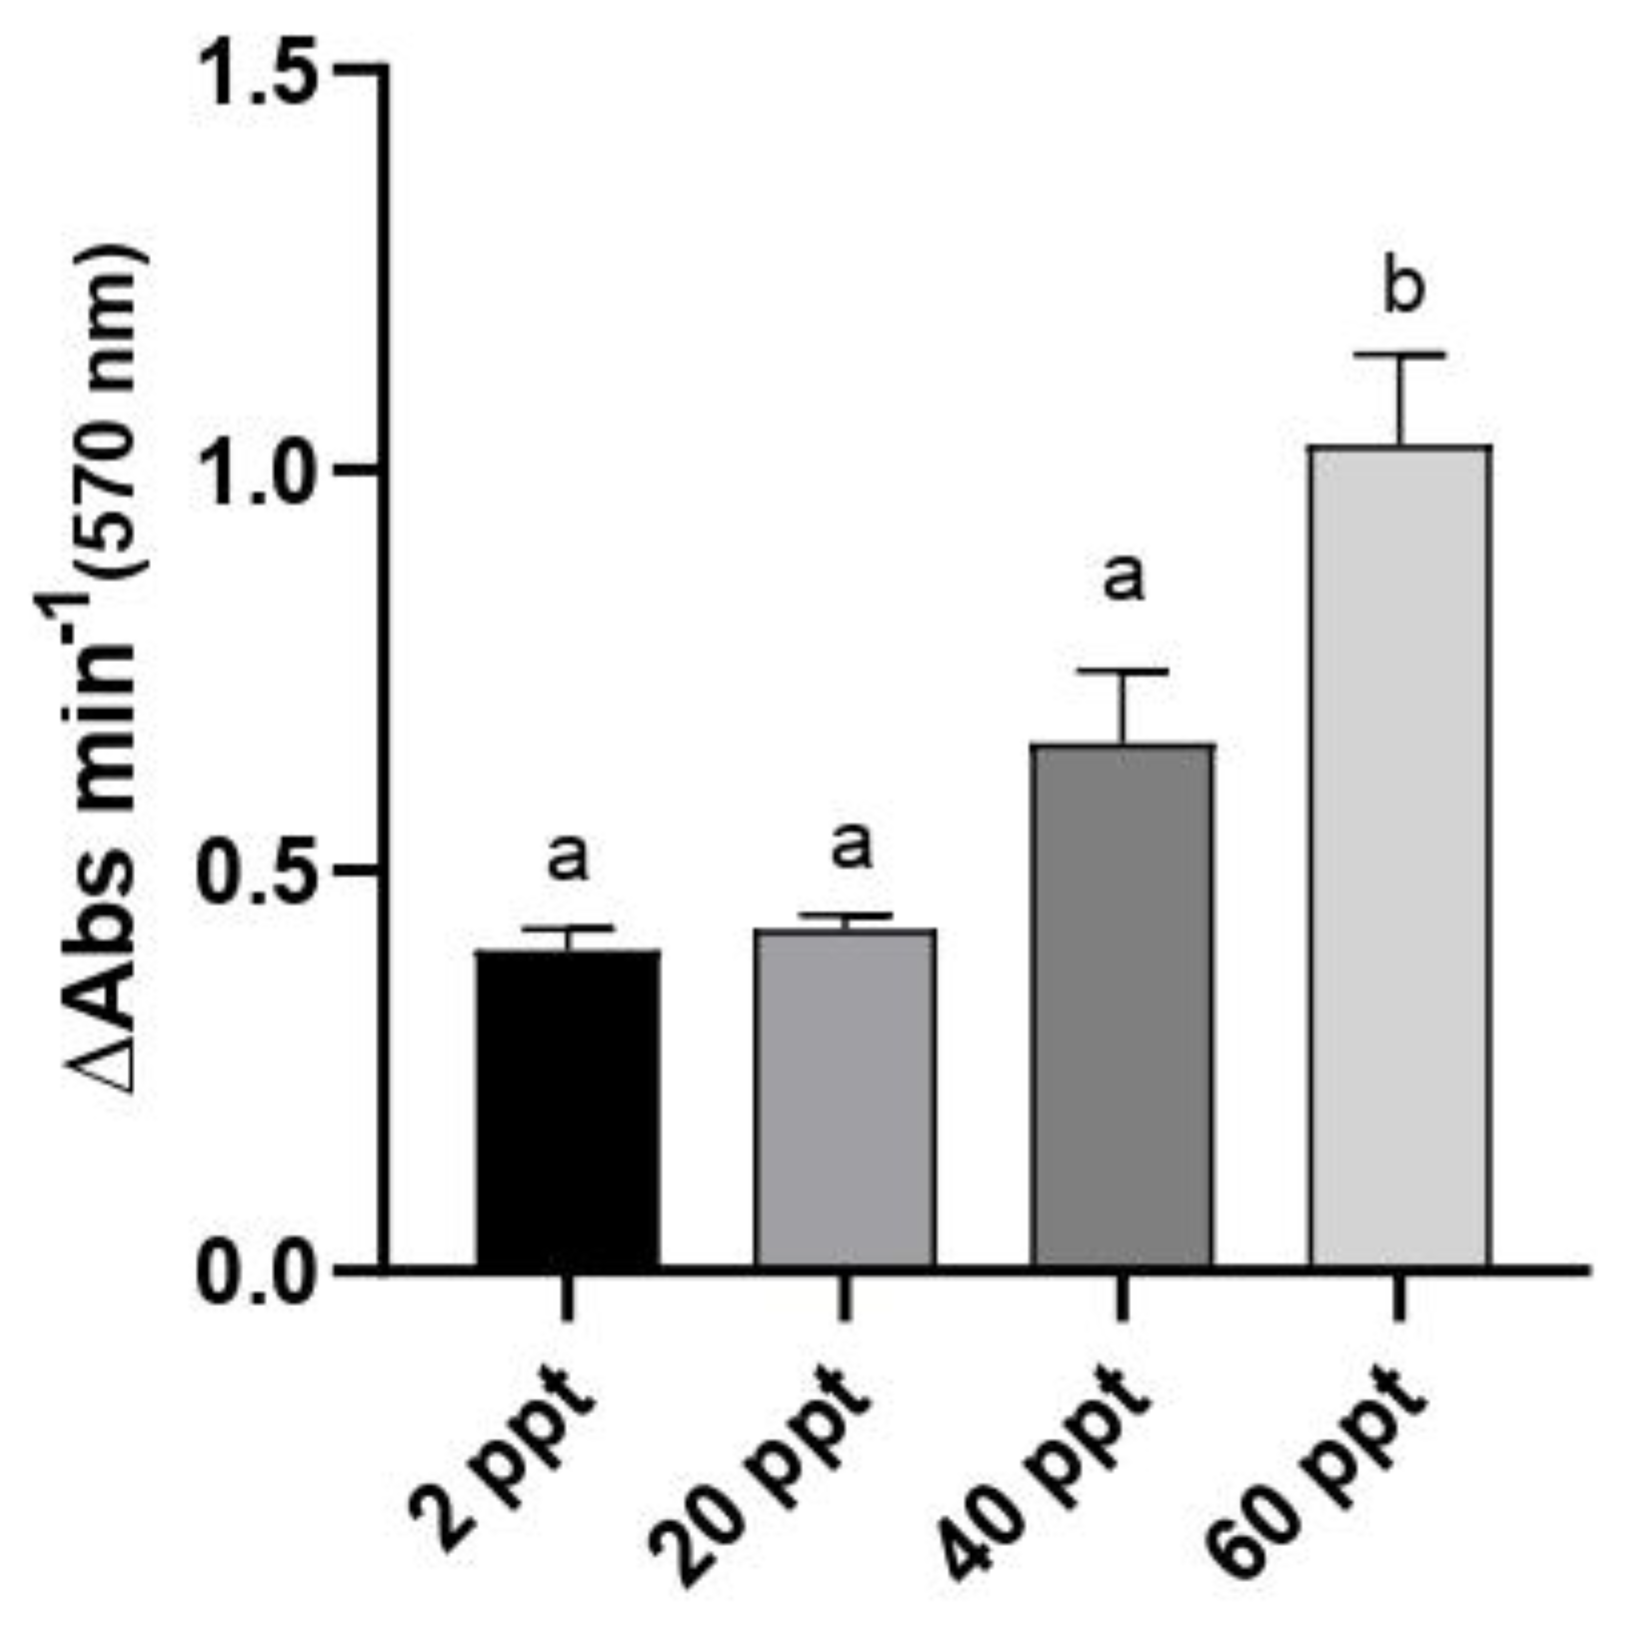
Figure 2.
Gene expression levels (relative to actb and eef1) of brain fads2a (A), fads2b (B), fads2c (C), elovl5 (D), elovl4a (E) and elovl4b (F) in Fundulus heteroclitus acclimated to different environmental salinities (2, 20, 40, and 60 ppt) for 62 days. Data are shown as the mean ± SEM (n = 12). No significant differences among salinities based on one-way ANOVA and Tukey’s test (p ≤ 0.05) were observed.
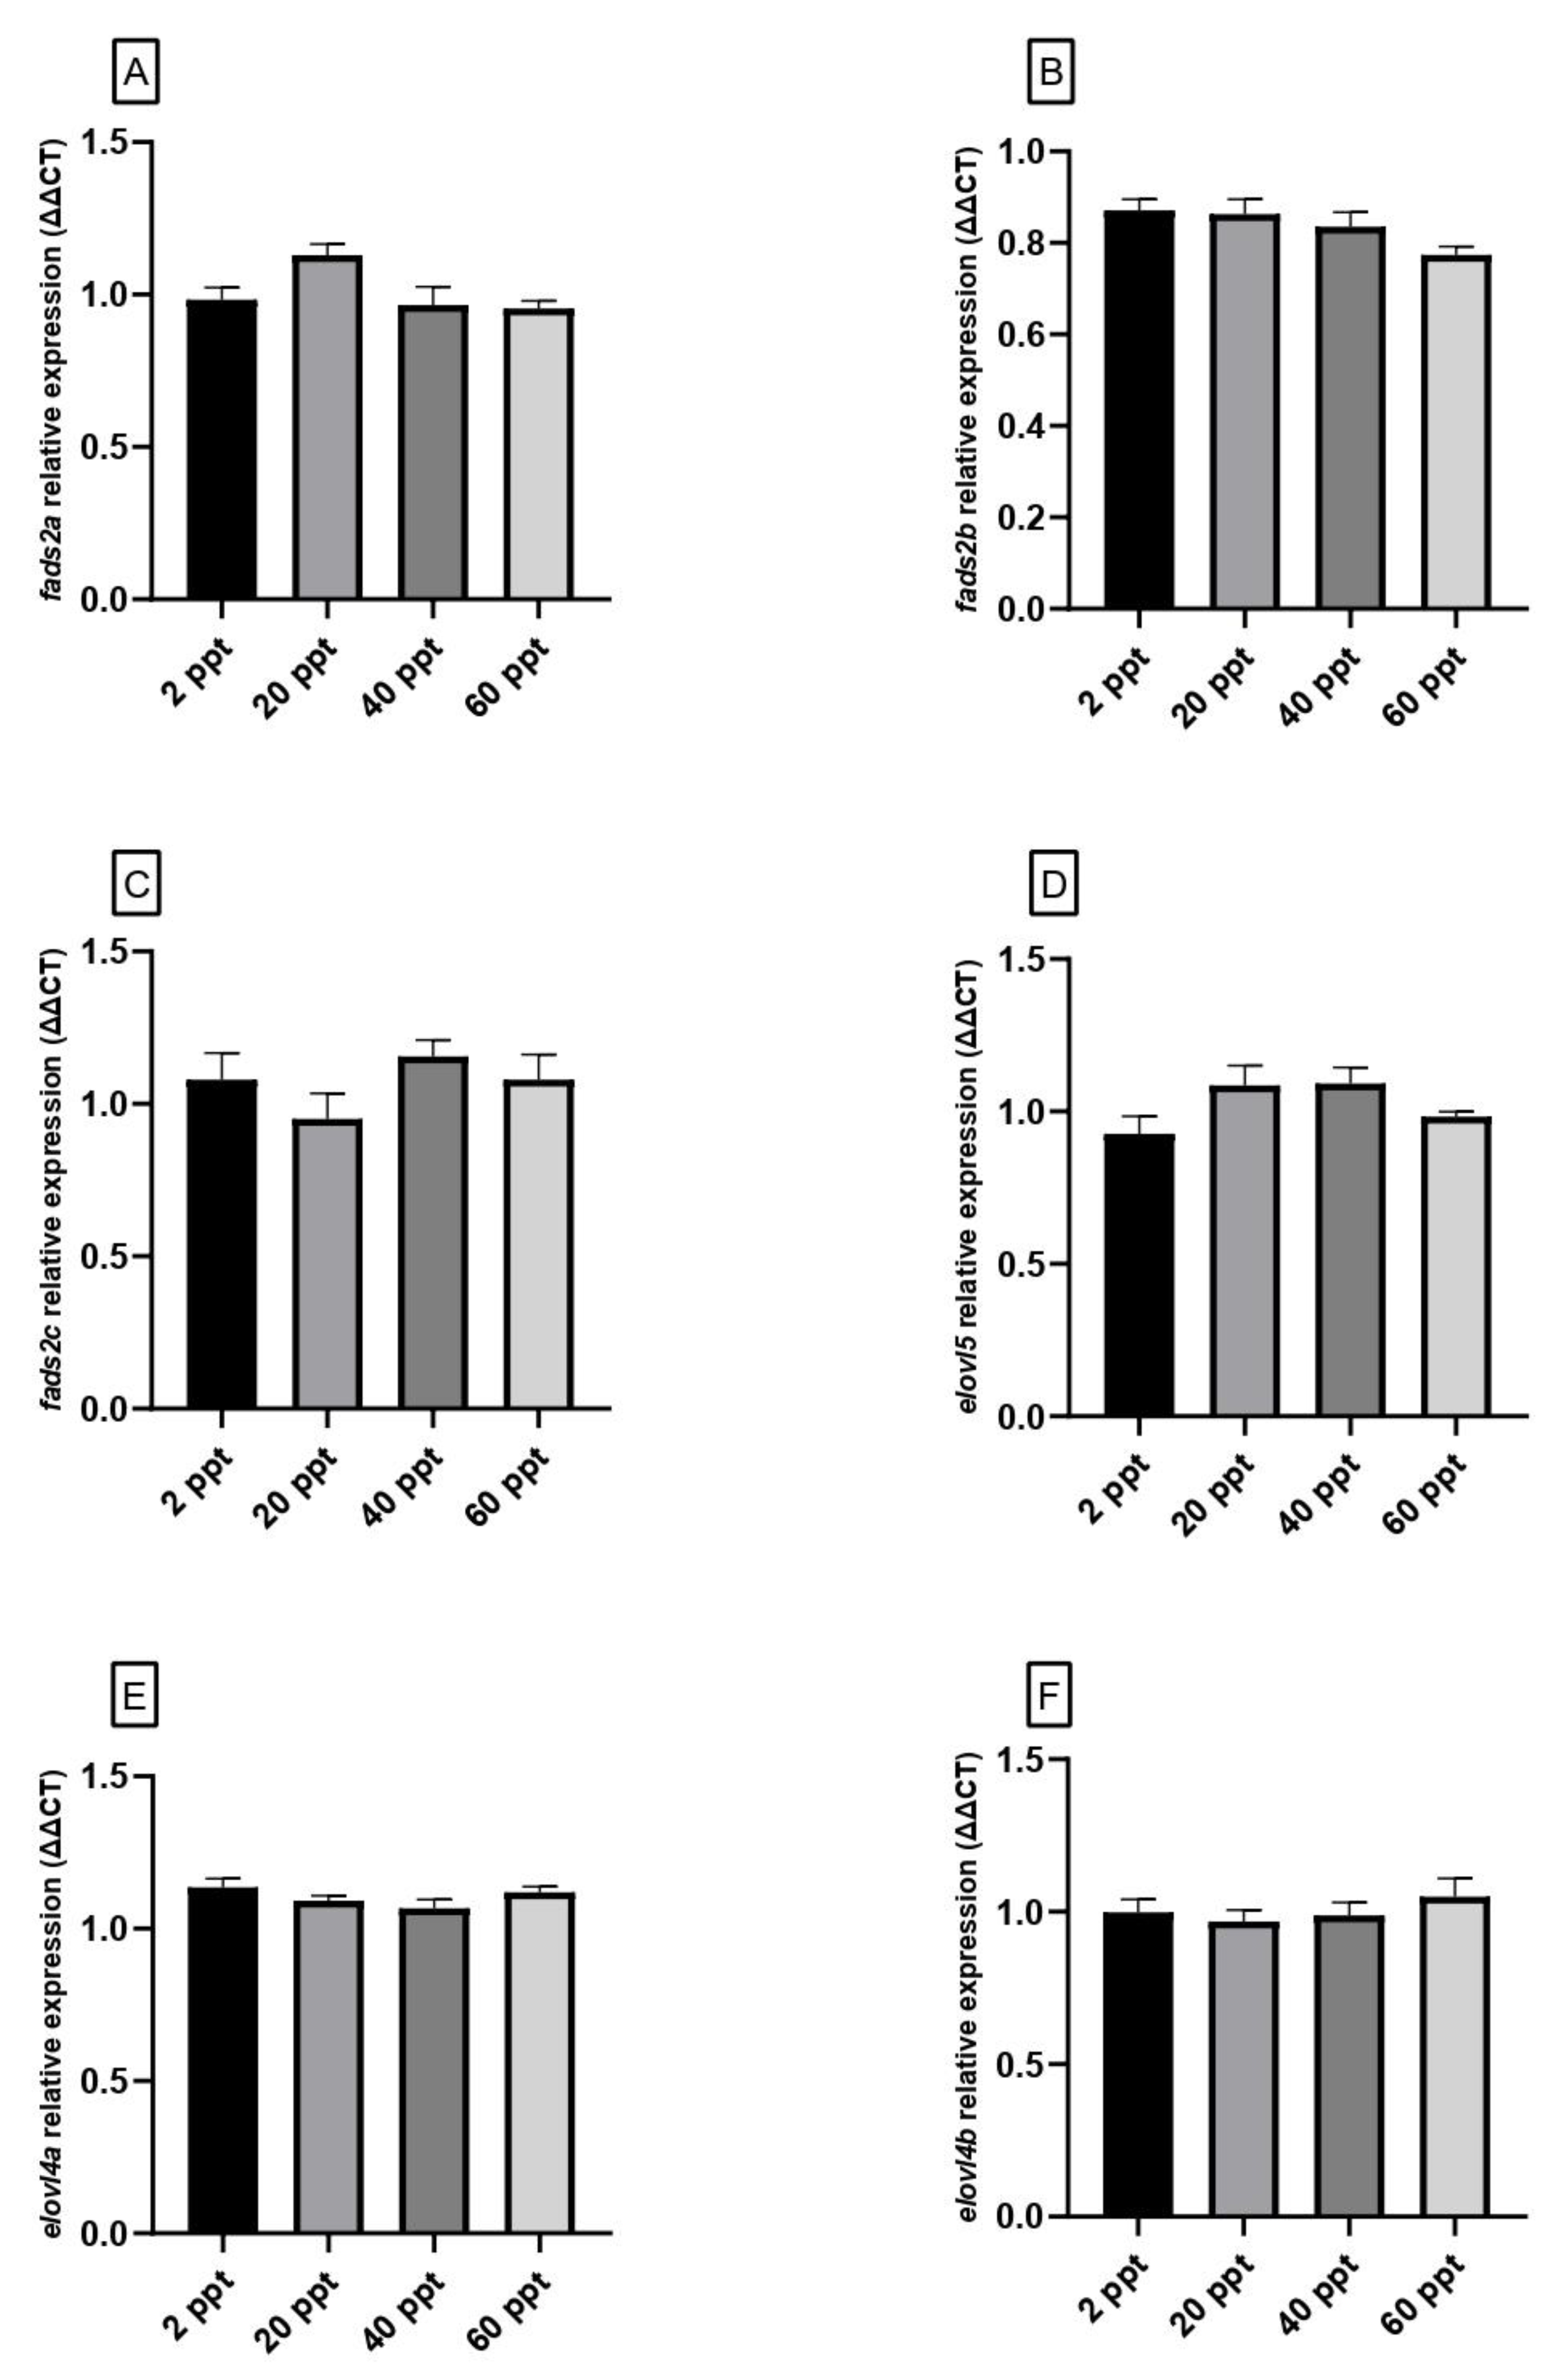
Figure 3.
Gene expression levels (relative to actb and eef1) of eye fads2a (A), fads2b (B), fads2c (C), elovl5 (D), elovl4a (E) and elovl4b (F) in Fundulus heteroclitus acclimated to different environmental salinities (2, 20, 40, and 60 ppt) for 62 days. Data are shown as the mean ± SEM (n = 12). Different superscript letters indicate significant differences among salinities based on one-way ANOVA and Tukey’s test (p ≤ 0.05).
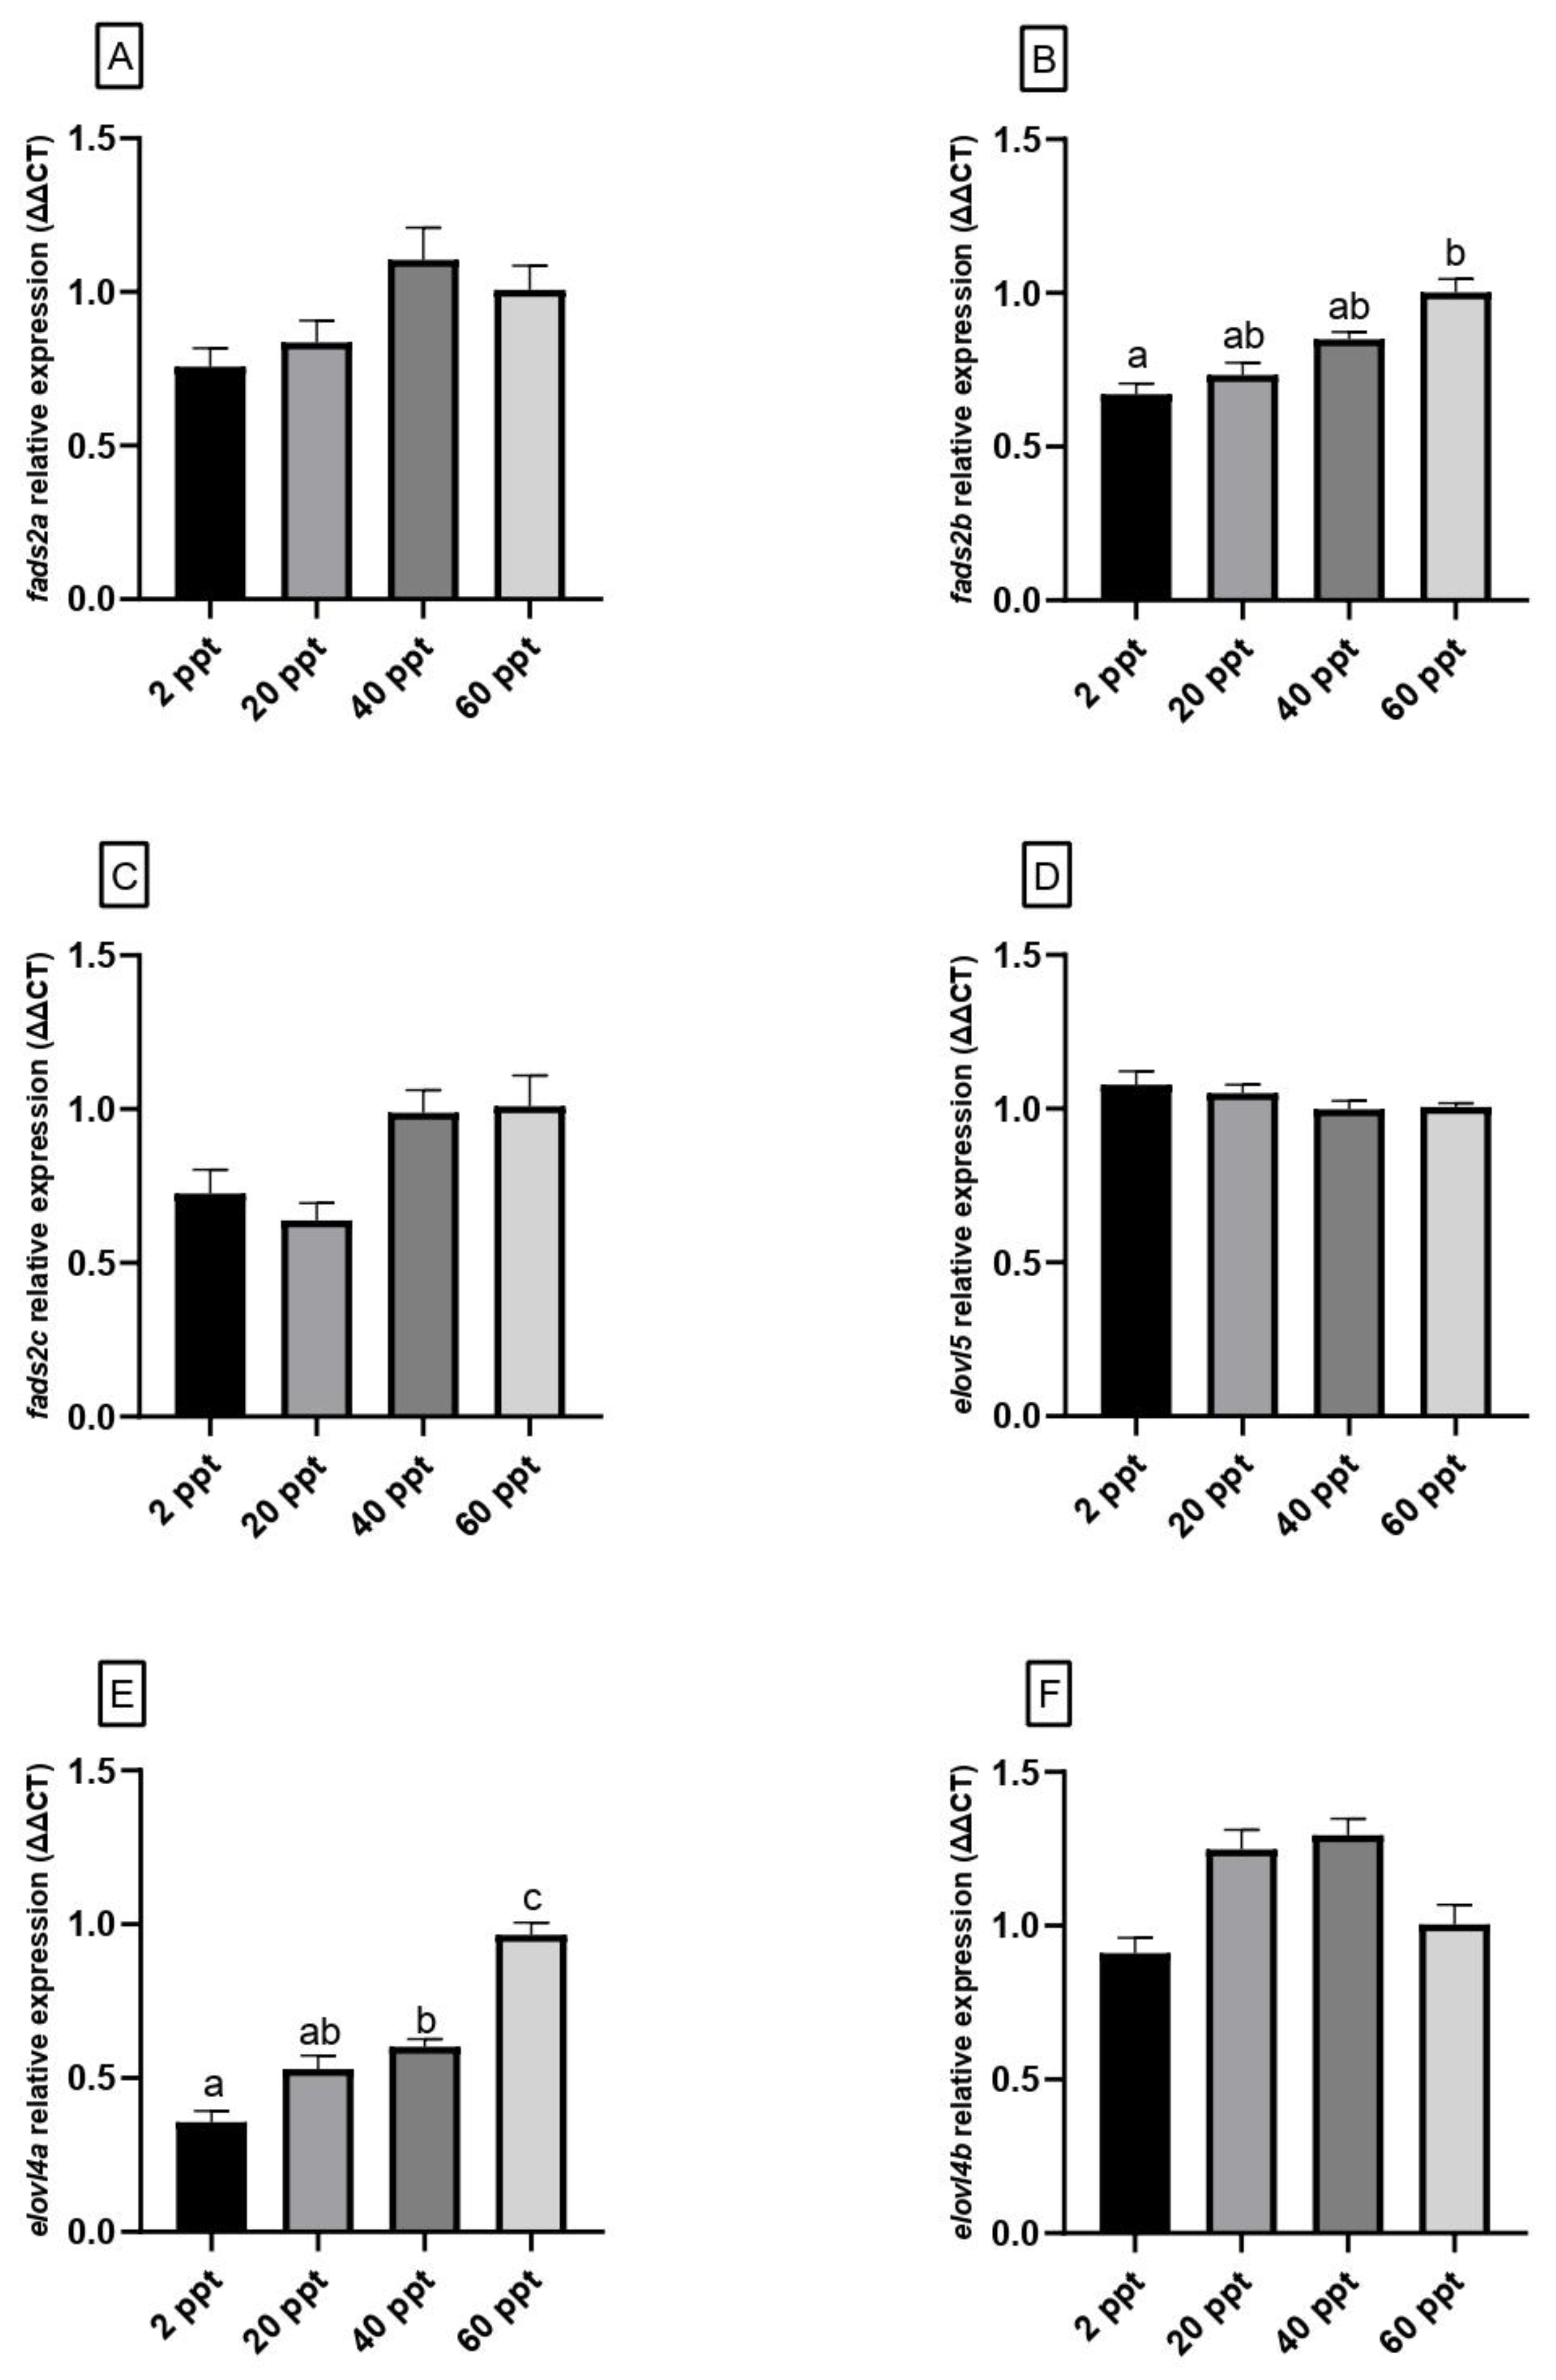

Table 1.
Specific primers used for real-time quantitative PCR (qPCR) of Fundulus heteroclitus genes. Sequences of the primer pairs used (Forward: F; Reverse: R), size of the fragments produced, and accession number of the sequences used for the primer design are shown.
Table 1.
Specific primers used for real-time quantitative PCR (qPCR) of Fundulus heteroclitus genes. Sequences of the primer pairs used (Forward: F; Reverse: R), size of the fragments produced, and accession number of the sequences used for the primer design are shown.
| Gene | Genbank Acc. Nº | Amplicon length (bp) |
Primer sequence (5’–3’) | |
|---|---|---|---|---|
| actin beta (actb) | XM_012850364.3 | 163 | F: GCCAACAGGGAGAAGATGAC R: CCTCGTAGATGGGCACTG |
|
| eukaryotic elongation factor 1 alpha (eef1a) | XM_012852503.3 | 179 | F: CACCACCACAGGACACCTTA R: CAAACTTCCACAGCGAGATG |
|
| fatty acyl desaturase 2a (fads2a) | XM_036148888.1 | 200 | F: CACTGGTTTGTGTGGGTGAC R: AGGTGGTAGTTGTGCCTTGG |
|
| fatty acyl desaturase 2b (fads2b) | XM_012865392.3 | 175 | F: AGGACTGGCTGACCATGC R: CCGTGTTTCTCACACAGCTC |
|
| fatty acyl desaturase 2a (fads2c) | XM_036148890.1 | 183 | F: AATCAAGACTGGCTGACCAT R: CACTCCGTGCTTCTCACACA |
|
| fatty acid elongase 5 (elovl5) | XM_036126476.1 | 85 | F: TGTTCTCGTTCATTGTGCTTT R: TTCTGATGCTCCTTCCTTCG |
|
| fatty acid elongase 4a (elovl4a) | XM_012864666.3 | 200 | F: AGGAGCCCTCTGGTGGTACT R: GGATCAGTGCGTTCATGTGT |
|
| fatty acid elongase 4b (elovl4b) | XM_012868850.3 | 177 | F: TTCGGTGCAACCATCAACT R: GCAGCCAGTGTAGAGGGAAT |
|
Table 2.
Growth performance and somatic indices of Fundulus heteroclitus acclimated to different environmental salinity (2, 20, 40, and 60 ppt) for 62 days.
Table 2.
Growth performance and somatic indices of Fundulus heteroclitus acclimated to different environmental salinity (2, 20, 40, and 60 ppt) for 62 days.
| Parameters | 2 ppt | 20 ppt | 40 ppt | 60 ppt |
| Mi (g)* | 4.67 ± 0.33 | 3.89 ± 0.25 | 4.52 ± 0.39 | 3.82 ± 0.24 |
| Mf (g)* | 7.34 ± 0.34b | 5.44 ± 0.20a | 5.66 ± 0,26a | 4.72 ± 0.15a |
| TLf (cm)* | 6.68 ± 0.11b | 6.23 ± 0.11a | 6.22 ± 0.11a | 5.96 ± 0.08a |
| K * | 2.47 ± 0.05b | 2.44 ± 0.05b | 2.38 ± 0.03ab | 2.25 ± 0.03a |
| MG (%) * | 54.20 ± 2.85b | 51.54 ± 5.12b | 40.16 ± 6.01ab | 26.92 ± 6.33a |
| SGR (% day-1) * | 0.86 ± 0.05b | 0.83 ± 0.10b | 0.67 ± 0.10ab | 0.48 ± 0.11a |
| FE * | 0.54 ± 0.00b | 0.52 ± 0.02b | 0.58 ± 0.04b | 0.39 ± 0.03a |
| HSI (%) ** | 2.97 ± 0.28ab | 2.68 ± 0.15ab | 3.32 ± 0.21b | 2.31 ± 0.21a |
| VSI (%) ** | 7.58 ± 0.39ab | 7.93 ± 0.29ab | 8.57 ± 0.29b | 7.13 ± 0.34a |
| ILI (%) ** | 89.07 ± 4.06 | 93.76 ± 5.44 | 98.77 ± 5.39 | 93.55 ± 4.08 |
Data on growth parameters are shown as the mean ± SEM of 45 fish (*). Data on somatic indices are shown as the mean ± SEM of 24 fish (**). Different superscript letters in each row denote significant differences among water salinity fish groups (2, 20, 40, and 60 ppt) based on one-way ANOVA and Tukey test (p ≤ 0.05). Mi: Initial Body Mass; Mf: Final Body Mass; TLf: Final Total length; K: Fulton’s condition factor; MG: Mass Gain; SGR: Specific Growth Rate; FE: Feed Efficiency; HSI: Hepatosomatic index; VSI: Viscerosomatic index; ILI: Intestine Length Index.
Table 3.
Plasma, liver, and muscle biochemistry of Fundulus heteroclitus acclimated to different environmental salinities (2, 20, 40, and 60 ppt) for 62 days. Data are the mean ± SEM (n = 12). Different superscript letters indicate significant differences among salinities based on one-way ANOVA and Tukey’s test (p ≤ 0.05). Liver and muscle values are expressed as mmols per gram of the wet mass of tissues (g-1 w.m.). TBA: Total bile acids.
| Plasma | 2 ppt | 20 ppt | 40 ppt | 60 ppt |
| Osmolality (mOsm kg-1) | 435.8 ± 19,14ab | 392.7 ± 12.26a | 381.4 ± 6.282a | 469.8 ± 22.24b |
| TBA (µmol/L) | 71.94 ± 18.16 | 72.48 ± 13.36 | 67.7± 10.03 | 69.63 ± 14.31 |
| Cortisol (ng/mL) | 99.6 ± 19.38a | 237.3 ± 34.62ab | 231.4 ± 37.98ab | 358.5 ± 49.21b |
| Proteins (mg/mL) | 38.45 ± 3.26 | 33.97 ± 0.95 | 38.63 ± 0.83 | 31.78 ± 0.94 |
| Glucose (mM) | 5.62 ± 1.20 | 4.63 ± 0.41 | 3.91 ± 0.55 | 4.35 ± 0.43 |
| Lactate (mM) | 14.93 ± 1.27 | 14.03 ± 0.85 | 13.56 ± 0.65 | 12.71 ± 0.98 |
| Triglycerides (mM) | 5.31 ± 0.39b | 3.20 ± 0.24a | 4.77 ± 0.28b | 2.75 ± 0.21a |
| Cholesterol (mM) | 4.75 ± 0.16b | 4.52 ± 0.21ab | 5.16 ± 0.22b | 3.81 ± 0.25a |
| Liver | ||||
| Glucose (mmol g-1 w.m.) | 14.61 ± 0.91a | 14.56 ± 0.67a | 21.12 ± 2.05b | 18.46 ± 0.23b |
| Glycogen (mmol g-1 w.m.) | 43.03 ± 4.51 | 31.70 ± 2.07 | 42.21 ± 6.03 | 38.45 ± 4.33 |
| Lactate (mmol g-1 w.m.) | 7.43 ± 0.83a | 5.85 ± 0.46a | 12.31 ± 1.78b | 11.05 ± 1.16b |
| Triglycerides (mmol g-1 w.m.) | 68.42 ± 3.70 | 72.03 ± 5.77 | 67.33 ± 5.97 | 60.60 ± 5.52 |
| Cholesterol (mmol g-1 w.m.) | 27.10 ± 2.56 | 30.39 ± 2.53 | 22.69 ± 1.75 | 23.82 ± 2.09 |
| Muscle | ||||
| Glucose (mmol g-1 w.m.) | 2.64 ± 0.18b | 2.38 ± 0.19ab | 2.48 ± 0.15ab | 1.88 ± 0.15a |
| Glycogen (mmol g-1 w.m.) | 3.02 ± 0.50a | 2.13 ± 0.43a | 5.71 ± 0.82b | 3.64 ± 0.63ab |
| Lactate (mmol g-1 w.m.) | 21.45 ± 0.91 | 22.22 ± 1.94 | 22.29 ± 0.98 | 22.14 ± 1.05 |
| Triglycerides (mmol g-1 w.m.) | 4.48 ± 0.51b | 3.22 ± 0.50ab | 3.00 ± 0.44ab | 2.78 ± 0.35a |
| Cholesterol (mmol g-1 w.m.) | 1.79 ± 0.35 | 1.92 ± 0.39 | 1.92 ± 0.49 | 2.34 ± 0.53 |
Table 4.
Selected fatty acid content (% of total fatty acids) from the brain of Fundulus heteroclitus acclimated to different environmental salinities (2, 20, 40, and 60 ppt) for 62 days. Results are expressed as the mean ± SEM (n = 6). Different superscript letters denote significant differences among salinities (one-way ANOVA and Tukey test, P ≤ 0.05).
| Brain | ||||
|---|---|---|---|---|
| Unsaturated Fatty Acid | 2 ppt | 20 ppt | 40 ppt | 60 ppt |
| 14:1n-5 (myristoleic acid) | 0.21 ± 0.02 | 0.24 ± 0.03 | 0.23 ± 0.01 | 0.22 ± 0.02 |
| 16:1n-7 (palmitoleic acid) | 3.51 ± 0.59a | 2.89 ± 0.54a | 3.08 ± 0.60a | 8.08 ± 1.25b |
| 18:1n-9 (oleic acid) | 1.11 ± 0.20ab | 0.92 ± 0.10a | 1.34 ± 0.33ab | 2.40 ± 0.57b |
| 18:2n-6 (linoleic acid) | 0.59 ± 0.10ab | 0.42 ± 0.05a | 0.75 ± 0.24ab | 1.33 ± 0.32b |
| 18:3n-6 (γ-linolenic acid) | 0.38 ± 0.03 | 0.37 ± 0.05 | 0.35 ± 0.01 | 0.39 ± 0.05 |
| 18:3n-3 (α-linolenic acid) | 0.30 ± 0.03 | 0.34 ± 0.05 | 0.33 ± 0.02 | 0.36 ± 0.04 |
| 20:3n-6 (dihomo-γ-linolenic acid) | 0.37 ± 0.04 | 0.46 ± 0.06 | 0.43 ± 0.02 | 0.45 ± 0.05 |
| 20:3n-3 (docosatrienoic acid) | 0.04 ± 0.01a | 0.04 ± 0.01a | 0.06 ± 0.01a | 0.51 ± 0.16b |
| 20:4n-6 (arachidonic acid) | 2.45 ± 0.33ab | 1.41 ± 0.26a | 1.81 ± 0.25a | 4.81 ± 0.85b |
| 20:5n-3 (eicosapentaenoic acid) | 3.69 ± 0.50ab | 1.31 ± 0.27a | 5.17 ± 0.47b | 4.13 ± 0.27ab |
| 22:1n-9 (erucic acid) | 0.62 ± 0.05 | 0.60 ± 0.05 | 0.72 ± 0.13 | 1.06 ± 0.18 |
| 22:6n-3 (docosahexaenoic acid) | 11.82 ± 2.04 | 12.69 ± 2.17 | 17.89 ± 4.06 | 24.12 ± 5.23 |
| 22:2n-6 (docosadienoic acid) | 0.97 ± 0.15 | 0.76 ± 0.09 | 0.78 ± 0.06 | 0.89 ± 0.12 |
| Total MUFA | 5.44 ± 0.86 | 4.64 ± 0.73 | 5.36 ± 1.08 | 11.75 ± 2.02 |
| Total PUFA | 20.60 ± 3.22 | 17.8 ± 3.02 | 27.56 ± 5.15 | 37.00 ± 7.09 |
| Total UFA | 26.05 ± 4.08 | 22.44 ± 3.75 | 32.92 ± 6.22 | 48.76 ± 9.11 |
MUFA: monounsaturated fatty acids; PUFA: polyunsaturated fatty acids; UFA: Unsaturated fatty acids.
Table 5.
Selected fatty acid content (% of total fatty acids) from the eye of Fundulus heteroclitus acclimated to different environmental salinities (2, 20, 40, and 60 ppt) for 62 days. Results are expressed as the mean ± SEM (n = 6). Different superscript letters denote significant differences among salinities (one-way ANOVA and Tukey test, P ≤ 0.05).
| Eye | ||||
|---|---|---|---|---|
| Unsaturated Fatty Acid | 2 ppt | 20 ppt | 40 ppt | 60 ppt |
| 14:1n-5 (myristoleic acid) | 0.39 ± 0.04 | 0.24 ± 0.03 | 0.22 ± 0.05 | 0.28 ± 0.02 |
| 16:1n-7 (palmitoleic acid) | 4.07 ± 0.08ab | 3.83 ± 0.28ab | 3.54 ± 0.24a | 4.61 ± 0.10b |
| 18:1n-9 (oleic acid) | 2.74 ± 0.20 | 2.46 ± 0.30 | 2.02 ± 0.26 | 2.70 ± 0.09 |
| 18:2n-6 (linoleic acid) | 0.93 ± 0.08 | 0.85 ± 0.12 | 0.67 ± 0.11 | 1.00 ± 0.03 |
| 18:3n-6 (γ-linolenic acid) | 0.26 ± 0.07 | 0.19 ± 0.11 | 0.15 ± 0.11 | 0.21 ± 0.08 |
| 18:3n-3 (α-linolenic acid) | 1.25 ± 0.16 | 1.27 ± 0.04 | 0.74 ± 0.23 | 1.10 ± 0.06 |
| 20:3n-6 (dihomo-γ-linolenic acid) | 0.11 ± 0.01 | 0.12 ± 0.03 | 0.09 ± 0.03 | 0.11 ± 0.01 |
| 20:3n-3 (docosatrienoic acid) | 0.08 ± 0.01 | 0.07 ± 0.01 | 0.09 ± 0.03 | 0.07 ± 0.01 |
| 20:4n-6 (arachidonic acid) | 2.62 ± 0.22 | 3.14 ± 0.21 | 3.50 ± 0.26 | 2.67 ± 0.23 |
| 20:5n-3 (eicosapentaenoic acid) | 1.83 ± 0.12b | 1.44 ± 0.13ab | 1.36 ± 0.23ab | 0.84 ± 0.06a |
| 22:1n-9 (erucic acid) | 0.88 ± 0.16 | 0.55 ± 0.14 | 0.95 ± 0.39 | 0.80 ± 0.08 |
| 22:6n-3 (docosahexaenoic acid) | 16.03 ± 0.46 | 19.31 ± 0.45 | 16.71 ± 1.68 | 15.12 ± 0.99 |
| 22:2n-6 (docosadienoic acid) | 0.11 ± 0.01 | 0.13 ± 0.02 | 0.13 ± 0.02 | 0.09 ± 0.02 |
| Total MUFA | 8.08 ± 0.48 | 7.08 ± 0.75 | 6.42 ± 0.94 | 8.39 ± 0.30 |
| Total PUFA | 23.23 ± 1.11 | 26.52 ± 1.07 | 23.40 ± 2.63 | 21.20 ± 1.43 |
| Total UFA | 31.31 ± 1.59 | 33.60 ± 1.82 | 29.82 ± 3.56 | 29.59 ± 1.73 |
MUFA: monounsaturated fatty acids; PUFA: polyunsaturated fatty acids; UFA: Unsaturated fatty acids.
Disclaimer/Publisher’s Note: The statements, opinions and data contained in all publications are solely those of the individual author(s) and contributor(s) and not of MDPI and/or the editor(s). MDPI and/or the editor(s) disclaim responsibility for any injury to people or property resulting from any ideas, methods, instructions or products referred to in the content. |
© 2025 by the authors. Licensee MDPI, Basel, Switzerland. This article is an open access article distributed under the terms and conditions of the Creative Commons Attribution (CC BY) license (https://creativecommons.org/licenses/by/4.0/).
Copyright: This open access article is published under a Creative Commons CC BY 4.0 license, which permit the free download, distribution, and reuse, provided that the author and preprint are cited in any reuse.


