
Submitted:
14 July 2025
Posted:
15 July 2025
You are already at the latest version
Abstract
Fatty acids play important, yet different roles in bacterial physiology, specifically their growth. On the one hand, these compounds may be used by bacteria to produce storage materials or serve as a carbon source. On the other hand, due to their influence on biolog-ical membranes, fatty acids have been reported to exhibit antimicrobial effects. It was in-dicated that the length of the fatty acid chain is crucial for specific effects on bacterial cells. However, the literature still contains reports of contradictory findings in studies on these molecules. Here, we present results showing to what degree short- and medium-chain fatty acids (butyric acid (butanoic acid, C4:0); caproic acid (hexanoic acid, C6:0); caprylic acid (octanoic acid, C8:0)), used at relatively low concentrations (in a range of g/mL, spe-cifically 0.25-16 g/mL, contrary to previously reported mg/mL which revealed inhibitory effects on bacterial growth) affect growth of Escherichia coli K-12 (MG1655 laboratory strain) depending on various conditions. In rich medium (LB) positive effects of all tested fatty acids on E. coli growth were observed, while temperature of incubation (growth at 25oC and 37oC was assessed) modulated these effects. In contrast, a slight but significant growth inhibition by fatty acids was observed in a minimal medium (M9) supplemented with glucose. Nonetheless, in minimal medium containing acetate, the effects of these compounds varied, being either positive or negative depending on their concentrations. No measurable bacterial growth was observed in the case of the presence of any tested fatty acids when primary carbon source (glucose or acetate) was removed from a minimal medium before addition of butyric acid, caproic acid or caprylic acid. These results indi-cated that effects of fatty acids on E. coli cells depend on growth conditions of bacterial cultures, and may suggest that previously reported discrepancies between results ob-tained by various groups might arise, at least partially, from using various cultivation procedures used for different experiments.
Keywords:
fatty acids
; bacterial growth
; Escherichia coli cultivation conditions
1. Introduction
Fatty acids play important roles in physiology of both prokaryotic and eukaryotic organisms [1]. These compounds are commonly classified according to the length of their aliphatic chain; when molecules contain 6 or less carbon atoms, they are called ‘short-chain fatty acids’, the chains made of 8-10 carbons are characteristic for ‘medium-chain fatty acids’, and ‘long-chain fatty acids’ contain 12 carbons or more. In bacteria, fatty acids are components of cell membranes, being either produced in cells or directly incorporated into bacterial membranes from external sources [2], and can be used either as a carbon source or for storage material production [3]. Furthermore, fatty acids are known for their antibacterial activities [4].
When fatty acids serve as carbon/energy source, their molecules must be transported into bacterial cells and then degraded in specific biochemical pathways. Short-chain and medium-chain fatty acids can enter the cell through either a free diffusion or using porins in membranes, while long-chain fatty acids require specialized importer proteins [5]. The degradation pathway of fatty acid is conducted through the β-oxidation cycles, the evolutionary conserved process which is best understood in Escherichia coli [3].
Despite using fatty acids as a carbon source, various reports described antibacterial properties of these compounds [4]. Early experiments demonstrated that caprylic acid (octanoic acid) and capric acid (decanoic acid) revealed antimicrobial properties toward E. coli, which was not observed for short-chain and long-chain fatty acids [6]. On the other hand, a strong inhibition of E. coli growth was reported for both caproic acid and caprylic acid [7]. Further studies, based on proteomic analyses, suggested that antibacterial effects of caprylic acid were caused predominantly due to damaging of cell membranes and inducing oxidative stress [8].
Therefore, in the light opposite effects of fatty acids on bacteria summarized above (the source of carbon and energy, and growth inhibition), we asked about conditions which might cause predominance of one of these effects, positive or negative. Determination of such a feature would be valuable for applied microbiological purposes, especially for optimizing cultivation conditions in bioreactors during biotechnological production as well as for intestinal microbiota regulation in various therapies. Since the bacterial metabolism of fatty acids and their antibacterial properties are best described for E. coli (see above), we have employed the widely used E. coli K-12 strain MG1655. As antibacterial effects of short-chain and medium-chain fatty acids were mostly investigated and described in previous reports, we used butyric acid (butanoic acid, C4:0), caproic acid (hexanoic acid, C6:0), and caprylic acid (octanoic acid, C8:0). However, contrary to most previous reports mentioned above, where concentrations of fatty acids were in a range of mg/mL, we focused on the use of low concentrations of these compounds, in a range of μg/mL, as the latter conditions might better reflect those occurring in mammalian intestine, as well as those easily reached during bacterial cultivation for biotechnological purposes. Moreover, different growth temperatures were tested, 37 °C and 25 °C; the former temperature reflecting natural E. coli habitat (mammalian gut) and standard laboratory conditions, while the latter temperature being employed for slow bacterial growth in cultures as well as occurring in an external environment, i.e. outside the mammalian body.
2. Materials and Methods
2.1. Bacterial Strain and Culture Conditions
Escherichia coli K-12 strain MG1655 [9] was used in the experiments. Bacteria were cultured at 25 °C or 37 °C in LB (BioShop, Burlington, ON, Canada) or M9 medium (BioShop, Burlington, ON, Canada). Bacteriological agar (BioShop, Burlington, ON, Canada) at a final concentration of 1% was used in solidified media (LB-agar or M9-agar). The exact composition of LB and M9 media and a scheme of the experiment are shown in Figure 1.
2.2. Saturated Fatty Acids
Three saturated fatty acids were used in the experiments: butyric acid (butanoic acid, C4:0), caproic acid (hexanoic acid, C6:0), and caprylic acid (octanoic acid, C8:0) (all purchased from Warchem, Poland; all with purity >95%). All acids were dissolved in 100% DMSO (Pol-Aura, Poland), and solutions of these acids were prepared in sterile water (Eurx, Poland) at concentrations of 16 mg/mL, 8 mg/mL, 4 mg/mL, 2 mg/mL, 1 mg/mL, 0.5 mg/mL, and 0.25 mg/mL. The final concentration of DMSO in these solutions, as well as in control sample, was 0.5 %. Then, these solutions were added to the medium at 1:1000 (v/v) ratio to obtain final concentrations of 16, 8, 4, 2, 1, 0.5, 0.25, and 0 (control) μg/mL, respectively.
2.3. Testing Effects of Saturated Fatty Acids as an Additional Carbon Source on the Growth of Escherichia coli
An overnight culture of E. coli MG1655 was inoculated from one bacterial colony grown on LB-agar or M9-agar medium and cultured in LB or M9 medium with 0.2% glucose or acetate for 24 h at 25 °C or 37 °C. Then, the overnight culture of bacteria was suspended in LB or M9 medium with 0.2% glucose or acetate at a 1:100 ratio (v/v) and cultured in a water bath with shaking (180 rpm) at 25 °C or 37 °C.
At OD600 = 0.1 (measured by using SmartSpecPLUS, BIO-RAD, CA, USA) bacteria were loaded to the wells of a 96-well plate and appropriate concentrations of butyric, caproic or caprylic acid were added, and cells were cultured with shaking at 25 °C or 37 °C for 20 h, with measuring of OD600 every 0.5 h (measured by using Varioskan Lux, Waltham, MA, USA). The negative control was a bacterial culture growing in LB or M9 medium with the addition of an appropriate amount of sterile water (Eurx, Poland).
2.4. Testing Effects of Saturated Fatty Acids as the Only Carbon Source on the Growth of Escherichia coli
The initial stages of the experiment were analogous to those presented in Section 2.3. with some modifications. When the bacterial culture reached OD600 = 0.1 (measured by using SmartSpecPLUS, BIO-RAD, CA, USA), it was centrifuged at 4000 ×g for 15 min at 4 °C (Avanti JXN-26, rotor JS-13.1, Beckman Coulter, IN, USA). The supernatant was removed, and the bacterial pellet was dissolved in DPBS buffer (Gibco, Waltham, MA, USA) to eliminate residual medium and centrifuged at 4000 ×g for 15 min at 4 ◦C (Avanti JXN-26, rotor JS-13.1, Beckman Coulter, IN, USA). Then, the supernatant was removed and the bacterial pellet was dissolved in LB or M9 medium without a carbon source. A saturated fatty acid was added to the bacterial culture at indicated concentration and bacteria were cultured with shaking for 20 h, with measuring OD600 every 0.5 h (measured by using Varioskan Lux, Waltham, MA, USA). The negative control was a bacterial culture growing in M9 medium with glucose or acetate as a carbon source.
2.5. Statistical Analysis
Each experiment was conducted three times (biological repeats). Statistical analysis of the data was performed using IBM SPSS v.14 software. First, the normality distribution of the data was checked using the Kolomogorov-Smirnov test, followed by the Levene's test to assess the homogeneity of variance. When both of the above assumptions were met, a one-way ANOVA with Tukey post-hoc test was performed. If one of these assumptions was not met, the Kruskal-Wallis test with Dunn's post-hoc test was performed. Statistical significance (p<0.05) is marked with an asterisk (*).
3. Results
The experiments were conducted using E. coli K-12 strain MG1655, grown in various media (nutrient medium LB or a minimal medium M9 with different carbon sources, glucose or acetate) and at different temperatures (25oC and 37oC). Three different fatty acids were used: butyric acid (butanoic acid, C4:0), caproic acid (hexanoic acid, C6:0), and caprylic acid (octanoic acid, C8:0). These fatty acids were added to bacterial cultures either without removing the primary nutrients or carbon source (glucose or acetate), or with the replacement of glucose or acetate by the tested fatty acid. The scheme of the experiment is presented in Figure 1 and Supplementary Figure S1.
When bacteria were grown at 37oC in LB medium supplemented with fatty acids, a stimulation of growth was observed in the case of all tested compounds (butyric acid, caproic acid, and caprylic acid) at various concentrations relative to the culture without fatty acids added to the medium (Figure 2; see Supplementary Figure S2 for additional tested concentrations of fatty acids). This bacterial growth stimulation was evident especially during the late exponential/stationary phase when E. coli culture densities continued to increase in the presence of fatty acids, whereas bacteria incubated in LB alone ceased to grow.
Stimulation of E. coli growth in LB medium by all tested fatty acids was also observed at 25°C. However, differences in growth rates between cultures with and without butyric acid, caproic acid, or caprylic acid became evident earlier under these conditions, specifically during the mid-exponential phase (Figure 3; see Supplementary Figure S3 for additional tested concentrations of fatty acids).
Contrary to the E. coli growth stimulation by fatty acids observed in LB medium, no growth rate increases could be detected when bacteria were cultured in the M9 minimal medium with glucose. Indeed, a small but statistically significant decrease in the growth rate was evident in the presence of butyric acid, caproic acid or caprylic acid at certain concentrations, relative to the control culture devoid of fatty acids. Such an effect was noted at both 37oC (Figure 4; see Supplementary Figure S4 for additional tested concentrations of fatty acids) and 25oC (Figure 5; see Supplementary Figure S5 for additional tested concentrations of fatty acids).
Intriguingly, when acetate was used instead of glucose as a carbon source in the M9 minimal medium, effects of fatty acids on E. coli growth were either positive or negative, depending on specific concentrations of these compounds and the kind of fatty acid. Nevertheless, while only stimulatory effects could be noted in the presence of butyric acid, both caproic acid or caprylic acid caused either stimulation or inhibition of the bacterial growth at various concentrations (Figure 6; see Supplementary Figure S6 for additional tested concentrations of fatty acids). We suspect that untypical, quite a ‘heterogeneous’, growth of bacterial cultures under these conditions, with some temporary slowdowns and accelerations, might arise from a limited availability of acetate as a carbon source and somewhat unstable physiological conditions.
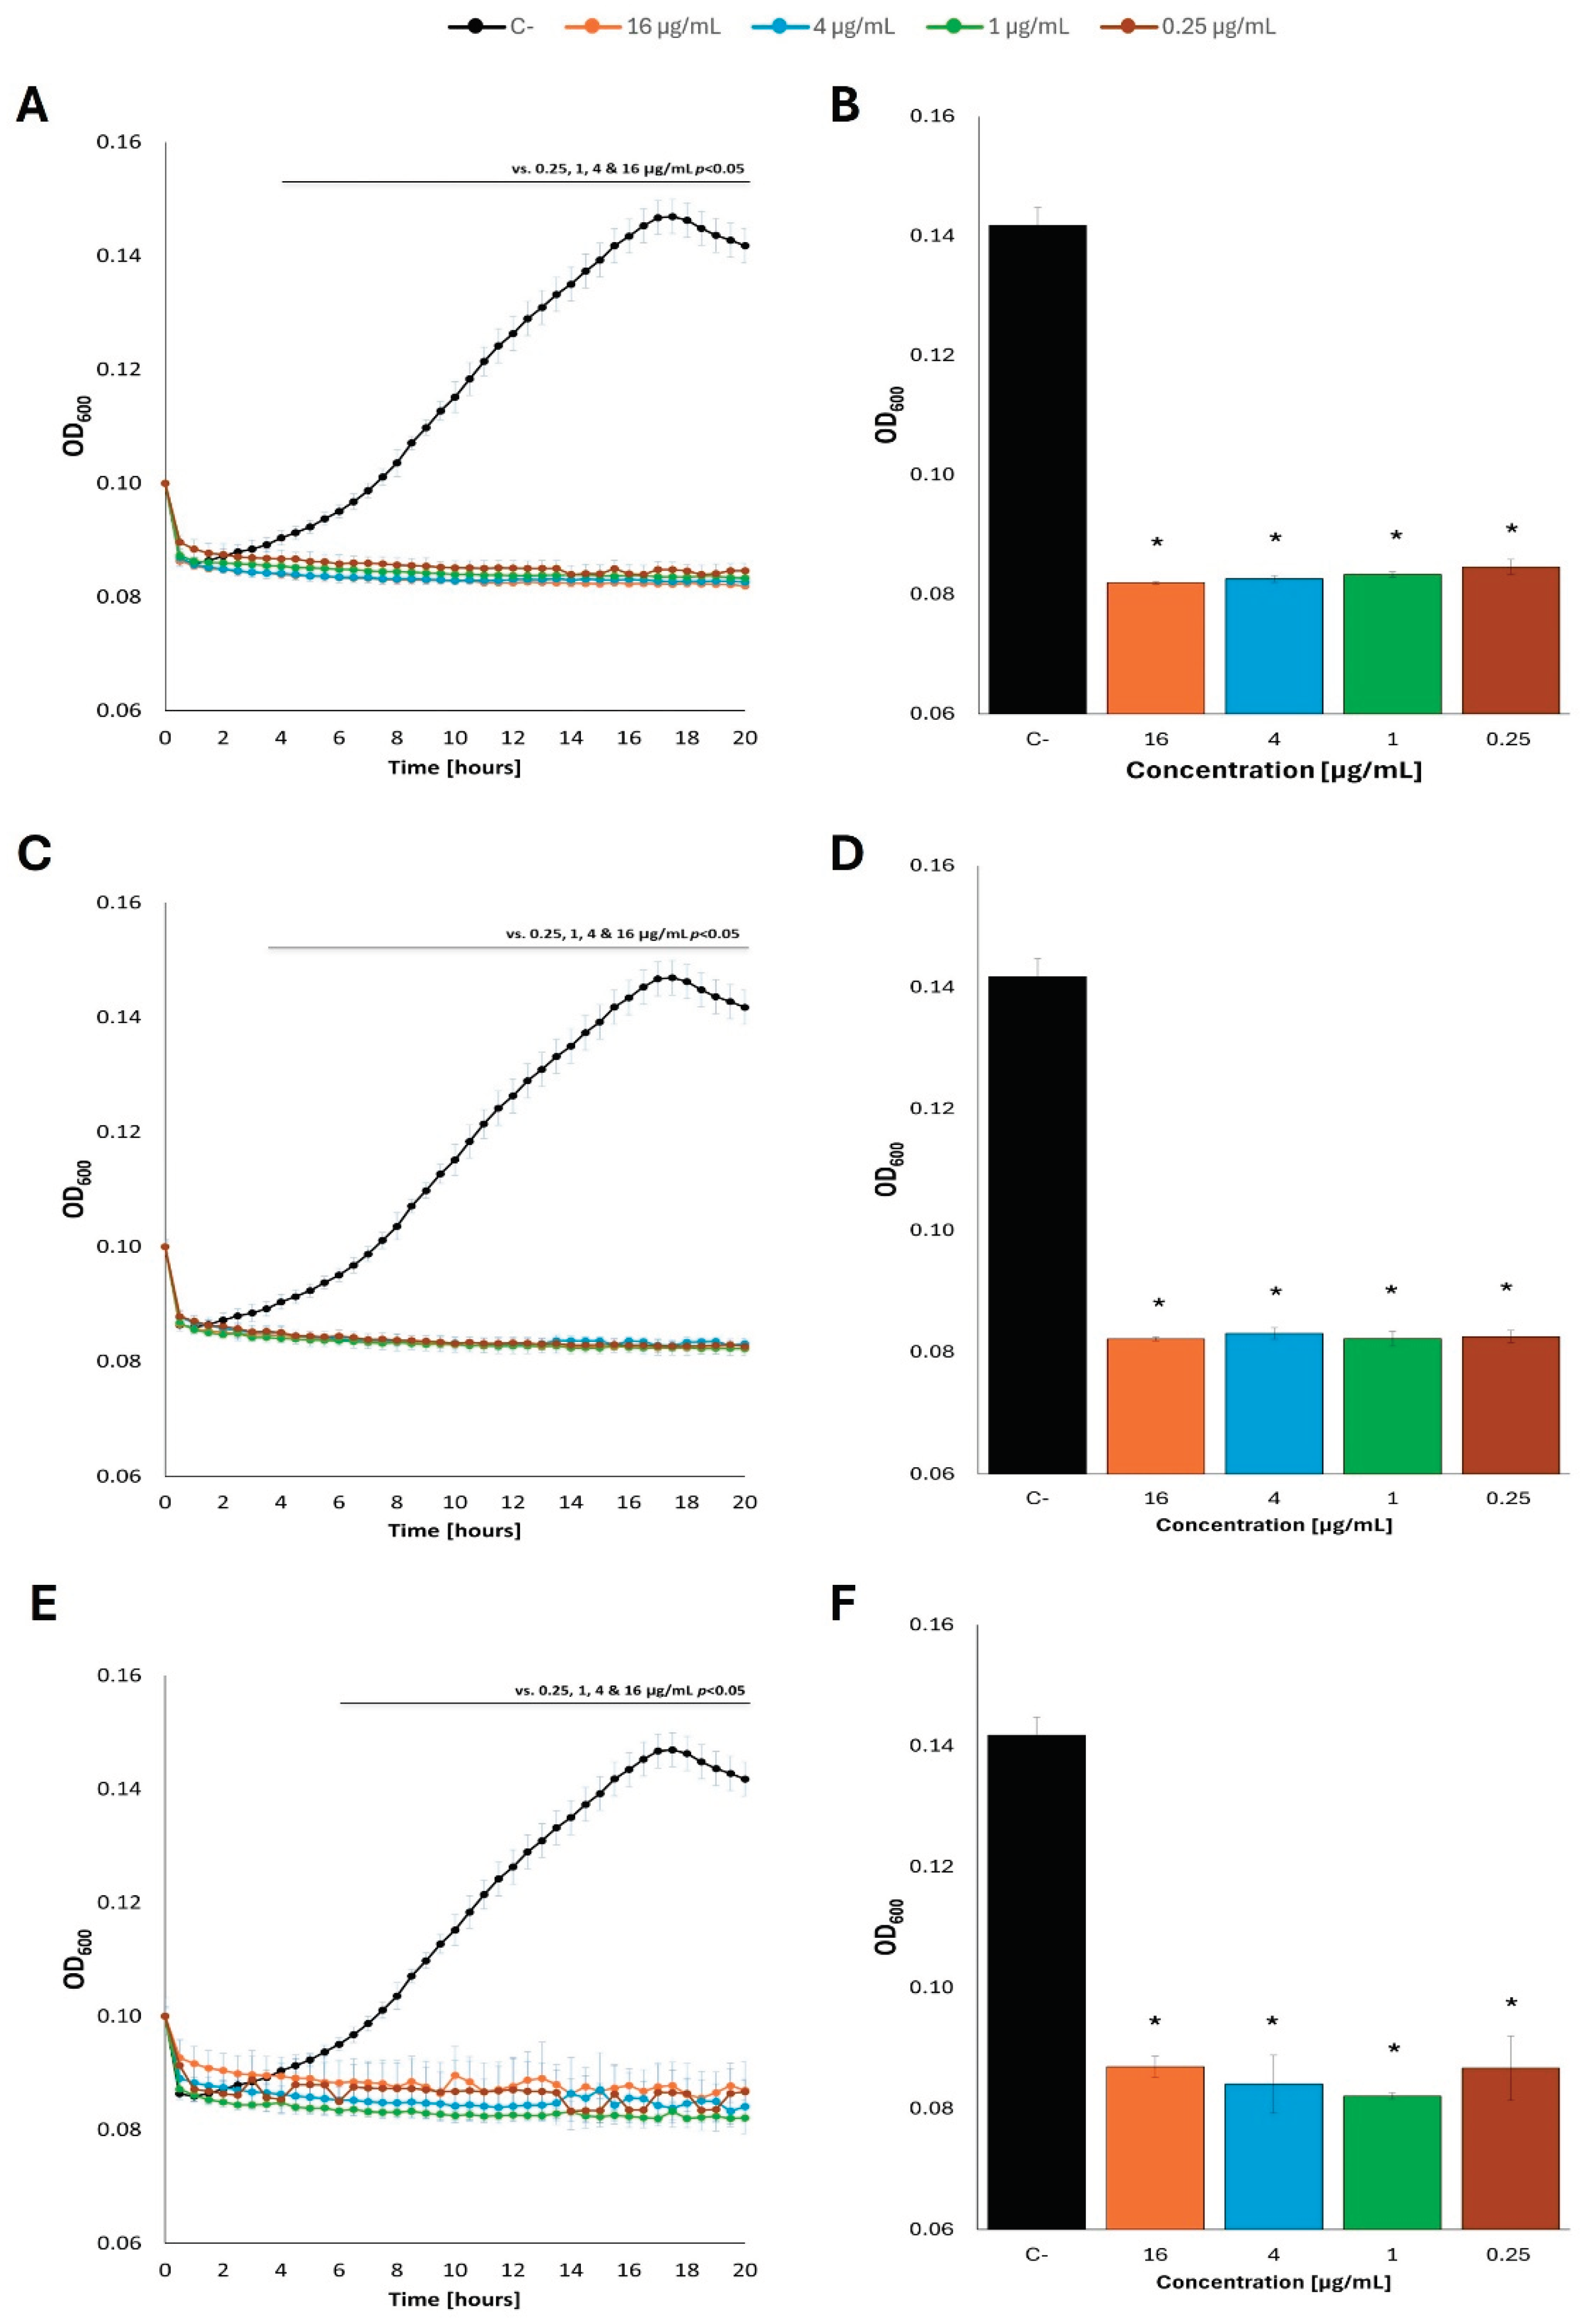
Totally different results were obtained in experiments where primary carbon sources (either glucose or acetate) were removed from the M9 minimal medium before addition of fatty acids. Under such conditions, no measurable growth of E. coli was observed in the presence of every tested fatty acid (butyric acid, caproic acid, or caprylic acid), irrespective of the concentration, and irrespective of the kind of the primary carbon source washed out prior to fatty acid supplementation, either glucose (Figure 7; see Supplementary Figure S7 for additional tested concentrations of fatty acids) or acetate (Figure 8; see Supplementary Figure S8 for additional tested concentrations of fatty acids).
4. Discussion
Fatty acids play various roles in organisms, from structural functions as constituents of phospholipids occurring in cell membranes, storage materials, and molecules involved in cell signalling [1]. Nevertheless, in the case of bacteria, fatty acids may play a negative role, as the antibacterial effects of these compounds have been reported previously [4,6][7]. Such effects are believed to be mainly due to membrane damage and oxidative stress [8]. However, bacteria can metabolize fatty acids [3], thus, they are able to use them to improve their energetic status. Therefore, it appears that there are two independent actions of fatty acids on bacterial cells, one of which is beneficial and the other is destructive. The major concern is what determines the domination of one process over another.
The strong biological activity of fatty acids is mainly represented by short-chain and medium-chain compounds [6,7]. Since butyric acid, caproic acid, and caprylic acid were identified as revealing the most pronounced effects on bacteria [10], while occurring also in human diet or produced by probiotic microorganisms, we have tested what conditions might distinguish between beneficial and deleterious effects of these fatty acids on a model bacterium, E. coli K-12 strain MG1655. Contrary to previous reports, where micromolar or mg/mL concentrations of fatty acids were used [2,6,7], we focused on their low concentrations (in a range of μg/mL). We were aware that such amounts of fatty acids were perhaps too low to have strong toxic effects on bacteria, however, such conditions should be more similar to those occurring in the natural environment of E. coli (mammalian gut) and might be easily obtained in cultures of this bacterium conducted for biotechnological purposes.
We have demonstrated that all tested fatty acids stimulated growth of E. coli in LB (rich) medium, especially at the later stages. We assume that these compounds might be used as alternative carbon sources when other molecules became exhausted from the medium due to their consumption by bacterial cells. Interestingly, there were differences between the effects of fatty acids at various temperatures, as growth stimulation was observed at the earlier phase of cultivation at 25 oC (mid-exponential phase) than at 37 oC (late exponential/stationary phase). This difference might be caused by either different composition of cell membranes at various temperatures (influencing fatty acid transportation or susceptibility of membranes to fatty acid-mediated damage) or the rate of cellular metabolism and putative requirement for additional nutrients at lower temperature.
Contrary to the growth in rich medium, when minimal medium was used, the positive effect of fatty acids on E. coli growth was either absent (when glucose was employed as a carbon source) or less pronounced and dependent on both the kind of fatty and its concentration (when acetate was employed as a carbon source). However, drastic effects of all tested fatty acids on the bacterial growth were evident when a bacterial culture was incubated first in a minimal medium with glucose or acetate, and the carbon source was removed just before addition of a fatty acid. Under these conditions, E. coli growth was undetectable irrespective of both the kind of fatty acid and its concentration. Evidently such conditions could not support the use of fatty acids as a sole carbon source. Because of low concentrations of these compounds used (from 0.25 to 16 μg/mL), we assume that their strong toxic effects were rather unlikely, thus, the most probable explanation is that E. coli cannot employ such molecules are sole carbon sources under starvation conditions.
On the basis of results presented in this report, we conclude that effects of short-chain and medium-chain fatty acids on E. coli depend strongly on growth medium (rich or minimal) and temperature, with a strong effect of the presence/absence of a specific carbon source (glucose or acetate in the case of our experiments) at the time of fatty acid addition. These results might also explain some ostensible discrepancies which can be found in the literature in respect of deleterious effects of specific short- and medium-chain fatty acids on E. coli (compare, for example refs. [6] and [7]). In fact, differences between results presented in various reports could arise, as least partially, from using different growth conditions of bacterial cultures. Obviously, the use of different concentrations of fatty acid is another plausible reason for obtaining ostensibly contradictory results.
Despite molecular mechanisms of the correlations reported in this work remain to be elucidated, we suggest that results presented here might have some implications for biotechnological and medical purposes. Namely, E. coli is one of the most commonly used microorganisms for production of various compound, at both small and large scales; therefore optimization of the growth of this bacterium in cultures, in flasks and in huge bioreactors, is biotechnologically important [11]. Therefore, conditions which might either improve E. coli growth or cause its inhibition should be considered carefully, being crucial factors influencing the efficiency of biotechnological processes. Hence, a potential usefulness of addition of low concentrations of fatty acids to growth media might be taken into account but only when a kind of medium and temperature are carefully chosen. Considering medical importance of the results reported here, it is crucial to emphasize the importance of the role of gut microbiota for human health. Since bacteria occurring in human gastrointestinal tract can influence human physiology significantly, and dysbiosis is correlated with various diseases [12,13,14,15,16], while modulating the composition of the gut microbiome (also using dietary compounds) is proposed as a potential therapeutic procedure [17,18,19], careful consideration of providing various nutrients and additives is necessary, including assessment of possible roles of fatty acids. This also concerns prebiotics and probiotics, as it was demonstrated that various bacteria can effectively produce fatty acids [18]. Thus, demonstration of various effects of fatty acids on bacterial cells depending on the growth conditions suggests that estimation of conditions occurring in human gut should be especially carefully considered when planning treatment of patients or healthy people (in the course of prevention) with nutraceuticals, prebiotics, probiotics, and other agents which might influence fatty acid composition and concentration in the gut.
5. Conclusions
On the basis of results presented in this report, we conclude that effects of short-chain and medium-chain fatty acids on E. coli depend strongly on growth medium (rich or minimal) and temperature, with a strong effect of the presence/absence of a specific carbon source (glucose or acetate in the case of our experiments) at the time of fatty acid addition. These results might also explain some ostensible discrepancies which can be found in the literature in respect of positive or deleterious effects of specific short- and medium-chain fatty acids on E. coli. In fact, differences between results presented in various reports could arise, as least partially, from using different growth conditions of bacterial cultures. Obviously, the use of different concentrations of fatty acid is another plausible reason for obtaining ostensibly contradictory results.
Supplementary Materials
The following supporting information can be downloaded at: Preprints.org, Figure S1: Scheme of the experimental procedures. Bacteria were cultured to OD600=0.1, and then procedures were conducted according to the figure. The scheme was created using BioRender.com. Figure S2: Growth curves of E.coli MG1655 with fatty acids at 37 °C in LB medium. Bacteria were cultured to OD=0.1, and then butyric acid (A), caproic acid (C) and caprylic acid (E) were added at appropriate concentrations. Panels B, D and F show the optical density value of the culture at the end of the experiment: butyric acid (B), caproic acid (D) and caprylic acid (F). Statistical significance (p<0.05) is marked with an asterisk (*). Figure S3: Growth curves of E.coli MG1655 with fatty acids at 25 °C in LB medium. Bacteria were cultured to OD=0.1, and then butyric acid (A), caproic acid (C) and caprylic acid (E) were added at appropriate concentrations. Panels B,D and F show the optical density value of the culture at the end of the experiment: butyric acid (B), caproic acid (D) and caprylic acid (F). Statistical significance (p<0.05) is marked with an asterisk (*). Figure S4: Growth curves of E.coli MG1655 with fatty acids at 37 °C in M9 minimal medium, in which glucose was the carbon source. Bacteria were cultured to OD=0.1, and then butyric acid (A), caproic acid (C) and caprylic acid (E) were added at appropriate concentrations. Panels B, D and F show the optical density value of the culture at the end of the experiment: butyric acid (B), caproic acid (D) and caprylic acid (F). Statistical significance (p<0.05) is marked with an asterisk (*). Figure S5. Growth curves of E.coli MG1655 with fatty acids at 25 °C in M9 minimal medium, in which glucose was the carbon source. Bacteria were cultured to OD=0.1, and then butyric acid (A), caproic acid (C) and caprylic acid (E) were added at appropriate concentrations. Panels B, D and F show the optical density value of the culture at the end of the experiment: butyric acid (B), caproic acid (D) and caprylic acid (F). Statistical significance (p<0.05) is marked with an asterisk (*). Figure S6: Growth curves of E.coli MG1655 with fatty acids at 37 °C in M9 minimal medium, in which acetate was the carbon source. Bacteria were cultured to OD=0.1, and then butyric acid (A), caproic acid (C) and caprylic acid (E) were added at appropriate concentrations. Panels B, D and F show the optical density value of the culture at the end of the experiment: butyric acid (B), caproic acid (D) and caprylic acid (F). Statistical significance (p<0.05) is marked with an asterisk (*). Figure S7: Growth curves of E.coli MG1655 with the addition of fatty acids at 37 °C in M9 minimal medium, in which glucose was the carbon source. The bacteria were cultured to OD=0.1, and then the previous carbon source was removed and replaced with: butyric acid (A), caproic acid (C) and caprylic acid (C) at appropriate concentrations. Panels B, D and F show the optical density value of the culture at the end of the experiment: butyric acid (B), caproic acid (D) and caprylic acid (F). Statistical significance (p<0.05) is marked with an asterisk (*). Figure S8: Growth curves of E.coli MG1655 with the addition of fatty acids at 37 °C in M9 minimal medium, in which acetate was the carbon source. The bacteria were cultured to OD=0.1, and then the previous carbon source was removed and replaced with: butyric acid (A), caproic acid (C) and caprylic acid (C) at appropriate concentrations. Panels B, D and F show the optical density value of the culture at the end of the experiment: butyric acid (B), caproic acid (D) and caprylic acid (F). Statistical significance (p<0.05) is marked with an asterisk (*).
Author Contributions
Conceptualization, B.S. and G.W.; methodology, Ł.G. and G.W..; validation, B.S., M.Z., Ł.G. and G.W.; investigation, B.S., M.Z. and Ł.G.; writing—original draft preparation, Ł.G. and G.W.; writing—review and editing, B.S., M.Z., Ł.G. and G,W.; visualization, Ł.G.; supervision, G.W.; project administration, G.W.; funding acquisition, G.W. All authors have read and agreed to the published version of the manuscript.
Funding
This research was funded by University of Gdansk (task grant no. 531-D020-D242-25).
Data Availability Statement
Raw data are available from the authors at request from qualified researchers.
Acknowledgments
The authors thank Joanna Bart for administrative and technical support.
Conflicts of Interest
The authors declare no conflicts of interest.
References
- de Carvalho, C.C.C.R.; Caramujo, M.J. The Various Roles of Fatty Acids. Molecules 2018, 23, 2583. [Google Scholar] [CrossRef] [PubMed]
- van den Berg, S.P.H.; Zoumaro-Djayoon, A.; Yang, F.; Bokinsky, G. Exogenous fatty acids inhibit fatty acid synthesis by competing with endogenously generated substrates for phospholipid synthesis in Escherichia coli. FEBS Lett 2024. [Google Scholar] [CrossRef] [PubMed]
- Pavoncello, V.; Barras, F.; Bouveret, E. Degradation of Exogenous Fatty Acids in Escherichia coli. Biomolecules 2022, 12, 1019. [Google Scholar] [CrossRef] [PubMed]
- Casillas-Vargas, G.; Ocasio-Malavé, C.; Medina, S.; Morales-Guzmán, C.; Del Valle, R.G.; Carballeira, N.M.; Sanabria-Ríos, D.J. Antibacterial fatty acids: An update of possible mechanisms of action and implications in the development of the next-generation of antibacterial agents. Prog Lipid Res 2021, 82, 101093. [Google Scholar] [CrossRef] [PubMed]
- Black, P.N.; DiRusso, C.C. Transmembrane movement of exogenous long-chain fatty acids: proteins, enzymes, and vectorial esterification. Microbiol Mol Biol Rev 2003, 67, 454–472. [Google Scholar] [CrossRef] [PubMed]
- Marounek, M.; Skrivanová, E.; Rada, V. Susceptibility of Escherichia coli to C2-C18 fatty acids. Folia Microbiol 2003, 48, 731–735. [Google Scholar] [CrossRef] [PubMed]
- De Keyser, K.; Dierick, N.; Kanto, U.; Hongsapak, T.; Buyens, G.; Kuterna, L.; Vanderbeke, E. Medium-chain glycerides affect gut morphology, immune- and goblet cells in post-weaning piglets: In vitro fatty acid screening with Escherichia coli and in vivo consolidation with LPS challenge. J Anim Physiol Anim Nutr 2019, 103, 221–230. [Google Scholar] [CrossRef] [PubMed]
- Rodríguez-Moyá, M.; Gonzalez, R. Proteomic analysis of the response of Escherichia coli to short-chain fatty acids. J Proteomics 2015, 122, 86–99. [Google Scholar] [CrossRef] [PubMed]
- Jensen, K.F. The Escherichia coli K-12 "wild types" W3110 and MG1655 have an rph frameshift mutation that leads to pyrimidine starvation due to low pyrE expression levels. J Bacteriol 1993, 175, 3401–3407. [Google Scholar] [CrossRef] [PubMed]
- Zavišić, G.; Ristić, S.; Petričević, S.; Janković, D.; Petković, B. Microbial Contamination of Food: Probiotics and Postbiotics as Potential Biopreservatives. Foods 2024, 13, 2487. [Google Scholar] [CrossRef] [PubMed]
- Negrete, A.; Shiloach, J. Improving E. coli growth performance by manipulating small RNA expression. Microb Cell Fact 2017, 16, 198. [Google Scholar] [CrossRef] [PubMed]
- Zhang, R.; Ding, N.; Feng, X.; Liao, W. The gut microbiome, immune modulation, and cognitive decline: insights on the gut-brain axis. Front Immunol 2025, 16, 1529958. [Google Scholar] [CrossRef] [PubMed]
- Nunez, H.; Nieto, P.A.; Mars, R.A.; Ghavami, M.; Sew Hoy, C.; Sukhum, K. Early life gut microbiome and its impact on childhood health and chronic conditions. Gut Microbes 2025, 17, 2463567. [Google Scholar] [CrossRef] [PubMed]
- Chong, S.; Lin, M.; Chong, D.; Jensen, S.; Lau, N.S. A systematic review on gut microbiota in type 2 diabetes mellitus. Front Endocrinol 2025, 15, 1486793. [Google Scholar] [CrossRef] [PubMed]
- Marcari, A.B.; Paiva, A.D.; Simon, C.R.; Dos Santos, M.E.S.M. Leaky Gut Syndrome: An Interplay Between Nutrients and Dysbiosis. Curr Nutr Rep 2025, 14, 25. [Google Scholar] [CrossRef] [PubMed]
- Trisal, A.; Singh, I.; Garg, G.; Jorwal, K.; Singh, A.K. Gut-brain axis and brain health: modulating neuroinflammation, cognitive decline, and neurodegeneration. 3 Biotech 2025, 15, 25. [Google Scholar] [CrossRef] [PubMed]
- Cao, C.; Yue, S.; Lu, A.; Liang, C. Host-Gut Microbiota Metabolic Interactions and Their Role in Precision Diagnosis and Treatment of Gastrointestinal Cancers. Pharmacol Res 2024, 207, 107321. [Google Scholar] [CrossRef] [PubMed]
- Yarahmadi, A.; Afkhami, H.; Javadi, A.; Kashfi, M. Understanding the complex function of gut microbiota: its impact on the pathogenesis of obesity and beyond: a comprehensive review. Diabetol Metab Syndr 2024, 16, 308. [Google Scholar] [CrossRef] [PubMed]
- Kandari, A.; Odat, M.A.; Alzaid, F.; Scott, K. P. Biotics and bacterial function: impact on gut and host health. ISME J 2024, 18, wrae226. [Google Scholar] [CrossRef] [PubMed]
Figure 1.
Scheme of the experimental procedures. Bacteria were cultured to OD600=0.1, and then procedures were conducted according to the figure. The scheme was created using BioRender.com.
Figure 1.
Scheme of the experimental procedures. Bacteria were cultured to OD600=0.1, and then procedures were conducted according to the figure. The scheme was created using BioRender.com.
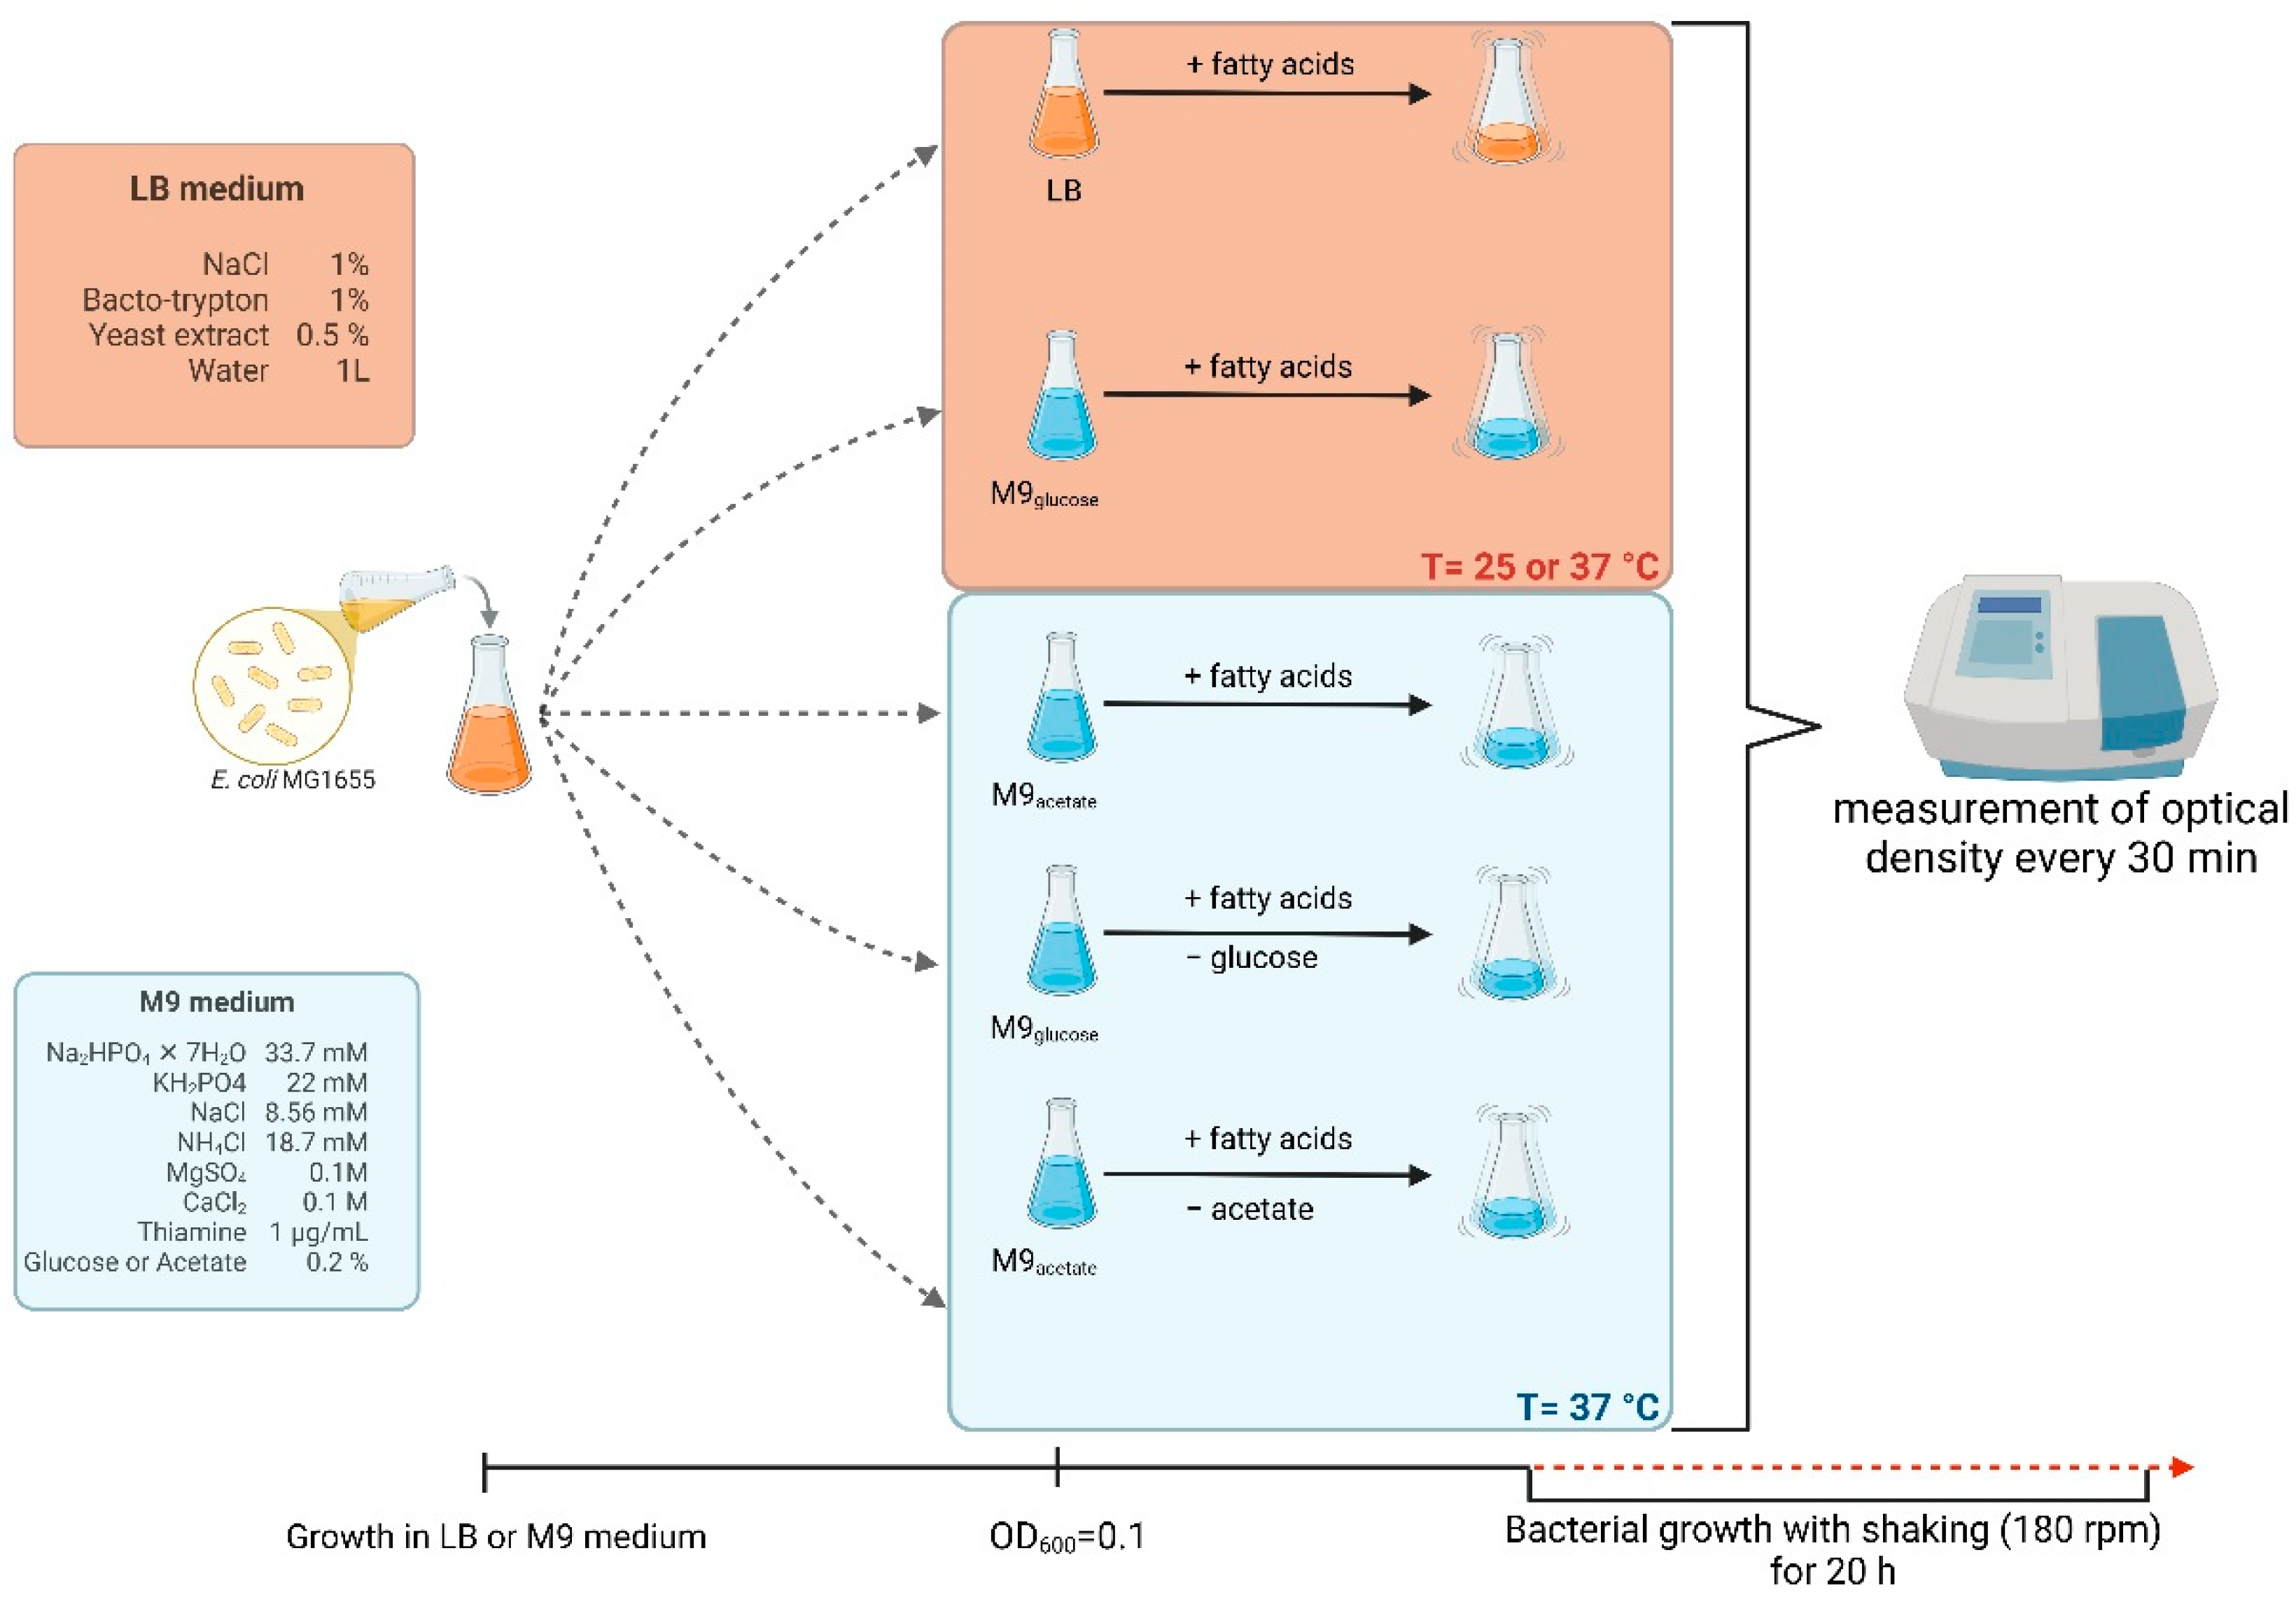
Figure 2.
Growth curves of E. coli MG1655 with fatty acids at 37 °C in LB medium. Bacteria were cultured to OD=0.1, and then butyric acid (A), caproic acid (C) and caprylic acid (E) were added at appropriate concentrations. Panels B,D and F show the optical density value of the culture at the end of the experiment: butyric acid (B), caproic acid (D) and caprylic acid (F). Statistical significance (p<0.05) is marked with an asterisk (*).
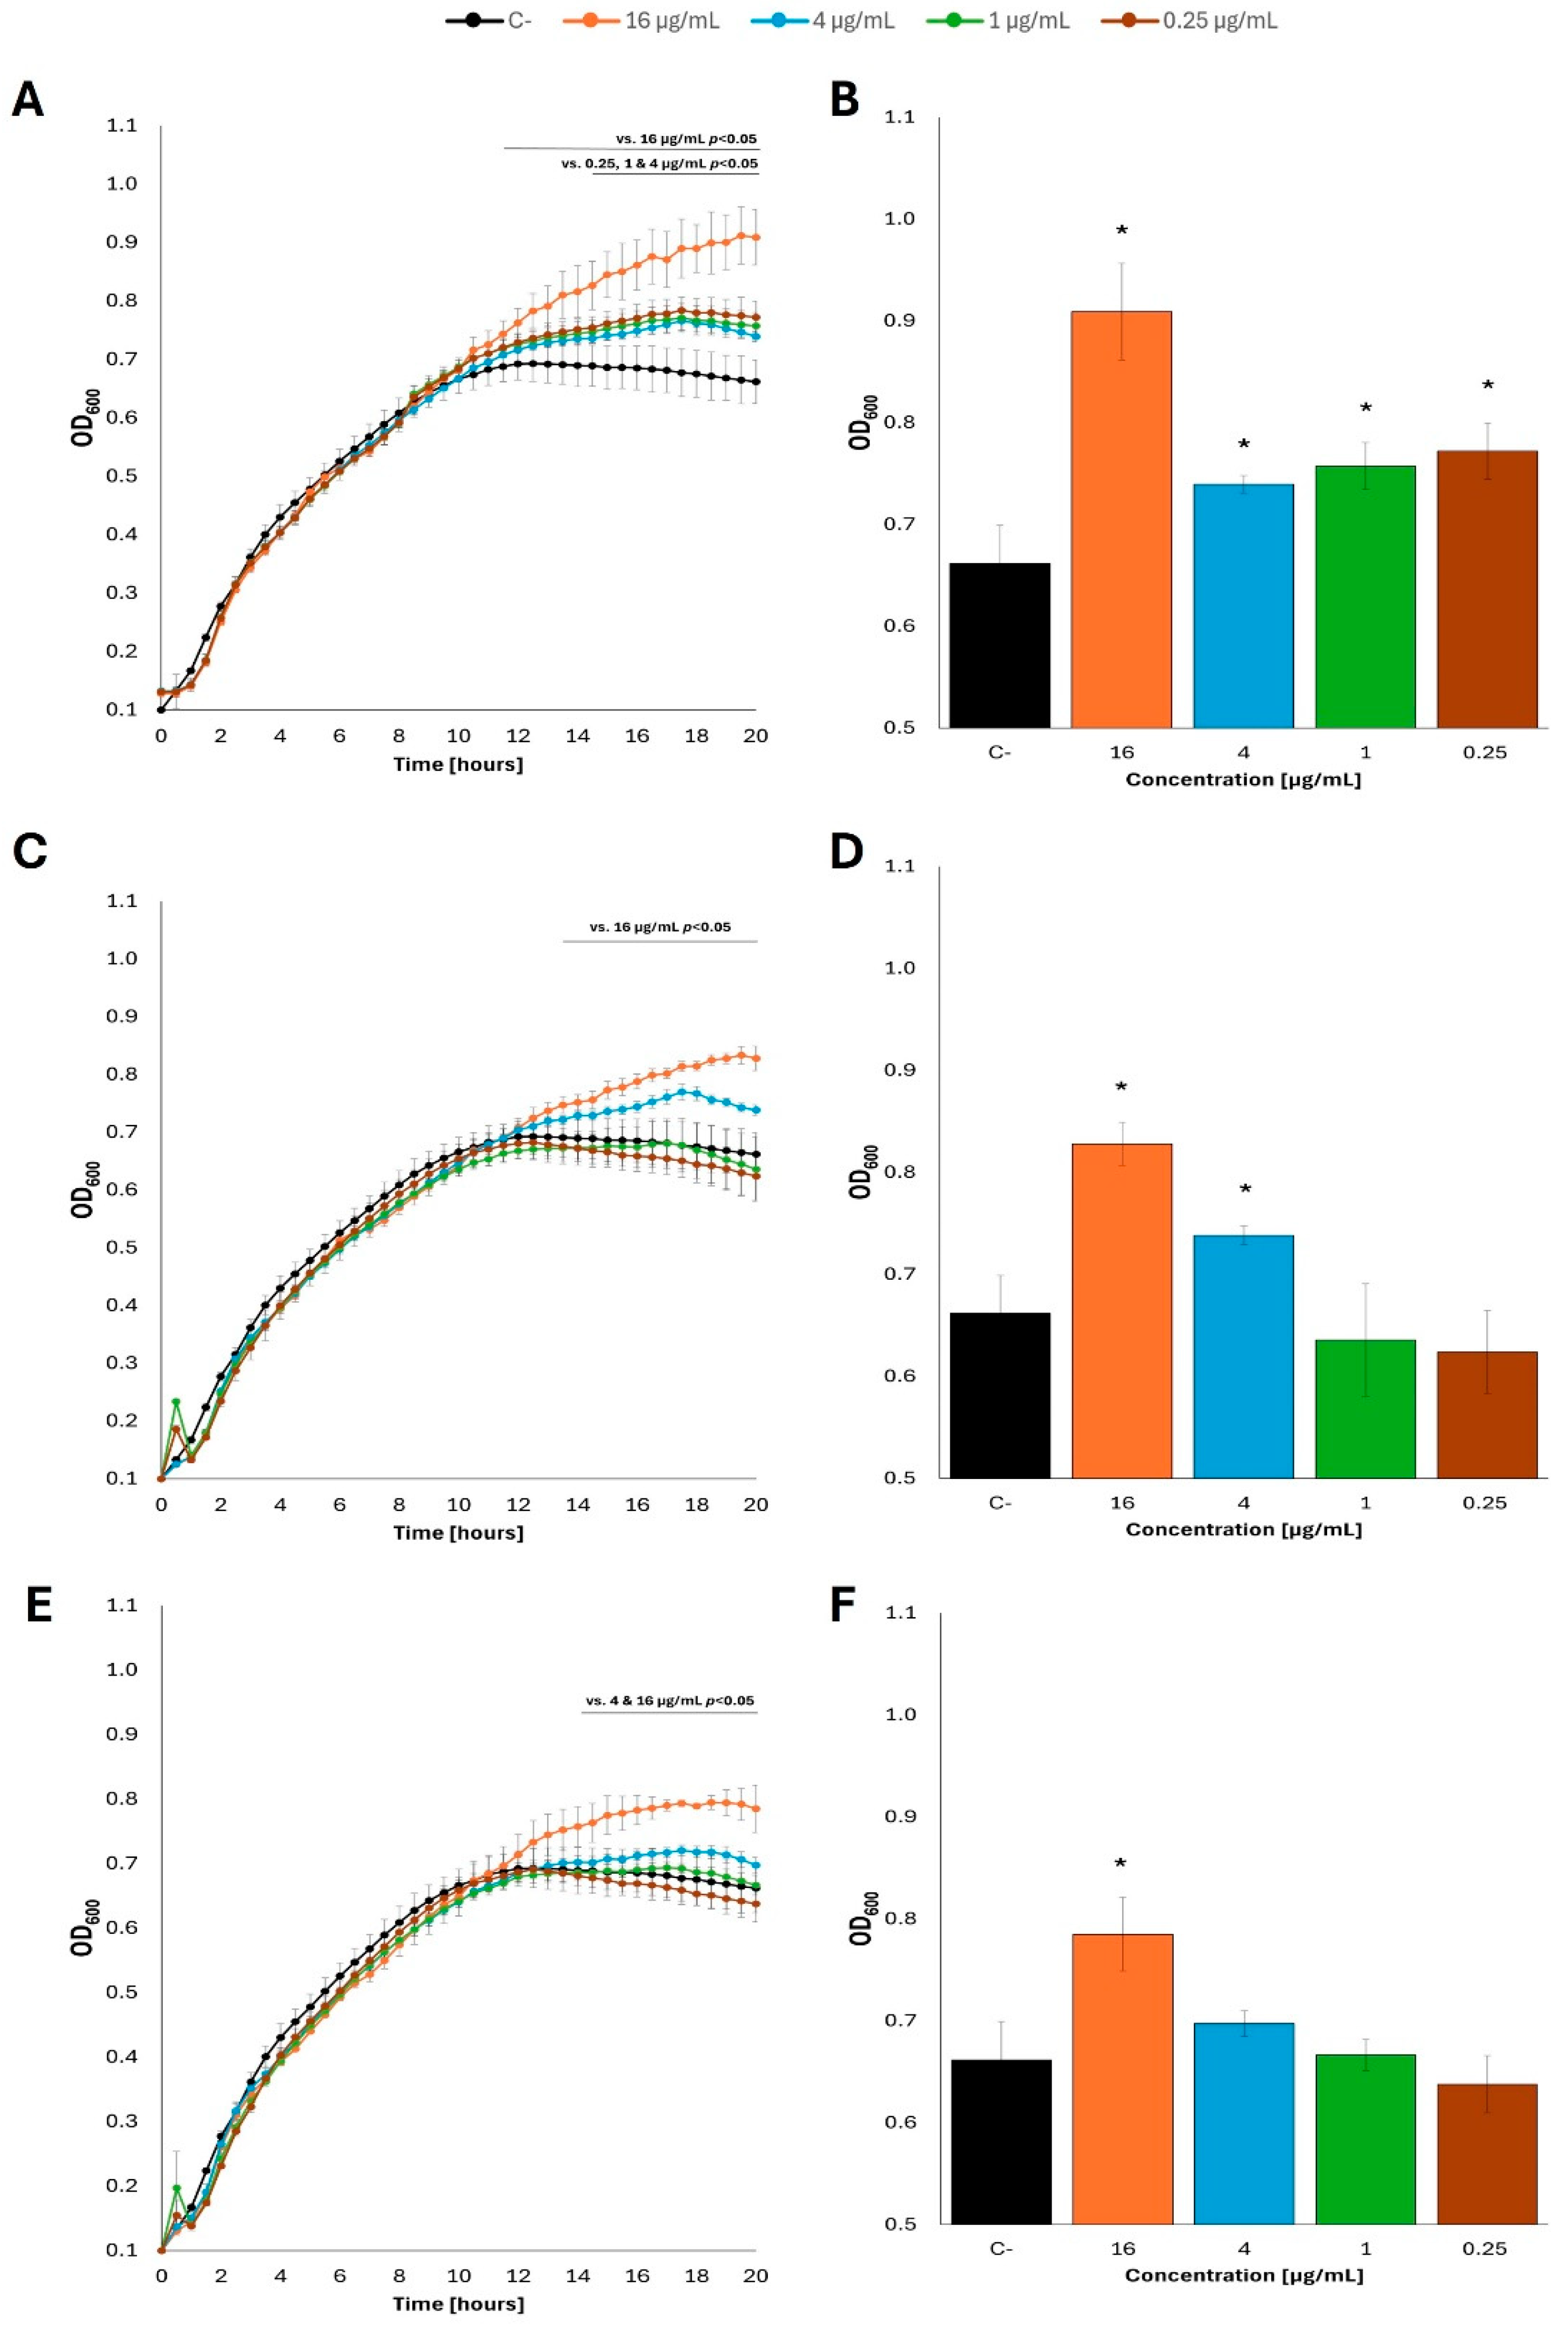
Figure 3.
Growth curves of E. coli MG1655 with fatty acids at 25 °C in LB medium. Bacteria were cultured to OD=0.1, and then butyric acid (A), caproic acid (C) and caprylic acid (E) were added at appropriate concentrations. Panels B,D and F show the optical density value of the culture at the end of the experiment: butyric acid (B), caproic acid (D) and caprylic acid (F). Statistical significance (p<0.05) is marked with an asterisk (*).
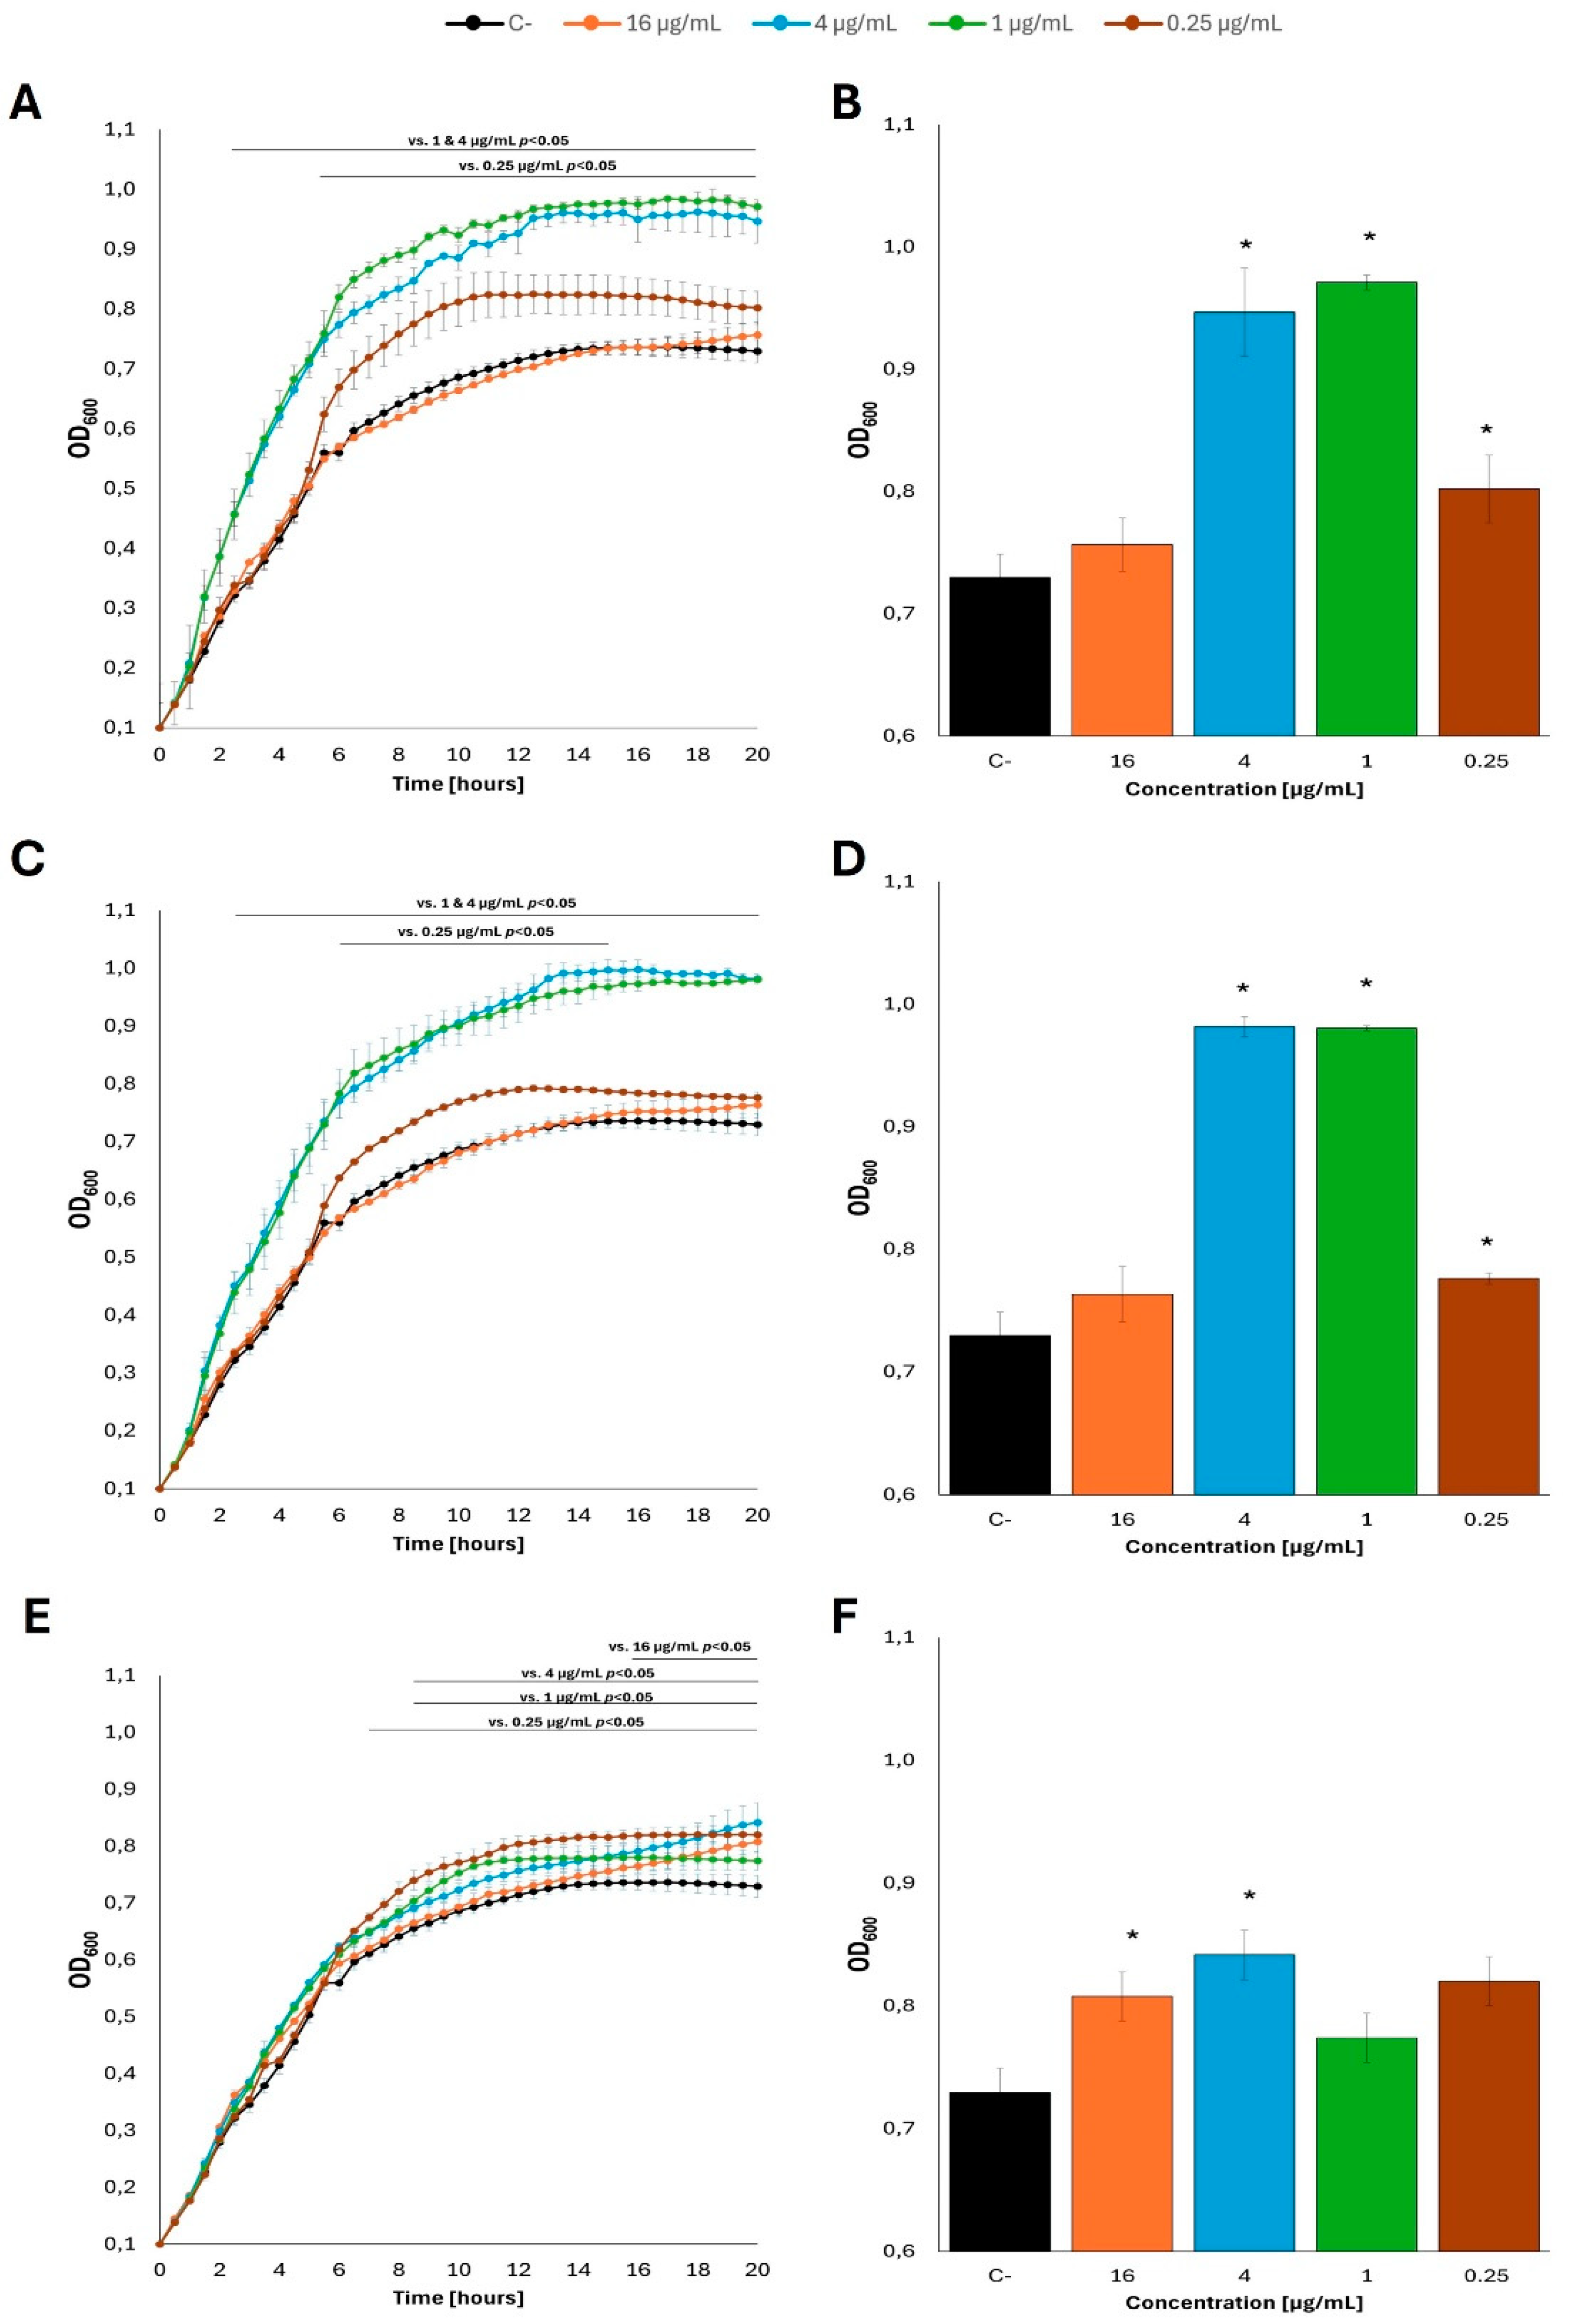
Figure 4.
Growth curves of E. coli MG1655 with fatty acids at 37 °C in M9 minimal medium, in which glucose was the carbon source. Bacteria were cultured to OD=0.1, and then butyric acid (A), caproic acid (C) and caprylic acid (E) were added at appropriate concentrations. Panels B,D and F show the optical density value of the culture at the end of the experiment: butyric acid (B), caproic acid (D) and caprylic acid (F). Statistical significance (p<0.05) is marked with an asterisk (*).
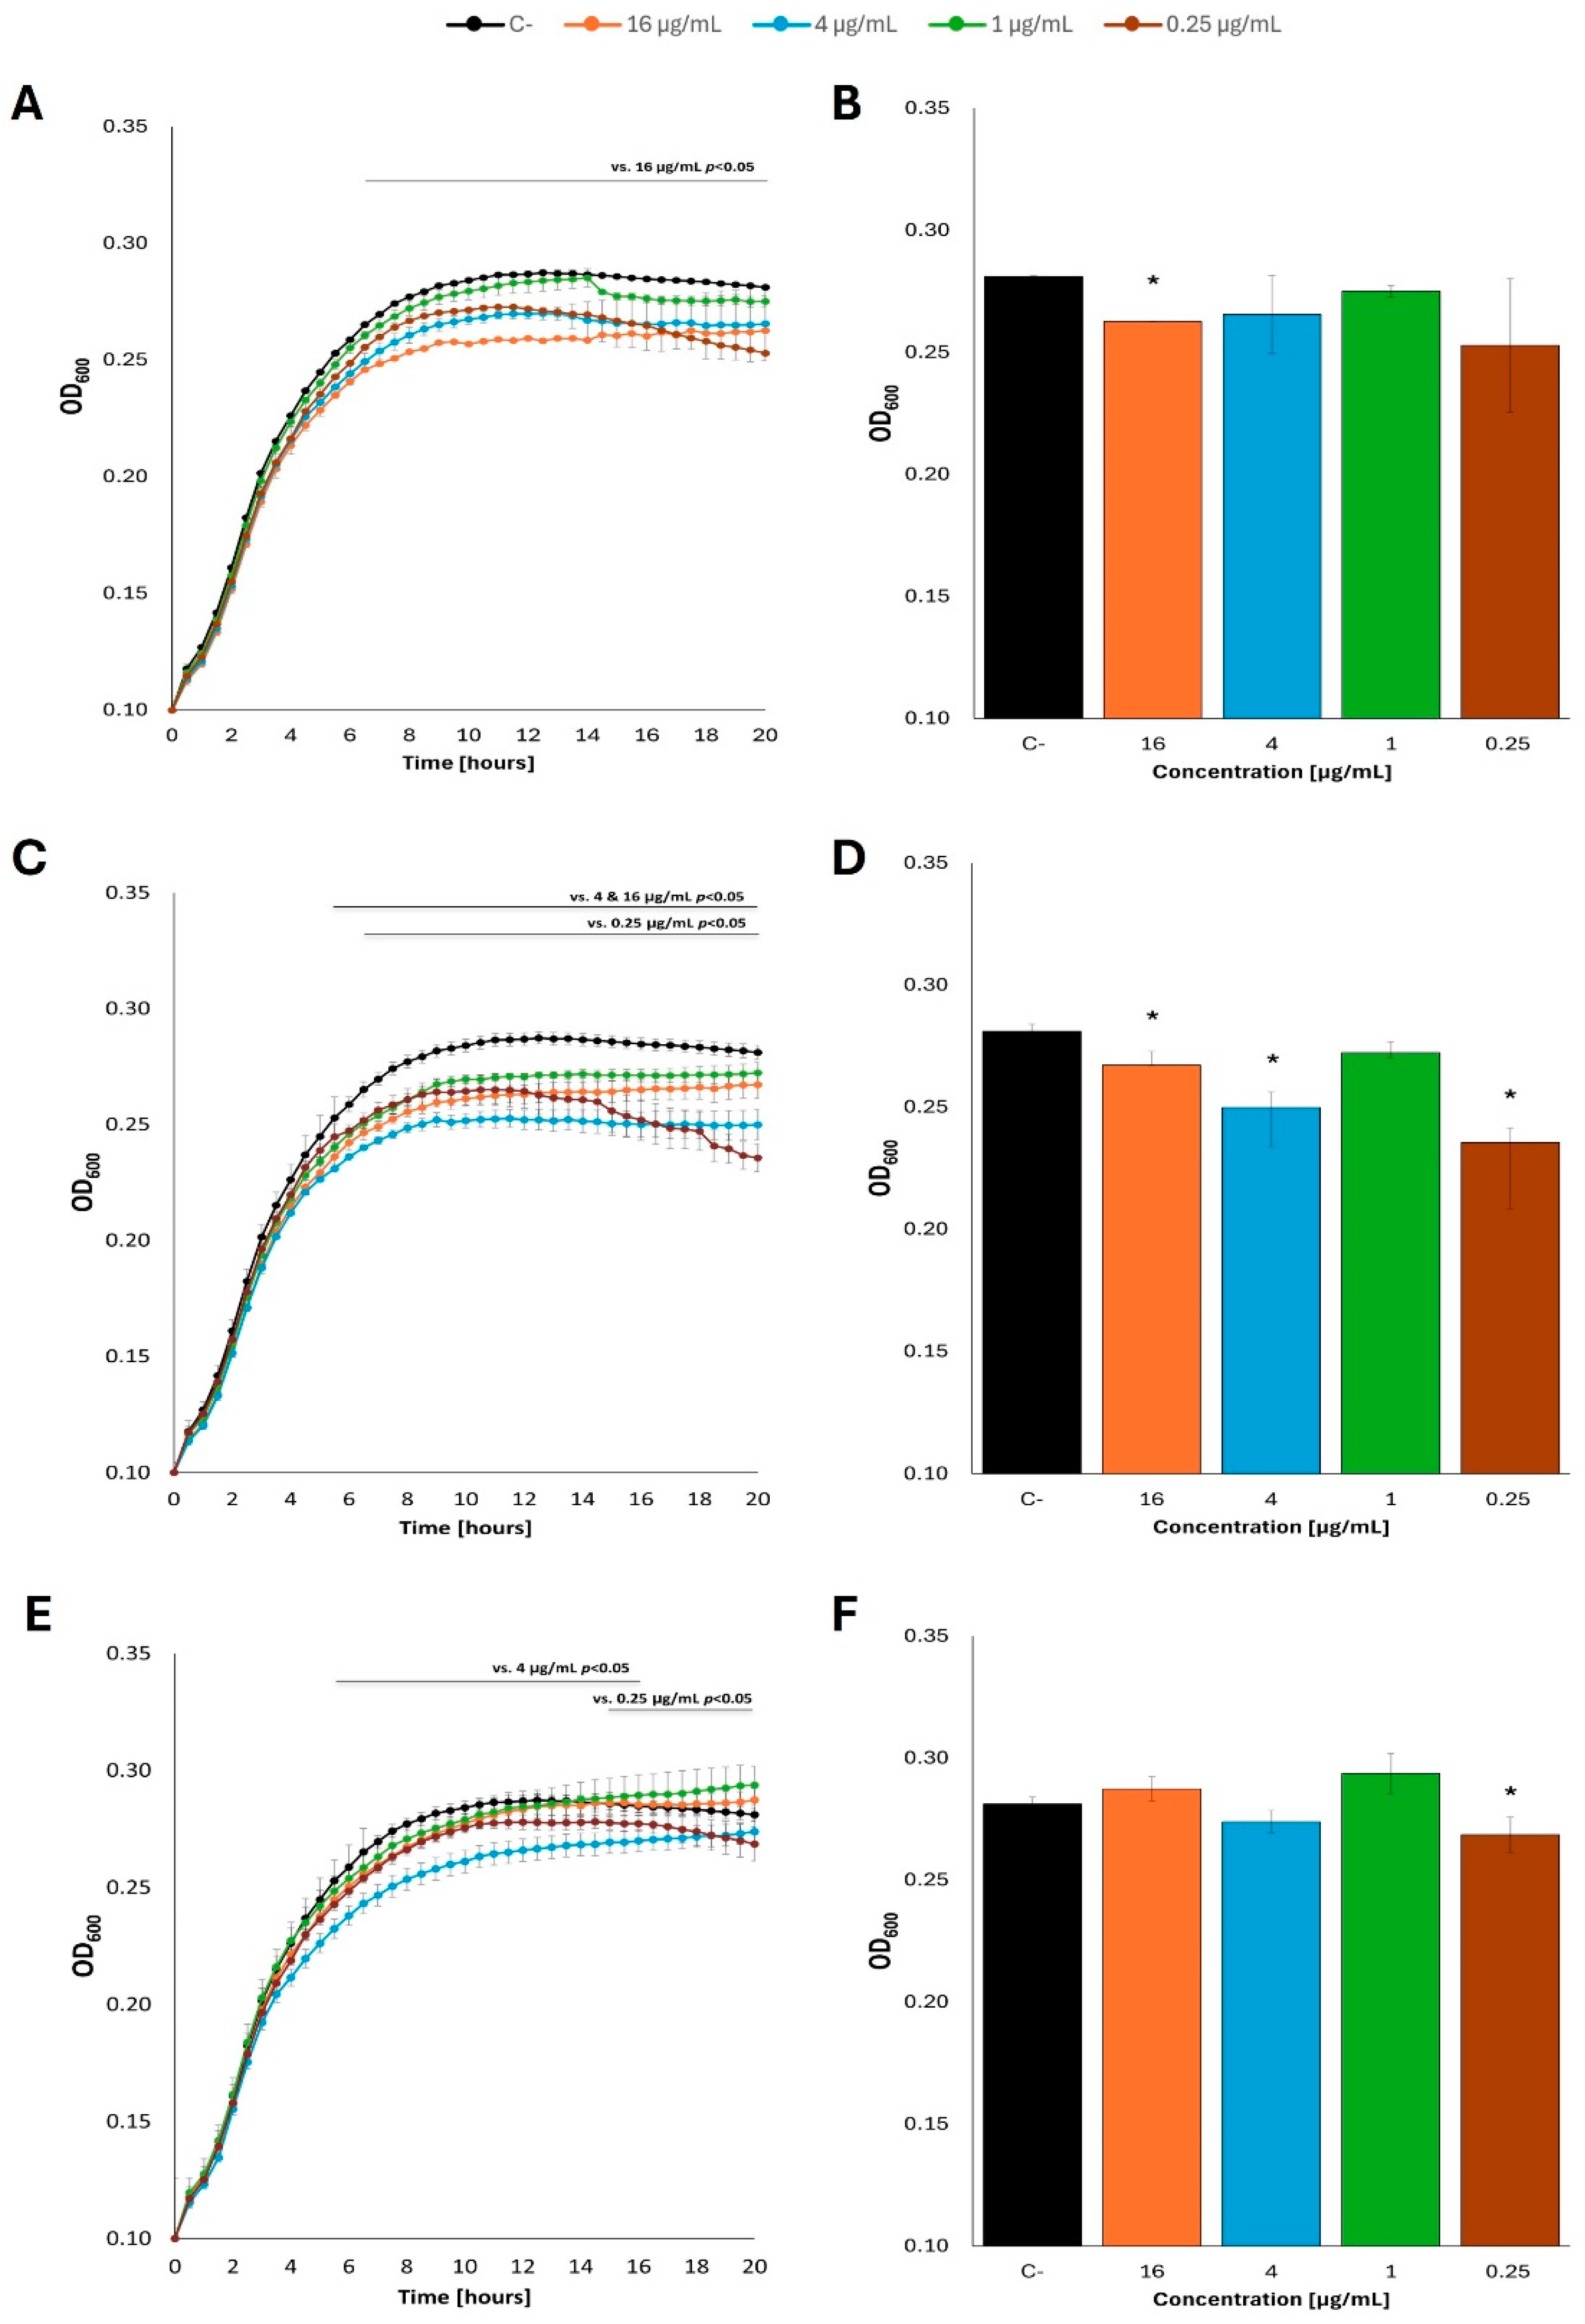
Figure 5.
Growth curves of E. coli MG1655 with fatty acids at 25 °C in M9 minimal medium, in which glucose was the carbon source. Bacteria were cultured to OD=0.1, and then butyric acid (A), caproic acid (C) and caprylic acid (E) were added at appropriate concentrations. Panels B,D and F show the optical density value of the culture at the end of the experiment: butyric acid (B), caproic acid (D) and caprylic acid (F). Statistical significance (p<0.05) is marked with an asterisk (*).
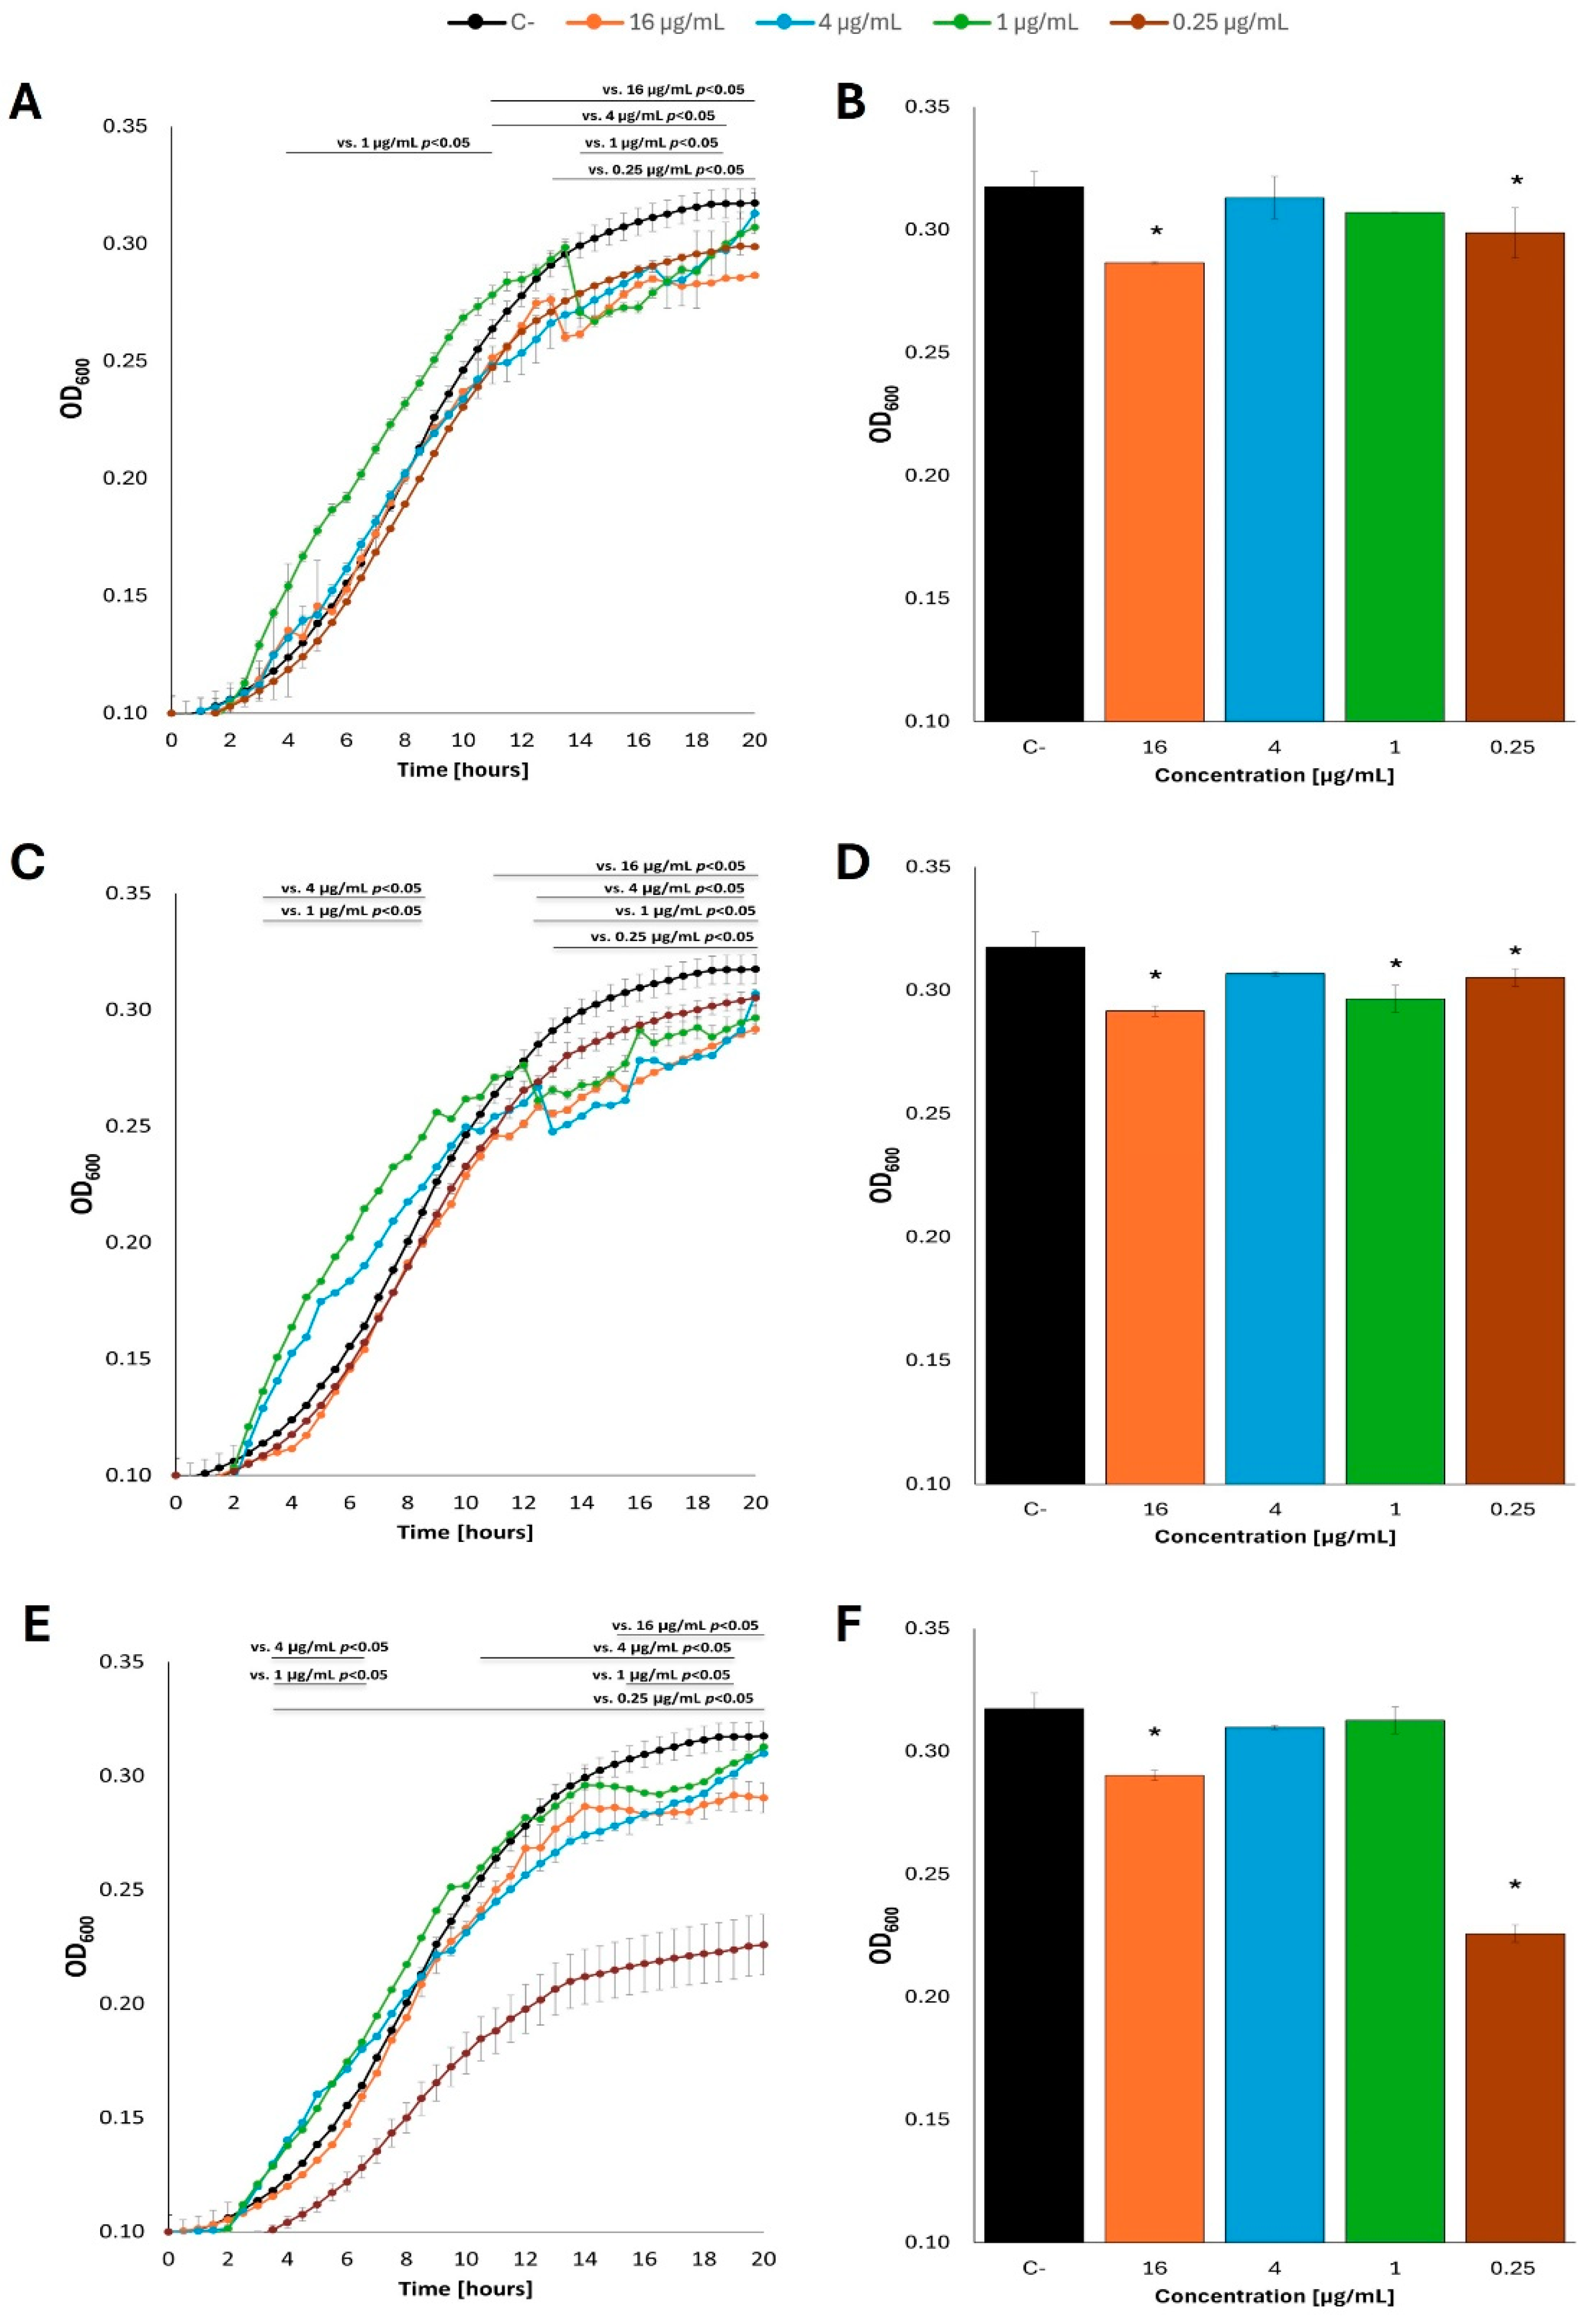
Figure 6.
Growth curves of E. coli MG1655 with fatty acids at 37 °C in M9 minimal medium, in which acetate was the carbon source. Bacteria were cultured to OD=0.1, and then butyric acid (A), caproic acid (C) and caprylic acid (E) were added at appropriate concentrations. Panels B,D and F show the optical density value of the culture at the end of the experiment: butyric acid (B), caproic acid (D) and caprylic acid (F). Statistical significance (p<0.05) is marked with an asterisk (*).
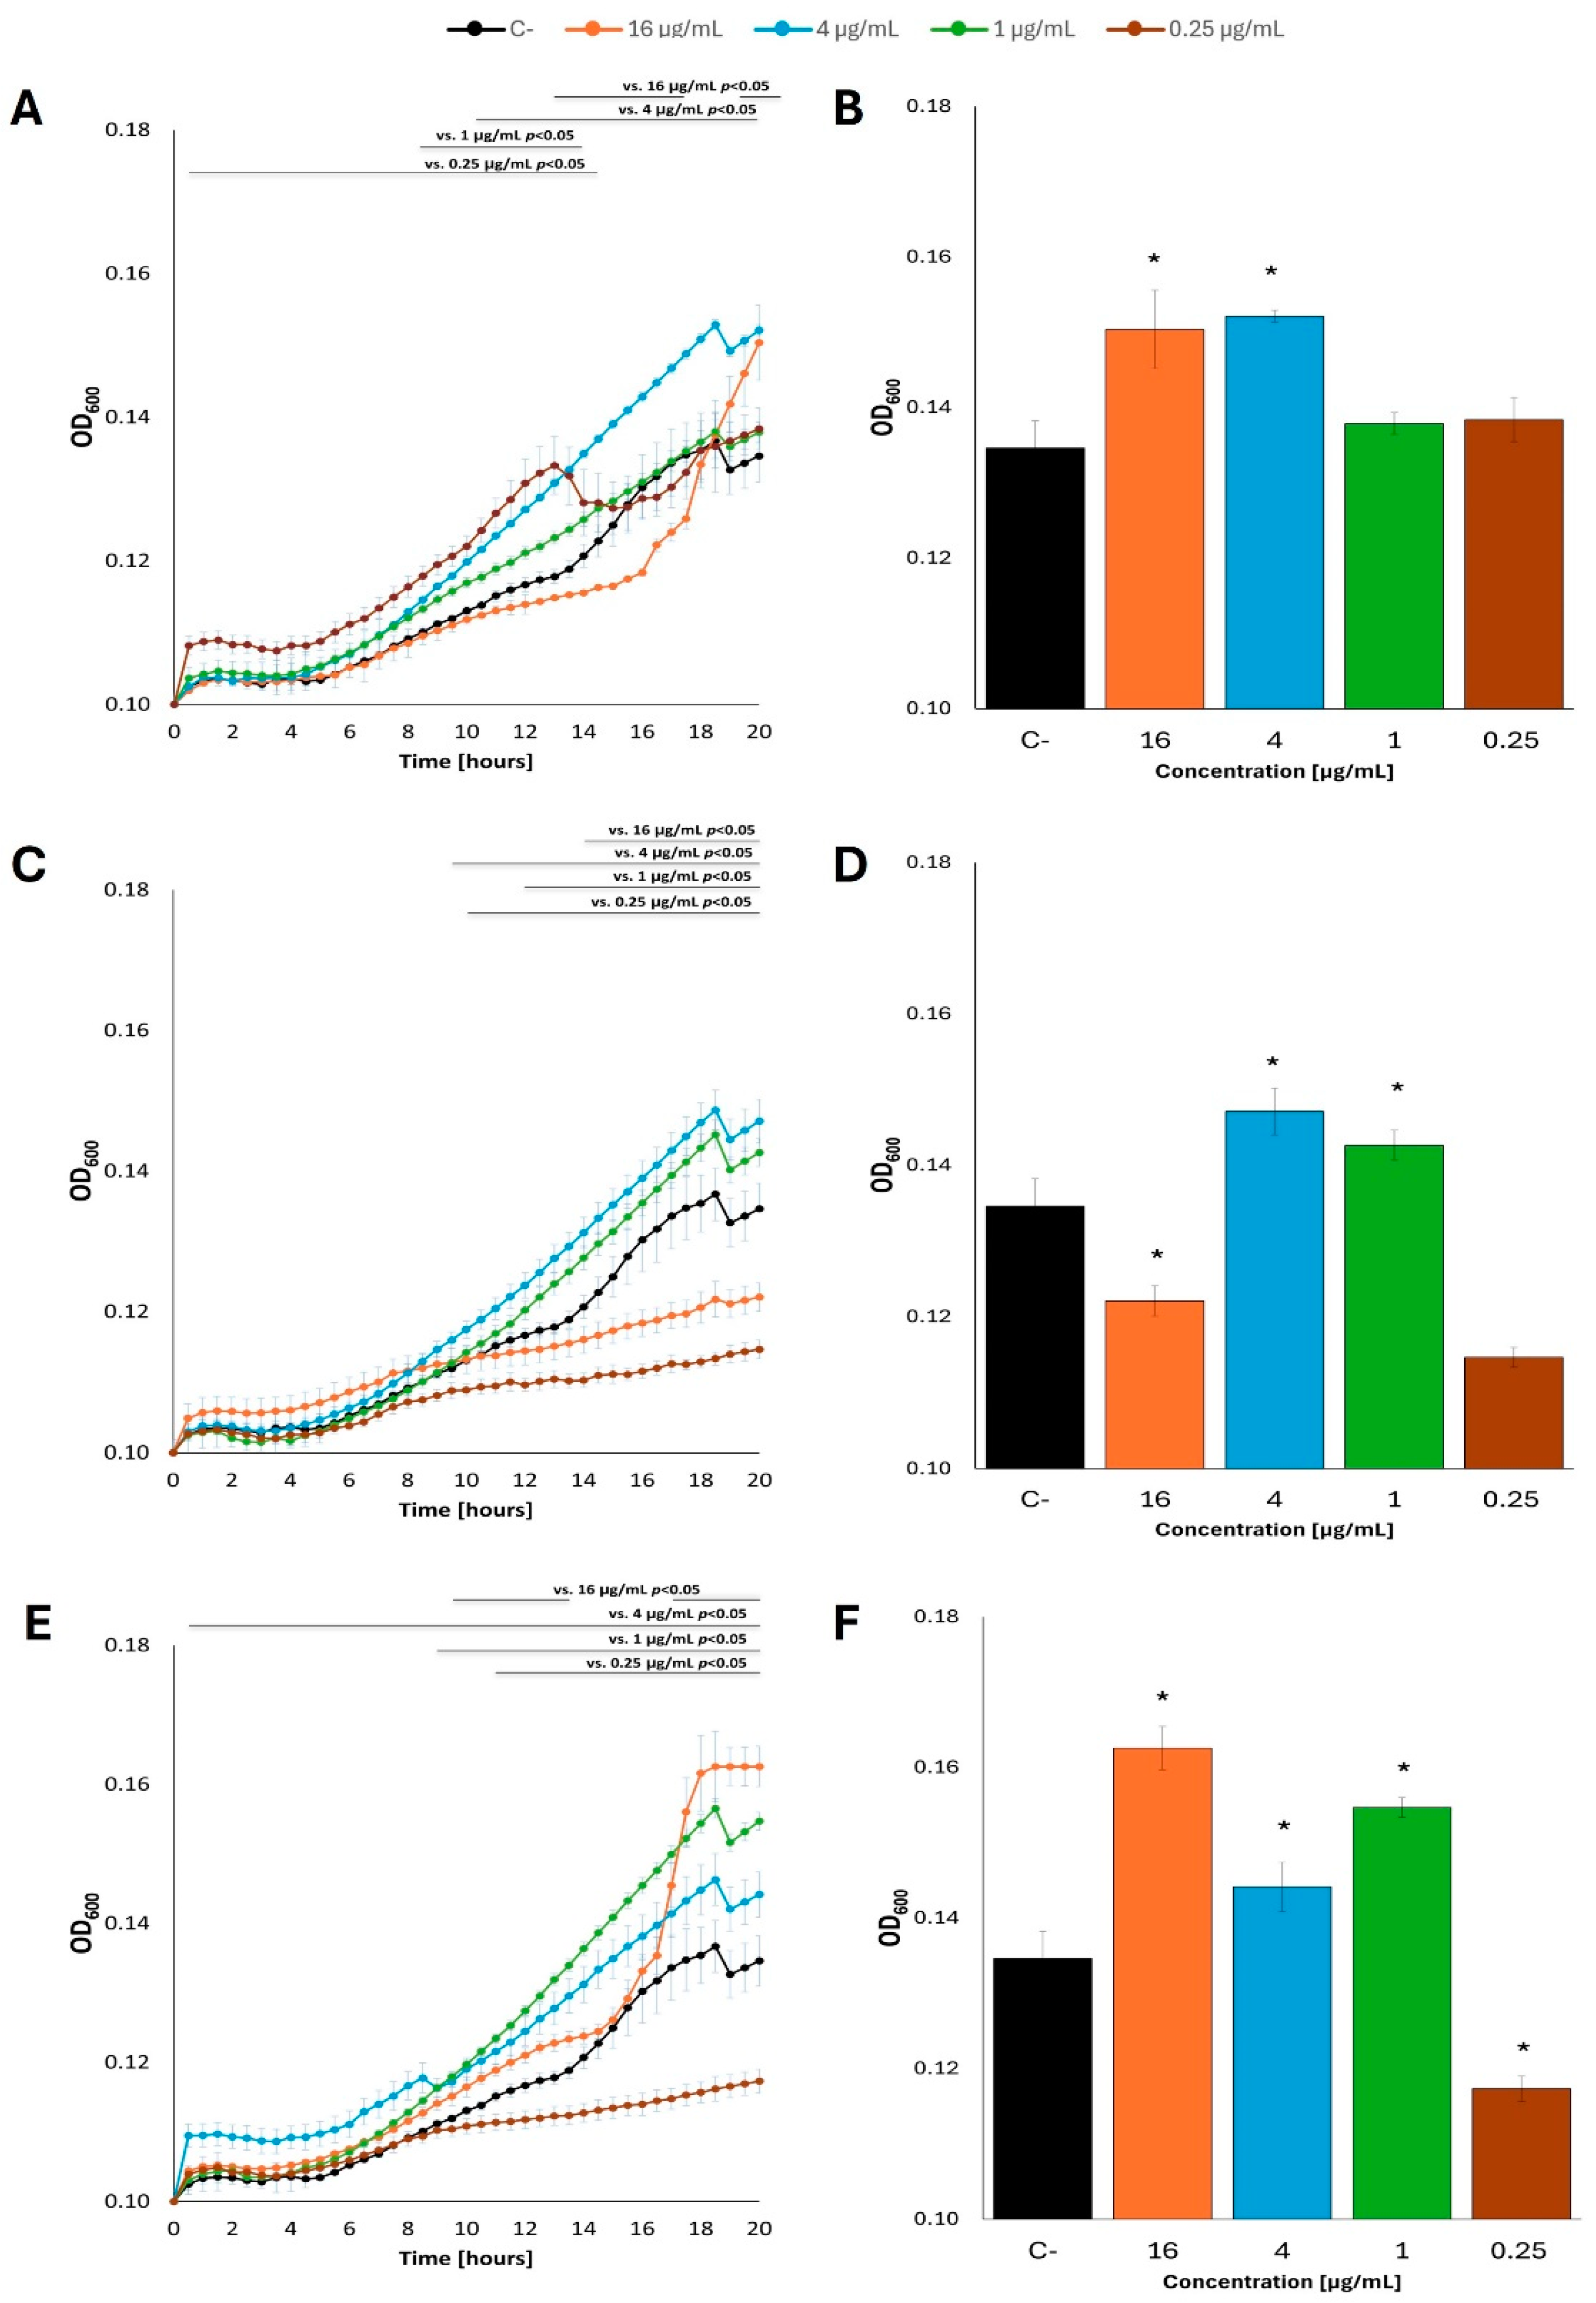
Figure 7.
Growth curves of E. coli MG1655 with the addition of fatty acids at 37 °C in M9 minimal medium, in which glucose was the carbon source. The bacteria were cultured to OD=0.1, and then the previous carbon source was removed and replaced with: butyric acid (A), caproic acid (C) and caprylic acid (E) at appropriate concentrations, contrary to control cultures which were supplemented with the original carbon source (glucose). Panels B, D and F show the optical density value of the culture at the end of the experiment: butyric acid (B), caproic acid (D) and caprylic acid (F). Statistical significance (p<0.05) is marked with an asterisk (*).
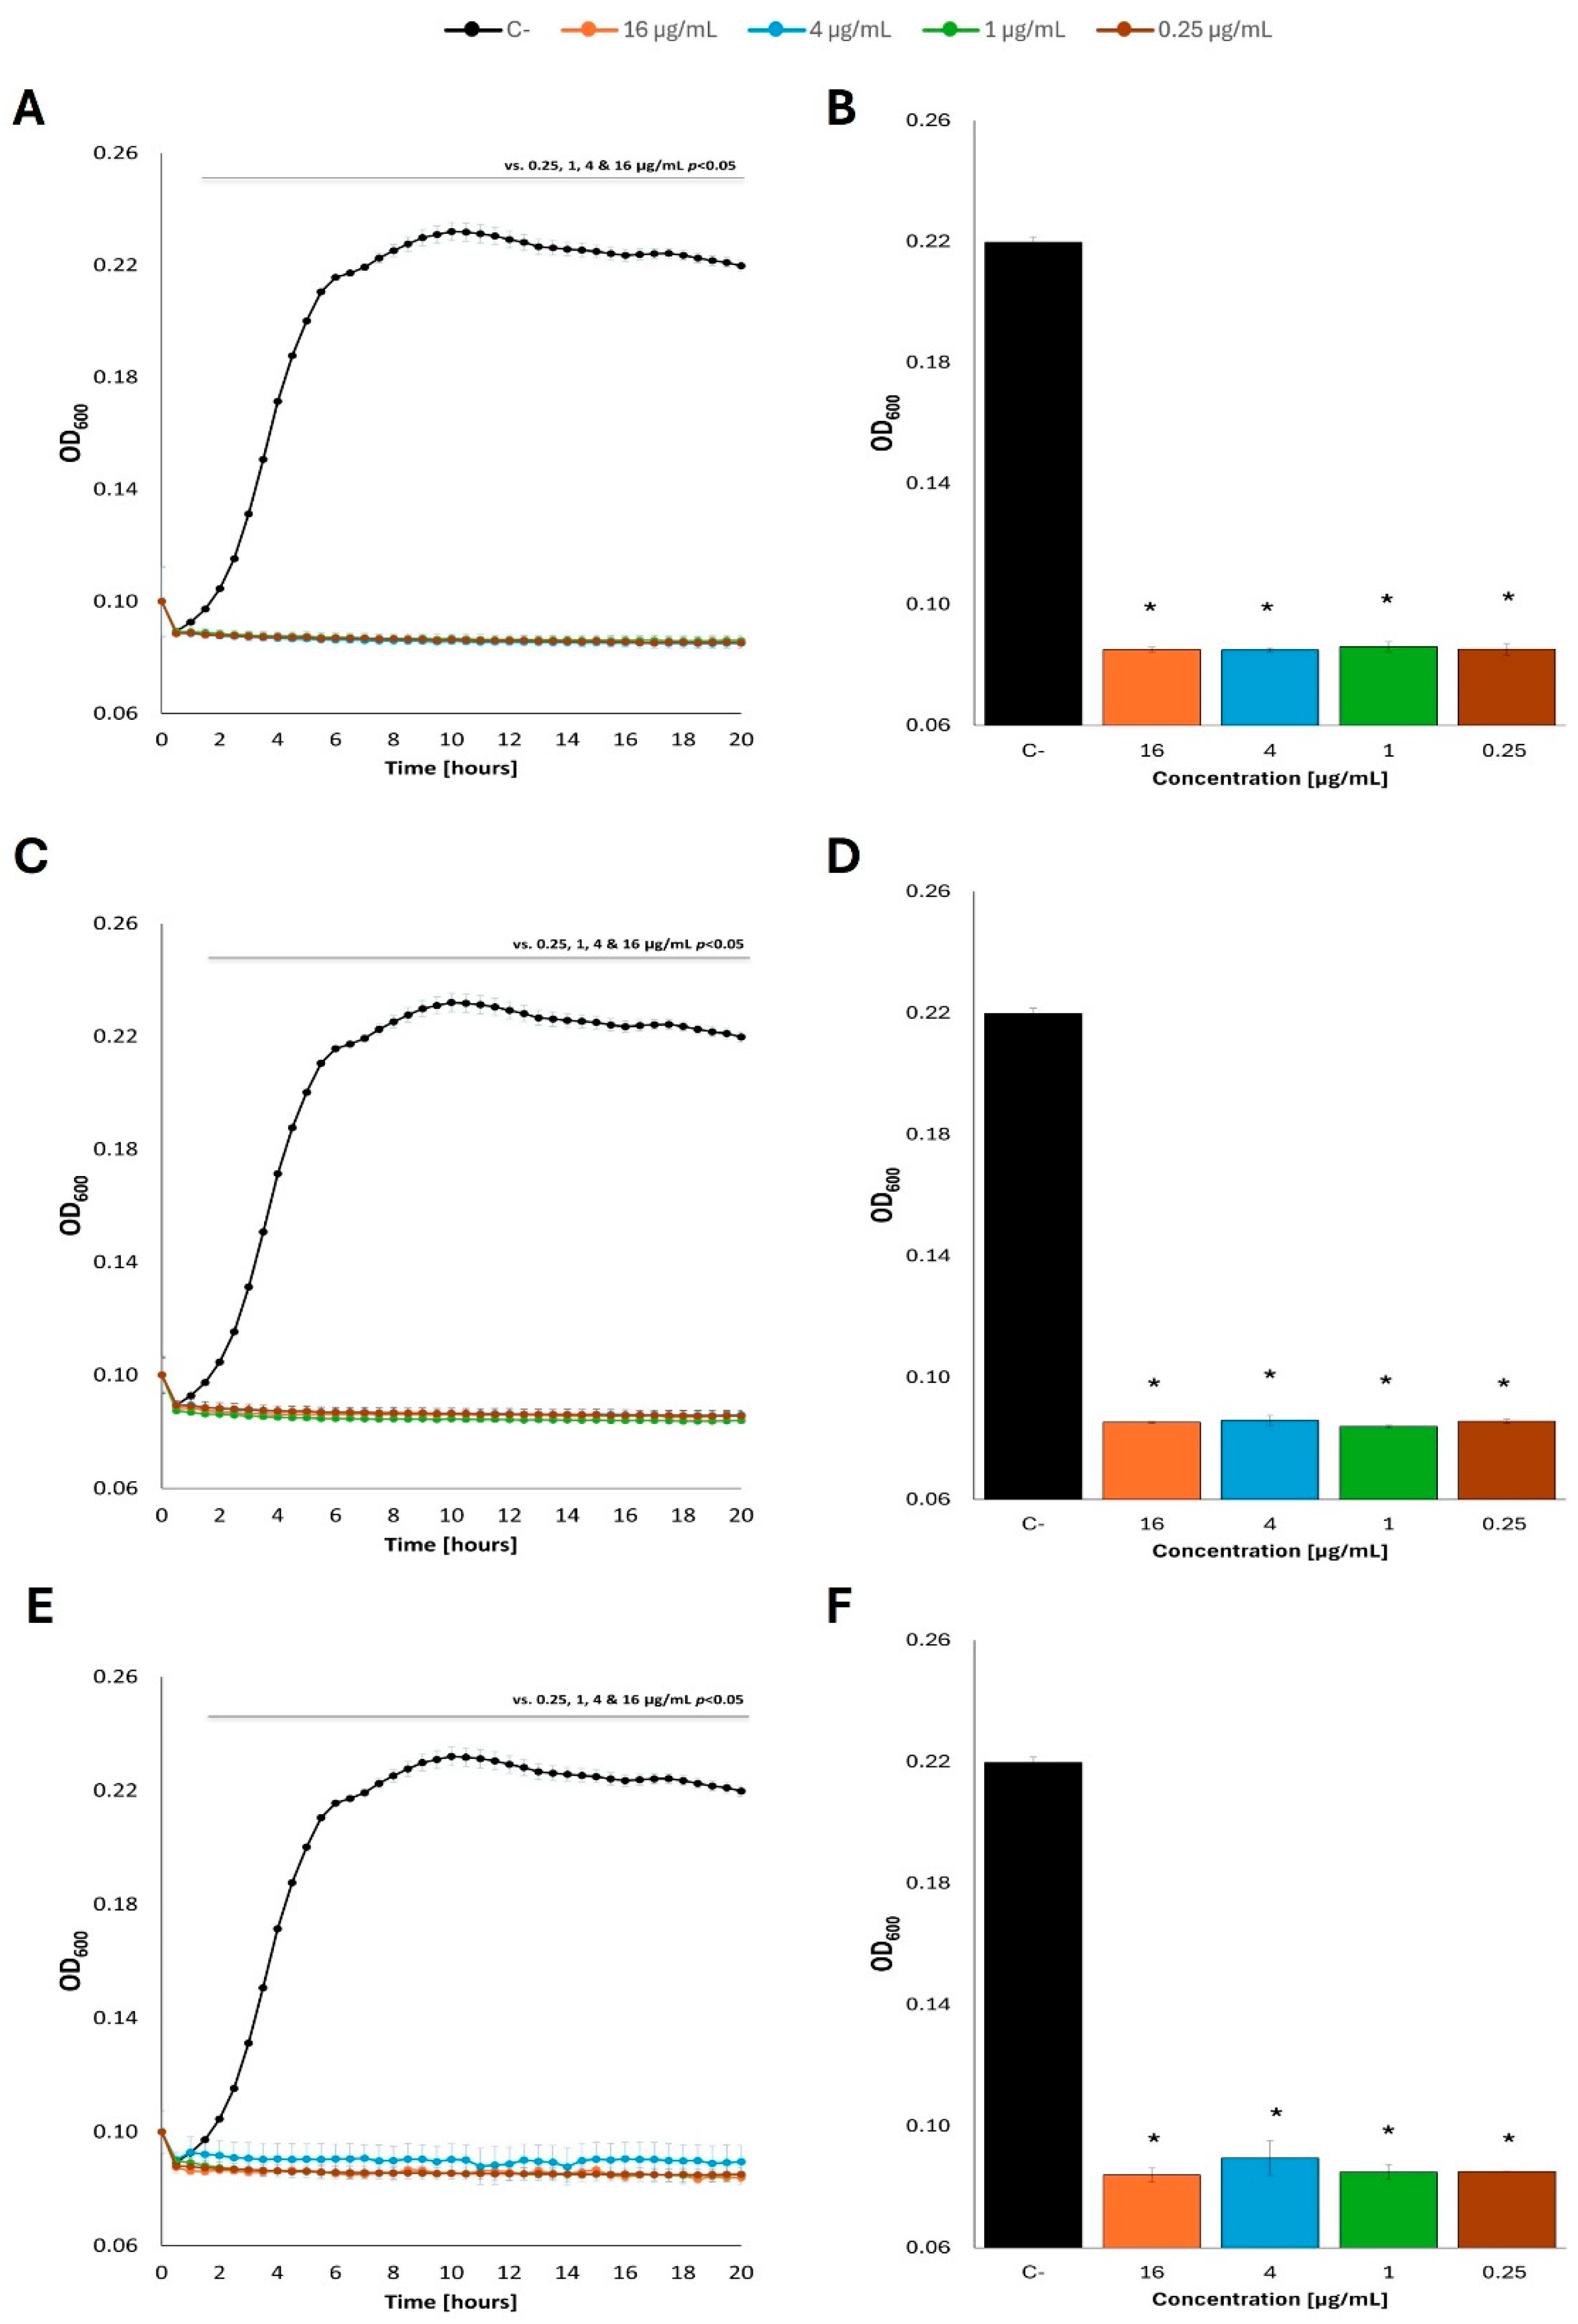
Figure 8.
Growth curves of E. coli MG1655 with the addition of fatty acids at 37 °C in M9 minimal medium, in which acetate was the carbon source. The bacteria were cultured to OD=0.1, and then the previous carbon source was removed and replaced with: butyric acid (A), caproic acid (C) and caprylic acid (E) at appropriate concentrations, contrary to control cultures which were supplemented with the original carbon source (acetate). Panels B,D and F show the optical density value of the culture at the end of the experiment: butyric acid (B), caproic acid (D) and caprylic acid (F). Statistical significance (p<0.05) is marked with an asterisk (*).
Disclaimer/Publisher’s Note: The statements, opinions and data contained in all publications are solely those of the individual author(s) and contributor(s) and not of MDPI and/or the editor(s). MDPI and/or the editor(s) disclaim responsibility for any injury to people or property resulting from any ideas, methods, instructions or products referred to in the content. |
© 2025 by the authors. Licensee MDPI, Basel, Switzerland. This article is an open access article distributed under the terms and conditions of the Creative Commons Attribution (CC BY) license (http://creativecommons.org/licenses/by/4.0/).
Copyright: This open access article is published under a Creative Commons CC BY 4.0 license, which permit the free download, distribution, and reuse, provided that the author and preprint are cited in any reuse.


