
Submitted:
14 July 2025
Posted:
15 July 2025
You are already at the latest version
Abstract
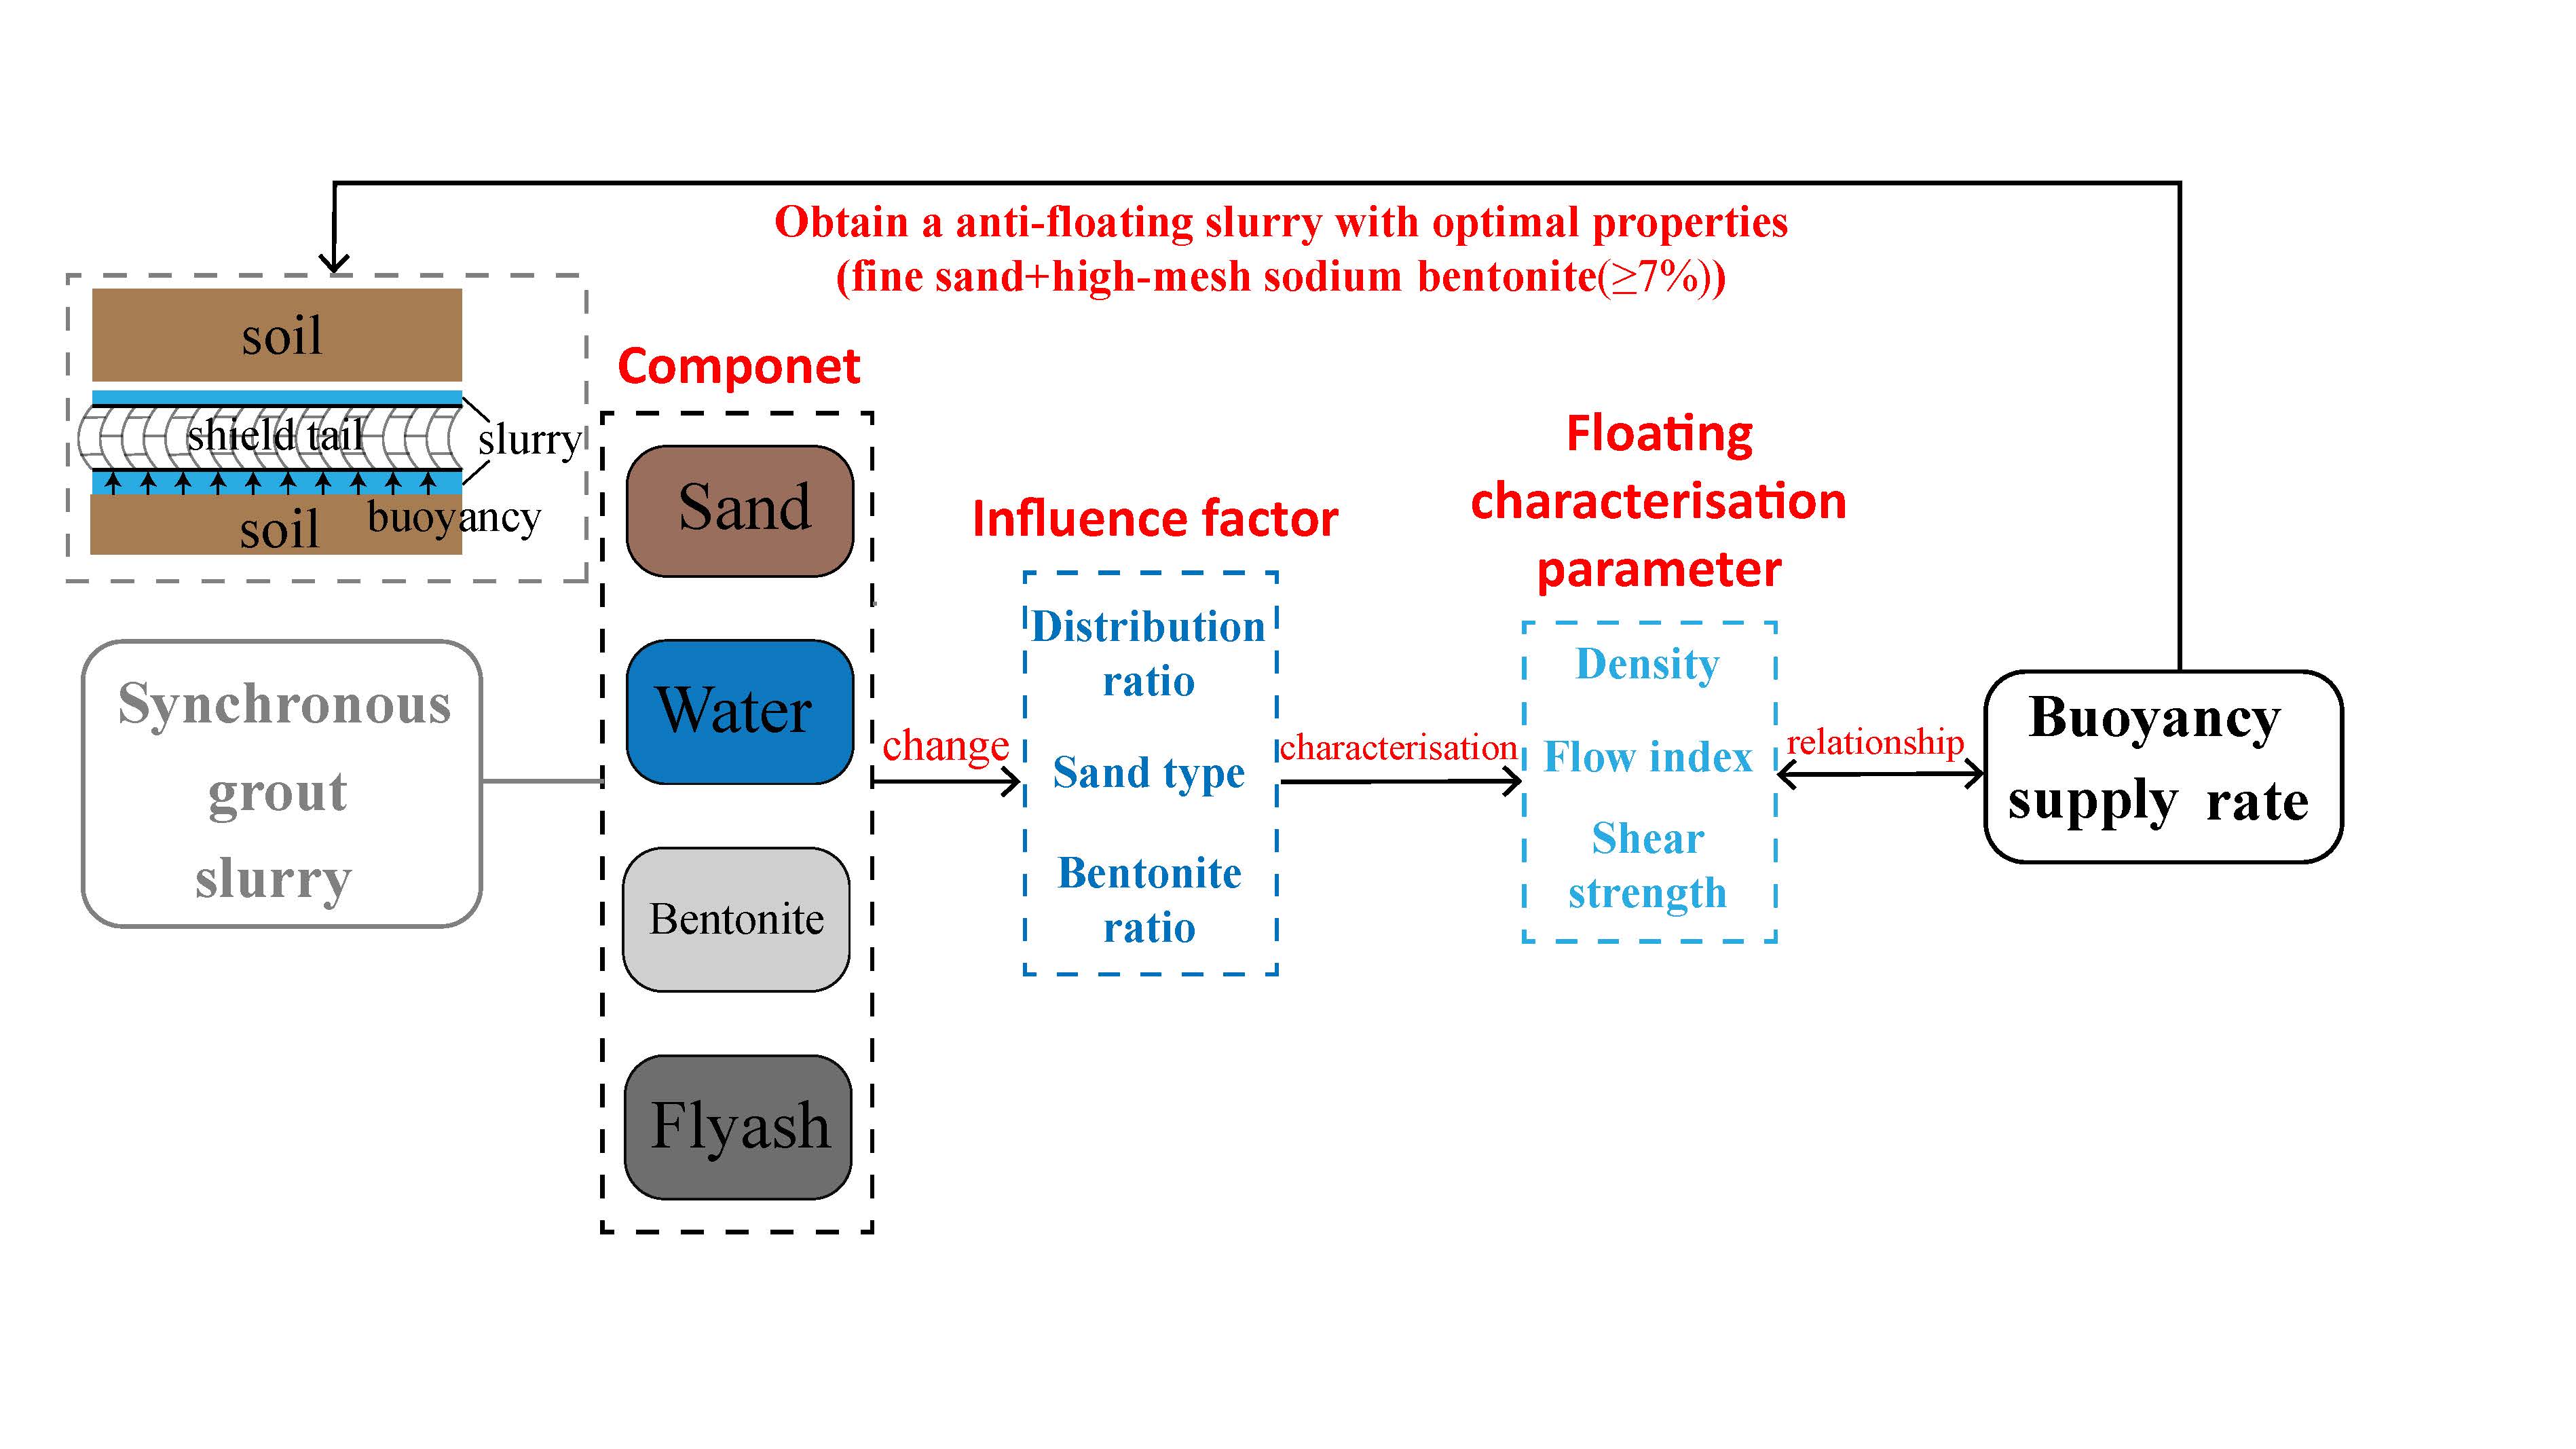
Synchronous grouting slurry is widely used in shield tunnel construction to fill the gaps between stratum and shield tail segments. However, as the grout is nearly liquid in the initial stages, the pipe segment rings recently separated from the shield tail are easily affected by the upward buoyancy generated by the grout, causing issues such as longitudinal misalignment and opening of ring joints. Therefore, studying the upward buoyancy characteristics of synchronous grout is crucial. In this study, floating characterisation parameters of grout were investigated using buoyancy model tests, orthogonal test, and comprehensive test. The floating characterisation parameters are affected by distribution ratio and types of each grout component. The relationship between the floating characterisation parameters of grout and buoyancy was established. The results show that density, flow index, and shear strength can be used as the floating characterisation parameters. Binder–sand and water–binder ratios have the largest impact on the density, while the bentonite–water ratio affects flow index the most. In addition, bentonite–water and binder–sand ratios have the greatest effect on the shear strength. Furthermore, the particle size of sand and type of bentonite considerably influence the flow index and shear strength. A high-shear grout using well-graded fine sand and a high mesh of sodium bentonite was considered in this study. When the content of bentonite exceeds 7% (P2.2), Archimedes' law is not applicable for calculating the up-ward buoyancy of grout. Buoyancy supply rate exhibits gradual enhancement with flow index elevation, yet with diminishing growth rates.
Keywords:
floating characterisation parameters
; fow index
; shear strength
; grout component
; upward buoyancy
1. Introduction
With the acceleration of the urbanization process in China, the number of cities with populations over 10 million is rapidly increasing. Thus, the urban demand for subway and cross-river tunnels has been increasing [1,2]. Shield tunnelling is widely used in tunnel construction because of its advantages of environmental friendliness, high efficiency, and safety [3,4,5].
In shield tunnelling, the gaps between the surrounding rock and shield-tail segments need to be filled by synchronous grouting so as to effectively control the surface settlement and surrounding rock disturbance caused by the tunnelling process [6,7]. However, owing to the low strength of grout in the initial stages and the upward buoyancy due to the grout, the segments are prone to upward displacement, eventually leading to the hazards such as longitudinal misplacement, opening of circular joints, and concrete fragmentation at bolt holes[8]. To improve the efficiency of urban traffic and save underground space resources, modern traffic tunnels are being developed as large cross-section tunnels. The shield tail annular gap of a large cross-section shield tunnel is also large. This increases the spacing of segments and aggravates the floating phenomenon [9]. Therefore, the problem of upward buoyancy on the segments needs to be solved urgently.
Several field measurement and numerical simulation studies exist on shield segment upward buoyancy [2,10,11,12]. These studies identified multiple influencing factors: soil thickness, hydrogeological conditions, shield attitude, tunnelling speed, grouting pressure, and grout component ratios affect the degree of segment upward buoyancy. Wang, Qin, Ding, Wang, Yu and Wang [2] found that synchronous grout ratios were the main construction factors affecting segment buoyancy.
Owing to the time variability of grout, upward buoyancy acting on the segments is dynamic; therefore, the rate of increase of buoyancy-induced displacement generated during the entire process also varies continuously [13]. The phenomenon of upward buoyancy occurs when segments just separate from the tail of the shield machine [14]. After segments are completely encapsulated by grout, the upward buoyancy on the segments reaches an peak value. Buoyancy effects develop rapidly in the initial stage of segment assembly (1–5 rings) [15]. However, the initial setting time of grout is relatively long (typically 6–14 h), during which segments enter the initial setting state[16]. Before the initial setting of the grout, the segments remain subjected to the effect of upward buoyancy generated by the grout over extended periods resulting in concentrated buoyancy-induced displacement in this period. Therefore, studying the upward buoyancy characteristics of grout before initial coagulation is of considerable significance. Single-liquid inert grout (SLIG) is widely used in shield tunnelling synchronous grouting due to its cost-effectiveness and cement-free composition. However, compared to double-liquid grout, SLIG exhibits longer initial setting times and lower strength than rigid grout, both of which exacerbate buoyancy-related challenges [17]. Consequently, research on SLIG’s buoyancy behavior is crucial for mitigating segment uplift through grout property optimization.
To quantitatively describe the upward buoyancy of grout, it is necessary to define the relevant parameters. In shield tunnel construction, the upward buoyancy generated by grout not only includes the liquid buoyancy generated by grout itself but also the partial elimination of the anti-buoyancy generated by the biting force and internal friction between the aggregate inside the grout. Hu, et al. [18]directly calculated the liquid buoyancy generated by the grout by using Archimedes’ law of buoyancy. The grout was assumed to be a Newtonian fluid. The viscous resistance of the grout was calculated as part of the anti-buoyancy.
Considering the non-Newtonian fluid nature of synchronous grouting slurry, some scholars proposed that this grout should be assumed as a Bingham fluid, and the relationship between the shear strength of grout and the maximum buoyancy of the tunnel was established by incorporating its shear strength [19]. The grout’s shear strength constitutes the primary component of tunnel anti-buoyancy. Therefore, its shear strength before initial setting critically governs segment buoyancy control. Yang [20] reported that for pumpable grouts, elevated early shear strength and accelerated growth rates result in diminished upward buoyancy. These findings demonstrate that upward buoyancy comprises both liquid buoyancy and anti-buoyancy. Consequently, calculating upward buoyancy directly via Archimedes’ law proves inaccurate, as it depends on both grout density and shear strength.
In addition, some researchers have proposed that grout fluidity significantly influences upward buoyancy [1,17,21]. Xu, et al. [22] reported that controlling grout consistency within a limited range facilitates the formation of an integral structure between tunnel segments and surrounding rock, thereby enhancing anti-floating resistance. Tian [23] proposed an anti-floating strategy based on two fluidity indices: consistency (9–10.5 cm) and slump (3–4 cm). Abd Elaty and Ghazy [24] suggested using the flow index as the liquidity index, demonstrating its stability across multiple test batches for the same slurry. These studies collectively indicate that upward buoyancy depends not only on grout density and shear strength but also critically on fluidity indices. However, existing research exhibits inconsistencies: (1) diverse floating characterization parameters lack unified theoretical justification, and (2) quantitative relationships between buoyancy and these parameters remain undefined.
The characterisation parameters of buoyancy are closely related to the proportions and types of grout components. Many researchers have discussed the influence of water–binder ratio (the ratio of water to fly ash and hydrated lime), binder–sand ratio, bentonite–water ratio, and fly ash–lime ratio on the characterisation parameters of grout, namely density, consistency, slump, setting time, 28-d compressive strength, leakage rate, and consolidation shrinkage rate[16,25,26,27,28,29].
Some researchers discussed the influence of a certain component on the grout. Kim, et al. [30] and Yang, He, Liu, Chen and Li [16] proposed that fly ash could fill slurry pores and improve slurry workability. Toniolo, Rincón, Roether, Ercole, Bernardo and Boccaccini [25] and Xu, Ma, Wang and Wang [22]proposed that hydrated lime reacts with fly ash to produce a gelatinous substance that can improve the strength of grout. Bezuijen, et al. [31] and Delaleux, Py, Olives and Dominguez [26] found that bentonite can fill pore and make grouts more compact. Further research considering the type and mesh size of bentonite has found that sodium bentonite makes grouts have better water retaining property than calcium bentonite[31,32]. In addition, some researchers have studied sand and sandy soil and found that the content of coarse and fine particles, and particle size, have a significant correlation with the shear strength[33]. Few extant studies have examined the influence of grout component ratio on shear strength and fluidity index, and no quantitative study has been conducted.
In this study, the upward buoyancy characteristics of synchronous grout in shield tunnels before the initial setting were investigated. Through buoyancy model tests, key characterization parameters representing grout-induced buoyancy were determined. In addition, the influence of the proportion of grout components on the floating characterisation parameters was systematic ally analyzed using orthogonal and comprehensive tests. By varying the contents of slurry components in model experiments, correlations between buoyancy characterization parameters and upward buoyancy were established. Furthermore, the mechanism by which components affect grout buoyancy was elucidated. These findings enable the reduction of grout-induced upward buoyancy and enhance segment floating control.
2. Materials and Methods
2.1. Material
A single-liquid inert grout was used in this test. Raw materials included fly ash, sand, slaked lime, bentonite, and water. First-grade laboratory fly ash was sourced from Yulian power Plant (Gongyi, China) ), desalinated sea sand from commercial suppliers, sodium bentonite from Yiguo Bentonite Factory (Anji, China), and hydrated lime from Liannanqiao Building Materials Factory (Guangdong, China). Table 1 shows the performance indeces of each raw material.
Sieve analysis results revealed that the sand had a fineness modulus of 2.10, with coefficients of uniformity (Cu = 2.52) and curvature (Cc = 0.96). These values classify the sand as poorly graded fine sand. Figure 1 depicts its grading curve.
2.2. Equipment
The buoyancy test utilises a self-design simple buoyancy model device (manufactured by Zhi fang Hardware Machinery Factory, HangZhou, China), comprising four principal subsystems. The core component is an 800 mm tall organic glass cylinder (100 mm diameter, 10 mm wall thickness) secured with eight bolts through its upper flange, which integrates dual water injection ports and maintains a 100 mm base clearance. This is housed within a 600 mm high plexiglass test tank (300×300 mm base, 12 mm wall thickness) featuring a slurry inlet 50 mm above its baseplate and matching bottom clearance. The sensing system includes: a 100 N tension load cell (Nanjing Danmo Electronics Co., Ltd., Nanjing, China) suspended from the reaction frame; paired earth pressure cells symmetrically installed at the cylinder base and tank sidewall; and a data acquisition unit (Weihan Instruments, Puyang, China). This configuration enables simultaneous measurement of vertical buoyancy forces through direct tension sensing and distributed fluid pressures via the dual earth pressure transducers, with the bottom clearances facilitating analysis of pressure distribution dynamics. The integrated system, as illustrated in Figure 2, allows comparative evaluation of buoyancy generation mechanisms through synchronized force-pressure data correlation.
For buoyancy measurement, the glass cylinder was first fixed to the reaction frame, with its exterior coated with lubricant to minimize wall friction. A After filling the cylinder base with slurry and compacting via vibration, the tension sensor was calibrated to match the suspension reference value by fine-tuning the reaction frame’s adjustment screws. This initialization procedure eliminated preload forces between the cylinder base and slurry. The slurry was slowly increased to minimise the wobble of the cylinder body and added to the specified position. Compaction was performed using an electric vibrator, and the increase or decrease was then adjusted.
Flow index determination employed a custom-designed penetration cone (570 g total mass) (Figure 3). Featuring a 200 mm height with 53.59 mm base radius and 30° tapered tip, the cone incorporated a top-mounted counterweight chamber for precision mass adjustment. The experimental procedure is in agreement with the requirements of the consistency test. By adding sand into the hole to change the balance weight of the cone, the sinking depth under varying balance weight was measured, and the theoretical buoyancy and gravity of the cone under each balance weight were calculated. The percentage of the ratio of the two is the flow index.The flow index, expressed as FI (%) = (ρfluid×Vdisplaced / m cone) ×100, provided a dimensionless parameter characterizing the slurry’s buoyant response under controlled loading conditions.
The shear strength testing employed a TT-LVS automatic cross plate shear tester (Suzhou Tuotest Instrument Equipment Co., Ltd., Figure 4), designed for measurement of soft/sensitive clay shear strength and undrained grout shear strength. The system configuration comprised a Φ100×177 mm sample chamber paired with a Φ25.4×50.8 mm cross plate, operating at 0.001–180°/min strain rates through stepless speed regulation. Torque sensor utilized a 0~30 N·m range with ±0.3% FS accuracy and 0.1 N·m resolution.
3. Materials and Methods
3.1. Trial Test
Before the test, tension sensor calibration was performed by comparing pre-/post-loading readings to verify instrument accuracy and validate the sensor’s calibration factor. Thereafter, on the basis of the synchronous grouting slurry ratio given by the mud factory of this project, the sand content, water consumption and total powder material were controlled to remain unchanged, and the powder material group allocation ratio was changed for the pre-test. A reference slurry with bentonite content (3.18% by mass) was designated P1.0, with subsequent specimens (P1.0, P2.0, P2.5) indexed to their respective bentonite increments. The shear strengths and flow indexes of the groups P1.0, P2.0, and P2.5 were evaluated to verify the feasibility of their characterisation of buoyancy.
3.2. Effect of Grout Composition on Characterisation Parameters of Uplift
An orthogonal test with four factors (water–binder ratio, the cement–sand ratio, the water–swelling ratios and the bentonite–cement ratio) — each evaluated at three levels. The L9(3⁴) orthogonal array detailing factor-level combinations is tabulated in Table 3.
As regards the control groups of sand grading, the sand can be divided into fine sand (fineness modulus of 2.2), medium sand (fineness modulus of 2.58), and coarse sand (fineness modulus of 3.34). Bentonite can be classified into low viscosity (calcium base 325 mesh), medium viscosity sodium (325 mesh), and high viscous sodium (1250 mesh). The comprehensive test was adopted in this study. Table 4 presents the component grouping for the comprehensive test.
3.3. Experiment on the Relationship Between Buoyancy Characterisation Parameters and Buoyancy
Based on the slurry ratio of engineering synchronous grouting, a more detailed slurry ratio test was conducted for grout with bentonite content between P2.0 and P2.5. Finally, the slurry flow index, shear strength and buoyancy of groups P2.5, P2.4, P2.3, P2.2, P2.0 and P1.0 were obtained. The buoyancy supply rate of each grout group (measured buoyancy/theoretical buoyancy calculated on the basis of Archimedes’ law) was calculated.
4. Results and Discussion
4.1. Verification of Floating Characterisation Parameters
As illustrated in Figure 5, the linear regression analysis of flow indices for grout groups P1.0, P2.0, and P2.5, demonstrates a statistically significant linear correlation (R² > 0.95) between buoyance and gravity. The coefficient of determination valueswere 0.99753, 0.98700, and 0.97410 respectively, exceeding the 0.95 threshold for strong linear predictability. While the flow index methodology originates from consistency test method, it exhibits superior measurement stability with reduced experimental variance (σ < 5%) compared to standard consistency tests, effectively mitigating the measurement uncertainty characteristic of traditional approaches.
For the low-viscosity grout of P1.0 group, the flow index is 27.0%, while P2.0 group exhibited 16.7% — a 10.3% differential. Subsequent testing of the P2.5 group yielded 0.4%, representing a 9.9% reduction relative to P2.0. The comparable magnitude of variation (10.3% vs. 9.9%) between consecutive sample groups demonstrates consistent sensitivity of the flow index to compositional modifications, validating its utility as a reliable quantitative indicator of slurry fluidity characteristics.
The cross-plate shear strength of grout of groups P1.0, P2.0, and P2.5 are 13.437 kPa, 34.965 kPa, and 54.346 kPa, respectively. Although the bentonite content of group P2.0 is 6.37%, which is twice that of group P1.0, its shear strength is 2.6 times that of group P1.0. The bentonite content of group P2.5 is 1.25 times than that of group P2.0; however, its shear strength is 1.6 times than that of P2.0 group. This indicates that the shear strength changes significantly with a change in bentonite content and that the shear strength changes relatively evidently between P2.0 and P2.5, wherein the buoyancy variation range is larger. Consequently, shear strength can be used as the characterisation parameter of slurry buoyancy.
4.2. Effect of Slurry Components on Experimental Results
4.2.1. Influence of Slurry Ratio
Figure 6 illustrates the parametric influence of grout composition ratios on slurry density, revealing dominant control by the binder-sand ratio and water-binder ratio through inverse proportionality, whereas bentonite-water and fly ash-lime ratios exhibit negligible correlation. Sand aggregates dominate density modulation, followed by cementitious materials (fly ash/lime) acting as secondary influencers. Consequently, reduction of cementing material and sand content provides an effective pathway for density optimization.
Figure 7 presents the parametric relationship slurry ratio and flow index, showing a broad variation range of 20%–70%. The bentonite–water ratio exerts dominant control, with flow index decreasing exponentially as this ratio increase, whereas binder-sand and fly ash-lime ratios demonstrate negligible influence. Owing to the spatial network structure of bentonite, bentonite has the property of water absorption and swelling and can absorb a large amount of free water in the slurry, which reduces the free water content in the slurry and increases the bound water content and leads to the decline of the slurry flow index. In addition, the flow index shows an overall upward trend with an increase in the water–binder ratio. The increase of the water–binder ratio increases the overall slurry porosity, decreases the contact area between particles, and weakens the occlusal effect; as a result, the flow index also increases. Therefore, increasing the amount of bentonite can effectively weaken the fluidity of the slurry.
Figure 8 demonstrates the compositional dependence of grout shear strength (4–13 kPa range), showing significant increasement with rising bentonite-water ratio and marked reduction with increasing binder-sand ratio. Moderate decreases occur with increased water-binder and powder-cement ratios. Mechanistically, bentonite’s water-absorbing expansion ransforms free water into bound water within its spatial grid, thereby increasing viscosity. Concurrently, bentonite fills interstitial voids during fly ash-lime hydration , while aggregate sand content elevation amplifies interparticle friction and shear angle — dual factors enhancing shear resistance.
4.2.2. Influence of Slurry Composition
Figure 9 illustrates the relationship between flow index and sand type/bentonite characteristics, demonstrating a significant positive correlation between flow index and sand particle size. Slurries incorporating low-viscosity bentonite exhibit 25-30% higher flow indices than medium-viscosity or high-viscosity bentonite formulations. The accelerated growth rate of flow index with coarser sand gradation confirms dual control by sand granulometry and bentonite viscosity grade. Notably, flow indices of clay-based bentonite slurries show negligible variation across mesh number gradients (1250 vs. 325 mesh) , indicating limited sensitivity to bentonite particle size distribution.
Figure 10 illustrates the correlation between slurry shear strength and sand type/ bentonite characteristics. The shear strength of slurry mixed with low-viscosity bentonite is evidently lower than that of the other groups, indicating that the shear strength of calcium bentonite is worse than that of sodium bentonite, which is not suitable for application in engineering. Figure 10 also shows that mixing sticky bentonite in the slurry increases the shear strength of the slurry. The increase in mixed sand particle size decreases the shear strength of the low-viscosity slurry. Furthermore, the shear strength of the high-viscosity slurry is slightly higher than that of the medium-viscosity slurry for all sand types, proved that bentonite mesh has little effect on shear strength of grout. Compared with low-viscosity bentonite, adding medium- and high-viscosity bentonite can make the aggregate in the slurry have better cementation effect and better viscosity force, thus affording a higher shear strength.
Figure 10 further demonstrates that low-viscosity bentonite slurries exhibit progressive shear strength reduction with increasing sand particle size, whereas medium/high-viscosity formulations show no monotonic correlation — strength initially declines then rebounds as sand granulometry coarsens. This contrasting behavior underscores the viscosity-dependent interplay between bentonite type and sand gradation .
As for the slurry mixed with medium-viscosity bentonite and high-viscosity bentonite, the slurry is thicker, and its state exhibits both liquid and solid properties. In case of fine sand, as a result of fine particles better filling the slurry, the overall specific surface area of fine particles is larger. Consequently, the contact area between the solid particles is larger, and improved shear strength of the slurry results. The shear strength improvement is more powerful than the bite force of coarse sand; the mixing of medium-viscosity bentonite with high-viscosity bentonite affords higher shear strength. As indicated by Figure 10, the shear strength of medium bentonite slurry mixed with fine sand is 5.278 kPa larger than that of low-viscosity bentonite slurry, and that of medium-viscosity bentonite slurry mixed with medium sand is 6.411 kPa larger than that of low-viscosity bentonite slurry. Meanwhile the shear strength of medium-viscosity bentonite slurry mixed with coarse sand is 9.191 kPa larger than that of low-viscosity bentonite slurry. The shear strength of the slurry with larger sand particle size increases more when the low-viscosity bentonite was replaced by medium-viscosity bentonite. This result indicates that the biting force between coarse particles begins to play a role at this time, making the shear strength associated with coarse sand higher than that with medium sand.
Figure 11 illustrates the comparison of the appearance of coarse sand and fine sand in the slurry mixed with low-viscosity bentonite. This slurry tends to behave as a liquid because it is thin, and the sand is suspended in the slurry. If the coarse sand is used, the gap between the aggregate particles in the grout would be larger, and the influence of the bite force is not evident, which is not conducive to the shear resistance of the grout. For grout mixed with fine sand, on the one hand, fine particles can better fill the gap of grout, making the grout denser. On the other hand, the overall specific surface area of fine particles is larger, leading to a larger contact area between solid particles. The distribution area of cementitious substances is larger, and it has stronger viscous force. Therefore, sand with fine particle size exhibits relatively good shear strength.
The upward buoyancy generated by the slurry includes the liquid-like buoyancy generated by the slurry itself and the anti-buoyancy generated by the aggregate of the slurry. The buoyancy is closely related to density, which is established under the condition of good fluidity. When the slurry is thick, the influence of density will be weakened. Therefore, in contrast with previous synchronous grout requirements on initial setting time, early compressive strength, and other indicators, anti-float grout should resist tunnel floating by utilising the biting force and internal friction between aggregate and sand particles and reduce the floating through the anti-buoyancy generated by the grout itself. According to the test results, the grout should have good particle size distribution to provide effective internal mechanical bite force, form good internal friction force, and prevent the tunnel from floating and deforming the surrounding soil because of its shear yield strength. In the case of thick grout, using fine sand with good gradation and sodium bentonite with high mesh size can effectively improve the anti-floating ability.
4.3. Relationship Between Buoyancy Characterisation Parameters and Buoyancy
Figure 12 depicts the relationship between buoyancy supply rate and flow index. When the flow index is 0.37%, the slurry buoyancy supply rate is only 51.41%; when the flow index reaches 15.46%, the slurry buoyancy supply rate reaches 99.63%. The buoyancy supply rate increases gradually with increasing flow index, and the growth rate decreases. The measured buoyancy is close to the theoretical buoyancy, indicating that the slurry has become liquid.
Figure 13 shows the relationship between buoyancy supply rate and shear strength. The figure indicates that the buoyancy remains constant at 100% until the shear strength reaches 34.965 kPa. Until that point the amount of buoyancy is essentially consistent with the calculated buoyancy based on Archimedes’ law. It confirms the serous tendency to be liquid-like; the buoyancy is only related to the density of the slurry, and its shear strength has little effect. At this time, the sand in the slurry exhibits little influence. When the shear strength reaches 34.965 kPa, the buoyancy supply rate begins to decrease, and the flow index of slurry decreases remarkably. Bentonite absorbs water and thickens the slurry, and it rapidly develops to a solid state. When the shear strength reaches 50.816 kPa, the buoyancy supply rate decreases significantly, and the slurry flow index is as low as 7.190%. The slurry showed evident solid properties, and the sand in the slurry acts as intergranular bite and affords shear strength for the slurry.
5. Conclusions
This study conducted a systematic investigation of buoyancy mechanisms in synchronous grouting slurry through integrated experimental approaches including buoyancy model test, orthogonal test, and comprehensive test. Floating characterisation parameters were demonstrated to depend on two key factors: component ratio optimization, and material selection. Quantitative correlations between these parameters and grout buoyancy were established via controlled component adjustment, providing a theoretical foundation for anti-floating strategy development. The results are as follows:
1) Density, flow index and shear strength are suitable as the floating characterisation parameters.
2) Slurry density is primarily governed by binder-sand and water-binder ratios; Flow index shows strong inverse correlation with water-swelling ratio; shear strength exhibits positive dependence on bentonite-water ratio but negative correlation with binder-sand ratio. A further comprehensive experimental study revealed flow index sensitivity to sand particle size and bentonite type. Optimal buoyancy reduction was achieved through fine sand combined with high-mesh sodium bentonite.
3) Bentonite content modulation exerts dominant control over grout-induced buoyancy, with Archimedes’ law deviating when bentonite exceeds 7% (P2.2) due to non-Newtonian behavior; buoyancy supply rate exhibits gradual enhancement with flow index elevation, yet with diminishing growth rates; concurrently, it initially remains constant then declines through an increase in shear strength.
Author Contributions
Conceptualization, methodology, supervision, W.Y., Z.W. and B.W.; data curation, formal analysis, W.Y. and J.T.; investigation, original draft preparation, J.S., J.T. and J.S.; writing—review and editing, W.Y., J.S.and Z.W.; project administration, H.L. and J.S.; funding acquisition, Z.W. and J.S..All authors have read and agreed to the published version of the manuscript.
Funding
This research has been financed and jointly supported by: 1) Zhejiang Province key research and development program (NO. 2022C01168); 2) National Natural Science Foundation of China (No. 51778585)..
Institutional Review Board Statement
Not applicable.
Informed Consent Statement
Not applicable.
Data Availability Statement
Not applicable.
Acknowledgments
This work was financially and jointly supported by Zhejiang Province key research and development program and National Natural Science Foundation of China. The support is gratefully acknowledged by the authors.
Conflicts of Interest
The authors declare no conflict of interest.
References
- Faramarzi, L.; Rasti, A.; Abtahi, S.M. , An experimental study of the effect of cement and chemical grouting on the improvement of the mechanical and hydraulic properties of alluvial formations. Constr. Build. Mater. 2016, 126, 32–43. [Google Scholar] [CrossRef]
- Wang, H.; Qin, W.; Ding, W.T.; Wang, C.Z.; Yu, W.D.; Wang, Z.C. , Research on the Antifloating Performance of Grouts with Different Mix Proportions in Synchronous Grouting of Shield Tunnels: From Laboratory Tests to Theoretical Calculations. Int. J. Geomech. 2024, 24, 04023279. [Google Scholar] [CrossRef]
- Liao, S.-M.; Liu, J.-H.; Wang, R.-L.; Li, Z.-M. , Shield tunneling and environment protection in Shanghai soft ground. Tunnelling Underground Space Technol. 2009, 24, 454–465. [Google Scholar] [CrossRef]
- Liu, J.L.; Hamza, O.; Davies-Vollum, K.S.; Liu, J.Q. , Repairing a shield tunnel damaged by secondary grouting. Tunnelling Underground Space Technol. 2018, 80, 313–321. [Google Scholar]
- Zhang, C.; Fu, J.; Yang, J.; Ou, X.; Ye, X.; Zhang, Y. , Formulation and performance of grouting materials for underwater shield tunnel construction in karst ground. Constr. Build. Mater. 2018, 187, 327–338. [Google Scholar] [CrossRef]
- Shirlaw, J.N.; Richard, D.P.; Ramond, P.; Longchamp, P. , Recent experience in automatic tail void grouting with soft ground tunnel boring machines. Tunnelling Underground Space Technol. 2004, 19, 446. [Google Scholar]
- Ding, W.Q.; Duan, C.; Zhu, Y.H.; Zhao, T.C.; Huang, D.Z.; Li, P.N. , The behavior of synchronous grouting in a quasi-rectangular shield tunnel based on a large visualized model test. Tunnelling Underground Space Technol. 2019, 83, 409–424. [Google Scholar] [CrossRef]
- Shi, Z.; Xu, J.F.; Xie, X.Y.; Zeng, H.B.; Xu, W.J.; Niu, G.; Xiao, Z.L. , Disaster mechanism analysis for segments floating of large-diameter shield tunnel construction in the water-rich strata: A case study. Eng. Fail. Anal. 2024, 157, 107953. [Google Scholar] [CrossRef]
- Ye, X.W.; Zhang, X.L.; Chen, Y.B.; Wei, Y.J.; Ding, Y. , Prediction of maximum upward displacement of shield tunnel linings during construction using particle swarm optimization-random forest algorithm. Journal of Zhejiang University-Science A 2024, 25, 1–17. [Google Scholar] [CrossRef]
- Jiang, Y.L.; Xu, Z.Z.; Geng, D.X.; Dong, J.L.; Liao, Y.Q. , Optimization of Grouting Material for Shield Tunnel Antifloating in Full-Face Rock Stratum in Nanchang Metro Construction in China. Int. J. Geomech. 2022, 22, 04022009. [Google Scholar] [CrossRef]
- Jin, H.; Yuan, D.J.; Jin, D.L.; Wu, J.; Wang, X.Y.; Han, B.Y.; Mao, J.H. , Shield kinematics and its influence on ground settlement in ultra-soft soil: a case study in Suzhou. Can. Geotech. J. 2022, 59, 1887–1900. [Google Scholar] [CrossRef]
- Wu, J.R.; Chen, J. , Experimental Research on the Floating Amount of Shield Tunnel Based on the Innovative Cumulative Floating Amount Calculation Method. Buildings 2024, 14, 1228. [Google Scholar] [CrossRef]
- Liang, Y.; Huang, X.M.; Gao, S.J.; Yin, Y.H. , Study on the Floating of Large Diameter Underwater Shield Tunnel Caused by Synchronous Grouting. Geofluids 2022, 2022, 2041924. [Google Scholar] [CrossRef]
- Yin, M.L.; Zhang, Y.Y.; Wang, R. , Accident analysis of segment floating in soft stratum shield tunnel. Journal of Municipal Technology 2014, 32, 70–72. (in Chinese). [Google Scholar]
- Li, M.Y.; Yu, L.C.; Chen, J.; Jin, J.W.; Li, P.L.; Li, C.L.; Tian, Y.F. , In situ test analysis of segment uplift and dislocation of large-diameter slurry shield tunnel in silty clay. Journal of Railway Science and Engineering 2021, 19, 1–9. [Google Scholar]
- Yang, Z.; He, Z.H.; Liu, Y.; Chen, P.S.; Li, D.J. , Recycle application of the shield waste slurry in backfill grouting material: a case study of a slurry shield tunnelling in the river-crossing Fuzhou metro. Modern Tunnelling Technology 2019, 56, 192–199. [Google Scholar]
- He, S.Y.; Lai, J.X.; Wang, L.X.; Wang, K. , A literature review on properties and applications of grouts for shield tunnel. Constr. Build. Mater. 2020, 239, 117782. [Google Scholar] [CrossRef]
- Hu, Y.F.; Xu, X.Y.; Huang, P.; He, J.; Li, L.Q. , Mechanism and control of segment floating of shield tunnel based on Newtonian kinematics. Construction Technology 2020, 49, 93–99. [Google Scholar]
- Bezuijen, A.; Talmon, A.M. , Grout pressures around a tunnel lining, influence of grout consolidation and loading on lining. Tunnelling Underground Space Technol. 2004, 19, 443–444. [Google Scholar]
- Yang, F.Q. , Anti-buoyancy technologies of extra-large slurry shield tunnel. Underground Engineering and Tunnels.
- Sonebi, M.; Lachemi, M.; Hossain, K.M.A. , Optimisation of rheological parameters and mechanical properties of superplasticised cement grouts containing metakaolin and viscosity modifying admixture. Constr. Build. Mater. 2013, 38, 126–138. [Google Scholar] [CrossRef]
- Xu, S.Q.; Ma, Q.L.; Wang, J.L.; Wang, L.L. , Grouting performance improvement for natural hydraulic lime-based grout via incorporating silica fume and silicon-acrylic latex. Constr. Build. Mater. 2018, 186, 652–659. [Google Scholar] [CrossRef]
- Tian, K. Study and application on high property grouting material used in synchronous grouting of shield tunnelling. Wuhan University of Technology, 2007.
- Abd Elaty, M.A.A.; Ghazy, M.F. , Fluidity evaluation of fiber reinforced-self compacting concrete based on buoyancy law. HBRC Journal 2018, 14, 368–378. [Google Scholar] [CrossRef]
- Toniolo, N.; Rincón, A.; Roether, J.A.; Ercole, P.; Bernardo, E.; Boccaccini, A.R. , Extensive reuse of soda-lime waste glass in fly ash-based geopolymers. Constr. Build. Mater. 2018, 188, 1077–1084. [Google Scholar] [CrossRef]
- Delaleux, F.; Py, X.; Olives, R.; Dominguez, A. , Enhancement of geothermal borehole heat exchangers performances by improvement of bentonite grouts conductivity. Appl. Therm. Eng. -34.
- Aboulayt, A.; Jaafri, R.; Samouh, H.; El Idrissi, A.C.; Roziere, E.; Moussa, R.; Loukili, A. , Stability of a new geopolymer grout: Rheological and mechanical performances of metakaolin-fly ash binary mixtures. Constr. Build. Mater. 2018, 181, 420–436. [Google Scholar] [CrossRef]
- Ajalloeian, R.; Matinmanesh, H.; Abtahi, S.M.; Rowshanzamir, M. , Effect of Polyvinyl Acetate Grout Injection on Geotechnical Properties of fine Sand. Geomech. Geoeng. 2013, 8, 86–96. [Google Scholar] [CrossRef]
- Oggeri, C.; Fenoglio, T.M.; Vinai, R. , Tunnel spoil classification and applicability of lime addition in weak formations for muck reuse. Tunnelling Underground Space Technol. 2014, 44, 97–107. [Google Scholar] [CrossRef]
- Kim, Y.; Chu, Y.S.; Seo, S.K.; Kim, J.H.J. , The non-shrinkage grout to use ground fly ash as admixture. J. Ceram. Process. Res. 2018, 19, 509–513. [Google Scholar]
- Bezuijen, A.; Sanders, M.P.M.; Den Hamer, D. , Parameters that influence the pressure filtration characteristics of bentonite grouts. Geotechnique 2009, 59, 717–721. [Google Scholar] [CrossRef]
- Yoon, J.; El Mohtar, C.S. , Groutability of Granular Soils Using Bentonite Grout Based on Filtration Model. Transp. Porous Media 2014, 102, 365–385. [Google Scholar] [CrossRef]
- Lim, S.K.; Tan, C.S.; Chen, K.P.; Lee, M.L.; Lee, W.P. , Effect of different sand grading on strength properties of cement grout. Constr. Build. Mater. 2013, 38, 348–355. [Google Scholar] [CrossRef]
Figure 1.
Cumulative curve of sand particle size gradation.
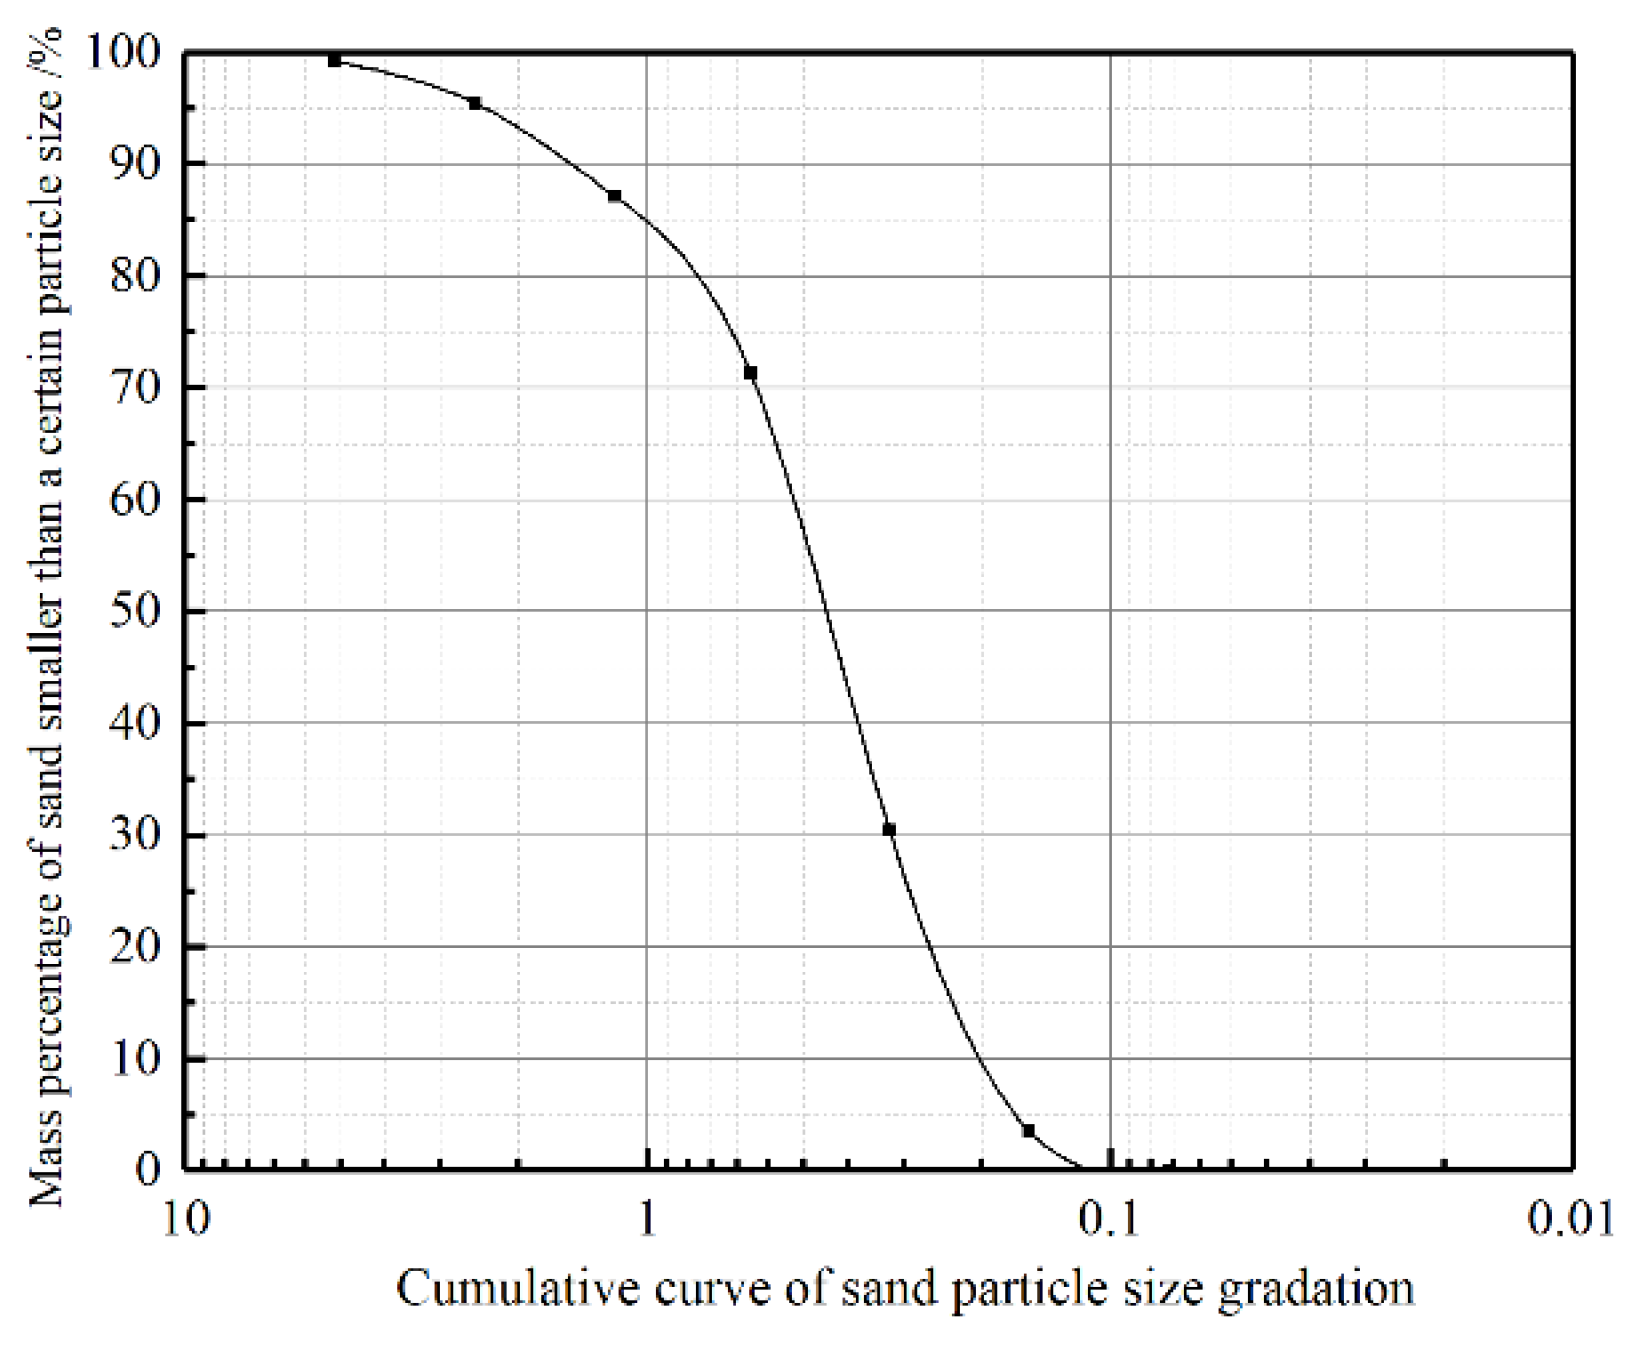
Figure 2.
Simple buoyancy test device: (a) schematic diagram; (b) the model test device.
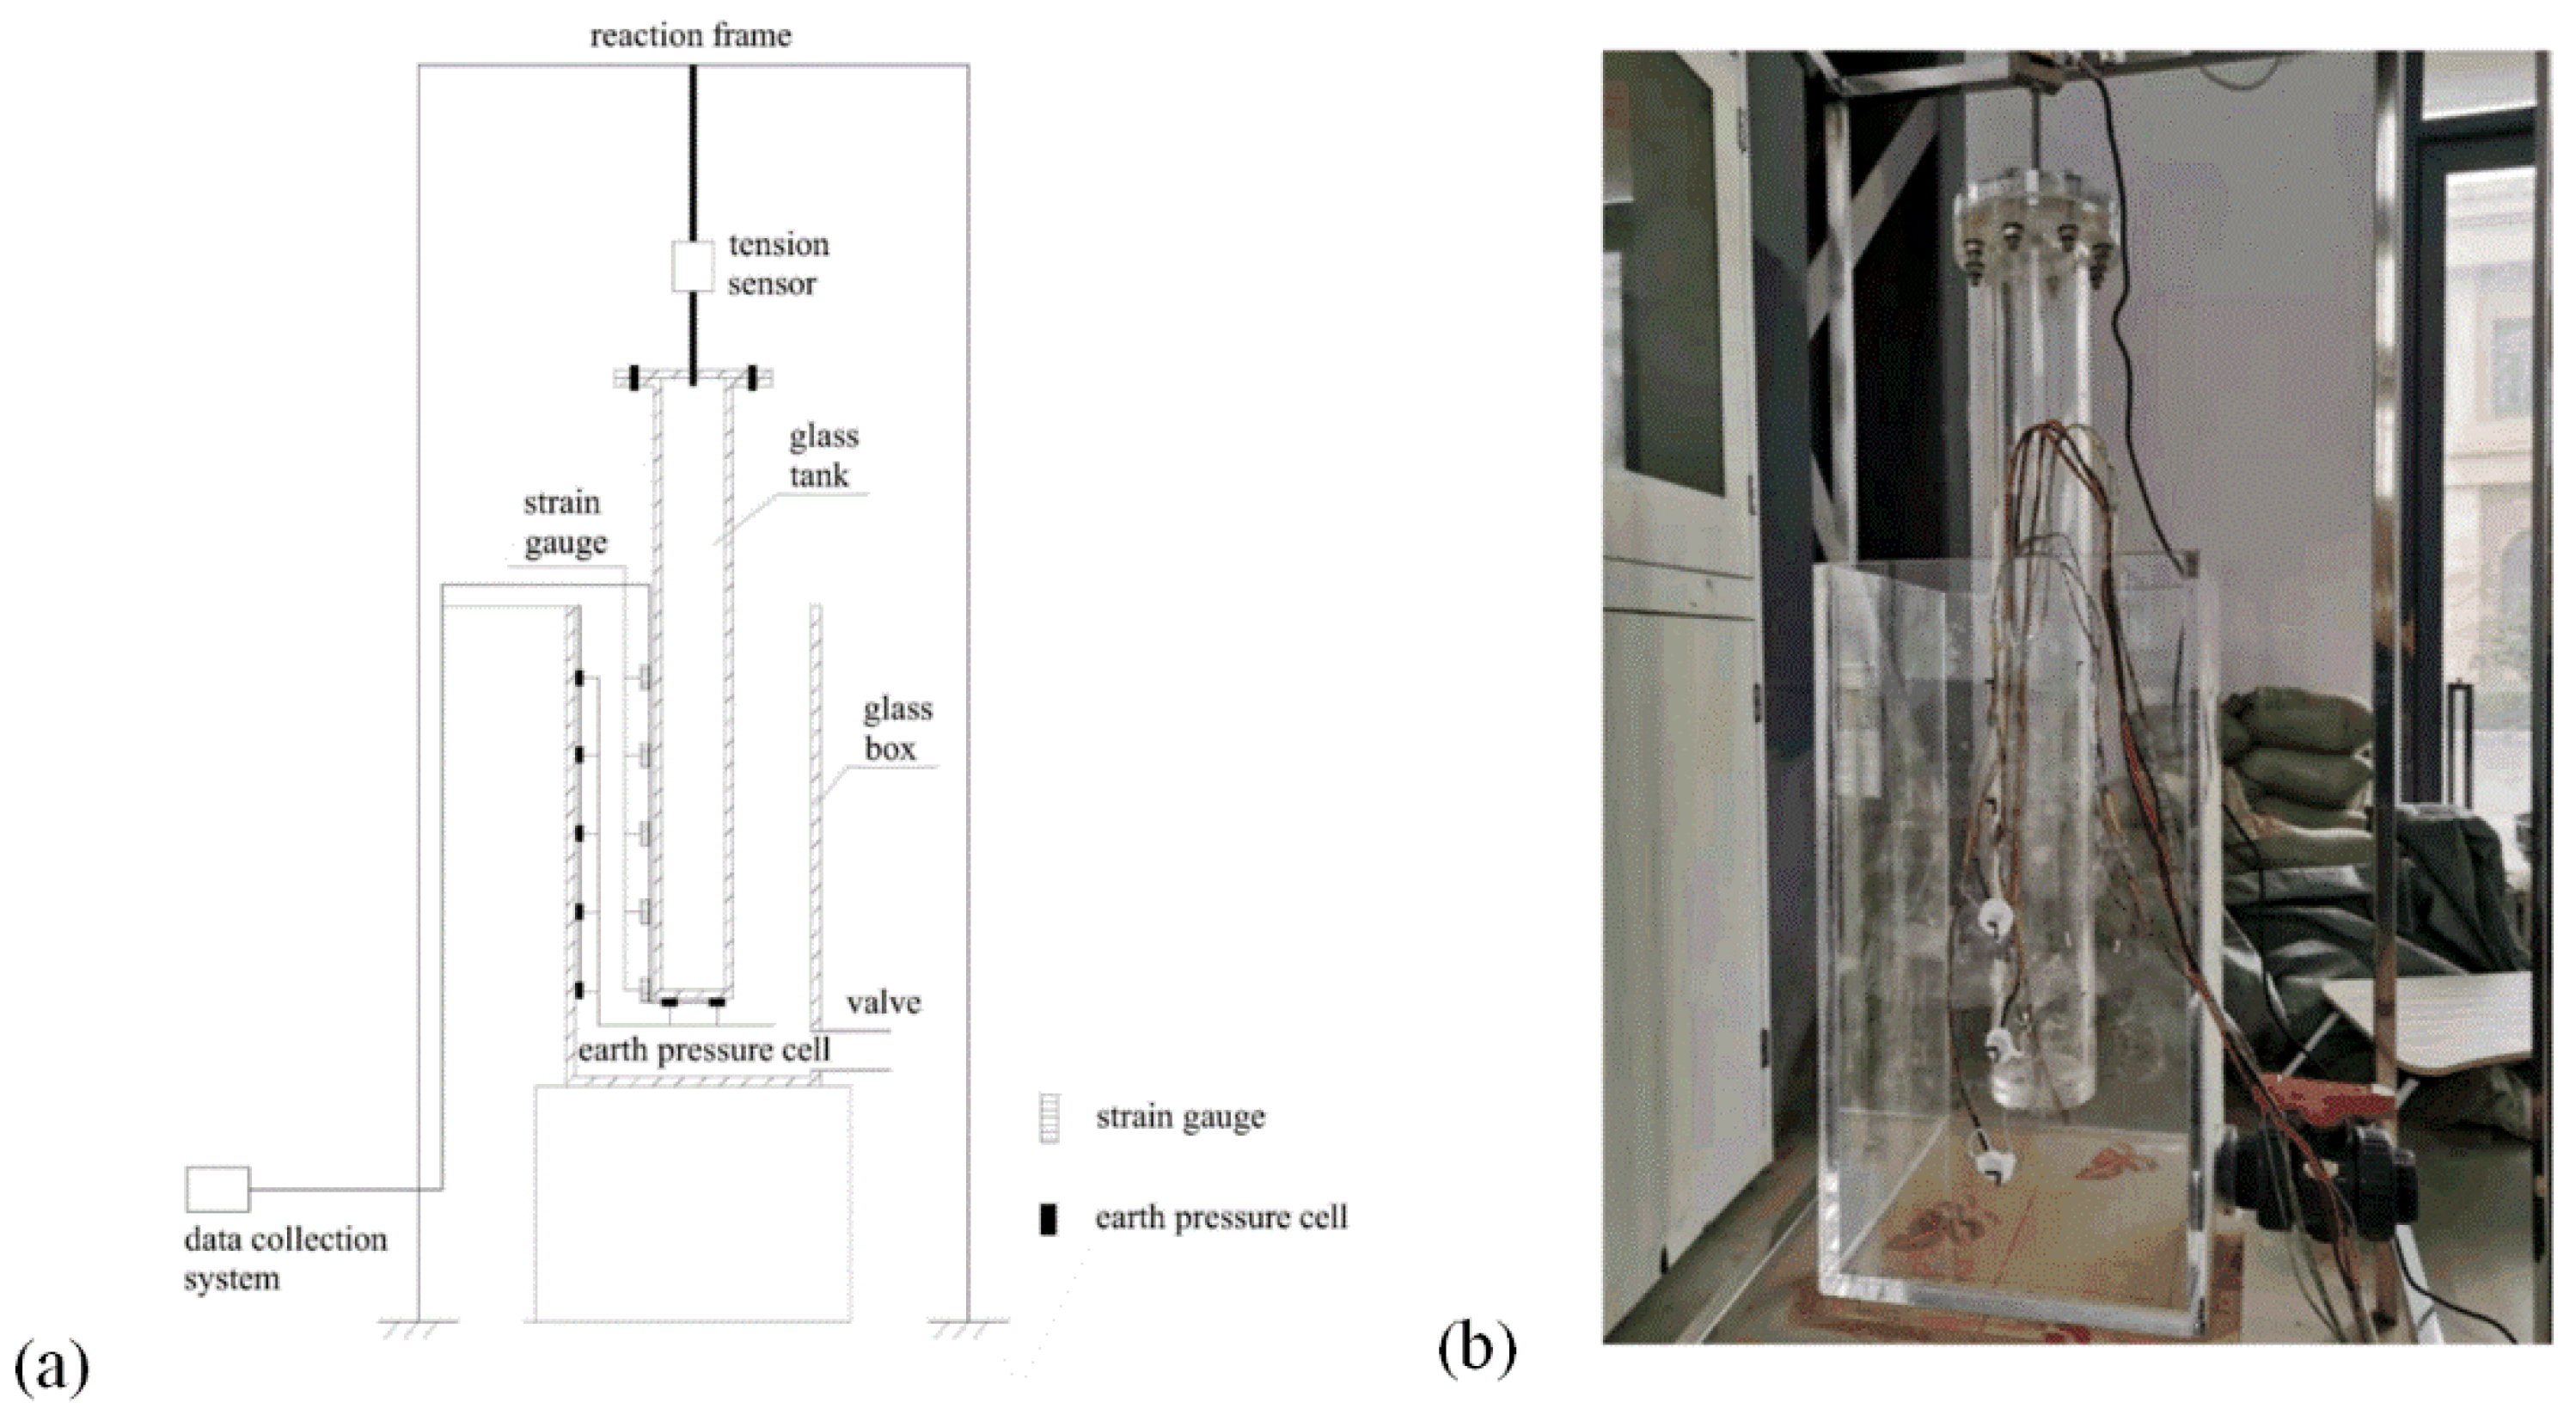
Figure 3.
Self-made test cone.
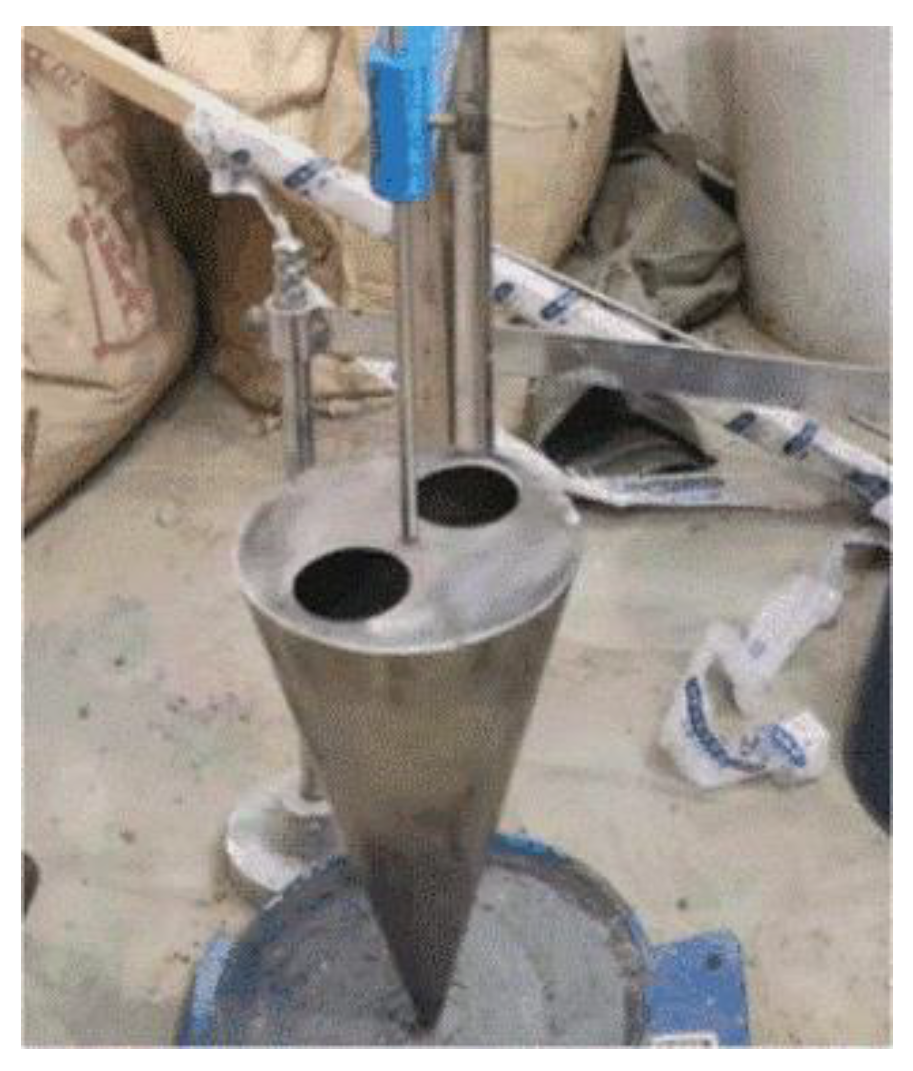
Figure 4.
Automatic cross-plate shear machine.
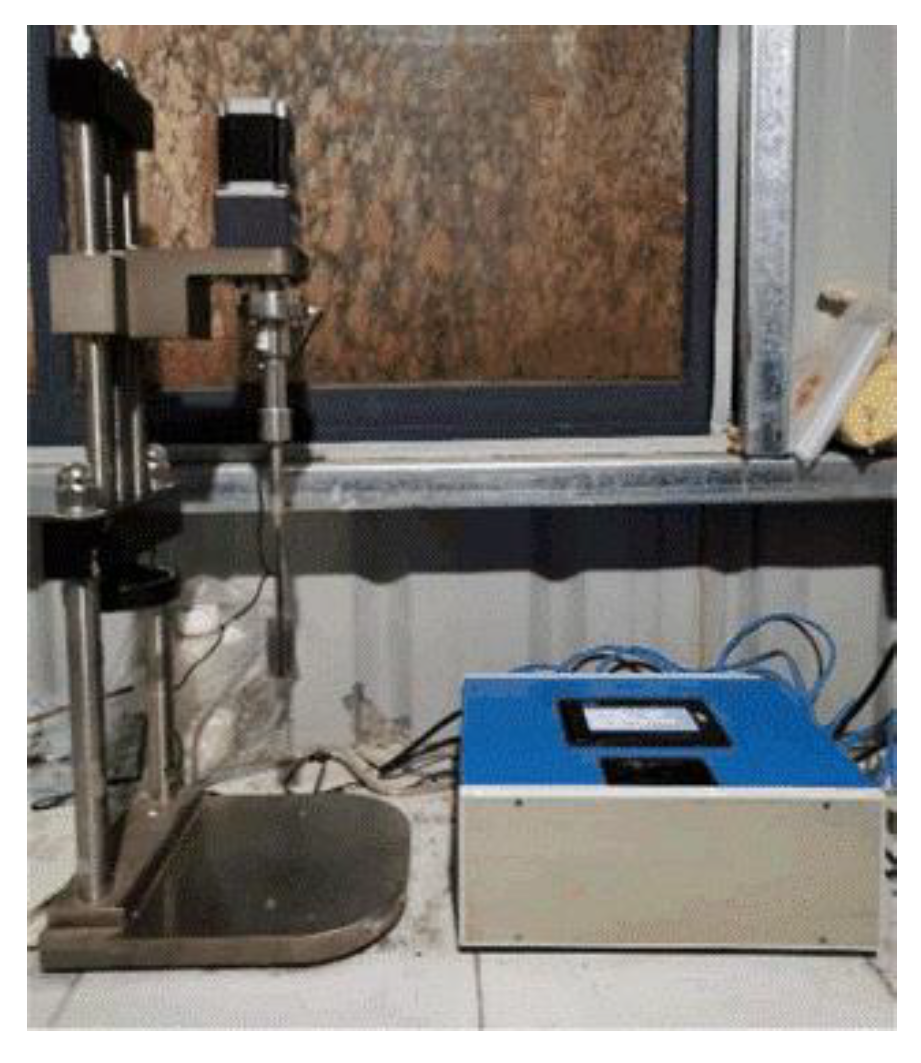
Figure 5.
Linear fitting line of grout flow index of P1.0, P2.0 and P2.5 groups.
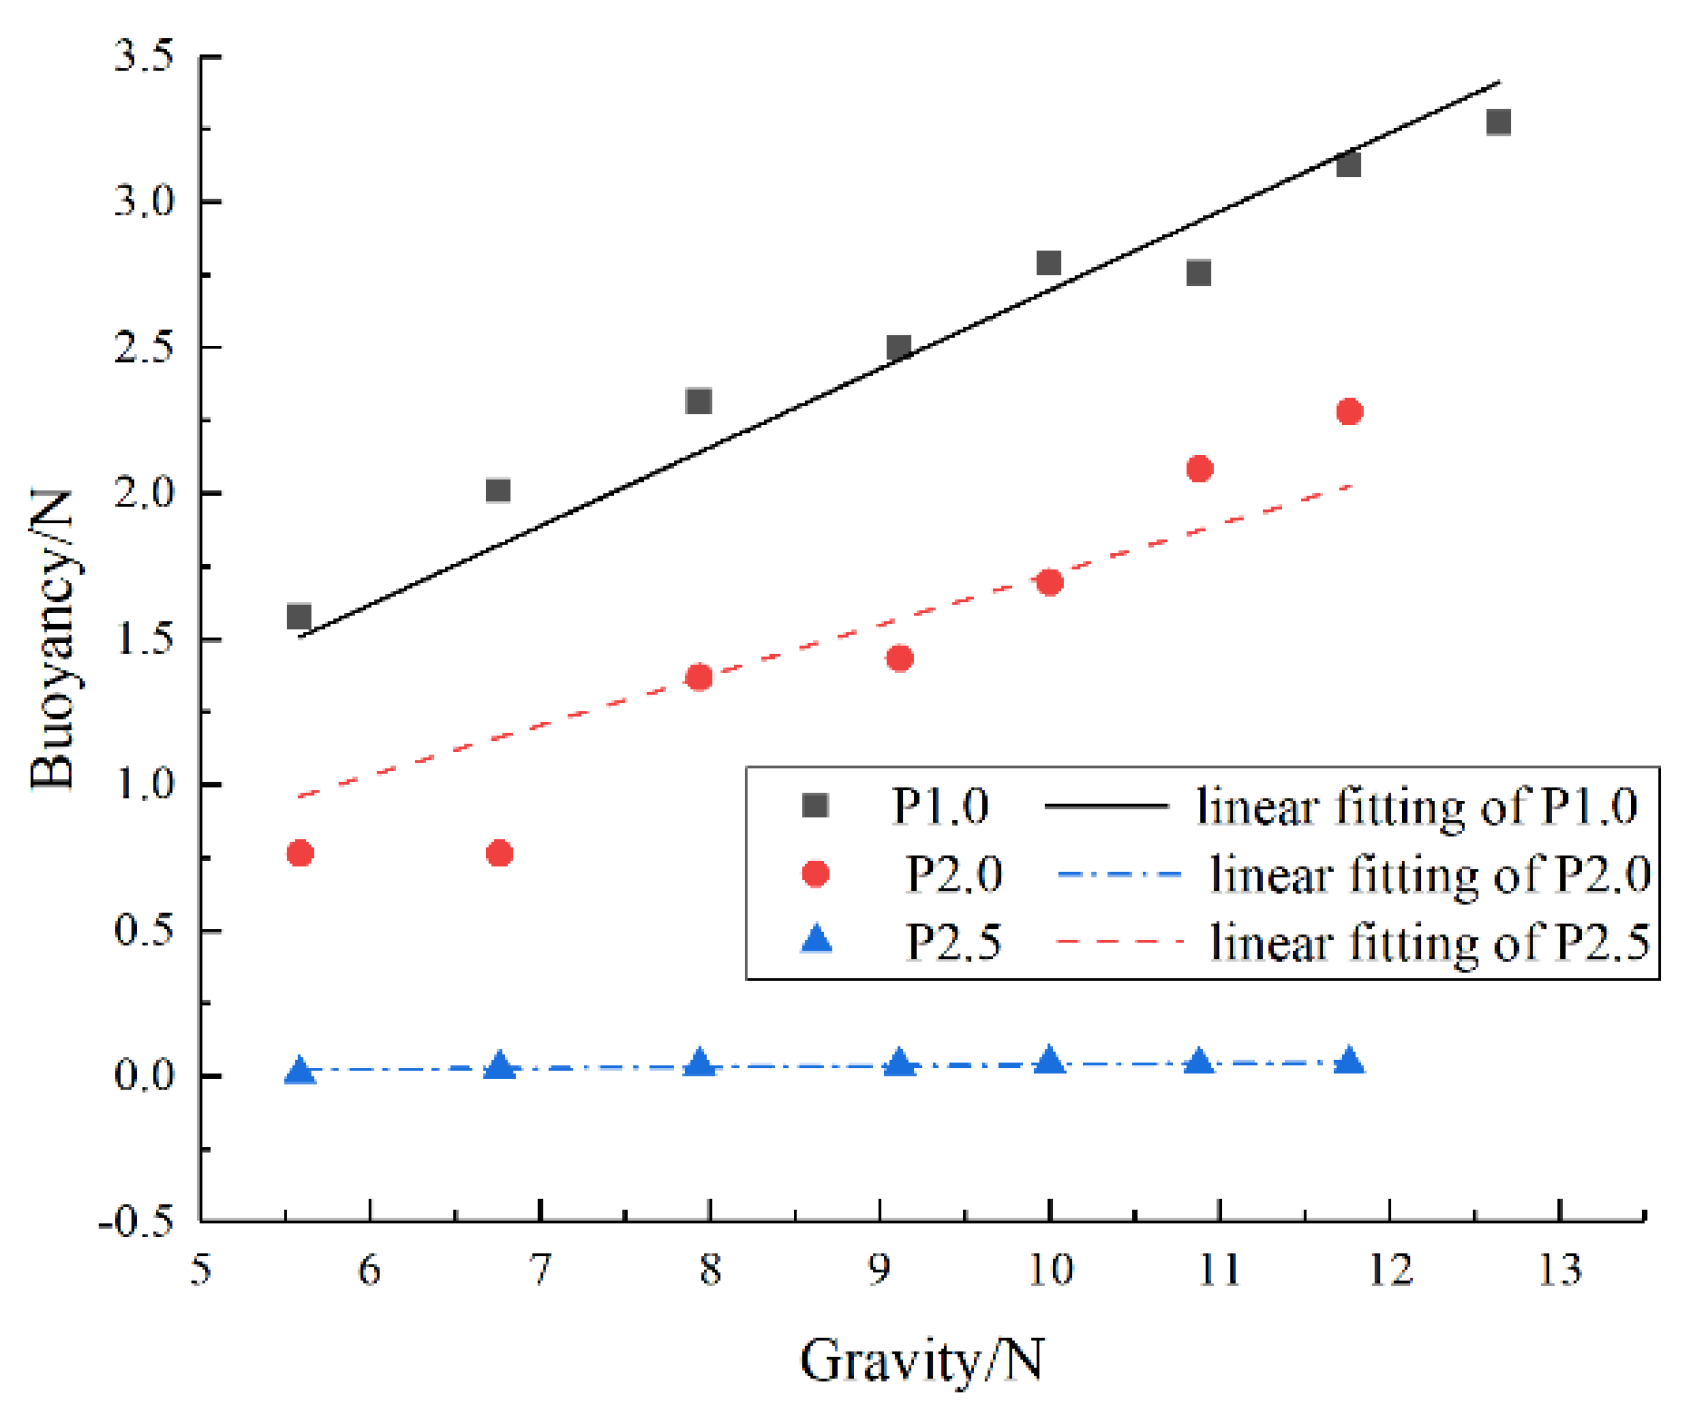
Figure 6.
Influence curve of slurry ratio on slurry density.
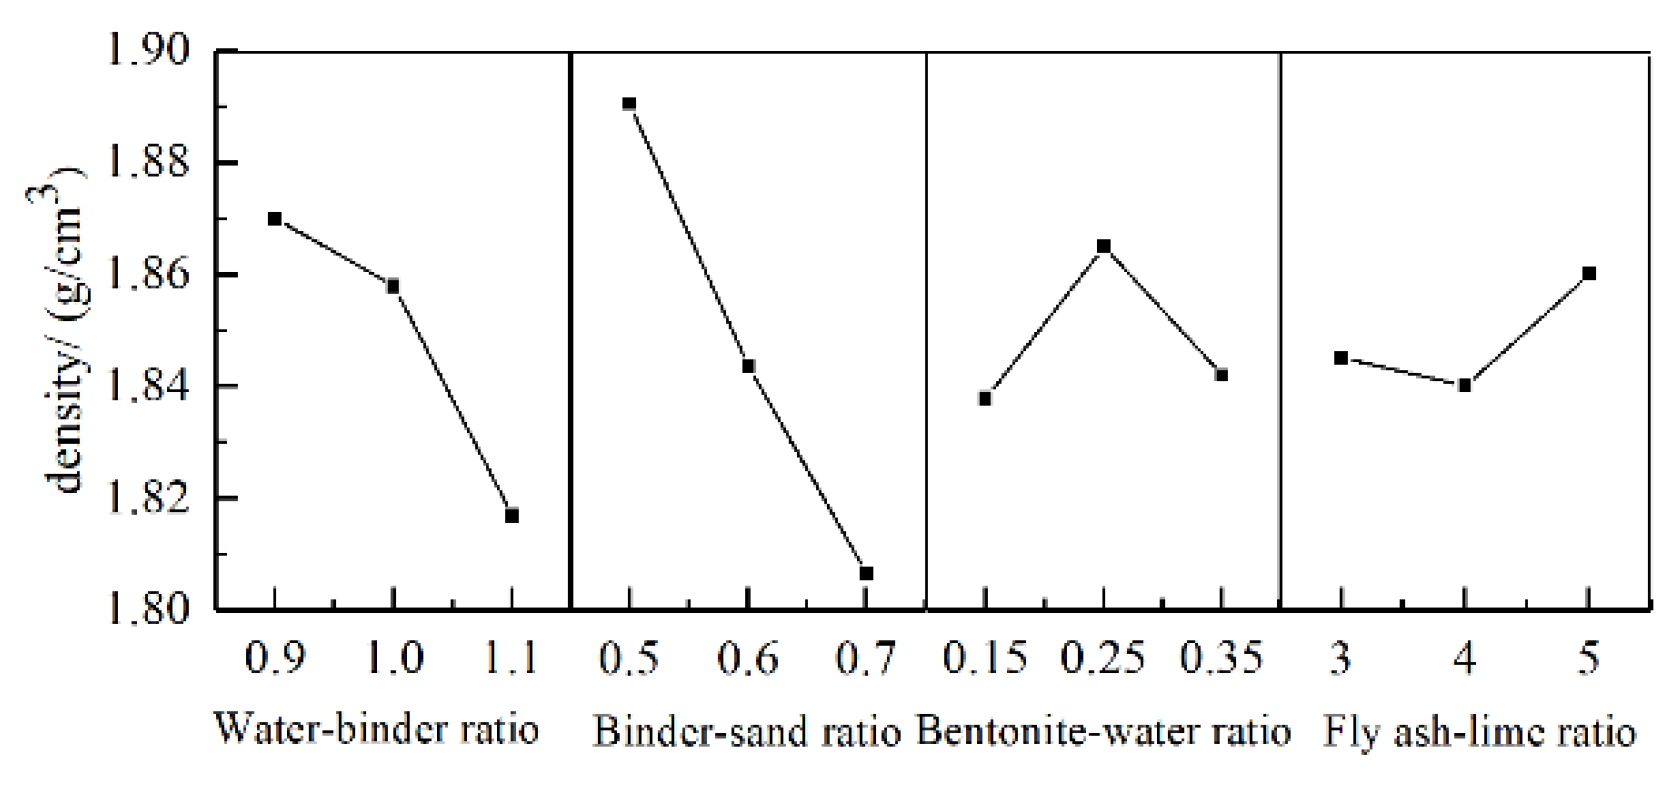
Figure 7.
Influence curve of slurry ratio on slurry flow index.
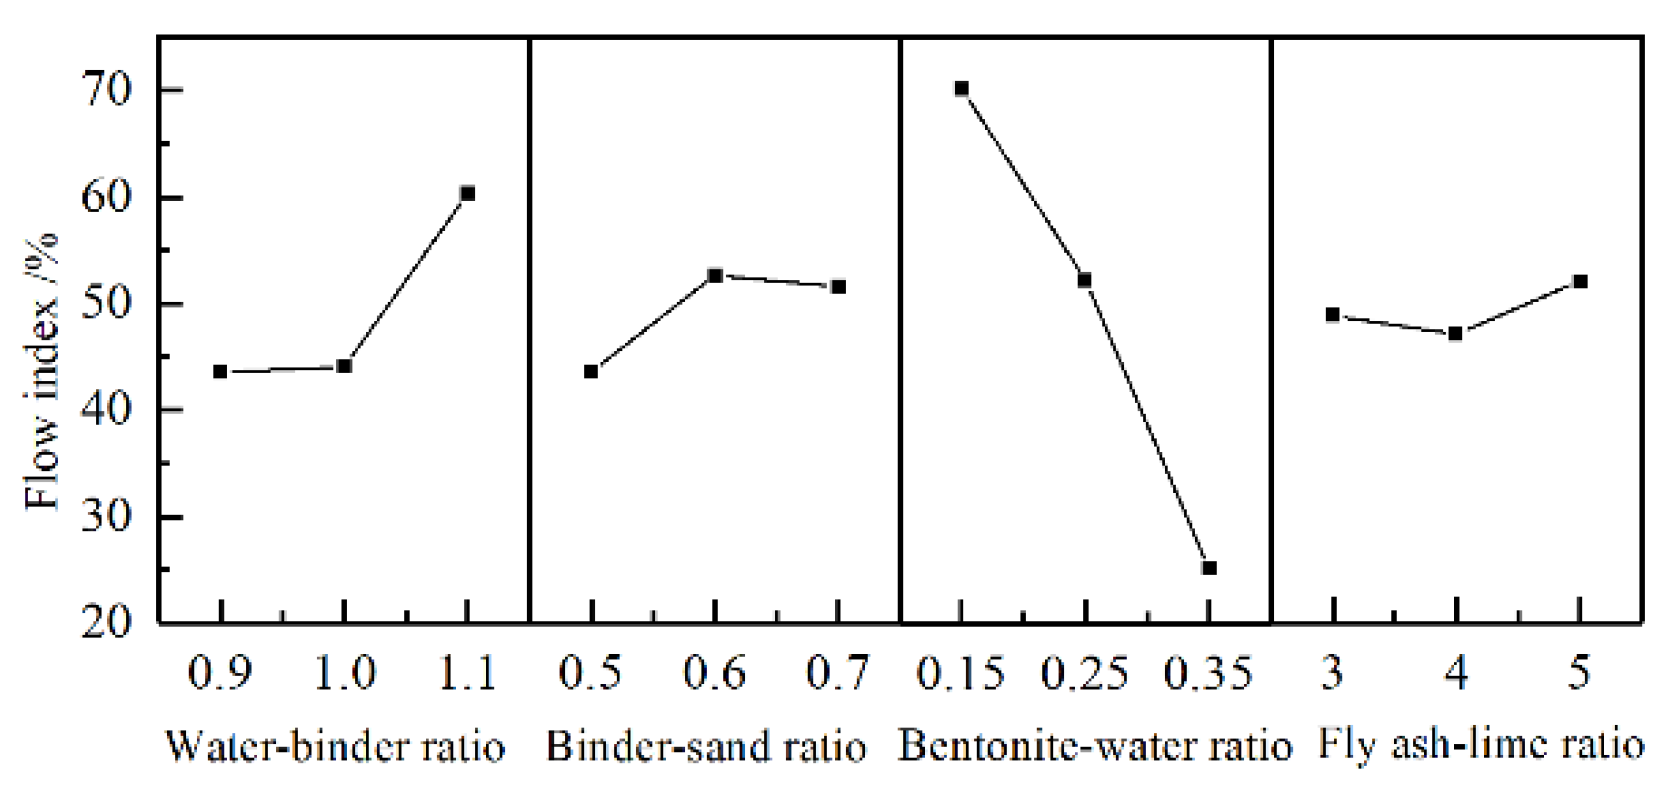
Figure 8.
Influence curve of slurry ratio on shear strength of slurry.
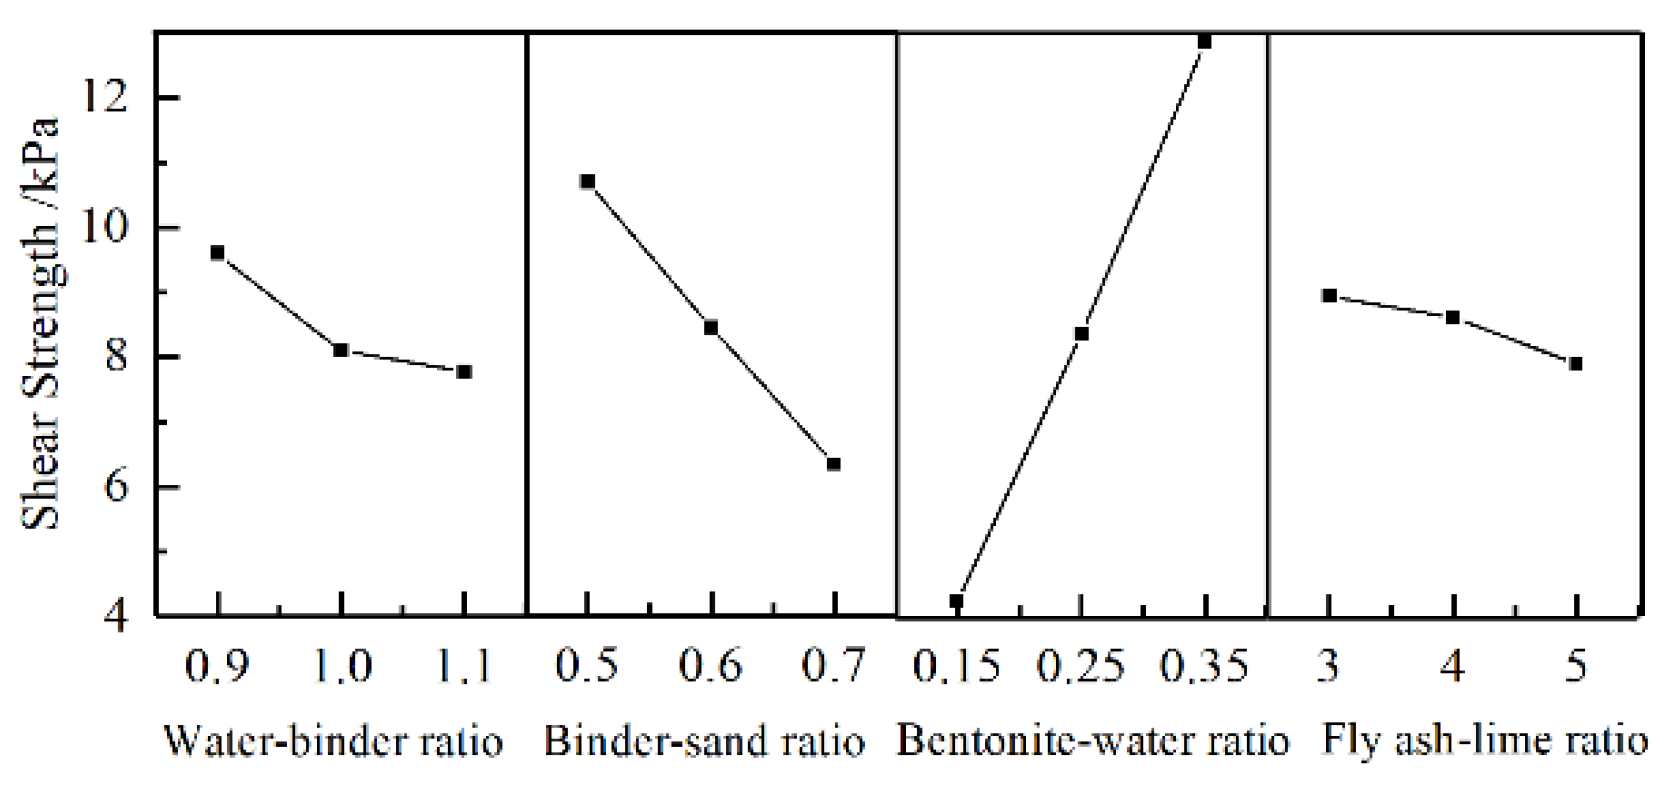
Figure 9.
Relationship between flow index, sand type and bentonite characteristics.
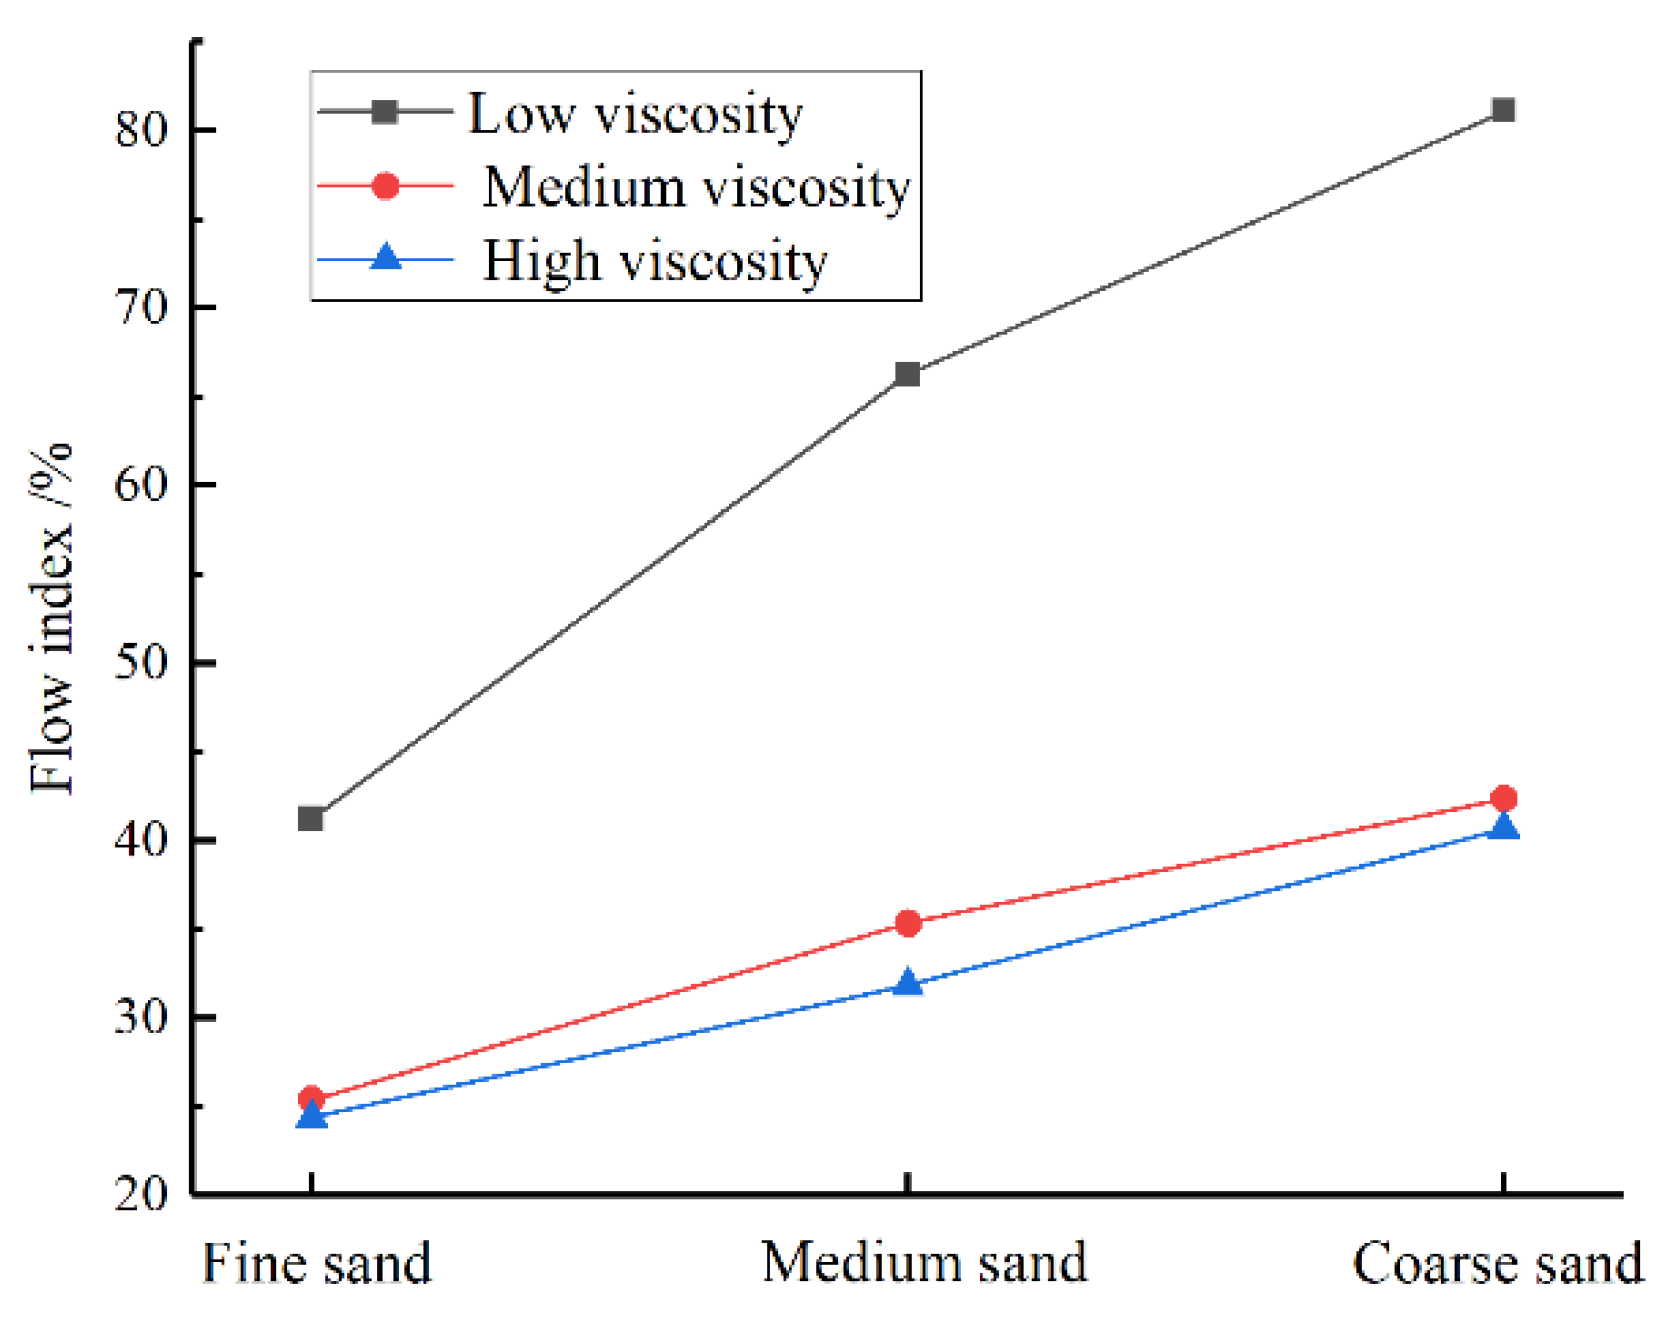
Figure 10.
Relationship between slurry shear strength and sand type, bentonite type.
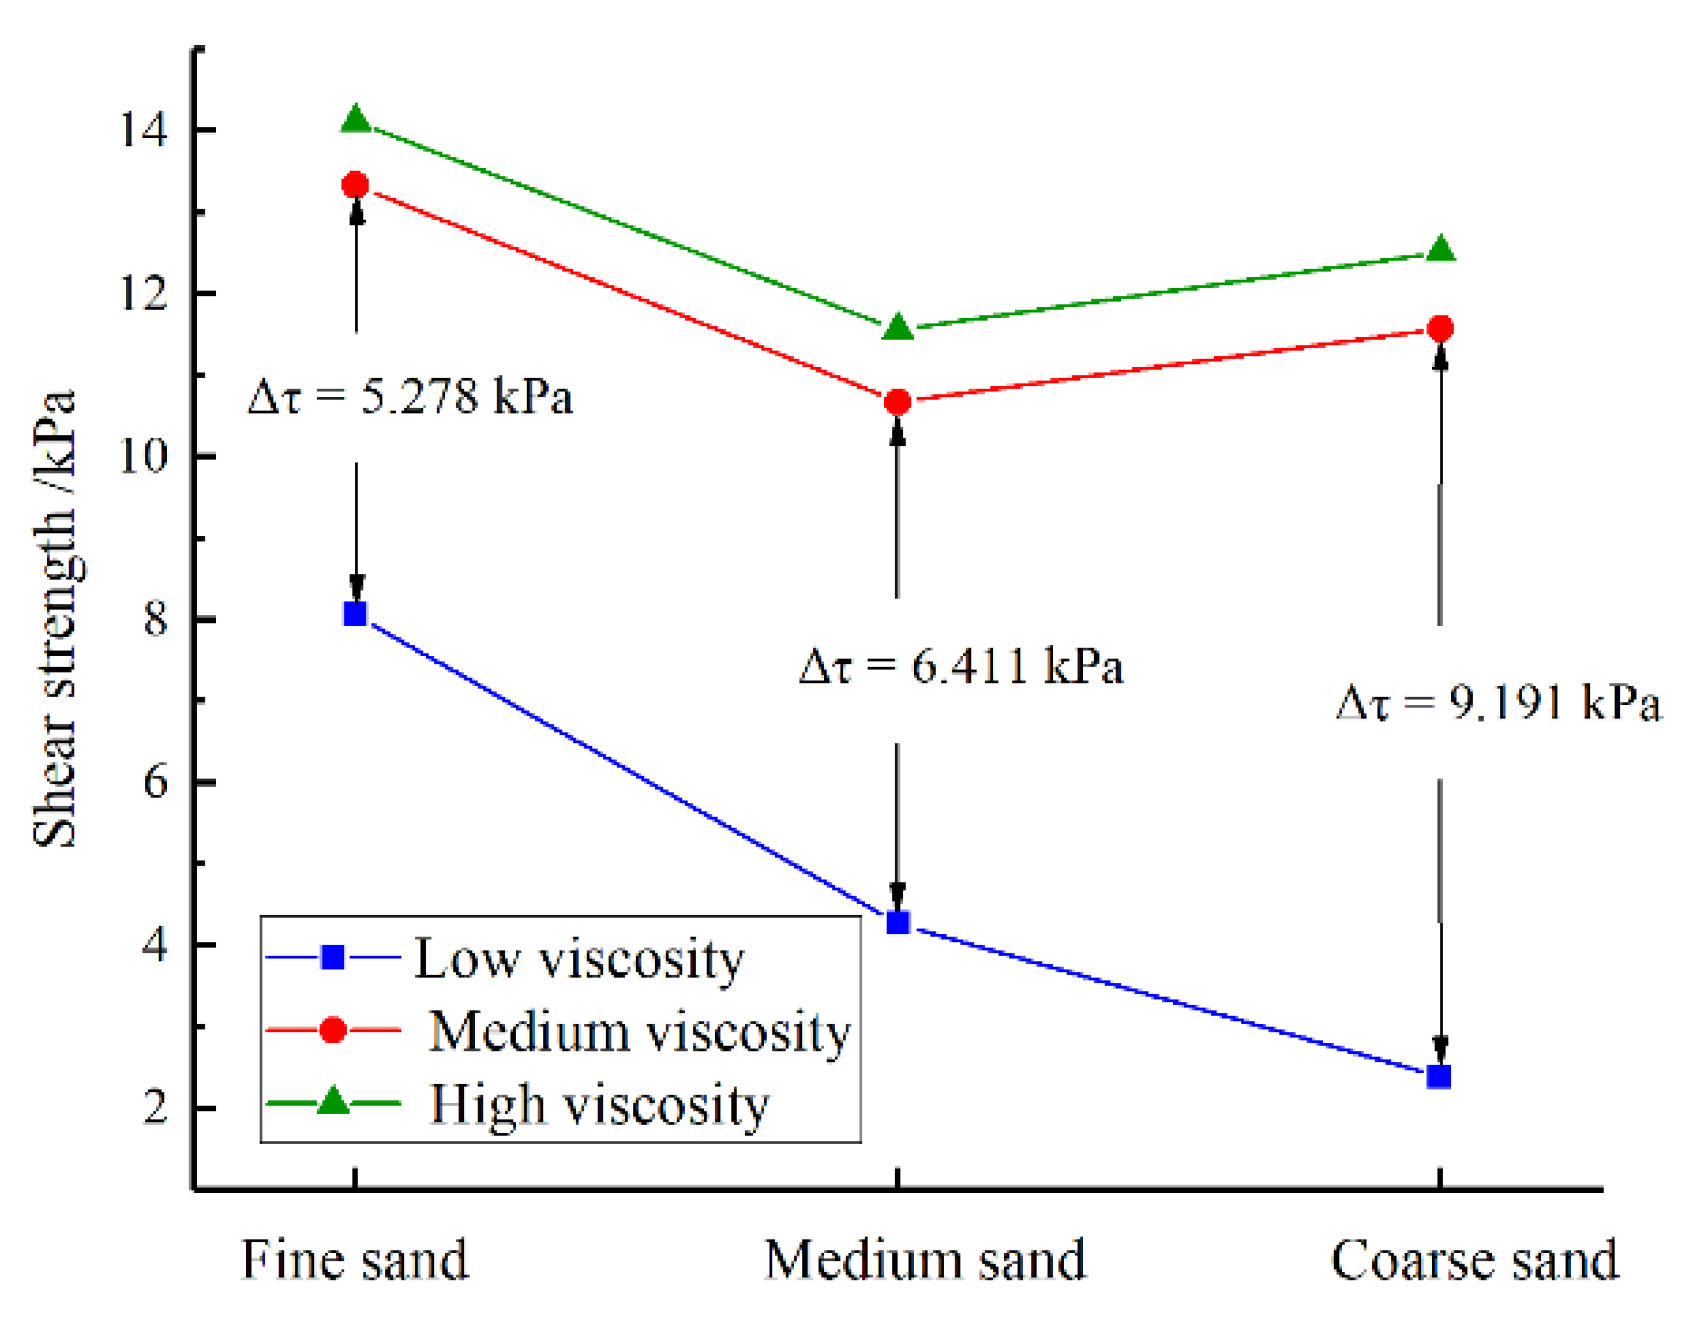
Figure 11.
Appearance of coarse sand and fine sand in slurry mixed with low-viscosity: (a) Grout mixed with low-viscosity bentonite and coarse sand; (b) Grout mixed with low-viscosity bentonite and fine sand.
Figure 11.
Appearance of coarse sand and fine sand in slurry mixed with low-viscosity: (a) Grout mixed with low-viscosity bentonite and coarse sand; (b) Grout mixed with low-viscosity bentonite and fine sand.
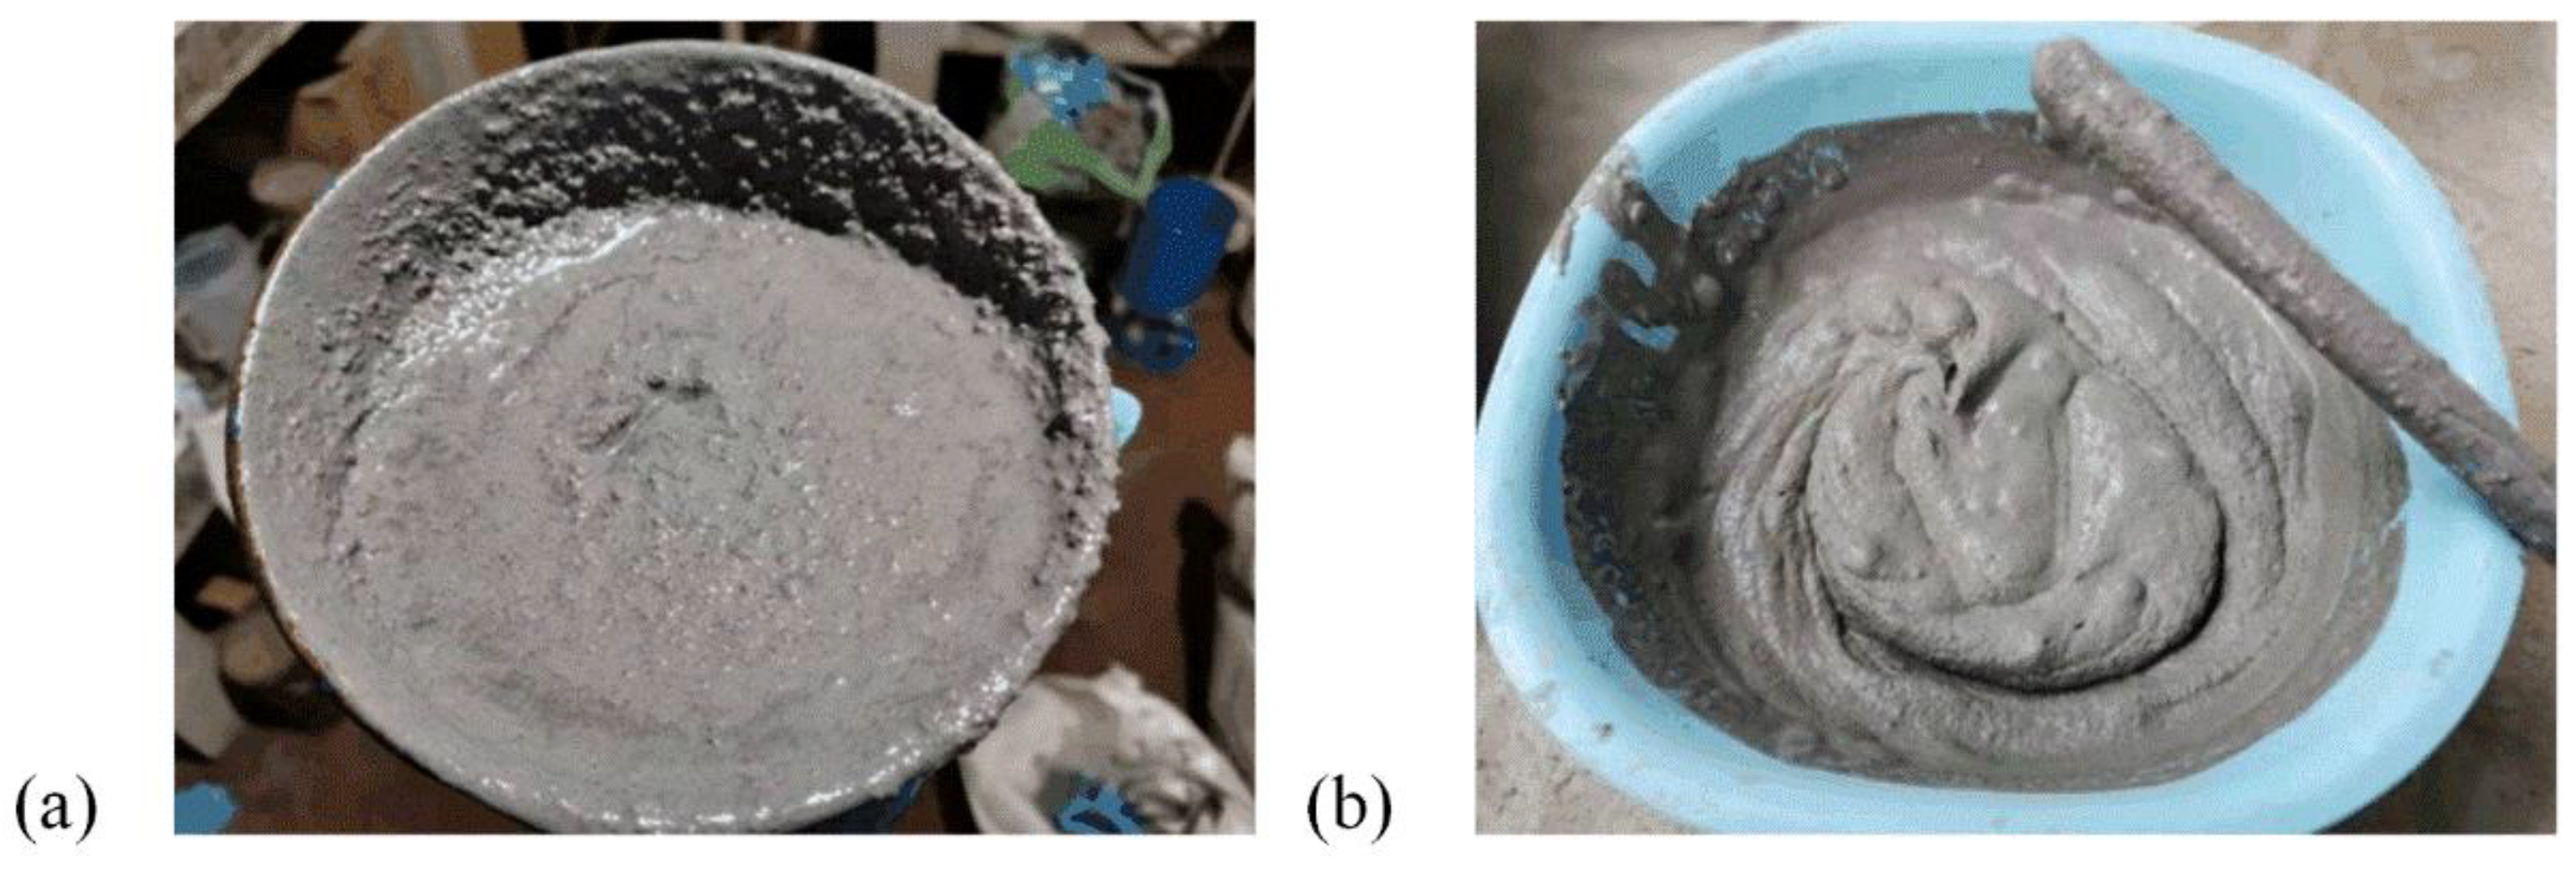
Figure 12.
Relationship between buoyancy supply rate and flow index.
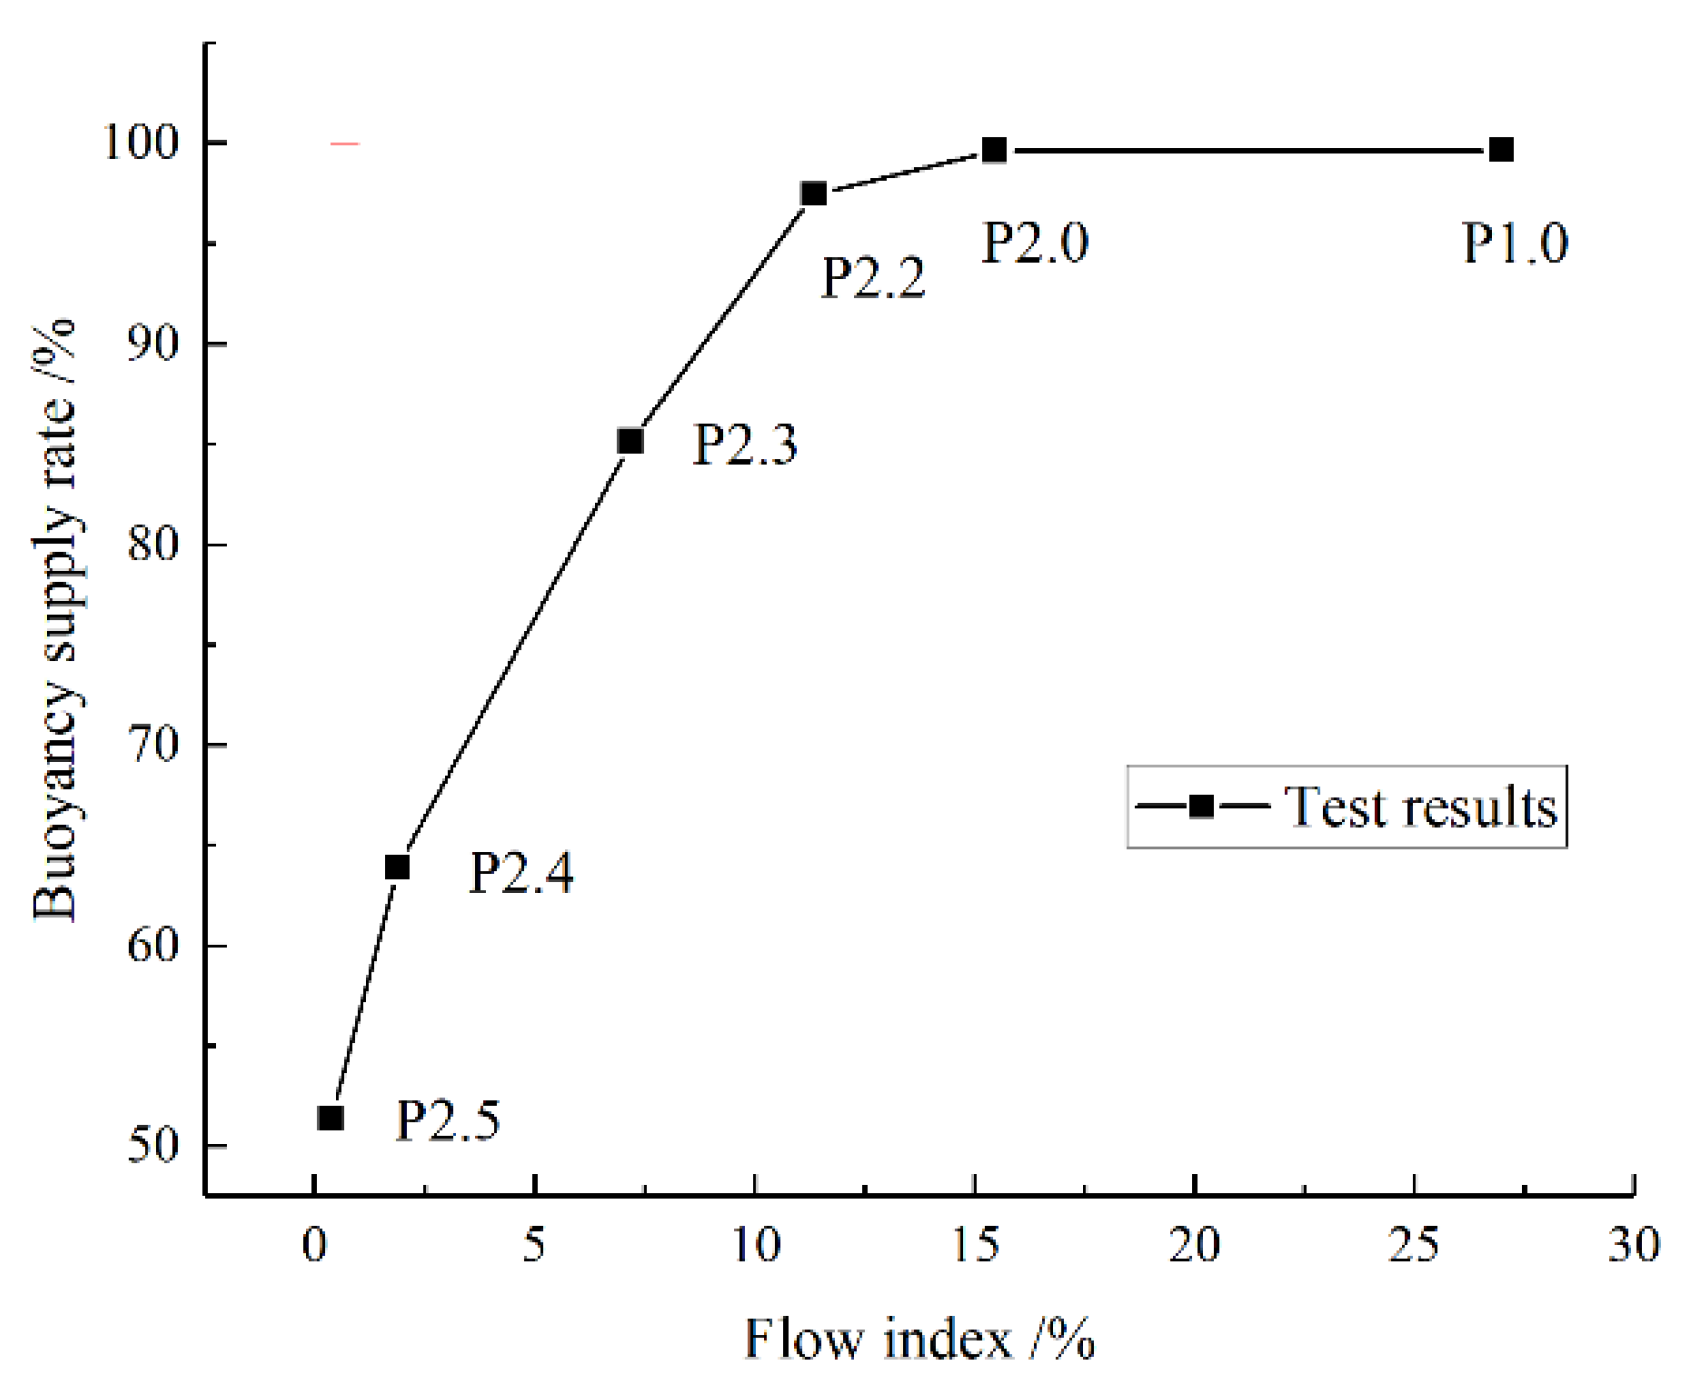
Figure 13.
Relationship between buoyancy supply rate and shear strength.
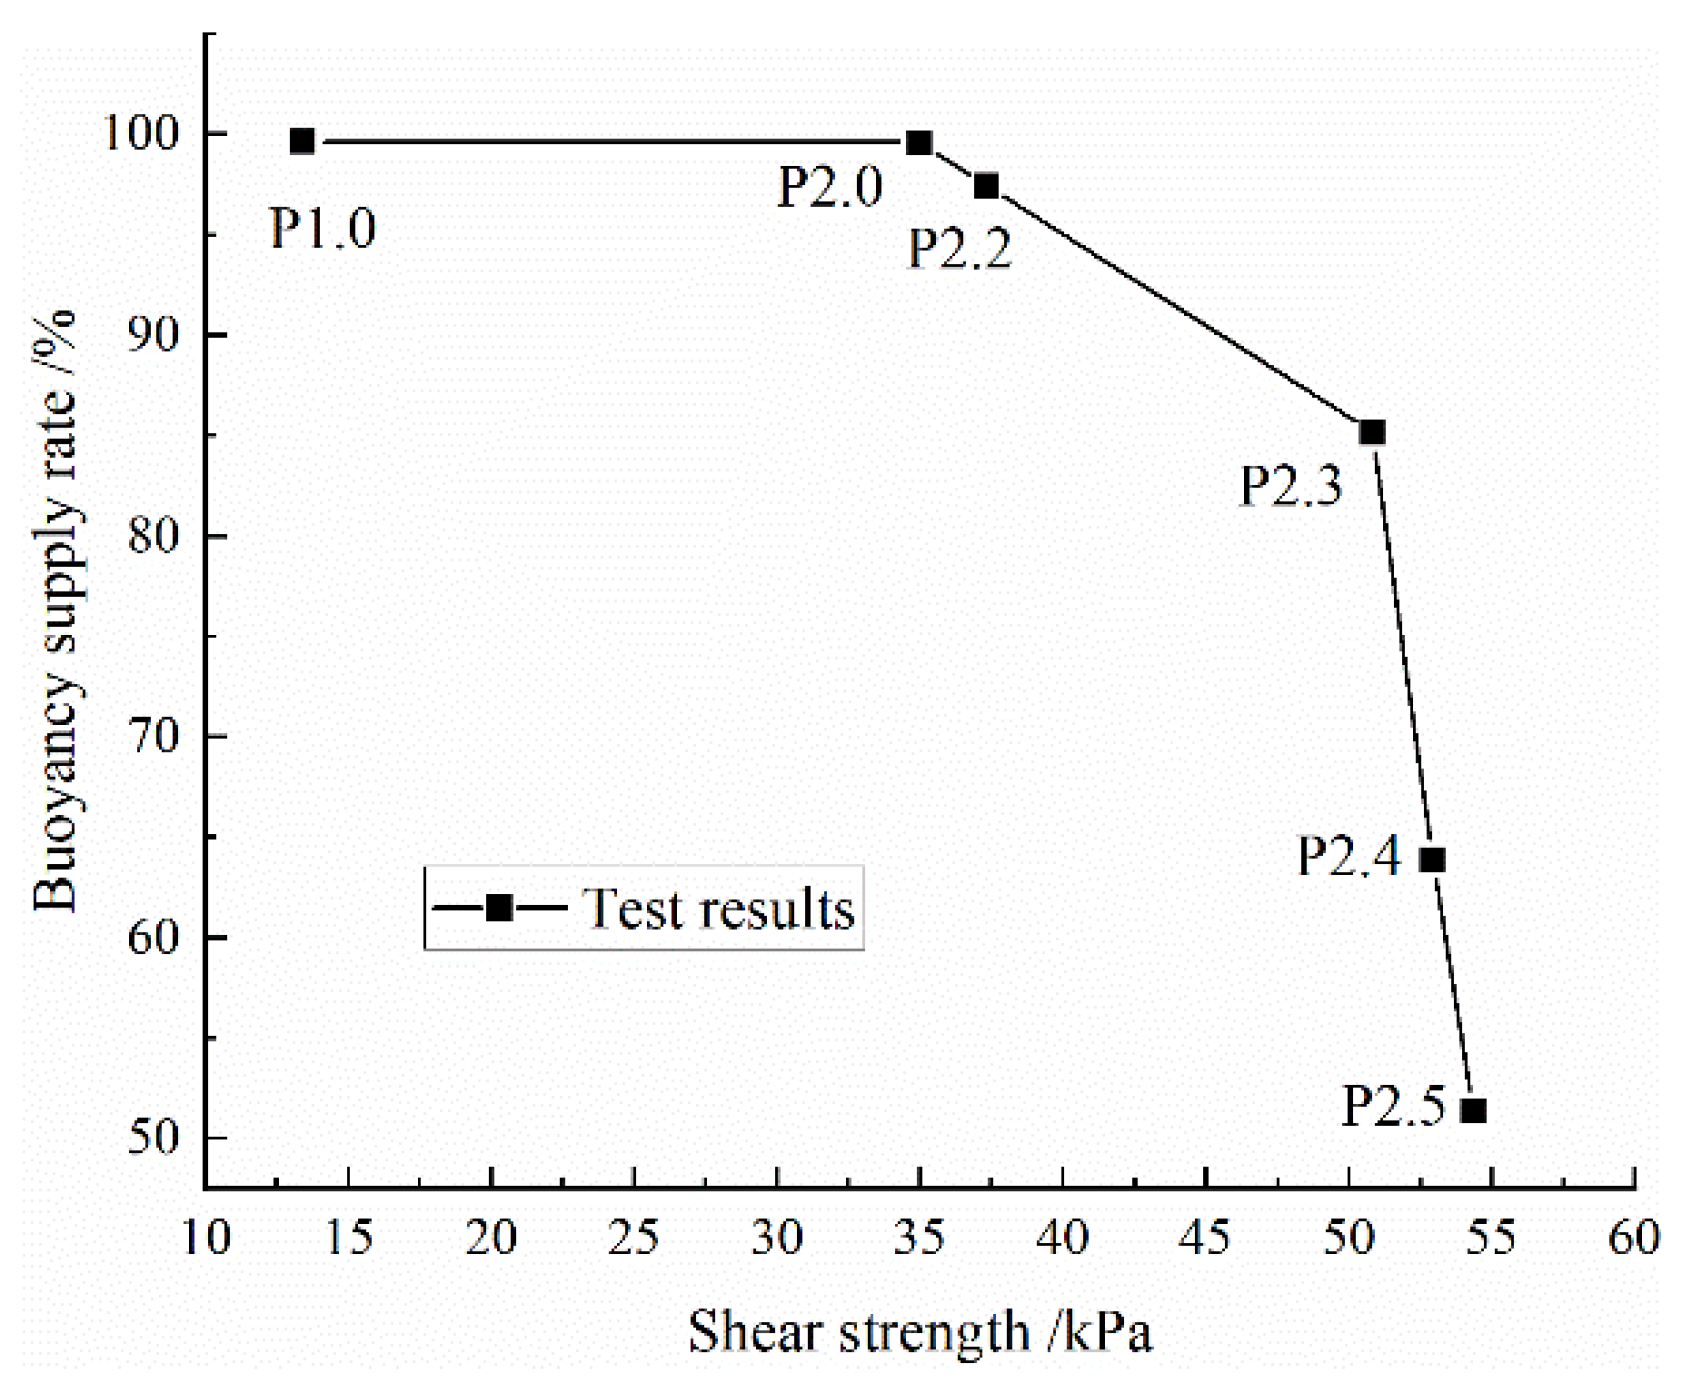

Table 1.
Performance indexes of grout raw materials.
| Component | Performance indexes |
| Fly ash | First-grade fly ash; 0.045 mm square hole sieve allowance ≤ 12%; moisture content ≤ 1% |
| Slaked lime | Calcium hydroxide content ≥ 85%; 320 mesh screen allowance≤ 0.5% |
| Sand | Desalinated sea sand; fineness modulus = 2.1; sieve 4.75 mm before screening |
| Bentonite | Sodium-based; 95% pass-through 400 mesh screens; the main mineral mass composition is montmorillonite 78.5%, quartz 12.3%, and feldspar 5.6% with an initial water content of 10.8% |
| Water | Underground water; pH = 7.0; tasteless |
Table 2.
Engineering slurry ratio.
| Grout material ratio | Sand | Water | Slaked lime | Fly ash | Bentonite |
| P1.0 | 53.50 | 19.11 | 5.10 | 19.11 | 3.18 |
Table 3.
Ratio table of orthogonal design experiment.
| Number | Water–binder ratio | Binder–sand ratio | Bentonite–water ratio | Fly ash–lime ratio |
| 1 | 0.9 | 0.5 | 0.15 | 3.0 |
| 2 | 0.9 | 0.6 | 0.25 | 4.0 |
| 3 | 0.9 | 0.7 | 0.35 | 5.0 |
| 4 | 1.0 | 0.5 | 0.25 | 5.0 |
| 5 | 1.0 | 0.6 | 0.35 | 3.0 |
| 6 | 1.0 | 0.7 | 0.15 | 4.0 |
| 7 | 1.1 | 0.5 | 0.35 | 4.0 |
| 8 | 1.1 | 0.6 | 0.15 | 5.0 |
| 9 | 1.1 | 0.7 | 0.25 | 3.0 |
Table 4.
Comprehensive test grouping.
| Number | Sand | Bentonite |
| 1 | Fine sand | Low viscosity |
| 2 | Fine sand | Medium viscosity |
| 3 | Fine sand | High viscosity |
| 4 | Medium sand | Low viscosity |
| 5 | Medium sand | Medium viscosity |
| 6 | Medium sand | High viscosity |
| 7 | Coarse sand | Low viscosity |
| 8 | Coarse sand | Medium viscosity |
| 9 | Coarse sand | High viscosity |
Disclaimer/Publisher’s Note: The statements, opinions and data contained in all publications are solely those of the individual author(s) and contributor(s) and not of MDPI and/or the editor(s). MDPI and/or the editor(s) disclaim responsibility for any injury to people or property resulting from any ideas, methods, instructions or products referred to in the content. |
© 2025 by the authors. Licensee MDPI, Basel, Switzerland. This article is an open access article distributed under the terms and conditions of the Creative Commons Attribution (CC BY) license (https://creativecommons.org/licenses/by/4.0/).
Copyright: This open access article is published under a Creative Commons CC BY 4.0 license, which permit the free download, distribution, and reuse, provided that the author and preprint are cited in any reuse.


