
Submitted:
14 July 2025
Posted:
15 July 2025
You are already at the latest version
Abstract
The integration of photovoltaic (PV) panels in greenhouses enables dual land use, combining crop production with electricity generation. However, PV installations can reduce both the intensity and uniformity of light at the canopy level, poten-tially affecting crop growth. This study employed computational fluid dynamics (CFD) simulations to evaluate the effects of different arrangements of thin PV modules—both opaque and semi-transparent—installed at gutter height in greenhouses. The influence of greenhouse size and roof shape on the intensity and uniformity of visible radiation was also investigated. Results showed that, during winter (21 December), irradiance in a mono-span tunnel greenhouse was 4–6% higher than in a multi-span structure; in summer (21 June), this difference increased to 10–13%. Among the PV layouts tested, the north-south straight-line arrangement provided the most uniform light distribution, outperforming check-erboard and east-west configurations. The east-west straight-line layout was the least effective. Roof shape (arched vs. pitched) had minimal impact on radiation distribution. Semi-transparent PV modules consistently resulted in higher irradi-ance and more uniform light distribution than opaque ones. These findings can inform optimal PV deployment strategies in greenhouses to enhance both energy yield and crop productivity.
Keywords:
greenhouse
; photovoltaic
; opaque
; semi-transparent
; radiation uniformity
1. Introduction
Solar technologies are often categorized into ‘generations’ based on their level of advancement. Crystalline silicon solar cells fall into the ‘first generation’. Second-generation cells are thin-film technologies that are often commercially available, such as copper indium gallium selenide (CIGS), cadmium telluride (CdTe), gallium arsenide (GaAs), and amorphous silicon (a-Si:H). Third-generation cells are less commercially advanced ‘emerging’ technologies. These include organic photovoltaics (OPVs), copper zinc tin sulphide (CZTS), perovskite solar cells, dye-sensitised solar cells (DSSCs), and quantum dot solar cells.
Many researchers in various regions around the world have investigated the feasibility of dual land usage for greenhouses, combining crop cultivation and electricity generation [1,2,3,4,5,6,7,8,9,10,11,12]. Most studies mainly focused on applying opaque PV materials using different panel arrangements and shading percentages. Straight-line and checkerboard panel arrangements were the most common in these studies. The reduction of light incidence on the canopy due to the shading cast by the PV panels and the non-homogeneous light distribution that may result when opaque PV panels are used was the primary concern, as reported by many authors (e.g., [13,14,15,16,17]). It appears that the checkerboard arrangement of panels on the roof was more frequently applied than the straight-line arrangement due to the more uniform solar radiation distribution it resulted in ([18,19,20]).
It was suggested that PV modules made of semi-transparent materials be used to increase the irradiance at the canopy level and improve its distribution within the greenhouse. Two studies [21,22] indicated that OPVs, perovskite solar cells, and DSSCs are among the third-generation technologies that are developing as potential sustainable renewable energy sources, especially for agrivoltaic applications, due to their semi-transparent and tunable spectral properties. In particular, Meitzner et al. [23] emphasized the need for large-scale applications of semi-transparent materials that parts of the solar spectrum that plants do not utilize to generate electricity.
Most third-generation technologies have considerably lower efficiencies than c-Si or second-generation PV technologies. However, the main advantages of these materials are their tunability and abundance of components. Furthermore, OPVs can be manufactured more easily and have higher defect tolerance than many inorganic materials [24]. They also have a low environmental impact throughout their life cycle and a short energy payback time (the time it takes for the solar cell to generate as much energy as was consumed during its production).
It is reasonable to assume that the percentage of roof area covered by panels, the panel arrangement on the roof, and their transparency are the main parameters affecting irradiance at the canopy level and its distribution. However, experiments in different types of greenhouses in which each of the parameters, as mentioned earlier, is changed to determine the most homogeneous irradiance with the highest intensity level may be very time-consuming and expensive. An alternative may be the development/use of models to predict irradiance and its distribution within a greenhouse. Such studies were done by a few research groups and are reported in the following.
Fatnassi et al. [19] simulated the solar radiation distribution, air temperature, and water vapor content using a Computational Fluid Dynamic (CFD) model in two different prototypes of greenhouses equipped with photovoltaic panels on their roof. They tested two arrangements of opaque photovoltaic panels, a straight-line and a checkerboard pattern, and provided a detailed description of the radiation distribution inside the greenhouses. They concluded that the checkerboard photovoltaic panel setup improved the spatial distribution of radiation in the greenhouse.
Castellano et al [25] used commercial lighting simulation software and available meteorological data to estimate the photosynthetic photon flux density (PPFD) distribution inside a greenhouse with opaque PV panels. The simulation results were compared with those obtained inside an experimental greenhouse. The daily average percent differences were lower than 19.0%, and the authors assumed that such differences were acceptable for agronomic purposes. On the other hand, an hourly analysis showed only qualitative agreement between simulation and experimental results. The authors concluded that on a monthly basis, the numerical model demonstrated a capability to predict the shading effect inside the photovoltaic greenhouse.
Cossu et al. [15] assessed the radiation distribution within Europe’s main commercial PV greenhouses using an algorithm specifically developed for PV greenhouse applications. Shading due to PV installations in three greenhouses, each with a different roof shape (greenhouse dimensions 9.6 50 m2), was analysed. The authors reported a 0.8% and 0.6% decrease in radiation in the greenhouse, with each additional 1% cover ratio for the east-west (EW) and north-south (NS) panel orientations, respectively. The NS orientation of the panels increased the average yearly radiation by 24% compared to the EW orientation, and both the NS and checkerboard orientations provided better light distribution than the EW one.
Chen et al. [26] presented a numerical method to predict the radiation distribution and the electricity yield of a photovoltaic greenhouse throughout the year using a 3D radiation model. The radiation model considered opaque PV panels and was validated using experimental data from a greenhouse with 36 rooftop panels arranged in a straight-line layout, covering 25% of the greenhouse’s roof area. The model’s performance was evaluated in terms of the non-uniformity of the radiation distribution, radiation intensity, and electricity yield of PV panels. The panels did not significantly affect the distribution and intensity of cumulative weekly radiation compared to a conventional greenhouse. The authors indicated that their results showed that the 3D radiation model can be used as an efficient tool to optimize the performance of a photovoltaic greenhouse. Recently, a new model was presented to simulate the distribution and uniformity of radiation inside photovoltaic greenhouses with panels installed on their rooftops [27]. According to the authors, the versatile model can analyze any PV panel layout and surface covering percentage. It can provide the average radiation reduction as a function of the fraction of the roof covered by PV panels and the uniformity of the radiation distribution. A greenhouse with opaque PV panels was considered. From the results, the authors concluded that the shading percentage and layout of the PV panels considerably affect the uniformity of the radiation distribution. The authors indicated that non-opaque PV modules may provide a more uniform distribution of radiation.
Ghaffarpour et al. [12] integrated energy, crop growth, and PV models to calculate the required cooling, heating, tomato production, and electricity generation in a PV-integrated greenhouse. One of their results was the light distribution in different panel arrangements. They concluded that the asymmetric checkerboard layout was the most suitable for their uneven mono-span greenhouse.
CFD was used [28] to study the effect of semi-transparent OPV modules structured in lines on the greenhouse roof on the available PAR inside the greenhouse. Three combinations of OPV/cover with PAR transmittance of 30%, 45%, and 60% were examined. The reductions observed in the mean daily PAR integral at the plant level for the 30%, 45%, and 60% cases were 77%, 66%, and 52%, respectively. Nevertheless, a comparison between the straight-line and checkerboard arrangement of the panels was not done in that study.
From the literature review, we learned that semi-transparent PV materials may be a better option for obtaining a more homogeneous irradiance distribution than opaque panels. Furthermore, the literature suggests that a checkerboard panel arrangement is superior to a straight-line arrangement concerning irradiance distribution within the greenhouse. However, the number of studies investigating whether a checkerboard panel arrangement is superior to a straight-line arrangement when semi-transparent panel materials are used is very limited. The present study presents simulation results using CFD software to answer this question.
2. Materials and Methods
CFD simulations using ANSYS, Fluent [29], were done to determine the effect of OPV module arrangement inside a mono-span greenhouse on the mean absorbed visible radiation (MAVR) and its ground-level distribution. The MAVR represents the mean value over a given period of the day at each point on the ground. An average of all values in a region of interest on the ground is then calculated. The CFD model was first validated through experiments in a mono-span greenhouse without OPV modules, where tomato plants were grown. The greenhouse was located in Kfar-Quari, Israel. It was oriented NS, and its floor area was 131 m2 (17.5 m × 7.5 m ). Its roof was covered by a diffuse polyethylene sheet (0.12mm thickness, a light transmittance of 89% in the PAR range, 55% haze, C460-120-IR, Ginegar, Israel). The side walls were covered by a semi-transparent 50-mesh insect-proof net (porosity of 0.35, thread diameters of 0.26 ± 0.013 and 0.26 ± 0.008 mm, and mesh sizes of 0.80 ± 0.018 and 0.22 ± 0.021 mm in the warp and weft directions, respectively). The same polyethylene sheet as on the roof covered a small portion of the insect-proof screen on the sidewalls, from gutter height to about 0.5 m below it. The gutter and ridge heights were 2.7 and 4.35 m, respectively. Two pyranometers (LI—200R Li COR Inc., Lincoln, NE, USA) were placed at gutter height in the central greenhouse region above the canopy to measure irradiance.
The validation stage, is based on a comparison with measurements that were done on 18.4.2023, 11.5.2023, and 23.5.2023. On 18.4.2023 and 11.5.2023, data measured by the two pyranometers at the greenhouse center between 10:00 and 14:00 was used for validation. On 23.5.2023, data measured between 10:50 and 11:30 local time was used. In addition to the pyranometers, radiation was measured by a spectroradiometer (LI-1800, LI-COR Biosciences, Nebraska, USA) placed at a height of 2.8 m. Measurements were taken at two points, about 2m, from the northern and southern sidewalls of the greenhouse. In each measurement point (northern and southern), two sessions of about 2 min each were done, and radiation as a function of wavelength was recorded in the range of 300–1100 nm. The two pyranometers at the center of the greenhouse collected data continuously every 15 s, and average values were recorded every 10 min on a CR1000 (Campbell Scientific, Logan, UT, USA) data logger.
A meteorological station was placed near the greenhouse to measure the ambient irradiance. Two pyranometers (LI—200R Li COR Inc., Lincoln, NE, USA, and CMP3, Kipp & Zonen, Delft, The Netherlands) measured global solar radiation. A shaded pyranometer (CMP3, Kipp & Zonen, Delft, The Netherlands) measured diffuse radiation.
2.1. Numerical Simulations
In the first stage, the model was validated by comparing the simulation results of a greenhouse without any OPV modules to the experimental results from the mono-span greenhouse. The dimensions of the greenhouse in the simulations were identical to those of the experimental greenhouse. Irradiance at the same location as in the experiments (gutter height at the greenhouse center) was calculated. A solar load calculator [28] was used to apply the direction and intensity of the ambient solar radiation on18.4.2023 and 11.5.2023 between 10:00 and 14:00. On 23.5.2023 the solar load calculator was applied between 10:50 and 11:30. Fair weather conditions and a common spectral fraction of 0.5 between visible and visible + infra-red (IR) ranges were assumed in the calculations. The visible and IR optical properties of the cover material and the OPV modules are given in Table 1. Based on the results of Franco et al. [30] we assumed, at the validation stage, that the visible and IR properties of the greenhouse cover materials are the same.
After the model was validated, simulations were done to determine the effect of a few OPV module arrangements on the MAVR and its distribution. The simulated module arrangements were considered: (i) checkerboard with north-south strips (NSC), and checkerboard with east-west strips (EWC) as shown in Figure 1; (ii) North-south straight-line (NSL), and east-west straight-line (EWL), as shown in Figure 2, (iii) Simulations of a north-south straight-line OPV arrangement in a greenhouse with a pitched roof (NSLP) to investigate the effect of roof type on irradiance and its distribution. Transient simulations of two specific dates, 21 December and 21 June, were considered, and the MAVR at afny particular point on the ground was calculated. On 21 December and 21 June, the simulations considered MAVR between 8:00–17:00 and 08:00–19:00 because of the difference in the day length. Since the NSL and NSC cases showed the best results in the mono-span greenhouse, simulations were also done for the NSL and NSC arrangements in a much larger greenhouse (six spans each 7.5 m width and 50 m length, 45 × 50 m2 greenhouse dimensions) to investigate the effect of greenhouse size on the results. In each module arrangement and both the mono and multi-span greenhouses, the OPV cover ratio (ratio between total OPV area and the ground area) was 0.3.
2.2. Uniformity of the MAVR Distribution
The uniformity of the MAVR distribution inside the greenhouse is very important because it affects crop production and quality in different parts of the greenhouse, and also the efficiency and comfort of the workers. Higher differences in received radiation inside the greenhouse can be even more detrimental than the intensity of radiation itself [27]. Two uniformity indices are proposed to measure the variability of MAVR inside the greenhouse in this study. The first, [27]:
Where is the average of the lowest quarter of the data (values of the pixels) and is the average of all the data.
The second, [31]:
Where and represent the maximum and minimum pixel values within the region of interest.
3. Results and Discussion
3.1. Validation Stage
To validate the CFD model, a comparative analysis was conducted using experimental irradiance data from a greenhouse without OPV modules. The validation utilized experimental measurements collected over three specific days: 18.4.2023, and 11.5. 2023, from 10:00 to 14:00, as well as 23.5.2023, between 10:50 and 11:30. On April 18 and May 11 the experimental data revealed irradiance levels of 660 ± 10.2 and 650 ± 12.2 Wm-² respectively, compared to simulation values of 611Wm-² and 650 Wm-² (the ± sign represents the confidence interval).
On 23.5.2023 the irradiance outside the experimental greenhouse was 937 ± 9 W m-. The average values measured at gutter height by two pyranometers inside the greenhouse and by the spectroradiometer were 692 ± 9 W m-2 and 706 ± 5 W m-2, respectively. The difference between the two measurement methods is very small, considering the sensors’ accuracy and the fact that measurements were done at slightly different locations along the centerline in the greenhouse. Thus, the transmissivity of the greenhouse cladding, about 0.75, is in good agreement with the value in Table 1 and the greenhouse average transmissivity values [15] reported for four types of large-scale typical commercial greenhouses.
The simulation results gave a higher value of irradiance (1048 W m-2) outside the greenhouse on 23.5.2023. The ratio between the experimental and simulation results of irradiance outside the greenhouse (937/1048) was used to normalize the radiation value obtained at gutter height in the simulation. The normalized value of irradiance at gutter height, obtained in the simulation, was 725 W m-2, similar to the experimental values. This validation highlights the good agreement between the CFD model and the observed experimental results.
3.2. Simulations of a Tunnel Greenhouse with OPV Modules–the 21 June Case
In the first stage, simulations of irradiance in a greenhouse identical to the one used for validation were done; however, they were done with thin OPV modules at gutter height. Figure 3 shows the MAVR at ground level for NSC and EWC cases. It is observed that the minimum and maximum MAVR values in the NSC were similar to those in the EWC, with slightly higher values in the EWC. Yet, the figure shows a different MAVR distribution pattern in the two cases. Visually it appears that the NSC case resulted in a more homogeneous distribution than the EWC. Figure 4 shows the mean and RMS of visible radiation values in all cases considered. To exclude sidewall effects, the values in the table were calculated using an area of 4×4 m2 in the center of the greenhouse. The mean and RMS values in the NSC and EWC on 21 June were 218.9 and 125.3 and 228.1 and 127.4 W m-2, respectively. Despite the apparent less homogenous distribution in the EWC, the RMS values are very similar.
Figure 5 shows the MAVR distribution in the NSL and EWL cases. The figure shows that the NSL case resulted in a more homogeneous distribution than the EWL. In the NSL, the difference between minimum and maximum MAVR values is 23 W m-2, while in the EWL, the difference is 100 W m-2. The EWL resulted in a distribution of homogeneous MAVR strips in the EW direction. The sharp variations in MAVR are in the NS direction, in which a low MAVR strip follows a high MAVR strip, and so on.
3.3. Simulations of a Mono-Span Greenhouse with OPV Modules–the 21 December Case
Figure 6 shows the MAVR distributions with NSC and EWC OPV configurations. The distributions in December are similar to those in June, except that at the southern end of the greenhouse, the OPV modules do not affect the MAVR distributions since the sun’s zenith angle is much larger than in June. Hence, radiation enters the greenhouse through the southern wall, so the MAVR there is higher and homogeneous. Figure 4 shows that the mean and RMS values in the NSC and EWC on 21 December were 112.2 and 85.4 and 115.0 and 86.8 Wm-2, respectively. In our analysis, the southern part of the greenhouse is excluded because it shows the MAVR at the ground due to solar radiation penetrating through the southern sidewall (Red area). The differences in the mean and RMS values between the two module orientations are small. Similar to observations in June, visually, it appears that the NSC case resulted in a more homogeneous distribution than the EWC. Despite the apparent less homogenous distribution in the EWC than the NSC, the RMS values are very similar.
Figure 7 shows the MAVR distributions with NSL and EWL on 21 December. The figure clearly shows that the MAVR is much more homogeneous with the NSL configuration than with the EWL. With EWL, the changes in the MAVR in the EW direction were much smaller than in the NS direction compared to observations with NSL. The sharp variations in MAVR (EWL) in winter are similar to those observed in the summer (Figure 4, EWL)
Figure 4 shows that the mean and RMS of the MAVR values in winter are much lower than in summer, as expected since the ambient radiation incident in the greenhouse is much lower. The distribution of radiation with a pitched roof (NSLP) is shown in Figure 8. Visually, it appears that in June, the MAVR distribution was less homogenous than in December. It is noticed that the mean and RMS values with a pitched roof (NSLP) were similar (see Figure 4) to those with an arched roof (NSL). Figure 4 shows no large differences in the mean and RMS values among the investigated OPV configurations.
Cossu et al. [15] also reported no significant differences between the checkerboard and straight-line patterns in the cumulated global radiation in summer and even slightly better performance of the straight-line pattern in winter for a mono-span greenhouse with a gable roof. They considered a cover ratio of 25%, where only the top half of the south-oriented roof was covered by panels.
3.4. Simulations of a Multi-Span Greenhouse with Opaque and Semi-Transparent Modules: NSC Configuration
Two configurations that resulted in the best homogenous distribution (NSC and NSL) were chosen to explore their effect in a six-span large greenhouse. To exclude sidewall effects, an area of 15×15 m2 in the center of the greenhouse was used to analyze the MAVR. Figure 9 and Figure 10 show the MAVR at the ground obtained with NSC on 21 June and 21 December, respectively. The figures show results obtained with opaque and semi-transparent modules. The radiation distribution at ground level with opaque and semi-transparent modules appears very similar. Yet, Figure 11 shows that although the distributions appear similar, the MAVR at ground level, with the semi-transparent modules, was higher by about 17% than with opaque modules, both in June and December. A comparison between the values in Figure 4 and Figure 11 of NSC and NSL shows that on 21 December, the radiation in the tunnel greenhouse was slightly higher than in the multi-span one (4–6%); on 21 June, it was higher by 10–13%. A higher radiation in the tunnel greenhouse was expected due to the contribution of radiation entering the greenhouse through the sidewalls. The contribution of the sidewalls to the increase in radiation at the canopy level was also reported by Cossu et al. [15]. In their case, the sidewalls contributed due to increased gutter height. As the greenhouse gutter height increased, more solar radiation could enter from the sidewalls.
3.5. Simulations of a Multi-Span Greenhouse with Opaque and Semi-Transparent Modules: NSL Configuration
Figure 12 and Figure 13 show the MAVR obtained at ground level with an NSL configuration using opaque and semi-transparent modules in June and December, respectively. Similar to the observation with the NSC case, there appear to be no significant differences in the homogeneity of the radiation distribution between opaque and semi-transparent modules. Yet, the MAVR values obtained with semi-transparent modules were higher than with opaque modules, as expected.
3.6. Uniformity of the MAVR Distribution
Figure 14 shows the values of uniformity (%) obtained by Eq. (1) and Eq. (2). The analysis was done on data from the multi-span greenhouse. On 21 June, the uniformity values were higher in the NSL than in the NSC. On 21 December, the values were similar, indicating that for the present dimensions of the PV panels and the specific considered configuration, straight-line results in a more homogenous light distribution than the checkerboard. Semi-transparent panels resulted in more uniform distributions than opaque ones, as expected.
3.7. The Potential of Energy Production
A rough estimate suggests that an organic photovoltaic (OPV) greenhouse covered with a polyethylene film under typical solar insolation in Israel can generate approximately 55 kWh m⁻² per year, based on OPV module area [32]. In contrast, greenhouses utilizing opaque first- or second-generation PV technologies may achieve up to 160 kWh m⁻² annually. However, the simulations indicate that opaque modules reduce light transmission by about 17% compared to semi-transparent OPV modules used in the current study, which could translate to a comparable decrease in crop yield [33]. Despite this, the substantially higher energy output from opaque modules may offset the potential reduction in crop productivity, making their installation economically viable in certain contexts. In particular, a greenhouse with variable shading resulting from panel rotation in relation to the climatic conditions external to the greenhouse and sun position in the sky [34] may be beneficial with opaque PV modules. Looking ahead, semi-transparent PV modules are likely to become more competitive as third-generation technologies improve in efficiency and performance [35].
4. Conclusions
The following conclusions can be drawn for the case of a greenhouse with gutters oriented North-South (NS):
- (1)
- NS OPV straight-line strips resulted in the most homogenous mean absorbed visible radiation (MAVR) distribution at ground level.
- (2)
- EW OPV straight-line strips resulted in the worst MAVR distribution.
- (3)
- NS Straight-line OPV configuration was slightly better than the checkerboard (NS or EW) with respect to radiation distribution.
- (4)
- Visible radiation distribution in summer was better than in winter.
- (5)
- Visible radiation values in a large multi-span greenhouse were lower than in a mono-span tunnel greenhouse.
Author Contributions
“Conceptualization, M.T. and H.V.; methodology, M.T. and H.V. and S.O.; software, M.T and S.O.; validation, M.T. and S.O.; formal analysis, M.T. and S.O.; investigation, M.T. and H.V.; resources, M.T. and H.V.; data curation, S.O.; writing—original draft preparation, M.T.; writing—review and editing, M.T. and H.V.; project administration, M.T. and H.V.; funding acquisition, M.T. and H.V. All authors have read and agreed to the published version of the manuscript.
Funding
This research was funded by Research Grant SOLAR-ERA.NET Cofund 2 Additional Joint Call N° 056 and the Israeli Ministry of Energy, Research Grants 220-11-056 & 220-11-057.
Data Availability Statement
Dataset available on request from the authors.
Acknowledgments
The authors thank Dr. Ibrahim Yehia and Dr. Esther Magadley for providing the greenhouse for experiments and helping with its design.
Conflicts of Interest
The authors declare no conflicts of interest. The funders had no role in the design of the study; in the collection, analyses, or interpretation of data; in the writing of the manuscript; or in the decision to publish the results.
Abbreviations
The following abbreviations are used in this manuscript:
| MDPI | Multidisciplinary Digital Publishing Institute |
| DOAJ | Directory of open access journals |
| TLA | Three letter acronym |
| LD | Linear dichroism |
References
- Yano, A.; Furue, A.; Kadowaki, M.; Tanaka, T.; Hiraki, E.; Miyamoto, M.; Ishizu, F.; Noda, S. Electrical energy generated by photovoltaic modules mounted inside the roof of a north–south oriented greenhouse. Biosyst. Eng. 2009, 103, 228–238. [Google Scholar] [CrossRef]
- Kadowaki, M.; Yano, A.; Ishizu, F.; Tanaka, T.; Noda, S. Effects of greenhouse photovoltaic array shading on Welsh onion growth. Biosyst. Eng. 2012, 111, 290–297. [Google Scholar] [CrossRef]
- Cossu, M.; Murgia, L.; Ledda, L.; Deligios, P.A.; Sirigu, A.; Chessa, F.; Pazzona, A. Solar radiation distribution inside a greenhouse with south-oriented photovoltaic roofs and effects on crop productivity. Appl. Energy 2014, 133, 89–100. [Google Scholar] [CrossRef]
- Marucci, A.; Cappuccini, A. Dynamic photovoltaic greenhouse: Energy efficiency in clear sky conditions. Appl. Energy 2016, 170, 362–376. [Google Scholar] [CrossRef]
- Trypanagnostopoulos, G.; Kavga, A.; Souliotis, Μ.; Tripanagnostopoulos, Y. Greenhouse performance results for roof installed photovoltaics. Renew. Energy 2017, 111, 724–731. [Google Scholar] [CrossRef]
- Okada, K.; Yehia, I.; Teitel, M.; Kacira, M. Crop production and energy generation in a greenhouse integrated with semi-transparent organic photovoltaic film. Acta Hortic. 2018, 231–240. [Google Scholar] [CrossRef]
- Ezzaeri, K.; Fatnassi, H.; Bouharroud, R.; Gourdo, L.; Bazgaou, A.; Wifaya, A.; Demrati, H.; Bekkaoui, A.; Aharoune, A.; Poncet, C.; et al. The effect of photovoltaic panels on the microclimate and on the tomato production under photovoltaic canarian greenhouses. Sol. Energy 2018, 173, 1126–1134. [Google Scholar] [CrossRef]
- Friman-Peretz, M.; Ozer, S.; Levi, A.; Magadley, E.; Yehia, I.; Geoola, F.; Gantz, S.; Brikman, R.; Levy, A.; Kacira, M.; et al. Energy partitioning and spatial variability of air temperature, VPD and radiation in a greenhouse tunnel shaded by semitransparent organic PV modules. Sol. Energy 2021, 220, 578–589. [Google Scholar] [CrossRef]
- Friman-Peretz, M.; Ozer, S.; Geoola, F.; Magadley, E.; Yehia, I.; Levi, A.; Brikman, R.; Gantz, S.; Levy, A.; Kacira, M.; et al. Microclimate and crop performance in a tunnel greenhouse shaded by organic photovoltaic modules – Comparison with conventional shaded and unshaded tunnels. Biosyst. Eng. 2020, 197, 12–31. [Google Scholar] [CrossRef]
- Peretz, M.F.; Geoola, F.; Yehia, I.; Ozer, S.; Levi, A.; Magadley, E.; Brikman, R.; Rosenfeld, L.; Levy, A.; Kacira, M.; et al. Testing organic photovoltaic modules for application as greenhouse cover or shading element. Biosyst. Eng. 2019, 184, 24–36. [Google Scholar] [CrossRef]
- Ben-Amara, H., Bouadila, S., Fatnassi, H., Arici, M., Guizani, A. A. 2021. Climate assessment of greenhouse equipped with south-oriented PV roofs: An experimental and computational fluid dynamics study. Sustainable Energy Technologies and Assessments, 45, 101100. [CrossRef]
- Ghaffarpour, Z.; Fakhroleslam, M.; Amidpour, M. Calculation of energy consumption, tomato yield, and electricity generation in a PV-integrated greenhouse with different solar panels configuration. Renew. Energy 2024, 229. [Google Scholar] [CrossRef]
- Hassanien, R.H.E.; Li, M.; Yin, F. The integration of semi-transparent photovoltaics on greenhouse roof for energy and plant production. Renew. Energy 2018, 121, 377–388. [Google Scholar] [CrossRef]
- Ezzaeri, K.; Fatnassi, H.; Wifaya, A.; Bazgaou, A.; Aharoune, A.; Poncet, C.; Bekkaoui, A.; Bouirden, L. Performance of photovoltaic canarian greenhouse: A comparison study between summer and winter seasons. Sol. Energy 2020, 198, 275–282. [Google Scholar] [CrossRef]
- Cossu, M.; Cossu, A.; Deligios, P.A.; Ledda, L.; Li, Z.; Fatnassi, H.; Poncet, C.; Yano, A. Assessment and comparison of the solar radiation distribution inside the main commercial photovoltaic greenhouse types in Europe. Renew. Sustain. Energy Rev. 2018, 94, 822–834. [Google Scholar] [CrossRef]
- Cossu, M.; Yano, A.; Solinas, S.; Deligios, P.A.; Tiloca, M.T.; Cossu, A.; Ledda, L. Agricultural sustainability estimation of the European photovoltaic greenhouses. Eur. J. Agron. 2020, 118. [Google Scholar] [CrossRef]
- Waller, R.; Kacira, M.; Magadley, E.; Teitel, M.; Yehia, I. Semi-Transparent Organic Photovoltaics Applied as Greenhouse Shade for Spring and Summer Tomato Production in Arid Climate. Agronomy 2021, 11, 1152. [Google Scholar] [CrossRef]
- Yano, A., Kadowaki, M., Furue, A., Tamaki, N., Tanaka, T., Hiraki, E., Kato, Y., Ishizu, F., Noda., S. Shading and electrical features of a photovoltaic array mounted inside the roof of an east-west oriented greenhouse. Biosyst. Eng. 2010, 106, 367–377. [CrossRef]
- Fatnassi, H.; Poncet, C.; Bazzano, M.M.; Brun, R.; Bertin, N. A numerical simulation of the photovoltaic greenhouse microclimate. Sol. Energy 2015, 120, 575–584. [Google Scholar] [CrossRef]
- Lu, L.; Ya'ACob, M.E.; Anuar, M.S.; Mohtar, M.N. Comprehensive review on the application of inorganic and organic photovoltaics as greenhouse shading materials. Sustain. Energy Technol. Assessments 2022, 52. [Google Scholar] [CrossRef]
- Gorjian, S.; Bousi, E.; Özdemir, Ö.E.; Trommsdorff, M.; Kumar, N.M.; Anand, A.; Kant, K.; Chopra, S.S. Progress and challenges of crop production and electricity generation in agrivoltaic systems using semi-transparent photovoltaic technology. Renew. Sustain. Energy Rev. 2022, 158. [Google Scholar] [CrossRef]
- Mabindisa, R.; Tambwe, K.; Mciteka, L.; Ross, N. Organic Nanostructured Materials for Sustainable Application in Next Generation Solar Cells. Appl. Sci. 2021, 11, 11324. [Google Scholar] [CrossRef]
- Meitzner, R.; Schubert, U.S.; Hoppe, H. Agrivoltaics—The Perfect Fit for the Future of Organic Photovoltaics. Adv. Energy Mater. 2020, 11. [Google Scholar] [CrossRef]
- Jean, J., Brown, P. R., Jaffe, R. L., Buonassisi, T., Bulović, V. 2015. Pathways for solar photovoltaics. Energy Environ. Sci. 2015, 8, 1200–1219. [CrossRef]
- Castellano, S.; Santamaria, P.; Serio, F. Solar radiation distribution inside a monospan greenhouse with the roof entirely covered by photovoltaic panels. J. Agric. Eng. 2016, 47, 1–6. [Google Scholar] [CrossRef]
- Chen, J.; Xu, F.; Ding, B.; Wu, N.; Shen, Z.; Zhang, L. Performance analysis of radiation and electricity yield in a photovoltaic panel integrated greenhouse using the radiation and thermal models. Comput. Electron. Agric. 2019, 164. [Google Scholar] [CrossRef]
- Torrente, C.J.; Reca, J.; López-Luque, R.; Martínez, J.; Casares, F.J. Simulation model to analyze the spatial distribution of solar radiation in agrivoltaic Mediterranean greenhouses and its effect on crop water needs. Appl. Energy 2023, 353. [Google Scholar] [CrossRef]
- Baxevanou, C.; Fidaros, D.; Katsoulas, N.; Mekeridis, E.; Varlamis, C.; Zachariadis, A.; Logothetidis, S. Simulation of Radiation and Crop Activity in a Greenhouse Covered with Semitransparent Organic Photovoltaics. Appl. Sci. 2020, 10, 2550. [Google Scholar] [CrossRef]
- ANSYS Fluent Theory Guide, Release 15.0. 2013. 275 Technology Drive, Canonsburg, PA, USA.
- Franco, J.E.; Rodríguez-Arroyo, J.A.; Ortiz, I.M.; Sánchez-Soto, P.J.; Garzón, E.; Lao, M.T. Chemical, Radiometric and Mechanical Characterization of Commercial Polymeric Films for Greenhouse Applications. Materials 2022, 15, 5532. [Google Scholar] [CrossRef] [PubMed]
- Goerner, F.L.; Duong, T.; Stafford, R.J.; Clarke, G.D. A comparison of five standard methods for evaluating image intensity uniformity in partially parallel imaging MRI. Med Phys. 2013, 40, 082302. [Google Scholar] [CrossRef]
- Teitel, M.; Grimberg, R.; Ozer, S.; Vitoshkin, H.; Yehia, I.; Magadley, E.; Levi, A.; Ziffer, E.; Gantz, S.; Levy, A. Effects of organic photovoltaic modules installed inside greenhouses on microclimate and plants. Biosyst. Eng. 2023, 232, 81–96. [Google Scholar] [CrossRef]
- Marcelis, L.F.M.; Broekhuijsen, A.G.M.; Meinen, E.; Nijs, E.M.F.M.; Raaphorst, M.G.M. Quantification of the growth response to light quantity of greenhouse grown crops. Acta Hortic. 2006, 97–104. [Google Scholar] [CrossRef]
- Moretti, S.; Marucci, A. A Photovoltaic Greenhouse with Variable Shading for the Optimization of Agricultural and Energy Production. Energies 2019, 12, 2589. [Google Scholar] [CrossRef]
- Basu, R.; Gumpert, F.; Lohbreier, J.; Morin, P.-O.; Vohra, V.; Liu, Y.; Zhou, Y.; Brabec, C.J.; Egelhaaf, H.-J.; Distler, A. Large-area organic photovoltaic modules with 14.5% certified world record efficiency. Joule 2024, 8, 970–978. [Google Scholar] [CrossRef]
Figure 1.
Checkerboard arrangement of the PV plastic modules, (a) Longitudinal (NSC); (b) Transverse (EWC). Figure 1 (a) shows also the numerical grid on the PV modules.
Figure 1.
Checkerboard arrangement of the PV plastic modules, (a) Longitudinal (NSC); (b) Transverse (EWC). Figure 1 (a) shows also the numerical grid on the PV modules.
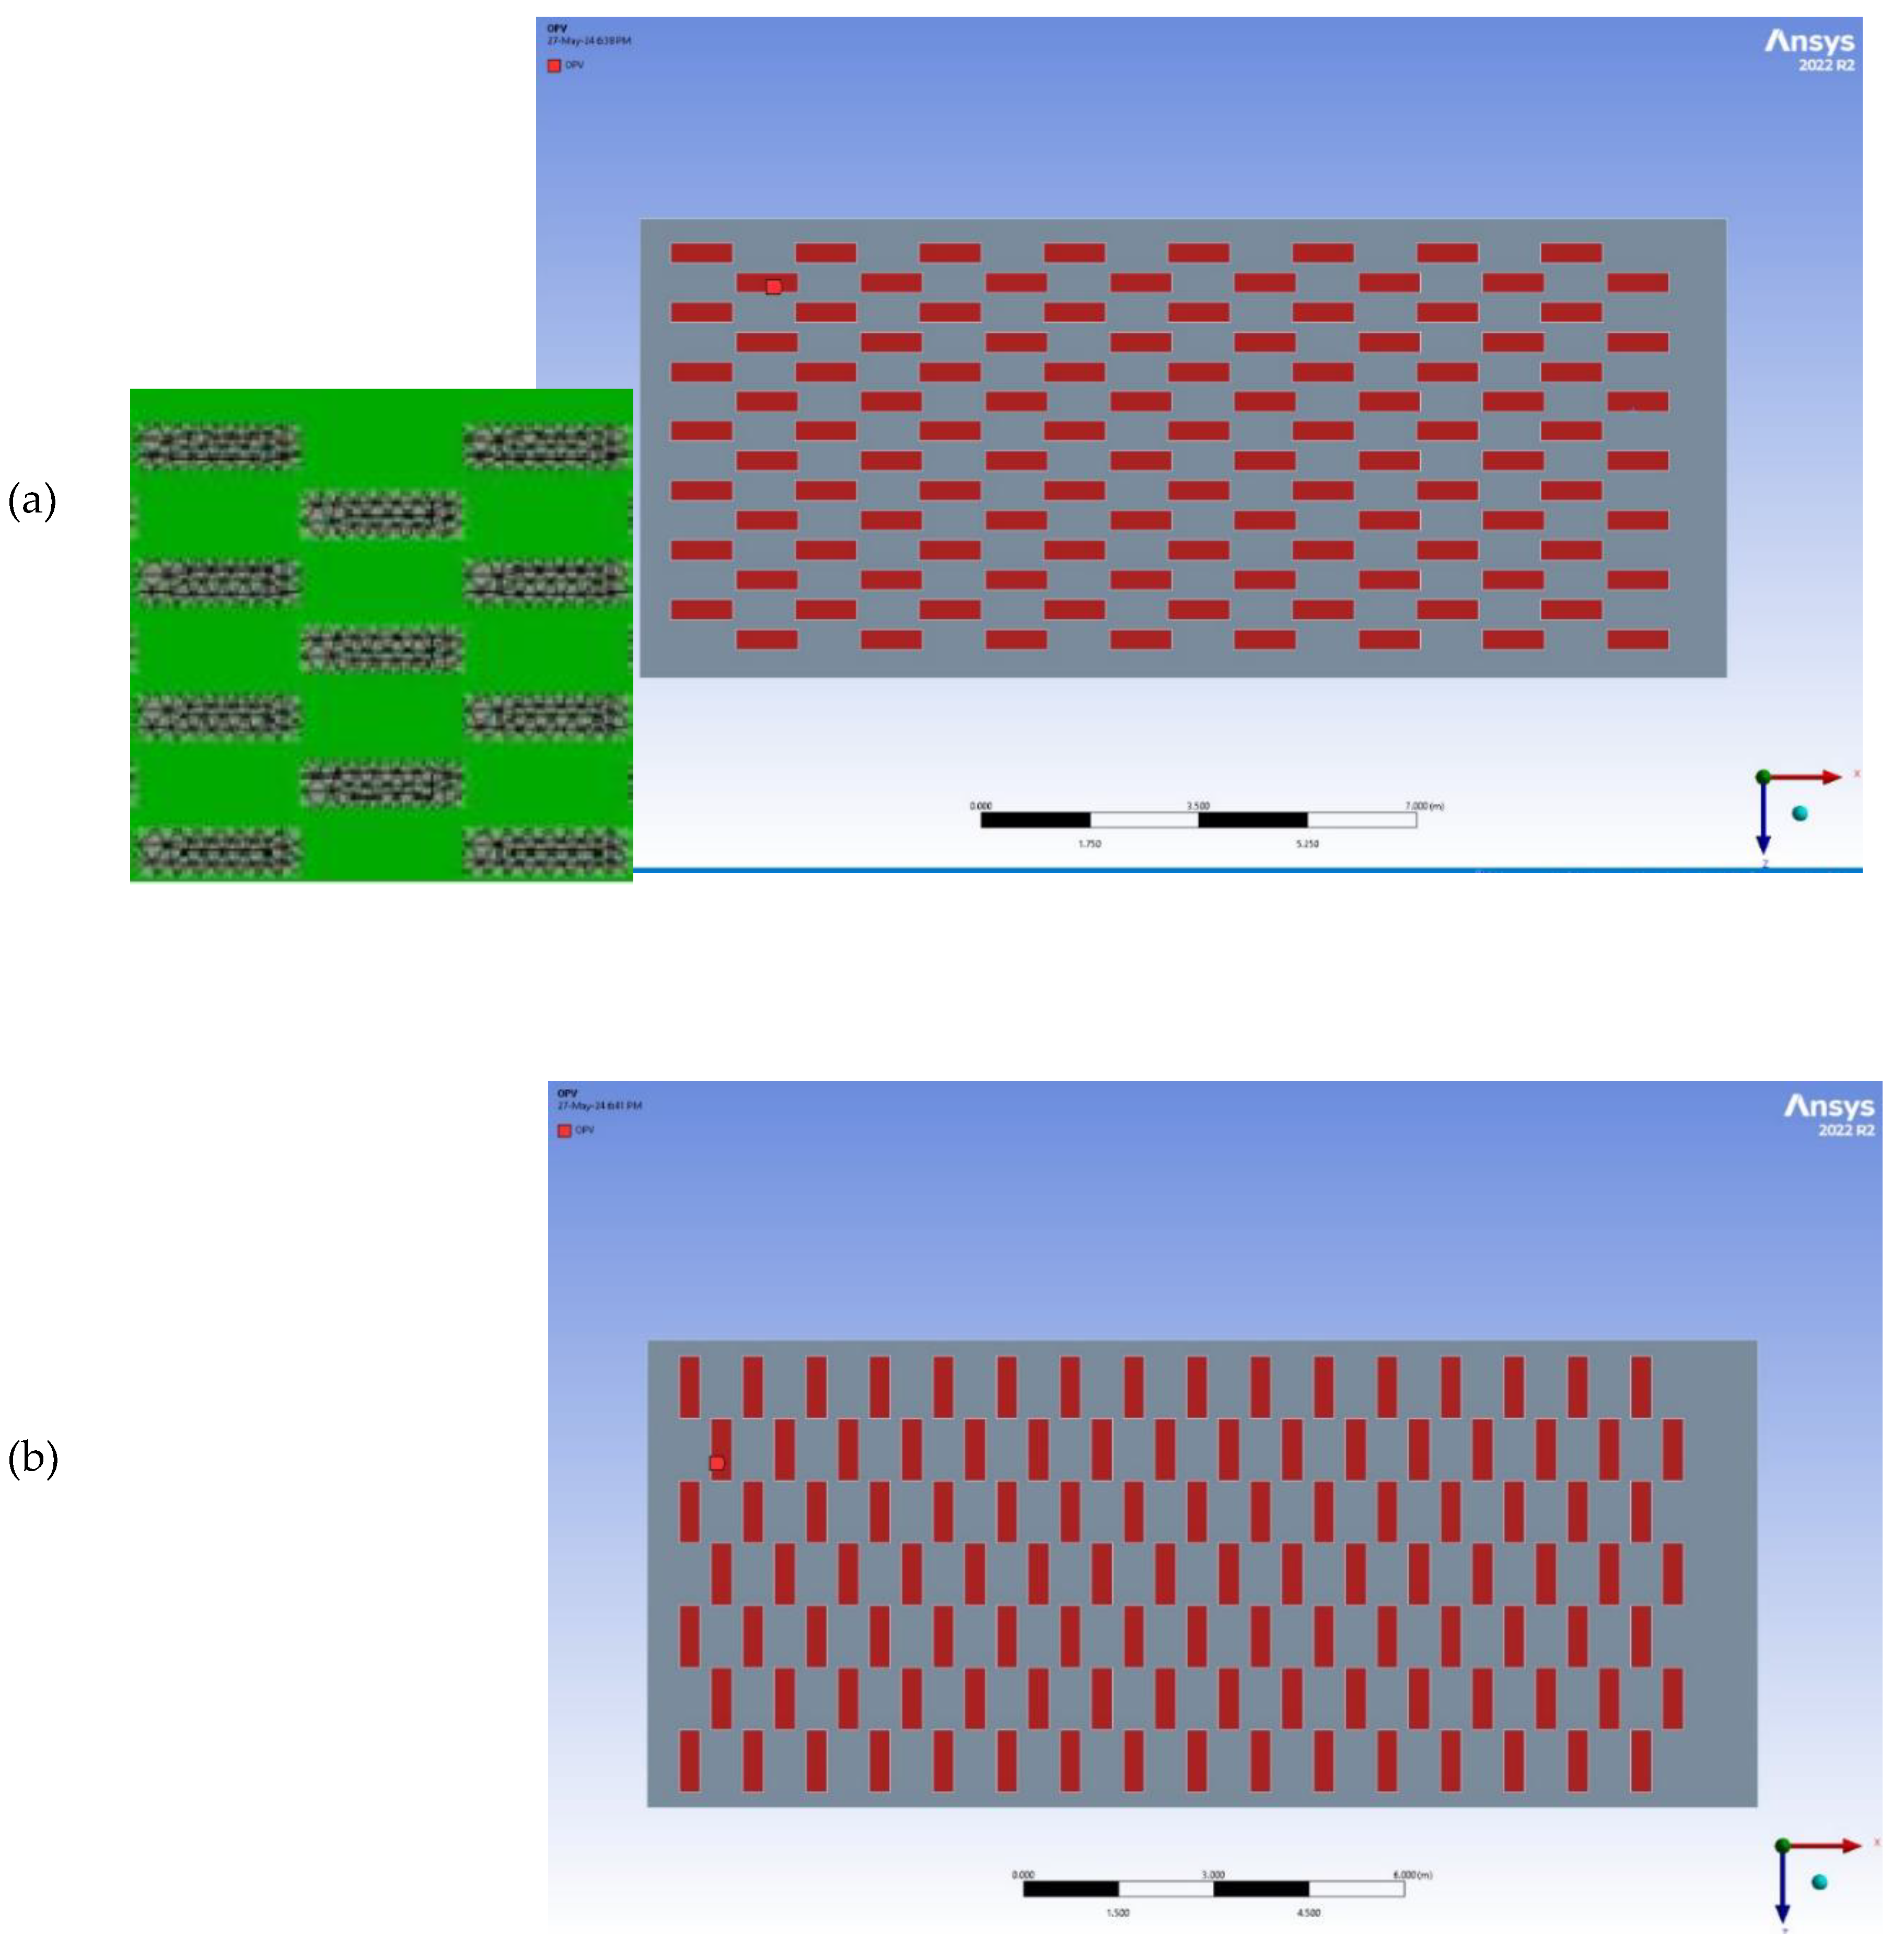
Figure 2.
Straight-line arrangement of the PV plastic modules, (a) Longitudinal (NSL); (b) Transverse (EWL).
Figure 2.
Straight-line arrangement of the PV plastic modules, (a) Longitudinal (NSL); (b) Transverse (EWL).
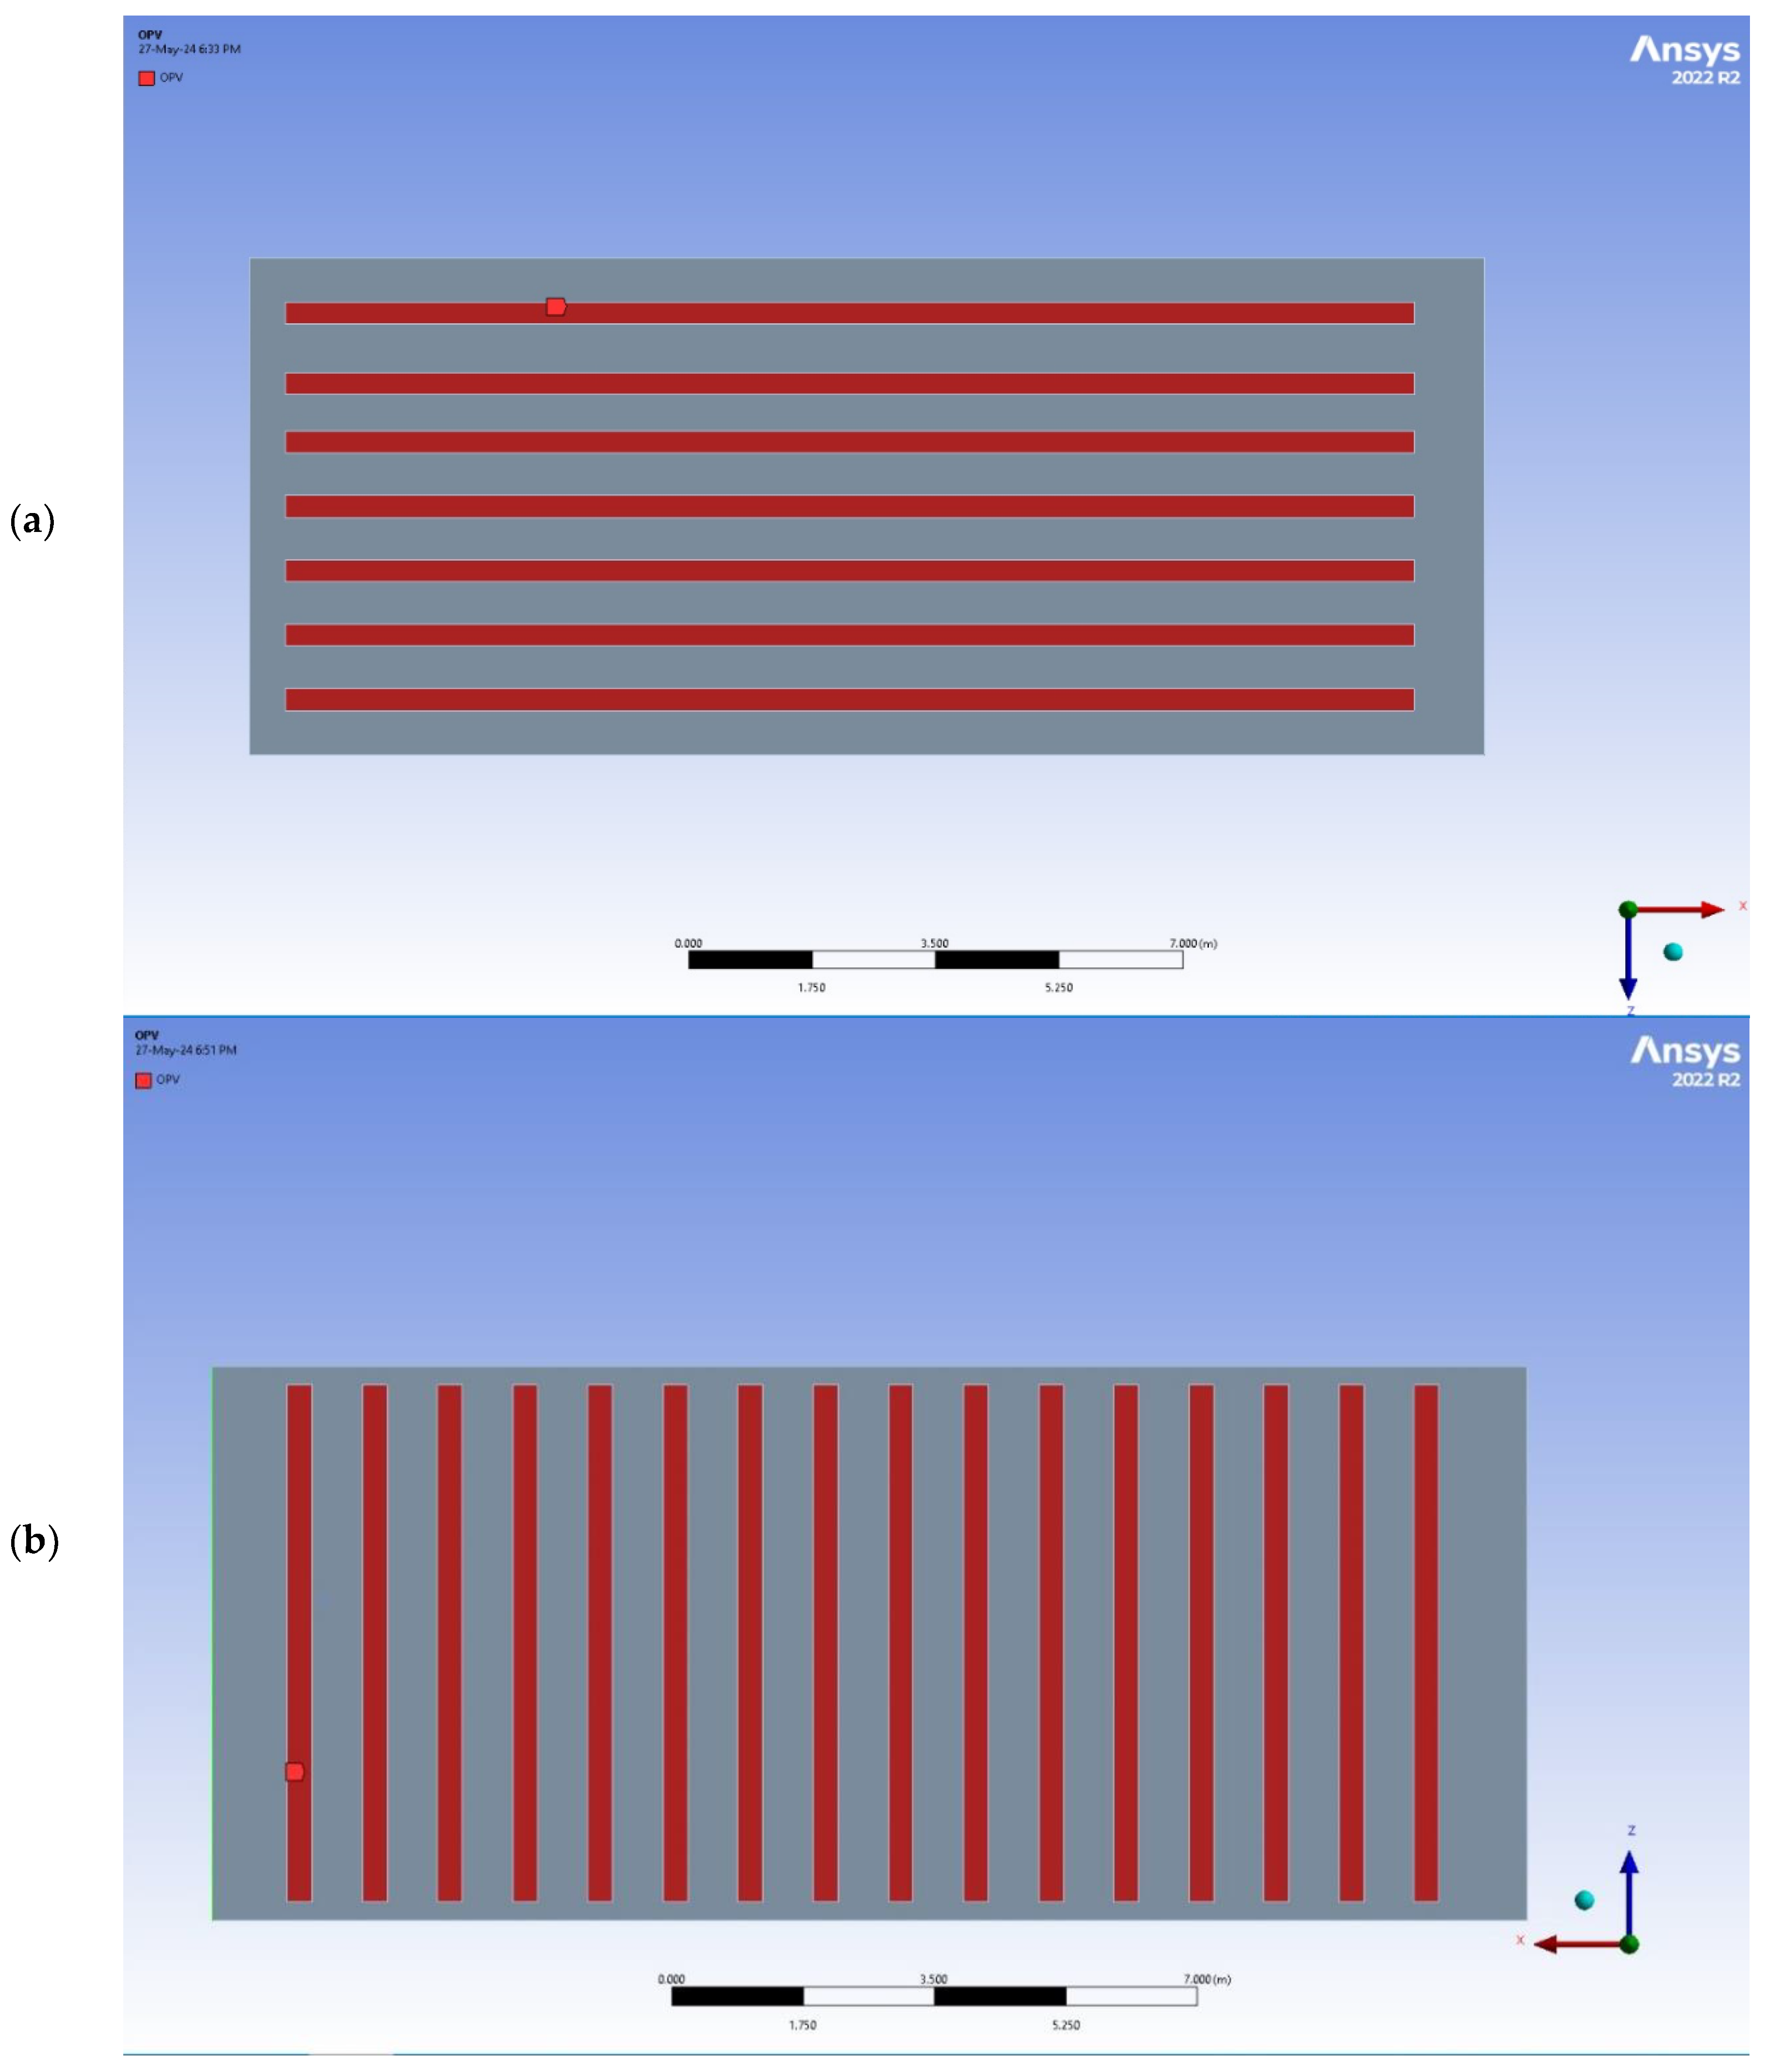
Figure 3.
Distribution of mean absorbed visible radiation (MAVR) on 21 June in the mono-span greenhouse, (a) NSC arrangement, (b) EWC arrangement. The arrow shows the north here and in all subsequent figures, considering the mono-span greenhouse.
Figure 3.
Distribution of mean absorbed visible radiation (MAVR) on 21 June in the mono-span greenhouse, (a) NSC arrangement, (b) EWC arrangement. The arrow shows the north here and in all subsequent figures, considering the mono-span greenhouse.
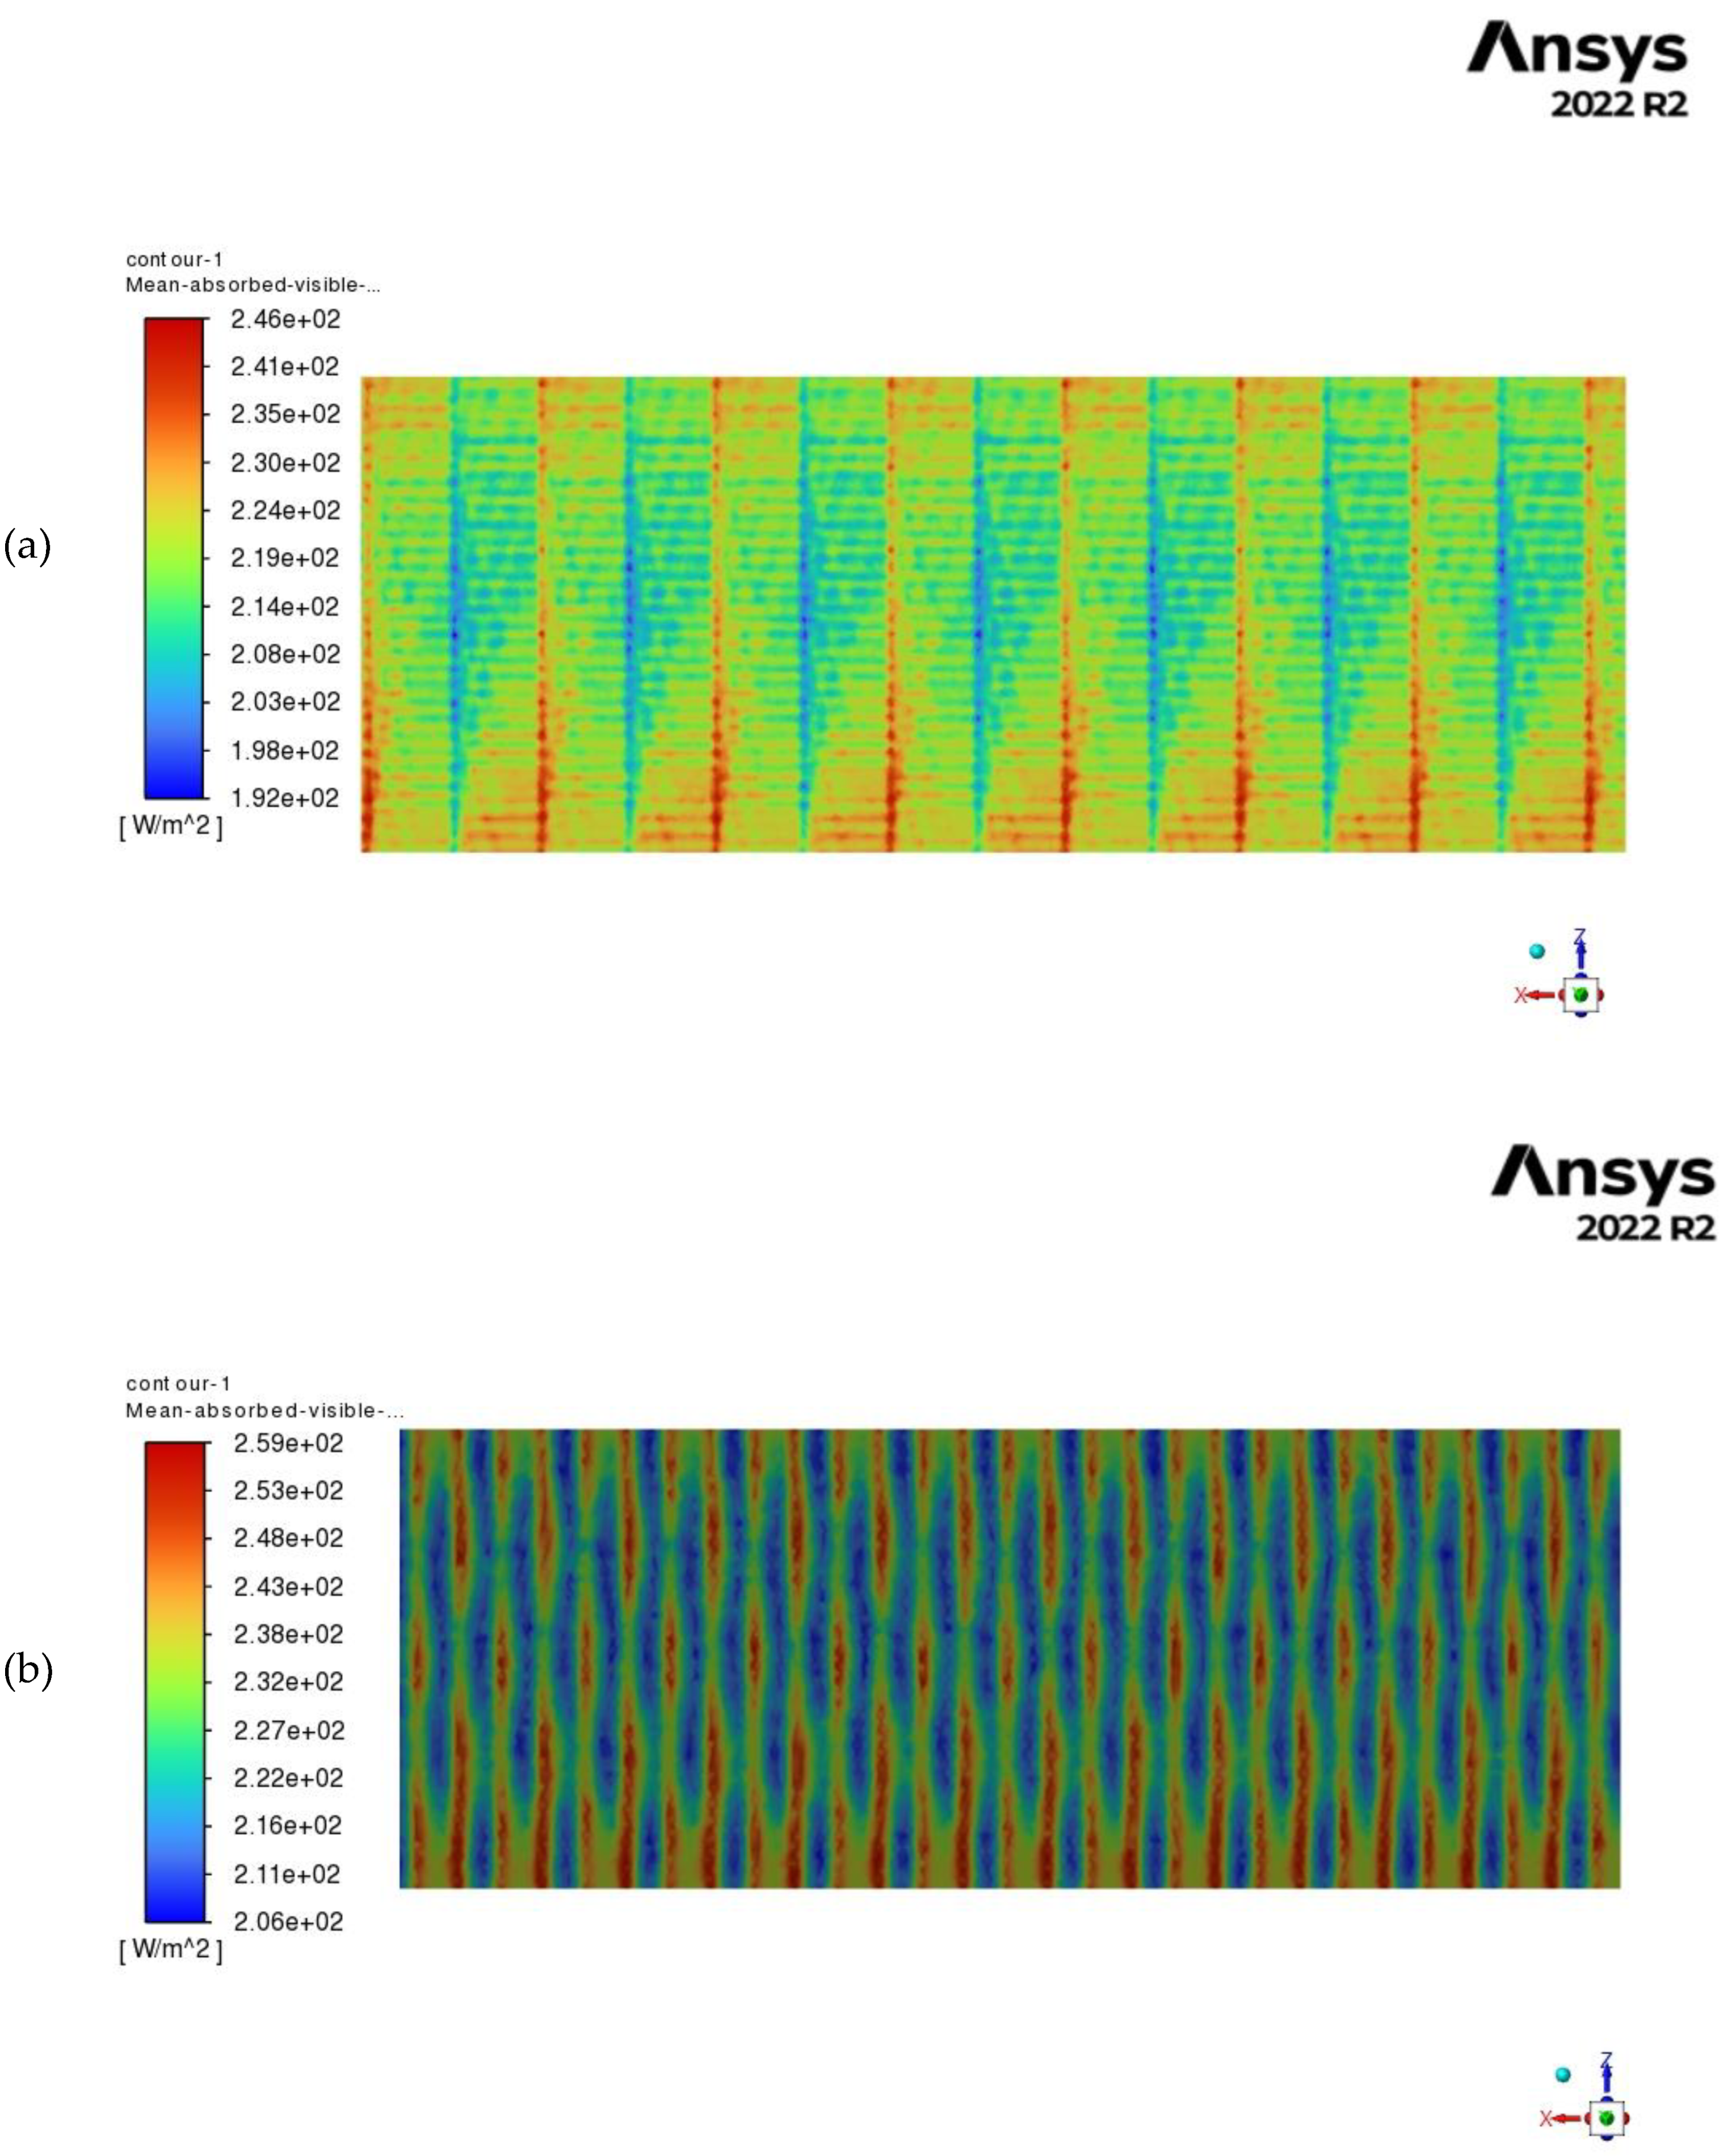
Figure 4.
Absorbed visible solar radiation at ground level in a mono-span greenhouse: a) Mean; b) RMS.
Figure 4.
Absorbed visible solar radiation at ground level in a mono-span greenhouse: a) Mean; b) RMS.
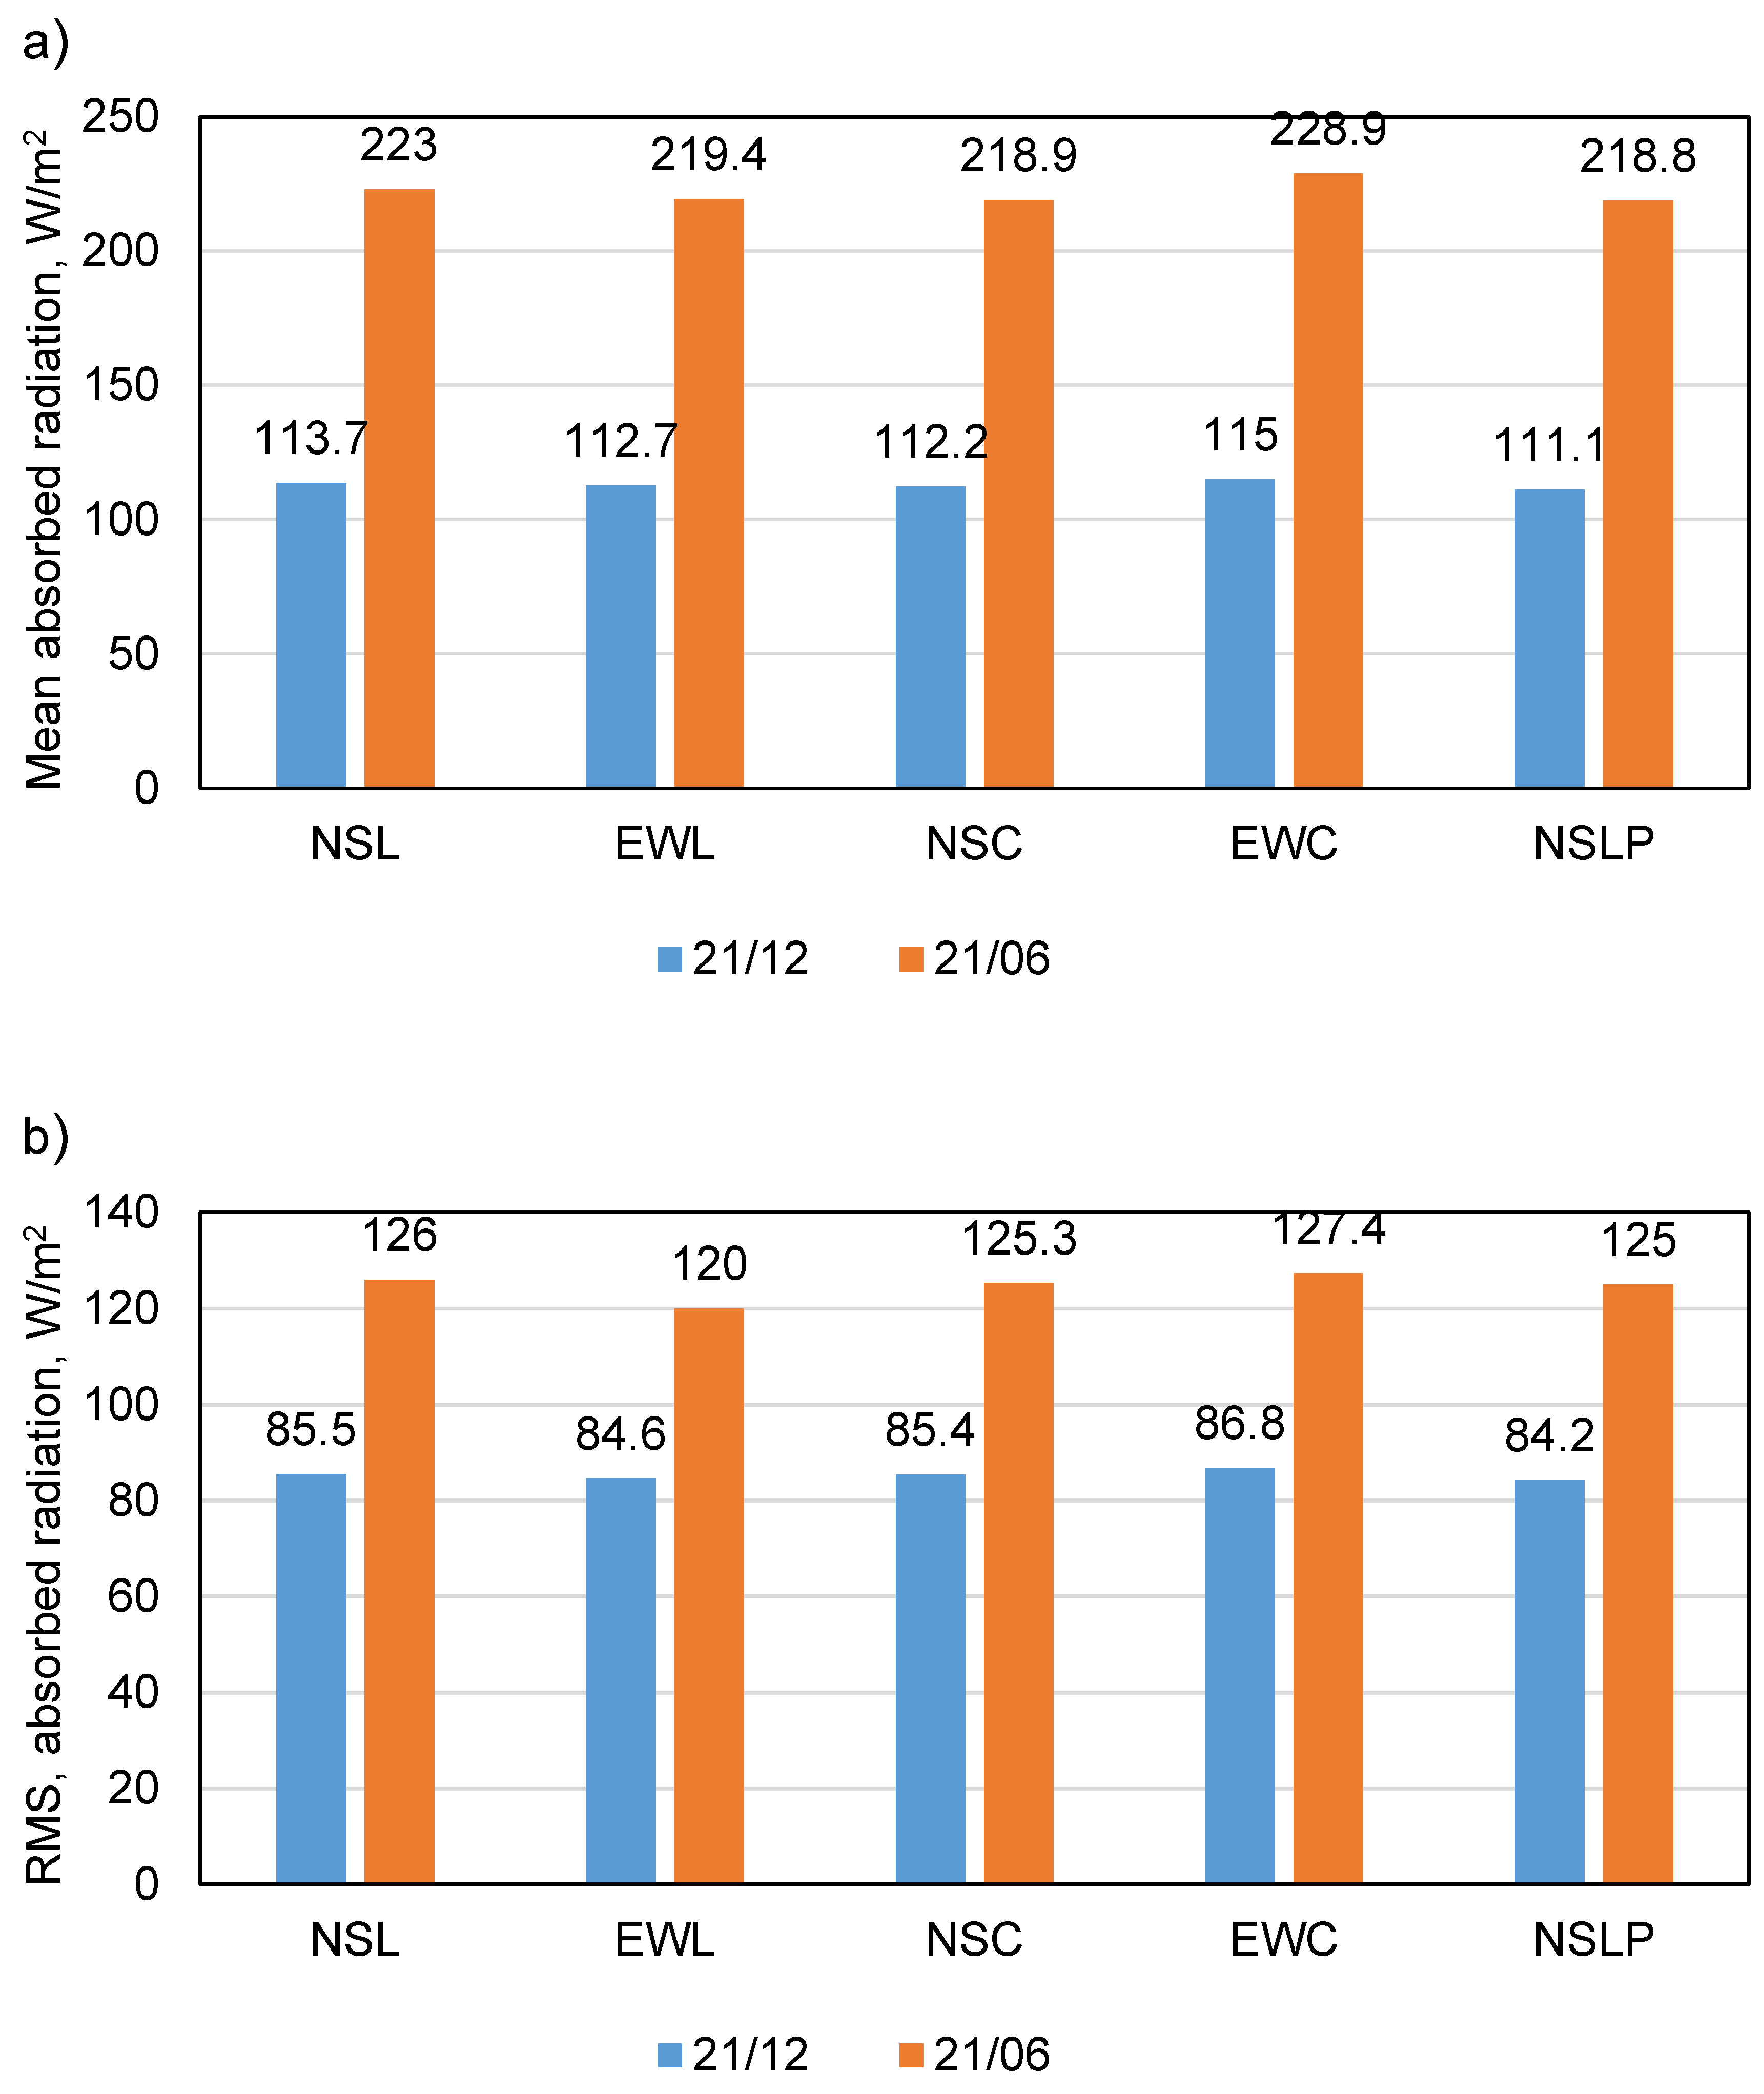
Figure 5.
MAVR distribution on 21 June in the mono-span greenhouse, (a) NSL arrangement, (b) EWL arrangement.
Figure 5.
MAVR distribution on 21 June in the mono-span greenhouse, (a) NSL arrangement, (b) EWL arrangement.

Figure 6.
MAVR distribution on 21 December in the mono-span greenhouse, (a) NSC arrangement, (b) EWC arrangement.
Figure 6.
MAVR distribution on 21 December in the mono-span greenhouse, (a) NSC arrangement, (b) EWC arrangement.
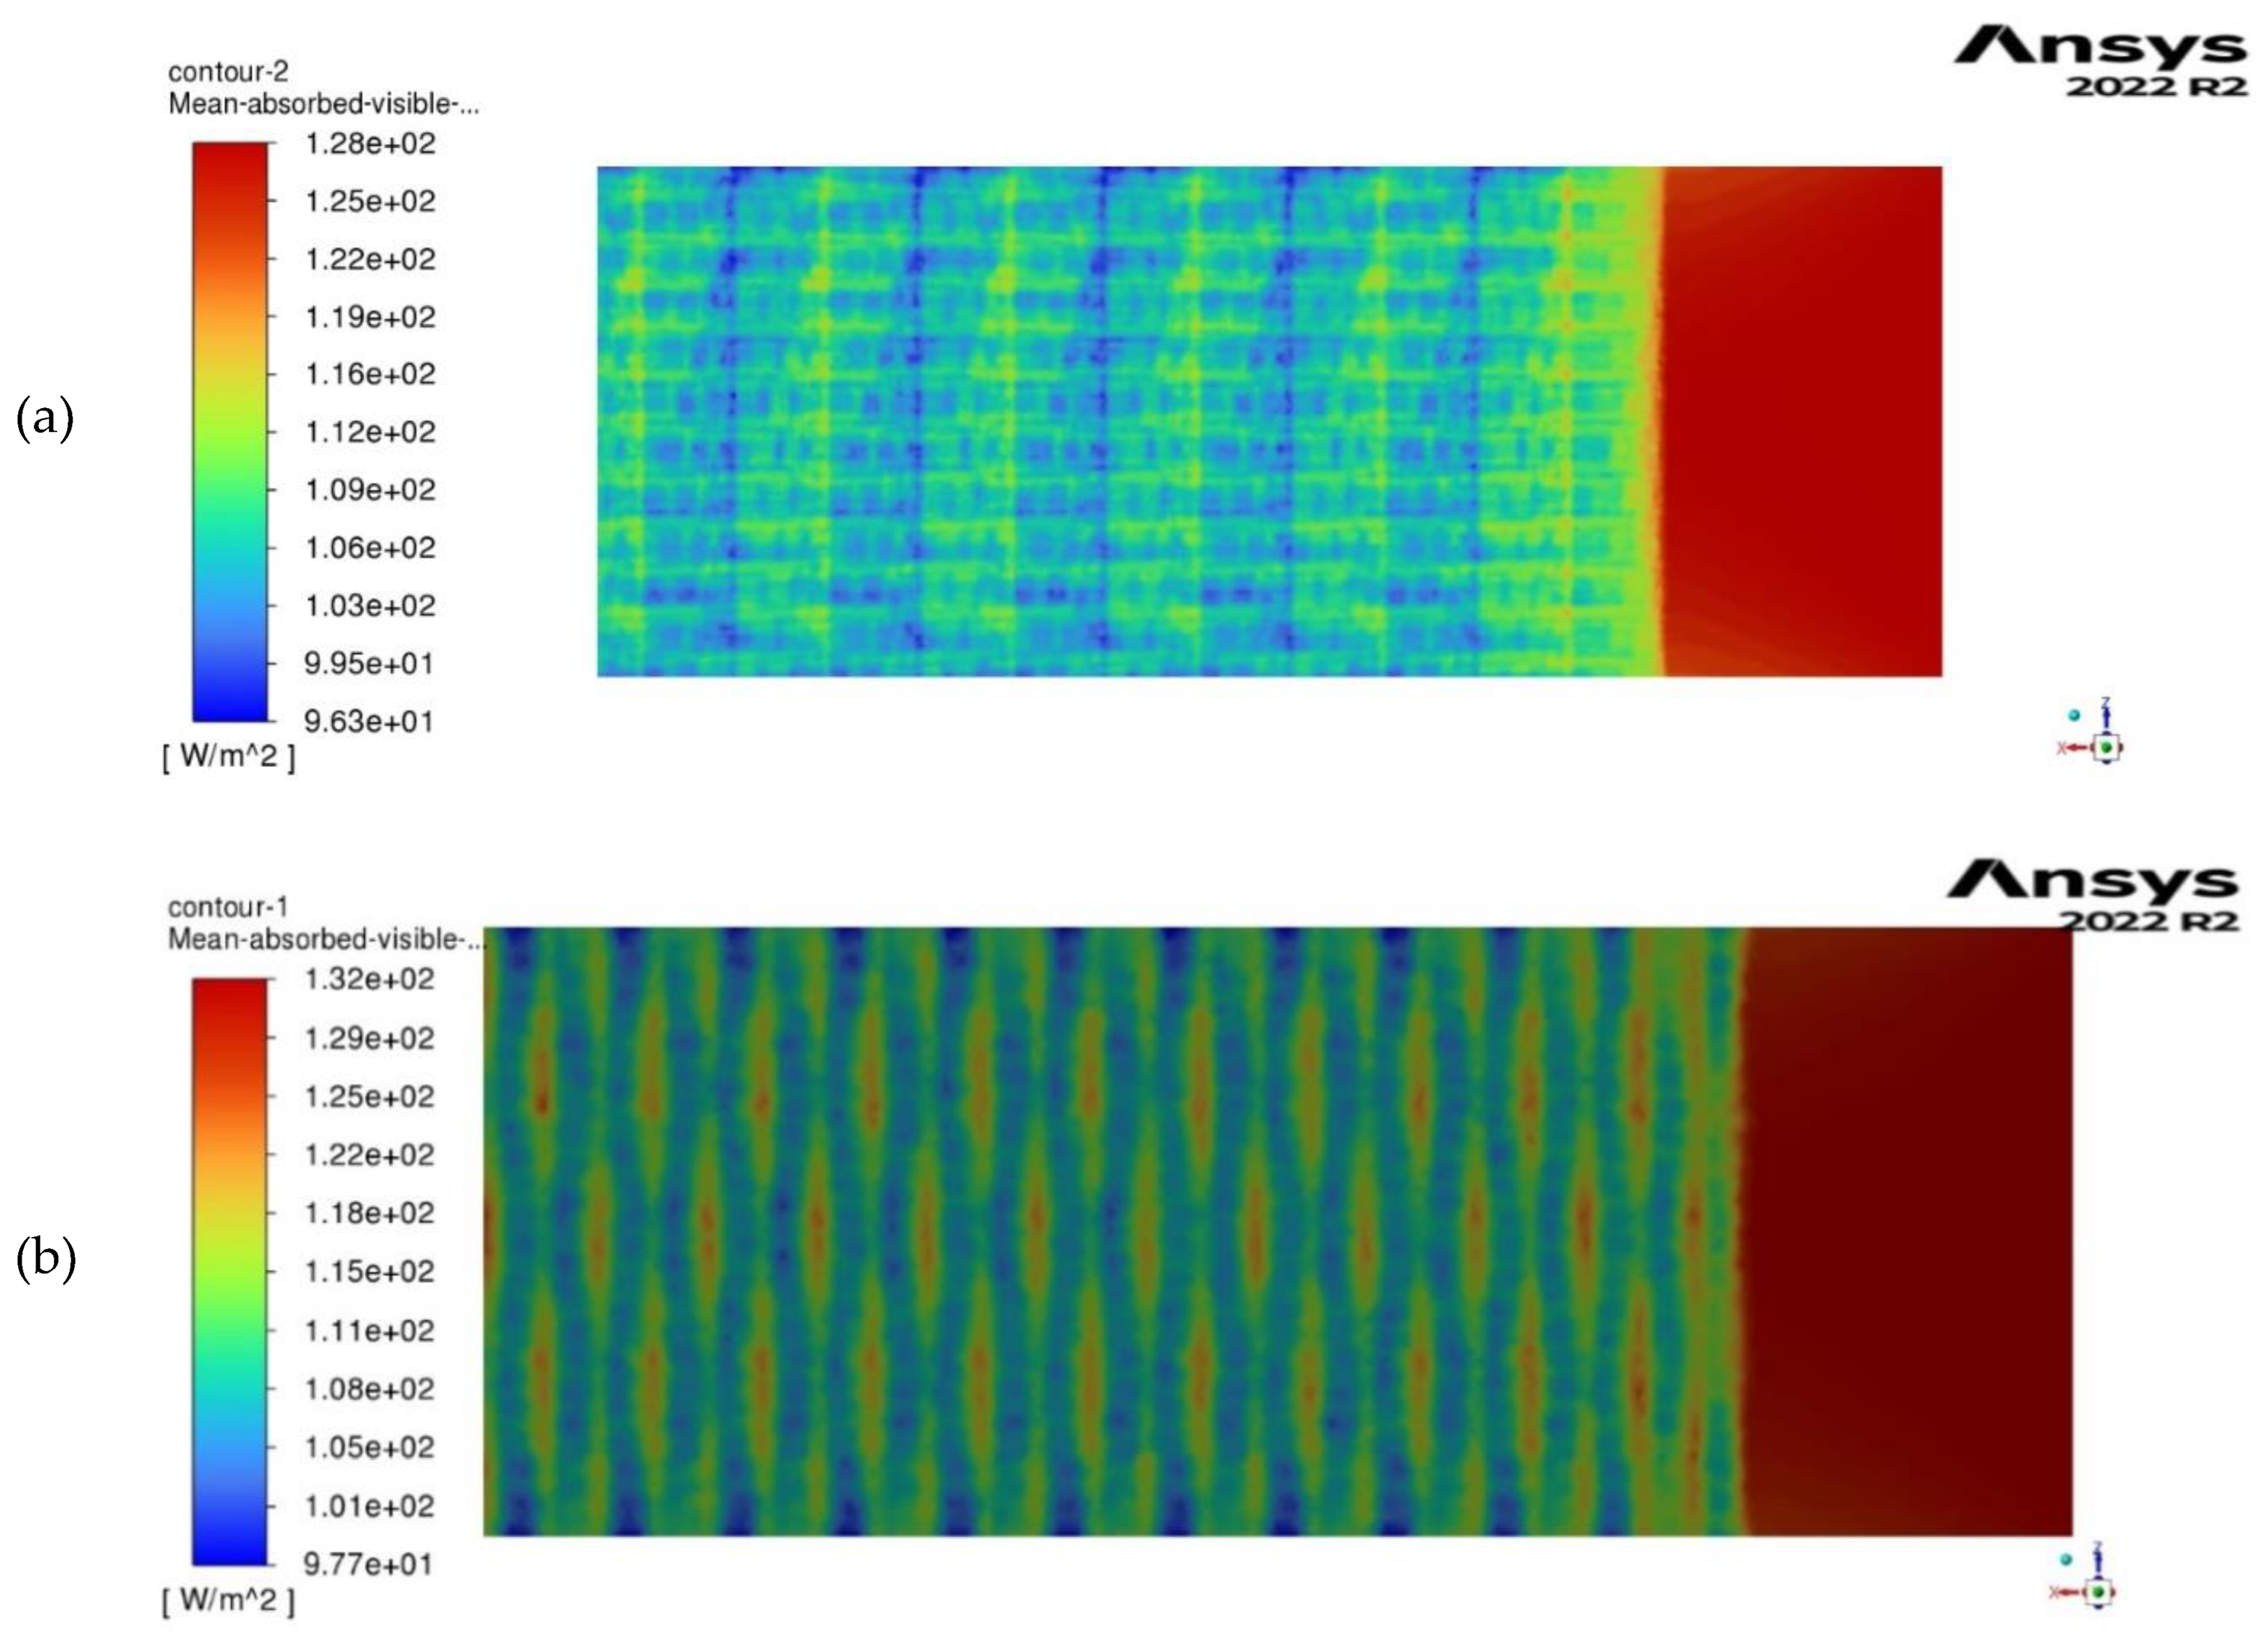
Figure 7.
MAVR distribution on 21 December in the mono-span greenhouse, (a) NSL arrangement, (b) EWL arrangement.
Figure 7.
MAVR distribution on 21 December in the mono-span greenhouse, (a) NSL arrangement, (b) EWL arrangement.
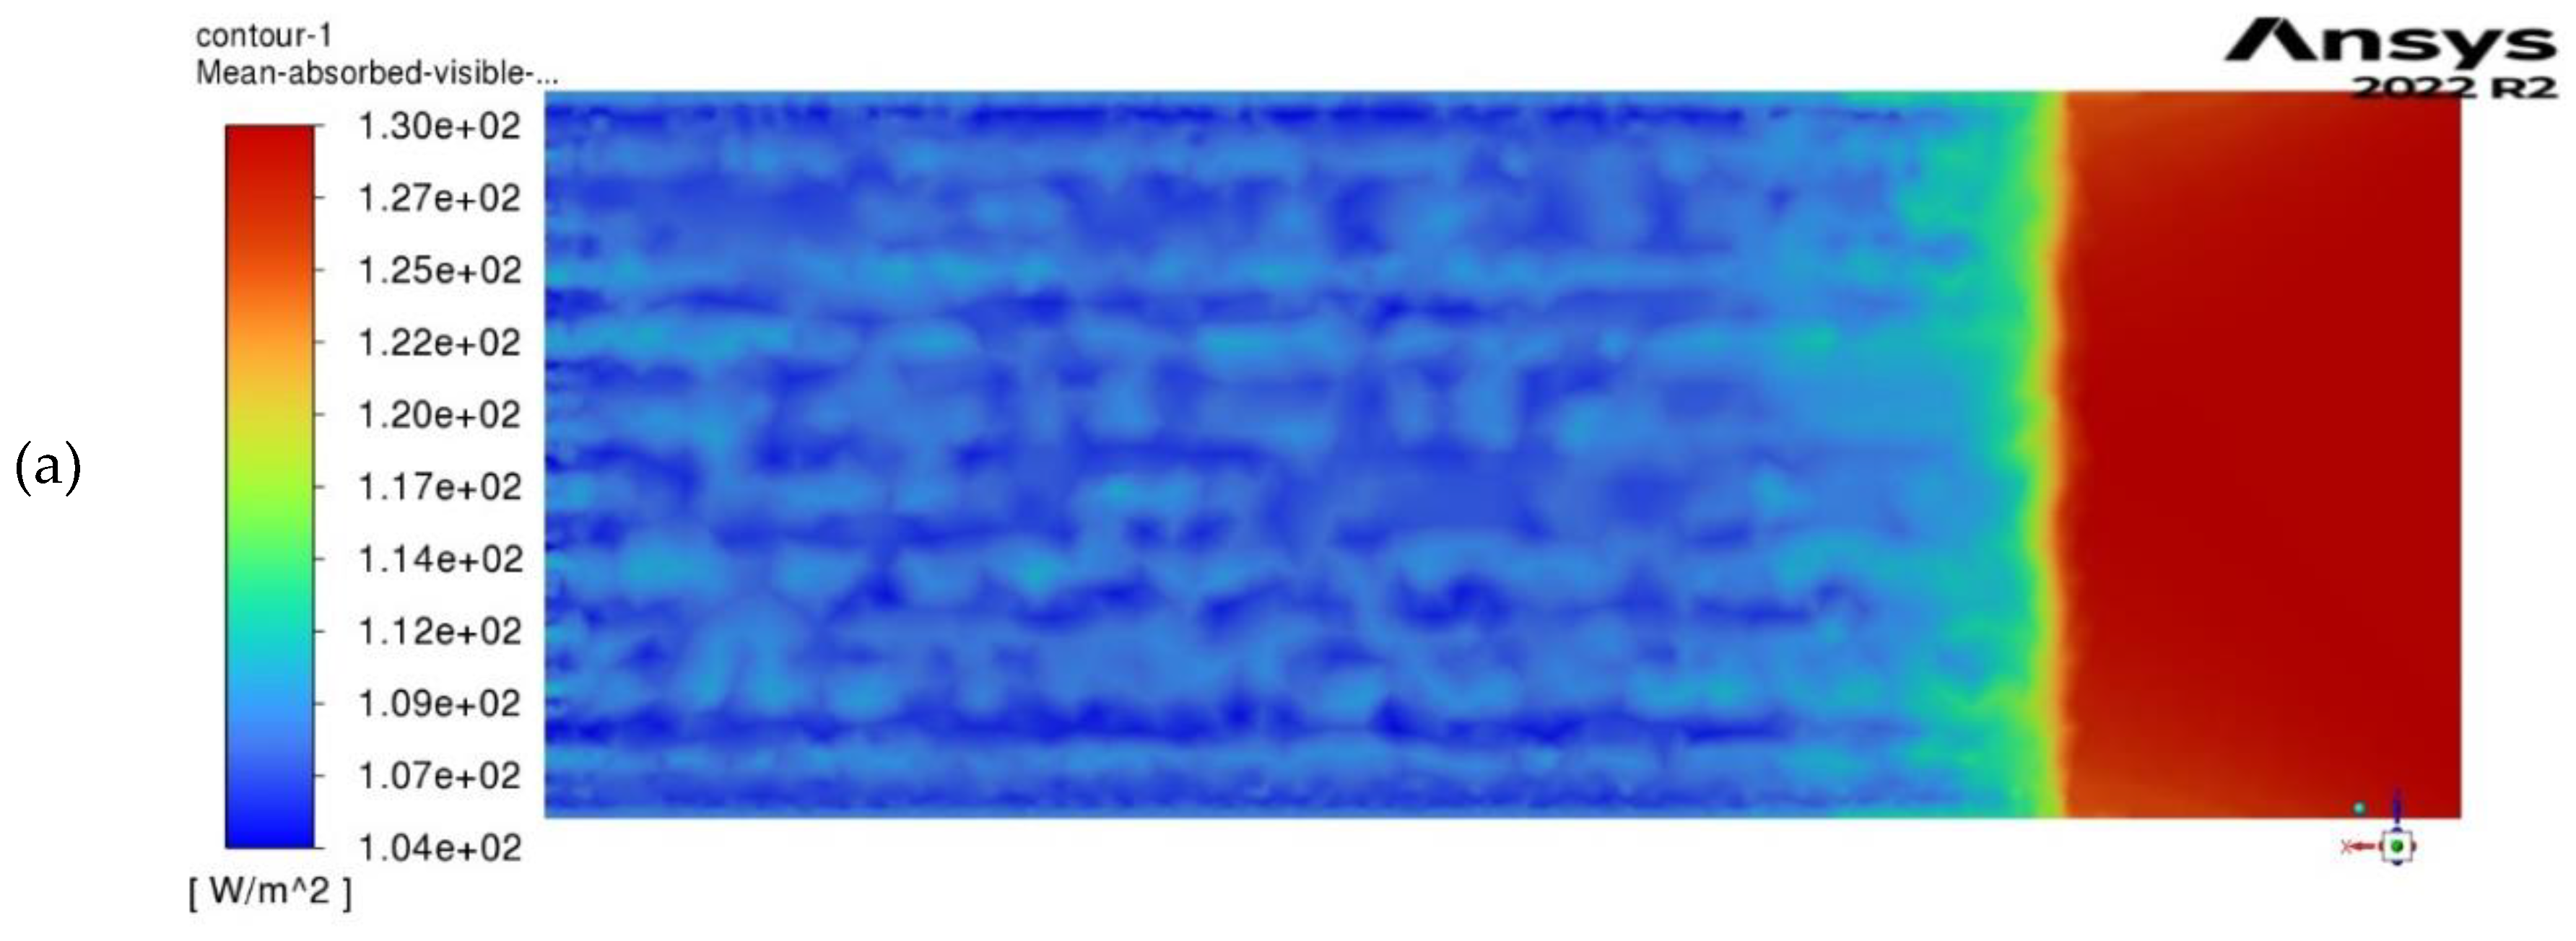
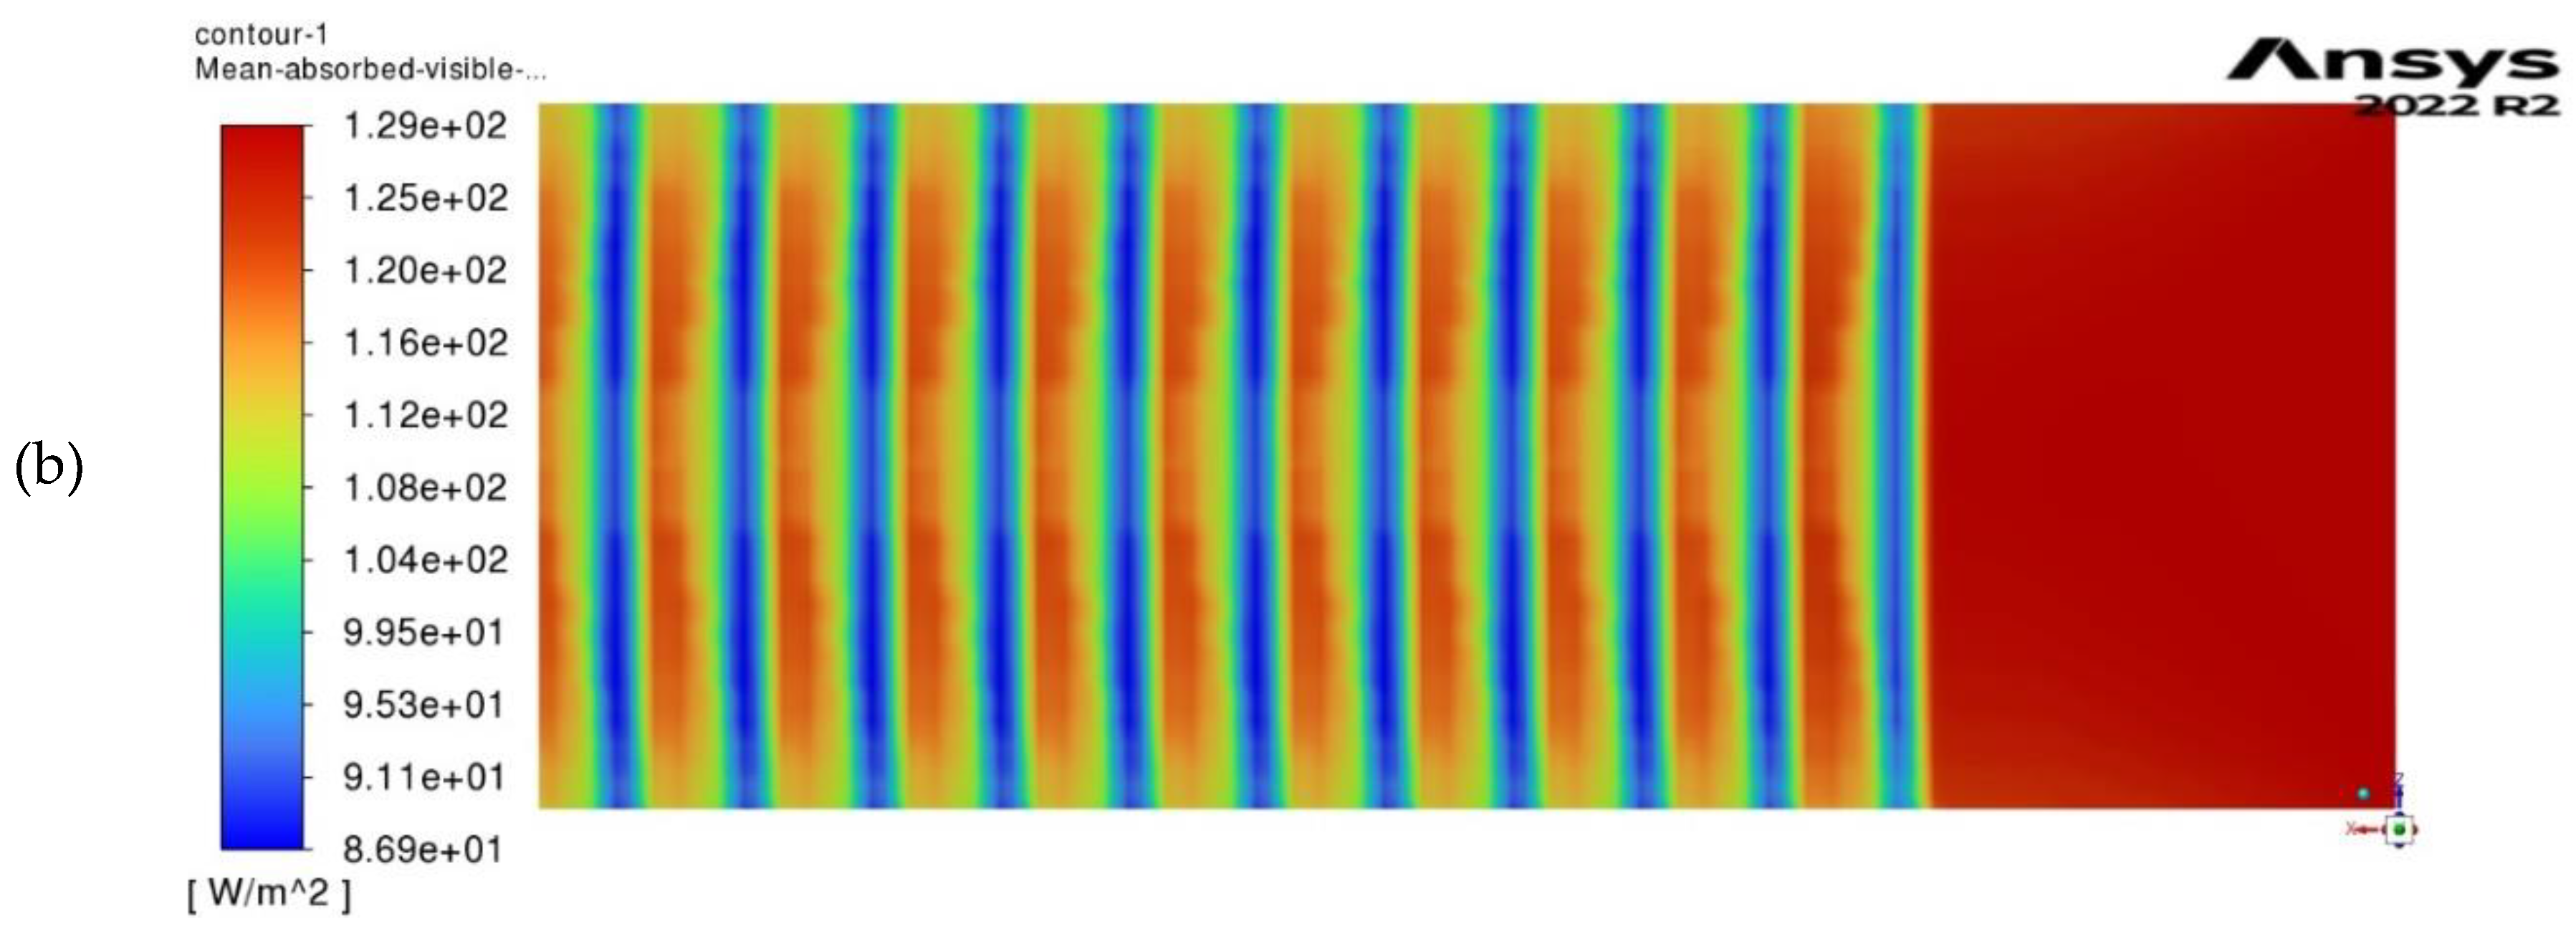
Figure 8.
MAVR distribution with NSLP in the mono-span greenhouse, (a) 21 June; (b) 21 December.
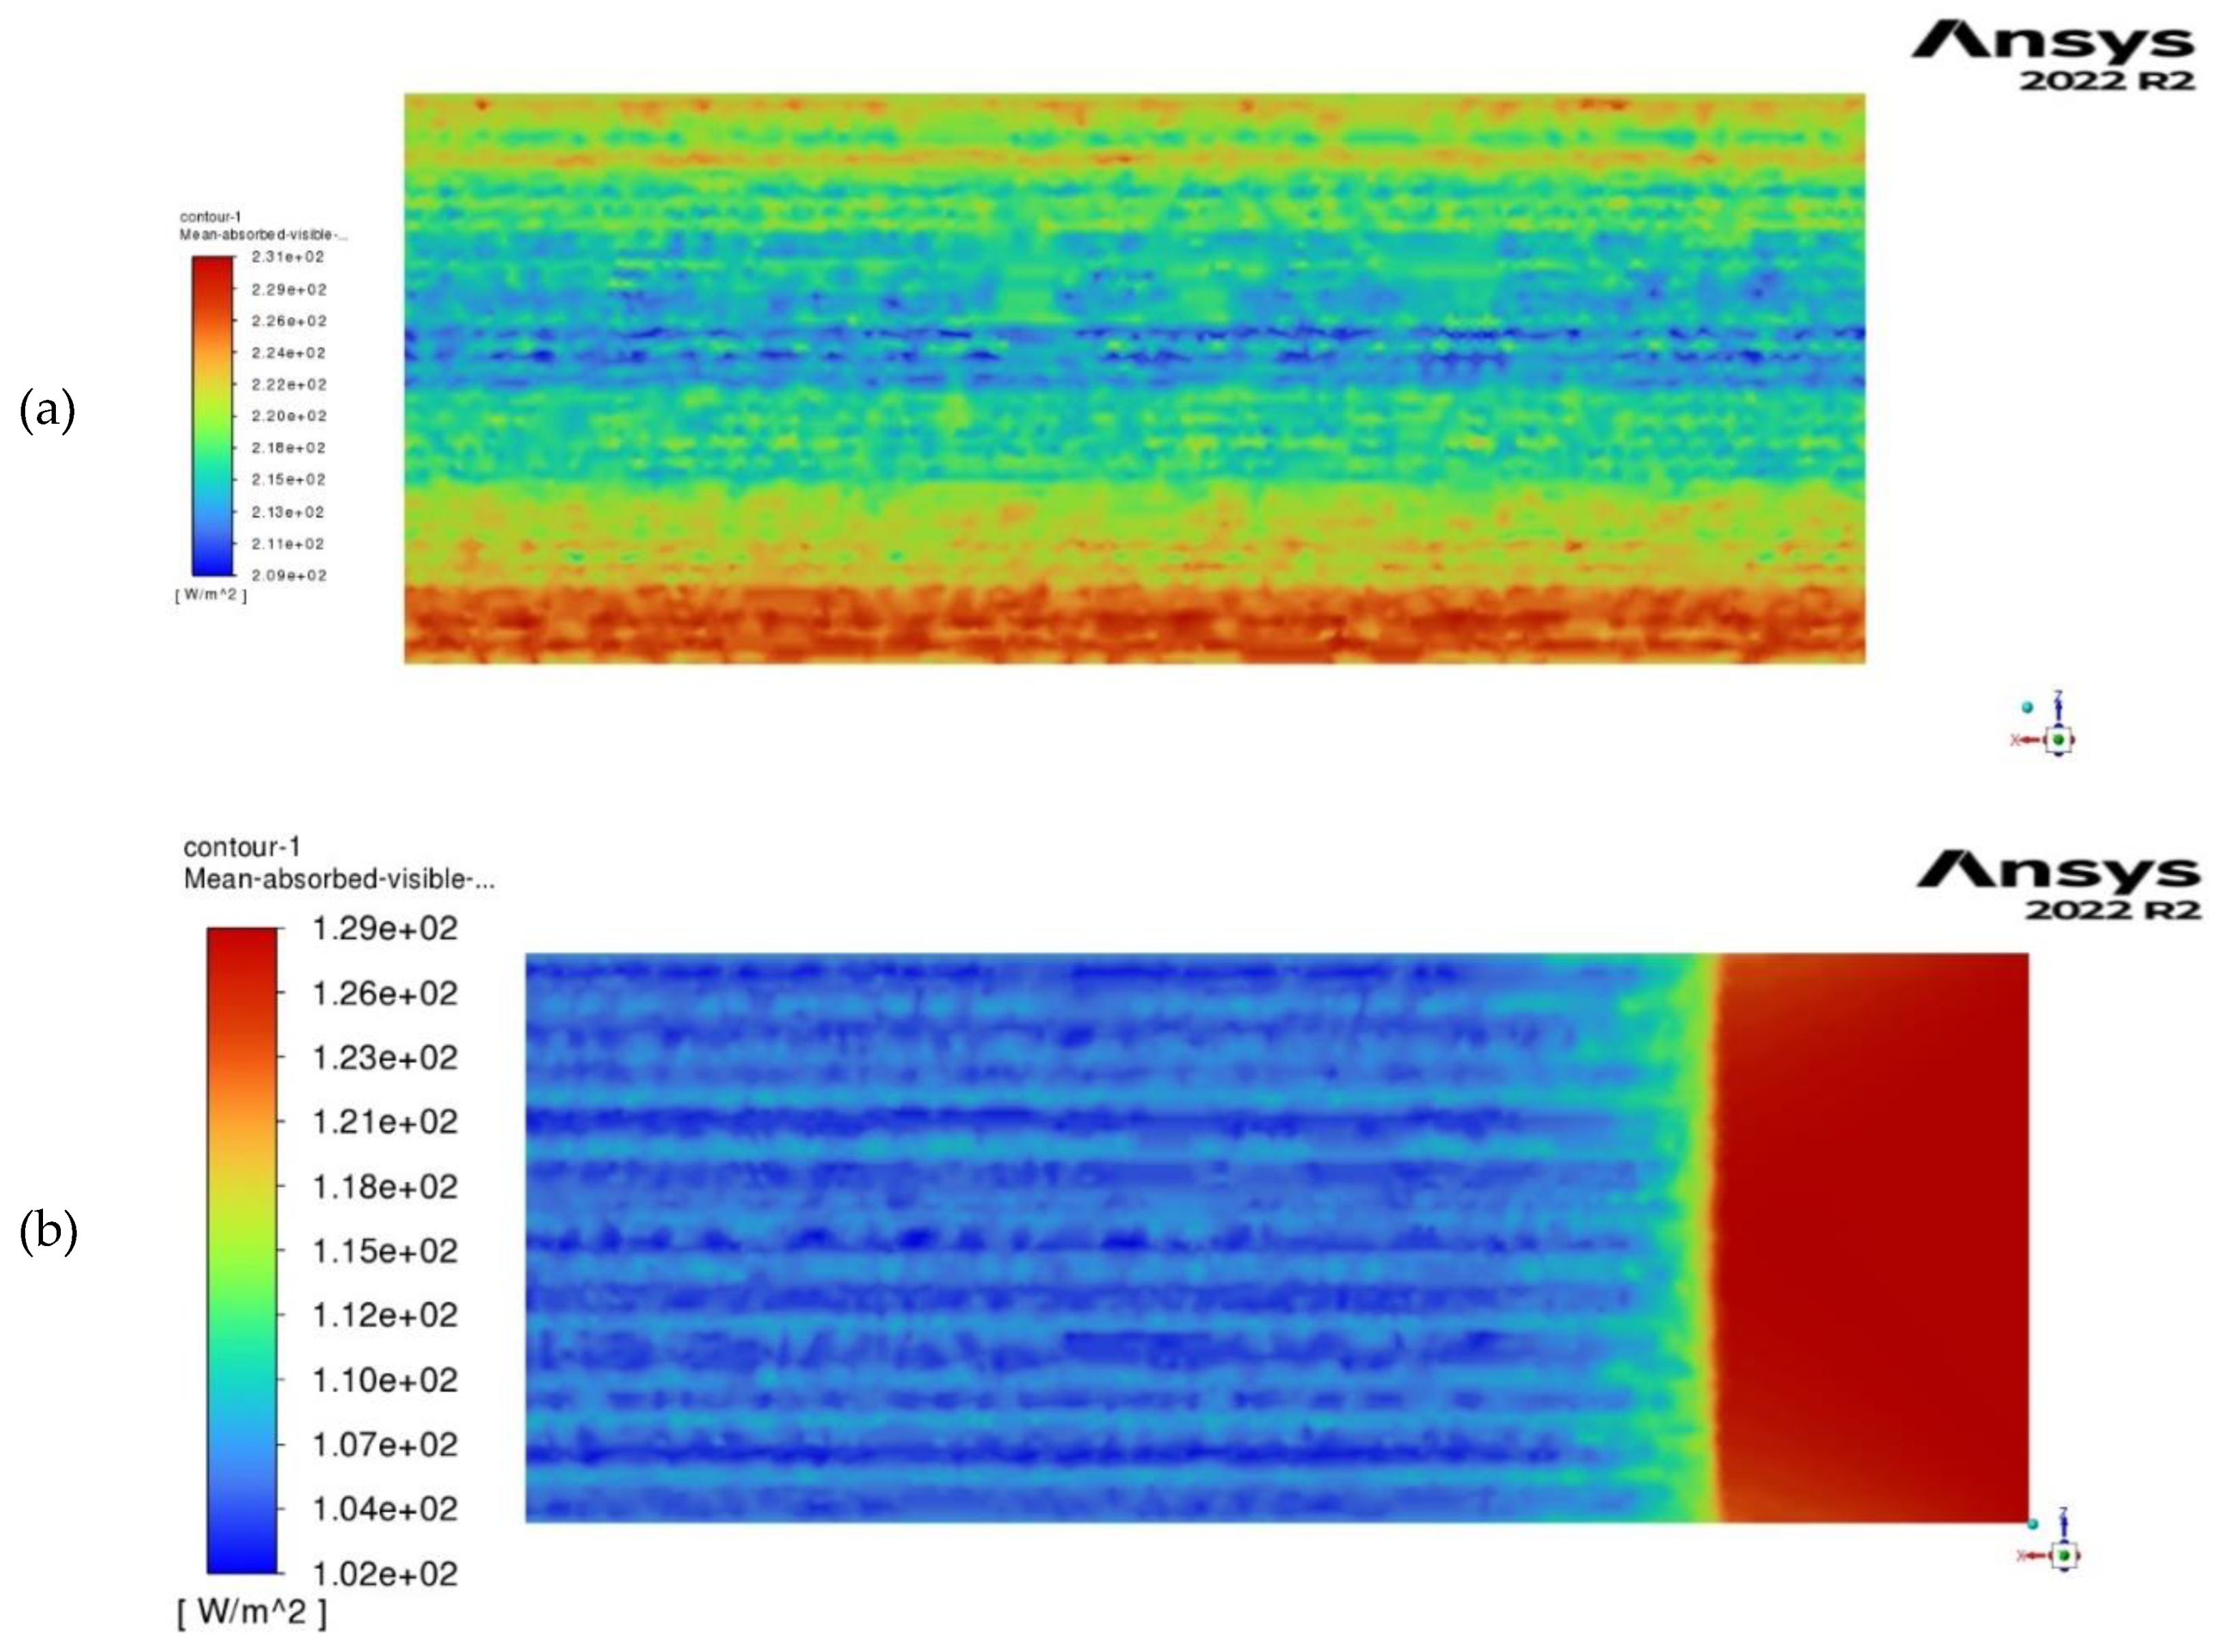
Figure 9.
MAVR distribution on 21 June in the large multi-span greenhouse with NSC arrangement. The figure shows an area of 15×15 m2 in the center of the greenhouse. (a) mesh of the six-span greenhouse (b) opaque PV modules, (c) semi-transparent PV modules. The arrow shows the north here and in all subsequent figures, considering the large greenhouse.
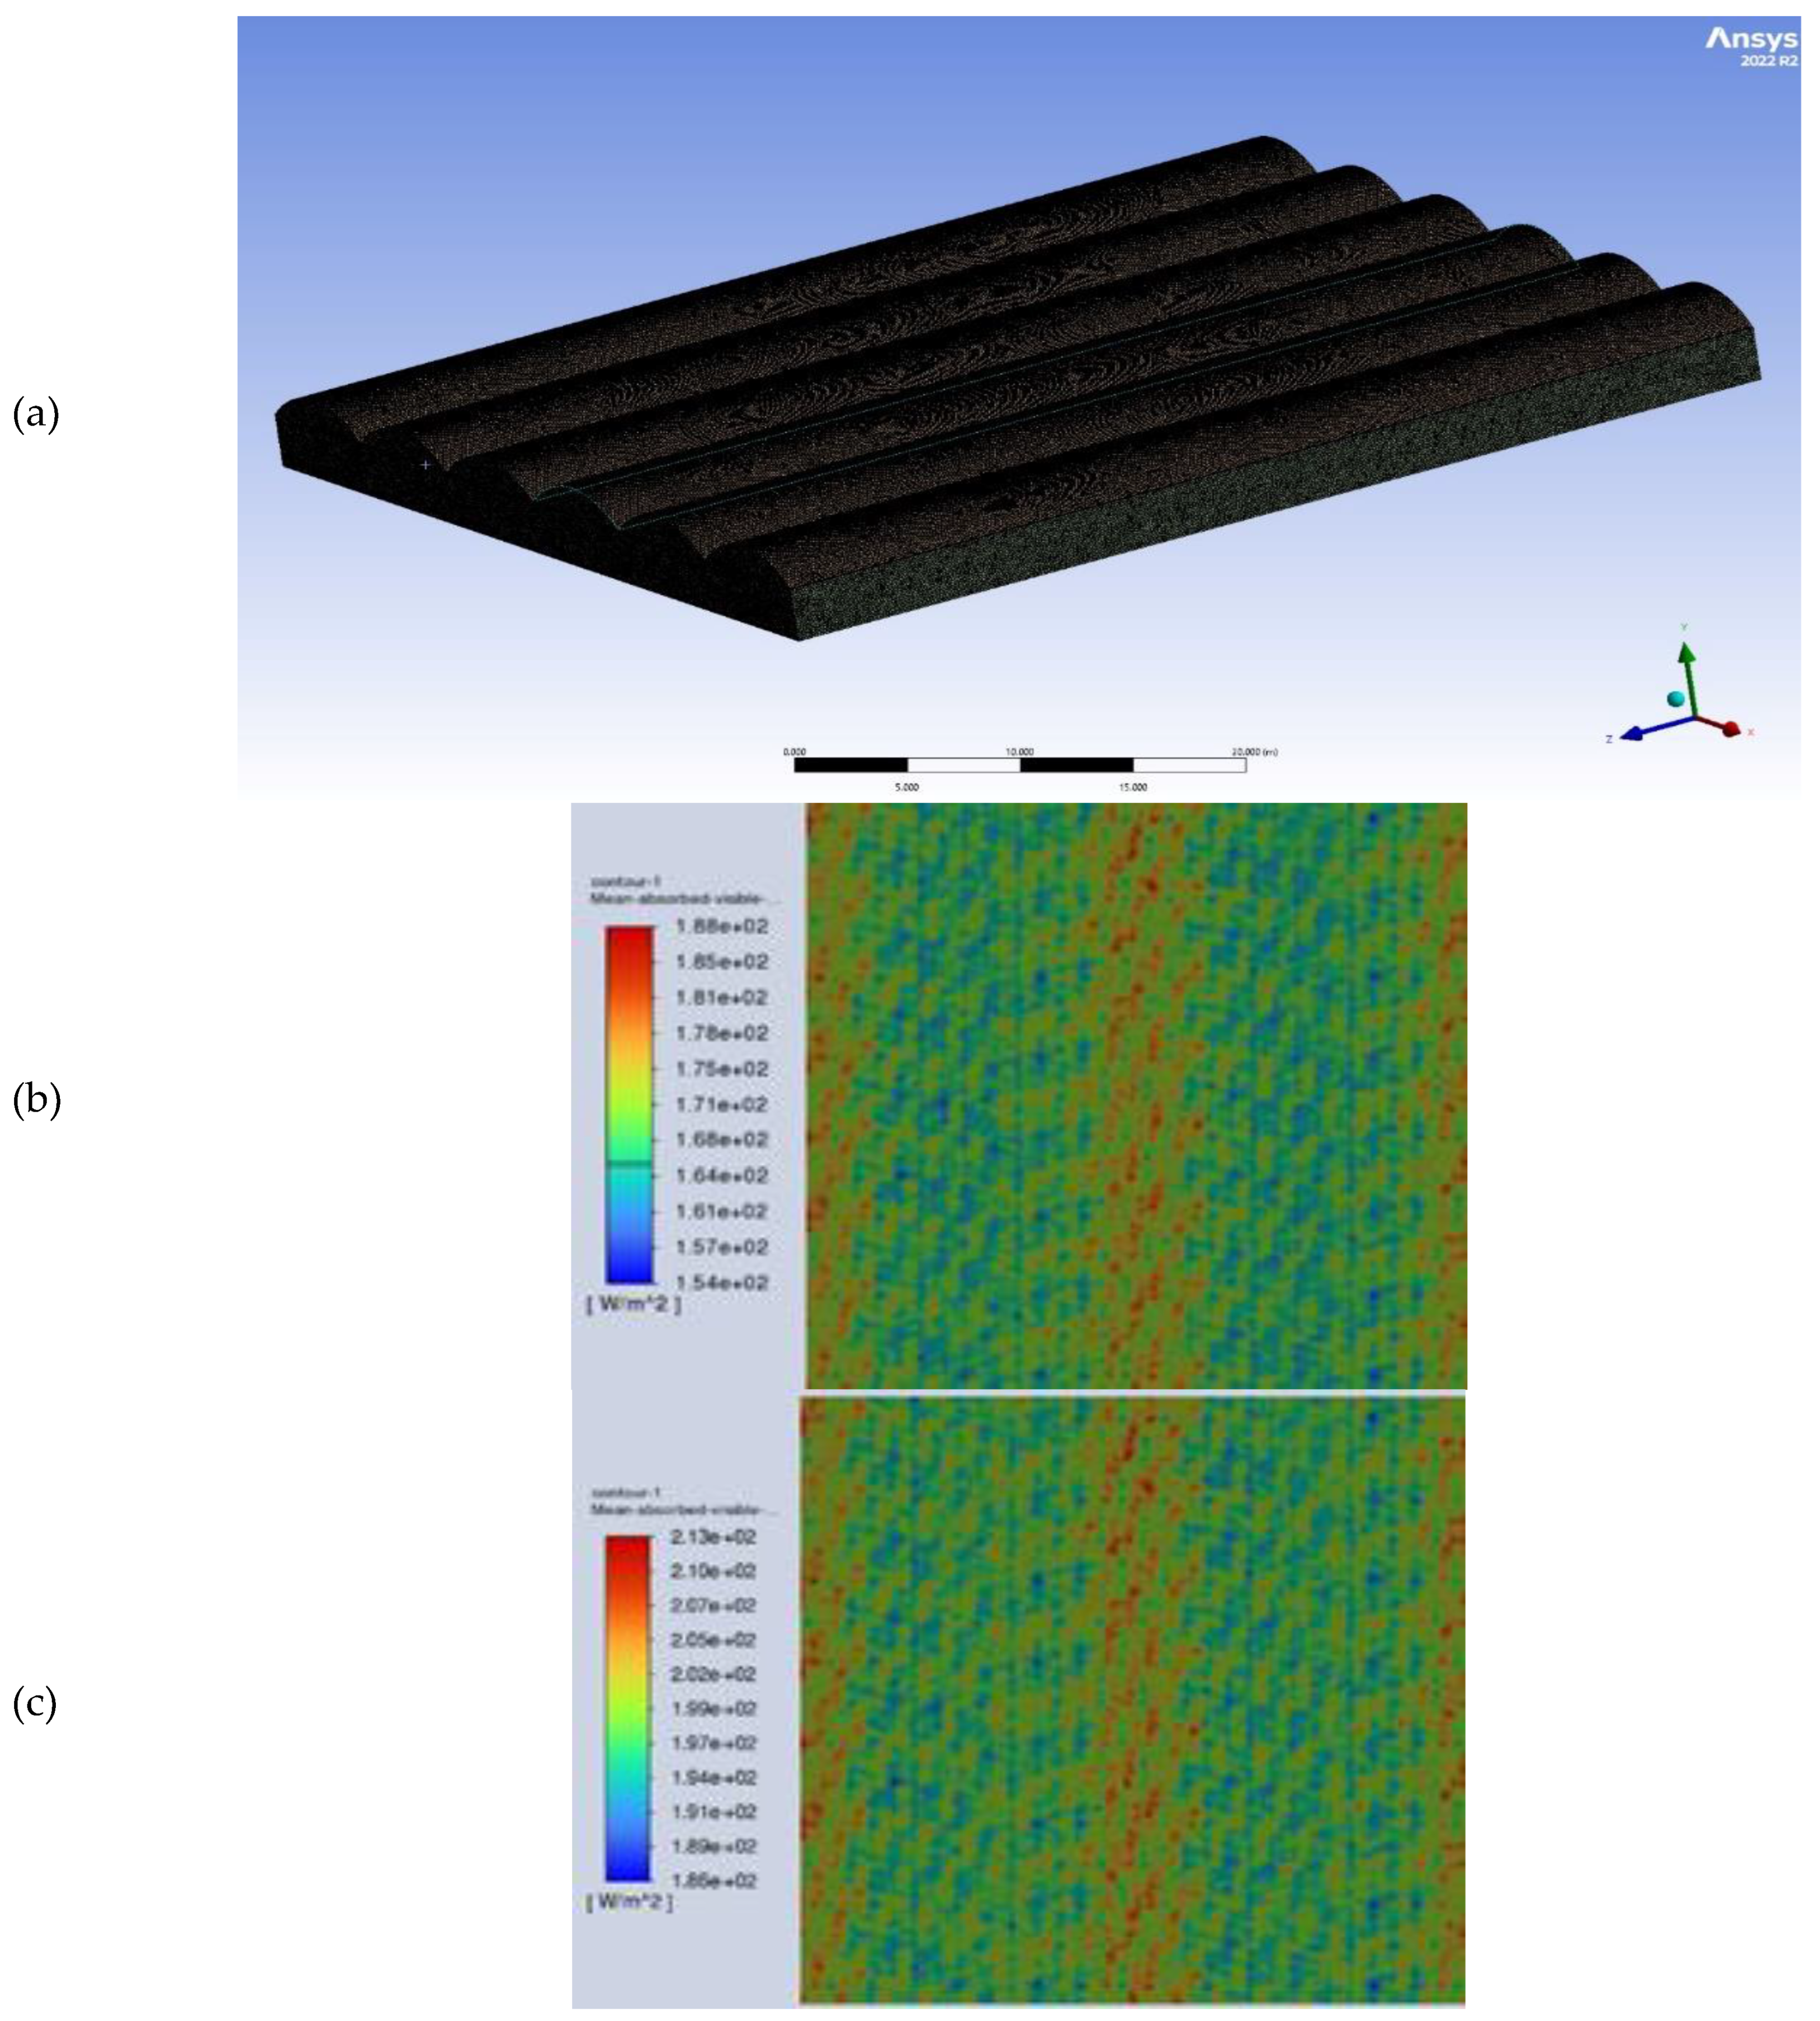
Figure 10.
MAVR distribution on 21 December in the large multi-span greenhouse with an NSC arrangement. The figure shows an area of 15×15 m2 in the center of the greenhouse. (a) opaque PV modules, (b) semi-transparent PV modules.
Figure 10.
MAVR distribution on 21 December in the large multi-span greenhouse with an NSC arrangement. The figure shows an area of 15×15 m2 in the center of the greenhouse. (a) opaque PV modules, (b) semi-transparent PV modules.
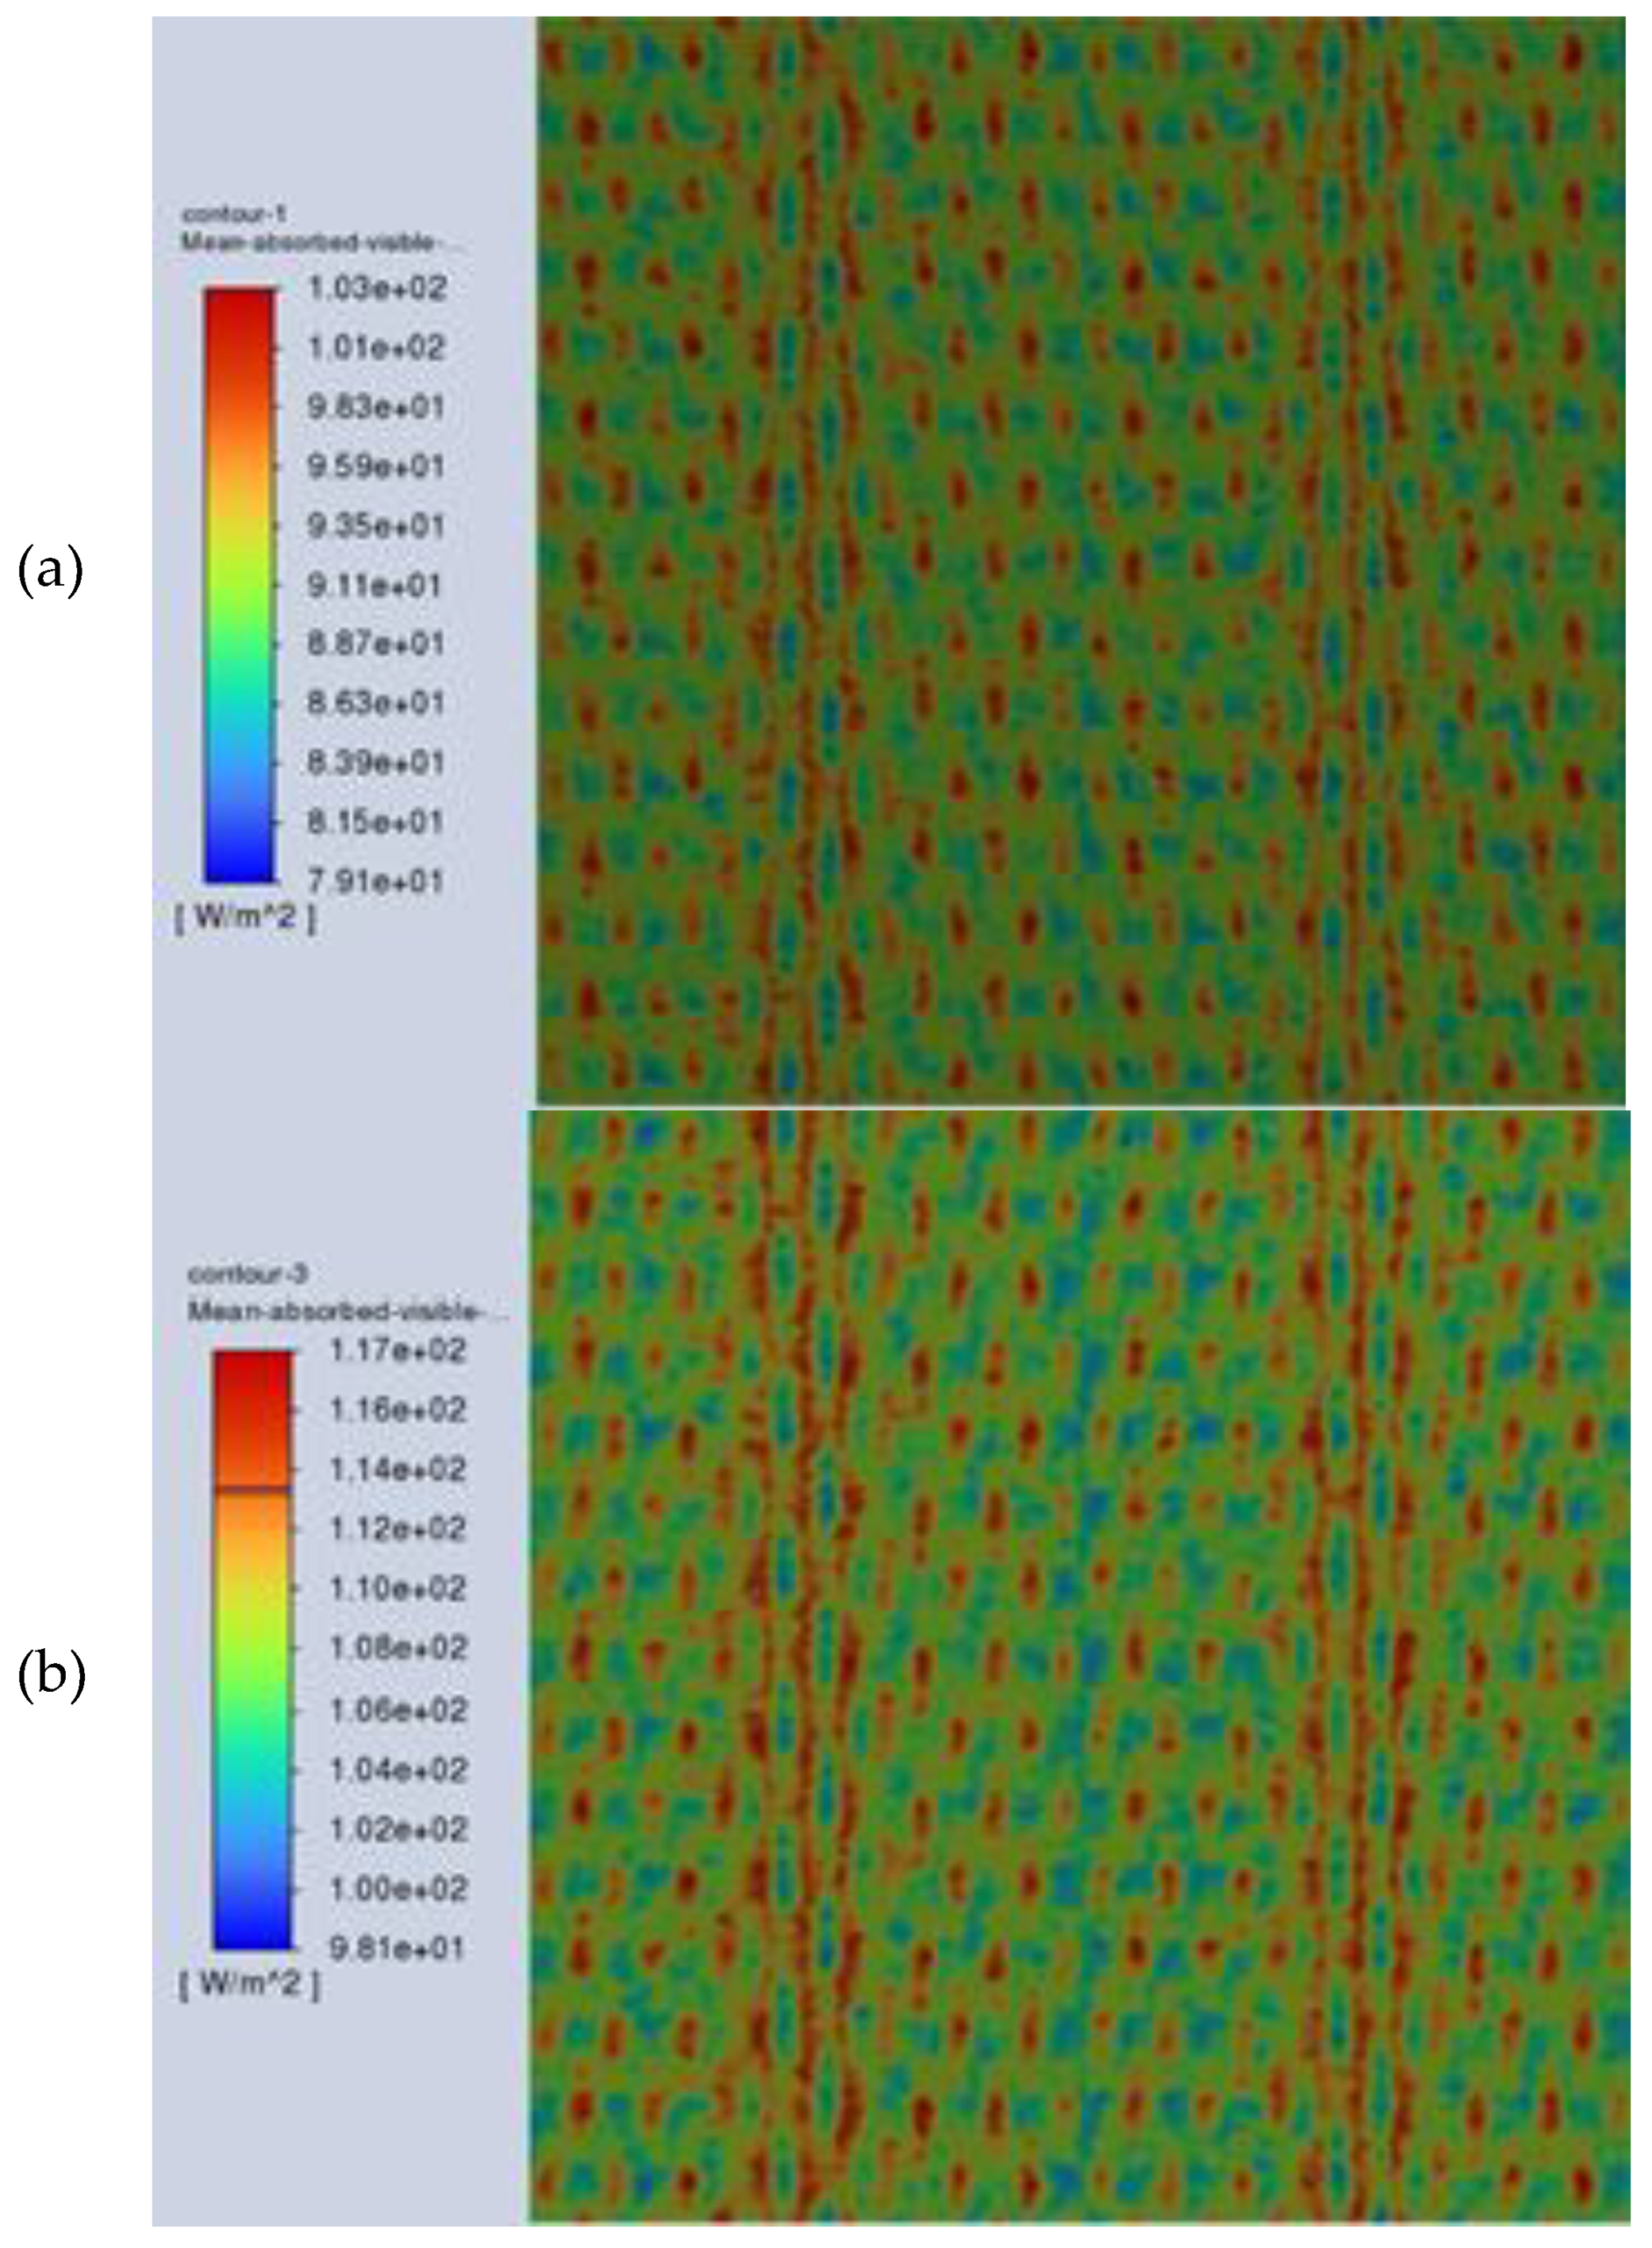
Figure 11.
Comparison of MAVR values across configurations in the multi-span greenhouse.
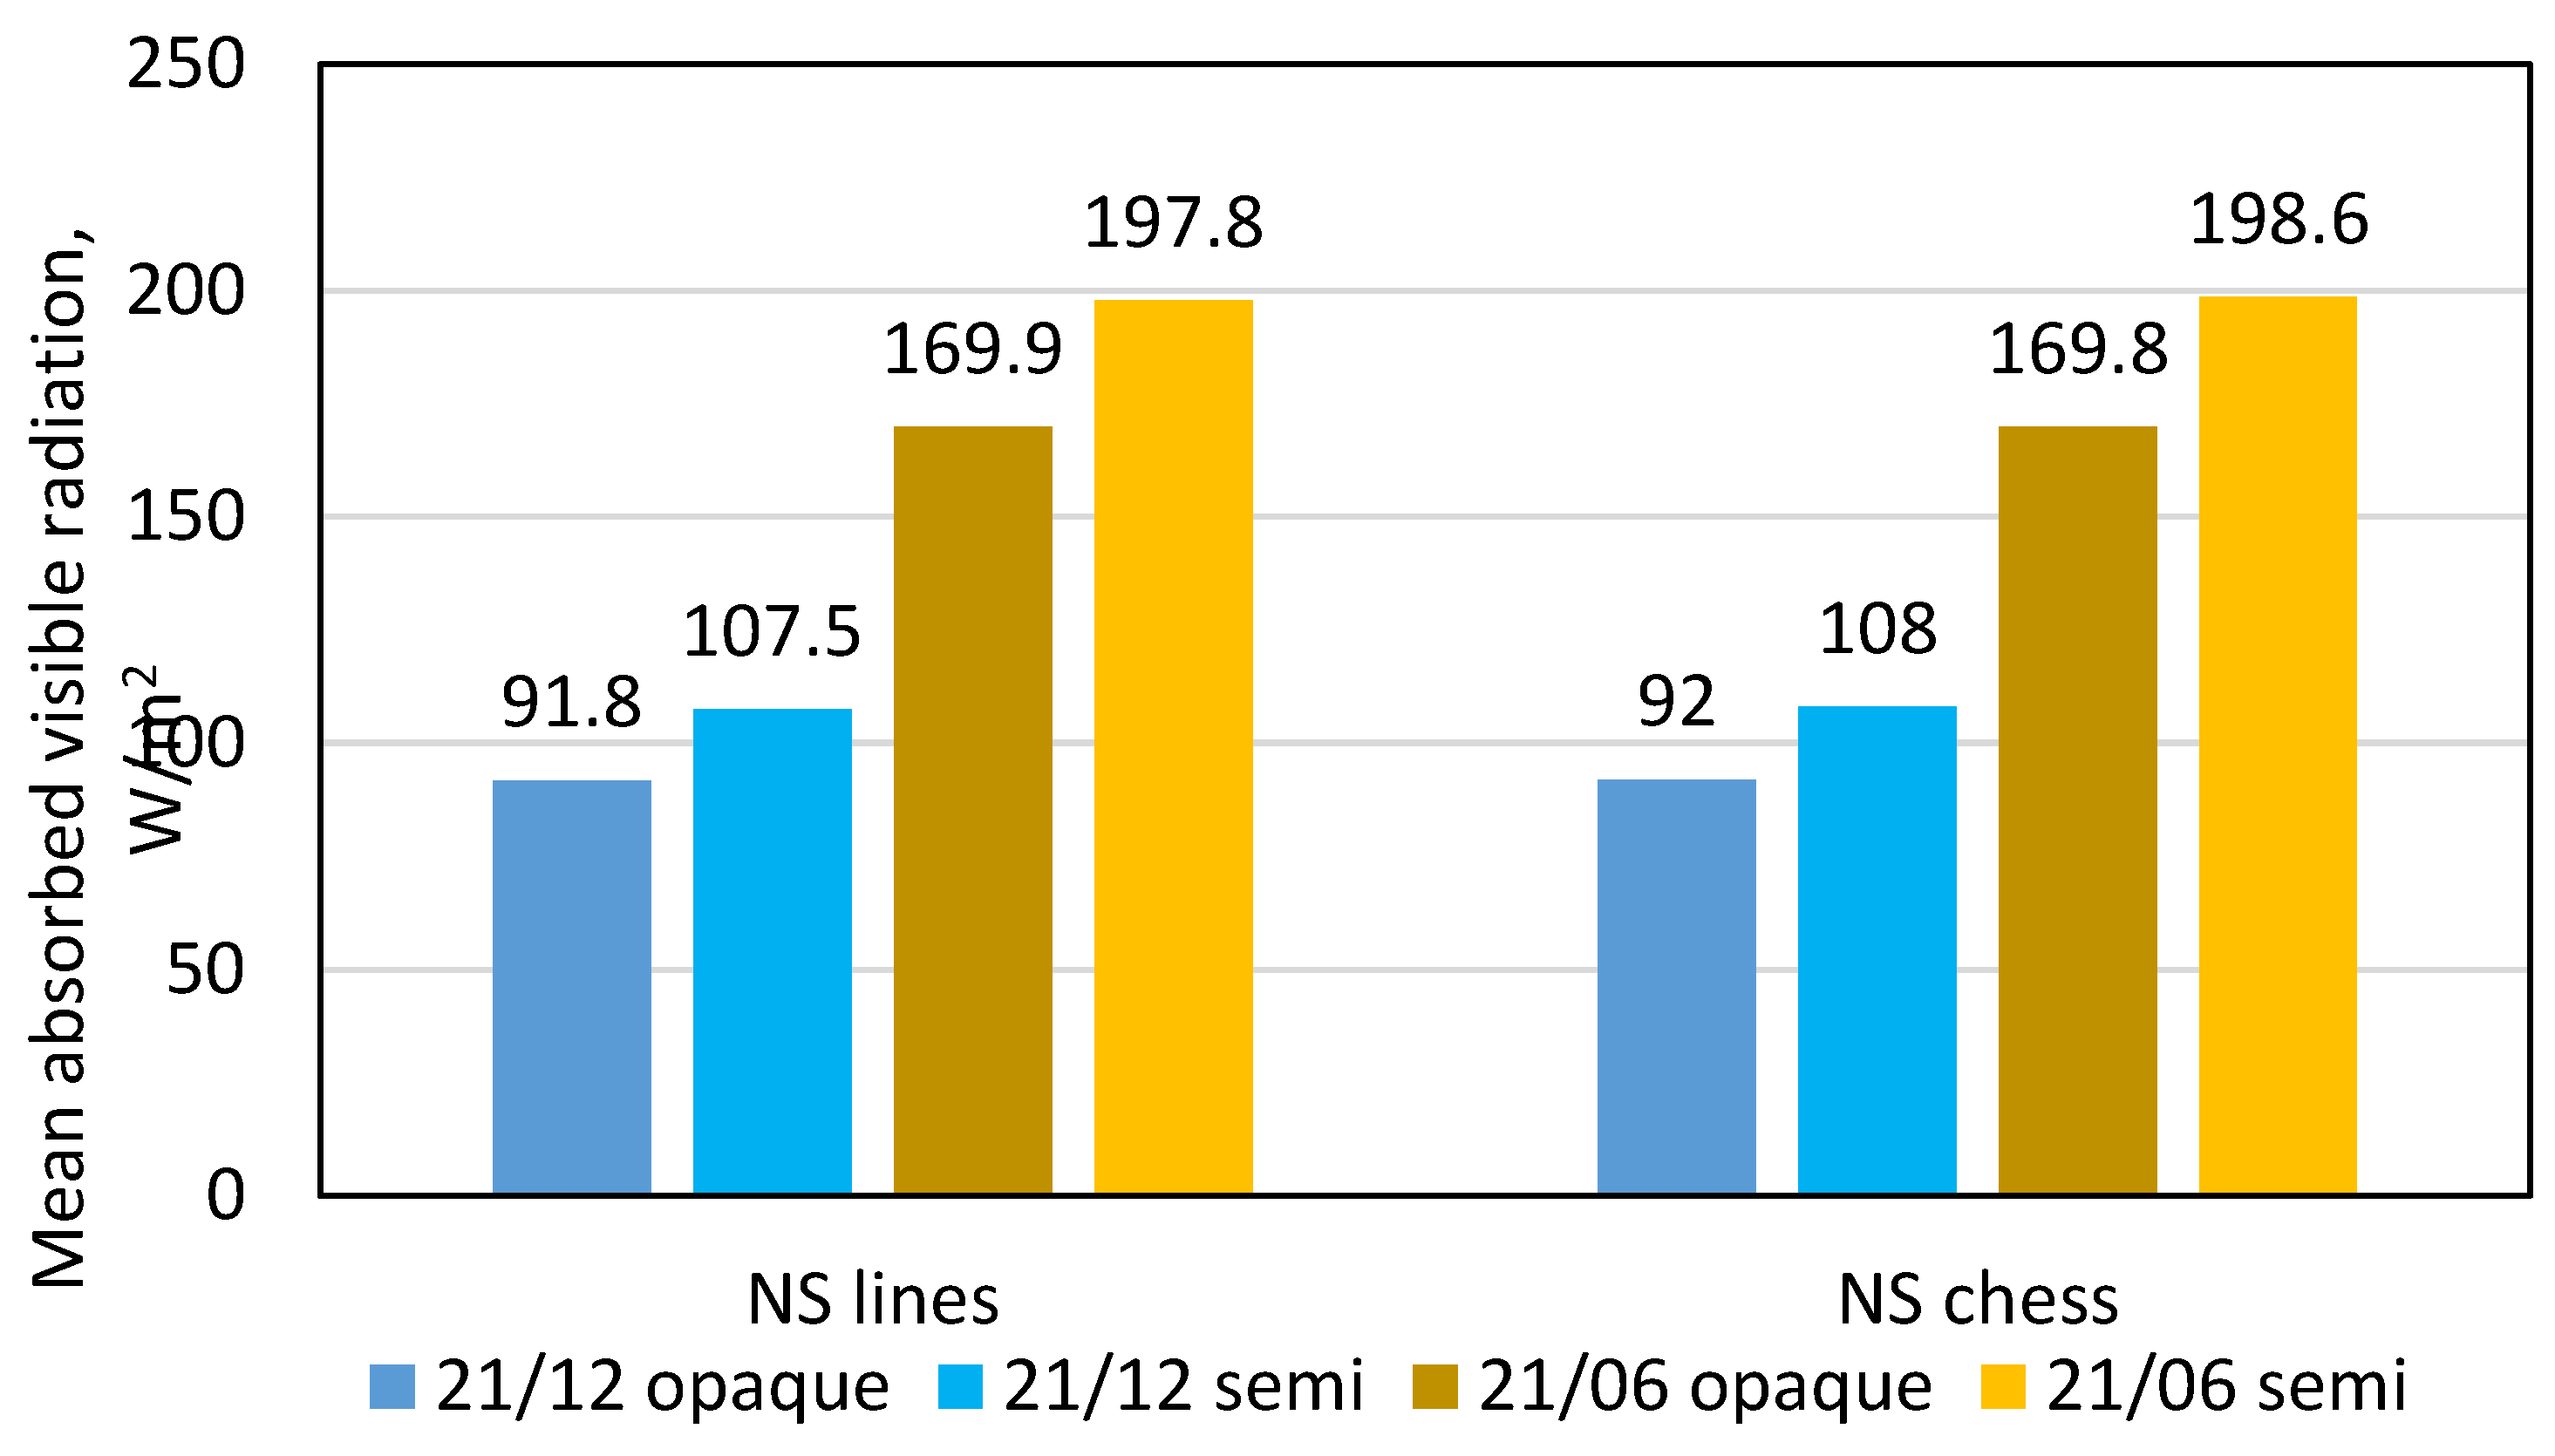
Figure 12.
MAVR distribution on 21 June in the large greenhouse with NSL arrangement. (a) opaque PV modules, (b) semi-transparent PV modules.
Figure 12.
MAVR distribution on 21 June in the large greenhouse with NSL arrangement. (a) opaque PV modules, (b) semi-transparent PV modules.
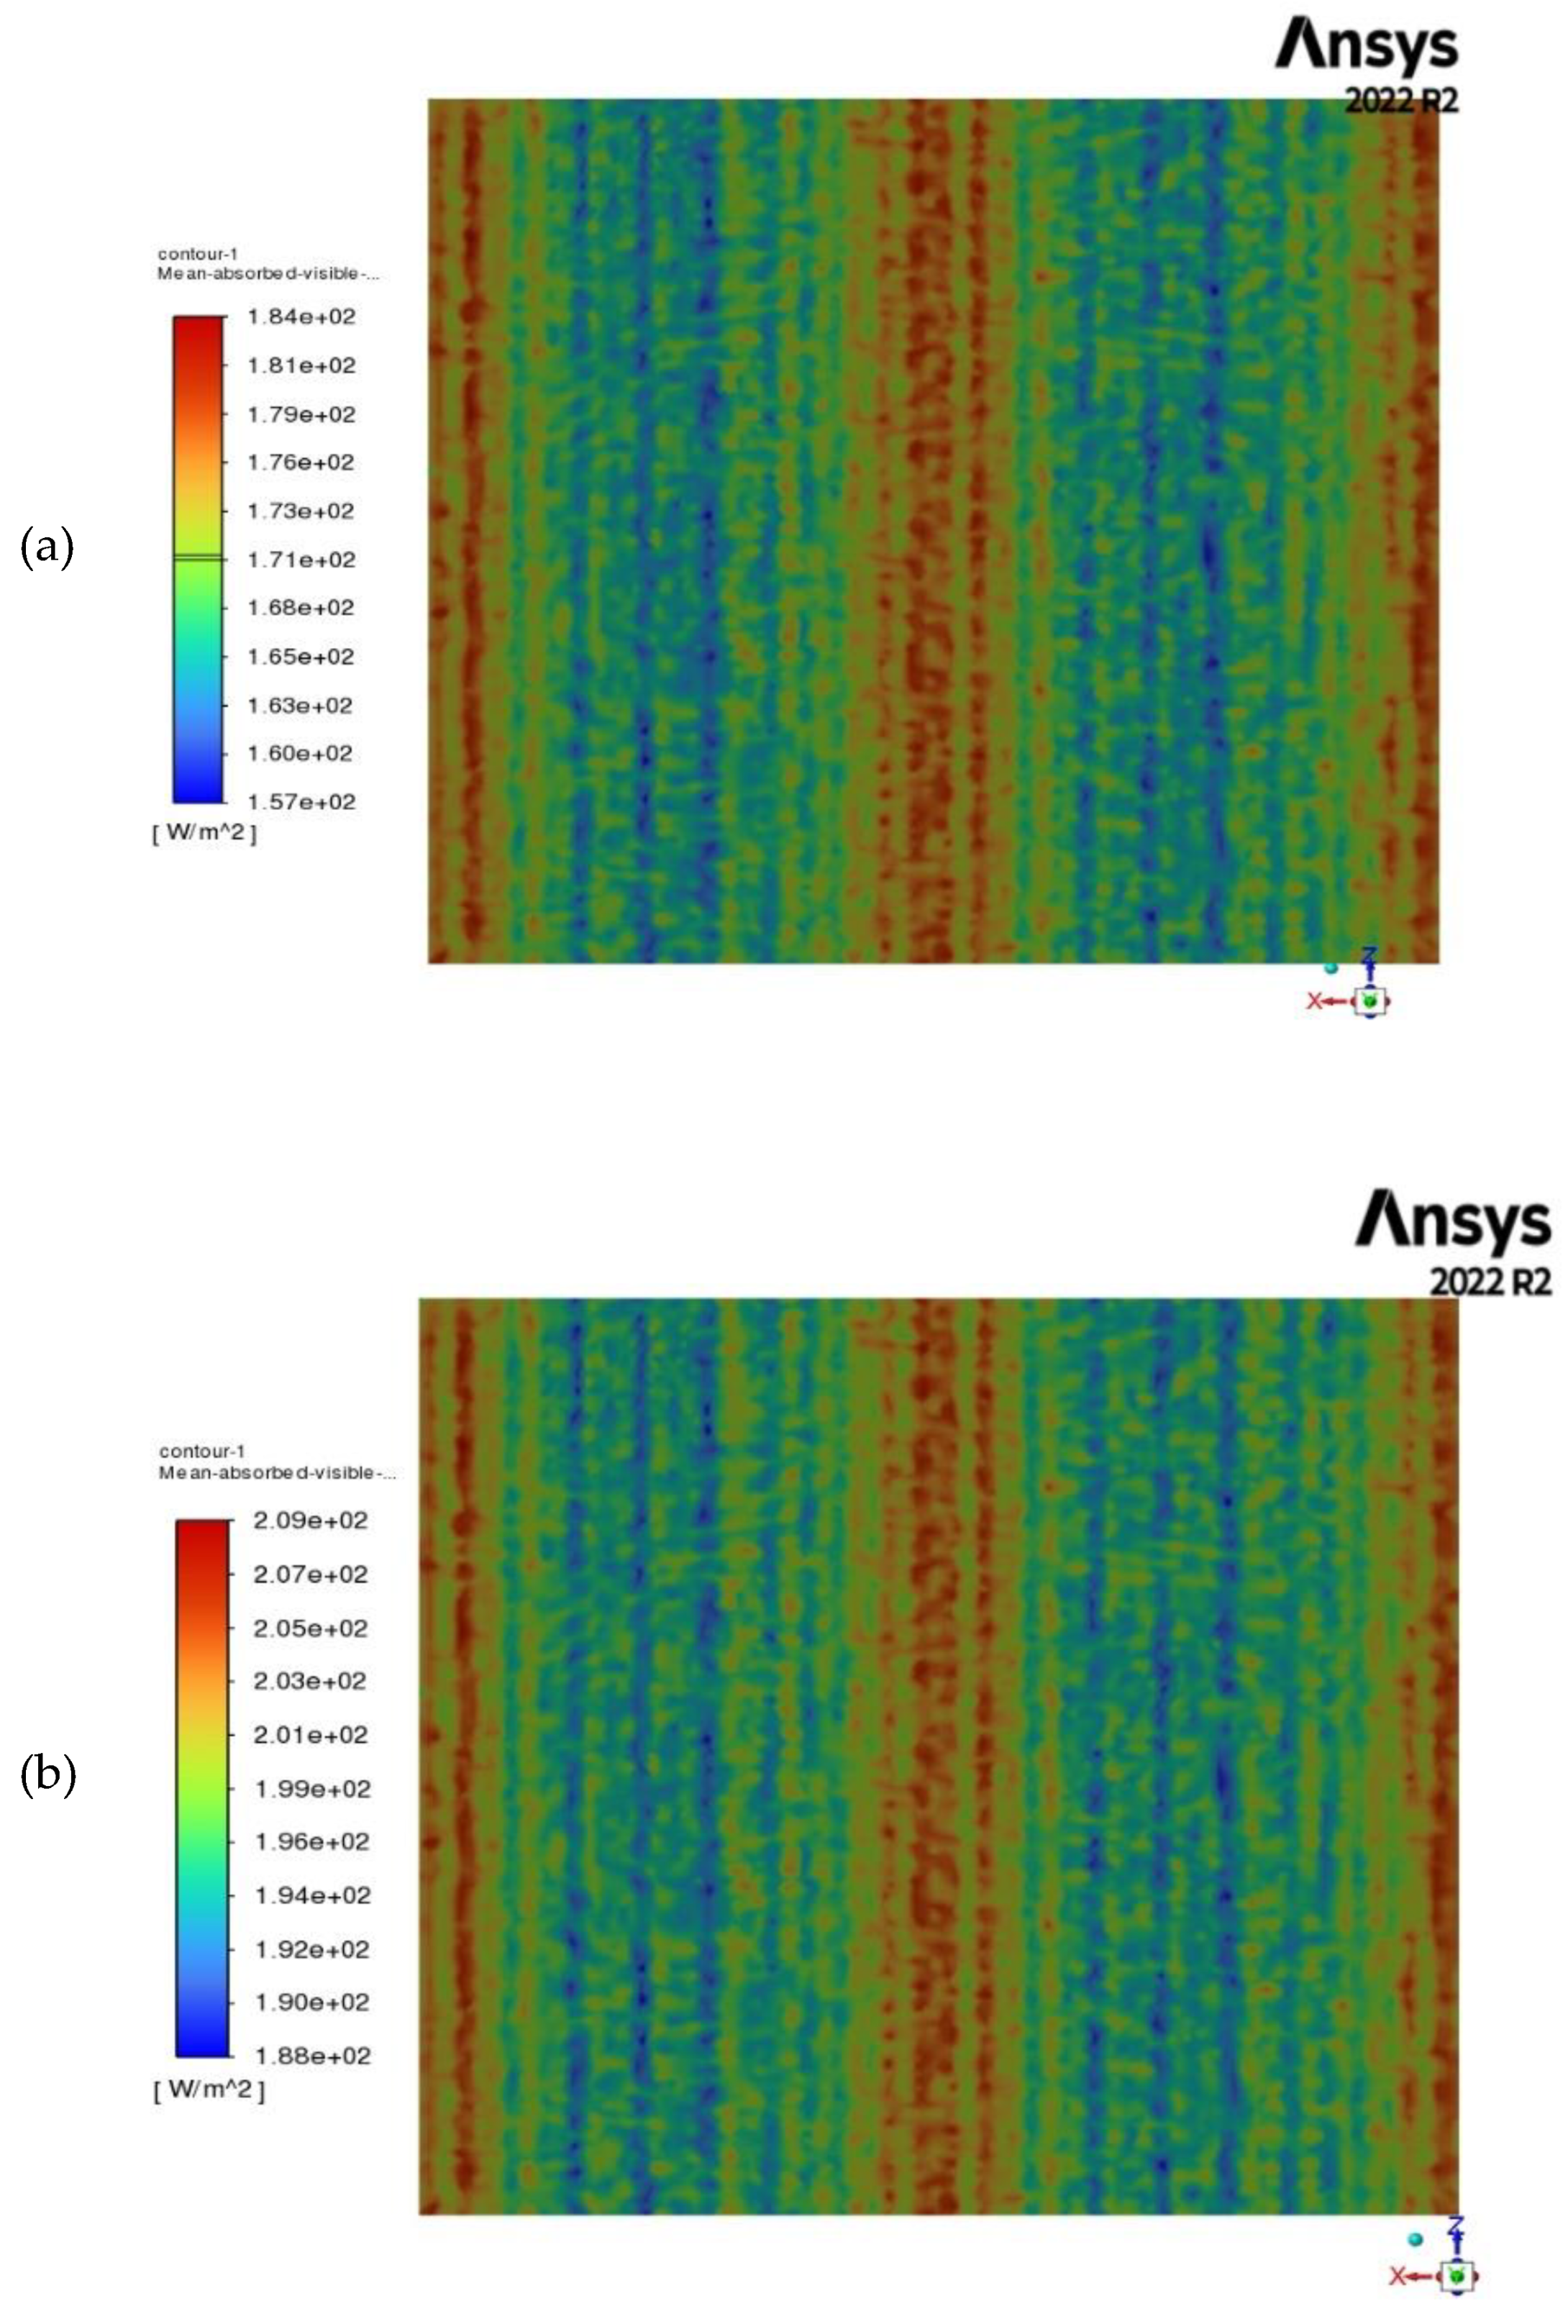
Figure 13.
MAVR distribution on 21 December in the large greenhouse with an NSL arrangement. (a) opaque PV modules, (b) semi-transparent PV modules.
Figure 13.
MAVR distribution on 21 December in the large greenhouse with an NSL arrangement. (a) opaque PV modules, (b) semi-transparent PV modules.
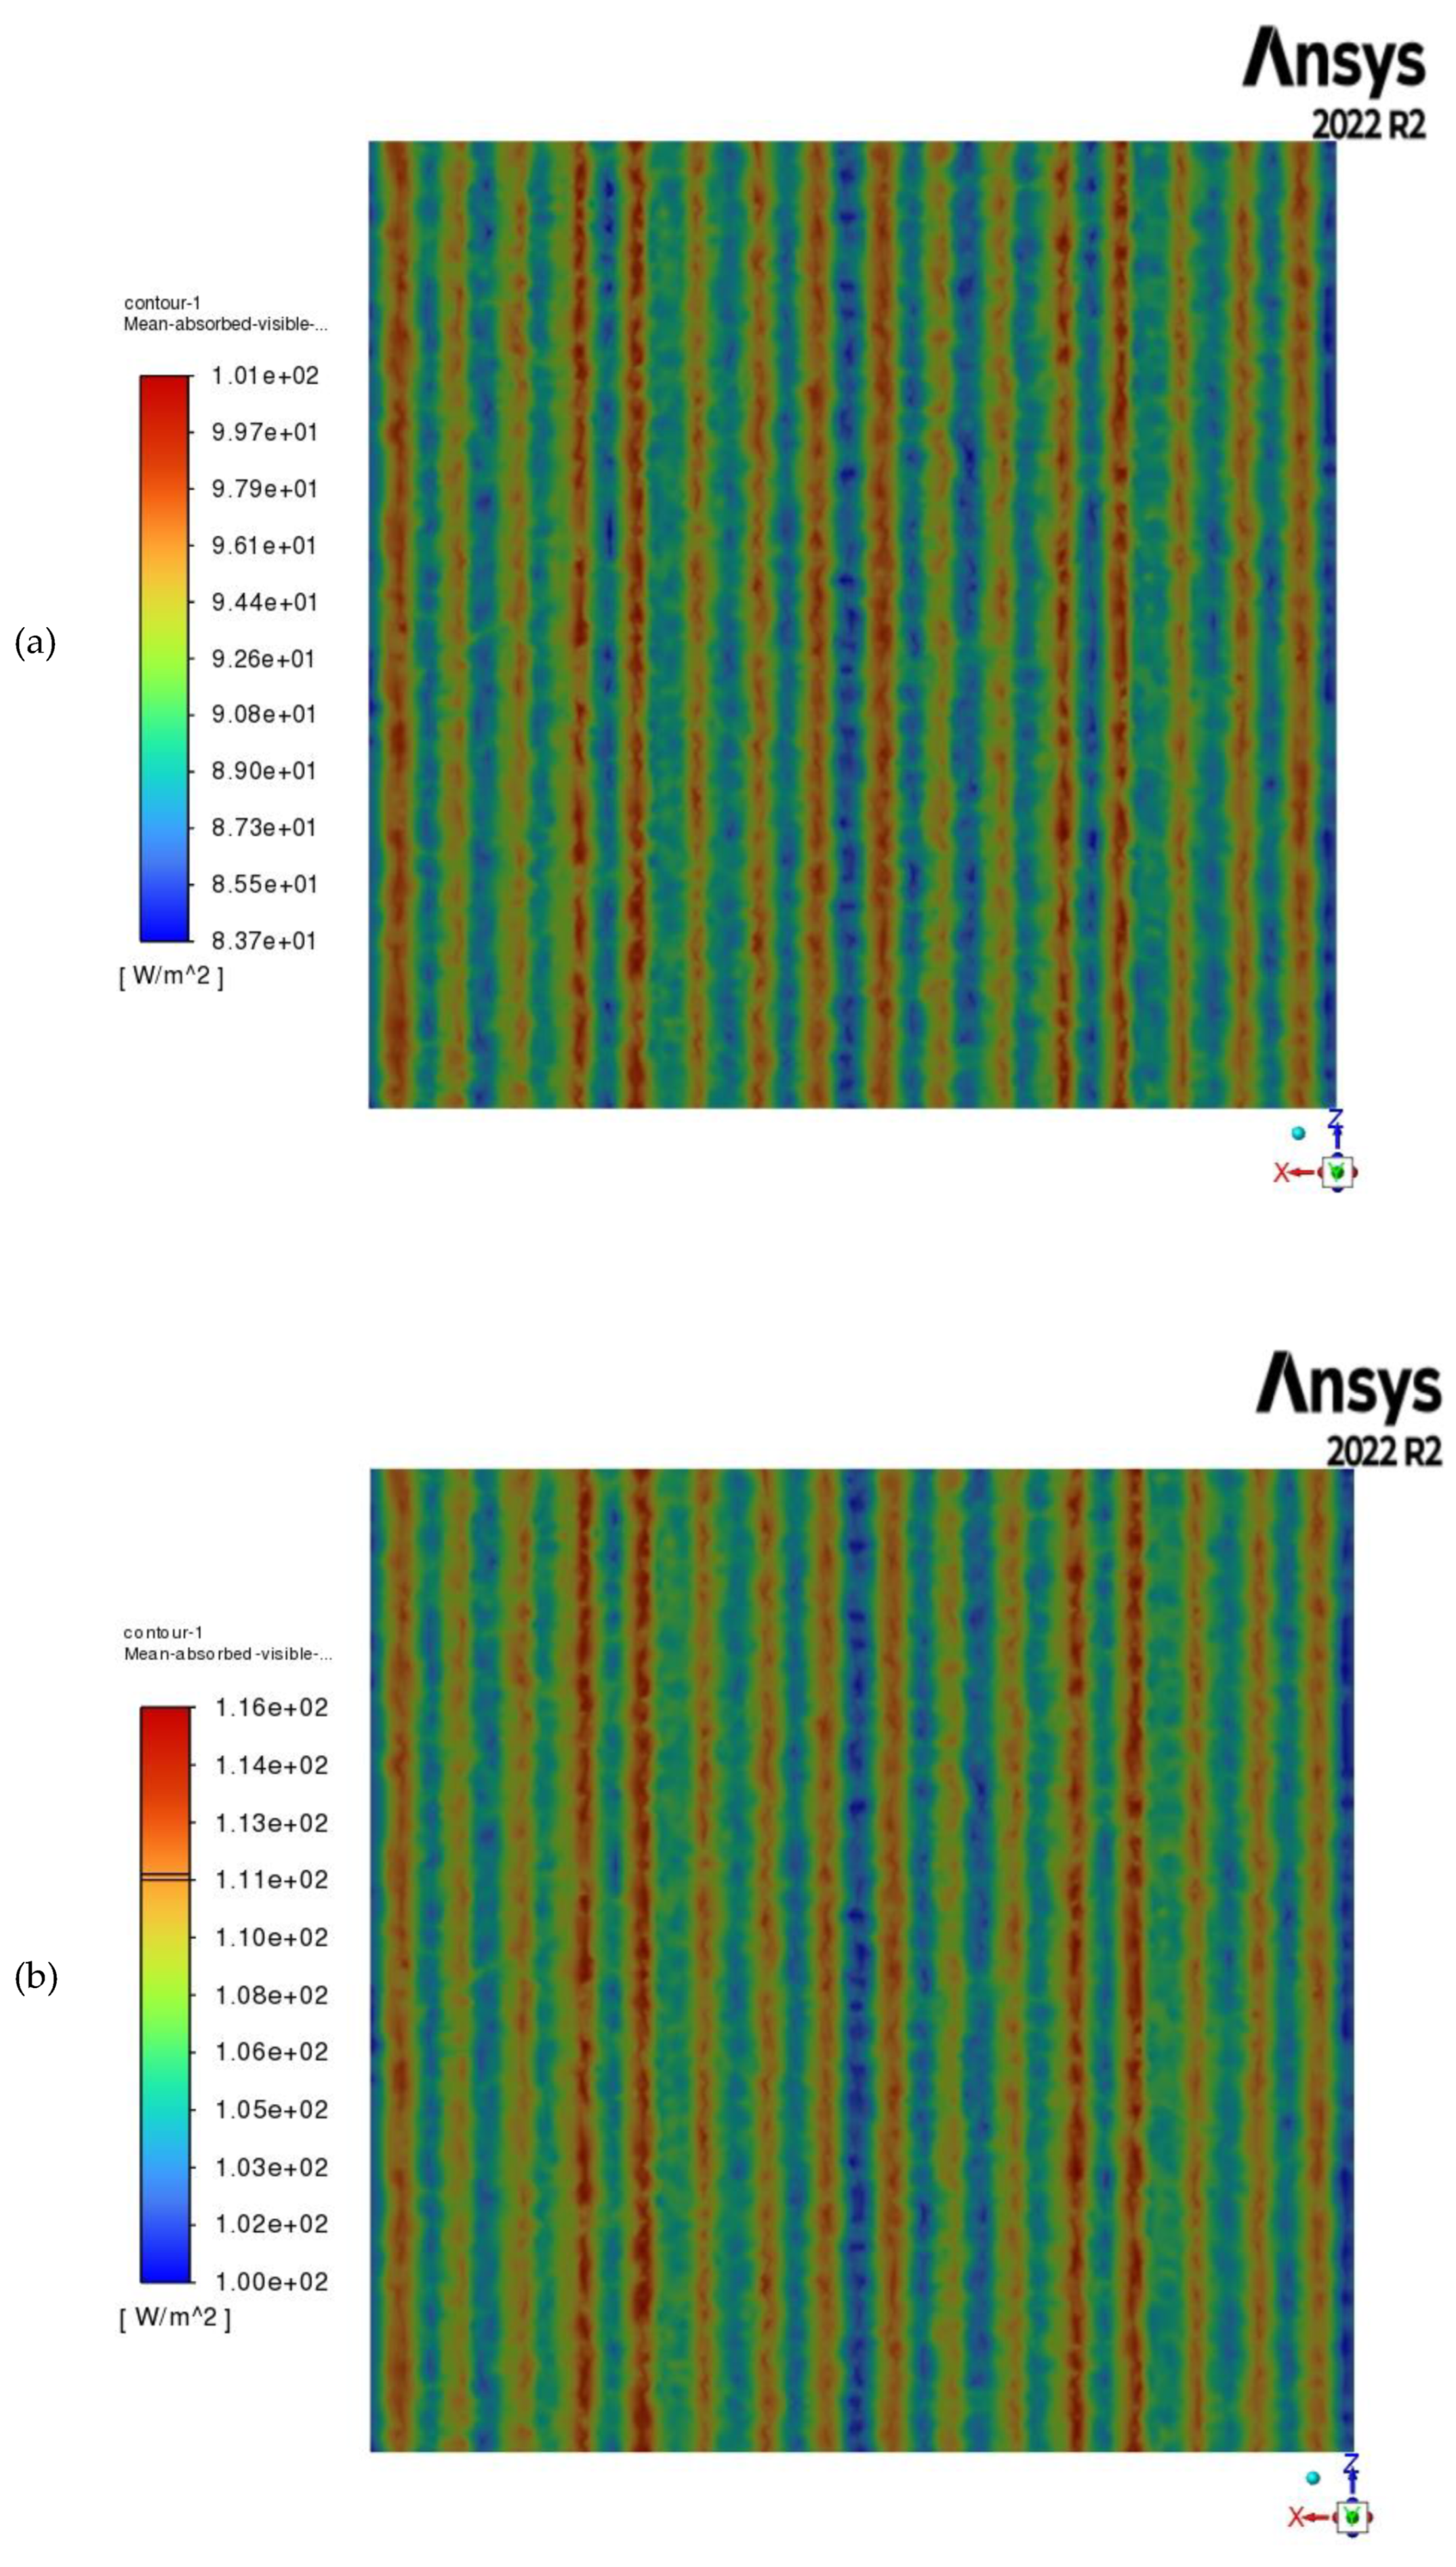
Figure 14.
Uniformity of MAVR distribution in the multi-span greenhouse, calculated using: (a) Uniformity Index 1 (lowest quartile method); (b) Uniformity Index 2 (min/max ratio).
Figure 14.
Uniformity of MAVR distribution in the multi-span greenhouse, calculated using: (a) Uniformity Index 1 (lowest quartile method); (b) Uniformity Index 2 (min/max ratio).
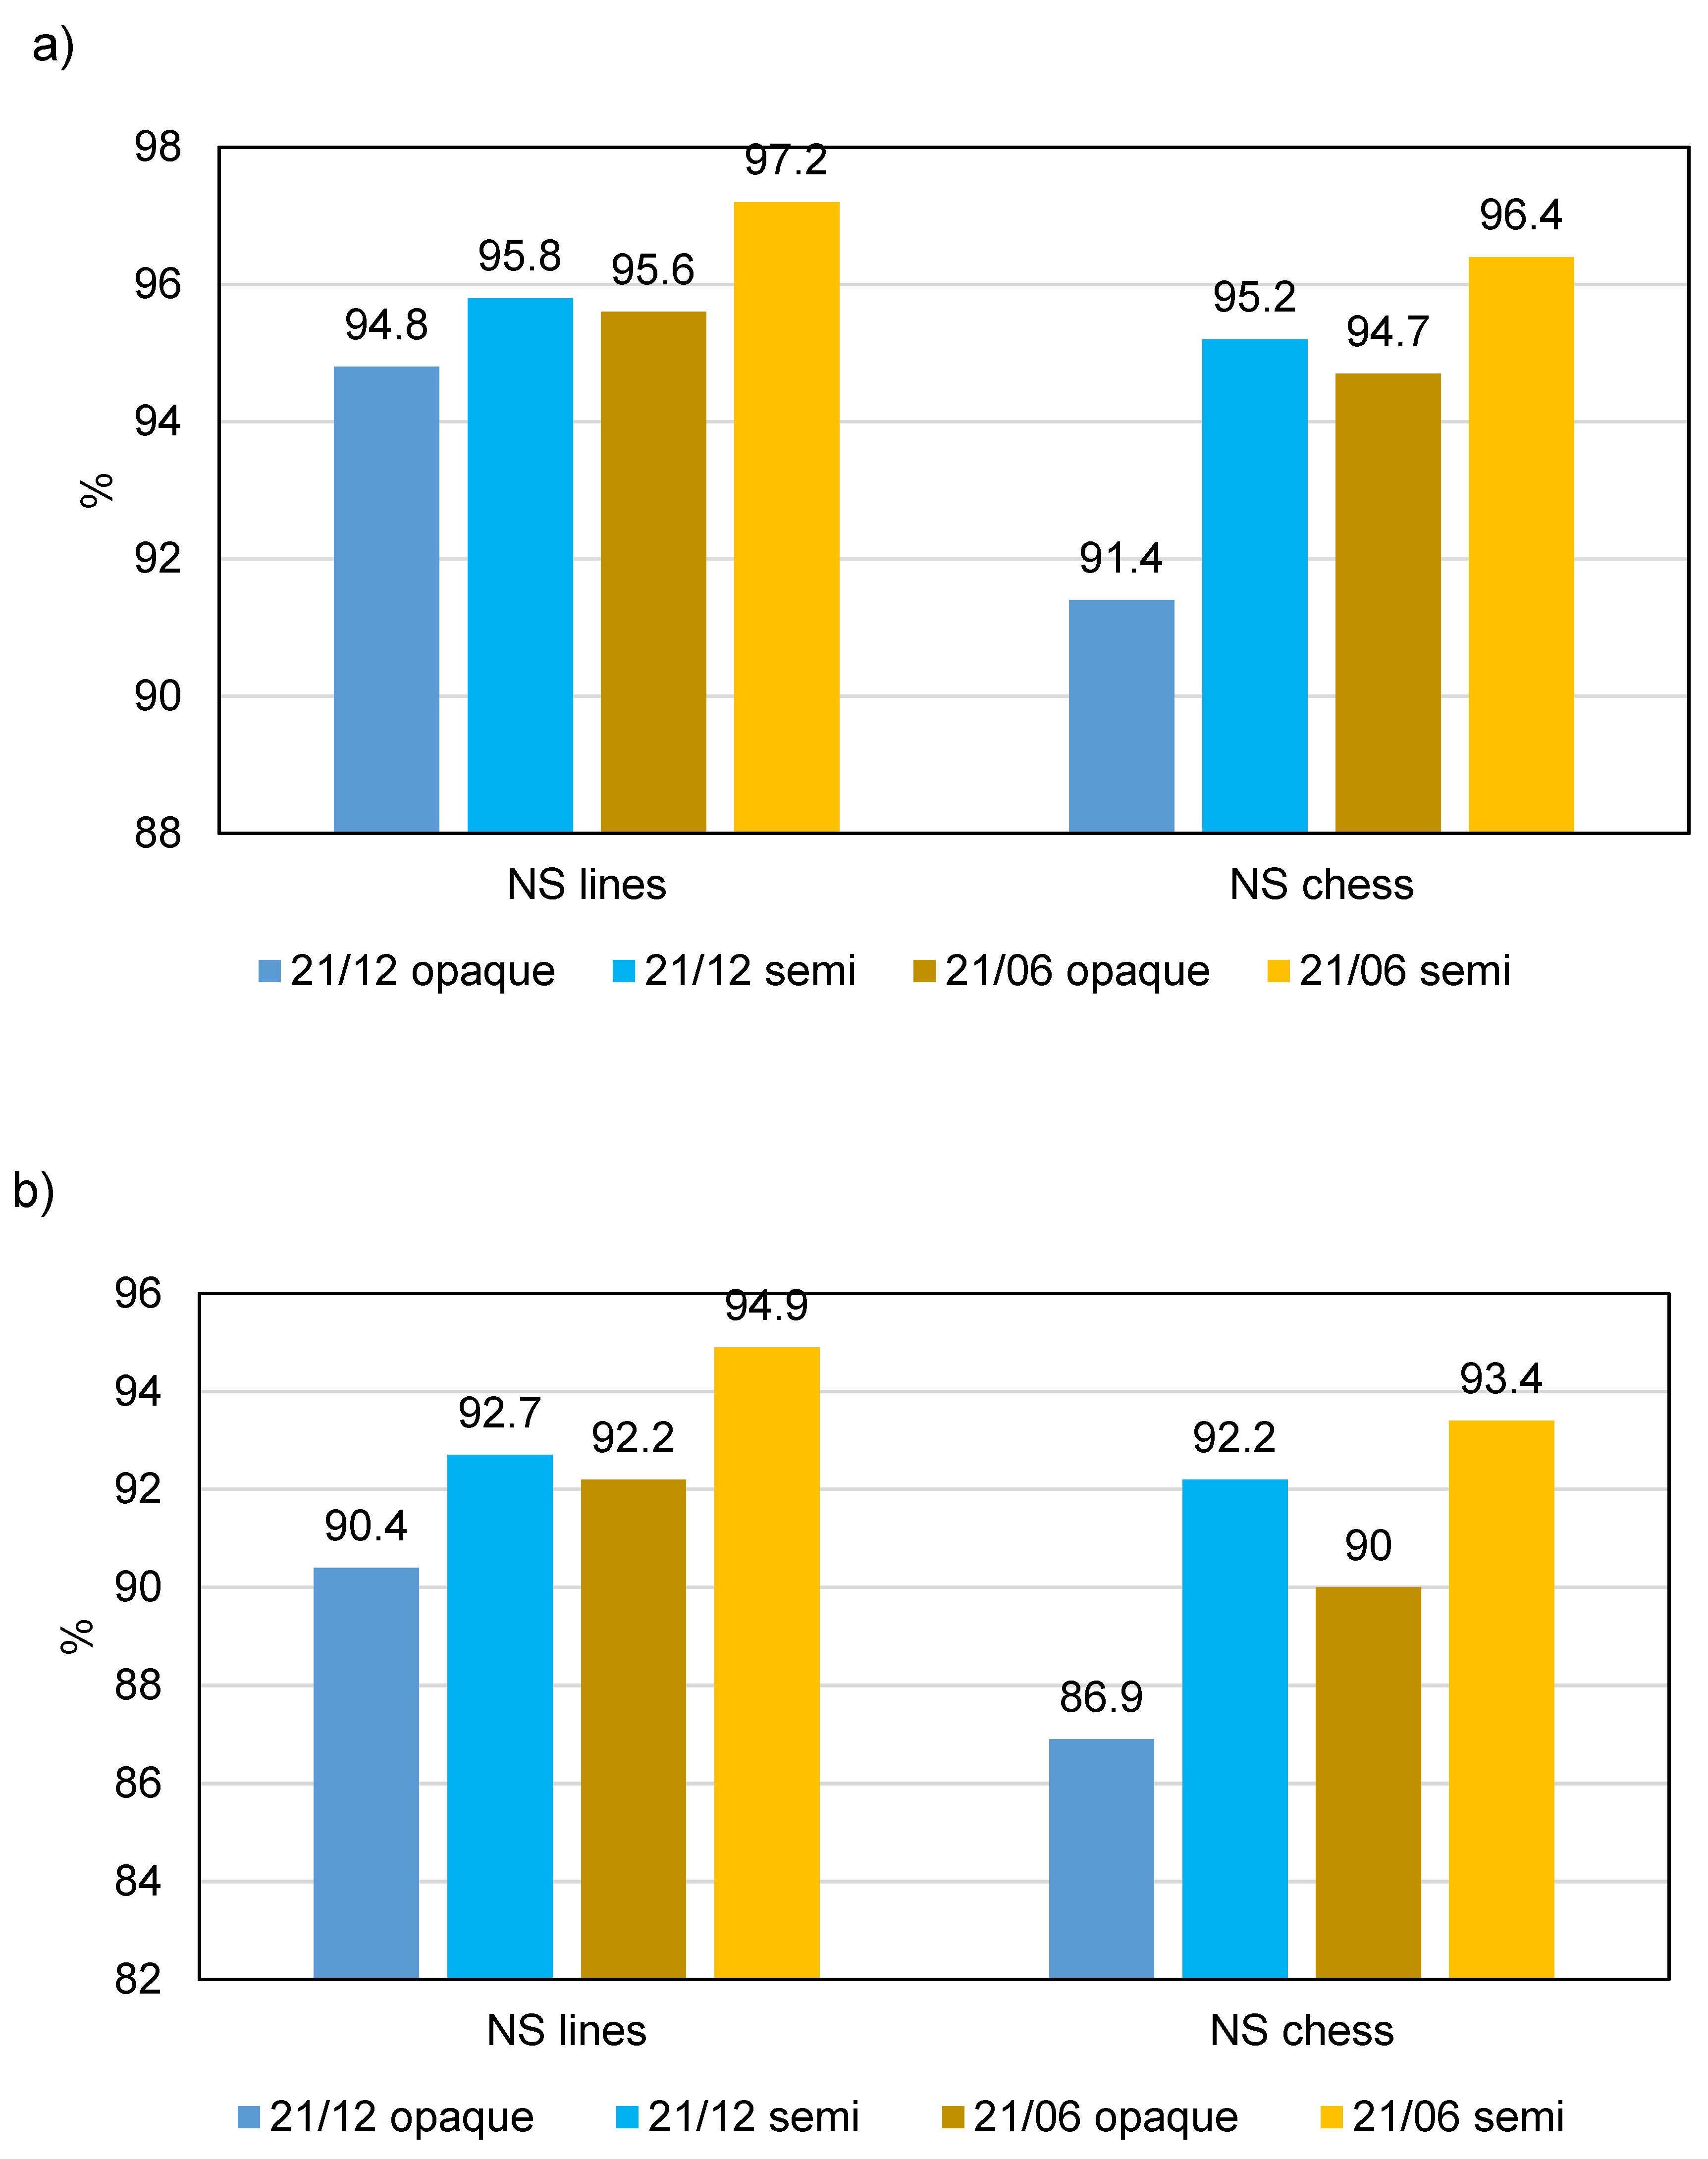

Table 1.
Optical properties of the polyethylene cover and the OPV modules in the visible and IR spectral ranges. The visible properties were measured by an in-house system. IR properties are assumed to be the same as visible properties [30].
Table 1.
Optical properties of the polyethylene cover and the OPV modules in the visible and IR spectral ranges. The visible properties were measured by an in-house system. IR properties are assumed to be the same as visible properties [30].
| Polyethylene | OPV module | |
| absorptivity | 0.10 | 0.61 |
| transmissivity | 0.76 | 0.24 |
| reflectivity | 0.14 | 0.15 |
Disclaimer/Publisher’s Note: The statements, opinions and data contained in all publications are solely those of the individual author(s) and contributor(s) and not of MDPI and/or the editor(s). MDPI and/or the editor(s) disclaim responsibility for any injury to people or property resulting from any ideas, methods, instructions or products referred to in the content. |
© 2025 by the authors. Licensee MDPI, Basel, Switzerland. This article is an open access article distributed under the terms and conditions of the Creative Commons Attribution (CC BY) license (http://creativecommons.org/licenses/by/4.0/).
Copyright: This open access article is published under a Creative Commons CC BY 4.0 license, which permit the free download, distribution, and reuse, provided that the author and preprint are cited in any reuse.


